Impact of the Extended Learning Opportunities Summer ... · Program Evaluation iv Impact of ELO...
88
Impact of the Extended Learning Opportunities Summer Adventures in Learning (ELO SAIL) Program on Student Academic Performance: Part 1, Results From Fall 2012 to Fall 2015 Office of Shared Accountability April 2016 Elizabeth Cooper-Martin, Ph.D. Natalie Wolanin Seong Jang Shahpar Modarresi, Ph.D. Huafang Zhao, Ph.D.
Transcript of Impact of the Extended Learning Opportunities Summer ... · Program Evaluation iv Impact of ELO...

Impact of the Extended Learning Opportunities
Summer Adventures in Learning (ELO SAIL)
Program on Student Academic Performance:
Part 1, Results From Fall 2012 to Fall 2015
Office of Shared Accountability
April 2016
Elizabeth Cooper-Martin, Ph.D.
Natalie Wolanin
Seong Jang
Shahpar Modarresi, Ph.D.
Huafang Zhao, Ph.D.
OFFICE OF SHARED ACCOUNTABILITY
850 Hungerford Drive
Rockville, Maryland 20850
301-279-3553
Mr. Larry A. Bowers Dr. Maria V. Navarro
Interim Superintendent of Schools Chief Academic Officer

Montgomery County Public Schools Office of Shared Accountability
Program Evaluation i Impact of ELO SAIL: Fall 2012 to Fall 2015
Table of Contents
Executive Summary ....................................................................................................................... ix
Summary of Methodology ......................................................................................................... ix
Summary of Findings ................................................................................................................. ix
Question 1. ............................................................................................................................. ix
Conclusion ................................................................................................................................. xi
Background ..................................................................................................................................... 1
Program Description ................................................................................................................... 1
Overview ................................................................................................................................. 1
Target population. ................................................................................................................... 1
Program purpose. .................................................................................................................... 1
Structure and funding. ............................................................................................................. 2
Staffing. ................................................................................................................................... 2
Major program changes since 2009. ....................................................................................... 2
Previous Evaluations of ELO SAIL ............................................................................................ 2
Scope of the Evaluation .................................................................................................................. 4
Methodology ................................................................................................................................... 5
Study Populations ....................................................................................................................... 5
Measures ..................................................................................................................................... 5
Data Collection ........................................................................................................................... 6
Analytical Procedures ................................................................................................................. 6
Strengths and Limitations of the Methodology .......................................................................... 7
Results ............................................................................................................................................. 8
Findings for Question 1: What were the demographic characteristics of students in Grades K–2 who
attended ELO SAIL in 2012, 2013, 2014, and 2015? ................................................................. 8
Findings for Question 2: How did the students who participated in ELO SAIL in 2012, 2013, 2014,
and 2015 perform in the fall, compared with students in Title I schools who did not participate?
..................................................................................................................................................... 9
Kindergarten ........................................................................................................................... 9
Grade 1 .................................................................................................................................. 12
Grade 2 .................................................................................................................................. 14
Reading ................................................................................................................................. 14
Summary for Question 2 ....................................................................................................... 16

Montgomery County Public Schools Office of Shared Accountability
Program Evaluation ii Impact of ELO SAIL: Fall 2012 to Fall 2015
Findings for Question 3: How did the Title I students who participated in ELO SAIL in 2012, 2013,
and 2014 perform in reading and mathematics at the end of the school year, compared with their
nonparticipating peers in Title I schools? ................................................................................. 18
Reading ................................................................................................................................. 18
Mathematics .......................................................................................................................... 21
Grade 1 .................................................................................................................................. 22
Grade 2 .................................................................................................................................. 23
Summary for Question 3 ....................................................................................................... 24
Conclusion .................................................................................................................................... 25
References ..................................................................................................................................... 26
Appendix A Findings for Question 2 on Fall Performance: Reading for Subgroups of
Kindergarten Students ................................................................................................................... 27
Appendix B Findings for Question 2 on Fall Performance: Mathematics for Subgroups of
Kindergarten Students ................................................................................................................... 32
Appendix C Findings for Question 2 on Fall Performance: Reading for Subgroups of Grade 1
Students ......................................................................................................................................... 36
Appendix D Findings for Question 2 on Fall Performance: Mathematics for Subgroups of
Grade 1 Students ........................................................................................................................... 40
Appendix E Findings for Question 2 on Fall Performance: Reading for Subgroups of Grade 2
Students ......................................................................................................................................... 44
Appendix F Findings for Question 2 on Fall Performance: Mathematics for Subgroups of
Grade 2 Students ........................................................................................................................... 48
Appendix G Findings for Question 3 on End-of-Year Performance: Reading for Subgroups of
Kindergarten Students ................................................................................................................... 52
Appendix H Findings for Question 3 on End-of-Year Performance: Reading for Subgroups of
Grade 1 Students ........................................................................................................................... 56
Appendix I Findings for Question 3 on End-of-Year Performance: Reading for Subgroups of
Grade 2 Students ........................................................................................................................... 60
Appendix J Findings for Question 3 on End-of-Year Performance: Mathematics for Subgroups
of Kindergarten Students .............................................................................................................. 64
Appendix K Findings for Question 3 on End-of-Year Performance: Mathematics for Subgroups
of Grade 1 Students ....................................................................................................................... 68
Appendix L Findings for Question 3 on End-of-Year Performance: Mathematics for Subgroups
of Grade 2 Students ....................................................................................................................... 72

Montgomery County Public Schools Office of Shared Accountability
Program Evaluation iii Impact of ELO SAIL: Fall 2012 to Fall 2015
List of Tables
Table 1 Characteristics of ELO SAIL Students in Grades K–2 by School Year and Subgroup .... 8
Table A1 Number of Kindergarten Students With AP-PR Reading Data From Fall by School Year,
Participation in ELO SAIL, and Selected Subgroups ................................................................... 27
Table A2 Categories of AP-PR Reading Performance for Kindergarten Students in 2015–2016 by
ELO SAIL Participation and Selected Subgroups ........................................................................ 31
Table B1 Number of Kindergarten Students With MAP-P RIT Scores in Mathematics From Fall by
School Year, Participation in ELO SAIL, and Selected Subgroups ............................................. 32
Table C1 Number of Grade 1 Students With AP-PR Book Levels in Fall and Prior Spring by School
Year, Participation in ELO SAIL, and Selected Subgroups ......................................................... 36
Table D1 Number of Grade 1 Students With MAP-P RIT Scores in Mathematics From Fall and Prior
Spring by School Year, Participation in ELO SAIL, and Selected Subgroups ........................... 40
Table E1 Number of Grade 2 Students With AP-PR Book Levels in Fall and Prior Spring by School
Year, Participation in ELO SAIL, and Selected Subgroups ......................................................... 44
Table F1 Number of Grade 2 Students With MAP-P RIT Scores in Mathematics From Fall and Prior
Spring by School Year, Participation in ELO SAIL, and Selected Subgroups ........................... 48
Table G1 Number of Kindergarten Students With End-of-Year AP-PR Reading Data by School Year,
Participation in ELO SAIL, and Selected Subgroups ................................................................... 52
Table H1 Number of Grade 1 Students With End-of-Year AP-PR Reading Data by School Year,
Participation in ELO SAIL, and Selected Subgroups ................................................................... 56
Table I1 Number of Grade 2 Students With End-of-Year AP-PR Reading Data by School Year,
Participation in ELO SAIL, and Selected Subgroups ................................................................... 60
Table J1 Number of Kindergarten Students With End-of-Year MAP-P RIT Score in Mathematics by
School Year, Participation in ELO SAIL, and Selected Subgroups ............................................. 64
Table K1 Number of Grade 1 Students With End-of-Year MAP-P RIT Score in Mathematics by
School Year, Participation in ELO SAIL, and Selected Subgroups ............................................. 68
Table L1 Number of Grade 2 Students With End-of-Year MAP-P RIT Score in Mathematics by
School Year, Participation in ELO SAIL, and Selected Subgroups ............................................. 72
Montgomery County Public Schools Office of Shared Accountability
Program Evaluation iv Impact of ELO SAIL: Fall 2012 to Fall 2015
List of Figures Figure 2.0 Percentage of kindergarten students who were reading, based on AP-PR in fall, for ELO SAIL
participants and nonparticipants by school year 9
Figure 2.1 Percentage of kindergarten students in reading categories from fall AP-PR for 2015–2016
by ELO SAIL participation 10
Figure 2.2 Mean MAP-P RIT scores in mathematics from fall for kindergarten students by participation
in ELO SAIL and school year 11
Figure 2.3 Percentage of Grade 1 students whose AP-PR book level book level in fall increased or stayed
the same from prior spring for ELO SAIL participants and nonparticipants by school year 12
Figure 2.4 Mean gain in MAP-P RIT mathematics score from prior spring to fall for Grade 1 ELO SAIL
participants and nonparticipants by school year 13
Figure 2.5 Percentage of Grade 2 students whose AP-PR book level in fall increased or stayed the same
from prior spring for ELO SAIL participants and nonparticipants by school year 14
Figure 2.6 Mean gain in MAP-P RIT mathematics score from prior spring to fall for Grade 2 ELO SAIL
participants and nonparticipants by school year 16
Figure 3.0 Percentage of kindergarten students who met the end-of-year AP-PR reading benchmark
for ELO SAIL participants and nonparticipants by school year 18
Figure 3.1 Percentage of Grade 1 students who met the end-of-year AP-PR reading benchmark
for ELO SAIL participants and nonparticipants by school year 19
Figure 3.2 Percentage of Grade 2 students who met the end-of-year AP-PR reading benchmark
for ELO SAIL participants and nonparticipants by school year 20
Figure 3.3 Mean end-of-year MAP-P RIT scores in mathematics for kindergarten students by
participation in ELO SAIL and school year 21
Figure 3.4 Mean end-of-year MAP-P RIT scores in mathematics for Grade 1 students by participation
in ELO SAIL and school year 22
Figure 3.5 Mean end-of-year MAP-P RIT scores in mathematics for Grade 2 students by participation
in ELO SAIL and school year 23
Figure A1 Percentage of Asian kindergarten students who were reading, based on AP-PR in fall,
for ELO SAIL participants and nonparticipants by school year 27
Figure A2 Percentage of Black or African American kindergarten students who were reading,
based on AP-PR in fall, for ELO SAIL participants and nonparticipants by school year 28
Figure A3 Percentage of Hispanic/Latino kindergarten students who were reading, based on AP-PR in fall,
for ELO SAIL participants and nonparticipants by school year 28
Figure A4 Percentage of White kindergarten students who were reading, based on AP-PR in fall,
for ELO SAIL participants and nonparticipants by school year 29
Figure A5 Percentage of kindergarten students receiving ESOL services who were reading, based
on AP-PR in fall, for ELO SAIL participants and nonparticipants by school year 29
Figure A6 Percentage of kindergarten students receiving FARMS services who were reading, based
on AP-PR in fall, for ELO SAIL participants and nonparticipants by school year 30
Figure A7 Percentage of kindergarten students receiving special education services who were reading,
based on AP-PR in fall, for ELO SAIL participants and nonparticipants by school year 30
Figure B1 Mean MAP-P RIT scores in mathematics from fall for Asian kindergarten students by
participation in ELO SAIL and school year 32
Figure B2 Mean MAP-P RIT scores in mathematics from fall for Black or African American kindergarten
students by participation in ELO SAIL and school year 33
Figure B3 Mean MAP-P RIT scores in mathematics from fall for Hispanic/Latino kindergarten students
by participation in ELO SAIL and school year 33
Figure B4 Mean MAP-P RIT scores in mathematics from fall for White kindergarten students
by participation in ELO SAIL and school year 34
Montgomery County Public Schools Office of Shared Accountability
Program Evaluation v Impact of ELO SAIL: Fall 2012 to Fall 2015
Figure B5 Mean MAP-P RIT scores in mathematics from fall for kindergarten students receiving ESOL
services by participation in ELO SAIL and school year 34
Figure B6 Mean MAP-P RIT scores in mathematics from fall for kindergarten students receiving
FARMS services by participation in ELO SAIL and school year 35
Figure B7 Mean MAP-P RIT scores in mathematics from fall for kindergarten students receiving
special education services by participation in ELO SAIL and school year 35
Figure C1 Percentage of Grade 1 Asian students whose AP-PR book level in fall increased or stayed
the same from prior spring for ELO SAIL participants and nonparticipants by school year 36
Figure C2 Percentage of Grade 1 Black or African American students whose AP-PR book level in fall
increased or stayed the same from prior spring for ELO SAIL participants and nonparticipants
by school year 37
Figure C3 Percentage of Grade 1 Hispanic/Latino students whose AP-PR book level in fall
increased or stayed the same from prior spring for ELO SAIL participants and nonparticipants
by school year 37
Figure C4 Percentage of White Grade 1 students whose AP-PR book level in fall increased or
stayed the same from prior spring for ELO SAIL participants and nonparticipants by school year 38
Figure C5 Percentage of Grade 1 ESOL recipients whose AP-PR book level in fall increased or
stayed the same from prior spring for ELO SAIL participants and nonparticipants by school year 38
Figure C6 Percentage of Grade 1 FARMS recipients whose AP-PR book level in fall increased
or stayed the same from prior spring for ELO SAIL participants and nonparticipants by school year 39
Figure C7 Percentage of Grade 1 recipients of special education whose AP-PR book level in fall
increased or stayed the same from prior spring for ELO SAIL participants and nonparticipants
by school year 39
Figure D1 Mean gain in MAP-P RIT mathematics score from prior spring to fall for Grade 1 Asian
students by participation in ELO SAIL and school year 40
Figure D2 Mean gain in MAP-P RIT mathematics score from prior spring to fall for Grade 1 Black or
African American students by participation in ELO SAIL and school year 41
Figure D3 Mean gain in MAP-P RIT mathematics score from prior spring to fall for Grade 1
Hispanic/Latino students by participation in ELO SAIL and school year 41
Figure D4 Mean gain in MAP-P RIT mathematics score from prior spring to fall for Grade 1 White
students by participation in ELO SAIL and school year 42
Figure D5 Mean gain in MAP-P RIT mathematics score from prior spring to fall for Grade 1 ESOL
recipients by participation in ELO SAIL and school year 42
Figure D6 Mean gain in MAP-P RIT mathematics score from prior spring to fall for Grade 1 FARMS
recipients by participation in ELO SAIL and school year 43
Figure D7 Mean gain in MAP-P RIT mathematics score from prior spring to fall for Grade 1 special
education recipients by participation in ELO SAIL and school year 43
Figure E1 Percentage of Grade 2 Asian students whose AP-PR book level in fall increased or stayed
the same from prior spring for ELO SAIL participants and nonparticipants by school year 44
Figure E2 Percentage of Grade 2 Black or African American students whose AP-PR book level in fall
increased or stayed the same from prior spring for ELO SAIL participants and nonparticipants
by school year 45
Figure E3 Percentage of Grade 2 Hispanic/Latino students whose AP-PR book level in fall increased
or stayed the same from prior spring for ELO SAIL participants and nonparticipants by school year 45
Figure E4 Percentage of Grade 2 White students whose AP-PR book level in fall increased or stayed the
same from prior spring for ELO SAIL participants and nonparticipants by school year 46
Figure E5 Percentage of Grade 2 students receiving ESOL services whose AP-PR book level in fall
increased or stayed the same from prior spring for ELO SAIL participants and nonparticipants by school
year 46
Montgomery County Public Schools Office of Shared Accountability
Program Evaluation vi Impact of ELO SAIL: Fall 2012 to Fall 2015
Figure E6 Percentage of Grade 2 students receiving FARMS services whose AP-PR book level in fall
increased or stayed the same from prior spring for ELO SAIL participants and nonparticipants by school
year 47
Figure E7 Percentage of Grade 2 students receiving special education services whose AP-PR
book level in fall increased or stayed the same from prior spring for ELO SAIL participants and
nonparticipants by school year 47
Figure F1 Mean gain in MAP-P RIT mathematics score from prior spring to fall for Grade 2 Asian
students by participation in ELO SAIL and school year 48
Figure F2 Mean gain in MAP-P RIT mathematics score from prior spring to fall for Grade 2 Black or African
American students by participation in ELO SAIL and school year 49
Figure F3 Mean gain in MAP-P RIT mathematics score from prior spring to fall for Grade 2
Hispanic/Latino by participation in ELO SAIL and school year 49
Figure F4 Mean gain in MAP-P RIT mathematics score from prior spring to fall for Grade 2 White
students by participation in ELO SAIL and school year 50
Figure F5 Mean gain in MAP-P RIT mathematics score from prior spring to fall for Grade 2 ESOL
recipients by participation in ELO SAIL and school year 50
Figure F6 Mean gain in MAP-P RIT mathematics score from prior spring to fall for Grade 2 FARMS
recipients by participation in ELO SAIL and school year 51
Figure F7 Mean gain in MAP-P RIT mathematics score from prior spring to fall for Grade 2 special
education recipients by participation in ELO SAIL and school year 51
Figure G1 Percentage of Asian kindergarten students who met the end-of-year AP-PR reading benchmark
for ELO SAIL participants and nonparticipants by school year 52
Figure G2 Percentage of Black or African American kindergarten students who met the AP-PR
end-of-year benchmark for ELO SAIL participants and nonparticipants by school year 53
Figure G3 Percentage of Hispanic/Latino kindergarten students who met the AP-PR end-of-year
benchmark for ELO SAIL participants and nonparticipants by school year 53
Figure G4 Percentage of White kindergarten students who met the AP-PR end-of-year benchmark
for ELO SAIL participants and nonparticipants by school year 54
Figure G5 Percentage of kindergarten students who met the AP-PR end-of-year benchmark for
ELO SAIL participants and nonparticipants by school year for ESOL recipients 54
Figure G6 Percentage of kindergarten students who met the AP-PR end-of-year benchmark for
ELO SAIL participants and nonparticipants by school year for FARMS recipients 55
Figure G7 Percentage of kindergarten students who met the AP-PR end-of-year benchmark for
ELO SAIL participants and nonparticipants by school year for special education recipients 55
Figure H1 Percentage of Asian Grade 1 students who met the AP-PR end-of-year benchmark for
ELO SAIL participants and nonparticipants by school year 56
Figure H2 Percentage of Black or African American Grade 1 students who met the AP-PR end-of-year
benchmark for ELO SAIL participants and nonparticipants by school year 57
Figure H3 Percentage of Hispanic/Latino Grade 1 students who met the AP-PR end-of-year benchmark
for ELO SAIL participants and nonparticipants by school year 57
Figure H4 Percentage of White Grade 1 students who met the AP-PR end-of-year benchmark
for ELO SAIL participants and nonparticipants by school year 58
Figure H5 Percentage of Grade 1 students who met the AP-PR end-of-year benchmark for ELO SAIL
participants and nonparticipants by school year for ESOL recipients 58
Figure H6 Percentage of Grade 1 students who met the AP-PR end-of-year benchmark for ELO SAIL
participants and nonparticipants by school year for FARMS recipients 59
Figure H7 Percentage of Grade 1 students who met the AP-PR end-of-year benchmark for ELO SAIL
participants and nonparticipants by school year for special education recipients 59
Figure I1 Percentage of Asian Grade 2 students who met the AP-PR end-of-year benchmark for
ELO SAIL participants and nonparticipants by school year 60

Montgomery County Public Schools Office of Shared Accountability
Program Evaluation vii Impact of ELO SAIL: Fall 2012 to Fall 2015
Figure I2 Percentage of Black or African American Grade 2 students who met the AP-PR end-of-year
benchmark for ELO SAIL participants and nonparticipants by school year 61
Figure I3 Percentage of Hispanic/Latino Grade 2 students who met the AP-PR end-of-year
benchmark for ELO SAIL participants and nonparticipants by school year 61
Figure I4 Percentage of White Grade 2 students who met the AP-PR end-of-year benchmark
for ELO SAIL participants and nonparticipants by school year 62
Figure I5 Percentage of Grade 2 students who met the AP-PR end-of-year benchmark for ELO SAIL
participants and nonparticipants by school year for ESOL recipients 62
Figure I6 Percentage of Grade 2 students who met the AP-PR end-of-year benchmark for ELO SAIL
participants and nonparticipants by school year for FARMS recipients 63
Figure I7 Percentage of Grade 2 students who met the AP-PR end-of-year benchmark for ELO SAIL
participants and nonparticipants by school year for special education recipients 63
Figure J1 Mean end-of-year MAP-P RIT scores in mathematics for Asian kindergarten students by
participation in ELO SAIL and school year 64
Figure J2 Mean end-of-year MAP-P RIT scores in mathematics for Black or African American
kindergarten students by participation in ELO SAIL and school year 65
Figure J3 Mean end-of-year MAP-P RIT scores in mathematics for Hispanic/Latino kindergarten students
by participation in ELO SAIL and school year 65
Figure J4 Mean end-of-year MAP-P RIT scores in mathematics for White kindergarten students
by participation in ELO SAIL and school year 66
Figure J5 Mean end-of-year MAP-P RIT scores in mathematics for kindergarten students who receive
ESOL services by participation in ELO SAIL and school year 66
Figure J6 Mean end-of-year MAP-P RIT scores in mathematics for kindergarten students who receive
FARMS services by participation in ELO SAIL and school year 67
Figure J7 Mean end-of-year MAP-P RIT scores in mathematics for kindergarten students who receive
special education services by participation in ELO SAIL and school year 67
Figure K1 Mean end-of-year MAP-P RIT scores in mathematics for Asian Grade 1 students by
participation in ELO SAIL and school year 68
Figure K2 Mean end-of-year MAP-P RIT scores in mathematics for Black or African American Grade 1
students by participation in ELO SAIL and school year 69
Figure K3 Mean end-of-year MAP-P RIT scores in mathematics for Hispanic/Latino Grade 1 students
by participation in ELO SAIL and school year 69
Figure K4 Mean end-of-year MAP-P RIT scores in mathematics for White Grade 1 students by
participation in ELO SAIL and school year 70
Figure K5 Mean end-of-year MAP-P RIT scores in mathematics for Grade 1 students who receive ESOL
services by participation in ELO SAIL and school year 70
Figure K6 Mean end-of-year MAP-P RIT scores in mathematics for Grade 1 students who receive
FARMS services by participation in ELO SAIL and school year 71
Figure K7 Mean end-of-year MAP-P RIT scores in mathematics for Grade 1 students
who receive special education services by participation in ELO SAIL and school year 71
Figure L1 Mean end-of-year MAP-P RIT scores in mathematics for Asian Grade 2 students by
participation in ELO SAIL and school year 72
Figure L2 Mean end-of-year MAP-P RIT scores in mathematics for Black or African American Grade 2
students by participation in ELO SAIL and school year 73
Figure L3 Mean end-of-year MAP-P RIT scores in mathematics for Hispanic/Latino Grade 2 students
by participation in ELO SAIL and school year 73
Figure L4 Mean end-of-year MAP-P RIT scores in mathematics for White Grade 2 students
by participation in ELO SAIL and school year 74
Figure L5 Mean end-of-year MAP-P RIT scores in mathematics for Grade 2 students who receive ESOL
services by participation in ELO SAIL and school year 74

Montgomery County Public Schools Office of Shared Accountability
Program Evaluation viii Impact of ELO SAIL: Fall 2012 to Fall 2015
Figure L6 Mean end-of-year MAP-P RIT scores in mathematics for Grade 2 students who receive
FARMS services by participation in ELO SAIL and school year 75
Figure L7 Mean end-of-year MAP-P RIT scores in mathematics for Grade 2 students who receive
special education services by participation in ELO SAIL and school year 75

Montgomery County Public Schools Office of Shared Accountability
Program Evaluation ix Impact of ELO SAIL: Fall 2012 to Fall 2015
Executive Summary
This study is an evaluation of Extended Learning Opportunities—Summer Adventures in Learning (ELO
SAIL), which is a Montgomery County Public Schools (MCPS) summer program in Title I elementary
schools. ELO SAIL has two major goals: 1) to prevent the achievement loss that students may
experience in summer and 2) to prepare students for the next grade level. The program is offered in all
24 Title I schools during July; its target includes students who will enter kindergarten, Grade 1, or Grade
2 in the fall after the summer session. The program features a four-hour instructional day of reading,
language arts, and mathematics.
The evaluation focuses on the impact of ELO SAIL on student academic achievement. This report
addresses the following questions; a subsequent report will analyze the impact of the 2015 ELO SAIL
program in greater detail.
1. What were the demographic characteristics of students in Kindergarten–Grade 2 who attended ELO
SAIL in 2012, 2013, 2014, and 2015?
2. How did the students who participated in ELO SAIL in 2012, 2013, 2014, and 2015 perform in the
fall, compared with students in Title I schools who did not participate? Did the academic impact of
the program vary by student subgroups?
3. How did the students who participated in ELO SAIL in 2012, 2013, and 2014 perform in reading
and mathematics at the end of the school year, compared with their nonparticipating peers in Title I
schools? Did the academic impact of the program vary by student subgroups?
Summary of Methodology
The study populations were all students who participated in ELO SAIL from 2012 to 2015. The
comparison groups were students who did not participate in ELO SAIL and were enrolled in Grades K–
2 in Title I schools during 2012–2013, 2013–2014, and 2014–2015. Rasch unit (RIT) scores in
mathematics from Measures of Academic Progress-Primary Grades (MAP-P) were used as outcome
measures for mathematics. Reading levels from the Assessment Program in Primary Reading (AP-PR)
were used as outcome measures for reading. For questions 2 and 3, bivariate tests of significance were
used to examine differences by grade level and content area between students who participated in ELO
SAIL and those who did not for all students and for seven student subgroups: Asian, Black or African
American, Hispanic/Latino, White, and students who received the following services: English for
Speakers of Other Languages (ESOL), Free and Reduced-price Meal System (FARMS), and special
education.
Summary of Findings
Question 1. Across four summers (2012, 2013, 2014, and 2015), more than 14,000 students in
Grades K–2 attended ELO SAIL. Out of this total, about two thirds were Hispanic/Latino and one
quarter were Black or African American. About one half of the students received ESOL, five out of six
received FARMS, and one out of ten received special education services. The percentage for each
subgroup was similar every year.
Montgomery County Public Schools Office of Shared Accountability
Program Evaluation x Impact of ELO SAIL: Fall 2012 to Fall 2015
Question 2: Kindergarten. Among all kindergarten students, the only significant difference in
fall AP-PR reading results was in one of the four years, when more ELO SAIL attendees were at a pre-
reading level (i.e., have mastered foundational reading skills) compared to their peers who did not attend.
The impact on fall reading results did not vary across kindergarten subgroups. In six of the seven
subgroups (all except for White students), there were statistically significant differences for at least one
year in favor of stronger reading performance by ELO SAIL attendees.
Among all kindergarteners, the mean RIT score in mathematics from the fall MAP-P test was
significantly lower for ELO SAIL participants than for nonparticipants in two of the three years
examined. However, among subgroups of kindergarteners, the math performance in the fall of students
who attended ELO SAIL did not differ from non-attendees, with very few exceptions.
Question 2: Grades 1 and 2. The analyses for Grade 1 and Grade 2 students concerned changes
in performance in the fall after each ELO session, compared to performance in the spring prior to that
ELO session; four years were examined. The reading measures concerned whether students increased or
stayed at the same AP-PR book level. Among all first graders, there was a significant difference in
reading for only one year; ELO SAIL participants experienced less summer loss in reading compared
with their peers who did not attend. Among all second graders, there were no differences between ELO
SAIL attendees and non-attendees in summer reading loss for any year. There was little variation in
summer reading loss by subgroups of first or second graders; ELO SAIL attendees did not differ from
non-attendees, with very few exceptions.
The mathematics measures for Grades 1 and 2 concerned gains in RIT scores in mathematics from MAP-
P. For all Grade 1 students, the mean gains of ELO SAIL attendees were significantly higher than those
of non-attendees in two of the four years. There was little variation in impact across subgroups of first
graders. Differences in math gains were statistically significant in favor of ELO SAIL for at least two
years among five of the seven subgroups: Black or African American, Hispanic/Latino, ESOL recipients,
FARMS recipients, and special education recipients.
Among all second graders, the mean gains in math scores were significantly higher for ELO SAIL
participants than nonparticipants in three years. There was some variation by subgroup. Differences
between attendees and non-attendees were statistically significant, in favor of ELO SAIL, in three years
for two subgroups, ESOL recipients and FARMS recipients, but in only one or two years for three
subgroups: Black or African American, Hispanic/Latino, and White students.
Question 3: Reading. Reading performance at the end of the year was analyzed for three years;
the only statistically significant differences for all students involved kindergarteners. More
kindergarteners who attended ELO SAIL met the end-of-the-year AP-PR reading benchmark than non-
attendees in two years. There was little variation by subgroup. There were significant differences for
two years in favor of ELO SAIL for five of the seven subgroups: Black or African American,
Hispanic/Latino, ESOL recipients, FARMS recipients, and special education recipients.
First and second graders who participated in ELO SAIL performed as well in meeting the end-of-the-
year reading benchmark as their peers in Title I schools who did not attend. Likewise, for most
subgroups of first graders and second graders, end-of-year reading performance did not differ between
attendees and non-attendees in any year. An exception was statistically significant differences in favor
of ELO SAIL attendees in one year for each of the three services subgroups.
Montgomery County Public Schools Office of Shared Accountability
Program Evaluation xi Impact of ELO SAIL: Fall 2012 to Fall 2015
Question 3: Mathematics. In analyses of all students, ELO SAIL participants had lower RIT
scores on the MAP-P mathematics test at the end of the following year, on average, than their
nonparticipating peers for each grade level in each of the three years examined. These differences in
mathematics were statistically significant in favor of non-attendees in each year for Grades 1 and 2 but
in only one year for kindergarten students.
In contrast, among most subgroups in most years, ELO SAIL attendees and non-attendees did not differ
on end-of-the-year mathematics performance. However, there were a few statistically significant
differences in favor of ELO SAIL attendees and a few statistically significant differences in favor of
non-attendees.
Conclusion
In conclusion, the positive impact of ELO SAIL was stronger on academic performance in the fall than
on performance at the end of the year, based on statistically significant differences between attendees
and non-attendees. Consistent with previous evaluations of ELO SAIL, the benefits varied by content
area, with more positive findings in mathematics than in reading, and varied by grade level, such that
positive findings in reading mainly were for kindergarteners, while positive findings in mathematics
were limited mainly to first and second graders. However, in this study, unlike previous ones, a benefit
for an entire grade level usually was evident for the majority of subgroups.
Montgomery County Public Schools Office of Shared Accountability
Program Evaluation 1 Impact of ELO SAIL: Fall 2012 to Fall 2015
Impact of the Extended Learning Opportunities Summer
Adventures in Learning Program (ELO SAIL) on Student
Academic Performance: Part 1, Results From Fall 2012 to Fall 2015
The Office of Shared Accountability (OSA) is conducting an evaluation of Extended Learning
Opportunities—Summer Adventures in Learning (ELO SAIL) in Montgomery County Public
Schools (MCPS) at the request of the Office of the Chief Academic Officer. The mission of MCPS
is to ensure that every student will have the academic, creative problem solving, and social
emotional skills necessary for success in college and career, as reflected in the district’s Strategic
Planning Framework (MCPS, 2013). Achieving this mission requires eliminating achievement
gaps among student groups. Extended school year and extended school time programs in MCPS
provide students in Title I schools additional learning opportunities to further develop academic
background knowledge. This document is one of two that examine the impact of ELO SAIL on
student academic achievement. This report includes ELO SAIL sessions from summer 2012
through summer 2015 and analyzes data from fall 2012 through fall 2015; the next report will
focus on the summer 2015 ELO SAIL session and analyze data available after fall 2015.
Background
Program Description
Overview. ELO SAIL is a free summer program for students in Grades K–2 in MCPS
Title I elementary schools. The major goals of ELO SAIL are first, to prevent the achievement
loss that students may experience in summer, also known as summer loss, and second, to prepare
students for the next grade level. ELO SAIL was piloted at 17 Title I schools in 2002 and continued
to operate in all 24 Title I schools in summer of 2015 as a part of the district’s strategy to focus
resources and supports for students in these schools (MCPS, 2015).
Target population. The target population for the ELO SAIL program includes students
who will enter kindergarten, Grade 1 or, Grade 2 in the fall after the ELO SAIL session. All
students in Title I schools are eligible to attend. Participation is voluntary in nature. However,
student attendance is monitored closely.
Program purpose. The ELO SAIL program is an equity strategy that seeks to serve the
following specific purposes:
Meet the academic needs of each participant by providing opportunities to review grade-
level concepts
Accelerate learning by previewing concepts and skills to be taught in the grades students
will enter in fall
Strengthen basic skills that are preconditions of later learning
Mitigate the achievement loss that students may experience in summer
Provide continuing English language instruction for speakers of other languages

Montgomery County Public Schools Office of Shared Accountability
Program Evaluation 2 Impact of ELO SAIL: Fall 2012 to Fall 2015
Structure and funding. In 2015, the ELO SAIL program was conducted for 19 days in July
and featured a four-hour instructional day of reading, language arts, and mathematics. Bus
transportation, breakfast, and lunch were provided free of charge. ELO SAIL is a core program
of the federal Title I programs and is supported mainly with federal Title I funding.
Staffing. All teachers must be highly qualified in order to teach in the ELO SAIL program. A
“highly qualified teacher” is someone who has a [minimum of a] bachelor’s degree from an
accredited institution, demonstrates competence in the subject area in which he/she will teach, and
is certified to teach in the state of Maryland (Maryland State Department of Education, 2015). In
summer 2015, classroom teacher to student ratio was 1:18 for all grades. Each school also had
one teacher for English for Speakers of Other Languages (ESOL), one special education resource
teacher, one paraeducator for every 75 enrolled students, one summer attendance secretary, one
cafeteria support, and one clerical support for registration. The Office of Community Engagement
and Partnership in MCPS recruited 230 volunteers to assist staff for ELO SAIL in summer 2015.
The number of volunteers assigned depended on ELO SAIL enrollment in the school, ranging from
4 to 15 volunteers per school.
Major program changes since 2009. In 2009, ELO SAIL targeted students entering
kindergarten through Grade 5 in 22 Title I schools, used an earlier MCPS curriculum, and had
staff-student ratios between 1:17 and 1:19 in Grades K–2. Due to fiscal constraints, the program
was limited to Grades K–2 in summer 2012. Although stimulus funds permitted ELO SAIL to
again serve Grades K–5 in summer 2013, MCPS responded to the threat of economic instability
by committing to fund the program for the early learners K–2 from summer 2014 onward. In
summer 2015, ELO SAIL served Grades K–2 in all 24 Title I schools, provided instruction with
MCPS Curriculum 2.0, and had a staff-student ratio of 1:18 in Grades K–2.
Expected student outcomes. The short-term goal of the ELO SAIL program is to provide a
stimulating academic summer opportunity for students in Title I schools. Further, the expectation
is that students who attend the ELO SAIL program will maintain or improve their skills in reading
and mathematics and be ready to succeed at the next grade level. In the long-run, the expectation
is that ELO SAIL attendees will continue to make expected academic progress and to meet or
exceed grade-level benchmarks in reading and mathematics.
Previous Evaluations of ELO SAIL
There have been MCPS evaluations of ELO SAIL for three previous years of the program: 2002,
2003, and 2007.
ELO SAIL began in summer 2002; the program was for 20 days and provided a preview of reading
and math concepts to students in kindergarten through Grade 3 at 18 schools. The first year of
ELO SAIL was evaluated for its impact on student academic outcomes and whether the impact
differed across student subgroups of race/ethnicity and services received (Sunmonu, Larson, Horn,
Cooper-Martin, & Nielsen, 2002). Students completed pretests in mathematics and reading at the
beginning of the ELO program and posttests in September after the program. Sunmonu et al. found
modest but statistically significant benefits in mathematics for 1st, 2nd, and 3rd graders who attended
all four weeks of the program and modest benefits in reading for students in Grades 1 and 2. The

Montgomery County Public Schools Office of Shared Accountability
Program Evaluation 3 Impact of ELO SAIL: Fall 2012 to Fall 2015
ELO SAIL program benefits were similar across all ethnic groups and also apparent for students
who received Free and Reduced-price Meals System (FARMS) and ESOL services. However, in
Grade 2, the ELO SAIL benefits in mathematics were limited to students with the lowest academic
needs, while the benefits in reading were limited to students with the highest academic needs.
Sunmonu, Curry-Corcoran, and Mordica (2004) evaluated both implementation and outcomes for
the second year of ELO SAIL in 2003, when the program served students in kindergarten through
Grade 4 in 18 Title I schools and ran for 20 days. These evaluators found that student recruitment
efforts and attendance strategies were largely successful; credential for the teachers at the summer
program were equivalent to teachers in Title I schools. Program administrators and teachers, along
with parents of attendees, were satisfied with ELO SAIL. To evaluate outcomes, the authors
calculated the change in each student’s test scores from the spring prior to ELO SAIL to test scores
from the fall after the program for students in Grades 1–4; they used fall scores only for
kindergarteners. Students who attended the program for at least 16 days had higher spring to fall
improvements, compared to their peers who attended five days or fewer, including those who did
not attend at all. Although the only statistically and practically significant difference overall was
for Grade 4 students in mathematics, the benefit did vary by student subgroup. The authors found
significant benefits, in selected grades and academic areas, for ESOL recipients, FARMS
recipients, and also for Asian, Black or African American, and Hispanic/Latino students.
Wang (2009) evaluated the 2007 ELO SAIL program for implementation and impact on student
academic achievement using multilevel data collection methods. She found significantly higher
reading performance in fall for Grade 1 students who attended all four weeks of ELO SAIL (fully
participated). Grade 4 students who attended all four weeks of ELO SAIL significantly
outperformed their nonparticipating peers in mathematics. While not all racial/ethnic groups in
Grades 1 and 4 showed these significant differences, students who were recipients of ESOL or
FARMS services benefited more from ELO SAIL than non-recipients for both first and fourth
graders.
In summary, the previous MCPS studies found a small to modest positive impact of ELO SAIL on
student fall academic performance in reading and mathematics for students with high attendance
at the summer program. However, the benefits varied by grade level, content area, and student
subgroup.

Montgomery County Public Schools Office of Shared Accountability
Program Evaluation 4 Impact of ELO SAIL: Fall 2012 to Fall 2015
Scope of the Evaluation
This evaluation examines the impact of ELO SAIL on student academic achievement as posed by
questions that were developed in collaboration with the program administrators in the Office of
Title I Programs. This report presents findings on the following evaluation questions; a second
report will analyze the impact of the 2015 ELO SAIL program in greater detail.
Evaluation Questions
1. What were the demographic characteristics of students in Kindergarten–Grade 2 who attended
ELO SAIL in 2012, 2013, 2014, and 2015?
2. How did the students who participated in ELO SAIL in 2012, 2013, 2014, and 2015 perform
in the fall, compared with students in Title I schools who did not participate?
a. Did kindergarten students who attended an ELO SAIL program perform better in reading
and mathematics in the following fall, compared with their peers in Title I schools who did
not attend?
b. Did Grade 1 and Grade 2 students who attended an ELO SAIL program experience less
summer loss in reading and mathematics, compared with their peers in Title I schools who
did not attend?
c. Did the academic impact of the ELO SAIL program vary by student subgroups, such as
race/ethnicity and services received?
3. How did the Title I students who participated in ELO SAIL in 2012, 2013, and 2014 perform
in reading and mathematics at the end of the school year, compared with their nonparticipating
peers in Title I schools?
a. Did the program participants in kindergarten, Grade 1, and Grade 2 perform better in reading
and mathematics in the following spring, compared with their peers in Title I schools who
did not attend?
b. Did the academic impact of the ELO SAIL program vary by student subgroups, such as
race/ethnicity and services received?

Montgomery County Public Schools Office of Shared Accountability
Program Evaluation 5 Impact of ELO SAIL: Fall 2012 to Fall 2015
Methodology
Study Populations
The study populations were composed of all students who participated in ELO SAIL from 2012 to
2015. To answer evaluation questions 2 and 3, the comparison groups were students who did not
participate in ELO SAIL and were enrolled in Grades K–2 in Title I schools during the following
school years: 2012–2013, 2013–2014, and 2014–2015. Program participants from summer 2012
to 2015 were chosen because these are the most recent cohorts with comparable and more complete
assessment data.
Measures
Measures for this study included academic performance and student characteristics.
Mathematics. Measures of Academic Progress-Primary Grades (MAP-P) is an integrated
collection of computerized assessments designed for students in kindergarten through second
grade (Northwest Education Association, 2008 and 2011). It includes multiple-choice items and
a variety of other item types. Task instructions are provided through audio headphones to capitalize
on non-readers’ or early readers’ auditory comprehension more than reading comprehension. The
MAP-P are designed to provide educators with instructional information about what students are
ready to learn. Rasch unit (RIT) scores for mathematics from MAP-P were used as outcome
measures.
To answer evaluation question 2 for mathematics performance in the fall, the measures varied by
grade level. For kindergarteners, the measure was the RIT score from the MAP-P in mathematics
assessment completed in the fall after the ELO SAIL session. For Grades 1 and 2, the analyses
examined differences between the RIT score from the fall assessment following ELO SAIL and
the RIT score from the spring prior to ELO SAIL. The measure to answer evaluation question 3
was the RIT score from the spring (i.e., the end of the year) following each ELO SAIL session.
Reading. Data from the Assessment Program in Primary Reading (AP-PR) were used as
reading measures. The AP-PR is a research-based and locally developed assessment used to
measure important concepts and skills in the MCPS reading curriculum. AP-PR results provide
formative and summative data. The Text Reading and Comprehension (TRC) subtest of the AP-
PR is administered in the fall, winter, and spring each year to students from kindergarten to
Grade 2. Teachers and staff can use the data to monitor students’ reading accuracy, oral retell, and
oral comprehension and to guide instructional decisions. Students are expected to reach grade-
specific benchmarks in spring (i.e., Level 4 for K, Level 16 for Grade 1, and Level M for
Grade 2). (MAP-P includes scores for reading as well as mathematics. However, most
Grade K–2 students did not complete the reading portion of MAP-P from 2012 to 2015, and so
RIT scores for reading were not available.)
To answer evaluation question 2 for reading performance in the fall, the measures varied by grade
level. For kindergarten, reading performance in the fall, after the summer of each ELO session,
was analyzed. For the years of this study, relatively few kindergarten students (about 15%) had a

Montgomery County Public Schools Office of Shared Accountability
Program Evaluation 6 Impact of ELO SAIL: Fall 2012 to Fall 2015
book level from the AP-PR in fall. Therefore, instead of analyzing each student’s book level, the
analyses focused on whether students were reading (i.e., had a book level) or not. More
information on reading performance was available for AP-PR in 2015–2016 for students who were
not reading. There was information on whether students had passed print concepts (foundational,
pre-reading behaviors), had attempted the print concepts test and failed it, or were not ready for
print concepts. There was also information on whether they had passed reading behaviors, which
is part two of print concepts. Therefore, 2015–2016 analyses of fall reading performance for
kindergarten students used three categories:
Non-reading, for students who were not ready for print concepts or attempted but did not
pass it
Pre-reading, for students who passed print concepts or reading behaviors
Reading for students who had any book level
To answer evaluation question 2 about reading performance in the fall for students in Grades 1
and 2, each student’s book level in fall (after ELO SAIL) was compared to his or her book level
in the previous spring (prior to ELO SAIL). The analyses focused on summer loss by examining
the percentage of students whose fall book level increased or stayed the same compared to their
book level the prior spring, meaning they had no summer loss. Analyses for 1st and 2nd graders
included only students with a book level from both spring and fall.
To answer evaluation question 3 for reading performance at the end of the academic year,
percentages of students meeting grade-specific benchmarks (noted above) in spring were used.
Student characteristics. Demographic information on students included grade level,
gender, race/ethnicity, and receipt of the following services: ESOL, FARMS, and special
education.
Data Collection
Student-level data on participation in ELO SAIL, characteristics, and outcomes were downloaded
from appropriate MCPS databases.
Analytical Procedures
Descriptive analyses addressed all evaluation questions. For evaluation questions 2 and 3,
bivariate tests of significance also were used to examine differences between students who
participated in ELO SAIL and those who did not. Specifically χ2 tests were used for the reading
measures because they were categorical (i.e., students did or did not have summer loss, students
did or did not meet the end-of-year reading benchmark). For the mathematics measures, t-tests
were used because the RIT scores were continuous (i.e., had a wide range of values) and were a
ratio scale (i.e., start at zero and had the same distance between values).

Montgomery County Public Schools Office of Shared Accountability
Program Evaluation 7 Impact of ELO SAIL: Fall 2012 to Fall 2015
Strengths and Limitations of the Methodology
One strength of this study is that ELO SAIL attendees were compared to other students from the
Title I schools that offer ELO SAIL. Thus, the comparison group had similar school experiences.
Further, the authors calculated the academic performance of multiple, successive cohorts of
students (for four years for fall performance and for three years for end-of-year performance) to
estimate the yearly impact of ELO SAIL on student academic achievement. The inclusion of
multiple years of results for each question leads to increased confidence in the study’s results and
conclusions.
There are three caveats when interpreting the results. One, the tests of significance did not control
for any differences between attendees and non-attendees at ELO SAIL that could affect their
academic performance, such as initial ability. Two, the ELO SAIL participants in this study varied
in the level of attendance. The coding of attendance data at ELO SAIL varied across the years
included in our analyses, and, therefore, we did not consider the data reliable enough to use.
However, prior evaluations of ELO SAIL identified benefits only for students who attended four
weeks or at least 16 days. By including students with both high and low attendance, the following
results may under-estimate the impact of ELO SAIL. Three, for the measure of reading in the fall
used for students in Grades 1 and 2, we calculated whether a student had an increase in book level
or stayed the same compared to the prior spring. However, because there are not equal intervals
between the book levels, the effort for a student to increase from one book level to the next may
not be the same for every book level.
Lastly, it should be noted that causality may not be inferred from this study due to the lack of an
experimental design. The underlying assumption of an experimental design is to administer an
intervention program (e.g., ELO SAIL) to only one group and use another group who did not
receive the same type of treatment as a comparison. Although the comparison group in this study
did not attend ELO SAIL, it is not known whether these students received a similar type of
academic or enrichment program during the summer.
Montgomery County Public Schools Office of Shared Accountability
Program Evaluation 8 Impact of ELO SAIL: Fall 2012 to Fall 2015
Results
Findings for Question 1: What were the demographic characteristics of students in Grades
K–2 who attended ELO SAIL in 2012, 2013, 2014, and 2015?
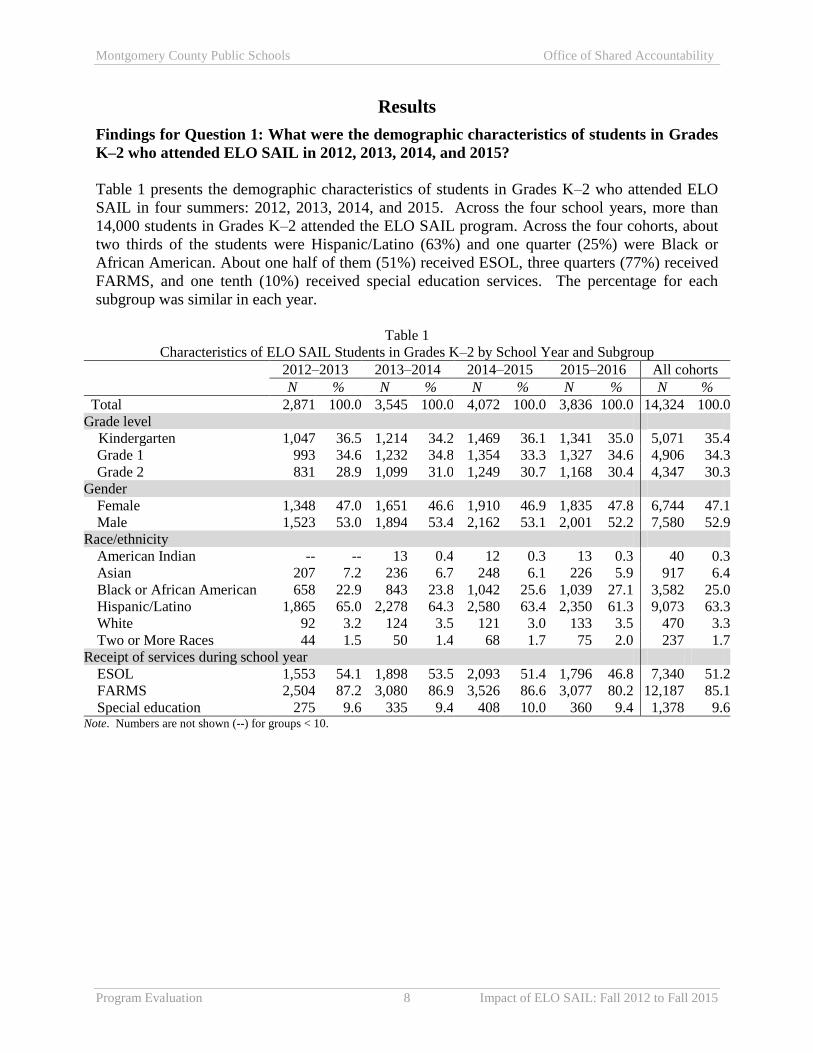
Table 1 presents the demographic characteristics of students in Grades K–2 who attended ELO
SAIL in four summers: 2012, 2013, 2014, and 2015. Across the four school years, more than
14,000 students in Grades K–2 attended the ELO SAIL program. Across the four cohorts, about
two thirds of the students were Hispanic/Latino (63%) and one quarter (25%) were Black or
African American. About one half of them (51%) received ESOL, three quarters (77%) received
FARMS, and one tenth (10%) received special education services. The percentage for each
subgroup was similar in each year.
Table 1
Characteristics of ELO SAIL Students in Grades K–2 by School Year and Subgroup
2012–2013 2013–2014 2014–2015 2015–2016 All cohorts
N % N % N % N % N %
Total 2,871 100.0 3,545 100.0 4,072 100.0 3,836 100.0 14,324 100.0
Grade level
Kindergarten 1,047 36.5 1,214 34.2 1,469 36.1 1,341 35.0 5,071 35.4
Grade 1 993 34.6 1,232 34.8 1,354 33.3 1,327 34.6 4,906 34.3
Grade 2 831 28.9 1,099 31.0 1,249 30.7 1,168 30.4 4,347 30.3
Gender
Female 1,348 47.0 1,651 46.6 1,910 46.9 1,835 47.8 6,744 47.1
Male 1,523 53.0 1,894 53.4 2,162 53.1 2,001 52.2 7,580 52.9
Race/ethnicity
American Indian -- -- 13 0.4 12 0.3 13 0.3 40 0.3
Asian 207 7.2 236 6.7 248 6.1 226 5.9 917 6.4
Black or African American 658 22.9 843 23.8 1,042 25.6 1,039 27.1 3,582 25.0
Hispanic/Latino 1,865 65.0 2,278 64.3 2,580 63.4 2,350 61.3 9,073 63.3
White 92 3.2 124 3.5 121 3.0 133 3.5 470 3.3
Two or More Races 44 1.5 50 1.4 68 1.7 75 2.0 237 1.7
Receipt of services during school year
ESOL 1,553 54.1 1,898 53.5 2,093 51.4 1,796 46.8 7,340 51.2
FARMS 2,504 87.2 3,080 86.9 3,526 86.6 3,077 80.2 12,187 85.1
Special education 275 9.6 335 9.4 408 10.0 360 9.4 1,378 9.6 Note. Numbers are not shown (--) for groups < 10.

Montgomery County Public Schools Office of Shared Accountability
Program Evaluation 9 Impact of ELO SAIL: Fall 2012 to Fall 2015
Findings for Question 2: How did the students who participated in ELO SAIL in 2012, 2013,
2014, and 2015 perform in the fall, compared with students in Title I schools who did not
participate?
Findings are separated by grade level; each grade level includes findings on reading performance,
mathematics performance, and variations among student subgroups. This section includes graphs
only for the total group; graphs for seven subgroups (Asian, Black or African American,
Hispanic/Latino, White, ESOL recipients, FARMS recipients, and special education recipients)
are in appendices for each academic area in each grade level.
Kindergarten
Reading. For the years of this study, relatively few kindergarten students (about 15%) had
a book level from the AP-PR in fall. Therefore, instead of analyzing each student’s book level,
the analyses focused on whether students were reading or not. Among kindergarten students,
slightly more ELO SAIL participants than nonparticipants were reading in the fall of each year
(Figure 2.0). None of these differences were statistically significant.
Figure 2.0
Percentage of kindergarten students who were reading, based on AP-PR in fall,
for ELO SAIL participants and nonparticipants by school year
Note. (#) refers to total number of students in group.
*p < .05, **p <. 01, ***p <. 001
As seen in Appendix A, there was little variation in reading performance of ELO SAIL participants
across subgroups of kindergarteners. As with all kindergarteners, there were more readers in ELO
SAIL every year for four subgroups: Black or African American, Hispanic/Latino, ESOL
recipients, and FARMS recipients. Better performance by ELO SAIL attendees also was apparent
6.4(976)
7.8(1,112)
6.9(1,349)
8.2(1,288)6.1
(1,713)
6.6(1,860)
6.4(1,478)
7.2(1,211)
0
10
20
30
40
50
60
70
80
90
100
2012–2013 2013–2014 2014–2015 2015–2016
% o
f kin
der
gar
ten s
tud
ents
School year
SAIL
Non-SAIL

Montgomery County Public Schools Office of Shared Accountability
Program Evaluation 10 Impact of ELO SAIL: Fall 2012 to Fall 2015
for Asian students in three years and for special education recipients in two years. The following
differences in favor of ELO SAIL attendees were statistically significant:
Asian students in 2015–2016 (χ2(1) = 6.40, p < .05)
Black or African American students in 2013–2014 (χ2(1) = 5.69, p < .05)
Hispanic/Latino students in 2013–2014 (χ2(1) = 7.34, p < .01)
ESOL recipients in 2013–2014 (χ2(1) = 4.53, p < .05)
FARMS recipients in three years: 2013–2014 (χ2(1) = 5.09, p < .05), 2014–2015 (χ2(1) =
4.64, p < .05), and 2015–2016 (χ2(1) = 5.39, p < .05)
For White students, the pattern was reversed; in every year there were fewer readers among ELO
SAIL attendees than non-attendees, although the differences were not statistically significant.
More information on reading performance was available for AP-PR in 2015–2016, so that students
without a book level were categorized as pre-reading or not reading. A higher percentage of
kindergarteners who attended ELO SAIL were at a pre-reading level, compared to their peers who
did not attend (Figure 2.1). This difference was statistically significant (χ2(2) = 14.85, p < .001).
Figure 2.1
Percentage of kindergarten students in reading categories from fall AP-PR for 2015–2016
by ELO SAIL participation
Note. N for SAIL = 1,288. N for non-SAIL = 1,211.
*p < .05, **p < .01, ***p < . 001
Analyses of the three reading categories from fall 2015–2016 for kindergarten subgroups revealed
little variation (Table A2). In five of the seven subgroups, there were more pre-readers among
ELO SAIL attendees than non-attendees. Each difference was statistically significant, as follows:
Black or African American students in 2015–2016 (χ2(2) = 14.96, p < .001)
8.2
29.3
62.5
7.2
23.1
69.7
0
10
20
30
40
50
60
70
Reading Pre-reading Not reading
% o
f kin
der
gar
ten s
tud
ents
Reading category in fall 2015–2016***
SAIL
Non-SAIL
Montgomery County Public Schools Office of Shared Accountability
Program Evaluation 11 Impact of ELO SAIL: Fall 2012 to Fall 2015
Hispanic/Latino students in 2015–2016 (χ2(2) = 11.36, p < .01)
ESOL recipients in 2015–2016 (χ2(2) = 23.37, p < .001)
FARMS recipients in 2015–2016 (χ2(2) = 26.98, p < .001)
Special education recipients in 2015–2016 (χ2(2) = 9.73, p < .01)
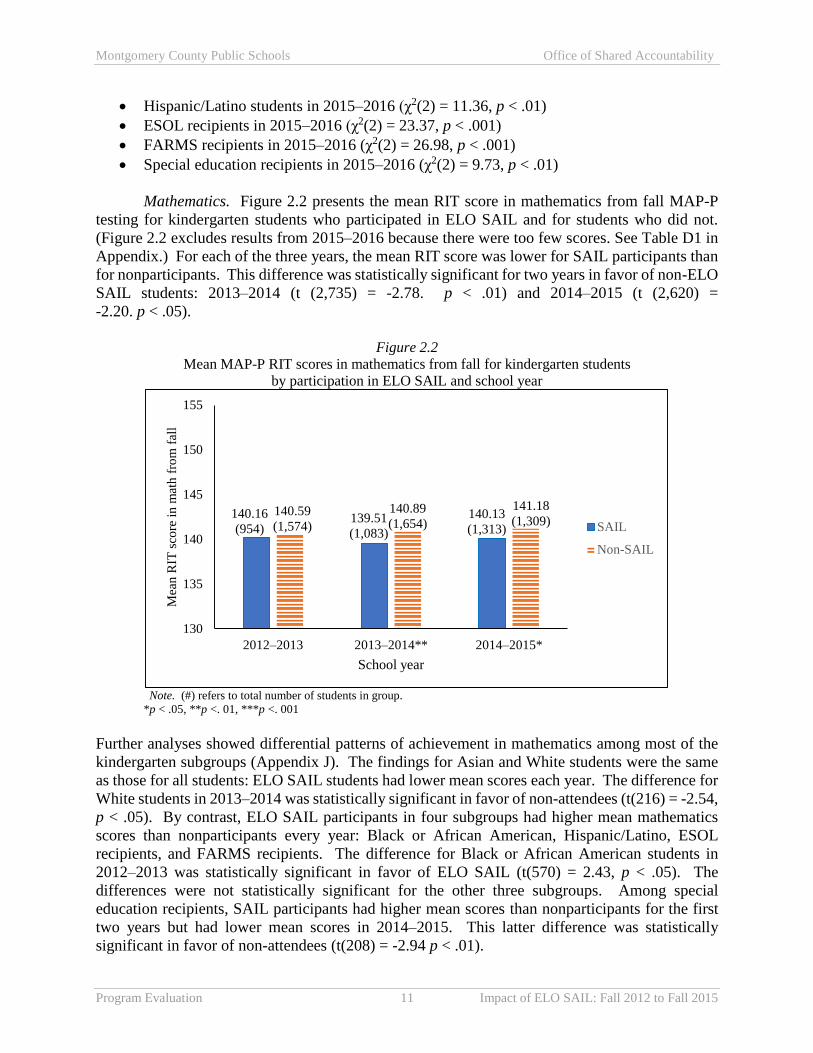
Mathematics. Figure 2.2 presents the mean RIT score in mathematics from fall MAP-P
testing for kindergarten students who participated in ELO SAIL and for students who did not.
(Figure 2.2 excludes results from 2015–2016 because there were too few scores. See Table D1 in
Appendix.) For each of the three years, the mean RIT score was lower for SAIL participants than
for nonparticipants. This difference was statistically significant for two years in favor of non-ELO
SAIL students: 2013–2014 (t (2,735) = -2.78. p < .01) and 2014–2015 (t (2,620) =
-2.20. p < .05).
Figure 2.2
Mean MAP-P RIT scores in mathematics from fall for kindergarten students
by participation in ELO SAIL and school year
Note. (#) refers to total number of students in group.
*p < .05, **p <. 01, ***p <. 001
Further analyses showed differential patterns of achievement in mathematics among most of the
kindergarten subgroups (Appendix J). The findings for Asian and White students were the same
as those for all students: ELO SAIL students had lower mean scores each year. The difference for
White students in 2013–2014 was statistically significant in favor of non-attendees (t(216) = -2.54,
p < .05). By contrast, ELO SAIL participants in four subgroups had higher mean mathematics
scores than nonparticipants every year: Black or African American, Hispanic/Latino, ESOL
recipients, and FARMS recipients. The difference for Black or African American students in
2012–2013 was statistically significant in favor of ELO SAIL (t(570) = 2.43, p < .05). The
differences were not statistically significant for the other three subgroups. Among special
education recipients, SAIL participants had higher mean scores than nonparticipants for the first
two years but had lower mean scores in 2014–2015. This latter difference was statistically
significant in favor of non-attendees (t(208) = -2.94 p < .01).
140.16
(954)139.51
(1,083)
140.13
(1,313)
140.59
(1,574)
140.89
(1,654)
141.18
(1,309)
130
135
140
145
150
155
2012–2013 2013–2014** 2014–2015*
Mea
n R
IT s
core
in m
ath f
rom
fal
l
School year
SAIL
Non-SAIL
Montgomery County Public Schools Office of Shared Accountability
Program Evaluation 12 Impact of ELO SAIL: Fall 2012 to Fall 2015
Grade 1
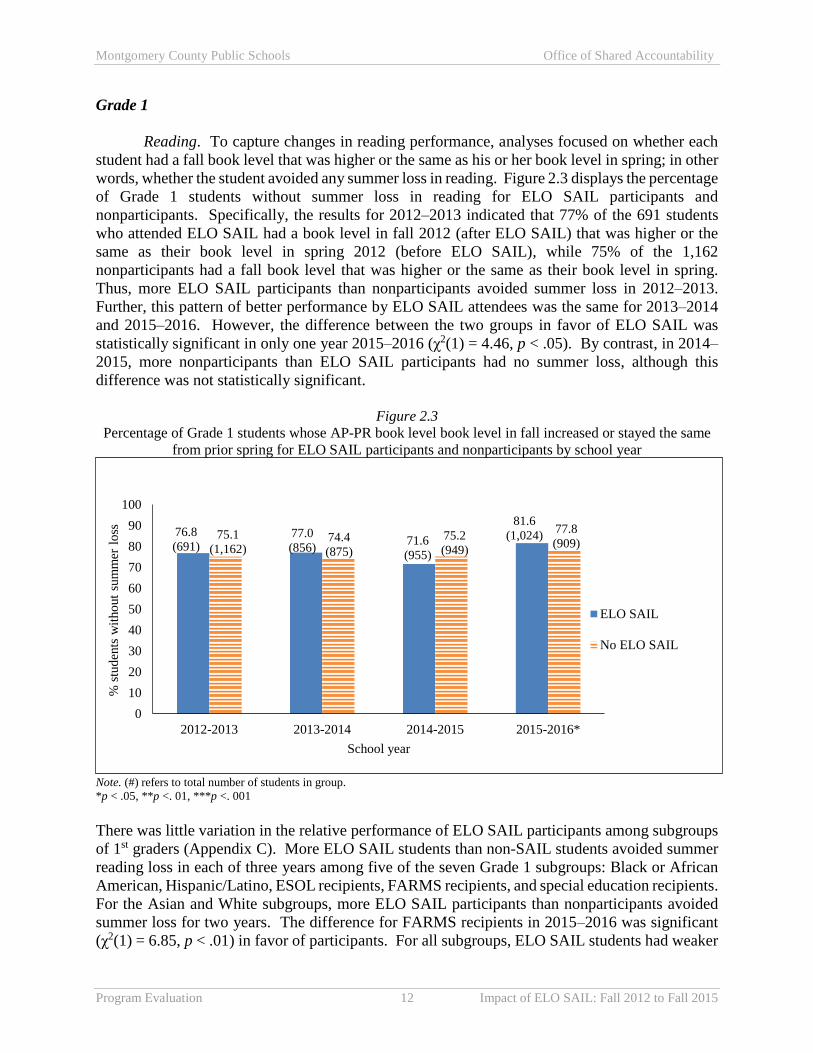
Reading. To capture changes in reading performance, analyses focused on whether each
student had a fall book level that was higher or the same as his or her book level in spring; in other
words, whether the student avoided any summer loss in reading. Figure 2.3 displays the percentage
of Grade 1 students without summer loss in reading for ELO SAIL participants and
nonparticipants. Specifically, the results for 2012–2013 indicated that 77% of the 691 students
who attended ELO SAIL had a book level in fall 2012 (after ELO SAIL) that was higher or the
same as their book level in spring 2012 (before ELO SAIL), while 75% of the 1,162
nonparticipants had a fall book level that was higher or the same as their book level in spring.
Thus, more ELO SAIL participants than nonparticipants avoided summer loss in 2012–2013.
Further, this pattern of better performance by ELO SAIL attendees was the same for 2013–2014
and 2015–2016. However, the difference between the two groups in favor of ELO SAIL was
statistically significant in only one year 2015–2016 (χ2(1) = 4.46, p < .05). By contrast, in 2014–
2015, more nonparticipants than ELO SAIL participants had no summer loss, although this
difference was not statistically significant.
Figure 2.3
Percentage of Grade 1 students whose AP-PR book level book level in fall increased or stayed the same
from prior spring for ELO SAIL participants and nonparticipants by school year
Note. (#) refers to total number of students in group.
*p < .05, **p <. 01, ***p <. 001
There was little variation in the relative performance of ELO SAIL participants among subgroups
of 1st graders (Appendix C). More ELO SAIL students than non-SAIL students avoided summer
reading loss in each of three years among five of the seven Grade 1 subgroups: Black or African
American, Hispanic/Latino, ESOL recipients, FARMS recipients, and special education recipients.
For the Asian and White subgroups, more ELO SAIL participants than nonparticipants avoided
summer loss for two years. The difference for FARMS recipients in 2015–2016 was significant
(χ2(1) = 6.85, p < .01) in favor of participants. For all subgroups, ELO SAIL students had weaker
76.8
(691)77.0
(856)71.6
(955)
81.6
(1,024)75.1
(1,162)74.4
(875)
75.2
(949)
77.8
(909)
0
10
20
30
40
50
60
70
80
90
100
2012-2013 2013-2014 2014-2015 2015-2016*
% s
tud
ents
wit
ho
ut
sum
mer
lo
ss
School year
ELO SAIL
No ELO SAIL
Montgomery County Public Schools Office of Shared Accountability
Program Evaluation 13 Impact of ELO SAIL: Fall 2012 to Fall 2015
performance in 2014–2015, as measured by summer loss in reading. One difference in that year
was statistically significant: for special education recipients (χ2(1) = 4.28, p < .05) in favor of
nonparticipants. No other differences for subgroups of Grade 1 students were statistically
significant.
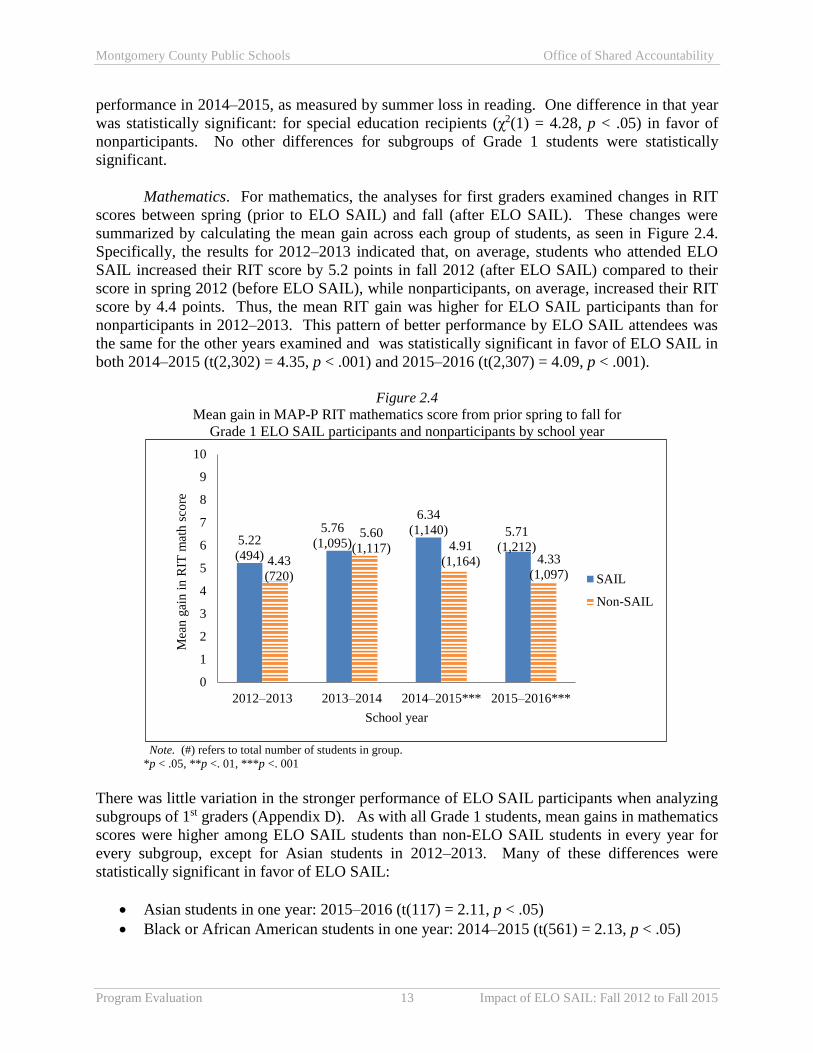
Mathematics. For mathematics, the analyses for first graders examined changes in RIT
scores between spring (prior to ELO SAIL) and fall (after ELO SAIL). These changes were
summarized by calculating the mean gain across each group of students, as seen in Figure 2.4.
Specifically, the results for 2012–2013 indicated that, on average, students who attended ELO
SAIL increased their RIT score by 5.2 points in fall 2012 (after ELO SAIL) compared to their
score in spring 2012 (before ELO SAIL), while nonparticipants, on average, increased their RIT
score by 4.4 points. Thus, the mean RIT gain was higher for ELO SAIL participants than for
nonparticipants in 2012–2013. This pattern of better performance by ELO SAIL attendees was
the same for the other years examined and was statistically significant in favor of ELO SAIL in
both 2014–2015 (t(2,302) = 4.35, p < .001) and 2015–2016 (t(2,307) = 4.09, p < .001).
Figure 2.4
Mean gain in MAP-P RIT mathematics score from prior spring to fall for
Grade 1 ELO SAIL participants and nonparticipants by school year
Note. (#) refers to total number of students in group.
*p < .05, **p <. 01, ***p <. 001
There was little variation in the stronger performance of ELO SAIL participants when analyzing
subgroups of 1st graders (Appendix D). As with all Grade 1 students, mean gains in mathematics
scores were higher among ELO SAIL students than non-ELO SAIL students in every year for
every subgroup, except for Asian students in 2012–2013. Many of these differences were
statistically significant in favor of ELO SAIL:
Asian students in one year: 2015–2016 (t(117) = 2.11, p < .05)
Black or African American students in one year: 2014–2015 (t(561) = 2.13, p < .05)
5.22
(494)
5.76
(1,095)
6.34
(1,140) 5.71
(1,212)4.43
(720)
5.60
(1,117) 4.91
(1,164) 4.33
(1,097)
0
1
2
3
4
5
6
7
8
9
10
2012–2013 2013–2014 2014–2015*** 2015–2016***
Mea
n g
ain
in
RIT
mat
h s
core
School year
SAIL
Non-SAIL

Montgomery County Public Schools Office of Shared Accountability
Program Evaluation 14 Impact of ELO SAIL: Fall 2012 to Fall 2015
Hispanic/Latino students in two years: 2014–2015 (t(1,348) = 3.69, p < .001) and
2015–2016 (t(1,461) =3.71, p < .001).
ESOL recipients in three years: 2013–2014 (t(1,193) = 2.02, p < .05), 2014–2015 (t(1,204)
= 4.05, p < .001), and 2015–2016 (t(1,204) = 3.03, p < .01)
FARMS recipients in two years: 2014–2015 (t(1,770) = 4.53, p < .001) and 2015–2016
(t(1,821) =3.91, p < .001)
Special education recipients in two years: 2014–2015 (t(192) = 2.02, p < .05) and
2015–2016 (t(180) =2.16, p < .05).
Grade 2
For Grade 2, the analyses concerned changes in performance in the fall after each ELO session,
compared to performance in the spring prior to that ELO session, as was done with Grade 1.
Reading. Figure 2.5 displays the percentage of Grade 2 students without summer loss in
reading by participation in ELO SAIL. Specifically, the results for 2012–2013 indicated that 65%
of 2nd graders who attended ELO SAIL had a book level in fall 2012 (after ELO SAIL) that was
higher or the same as their book level in spring 2012 (before ELO SAIL), while 61% of
nonparticipants had a fall book level that was higher or the same as their book level in spring.
Thus, more ELO SAIL participants had no summer loss in 2012–2013 compared to
nonparticipants. This pattern of higher performance by ELO SAIL attendees was the same for
2013–2014 and 2015–2016, but in 2014–2015, slightly more nonparticipants than ELO SAIL
participants had no summer loss. However, none of the differences was statistically significant.
Figure 2.5
Percentage of Grade 2 students whose AP-PR book level in fall increased or stayed the same
from prior spring for ELO SAIL participants and nonparticipants by school year
Note. (#) refers to total number of students in group.
*p < .05, **p <. 01, ***p <. 001
65.0
(683)62.5
(883)
65.1
(1,037)
75.3
(1,045)
61.0
(1,215)59.9
(1,077)
65.6
(1,241)
73.3
(1,213)
0
10
20
30
40
50
60
70
80
90
100
2012–2013 2013–2014 2014–2015 2015–2016
% s
tud
ents
wit
ho
ut
sum
mer
lo
ss
School year
SAIL
Non-SAIL
Montgomery County Public Schools Office of Shared Accountability
Program Evaluation 15 Impact of ELO SAIL: Fall 2012 to Fall 2015
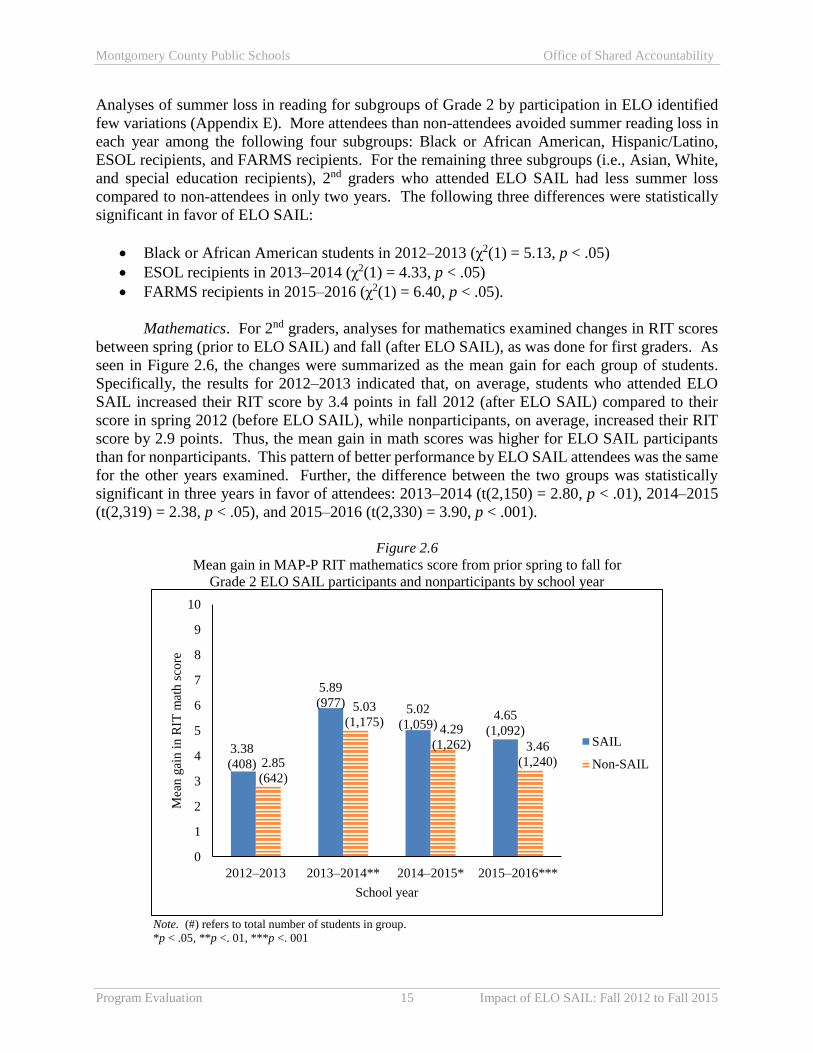
Analyses of summer loss in reading for subgroups of Grade 2 by participation in ELO identified
few variations (Appendix E). More attendees than non-attendees avoided summer reading loss in
each year among the following four subgroups: Black or African American, Hispanic/Latino,
ESOL recipients, and FARMS recipients. For the remaining three subgroups (i.e., Asian, White,
and special education recipients), 2nd graders who attended ELO SAIL had less summer loss
compared to non-attendees in only two years. The following three differences were statistically
significant in favor of ELO SAIL:
Black or African American students in 2012–2013 (χ2(1) = 5.13, p < .05)
ESOL recipients in 2013–2014 (χ2(1) = 4.33, p < .05)
FARMS recipients in 2015–2016 (χ2(1) = 6.40, p < .05).
Mathematics. For 2nd graders, analyses for mathematics examined changes in RIT scores
between spring (prior to ELO SAIL) and fall (after ELO SAIL), as was done for first graders. As
seen in Figure 2.6, the changes were summarized as the mean gain for each group of students.
Specifically, the results for 2012–2013 indicated that, on average, students who attended ELO
SAIL increased their RIT score by 3.4 points in fall 2012 (after ELO SAIL) compared to their
score in spring 2012 (before ELO SAIL), while nonparticipants, on average, increased their RIT
score by 2.9 points. Thus, the mean gain in math scores was higher for ELO SAIL participants
than for nonparticipants. This pattern of better performance by ELO SAIL attendees was the same
for the other years examined. Further, the difference between the two groups was statistically
significant in three years in favor of attendees: 2013–2014 (t(2,150) = 2.80, p < .01), 2014–2015
(t(2,319) = 2.38, p < .05), and 2015–2016 (t(2,330) = 3.90, p < .001).
Figure 2.6
Mean gain in MAP-P RIT mathematics score from prior spring to fall for
Grade 2 ELO SAIL participants and nonparticipants by school year
Note. (#) refers to total number of students in group.
*p < .05, **p <. 01, ***p <. 001
3.38
(408)
5.89
(977)5.02
(1,059)4.65
(1,092)
2.85
(642)
5.03
(1,175)4.29
(1,262) 3.46
(1,240)
0
1
2
3
4
5
6
7
8
9
10
2012–2013 2013–2014** 2014–2015* 2015–2016***
Mea
n g
ain i
n R
IT m
ath s
core
School year
SAIL
Non-SAIL

Montgomery County Public Schools Office of Shared Accountability
Program Evaluation 16 Impact of ELO SAIL: Fall 2012 to Fall 2015
There was little variation in the relative performance of ELO SAIL participants when analyzing
subgroups of second graders (Appendix F). As with all Grade 2 students, SAIL attendees had
higher gains than non-attendees every year for four of the seven subgroups: Black or African
American, Hispanic/Latino, ESOL recipients, and FARMS recipients. Most of these differences
were statistically significant in favor of ELO SAIL:
Black or African American students in 2015–2016 (t(610) = 2.66, p < .01)
Hispanic/Latino students in two years: 2014–2015 (t(1450) = 2.56, p < .05) and 2015–2016
(t(1,355) = 3.01, p < .01)
ESOL recipients in three years: 2013–2014 (t(1,123) = 2.14, p < .05), 2014–2015 (t(1,166)
=2.09, p < .05), and 2015–2016 (t(1,158) = 3.18, p < .001)
FARMS recipients in three years: 2013–2014 (t(1,690) = 2.99, p < .01), 2014–2015
(t(1,785) =1.97, p < .05) , and 2015–2016 (t(1,836) = 3.84, p < .001).
Among special education recipients, ELO SAIL participants had a greater mean gain in
mathematics score during three school years. Among White students, ELO SAIL participants had
higher performance only during the first two years analyzed; the difference for 2013–2014 was
statistically significant in favor of ELO SAIL (t(148) = 2.97, p < .05). There was no consistent
pattern of differences for Asian students.
Summary for Question 2
Kindergarten. Among all kindergarten students, the only significant difference in fall AP-
PR reading results was in one of the four years, when more ELO SAIL attendees were at a pre-
reading level (i.e., have mastered foundational reading skills) compared to their peers who did not
attend. The impact on fall reading results was positive for kindergarten subgroups. In six of the
seven subgroups (all except for White students), there were statistically significant differences for
at least one year in favor of stronger reading performance by ELO SAIL attendees.
Among all kindergarteners, the mean RIT score in mathematics from the fall MAP-P test was
significantly lower for ELO SAIL participants than for nonparticipants in two of the three years
examined. However, among subgroups of kindergarteners, the math performance in the fall of
students who attended ELO SAIL did not differ from non-attendees, with very few exceptions.
Grades 1 and 2. The analyses for Grade 1 and Grade 2 students concerned changes in
performance in the fall after each ELO SAIL session, compared to performance in the spring prior
to that ELO SAIL session; four years were examined. The reading measures concerned whether
students increased or stayed at the same AP-PR book level. Among all first graders, there was a
significant difference in reading for only one year; ELO SAIL participants experienced less
summer loss in reading compared with their peers who did not attend. Among all second graders,
there were no differences between ELO SAIL attendees and non-attendees in summer reading loss
for any year. There was little variation in summer reading loss by subgroups of first or second
graders; ELO SAIL attendees did not differ significantly from non-attendees, with very few
exceptions.
Montgomery County Public Schools Office of Shared Accountability
Program Evaluation 17 Impact of ELO SAIL: Fall 2012 to Fall 2015
The mathematics measures for Grades 1 and 2 concerned gains in RIT scores in mathematics from
MAP-P. For all Grade 1 students, the mean gains of ELO SAIL attendees were significantly higher
than those of non-attendees in two of the four years. The positive impact of ELO SAIL for two
years also was evident in subgroups of first graders. Differences in math gains were statistically
significant in favor of ELO SAIL for at least two years among five of the seven subgroups: Black
or African American, Hispanic/Latino, ESOL recipients, FARMS recipients, and special education
recipients.
Among all second graders, the mean gains in math scores were significantly higher for ELO SAIL
participants than for nonparticipants in three years. There was some variation among subgroups.
Differences between attendees and non-attendees in Grade 2 were statistically significant in favor
of ELO SAIL in three years for two subgroups, ESOL recipients and FARMS recipients, but in
only one or two years for three subgroups: Black or African American, Hispanic/Latino, and White
students.
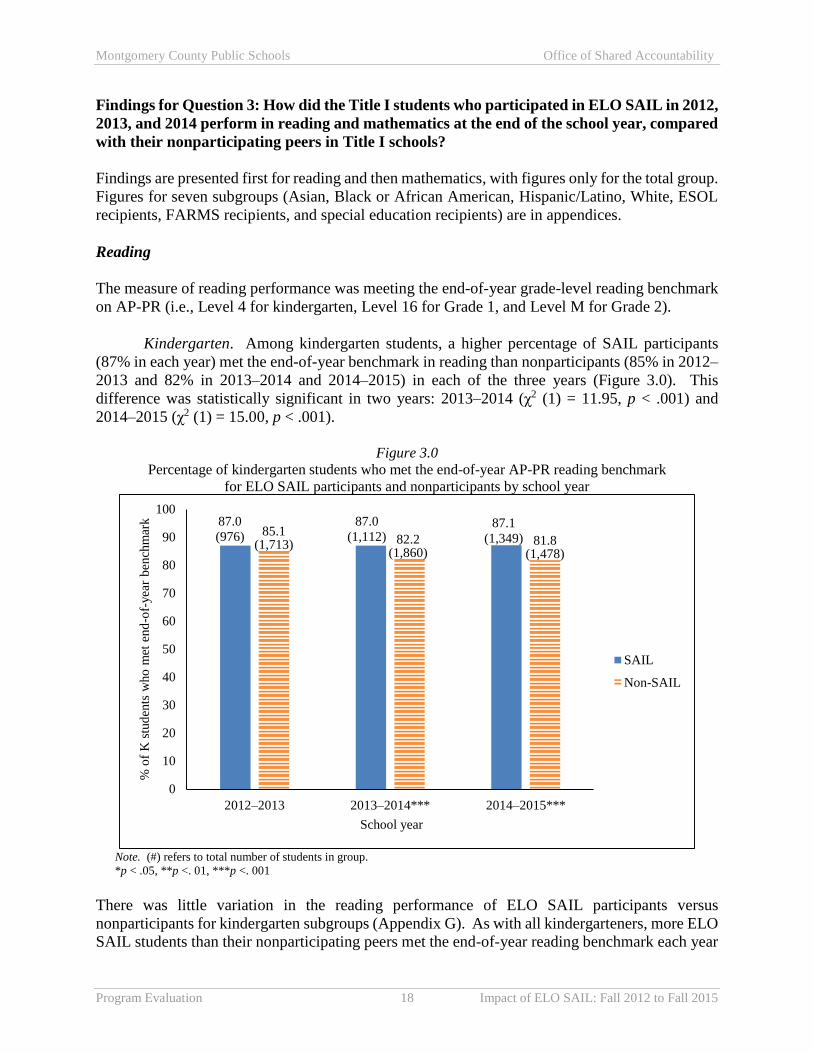
Montgomery County Public Schools Office of Shared Accountability
Program Evaluation 18 Impact of ELO SAIL: Fall 2012 to Fall 2015
Findings for Question 3: How did the Title I students who participated in ELO SAIL in 2012,
2013, and 2014 perform in reading and mathematics at the end of the school year, compared
with their nonparticipating peers in Title I schools?
Findings are presented first for reading and then mathematics, with figures only for the total group.
Figures for seven subgroups (Asian, Black or African American, Hispanic/Latino, White, ESOL
recipients, FARMS recipients, and special education recipients) are in appendices.
Reading
The measure of reading performance was meeting the end-of-year grade-level reading benchmark
on AP-PR (i.e., Level 4 for kindergarten, Level 16 for Grade 1, and Level M for Grade 2).
Kindergarten. Among kindergarten students, a higher percentage of SAIL participants
(87% in each year) met the end-of-year benchmark in reading than nonparticipants (85% in 2012–
2013 and 82% in 2013–2014 and 2014–2015) in each of the three years (Figure 3.0). This
difference was statistically significant in two years: 2013–2014 (χ2 (1) = 11.95, p < .001) and
2014–2015 (χ2 (1) = 15.00, p < .001).
Figure 3.0
Percentage of kindergarten students who met the end-of-year AP-PR reading benchmark
for ELO SAIL participants and nonparticipants by school year
Note. (#) refers to total number of students in group.
*p < .05, **p <. 01, ***p <. 001
There was little variation in the reading performance of ELO SAIL participants versus
nonparticipants for kindergarten subgroups (Appendix G). As with all kindergarteners, more ELO
SAIL students than their nonparticipating peers met the end-of-year reading benchmark each year
87.0
(976)
87.0
(1,112)87.1
(1,349)85.1
(1,713) 82.2(1,860)
81.8(1,478)
0
10
20
30
40
50
60
70
80
90
100
2012–2013 2013–2014*** 2014–2015***
% o
f K
stu
den
ts w
ho
met
end
-of-
yea
r b
ench
mar
k
School year
SAIL
Non-SAIL

Montgomery County Public Schools Office of Shared Accountability
Program Evaluation 19 Impact of ELO SAIL: Fall 2012 to Fall 2015
among five subgroups: Black or African American, Hispanic/Latino, ESOL recipients, FARMS
recipients, and special education recipients. Also, more Asian students who attended the summer
program met the reading benchmark than non-attendees for two of the three years. Most of these
differences in favor of ELO SAIL were statistically significant:
Black or African American students in all three years: 2012–2013 (χ2(1) = 4.74, p < .05);
2013–2014 (χ2(1) = 5.05, p < .05); and 2014–2015 (χ2(1) = 14.44, p < .001).
Hispanic/Latino students in two years: 2013–2014 (χ2(1) = 11.63, p < .001) and 2014–2015
(χ2(1) = 8.92, p < .01).
ESOL recipients in two years: 2013–2014 (χ2(1) = 13.29, p < .001) and 2014–2015 (χ2(1)
= 17.20, p < .001).
FARMS recipients in two years: 2013–2014 (χ2(1) = 12.25, p < .001) and 2014–2015 (χ2(1)
= 21.95, p < .001).
Special education recipients in two years: 2013–2014 (χ2(1) = 8.91, p < .01) and 2014–
2015 (χ2(1) = 12.50, p < .001).
The only variation involved White kindergarteners; among this subgroup, better performance in
reading by ELO SAIL students occurred for only one year.
Grade 1. Grade 1 ELO SAIL participants performed slightly lower than their
nonparticipating counterparts in each year analyzed, as measured by meeting the end-of-year
reading benchmark (Figure 3.1). None of these differences were statistically significant.
Figure 3.1
Percentage of Grade 1 students who met the end-of-year AP-PR reading benchmark
for ELO SAIL participants and nonparticipants by school year
Note. (#) refers to total number of students in group.
*p < .05, **p <. 01, ***p <. 001
73.3
(900) 69.9
(1,138)69.4
(1,231)
73.5
(1,685)71.3
(1,827)
71.6
(1,540)
0
10
20
30
40
50
60
70
80
90
100
2012–2013 2013–2014 2014–2015
% o
f st
ud
ents
who
met
end
-of-
yea
r b
ench
mar
k
School year
SAIL
Non-SAIL

Montgomery County Public Schools Office of Shared Accountability
Program Evaluation 20 Impact of ELO SAIL: Fall 2012 to Fall 2015
Further analyses showed differential patterns of achievement among Grade 1 subgroups (Appendix
H). Among five subgroups (Asian, Black or African American, plus students receiving ESOL,
FARMS, or special education), more ELO participants than nonparticipants reached the end of the
year reading benchmark in two years, usually 2013–2014 and 2015–2016. However, among White
students, SAIL participants performed slightly lower than their nonparticipant counterparts in each
year analyzed; there was no consistent pattern among Hispanic/Latino students. Across all these
comparisons, two were significant, both in favor of ELO SAIL participants receiving special
education services in 2012–2013 (χ2 (1) = 7.73, p < .01) and in 2013–2014 (χ2 (1) = 4.25,
p < .05).
Grade 2. Overall, Grade 2 ELO SAIL participants performed slightly lower in 2012–2013
than their non- ELO SAIL peers in meeting the end-of-year reading benchmark, but outperformed
nonparticipants in 2013–2014 and 2014–2015 (Figure 3.2). None of these differences were
statistically significant.
Figure 3.2
Percentage of Grade 2 students who met the end-of-year AP-PR reading benchmark
for ELO SAIL participants and nonparticipants by school year
Note. (#) refers to total number of students in group.
*p < .05, **p <. 01, ***p <. 001
The reading performance of ELO SAIL participants versus nonparticipants varied across Grade 2
subgroups in 2012–2013 but showed little variation in the other two years studied (Appendix I).
In 2012–2013, among four subgroups (i.e., Asian, Hispanic/Latino, ESOL recipients, FARMS
recipients), more ELO SAIL participants than nonparticipants met the end-of-year reading
benchmark, while in two other subgroups (i.e., Black or African American, students receiving
special education services), fewer participants met the benchmark. In both 2013–2014 and 2014–
2015, more ELO SAIL attendees met the reading benchmark, compared to non-attendees, in five
66.6
(755)65.6
(1,022)64.7
(1,142)
67.6
(1,504) 63.8
(1,821)
63.8
(1,626)
0
10
20
30
40
50
60
70
80
90
100
2012–2013 2013–2014 2014–2015
% o
f st
ud
ents
who
met
end
-of-
yea
r b
ench
mar
k
School year
SAIL
Non-SAIL
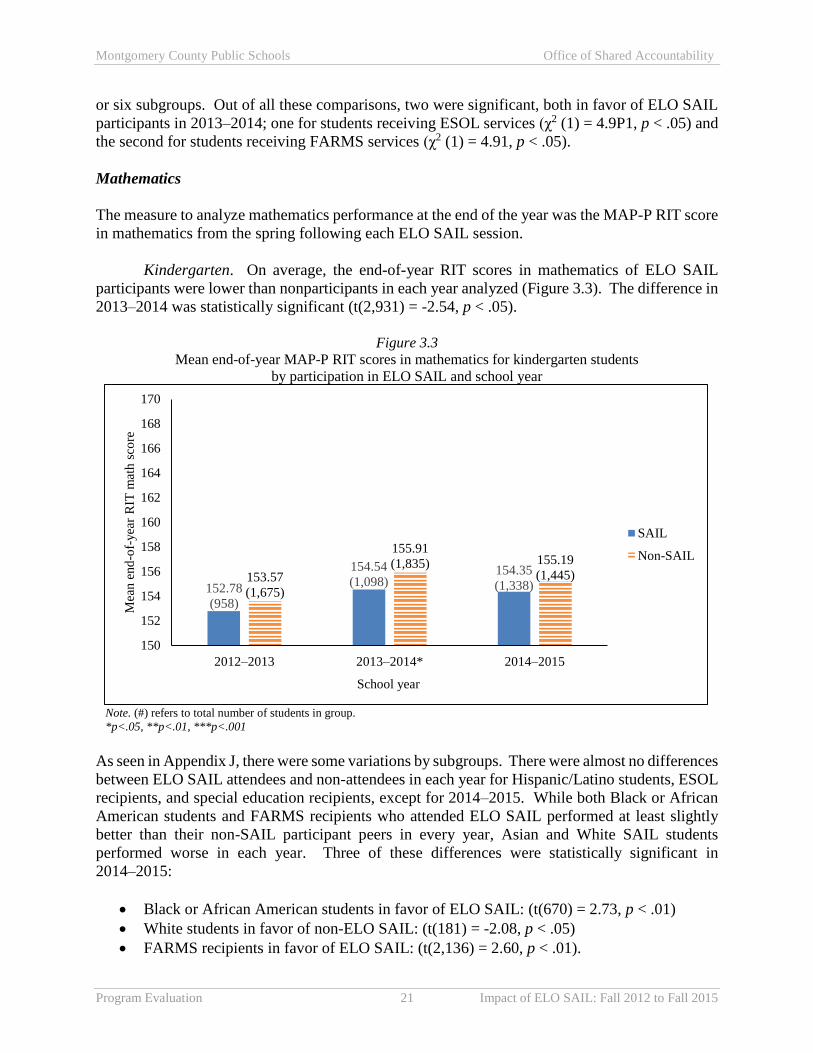
Montgomery County Public Schools Office of Shared Accountability
Program Evaluation 21 Impact of ELO SAIL: Fall 2012 to Fall 2015
or six subgroups. Out of all these comparisons, two were significant, both in favor of ELO SAIL
participants in 2013–2014; one for students receiving ESOL services (χ2 (1) = 4.9P1, p < .05) and
the second for students receiving FARMS services (χ2 (1) = 4.91, p < .05).
Mathematics
The measure to analyze mathematics performance at the end of the year was the MAP-P RIT score
in mathematics from the spring following each ELO SAIL session.
Kindergarten. On average, the end-of-year RIT scores in mathematics of ELO SAIL
participants were lower than nonparticipants in each year analyzed (Figure 3.3). The difference in
2013–2014 was statistically significant (t(2,931) = -2.54, p < .05).
Figure 3.3
Mean end-of-year MAP-P RIT scores in mathematics for kindergarten students
by participation in ELO SAIL and school year
Note. (#) refers to total number of students in group.
*p<.05, **p<.01, ***p<.001
As seen in Appendix J, there were some variations by subgroups. There were almost no differences
between ELO SAIL attendees and non-attendees in each year for Hispanic/Latino students, ESOL
recipients, and special education recipients, except for 2014–2015. While both Black or African
American students and FARMS recipients who attended ELO SAIL performed at least slightly
better than their non-SAIL participant peers in every year, Asian and White SAIL students
performed worse in each year. Three of these differences were statistically significant in
2014–2015:
Black or African American students in favor of ELO SAIL: (t(670) = 2.73, p < .01)
White students in favor of non-ELO SAIL: (t(181) = -2.08, p < .05)
FARMS recipients in favor of ELO SAIL: (t(2,136) = 2.60, p < .01).
152.78
(958)
154.54
(1,098)154.35
(1,338)153.57
(1,675)
155.91
(1,835) 155.19
(1,445)
150
152
154
156
158
160
162
164
166
168
170
2012–2013 2013–2014* 2014–2015
Mea
n e
nd
-of-
yea
r R
IT m
ath s
core
School year
SAIL
Non-SAIL

Montgomery County Public Schools Office of Shared Accountability
Program Evaluation 22 Impact of ELO SAIL: Fall 2012 to Fall 2015
Grade 1. On average, the end-of-year RIT scores in mathematics of ELO SAIL first graders
were lower than non-participating first graders in each year analyzed (Figure 3.4). The difference
was statistically significant, in favor of non-SAIL students, in each year: 2012–2013 (t(2,535) =
-3.01, p < .01), 2013–2014 (t(2,925) = -4.80, p < .001), and 2014–2015 (t(2,757) = -4.06, p < .01).
Figure 3.4
Mean end-of-year MAP-P RIT scores in mathematics for Grade 1 students
by participation in ELO SAIL and school year
Note. (#) refers to total number of students in group.
*p<.05, **p<.01, ***p<.001
The lower performance by ELO SAIL participants compared to nonparticipants differed for some
Grade 1 subgroups in 2012–2013, but not in the other two years (Appendix K). In 2012–2013,
some subgroups of ELO SAIL students had higher, mean end-of-year scores in mathematics, than
non-ELO students, while there was almost no difference for other subgroups, and both Black or
African American and White participants had lower mean scores. In each year, the mean scores
of White students who attended ELO SAIL were lower than non-attendees; these differences were
statistically significant in favor of nonparticipants in two years: 2012–2013 (t(188) = -4.11,
p < .001) and in 2013–2014 (t(186) = -2.58, p < .05). In both 2013–2014 and 2013–2014, there
was little variation across subgroups; ELO SAIL participants in six of the seven subgroups had
lower performance than nonparticipants. In 2013–2014, two differences (in addition to that for
White students) were statistically significant in favor of non-ELO SAIL attendees: students
receiving ESOL services (t(1,815) = -2.01, p < .05) and students receiving FARMS (t(2,219) =
-2.19, p < .05).
171.78
(886)
172.63
(1,127)
173.65
(1,229)173.49
(1,651)
175.13
(1,800)
175.94
(1,530)
150
155
160
165
170
175
180
2012–2013** 2013–2014*** 2014–2015***
Mea
n e
nd
-of-
yea
r R
IT m
ath s
core
School year
SAIL
Non-SAIL

Montgomery County Public Schools Office of Shared Accountability
Program Evaluation 23 Impact of ELO SAIL: Fall 2012 to Fall 2015
Grade 2. As with the findings for Grade 1, ELO SAIL participants in Grade 2 performed lower
than their nonparticipant peers, as measured by mean RIT scores in mathematics, for each year
analyzed (Figure 3.5). The difference was statistically significant, in favor of non-SAIL students,
in each year: 2012–2013 (t(2,217) =-4.09, p < .001), 2013–2014 (t(2,808) = -2.76, p < .01), and
2014–2015 (t(2,749) = -3.45, p < .001).
Figure 3.5
Mean end-of-year MAP-P RIT scores in mathematics for Grade 2 students
by participation in ELO SAIL and school year
Note. (#) refers to total number of students in group.
*p<.05, **p<.01, ***p<.001
Appendix L presents figures with mean, end-of-year math scores for each subgroup of Grade 2
students. As with all second graders, ELO SAIL participants in every subgroup had lower
performance compared to nonparticipants in 2012–2013. For that year, the difference for students
receiving special education services was statistically significant (t(213) = -2.25, p < .05), in favor
of non-ELO SAIL participants. In the other two years, some ELO SAIL subgroups had better
performance than their non-ELO SAIL peers, including Black or African American students; the
difference in 2014–2015 for this subgroup was statistically significant, in favor of ELO SAIL
(t(666) = 2.02, p < .05). By contrast, for two subgroups, Hispanic/Latino and White, ELO SAIL
participants had lower mean end-of-year math scores than nonparticipants in both 2013–2014 and
2014–2015, as well as 2012–2013. The difference for White students was statistically significant
in 2014–2015 (t(164) = -3.63, p < .001), in favor of nonparticipants.
186.07
(747)
189.86
(1,019)
190.21
(1,140)188.64
(1,472)
191.43
(1,791)
192.33
(1,611)
150
155
160
165
170
175
180
185
190
195
200
2012–2013*** 2013–2014** 2014–2015***
Mea
n e
nd-o
f-yea
r R
IT m
ath s
core
School year
SAIL
Non-SAIL
Montgomery County Public Schools Office of Shared Accountability
Program Evaluation 24 Impact of ELO SAIL: Fall 2012 to Fall 2015
Summary for Question 3
Reading. With respect to reading performance at the end of the year, the only statistically
significant differences for all students involved kindergarteners; more kindergarteners who
attended ELO SAIL met the end-of-the-year AP-PR reading benchmark than non-attendees, in two
of the three years analyzed. First and second graders who participated in ELO SAIL performed as
well in meeting the end-of-the-year reading benchmark as their peers in Title I schools who did
not attend.
The impact of ELO SAIL on end-of-year reading performance varied little across student
subgroups. As among all kindergarteners, there were significant differences for two of the three
years in favor of ELO SAIL among five of the seven subgroups: Black or African American,
Hispanic/Latino, ESOL recipients, FARMS recipients, and recipients of special education
services. For first graders and second graders, as with all students, attendees and non-attendees
did not differ among most subgroups. However, there were a few variations (i.e., in favor of ELO
SAIL attendees) that were statistically significant: in two years for first graders receiving special
education services, in one year for second graders receiving ESOL services, and in one year for
second graders receiving FARMS services.
Mathematics. In analyses of all students, participants in ELO SAIL had lower scores on
the MAP-P mathematics test at the end of the following year, on average, than their
nonparticipating peers for each grade level in each of the three years examined. These differences
in mean RIT scores in mathematics were statistically significant in favor of non-attendees in each
year for Grades 1 and 2 but in only one year for kindergarten students.
In contrast, among most subgroups, ELO SAIL attendees and non-attendees did not differ on end-
of-the-year mathematics performance. However, there were a few statistically significant
differences for one year in favor of non-attendees among subgroups of first and second graders as
follows: first graders receiving ESOL services, first graders receiving FARMS, second graders
receiving special education services, and White second graders. Also, among White first graders,
there were significant differences in favor of non-attendees for two years. There were even fewer
significant differences that were in favor of ELO SAIL attendees; each was for only one year and
included three subgroups of kindergarteners (Black or African American, White, and FARMS
recipients) and one subgroup of second graders (Black or African American).

Montgomery County Public Schools Office of Shared Accountability
Program Evaluation 25 Impact of ELO SAIL: Fall 2012 to Fall 2015
Conclusion
In conclusion, the positive impact of ELO SAIL was stronger on academic performance in the fall
than on performance at the end of the year, based on statistically significant differences between
attendees and non-attendees. Consistent with previous evaluations of ELO SAIL, the benefits
varied by content area, with more positive findings in mathematics than in reading, and varied by
grade level, such that positive findings in reading mainly were for kindergarteners, while positive
findings in mathematics were limited mainly to first and second graders. However, in this study,
unlike previous ones, a benefit for an entire grade level usually was evident for the majority of
subgroups. Further, the following subgroups had more significant differences than other
subgroups: African American or Black students, students receiving ESOL services, and students
receiving FARMS services.
Across four years of analysis, there was a positive impact on reading in the fall for kindergarten in
one year, including all kindergarteners and the majority of subgroups, and for Grade 1 in one year,
for all first graders, but not for subgroups. Because the positive impact for kindergarteners was in
the only year with more detailed data on non-readers, the lack of positive findings in earlier years
may reflect a lack of more detailed data. The only positive impact on end-of-the-year reading was
for kindergarten in two of the three years studied; the stronger performance was apparent for all
kindergarteners and the majority of subgroups. There were no significant differences in end-of-
the year reading performance between ELO SAIL attendees and non-attendees in Grades 1 and 2.
Out of four years analyzed, the positive impact of ELO SAIL on mathematics performance in the
fall was evident for two or three years, for both Grades 1 and 2, among all students and the majority
of subgroups in both grade levels. However, this benefit did not carry through to the spring; ELO
SAIL participants had lower end-of-the-year mathematics scores than nonparticipants in three
years for both first and second graders. These differences were evident for all students in each
grade level, but not for most subgroups. For kindergarten students, there was no evidence for a
positive impact of ELO SAIL on mathematics performance in the three years studied; attendees
had lower scores than non-attendees in the fall for two years and at the end of the year for one
year, although these differences were evident only for all kindergarteners, not for subgroups.
Montgomery County Public Schools Office of Shared Accountability
Program Evaluation 26 Impact of ELO SAIL: Fall 2012 to Fall 2015
References
Maryland State Department of Education. (2015). General definition of a highly qualified teacher.
Retrieved on September 10, 2015 from http://www.marylandpublicschools.org/msde/
programs/esea/docs/TQ_Regulations/general_definition.htm.
Montgomery County Public Schools. (2013). Building our future together: Strategic planning
framework. Rockville, MD: Montgomery County Public Schools.
Montgomery County Public Schools. (2015). Extended Learning Opportunities Summer
Adventures in Learning 2015. Retrieved July 29, 2015 from
http://www.montgomeryschoolsmd.org/departments/titleone/includes/elo.shtm.
Northwest Evaluation Association. (2008). RIT scale norms for use with Measures of Academic
Progress. Lake Oswego, OR: Northwest Evaluation Association.
Northwest Evaluation Association. (2011). Technical manual for Measures of Academic Progress
and Measures of Academic Progress for primary grades. Lake Oswego, OR: Northwest
Evaluation Association.
Sunmonu, K., Curry-Corcoran, D. and Mordica J. (2004). 2003 summer evaluation of the
Extended Learning Opportunities (ELO) program evaluation report. Rockville, MD:
Montgomery County Public Schools.
Sunmonu, K., Larson, J., Horn, Y. V., Cooper-Martin, E. & Nielsen, J. (2002). Evaluation of
Extended Learning Opportunities summer program. Rockville, MD: Montgomery County
Public Schools.
Wang, H. (2009). Evaluation of 2007 Extended Learning Opportunities Summer Adventures in
Learning (ELO SAIL) Program: Implementation and Outcomes. Rockville, MD:
Montgomery County Public Schools.

Montgomery County Public Schools Office of Shared Accountability
Program Evaluation 27 Impact of ELO SAIL: Fall 2012 to Fall 2015
Appendix A
Findings for Question 2 on Fall Performance:
Reading for Subgroups of Kindergarten Students
Table A1
Number of Kindergarten Students With AP-PR Reading Data From Fall
by School Year, Participation in ELO SAIL, and Selected Subgroups
Kindergarten 2012–2013 2013–2014 2014–2015 2015–2016
SAIL Non SAIL Non SAIL Non SAIL Non Total 976 1,713 1,112 1,860 1,349 1,478 1,288 1,211 Race/ethnicity Asian 59 117 74 139 64 86 76 84 Black or African American 198 428 253 487 325 358 338 313 Hispanic/Latino 666 954 717 965 897 835 51 97 White 34 164 43 187 39 150 792 671
Receipt of services during school year ESOL 615 879 700 908 845 740 770 562 FARMS 813 1,227 917 1,315 1,124 1,041 1,027 855 Special education 92 136 79 170 122 121 117 99
Note. SAIL = participants in ELO SAIL. Non = nonparticipants in ELO SAIL. American Indian, Pacific Islander, and Two or More Races subgroups excluded due to small sample size.
Figure A1
Percentage of Asian American kindergarten students who were reading, based on AP-PR in fall,
for ELO SAIL participants and nonparticipants by school year
Note. See Table A1 for number of students in each group.
*p <. 05, **p < .01, ***p < .001
11.914.9 15.6 17.115.4
10.814.0
4.8
0
10
20
30
40
50
60
70
80
90
100
2012–2013 2013–2014 2014–2015 2015–2016*
% o
f kin
der
gar
ten s
tud
ents
re
adin
g
School year
SAIL
Non-SAIL

Montgomery County Public Schools Office of Shared Accountability
Program Evaluation 28 Impact of ELO SAIL: Fall 2012 to Fall 2015
Figure A2
Percentage of Black or African American kindergarten students who were reading, based on AP-PR in
fall, for ELO SAIL participants and nonparticipants by school year
Note. See Table A1 for number of students in each group.
*p <. 05, **p < .01, ***p < .001
Figure A3
Percentage of Hispanic/Latino kindergarten students who were reading, based on AP-PR in fall,
for ELO SAIL participants and nonparticipants by school year
Note. See Table A1 for number of students in each group.
*p <. 05, **p < .01, ***p < .001
15.2 16.6 14.8 15.410.7 10.5 10.3 12.1
0
10
20
30
40
50
60
70
80
90
100
2012–2013 2013–2014* 2014–2015 2015–2016
% o
f kin
der
gar
ten s
tud
ents
re
adin
g
School year
SAIL
Non-SAIL
2.9 3.8 3.2 3.81.9 1.7 2.4 3.6
0
10
20
30
40
50
60
70
80
90
100
2012–2013 2013–2014** 2014–2015 2015–2016
% o
f kin
der
gar
ten s
tud
ents
re
adin
g
School year
SAIL
Non-SAIL
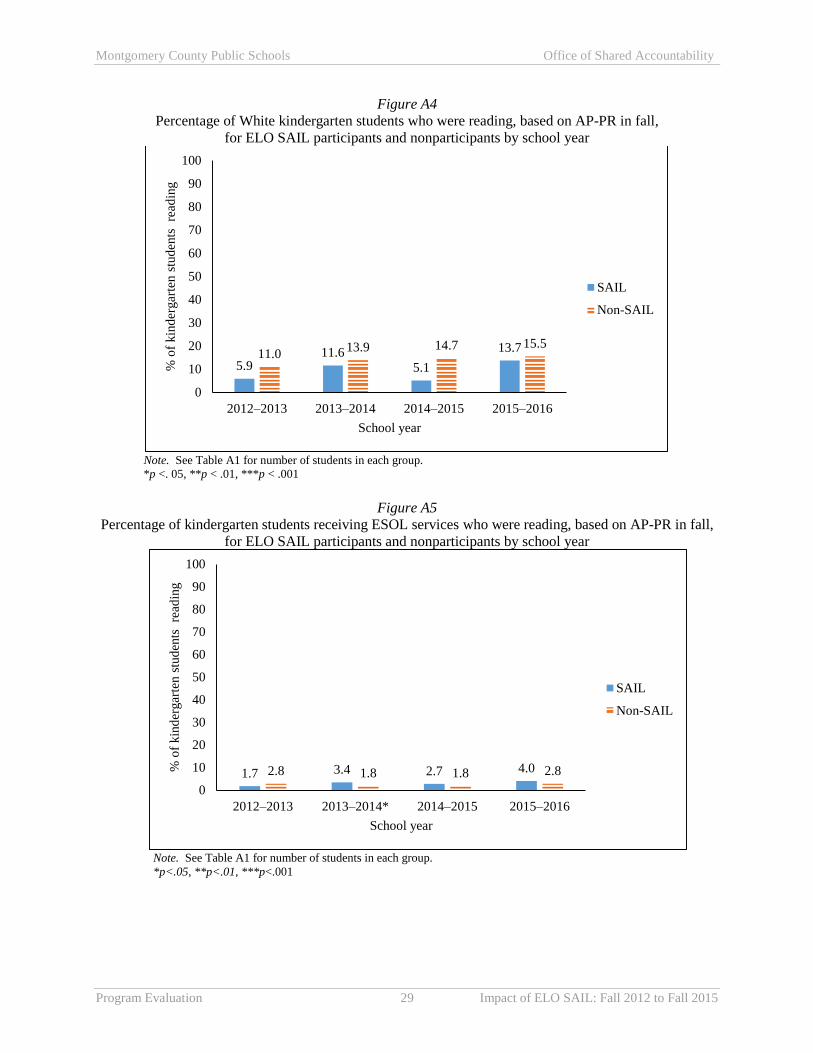
Montgomery County Public Schools Office of Shared Accountability
Program Evaluation 29 Impact of ELO SAIL: Fall 2012 to Fall 2015
Figure A4
Percentage of White kindergarten students who were reading, based on AP-PR in fall,
for ELO SAIL participants and nonparticipants by school year
Note. See Table A1 for number of students in each group.
*p <. 05, **p < .01, ***p < .001
Figure A5
Percentage of kindergarten students receiving ESOL services who were reading, based on AP-PR in fall,
for ELO SAIL participants and nonparticipants by school year
Note. See Table A1 for number of students in each group.
*p<.05, **p<.01, ***p<.001
5.911.6
5.1
13.711.0
13.9 14.7 15.5
0
10
20
30
40
50
60
70
80
90
100
2012–2013 2013–2014 2014–2015 2015–2016
% o
f kin
der
gar
ten s
tud
ents
re
adin
g
School year
SAIL
Non-SAIL
1.7 3.4 2.7 4.02.8 1.8 1.8 2.8
0
10
20
30
40
50
60
70
80
90
100
2012–2013 2013–2014* 2014–2015 2015–2016
% o
f kin
der
gar
ten s
tud
ents
re
adin
g
School year
SAIL
Non-SAIL

Montgomery County Public Schools Office of Shared Accountability
Program Evaluation 30 Impact of ELO SAIL: Fall 2012 to Fall 2015
Figure A6
Percentage of kindergarten students receiving FARMS services who were reading, based on AP-PR in
fall, or ELO SAIL participants and nonparticipants by school year
Note. See Table A1 for number of students in each group.
*p<.05, **p<.01, ***p<.001
Figure A7
Percentage of kindergarten students receiving special education services who were reading,
based on AP-PR in fall, for ELO SAIL participants and nonparticipants by school year
Note. See Table A1 for number of students in each group.
*p <. 05, **p < .01, ***p < .001
4.9 6.2 5.6 6.83.7 4.1 3.7 4.3
0
10
20
30
40
50
60
70
80
90
100
2012–2013 2013–2014* 2014–2015* 2015–2016*
% o
f kin
der
gar
ten s
tud
ents
re
adin
g
School year
SAIL
Non-SAIL
3.36.3 4.9 3.42.9 2.4
8.3 6.1
0
10
20
30
40
50
60
70
80
90
100
2012–2013 2013–2014 2014–2015 2015–2016
% o
f kin
der
gar
ten s
tud
ents
re
adin
g
School year
SAIL
Non-SAIL
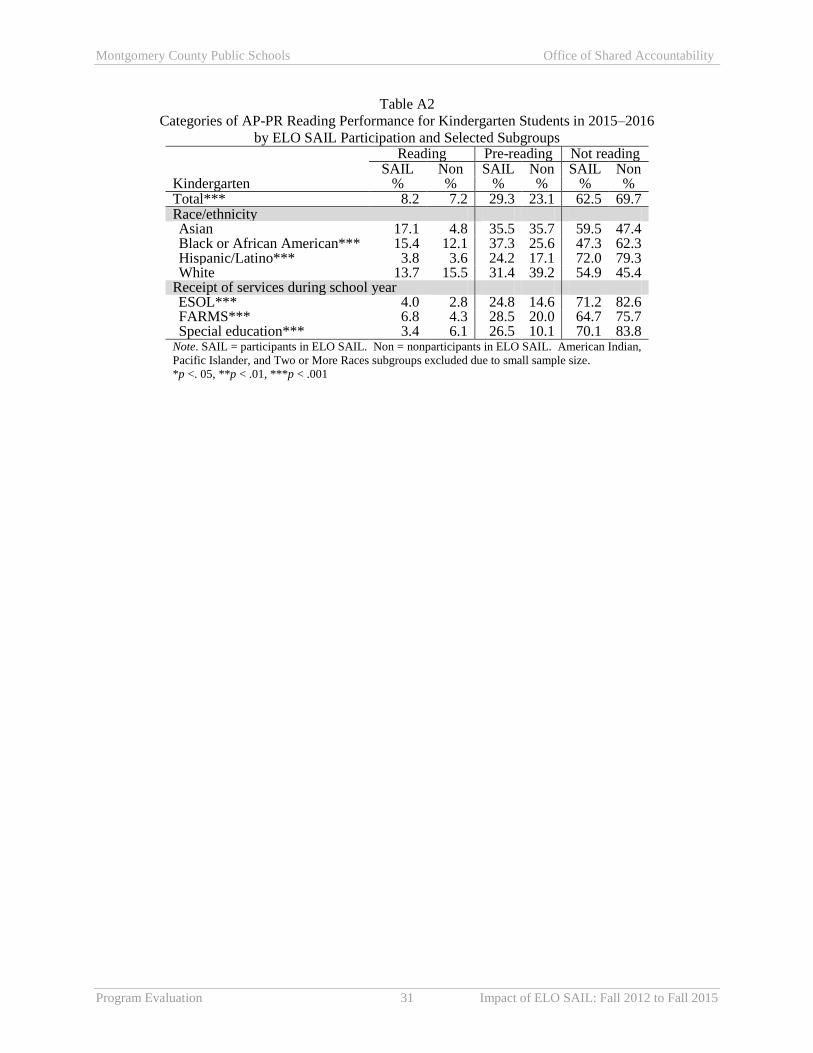
Montgomery County Public Schools Office of Shared Accountability
Program Evaluation 31 Impact of ELO SAIL: Fall 2012 to Fall 2015
Table A2
Categories of AP-PR Reading Performance for Kindergarten Students in 2015–2016
by ELO SAIL Participation and Selected Subgroups
Reading Pre-reading Not reading
SAIL Non SAIL Non SAIL Non Kindergarten % % % % % % Total*** 8.2 7.2 29.3 23.1 62.5 69.7 Race/ethnicity Asian 17.1 4.8 35.5 35.7 59.5 47.4 Black or African American*** 15.4 12.1 37.3 25.6 47.3 62.3 Hispanic/Latino*** 3.8 3.6 24.2 17.1 72.0 79.3 White 13.7 15.5 31.4 39.2 54.9 45.4
Receipt of services during school year ESOL*** 4.0 2.8 24.8 14.6 71.2 82.6 FARMS*** 6.8 4.3 28.5 20.0 64.7 75.7 Special education*** 3.4 6.1 26.5 10.1 70.1 83.8
Note. SAIL = participants in ELO SAIL. Non = nonparticipants in ELO SAIL. American Indian,
Pacific Islander, and Two or More Races subgroups excluded due to small sample size.
*p <. 05, **p < .01, ***p < .001
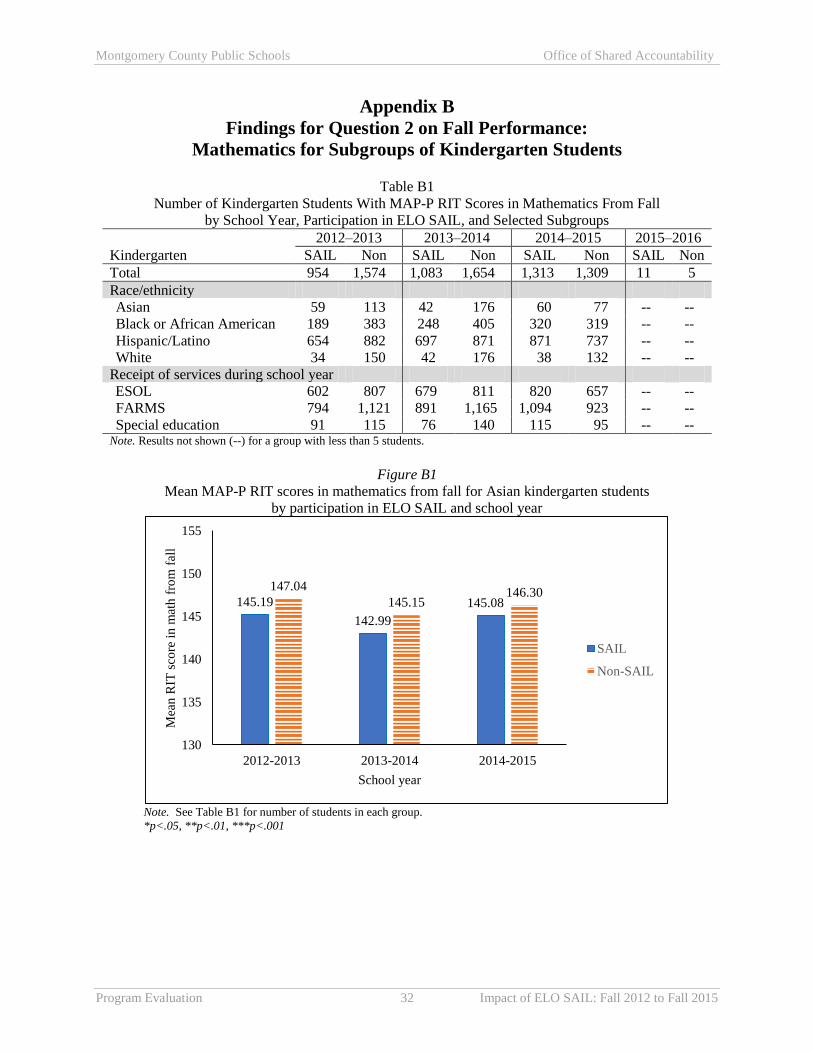
Montgomery County Public Schools Office of Shared Accountability
Program Evaluation 32 Impact of ELO SAIL: Fall 2012 to Fall 2015
Appendix B
Findings for Question 2 on Fall Performance:
Mathematics for Subgroups of Kindergarten Students
Table B1
Number of Kindergarten Students With MAP-P RIT Scores in Mathematics From Fall
by School Year, Participation in ELO SAIL, and Selected Subgroups
Kindergarten
2012–2013 2013–2014 2014–2015 2015–2016
SAIL Non SAIL Non SAIL Non SAIL Non
Total 954 1,574 1,083 1,654 1,313 1,309 11 5
Race/ethnicity
Asian 59 113 42 176 60 77 -- --
Black or African American 189 383 248 405 320 319 -- --
Hispanic/Latino 654 882 697 871 871 737 -- --
White 34 150 42 176 38 132 -- --
Receipt of services during school year
ESOL 602 807 679 811 820 657 -- --
FARMS 794 1,121 891 1,165 1,094 923 -- --
Special education 91 115 76 140 115 95 -- -- Note. Results not shown (--) for a group with less than 5 students.
Figure B1
Mean MAP-P RIT scores in mathematics from fall for Asian kindergarten students
by participation in ELO SAIL and school year
Note. See Table B1 for number of students in each group.
*p<.05, **p<.01, ***p<.001
145.19
142.99
145.08
147.04
145.15146.30
130
135
140
145
150
155
2012-2013 2013-2014 2014-2015
Mea
n R
IT s
core
in m
ath f
rom
fal
l
School year
SAIL
Non-SAIL

Montgomery County Public Schools Office of Shared Accountability
Program Evaluation 33 Impact of ELO SAIL: Fall 2012 to Fall 2015
Figure B2
Mean MAP-P RIT scores in mathematics from fall for Black or African American kindergarten students
by participation in ELO SAIL and school year
Note. See Table B1 for number of students in each group.
*p<.05, **p<.01, ***p<.001
Figure B3
Mean MAP-P RIT scores in mathematics from fall for Hispanic/Latino kindergarten students
by participation in ELO SAIL and school year
Note. See Table B1 for number of students in each group.
*p<.05, **p<.01, ***p<.001
144.07
142.28
144.83
141.86 142.15143.15
130
135
140
145
150
155
2012-2013* 2013-2014 2014-2015
Mea
n R
IT s
core
in m
ath f
rom
fal
l
School year
SAIL
Non-SAIL
138.03 137.50 137.66137.72136.92 137.45
130
135
140
145
150
155
2012-2013 2013-2014 2014-2015
Mea
n R
IT s
core
in m
ath f
rom
fal
l
School year
SAIL
Non-SAIL
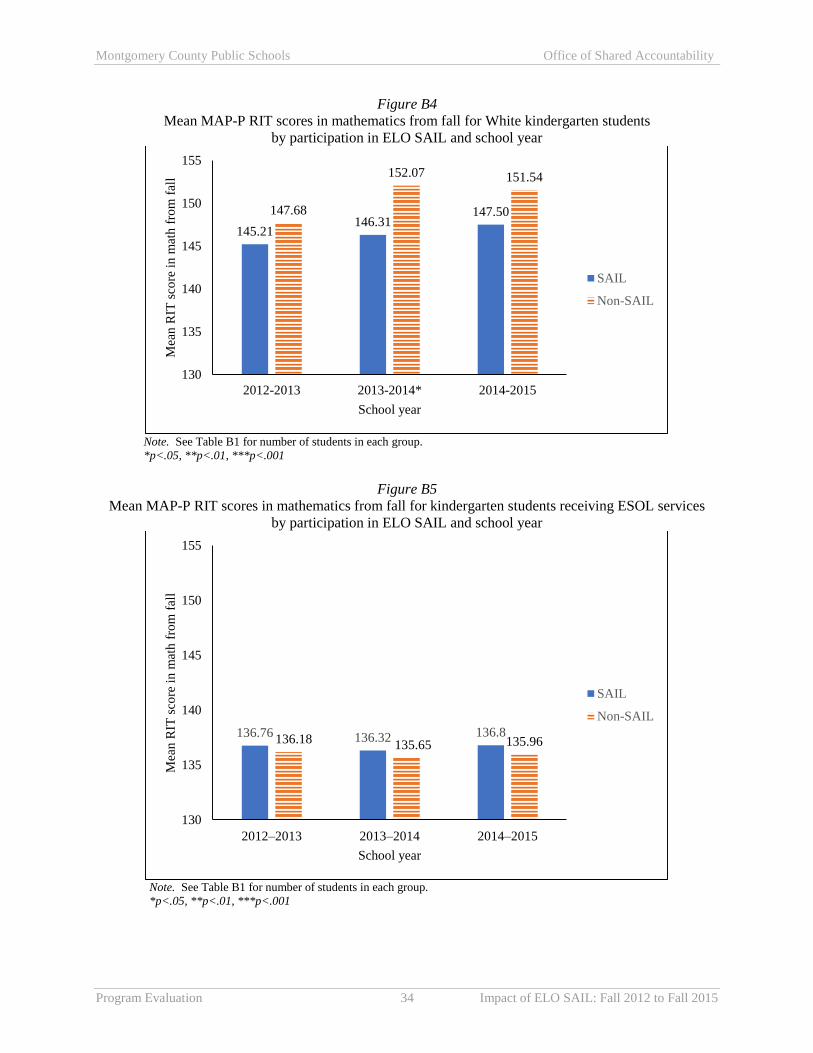
Montgomery County Public Schools Office of Shared Accountability
Program Evaluation 34 Impact of ELO SAIL: Fall 2012 to Fall 2015
Figure B4
Mean MAP-P RIT scores in mathematics from fall for White kindergarten students
by participation in ELO SAIL and school year
Note. See Table B1 for number of students in each group. *p<.05, **p<.01, ***p<.001
Figure B5
Mean MAP-P RIT scores in mathematics from fall for kindergarten students receiving ESOL services
by participation in ELO SAIL and school year
Note. See Table B1 for number of students in each group.
*p<.05, **p<.01, ***p<.001
145.21146.31
147.50147.68
152.07 151.54
130
135
140
145
150
155
2012-2013 2013-2014* 2014-2015
Mea
n R
IT s
core
in m
ath f
rom
fal
l
School year
SAIL
Non-SAIL
136.76 136.32 136.8136.18 135.65 135.96
130
135
140
145
150
155
2012–2013 2013–2014 2014–2015
Mea
n R
IT s
core
in m
ath f
rom
fal
l
School year
SAIL
Non-SAIL
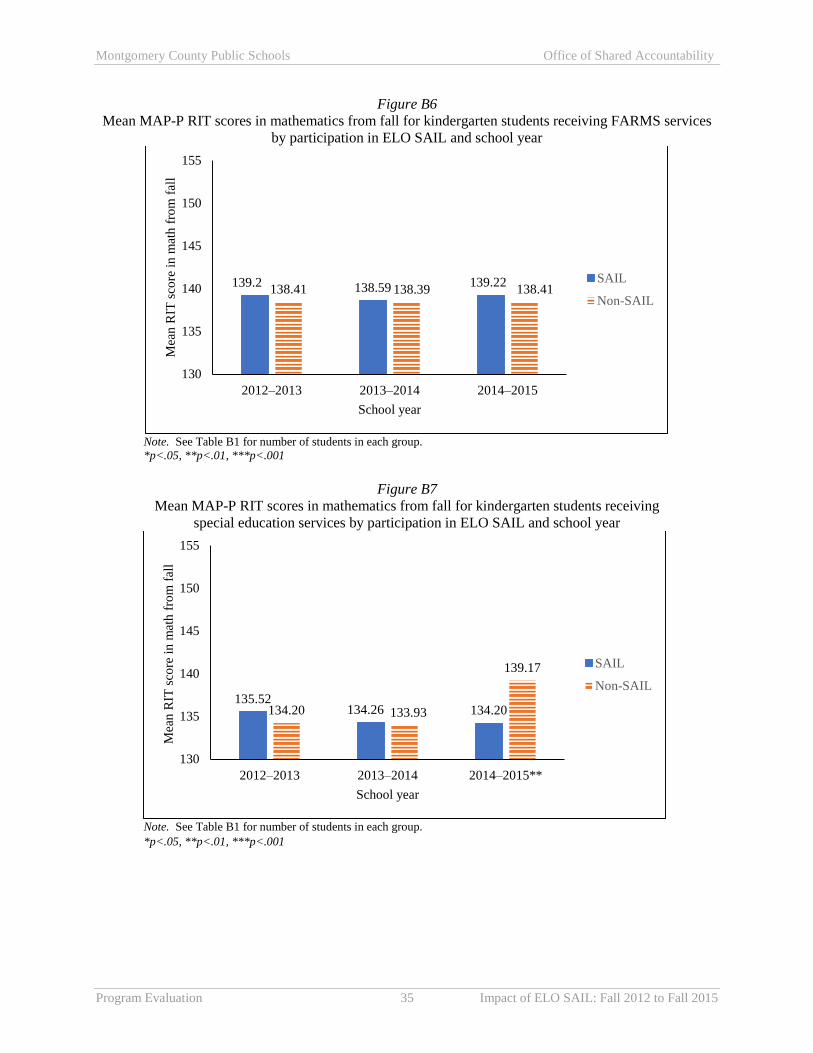
Montgomery County Public Schools Office of Shared Accountability
Program Evaluation 35 Impact of ELO SAIL: Fall 2012 to Fall 2015
Figure B6
Mean MAP-P RIT scores in mathematics from fall for kindergarten students receiving FARMS services
by participation in ELO SAIL and school year
Note. See Table B1 for number of students in each group. *p<.05, **p<.01, ***p<.001
Figure B7
Mean MAP-P RIT scores in mathematics from fall for kindergarten students receiving
special education services by participation in ELO SAIL and school year
Note. See Table B1 for number of students in each group.
*p<.05, **p<.01, ***p<.001
139.2 138.59 139.22138.41 138.39 138.41
130
135
140
145
150
155
2012–2013 2013–2014 2014–2015
Mea
n R
IT s
core
in m
ath f
rom
fal
l
School year
SAIL
Non-SAIL
135.52134.26 134.20134.20 133.93
139.17
130
135
140
145
150
155
2012–2013 2013–2014 2014–2015**
Mea
n R
IT s
core
in m
ath f
rom
fal
l
School year
SAIL
Non-SAIL
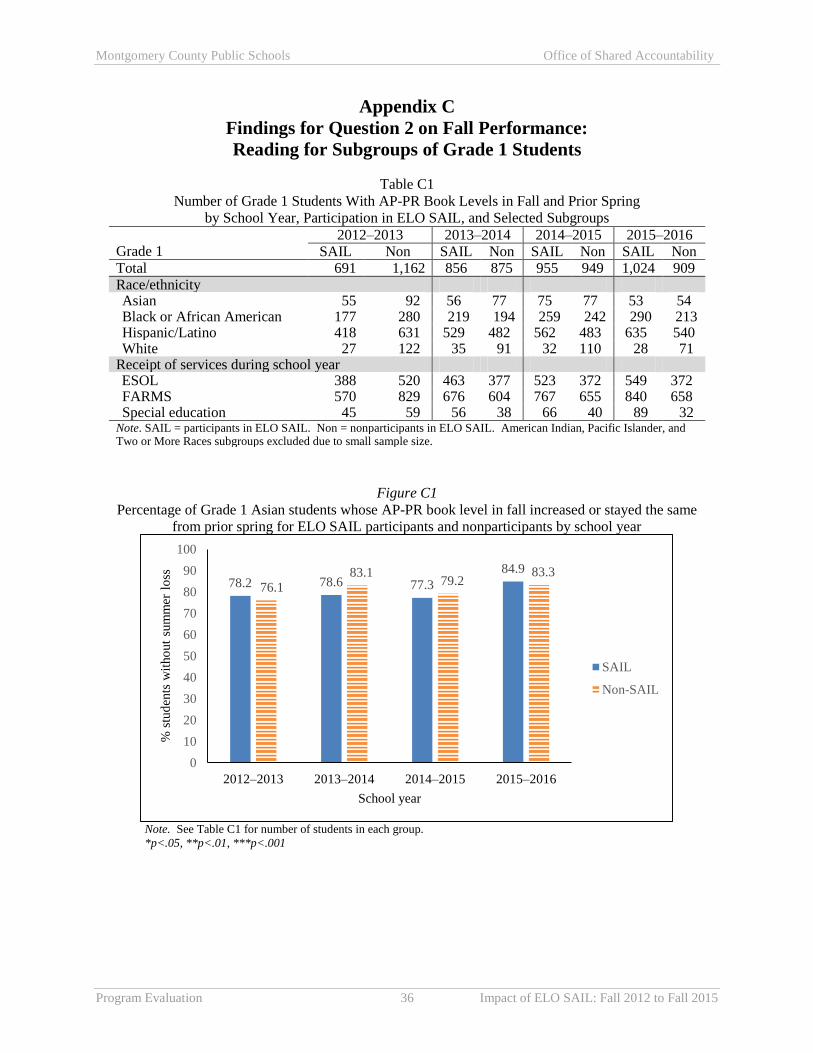
Montgomery County Public Schools Office of Shared Accountability
Program Evaluation 36 Impact of ELO SAIL: Fall 2012 to Fall 2015
Appendix C
Findings for Question 2 on Fall Performance:
Reading for Subgroups of Grade 1 Students
Table C1
Number of Grade 1 Students With AP-PR Book Levels in Fall and Prior Spring
by School Year, Participation in ELO SAIL, and Selected Subgroups
Grade 1 2012–2013 2013–2014 2014–2015 2015–2016
SAIL Non SAIL Non SAIL Non SAIL Non Total 691 1,162 856 875 955 949 1,024 909 Race/ethnicity Asian 55 92 56 77 75 77 53 54 Black or African American 177 280 219 194 259 242 290 213 Hispanic/Latino 418 631 529 482 562 483 635 540 White 27 122 35 91 32 110 28 71
Receipt of services during school year ESOL 388 520 463 377 523 372 549 372 FARMS 570 829 676 604 767 655 840 658 Special education 45 59 56 38 66 40 89 32
Note. SAIL = participants in ELO SAIL. Non = nonparticipants in ELO SAIL. American Indian, Pacific Islander, and Two or More Races subgroups excluded due to small sample size.
Figure C1
Percentage of Grade 1 Asian students whose AP-PR book level in fall increased or stayed the same
from prior spring for ELO SAIL participants and nonparticipants by school year
Note. See Table C1 for number of students in each group.
*p<.05, **p<.01, ***p<.001
78.2 78.6 77.3
84.9
76.183.1
79.283.3
0
10
20
30
40
50
60
70
80
90
100
2012–2013 2013–2014 2014–2015 2015–2016
% s
tud
ents
wit
ho
ut
sum
mer
lo
ss
School year
SAIL
Non-SAIL

Montgomery County Public Schools Office of Shared Accountability
Program Evaluation 37 Impact of ELO SAIL: Fall 2012 to Fall 2015
Figure C2
Percentage of Grade 1 Black or African American students
whose AP-PR book level in fall increased or stayed the same from prior spring
for ELO SAIL participants and nonparticipants by school year
Note. See Table C1 for number of students in each group.
*p<.05, **p<.01, ***p<.001
Figure C3
Percentage of Grade 1 Hispanic/Latino students whose AP-PR book level in fall increased or
stayed the same from prior spring for ELO SAIL participants and nonparticipants by school year
Note. See Table C1 for number of students in each group.
*p<.05, **p<.01, ***p<.001
83.679.5
72.6
81.781.1
72.776.9 78.4
0
10
20
30
40
50
60
70
80
90
100
2012–2013 2013–2014 2014–2015 2015–2016
% s
tud
ents
wit
ho
ut
sum
mer
lo
ss
School year
SAIL
Non-SAIL
73.7 75.871.2
80.8
72.1 73.2 73.376.3
0
10
20
30
40
50
60
70
80
90
100
2012–2013 2013–2014 2014–2015 2015–2016
% s
tud
ents
wit
ho
ut
sum
mer
lo
ss
School year
SAIL
Non-SAIL
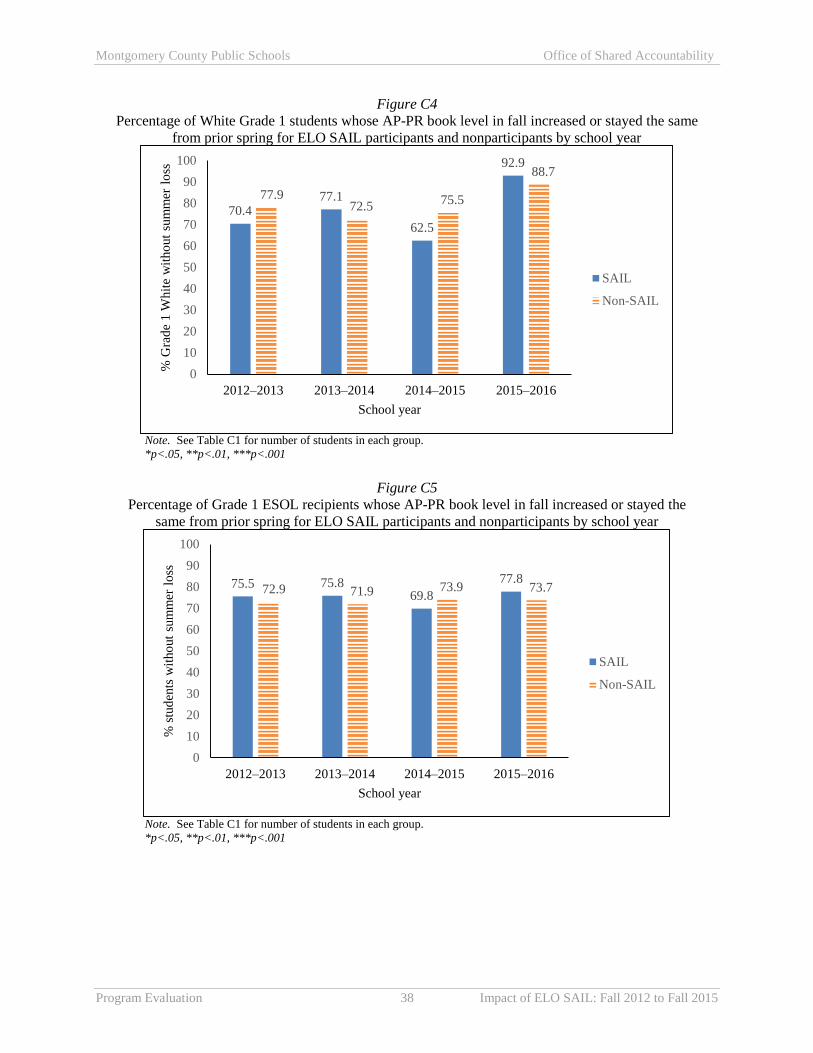
Montgomery County Public Schools Office of Shared Accountability
Program Evaluation 38 Impact of ELO SAIL: Fall 2012 to Fall 2015
Figure C4
Percentage of White Grade 1 students whose AP-PR book level in fall increased or stayed the same
from prior spring for ELO SAIL participants and nonparticipants by school year
Note. See Table C1 for number of students in each group.
*p<.05, **p<.01, ***p<.001
Figure C5
Percentage of Grade 1 ESOL recipients whose AP-PR book level in fall increased or stayed the
same from prior spring for ELO SAIL participants and nonparticipants by school year
Note. See Table C1 for number of students in each group.
*p<.05, **p<.01, ***p<.001
70.477.1
62.5
92.9
77.972.5
75.5
88.7
0
10
20
30
40
50
60
70
80
90
100
2012–2013 2013–2014 2014–2015 2015–2016
% G
rad
e 1
Whit
e w
itho
ut
sum
mer
lo
ss
School year
SAIL
Non-SAIL
75.5 75.869.8
77.872.9 71.9 73.9 73.7
0
10
20
30
40
50
60
70
80
90
100
2012–2013 2013–2014 2014–2015 2015–2016
% s
tud
ents
wit
ho
ut
sum
mer
lo
ss
School year
SAIL
Non-SAIL

Montgomery County Public Schools Office of Shared Accountability
Program Evaluation 39 Impact of ELO SAIL: Fall 2012 to Fall 2015
Figure C6
Percentage of Grade 1 FARMS recipients whose AP-PR book level in fall increased or stayed the
same from prior spring for ELO SAIL participants and nonparticipants by school year
Note. See Table C1 for number of students in each group.
*p<.05, **p<.01, ***p<.001
Figure C7
Percentage of Grade 1 recipients of special education whose AP-PR book level in fall increased or
stayed the same from prior spring for ELO SAIL participants and nonparticipants by school year
Note. See Table C1 for number of students in each group.
*p<.05, **p<.01, ***p<.001
76.1 75.970.7
81.7
73.8 72.2 74.7 76.1
0
10
20
30
40
50
60
70
80
90
100
2012–2013 2013–2014 2014–2015 2015–2016**
% s
tud
ents
wit
ho
ut
sum
mer
lo
ss
School year
SAIL
Non-SAIL
80.0
67.963.6
78.7
66.1
55.3
82.5
71.9
0
10
20
30
40
50
60
70
80
90
100
2012–2013 2013–2014 2014–2015* 2015–2016
% s
tud
ents
wit
ho
ut
sum
mer
lo
ss
School year
SAIL
Non-SAIL
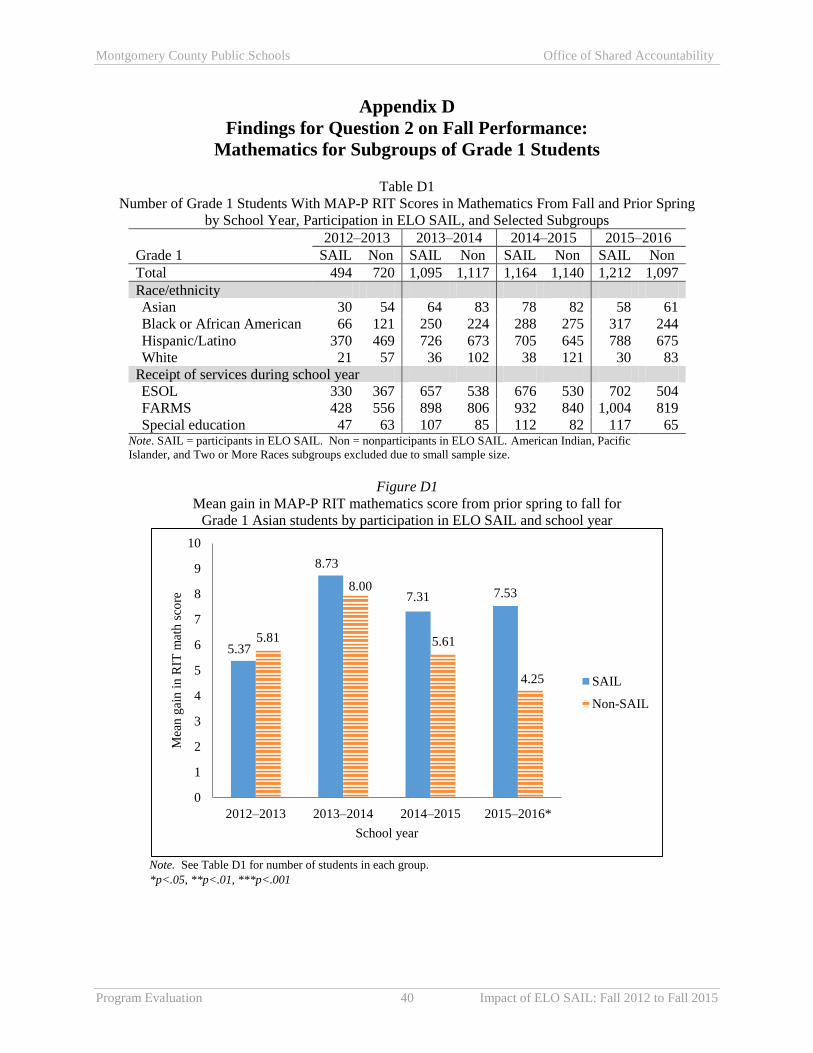
Montgomery County Public Schools Office of Shared Accountability
Program Evaluation 40 Impact of ELO SAIL: Fall 2012 to Fall 2015
Appendix D
Findings for Question 2 on Fall Performance:
Mathematics for Subgroups of Grade 1 Students
Table D1
Number of Grade 1 Students With MAP-P RIT Scores in Mathematics From Fall and Prior Spring
by School Year, Participation in ELO SAIL, and Selected Subgroups
Grade 1
2012–2013 2013–2014 2014–2015 2015–2016
SAIL Non SAIL Non SAIL Non SAIL Non
Total 494 720 1,095 1,117 1,164 1,140 1,212 1,097
Race/ethnicity
Asian 30 54 64 83 78 82 58 61
Black or African American 66 121 250 224 288 275 317 244
Hispanic/Latino 370 469 726 673 705 645 788 675
White 21 57 36 102 38 121 30 83
Receipt of services during school year
ESOL 330 367 657 538 676 530 702 504
FARMS 428 556 898 806 932 840 1,004 819
Special education 47 63 107 85 112 82 117 65 Note. SAIL = participants in ELO SAIL. Non = nonparticipants in ELO SAIL. American Indian, Pacific
Islander, and Two or More Races subgroups excluded due to small sample size.
Figure D1
Mean gain in MAP-P RIT mathematics score from prior spring to fall for
Grade 1 Asian students by participation in ELO SAIL and school year
Note. See Table D1 for number of students in each group.
*p<.05, **p<.01, ***p<.001
5.37
8.73
7.31 7.53
5.81
8.00
5.61
4.25
0
1
2
3
4
5
6
7
8
9
10
2012–2013 2013–2014 2014–2015 2015–2016*
Mea
n g
ain i
n R
IT m
ath s
core
School year
SAIL
Non-SAIL

Montgomery County Public Schools Office of Shared Accountability
Program Evaluation 41 Impact of ELO SAIL: Fall 2012 to Fall 2015
Figure D2
Mean gain in MAP-P RIT mathematics score from prior spring to fall for
Grade 1 Black or African American students by participation in ELO SAIL and school year
Note. See Table D1 for number of students in each group. *p<.05, **p<.01, ***p<.001
Figure D3
Mean gain in MAP-P RIT mathematics score from prior spring to fall for
Grade 1 Hispanic/Latino students by participation in ELO SAIL and school year
Note. See Table D1 for number of students in each group.
*p<.05, **p<.01, ***p<.001
5.36
6.39 6.28
5.49
4.12
5.92
4.884.67
0
1
2
3
4
5
6
7
8
9
10
2012–2013 2013–2014 2014–2015* 2015–2016
Mea
n g
ain i
n R
IT m
ath s
core
School year
SAIL
Non-SAIL
5.17 5.19
6.27
5.58
4.44.86 4.72
4.02
0
1
2
3
4
5
6
7
8
9
10
2012–2013 2013–2014 2014–2015*** 2015–2016***
Mea
n g
ain i
n R
IT m
ath s
core
School year
SAIL
Non-SAIL

Montgomery County Public Schools Office of Shared Accountability
Program Evaluation 42 Impact of ELO SAIL: Fall 2012 to Fall 2015
Figure D4
Mean gain in MAP-P RIT mathematics score from prior spring to fall for
Grade 1 White students by participation in ELO SAIL and school year
Note. See Table D1 for number of students in each group.
*p<.05, **p<.01, ***p<.001
Figure D5
Mean gain in MAP-P RIT mathematics score from prior spring to fall for
Grade 1 ESOL recipients by participation in ELO SAIL and school year
Note. See Table D1 for number of students in each group.
*p<.05, **p<.01, ***p<.001
5.71
7.53
6.536.33
4.11
7.37
4.74
5.63
0
1
2
3
4
5
6
7
8
9
10
2012–2013 2013–2014 2014–2015 2015–2016
Mea
n g
ain i
n R
IT m
ath s
core
School year
SAIL
Non-SAIL
5.175.53
6.45
5.83
4.53 4.58 4.544.32
0
1
2
3
4
5
6
7
8
9
10
2012–2013 2013–2014* 2014–2015*** 2015–2016**
Mea
n g
ain R
IT s
core
fo
r G
rad
e 1
ES
OL
School year
SAIL
Non-SAIL

Montgomery County Public Schools Office of Shared Accountability
Program Evaluation 43 Impact of ELO SAIL: Fall 2012 to Fall 2015
Figure D6
Mean gain in MAP-P RIT mathematics score from prior spring to fall for
Grade 1 FARMS recipients by participation in ELO SAIL and school year
Note. See Table D1 for number of students in each group.
*p<.05, **p<.01, ***p<.001
Figure D7
Mean gain in MAP-P RIT mathematics score from prior spring to fall for
Grade 1 special education recipients by participation in ELO SAIL and school year
Note. See Table D1 for number of students in each group.
*p<.05, **p<.01, ***p<.001
4.95 5.47
6.36
5.58
4.434.83 4.67
4.08
0
1
2
3
4
5
6
7
8
9
10
2012–2013 2013–2014 2014–2015*** 2015–2016***
Mea
n g
ain i
n R
IT m
ath s
core
School year
SAIL
Non-SAIL
4.724.09
5.90 6.36
3.112.78
2.98 3.26
0
1
2
3
4
5
6
7
8
9
10
2012–2013 2013–2014 2014–2015* 2015–2016*
Mea
n g
ain i
n R
IT m
ath s
core
School year
SAIL
Non-SAIL

Montgomery County Public Schools Office of Shared Accountability
Program Evaluation 44 Impact of ELO SAIL: Fall 2012 to Fall 2015
Appendix E
Findings for Question 2 on Fall Performance:
Reading for Subgroups of Grade 2 Students
Table E1
Number of Grade 2 Students With AP-PR Book Levels in Fall and Prior Spring
by School Year, Participation in ELO SAIL, and Selected Subgroups
Grade 2
2012–2013 2013–2014 2014–2015 2015–2016
SAIL Non SAIL Non SAIL Non SAIL Non
Total 683 1,215 883 1,077 1,037 1,241 1,045 1,213
Race/ethnicity
Asian 58 107 67 78 57 81 69 78
Black or African American 160 297 219 237 257 273 292 303
Hispanic/Latino 439 658 563 605 691 729 619 701
White 16 116 23 118 21 109 35 90
Receipt of services during school year
ESOL 416 572 513 480 597 533 583 537
FARMS 574 857 741 783 869 881 864 923
Special education 61 94 95 80 105 75 97 67 Note. SAIL = participants in ELO SAIL. Non = nonparticipants in ELO SAIL. American Indian, Pacific
Islander, and Two or More Races subgroups excluded due to small sample size.
Figure E1
Percentage of Grade 2 Asian students whose AP-PR book level in fall increased or stayed the same from
prior spring for ELO SAIL participants and nonparticipants by school year
Note. See Table E1 for number of students in each group.
*p<.05, **p<.01, ***p<.001
55.2
67.2
73.7
84.1
64.567.9
72.8
82.1
0
10
20
30
40
50
60
70
80
90
100
2012–2013 2013–2014 2014–2015 2015–2016
% s
tud
ents
wit
ho
ut
sum
mer
lo
ss
School year
SAIL
Non-SAIL
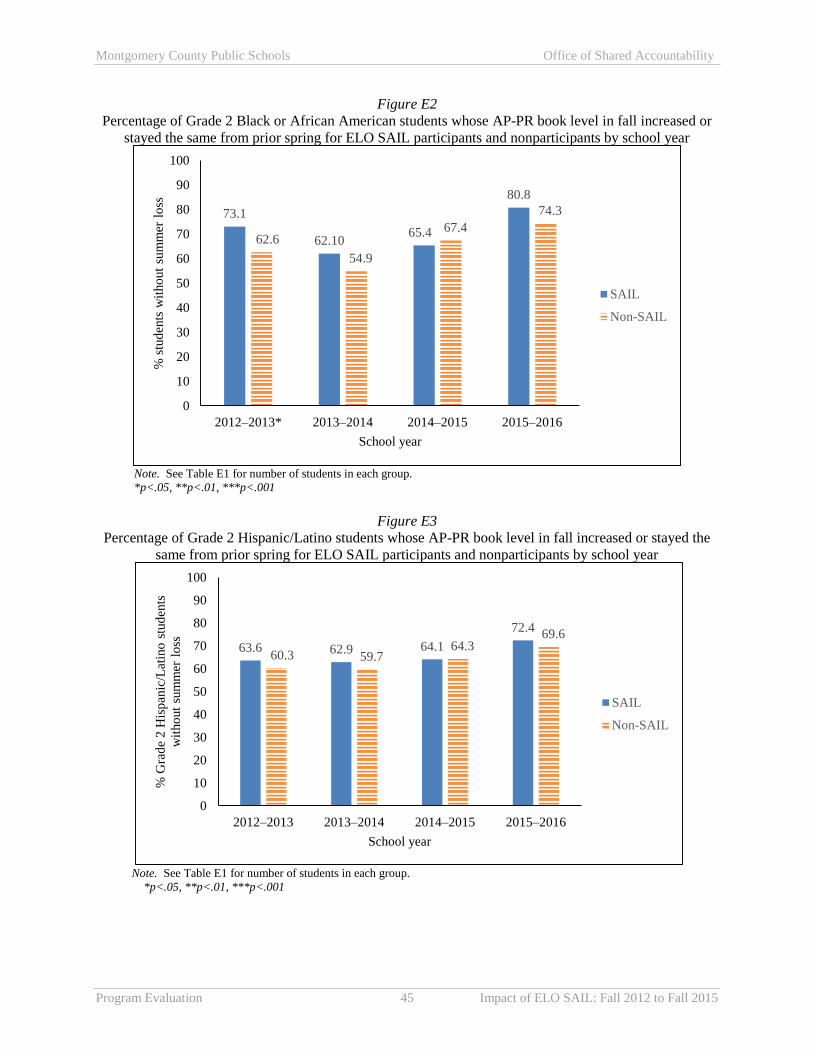
Montgomery County Public Schools Office of Shared Accountability
Program Evaluation 45 Impact of ELO SAIL: Fall 2012 to Fall 2015
Figure E2
Percentage of Grade 2 Black or African American students whose AP-PR book level in fall increased or
stayed the same from prior spring for ELO SAIL participants and nonparticipants by school year
Note. See Table E1 for number of students in each group.
*p<.05, **p<.01, ***p<.001
Figure E3
Percentage of Grade 2 Hispanic/Latino students whose AP-PR book level in fall increased or stayed the
same from prior spring for ELO SAIL participants and nonparticipants by school year
Note. See Table E1 for number of students in each group.
*p<.05, **p<.01, ***p<.001
73.1
62.1065.4
80.8
62.6
54.9
67.4
74.3
0
10
20
30
40
50
60
70
80
90
100
2012–2013* 2013–2014 2014–2015 2015–2016
% s
tud
ents
wit
ho
ut
sum
mer
lo
ss
School year
SAIL
Non-SAIL
63.6 62.9 64.1
72.4
60.3 59.764.3
69.6
0
10
20
30
40
50
60
70
80
90
100
2012–2013 2013–2014 2014–2015 2015–2016
% G
rad
e 2
His
pan
ic/L
atin
o s
tud
ents
wit
ho
ut
sum
mer
lo
ss
School year
SAIL
Non-SAIL
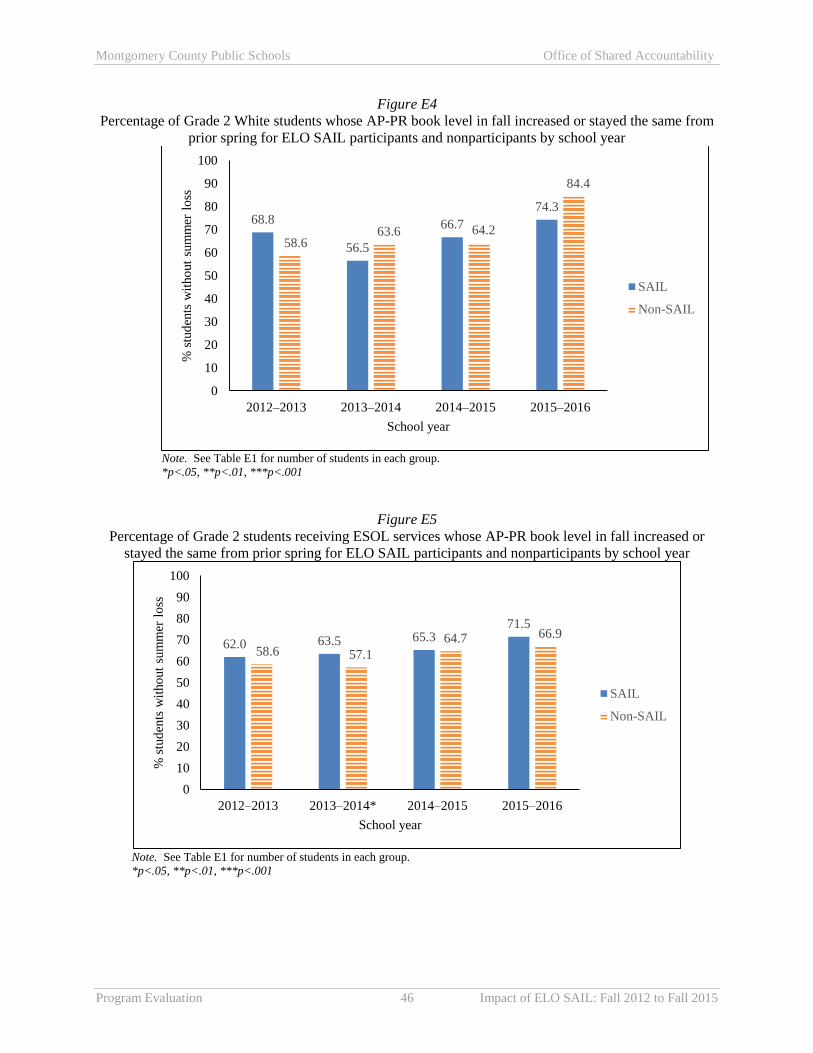
Montgomery County Public Schools Office of Shared Accountability
Program Evaluation 46 Impact of ELO SAIL: Fall 2012 to Fall 2015
Figure E4
Percentage of Grade 2 White students whose AP-PR book level in fall increased or stayed the same from
prior spring for ELO SAIL participants and nonparticipants by school year
Note. See Table E1 for number of students in each group.
*p<.05, **p<.01, ***p<.001
Figure E5
Percentage of Grade 2 students receiving ESOL services whose AP-PR book level in fall increased or
stayed the same from prior spring for ELO SAIL participants and nonparticipants by school year
Note. See Table E1 for number of students in each group.
*p<.05, **p<.01, ***p<.001
68.8
56.5
66.7
74.3
58.663.6 64.2
84.4
0
10
20
30
40
50
60
70
80
90
100
2012–2013 2013–2014 2014–2015 2015–2016
% s
tud
ents
wit
ho
ut
sum
mer
lo
ss
School year
SAIL
Non-SAIL
62.0 63.5 65.371.5
58.6 57.1
64.7 66.9
0
10
20
30
40
50
60
70
80
90
100
2012–2013 2013–2014* 2014–2015 2015–2016
% s
tud
ents
wit
ho
ut
sum
mer
lo
ss
School year
SAIL
Non-SAIL

Montgomery County Public Schools Office of Shared Accountability
Program Evaluation 47 Impact of ELO SAIL: Fall 2012 to Fall 2015
Figure E6
Percentage of Grade 2 students receiving FARMS services
whose AP-PR book level in fall increased or stayed the same from prior spring
for ELO SAIL participants and nonparticipants by school year
.
Note. See Table E1 for number of students in each group.
*p<.05, **p<.01, ***p<.001
Figure E7
Percentage of Grade 2 students receiving special education services
whose AP-PR book level in fall increased or stayed the same from prior spring
for ELO SAIL participants and nonparticipants by school year
Note. See Table E1 for number of students in each group.
*p<.05, **p<.01, ***p<.001
64.561.3
65.9
75.2
60.3 60.265.6
69.9
0
10
20
30
40
50
60
70
80
90
100
2012–2013 2013–2014 2014–2015 2015–2016*
% s
tud
ents
wit
ho
ut
sum
mer
lo
ss
School year
SAIL
Non-SAIL
57.462.1
53.3
68.0
48.9
58.8 58.7
70.1
0
10
20
30
40
50
60
70
80
90
100
2012–2013 2013–2014 2014–2015 2015–2016
% s
tud
ents
wit
ho
ut
sum
mer
lo
ss
School year
SAIL
Non-SAIL

Montgomery County Public Schools Office of Shared Accountability
Program Evaluation 48 Impact of ELO SAIL: Fall 2012 to Fall 2015
Appendix F
Findings for Question 2 on Fall Performance:
Mathematics for Subgroups of Grade 2 Students
Table F1
Number of Grade 2 Students With MAP-P RIT Scores in Mathematics From Fall and Prior Spring
by School Year, Participation in ELO SAIL, and Selected Subgroups
Grade 2
2012–2013 2013–2014 2014–2015 2015–2016
SAIL Non SAIL Non SAIL Non SAIL Non
Total 408 642 977 1,175 1,059 1,262 1,092 1,240
Race/ethnicity
Asian 32 60 72 81 58 83 74 83
Black or African American 75 122 227 246 258 275 303 309
Hispanic/Latino 286 387 645 676 709 743 647 710
White 7 58 21 129 23 110 36 96
Receipt of services during school year
ESOL 279 341 592 533 615 553 614 546
FARMS 350 468 833 859 889 898 901 937
Special education 48 65 116 95 121 90 105 76 Note. SAIL = participants in ELO SAIL. Non = nonparticipants in ELO SAIL. American Indian, Pacific Islander,
and Two or More Races subgroups excluded due to small sample size.
Figure F1
Mean gain in MAP-P RIT mathematics score from prior spring to fall for
Grade 2 Asian students by participation in ELO SAIL and school year
Note. See Table F1 for number of students in each group.
*p<.05, **p<.01, ***p<.001
4.09
7.08
5.64
6.39
5.15
7.04
5.67
4.95
0
1
2
3
4
5
6
7
8
9
10
2012–2013 2013–2014 2014–2015 2015–2016
Mea
n g
ain i
n R
IT m
ath s
core
School year
SAIL
Non-SAIL

Montgomery County Public Schools Office of Shared Accountability
Program Evaluation 49 Impact of ELO SAIL: Fall 2012 to Fall 2015
Figure F2
Mean gain in MAP-P RIT mathematics score from prior spring to fall for
Grade 2 Black or African American students by participation in ELO SAIL and school year
Note. See Table F1 for number of students in each group.
*p<.05, **p<.01, ***p<.001
Figure F3
Mean gain in MAP-P RIT mathematics score from prior spring to fall for
Grade 2 Hispanic/Latino by participation in ELO SAIL and school year
Note. See Table F1 for number of students in each group.
*p<.05, **p<.01, ***p<.001
4.63
6.80
5.09 4.96
2.96
5.614.84
3.39
0
1
2
3
4
5
6
7
8
9
10
2012–2013 2013–2014 2014–2015 2015–2016**
Mea
n g
ain i
n R
IT m
ath s
core
School year
SAIL
Non-SAIL
3.02
5.31 5.004.45
2.49
4.553.99
3.24
0
1
2
3
4
5
6
7
8
9
10
2012–2013 2013–2014 2014–2015** 2015–2016**
Mea
n g
ain i
n R
IT m
ath s
core
School year
SAIL
Non-SAIL

Montgomery County Public Schools Office of Shared Accountability
Program Evaluation 50 Impact of ELO SAIL: Fall 2012 to Fall 2015
Figure F4
Mean gain in MAP-P RIT mathematics score from prior spring to fall for
Grade 2 White students by participation in ELO SAIL and school year
Note. See Table F1 for number of students in each group.
*p<.05, **p<.01, ***p<.001
Figure F5
Mean gain in MAP-P RIT mathematics score from prior spring to fall for
Grade 2 ESOL recipients by participation in ELO SAIL and school year
Note. See Table F1 for number of students in each group.
*p<.05, **p<.01, ***p<.001
3.57
10.05
3.09
2.03
2.98
5.60
4.15 4.35
0
1
2
3
4
5
6
7
8
9
10
11
2012–2013 2013–2014** 2014–2015 2015–2016
Mea
n g
ain i
n R
IT m
ath s
core
School year
SAIL
Non-SAIL
3.24
5.45
4.95 5.07
2.55
4.494.00
3.57
0
1
2
3
4
5
6
7
8
9
10
2012–2013 2013–2014* 2014–2015* 2015–2016***
Mea
n g
ain i
n R
IT m
ath
sco
re
School year
SAIL
Non-SAIL
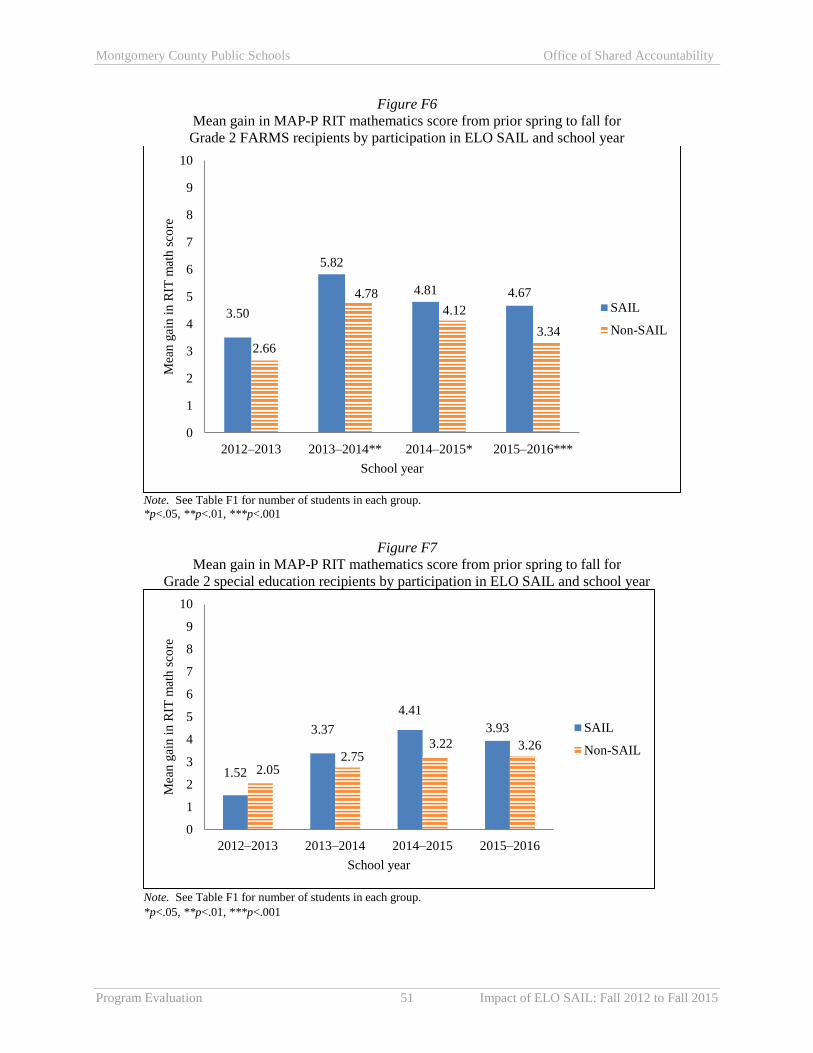
Montgomery County Public Schools Office of Shared Accountability
Program Evaluation 51 Impact of ELO SAIL: Fall 2012 to Fall 2015
Figure F6
Mean gain in MAP-P RIT mathematics score from prior spring to fall for
Grade 2 FARMS recipients by participation in ELO SAIL and school year
Note. See Table F1 for number of students in each group.
*p<.05, **p<.01, ***p<.001
Figure F7
Mean gain in MAP-P RIT mathematics score from prior spring to fall for
Grade 2 special education recipients by participation in ELO SAIL and school year
Note. See Table F1 for number of students in each group.
*p<.05, **p<.01, ***p<.001
3.50
5.82
4.81 4.67
2.66
4.78
4.12
3.34
0
1
2
3
4
5
6
7
8
9
10
2012–2013 2013–2014** 2014–2015* 2015–2016***
Mea
n g
ain i
n R
IT m
ath s
core
School year
SAIL
Non-SAIL
1.52
3.37
4.41
3.93
2.052.75
3.22 3.26
0
1
2
3
4
5
6
7
8
9
10
2012–2013 2013–2014 2014–2015 2015–2016
Mea
n g
ain i
n R
IT m
ath s
core
School year
SAIL
Non-SAIL

Montgomery County Public Schools Office of Shared Accountability
Program Evaluation 52 Impact of ELO SAIL: Fall 2012 to Fall 2015
Appendix G
Findings for Question 3 on End-of-Year Performance:
Reading for Subgroups of Kindergarten Students
Table G1
Number of Kindergarten Students With End-of-Year AP-PR Reading Data by
School Year, Participation in ELO SAIL, and Selected Subgroups
Kindergarten 2012–2013 2013–2014 2014–2015
SAIL Non SAIL Non SAIL Non
Total 976 1,713 1,112 1,860 1,349 1,478
Race/ethnicity Asian 59 117 74 139 64 86 Black or African American 198 428 253 487 325 358 Hispanic/Latino 666 954 717 965 897 835 White 34 164 43 187 39 150 Receipt of services during school year ESOL 615 879 700 908 845 740 FARMS 813 1,227 917 1,315 1,124 1,041 Special education 92 136 79 170 122 121 Note. SAIL = participants in ELO SAIL. Non = nonparticipants in ELO SAIL. American Indian, Pacific
Islander, and Two or More Races subgroups excluded due to small sample size.
Figure G1
Percentage of Asian kindergarten students who met the AP-PR end-of-year benchmark
for ELO SAIL participants and nonparticipants by school year
Note. See Table G1 for number of students in each group. *p<.05, **p<.01, ***p<.001
94.9 94.689.1
98.3
87.883.7
0
10
20
30
40
50
60
70
80
90
100
2012–2013 2013–2014 2014–2015
% o
f st
ud
ents
who
met
end
-of-
yea
r b
ench
mar
k
School year
SAIL
Non-SAIL
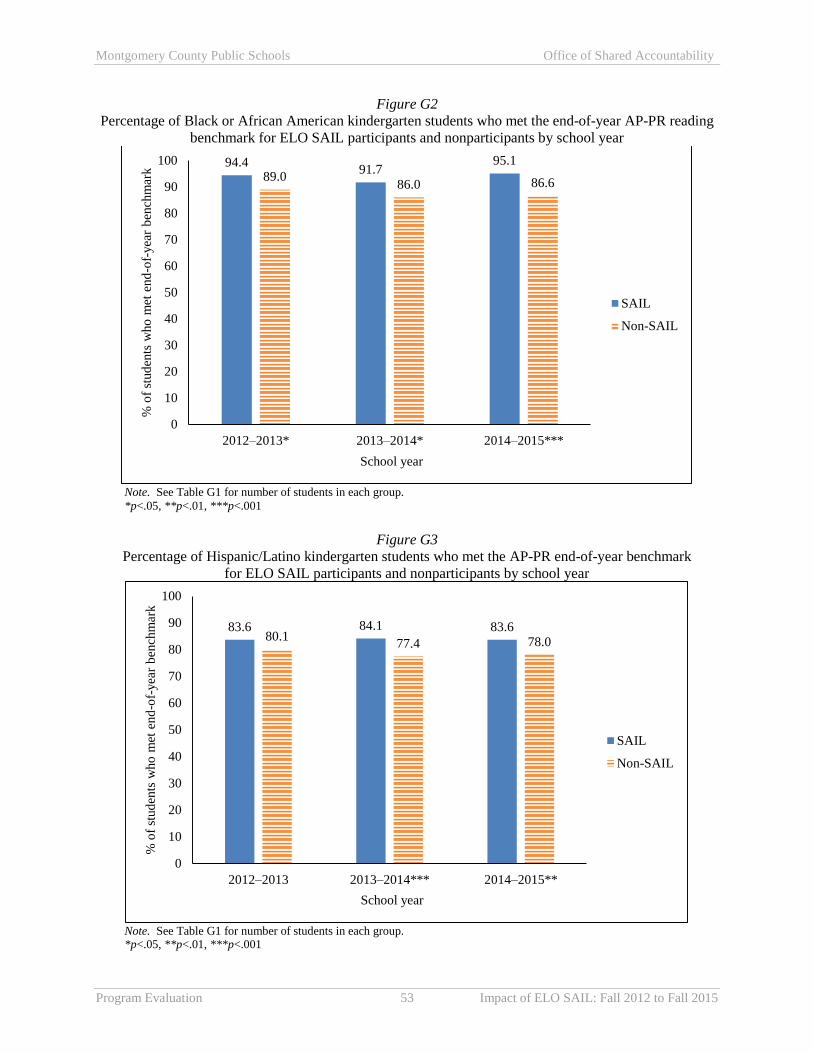
Montgomery County Public Schools Office of Shared Accountability
Program Evaluation 53 Impact of ELO SAIL: Fall 2012 to Fall 2015
Figure G2
Percentage of Black or African American kindergarten students who met the end-of-year AP-PR reading
benchmark for ELO SAIL participants and nonparticipants by school year
Note. See Table G1 for number of students in each group.
*p<.05, **p<.01, ***p<.001
Figure G3
Percentage of Hispanic/Latino kindergarten students who met the AP-PR end-of-year benchmark
for ELO SAIL participants and nonparticipants by school year
Note. See Table G1 for number of students in each group. *p<.05, **p<.01, ***p<.001
94.491.7
95.1
89.086.0 86.6
0
10
20
30
40
50
60
70
80
90
100
2012–2013* 2013–2014* 2014–2015***
% o
f st
ud
ents
who
met
end
-of-
yea
r b
ench
mar
k
School year
SAIL
Non-SAIL
83.6 84.1 83.680.1
77.4 78.0
0
10
20
30
40
50
60
70
80
90
100
2012–2013 2013–2014*** 2014–2015**
% o
f st
ud
ents
who
met
end
-of-
yea
r b
ench
mar
k
School year
SAIL
Non-SAIL

Montgomery County Public Schools Office of Shared Accountability
Program Evaluation 54 Impact of ELO SAIL: Fall 2012 to Fall 2015
Figure G4
Percentage of White kindergarten students who met the AP-PR end-of-year benchmark
for ELO SAIL participants and nonparticipants by school year
Note. See Table G1 for number of students in each group.
*p<.05, **p<.01, ***p<.001
Figure G5
Percentage of kindergarten students who met the AP-PR end-of-year benchmark
for ELO SAIL participants and nonparticipants by school year for ESOL recipients
Note. See Table G1 for number of students in each group.
*p<.05, **p<.01, ***p<.001
91.288.4
92.391.589.3
86.7
0
10
20
30
40
50
60
70
80
90
100
2012–2013 2013–2014 2014–2015
% o
f st
ud
ents
who
met
end
-of-
yea
r b
ench
mar
k
School year
SAIL
Non-SAIL
82.4 83.4 83.380.5
76.0 74.9
0
10
20
30
40
50
60
70
80
90
100
2012–2013 2013–2014*** 2014–2015***
% o
f st
ud
ents
who
met
end
-of-
yea
r b
ench
mar
k
School year
SAIL
Non-SAIL

Montgomery County Public Schools Office of Shared Accountability
Program Evaluation 55 Impact of ELO SAIL: Fall 2012 to Fall 2015
Figure G6
Percentage of kindergarten students who met the AP-PR end-of-year benchmark
for ELO SAIL participants and nonparticipants by school year for FARMS recipients
Note. See Table G1 for number of students in each group. *p<.05, **p<.01, ***p<.001
Figure G7
Percentage of kindergarten students who met the AP-PR end-of-year benchmark
for ELO SAIL participants and nonparticipants by school year for special education recipients
Note. See Table G1 for number of students in each group. *p<.05, **p<.01, ***p<.001
85.9 85.6 86.483.0
79.8 78.8
0
10
20
30
40
50
60
70
80
90
100
2012–2013 2013–2014*** 2014–2015***
% o
f st
ud
ents
who
met
end
-of-
yea
r b
ench
mar
k
School year
SAIL
Non-SAIL
73.979.7
75.4
63.260.6
53.7
0
10
20
30
40
50
60
70
80
90
100
2012–2013 2013–2014** 2014–2015***
% o
f st
ud
ents
who
met
end
-of-
yea
r b
ench
mar
k
School year
SAIL
Non-SAIL
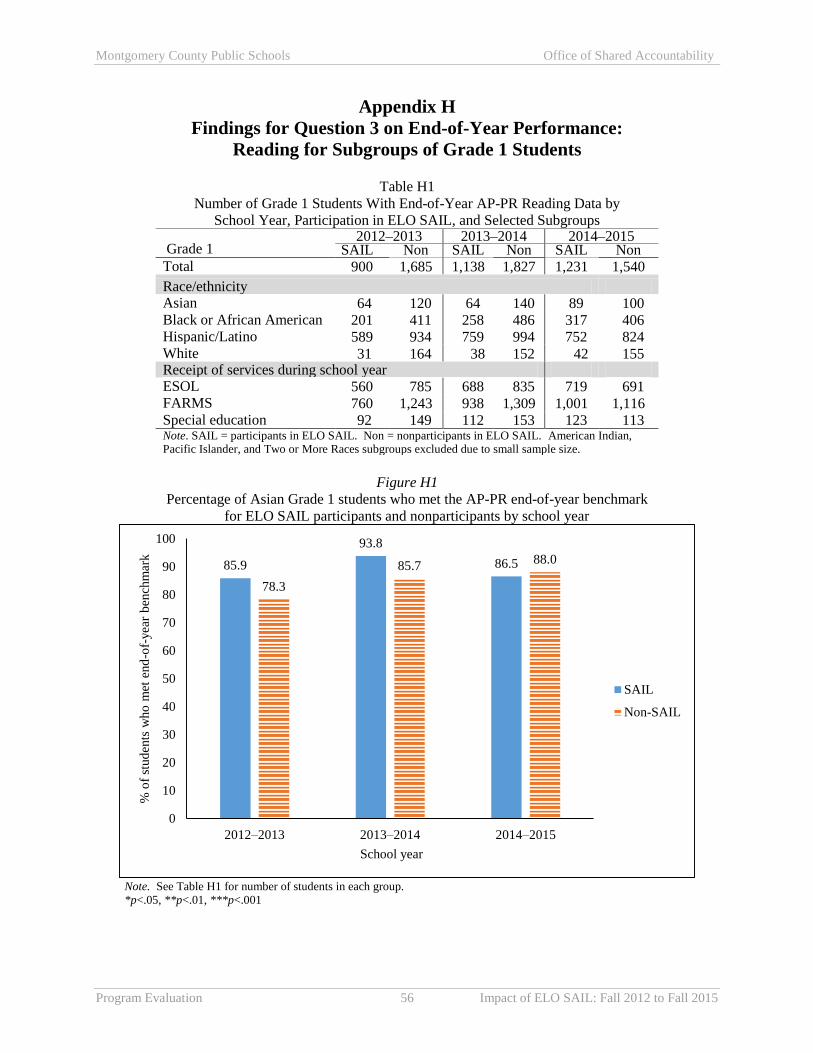
Montgomery County Public Schools Office of Shared Accountability
Program Evaluation 56 Impact of ELO SAIL: Fall 2012 to Fall 2015
Appendix H
Findings for Question 3 on End-of-Year Performance:
Reading for Subgroups of Grade 1 Students
Table H1
Number of Grade 1 Students With End-of-Year AP-PR Reading Data by
School Year, Participation in ELO SAIL, and Selected Subgroups
Grade 1 2012–2013 2013–2014 2014–2015
SAIL Non SAIL Non SAIL Non Total 900 1,685 1,138 1,827 1,231 1,540
Race/ethnicity Asian 64 120 64 140 89 100 Black or African American 201 411 258 486 317 406 Hispanic/Latino 589 934 759 994 752 824 White 31 164 38 152 42 155 Receipt of services during school year ESOL 560 785 688 835 719 691 FARMS 760 1,243 938 1,309 1,001 1,116 Special education 92 149 112 153 123 113 Note. SAIL = participants in ELO SAIL. Non = nonparticipants in ELO SAIL. American Indian, Pacific Islander, and Two or More Races subgroups excluded due to small sample size.
Figure H1
Percentage of Asian Grade 1 students who met the AP-PR end-of-year benchmark
for ELO SAIL participants and nonparticipants by school year
Note. See Table H1 for number of students in each group. *p<.05, **p<.01, ***p<.001
85.9
93.8
86.5
78.3
85.788.0
0
10
20
30
40
50
60
70
80
90
100
2012–2013 2013–2014 2014–2015
% o
f st
ud
ents
who
met
end
-of-
yea
r b
ench
mar
k
School year
SAIL
Non-SAIL

Montgomery County Public Schools Office of Shared Accountability
Program Evaluation 57 Impact of ELO SAIL: Fall 2012 to Fall 2015
Figure H2
Percentage of Black or African American Grade 1 students who met the AP-PR end-of-year benchmark
for ELO SAIL participants and nonparticipants by school year
Note. See Table H1 for number of students in each group. *p<.05, **p<.01, ***p<.001
Figure H3
Percentage of Hispanic/Latino Grade 1 students who met the AP-PR end-of-year benchmark
for ELO SAIL participants and nonparticipants by school year
Note. See Table H1 for number of students in each group. *p<.05, **p<.01, ***p<.001
85.680.6 81.481.3 81.9
78.1
0
10
20
30
40
50
60
70
80
90
100
2012–2013 2013–2014 2014–2015
% o
f st
ud
ents
who
met
end-o
f-yea
r b
ench
mar
k
School year
SAIL
Non-SAIL
67.163.8
61.466.6
61.7 62.7
0
10
20
30
40
50
60
70
80
90
100
2012–2013 2013–2014 2014–2015
% o
f st
ud
ents
who
met
end
-of-
yea
r b
ench
mar
k
School year
SAIL
Non-SAIL
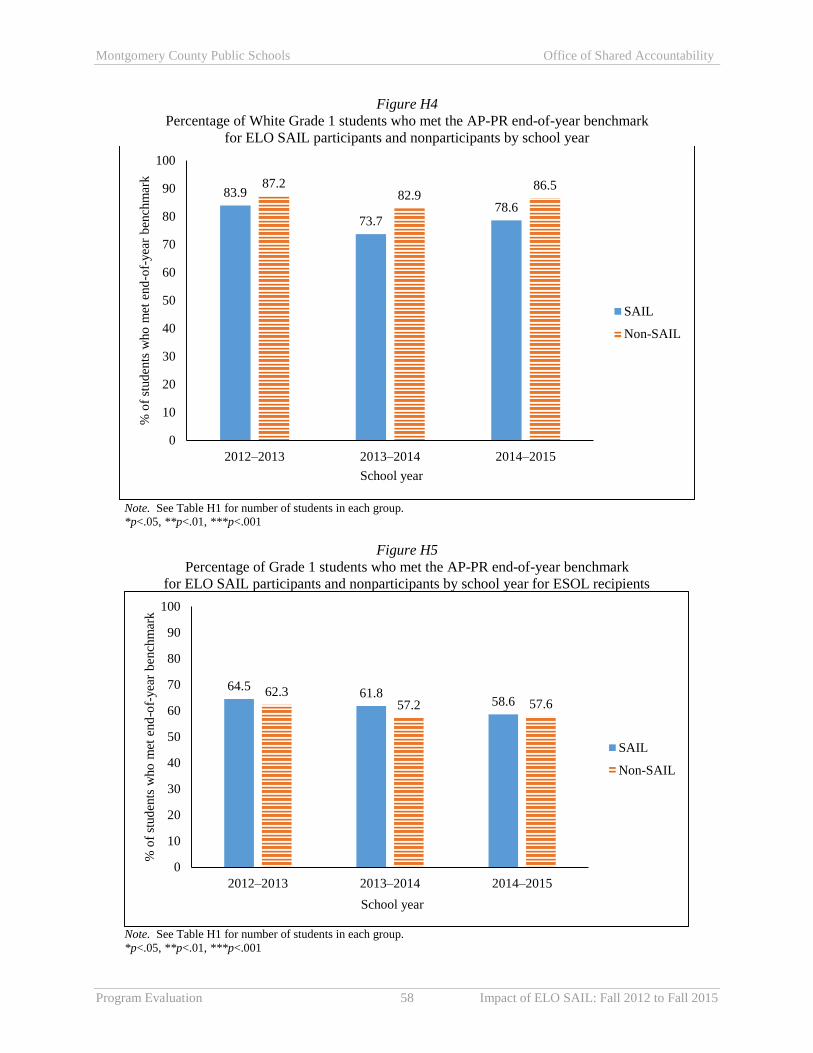
Montgomery County Public Schools Office of Shared Accountability
Program Evaluation 58 Impact of ELO SAIL: Fall 2012 to Fall 2015
Figure H4
Percentage of White Grade 1 students who met the AP-PR end-of-year benchmark
for ELO SAIL participants and nonparticipants by school year
Note. See Table H1 for number of students in each group. *p<.05, **p<.01, ***p<.001
Figure H5
Percentage of Grade 1 students who met the AP-PR end-of-year benchmark
for ELO SAIL participants and nonparticipants by school year for ESOL recipients
Note. See Table H1 for number of students in each group. *p<.05, **p<.01, ***p<.001
83.9
73.778.6
87.282.9
86.5
0
10
20
30
40
50
60
70
80
90
100
2012–2013 2013–2014 2014–2015
% o
f st
ud
ents
who
met
end
-of-
yea
r b
ench
mar
k
School year
SAIL
Non-SAIL
64.561.8
58.662.3
57.2 57.6
0
10
20
30
40
50
60
70
80
90
100
2012–2013 2013–2014 2014–2015
% o
f st
ud
ents
who
met
end
-of-
yea
r b
ench
mar
k
School year
SAIL
Non-SAIL

Montgomery County Public Schools Office of Shared Accountability
Program Evaluation 59 Impact of ELO SAIL: Fall 2012 to Fall 2015
Figure H6
Percentage of Grade 1 students who met the AP-PR end-of-year benchmark
for ELO SAIL participants and nonparticipants by school year for FARMS recipients
Note. See Table H1 for number of students in each group. *p<.05, **p<.01, ***p<.001
Figure H7
Percentage of Grade 1 students who met the AP-PR end-of-year benchmark
for ELO SAIL participants and nonparticipants by school year for special education recipients
Note. See Table H1 for number of students in each group. *p<.05, **p<.01, ***p<.001
71.366.7 67.069.0
65.6 66.7
0
10
20
30
40
50
60
70
80
90
100
2012–2013 2013–2014 2014–2015
% o
f st
ud
ents
who
met
end
-of-
yea
r b
ench
mar
k
School year
SAIL
Non-SAIL
43.540.2
31.726.2 28.1
36.3
0
10
20
30
40
50
60
70
80
90
100
2012–2013** 2013–2014* 2014–2015
% o
f st
ud
ents
who
met
end
-of-
yea
r b
ench
mar
k
School year
SAIL
Non-SAIL

Montgomery County Public Schools Office of Shared Accountability
Program Evaluation 60 Impact of ELO SAIL: Fall 2012 to Fall 2015
Appendix I
Findings for Question 3 on End-of-Year Performance:
Reading for Subgroups of Grade 2 Students
Table I1
Number of Grade 2 Students With End-of-Year AP-PR Reading Data by
School Year, Participation in ELO SAIL, and Selected Subgroups
Grade 2 2012–2013 2013–2014 2014–2015
SAIL Non SAIL Non SAIL Non Total 755 1,504 1,022 1,821 1,142 1,626
Race/ethnicity Asian 63 134 75 133 62 111 Black or African American 172 368 238 475 282 394 Hispanic/Latino 492 816 672 969 761 919 White 17 140 24 178 24 143 Receipt of services during school year ESOL 475 715 618 793 655 721 FARMS 639 1,065 870 1,315 960 1,164 Special education 74 132 125 176 136 135 Note. SAIL = participants in ELO SAIL. Non = nonparticipants in ELO SAIL. American Indian, Pacific Islander, and Two or More Races subgroups excluded due to small sample size.
Figure I1
Percentage of Asian Grade 2 students who met the AP-PR end-of-year benchmark
for ELO SAIL participants and nonparticipants by school year
Note. See Table I1 for number of students in each group.
*p<.05, **p<.01, ***p<.001
82.5 82.7 82.380.6
70.7
78.4
0
10
20
30
40
50
60
70
80
90
100
2012–2013 2013–2014 2014–2015
% o
f st
ud
ents
who
met
end
-of-
yea
r b
ench
mar
k
School year
SAIL
Non-SAIL

Montgomery County Public Schools Office of Shared Accountability
Program Evaluation 61 Impact of ELO SAIL: Fall 2012 to Fall 2015
Figure I2
Percentage of Black or African American Grade 2 students who met the AP-PR end-of-year benchmark
for ELO SAIL participants and nonparticipants by school year
Note. See Table I1 for number of students in each group.
*p<.05, **p<.01, ***p<.001
Figure I3
Percentage of Hispanic/Latino Grade 2 students who met the AP-PR end-of-year benchmark
for ELO SAIL participants and nonparticipants by school year
Note. See Table I1 for number of students in each group.
*p<.05, **p<.01, ***p<.001
70.374.4 75.573.4
67.872.8
0
10
20
30
40
50
60
70
80
90
100
2012–2013 2013–2014 2014–2015
% o
f st
ud
ents
who
met
end
-of-
yea
r b
ench
mar
k
School year
SAIL
Non-SAIL
62.859.5 58.660.4
56.9 54.7
0
10
20
30
40
50
60
70
80
90
100
2012–2013 2013–2014 2014–2015
% o
f st
ud
ents
who
met
end
-of-
yea
r b
ench
mar
k
School year
SAIL
Non-SAIL
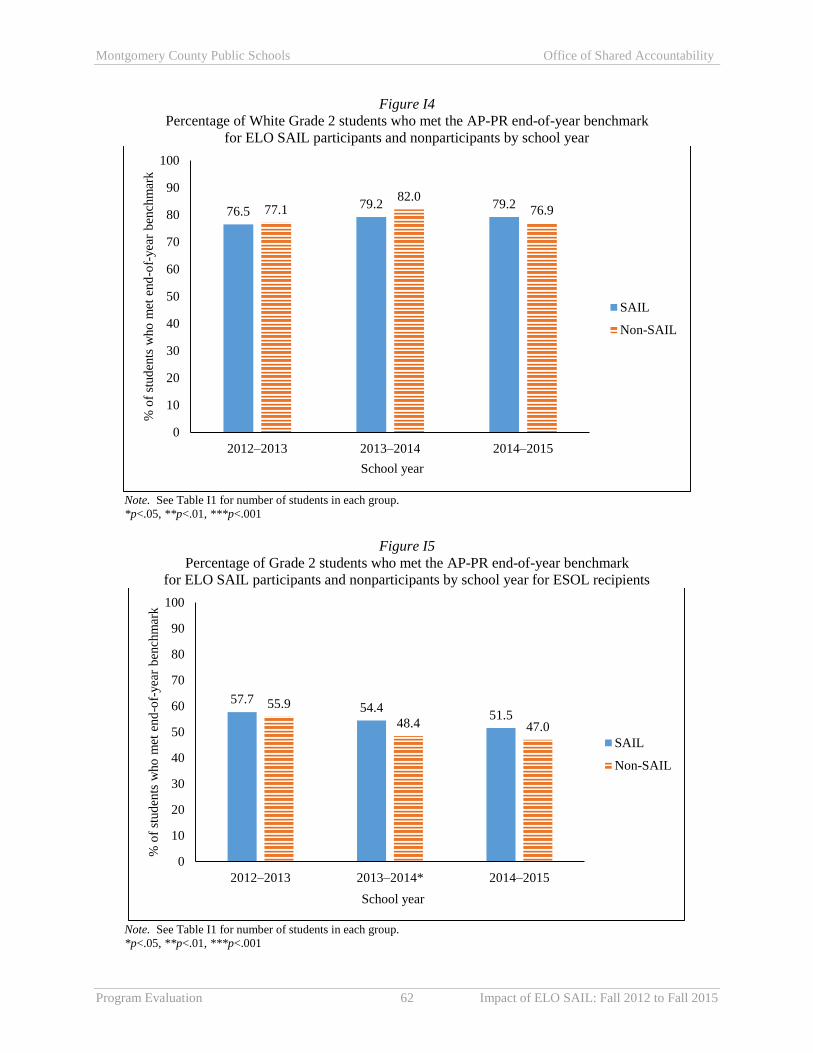
Montgomery County Public Schools Office of Shared Accountability
Program Evaluation 62 Impact of ELO SAIL: Fall 2012 to Fall 2015
Figure I4
Percentage of White Grade 2 students who met the AP-PR end-of-year benchmark
for ELO SAIL participants and nonparticipants by school year
Note. See Table I1 for number of students in each group.
*p<.05, **p<.01, ***p<.001
Figure I5
Percentage of Grade 2 students who met the AP-PR end-of-year benchmark
for ELO SAIL participants and nonparticipants by school year for ESOL recipients
Note. See Table I1 for number of students in each group.
*p<.05, **p<.01, ***p<.001
76.579.2 79.277.1
82.076.9
0
10
20
30
40
50
60
70
80
90
100
2012–2013 2013–2014 2014–2015
% o
f st
ud
ents
who
met
end
-of-
yea
r b
ench
mar
k
School year
SAIL
Non-SAIL
57.754.4
51.555.9
48.4 47.0
0
10
20
30
40
50
60
70
80
90
100
2012–2013 2013–2014* 2014–2015
% o
f st
ud
ents
who
met
end
-of-
yea
r b
ench
mar
k
School year
SAIL
Non-SAIL

Montgomery County Public Schools Office of Shared Accountability
Program Evaluation 63 Impact of ELO SAIL: Fall 2012 to Fall 2015
Figure I6
Percentage of Grade 2 students who met the AP-PR end-of-year benchmark
for ELO SAIL participants and nonparticipants by school year for FARMS recipients
Note. See Table I1 for number of students in each group.
*p<.05, **p<.01, ***p<.001
Figure I7
Percentage of Grade 2 students who met the AP-PR end-of-year benchmark
for ELO SAIL participants and nonparticipants by school year for special education recipients
Note. See Table I1 for number of students in each group.
*p<.05, **p<.01, ***p<.001
63.5 62.9 61.562.358.6 58.4
0
10
20
30
40
50
60
70
80
90
100
2012–2013 2013–2014* 2014–2015
% o
f st
ud
ents
who
met
end
-of-
yea
r b
ench
mar
k
School year
SAIL
Non-SAIL
23.0 23.218.4
26.5 28.4
21.5
0
10
20
30
40
50
60
70
80
90
100
2012–2013 2013–2014 2014–2015
% o
f st
ud
ents
who
met
end
-of-
yea
r b
ench
mar
k
School year
SAIL
Non-SAIL

Montgomery County Public Schools Office of Shared Accountability
Program Evaluation 64 Impact of ELO SAIL: Fall 2012 to Fall 2015
Appendix J
Findings for Question 3 on End-of-Year Performance:
Mathematics for Subgroups of Kindergarten Students
Table J1
Number of Kindergarten Students With End-of-Year MAP-P RIT Score in Mathematics
by School Year, Participation in ELO SAIL, and Selected Subgroups
Kindergarten
2012–2013 2013–2014 2014–2015
SAIL Non SAIL Non SAIL Non
Total 958 1,675 1,098 1,835 1,338 1,445
Race/ethnicity
Asian 59 118 72 137 62 81
Black or African American 196 414 250 471 325 347
Hispanic/Latino 650 932 708 962 888 827
White 34 161 43 185 39 144
Receipt of services during school year
ESOL 671 965 773 1,011 942 820
FARMS 796 1,197 905 1,303 1,115 1,023
Special education 99 149 87 173 123 105 Note. SAIL = participants in ELO SAIL. Non = nonparticipants in ELO SAIL. American Indian, Pacific
Islander, and Two or More Races subgroups excluded due to small sample size.
Figure J1
Mean end-of-year MAP-P RIT scores in mathematics for Asian kindergarten students
by participation in ELO SAIL and school year
Note. See Table J1 for number of students in each group. *p<.05, **p<.01, ***p<.001
158.90159.74 159.27
160.04
161.96160.86
140
145
150
155
160
165
170
2012–2013 2013–2014 2014–2015
Mea
n e
nd
-of-
yea
r R
IT m
ath s
core
School year
SAIL
Non-SAIL
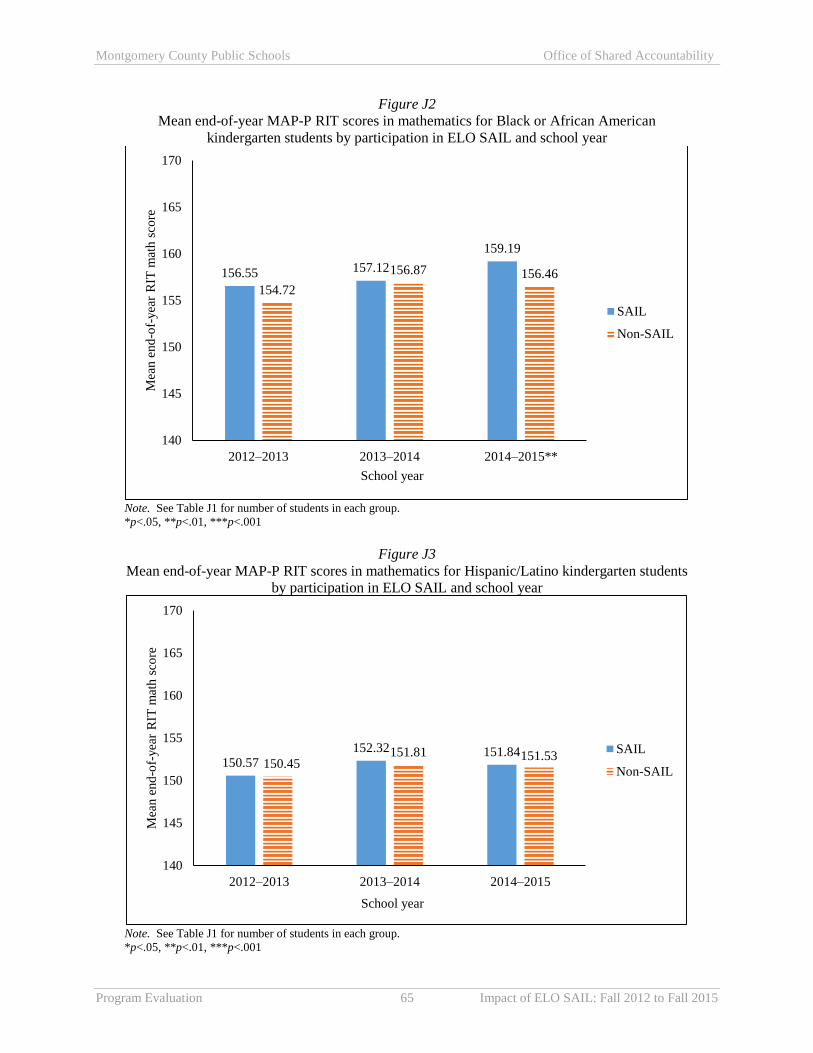
Montgomery County Public Schools Office of Shared Accountability
Program Evaluation 65 Impact of ELO SAIL: Fall 2012 to Fall 2015
Figure J2
Mean end-of-year MAP-P RIT scores in mathematics for Black or African American
kindergarten students by participation in ELO SAIL and school year
Note. See Table J1 for number of students in each group. *p<.05, **p<.01, ***p<.001
Figure J3
Mean end-of-year MAP-P RIT scores in mathematics for Hispanic/Latino kindergarten students
by participation in ELO SAIL and school year
Note. See Table J1 for number of students in each group. *p<.05, **p<.01, ***p<.001
156.55 157.12
159.19
154.72
156.87 156.46
140
145
150
155
160
165
170
2012–2013 2013–2014 2014–2015**
Mea
n e
nd
-of-
yea
r R
IT m
ath s
core
School year
SAIL
Non-SAIL
150.57152.32 151.84
150.45151.81 151.53
140
145
150
155
160
165
170
2012–2013 2013–2014 2014–2015
Mea
n e
nd
-of-
yea
r R
IT m
ath s
core
School year
SAIL
Non-SAIL

Montgomery County Public Schools Office of Shared Accountability
Program Evaluation 66 Impact of ELO SAIL: Fall 2012 to Fall 2015
Figure J4
Mean end-of-year MAP-P RIT scores in mathematics for White kindergarten students
by participation in ELO SAIL and school year
Note. See Table J1 for number of students in each group. *p<.05, **p<.01, ***p<.001
Figure J5
Mean end-of-year MAP-P RIT scores in mathematics for kindergarten students
who receive ESOL services by participation in ELO SAIL and school year
Note. See Table J1 for number of students in each group. *p<.05, **p<.01, ***p<.001
157.24
163.09 162.59162.11
167.89 167.72
140
145
150
155
160
165
170
2012–2013 2013–2014 2014–2015*
Mea
n e
nd
-of-
yea
r R
IT m
ath s
core
School year
SAIL
Non-SAIL
150.21
152.21 152.07
150.00
151.71150.89
140
145
150
155
160
165
170
2012–2013 2013–2014 2014–2015
Mea
n e
nd
-of-
yea
r R
IT m
ath s
core
School year
SAIL
Non-SAIL

Montgomery County Public Schools Office of Shared Accountability
Program Evaluation 67 Impact of ELO SAIL: Fall 2012 to Fall 2015
Figure J6
Mean end-of-year MAP-P RIT scores in mathematics for kindergarten students
who receive FARMS services by participation in ELO SAIL and school year
Note. See Table J1 for number of students in each group. *p<.05, **p<.01, ***p<.001
Figure J7
Mean end-of-year MAP-P RIT scores in mathematics for kindergarten students
who receive special education services by participation in ELO SAIL and school year
Note. See Table J1 for number of students in each group. *p<.05, **p<.01, ***p<.001
151.76153.44 153.64
151.00
152.85 152.16
140
145
150
155
160
165
170
2012–2013 2013–2014 2014–2015**
Mea
n e
nd
-of-
yea
r R
IT m
ath s
core
School year
SAIL
Non-SAIL
147.68 148.30
146.48147.05148.50 148.28
140
145
150
155
160
165
170
2012–2013 2013–2014 2014–2015
Mea
n e
nd
-of-
yea
r R
IT m
ath s
core
School year
SAIL
Non-SAIL
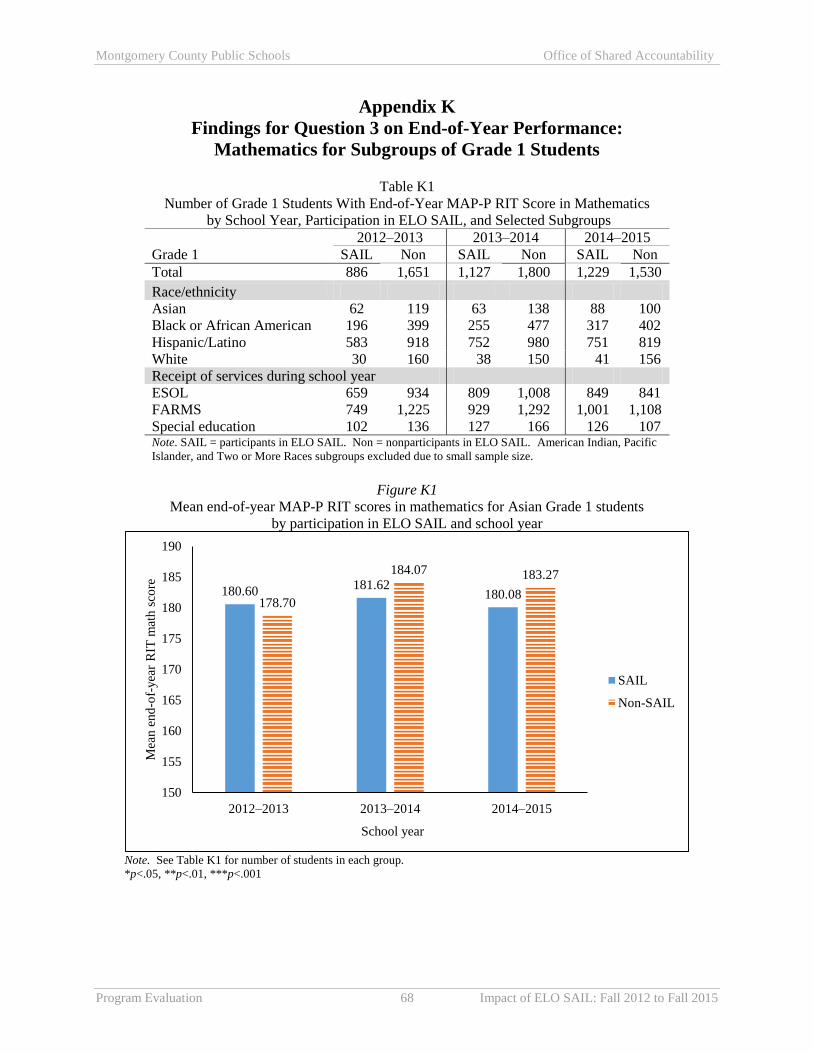
Montgomery County Public Schools Office of Shared Accountability
Program Evaluation 68 Impact of ELO SAIL: Fall 2012 to Fall 2015
Appendix K
Findings for Question 3 on End-of-Year Performance:
Mathematics for Subgroups of Grade 1 Students
Table K1
Number of Grade 1 Students With End-of-Year MAP-P RIT Score in Mathematics
by School Year, Participation in ELO SAIL, and Selected Subgroups
Grade 1
2012–2013 2013–2014 2014–2015
SAIL Non SAIL Non SAIL Non
Total 886 1,651 1,127 1,800 1,229 1,530
Race/ethnicity
Asian 62 119 63 138 88 100
Black or African American 196 399 255 477 317 402
Hispanic/Latino 583 918 752 980 751 819
White 30 160 38 150 41 156
Receipt of services during school year
ESOL 659 934 809 1,008 849 841
FARMS 749 1,225 929 1,292 1,001 1,108
Special education 102 136 127 166 126 107 Note. SAIL = participants in ELO SAIL. Non = nonparticipants in ELO SAIL. American Indian, Pacific
Islander, and Two or More Races subgroups excluded due to small sample size.
Figure K1
Mean end-of-year MAP-P RIT scores in mathematics for Asian Grade 1 students
by participation in ELO SAIL and school year
Note. See Table K1 for number of students in each group. *p<.05, **p<.01, ***p<.001
180.60181.62
180.08178.70
184.07 183.27
150
155
160
165
170
175
180
185
190
2012–2013 2013–2014 2014–2015
Mea
n e
nd
-of-
yea
r R
IT m
ath s
core
School year
SAIL
Non-SAIL
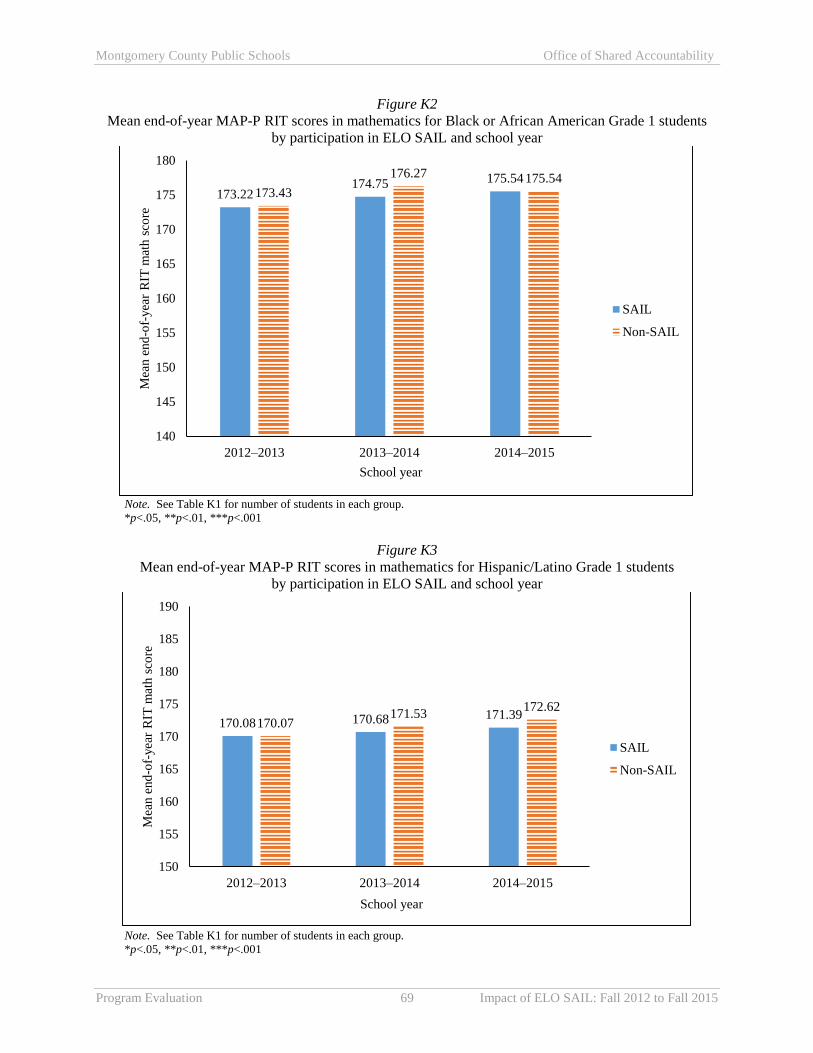
Montgomery County Public Schools Office of Shared Accountability
Program Evaluation 69 Impact of ELO SAIL: Fall 2012 to Fall 2015
Figure K2
Mean end-of-year MAP-P RIT scores in mathematics for Black or African American Grade 1 students
by participation in ELO SAIL and school year
Note. See Table K1 for number of students in each group. *p<.05, **p<.01, ***p<.001
Figure K3
Mean end-of-year MAP-P RIT scores in mathematics for Hispanic/Latino Grade 1 students
by participation in ELO SAIL and school year
Note. See Table K1 for number of students in each group. *p<.05, **p<.01, ***p<.001
173.22174.75 175.54
173.43
176.27 175.54
140
145
150
155
160
165
170
175
180
2012–2013 2013–2014 2014–2015
Mea
n e
nd
-of-
yea
r R
IT m
ath s
core
School year
SAIL
Non-SAIL
170.08 170.68 171.39170.07
171.53172.62
150
155
160
165
170
175
180
185
190
2012–2013 2013–2014 2014–2015
Mea
n e
nd
-of-
yea
r R
IT m
ath s
core
School year
SAIL
Non-SAIL
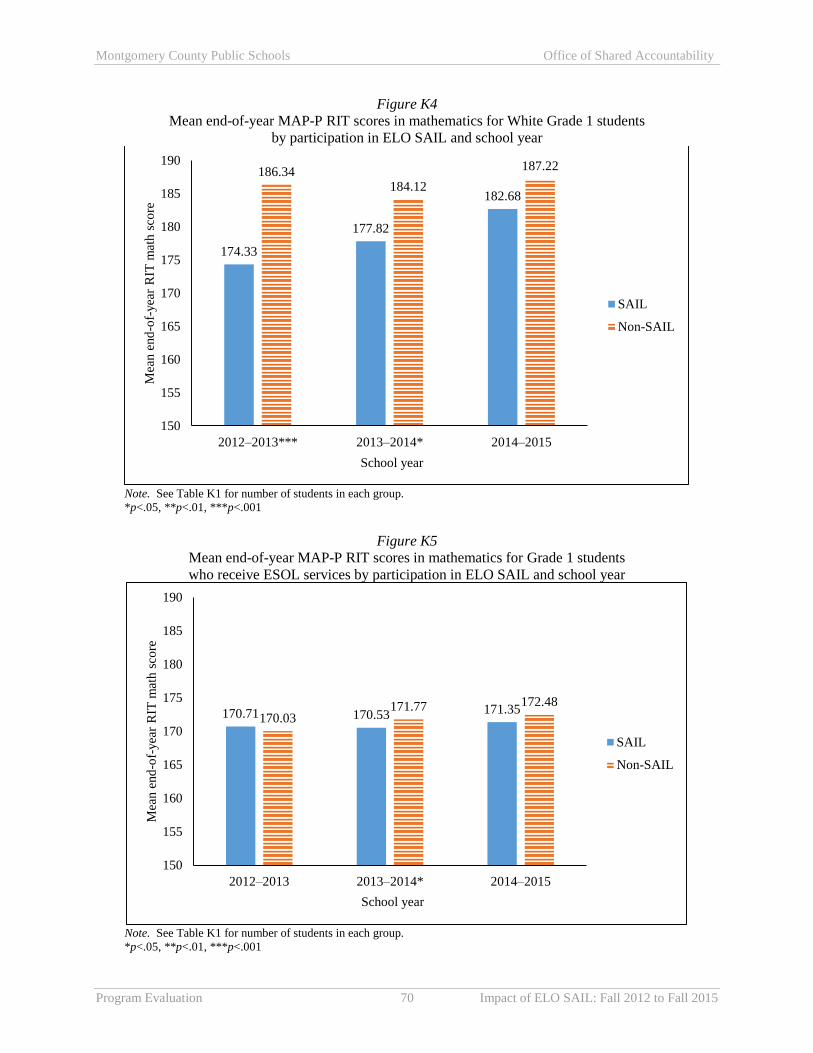
Montgomery County Public Schools Office of Shared Accountability
Program Evaluation 70 Impact of ELO SAIL: Fall 2012 to Fall 2015
Figure K4
Mean end-of-year MAP-P RIT scores in mathematics for White Grade 1 students
by participation in ELO SAIL and school year
Note. See Table K1 for number of students in each group. *p<.05, **p<.01, ***p<.001
Figure K5
Mean end-of-year MAP-P RIT scores in mathematics for Grade 1 students
who receive ESOL services by participation in ELO SAIL and school year
Note. See Table K1 for number of students in each group. *p<.05, **p<.01, ***p<.001
174.33
177.82
182.68
186.34184.12
187.22
150
155
160
165
170
175
180
185
190
2012–2013*** 2013–2014* 2014–2015
Mea
n e
nd
-of-
yea
r R
IT m
ath s
core
School year
SAIL
Non-SAIL
170.71 170.53 171.35170.03
171.77 172.48
150
155
160
165
170
175
180
185
190
2012–2013 2013–2014* 2014–2015
Mea
n e
nd
-of-
yea
r R
IT m
ath s
core
School year
SAIL
Non-SAIL
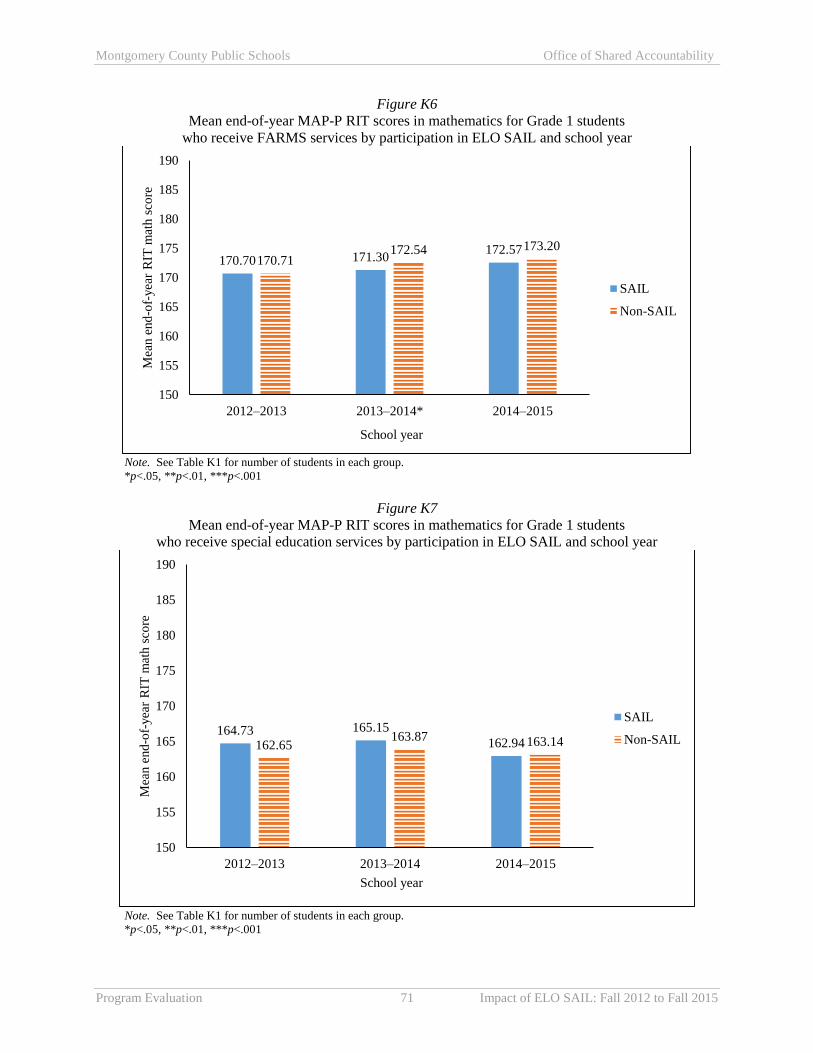
Montgomery County Public Schools Office of Shared Accountability
Program Evaluation 71 Impact of ELO SAIL: Fall 2012 to Fall 2015
Figure K6
Mean end-of-year MAP-P RIT scores in mathematics for Grade 1 students
who receive FARMS services by participation in ELO SAIL and school year
Note. See Table K1 for number of students in each group. *p<.05, **p<.01, ***p<.001
Figure K7
Mean end-of-year MAP-P RIT scores in mathematics for Grade 1 students
who receive special education services by participation in ELO SAIL and school year
Note. See Table K1 for number of students in each group. *p<.05, **p<.01, ***p<.001
170.70 171.30172.57
170.71172.54 173.20
150
155
160
165
170
175
180
185
190
2012–2013 2013–2014* 2014–2015
Mea
n e
nd
-of-
yea
r R
IT m
ath s
core
School year
SAIL
Non-SAIL
164.73 165.15
162.94162.65163.87 163.14
150
155
160
165
170
175
180
185
190
2012–2013 2013–2014 2014–2015
Mea
n e
nd-o
f-yea
r R
IT m
ath s
core
School year
SAIL
Non-SAIL
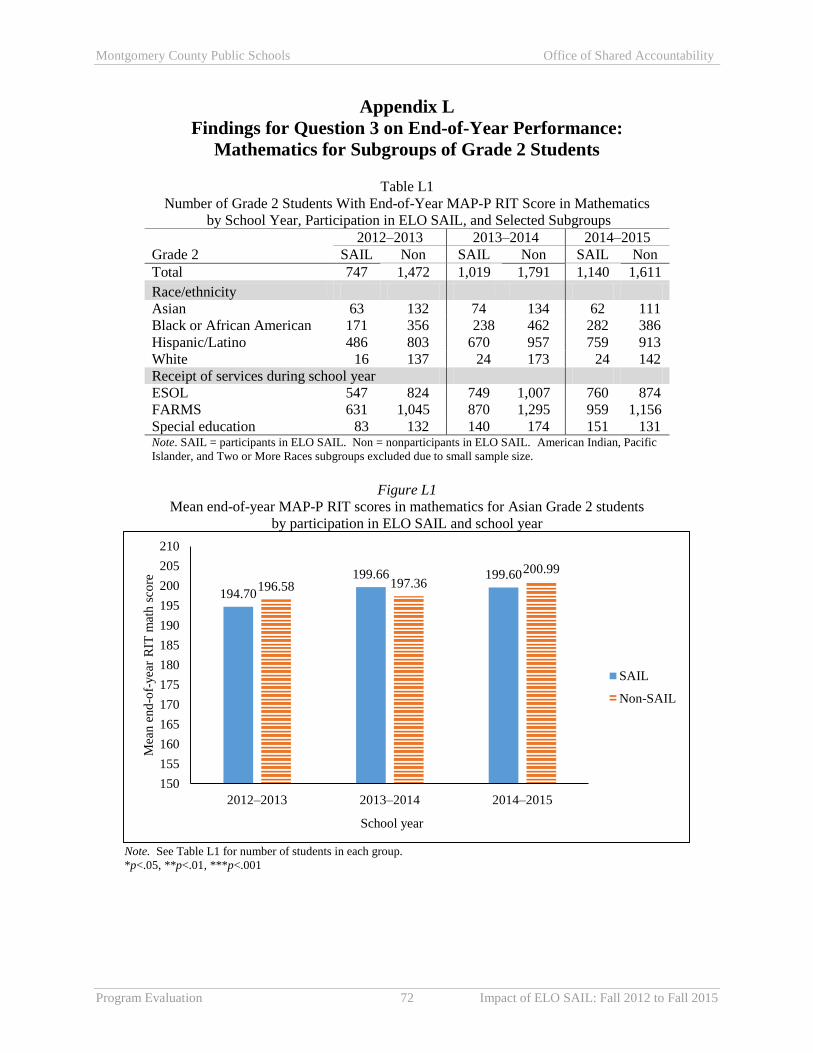
Montgomery County Public Schools Office of Shared Accountability
Program Evaluation 72 Impact of ELO SAIL: Fall 2012 to Fall 2015
Appendix L
Findings for Question 3 on End-of-Year Performance:
Mathematics for Subgroups of Grade 2 Students
Table L1
Number of Grade 2 Students With End-of-Year MAP-P RIT Score in Mathematics
by School Year, Participation in ELO SAIL, and Selected Subgroups
Grade 2
2012–2013 2013–2014 2014–2015
SAIL Non SAIL Non SAIL Non
Total 747 1,472 1,019 1,791 1,140 1,611
Race/ethnicity
Asian 63 132 74 134 62 111
Black or African American 171 356 238 462 282 386
Hispanic/Latino 486 803 670 957 759 913
White 16 137 24 173 24 142
Receipt of services during school year
ESOL 547 824 749 1,007 760 874
FARMS 631 1,045 870 1,295 959 1,156
Special education 83 132 140 174 151 131 Note. SAIL = participants in ELO SAIL. Non = nonparticipants in ELO SAIL. American Indian, Pacific
Islander, and Two or More Races subgroups excluded due to small sample size.
Figure L1
Mean end-of-year MAP-P RIT scores in mathematics for Asian Grade 2 students
by participation in ELO SAIL and school year
Note. See Table L1 for number of students in each group.
*p<.05, **p<.01, ***p<.001
194.70
199.66 199.60196.58 197.36
200.99
150
155
160
165
170
175
180
185
190
195
200
205
210
2012–2013 2013–2014 2014–2015
Mea
n e
nd
-of-
yea
r R
IT m
ath s
core
School year
SAIL
Non-SAIL

Montgomery County Public Schools Office of Shared Accountability
Program Evaluation 73 Impact of ELO SAIL: Fall 2012 to Fall 2015
Figure L2
Mean end-of-year MAP-P RIT scores in mathematics for Black or African American Grade 2 students
by participation in ELO SAIL and school year
Note. See Table L1 for number of students in each group.
*p<.05, **p<.01, ***p<.001
Figure L3
Mean end-of-year MAP-P RIT scores in mathematics for Hispanic/Latino Grade 2 students
by participation in ELO SAIL and school year
Note. See Table L1 for number of students in each group.
*p<.05, **p<.01, ***p<.001
186.91
192.14194.47
188.19191.15 192.09
150
155
160
165
170
175
180
185
190
195
200
205
210
2012–2013 2013–2014 2014–2015*
Mea
n e
nd
-of-
yea
r R
IT m
ath s
core
School year
SAIL
Non-SAIL
184.14187.54 187.69
185.41188.37 189.05
150
155
160
165
170
175
180
185
190
195
200
205
210
2012–2013 2013–2014 2014–2015
Mea
n e
nd
-of-
yea
r R
IT m
ath s
core
School year
SAIL
Non-SAIL
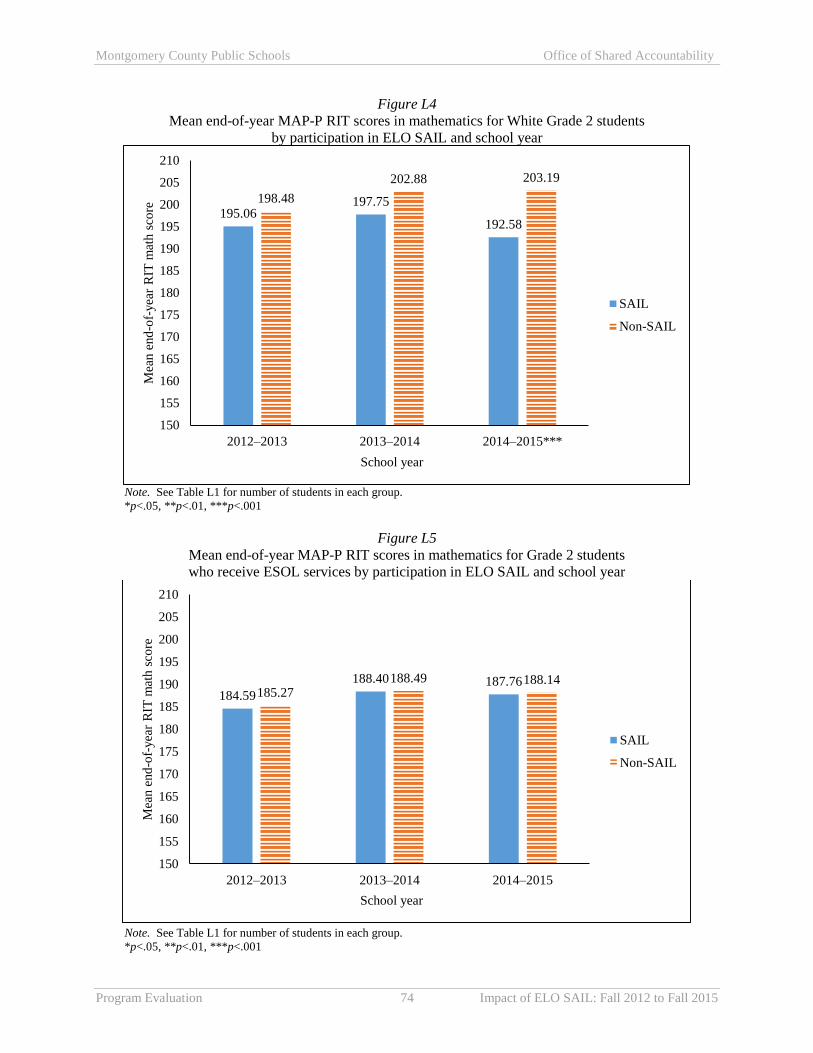
Montgomery County Public Schools Office of Shared Accountability
Program Evaluation 74 Impact of ELO SAIL: Fall 2012 to Fall 2015
Figure L4
Mean end-of-year MAP-P RIT scores in mathematics for White Grade 2 students
by participation in ELO SAIL and school year
Note. See Table L1 for number of students in each group.
*p<.05, **p<.01, ***p<.001
Figure L5
Mean end-of-year MAP-P RIT scores in mathematics for Grade 2 students
who receive ESOL services by participation in ELO SAIL and school year
Note. See Table L1 for number of students in each group.
*p<.05, **p<.01, ***p<.001
195.06197.75
192.58
198.48
202.88 203.19
150
155
160
165
170
175
180
185
190
195
200
205
210
2012–2013 2013–2014 2014–2015***
Mea
n e
nd
-of-
yea
r R
IT m
ath s
core
School year
SAIL
Non-SAIL
184.59
188.40 187.76185.27
188.49 188.14
150
155
160
165
170
175
180
185
190
195
200
205
210
2012–2013 2013–2014 2014–2015
Mea
n e
nd
-of-
yea
r R
IT m
ath s
core
School year
SAIL
Non-SAIL

Montgomery County Public Schools Office of Shared Accountability
Program Evaluation 75 Impact of ELO SAIL: Fall 2012 to Fall 2015
Figure L6
Mean end-of-year MAP-P RIT scores in mathematics for Grade 2 students
who receive FARMS services by participation in ELO SAIL and school year
Note. See Table L1 for number of students in each group.
*p<.05, **p<.01, ***p<.001
Figure L7
Mean end-of-year MAP-P RIT scores in mathematics for Grade 2 students
who receive special education services by participation in ELO SAIL and school year
Note. See Table L1 for number of students in each group.
*p<.05, **p<.01, ***p<.001
184.81
188.59 188.87185.57
188.84 188.99
150
155
160
165
170
175
180
185
190
195
200
205
210
2012–2013 2013–2014 2014–2015
Mea
n e
nd
-of-
yea
r R
IT m
ath s
core
School year
SAIL
Non-SAIL
174.30
177.65 178.47179.05 179.76
174.60
150
155
160
165
170
175
180
185
190
195
200
205
210
2012–2013* 2013–2014 2014–2015
Mea
n e
nd
-of-
yea
r R
IT m
ath s
core
School year
SAIL
Non-SAIL