Impact of Static and Dynamic Load Model on the Low … of the Doubly-Fed Induction Generator Wind...
10
Impact of Static and Dynamic Load Model on the Low Voltage Ride- Through of the Doubly-Fed Induction Generator Wind Farm ABDELAZIZ SALAH SAIDI 1,2 , MOHAMMED IBRAHIM Y. AL-RAYIF 2 1 Electric Systems Laboratory, National Engineering School of Tunis, ENIT Tunis, TUNISIA 1,2 King Khalid University, Electrical Engineering Department, Abha, SAUDI ARABIA [email protected] Abstract: - The increasing penetration of load model in distribution systems may significantly affect voltage stability of the systems, particularly during Low Voltage Ride-Through (LVRT) wind turbine. The main objective of this work is to present the impact of different static and dynamic load models, on the LVRT recovery after disturbances. A component and composite loading structures are considered, comprising static, dynamic motor and a composite model. Motor loads are assessed with respect to their mechanical loads. The polynomial load model using load class and load type is investigated thoroughly under various operating conditions. The present paper examines the effect of nonlinear loads as well as different mechanical torque and inertia of induction motor loads on the transient stability and observing the fault recovery performance of the Doubly-Fed Induction Generator (DFIG) wind turbine system. The dynamic impacts between wind turbines (WTs) and motor loads are also examined. The complete system is modeled and simulated using PSAT/MATLAB software environment in such a way that it can be suited for modeling of all types of loads configurations. The LVRT capability is investigated and the results of voltage dip ride-through simulations are presented for both static and dynamic load. Key-Words: - Low Voltage Ride-Through, doubly-fed induction generator wind turbine, static load, dynamic load, composite load modeling, transient stability. 1 Introduction As the wind power penetration continue to increase its share of total energy production, its impacts on gird stability has been an important issue. Therefore, wind farms will have to continue to operate during system disturbances and support the network voltage and frequency without compromising the power quality as well as the security and reliability of the electric power system [1]. Network design codes are revised to reflect this new requirement. Grid codes specify that wind farms must contribute to power system control, as much as conventional power generation stations and withstanding of wind system during abnormal condition. Such requirements are known as Fault Ride- Through at the Point of Common Coupling (PCC) for wind farms or Low Voltage Ride-Through capability for wind turbine generators [2-3]. Low voltage ride through addresses mainly the design of the wind turbine controller in such a way that the wind turbine is able to remain connected to the system in presence of grid voltage dip. It is required for the LVRT capability of the wind farm that the wind generators must not be disconnected from the grid during fault persistence either due to over-speeding or under voltage protections. After the clearing of the fault that leads to the voltage dip, the voltage at the wind turbine bus increases. It is also required that the wind generators should resume their power supply to the network without losing stability. Upon voltage recovery, the wind turbines must not consume excessive reactive power when re-exciting the generator, as this may result in a further voltage dip. A summary of the voltage profile for ride-through capabilities in the German E. ON Netz grid codes is shown in Fig. 1 [4-5]. It is usually described by a Voltage versus time characteristic, depicting the minimum required protection characteristics of the wind farm to the system voltage sags. According to this requirement, the LVRT restrictions given by the WSEAS TRANSACTIONS on POWER SYSTEMS Abdelaziz Salah Saidi, Mohammed Ibrahim Y. Al-Rayif E-ISSN: 2224-350X 1 Volume 12, 2017
Transcript of Impact of Static and Dynamic Load Model on the Low … of the Doubly-Fed Induction Generator Wind...

Impact of Static and Dynamic Load Model on the Low Voltage Ride-Through of the Doubly-Fed Induction Generator Wind Farm
ABDELAZIZ SALAH SAIDI1,2, MOHAMMED IBRAHIM Y. AL-RAYIF2 1Electric Systems Laboratory, National Engineering School of Tunis, ENIT Tunis, TUNISIA 1,2 King Khalid University, Electrical Engineering Department, Abha, SAUDI ARABIA
Abstract: - The increasing penetration of load model in distribution systems may significantly affect voltage stability of the systems, particularly during Low Voltage Ride-Through (LVRT) wind turbine. The main objective of this work is to present the impact of different static and dynamic load models, on the LVRT recovery after disturbances. A component and composite loading structures are considered, comprising static, dynamic motor and a composite model. Motor loads are assessed with respect to their mechanical loads. The polynomial load model using load class and load type is investigated thoroughly under various operating conditions. The present paper examines the effect of nonlinear loads as well as different mechanical torque and inertia of induction motor loads on the transient stability and observing the fault recovery performance of the Doubly-Fed Induction Generator (DFIG) wind turbine system. The dynamic impacts between wind turbines (WTs) and motor loads are also examined. The complete system is modeled and simulated using PSAT/MATLAB software environment in such a way that it can be suited for modeling of all types of loads configurations. The LVRT capability is investigated and the results of voltage dip ride-through simulations are presented for both static and dynamic load.
Key-Words: - Low Voltage Ride-Through, doubly-fed induction generator wind turbine, static load, dynamic load, composite load modeling, transient stability.
1 Introduction As the wind power penetration continue to
increase its share of total energy production, its impacts on gird stability has been an important issue. Therefore, wind farms will have to continue to operate during system disturbances and support the network voltage and frequency without compromising the power quality as well as the security and reliability of the electric power system [1]. Network design codes are revised to reflect this new requirement. Grid codes specify that wind farms must contribute to power system control, as much as conventional power generation stations and withstanding of wind system during abnormal condition.
Such requirements are known as Fault Ride-Through at the Point of Common Coupling (PCC) for wind farms or Low Voltage Ride-Through capability for wind turbine generators [2-3]. Low voltage ride through addresses mainly the design of the wind turbine controller in such a way that the wind turbine
is able to remain connected to the system in presence of grid voltage dip. It is required for the LVRT capability of the wind farm that the wind generators must not be disconnected from the grid during fault persistence either due to over-speeding or under voltage protections. After the clearing of the fault that leads to the voltage dip, the voltage at the wind turbine bus increases. It is also required that the wind generators should resume their power supply to the network without losing stability. Upon voltage recovery, the wind turbines must not consume excessive reactive power when re-exciting the generator, as this may result in a further voltage dip.
A summary of the voltage profile for ride-through capabilities in the German E. ON Netz grid codes is shown in Fig. 1 [4-5]. It is usually described by a Voltage versus time characteristic, depicting the minimum required protection characteristics of the wind farm to the system voltage sags. According to this requirement, the LVRT restrictions given by the
WSEAS TRANSACTIONS on POWER SYSTEMS Abdelaziz Salah Saidi, Mohammed Ibrahim Y. Al-Rayif
E-ISSN: 2224-350X 1 Volume 12, 2017

German grid code establish two different border lines that the WTG must accomplish to interconnect with the grid. In case of dips above the limit line of Fig. 1, all wind turbines facilities must pass through the fault without being disconnected from the grid network. The wind turbines should afford LVRT capability for grid faults resulting in voltage drop of 85%, which is a major requirement of grid codes. To contribute to the stability of system, they should stay connected to the system. Moreover, to support voltage recovery they should supply reactive power [6-7]. This requirement became essential due to the fact that thousands of MW wind power were at risk of being lost. If the measured voltage is below the limit line, the turbines are allowed to be disconnected.
Variable-speed wind turbines based on doubly-fed induction generators is one of the most frequently deployed large grid-connected wind turbines due to their advanced reactive power and voltage control capability [8]. DFIGs make use of power electronic converters and are, thus, able to regulate their own reactive power in order to operate at a given power factor or to control the grid voltage. However, DFIG-based WTs are very sensitive to grid disturbances, especially to voltage dips [9].
To ensure the security and reliability of the grid with the new generation of wind turbines in distribution networks, a number of issues should be investigated before connecting large-scale wind turbines units into existing systems as system behavior depends on the wind turbines technology.
Many researchers have made significant effort to evaluate the problem of the interaction between wind turbines and the electric grid. Papers by [10-11] deal with the interaction analysis of a wind generator with the transmission power grids during normal operation and during transient grid fault events. The main focus of these research is to observe the interaction between the wind turbines and the local distribution grid regarding power quality, voltage fluctuations, mechanical system, the Low Voltage Ride-Through capability and the ability to protect the wind turbines without disconnection during grid faults.
From the knowledge gained from the above research studies, these simulations did not provide a detailed insight on the interaction between the wind turbine and the load models. As generation is closer to the consumer, the interaction between the wind turbines and load characteristics affects the operation of the distribution systems. Most of the studies in
distribution network has analysed the impact of wind power penetration in the system considering static load models for simplicity [12-13].
However, static load models are not accurate enough to represent the behaviour of the load and to capture all dynamics of the network [14]. In reality, distribution networks with wind generators have composite loads which are composed of both static and dynamic elements [15-16].
One important contribution of this research is carrying out our dynamic analysis with aggregated variable speed wind turbines based on DFIG and composite load model. Composite loads responses are dominated by dynamic behaviour of Load Tap Changers (LTC) transformers, induction motors and thermostatically controlled loads. Industrial loads contain a large fraction (60 to 70 %) of induction machines, and their behaviour varies with the mechanical load. The knowledge of induction motor loads is essential since stalling motors draw large reactive currents which may slow post-fault voltage recovery.
A composite load structure has been recommended by WECC standards [16], consisting of multiple loads connected to a single bus: static, motor and dynamic loads (Fig. 2). Motor loads are assessed with respect to their mechanical loads. Several case studies are carried out to see the non-linear interactions between the generators to the system. Thus, analysis and investigation of load models influence on the fault ride-through capability of DFIG wind turbines plays a crucial role in order to guarantee a stable and secure operation.
The rest of this paper is organized as follows. Section II discusses the model of the DFIG including the mechanical system, electrical system and converter control system. A component and composite loading structures are also considered in section II, comprising static, dynamic motor and a composite model. Motor loads are assessed with respect to their mechanical loads. Different case studies are carried out in PSAT/MATLAB software in order to enhance the understanding of the evolution of the dynamic interaction between the DFIG wind turbines and the power system load model, during and shortly after severe three-phase short circuit grid fault. A conclusion and further research closes the paper.
WSEAS TRANSACTIONS on POWER SYSTEMS Abdelaziz Salah Saidi, Mohammed Ibrahim Y. Al-Rayif
E-ISSN: 2224-350X 2 Volume 12, 2017

2 System Models 2.1. Variable Speed Wind Turbines Model 2.1.1 Mechanical System The mechanical motion equation is modelled as a single shaft, as it is assumed that the converter controls are able to filter shaft dynamics [17]. Thus: memm H2/TT (1) where Hm is the inertia constant, Te is the electromagnetic torque. The mechanical torque Tm extracted from the wind is:
wm
m
PT
(2)
In Eq. (2), Pw is the mechanical power function of the wind speed uw, and the blade pitch angle θp. Pw can be written as follows [18]:
2 3w p p wP ( / 2)C , R u (3)
where ρ is the air density, R is the wind turbine blade radius and Cp is the aerodynamic power coefficient function of the tip speed ratio ζ and the blade pitch angle θp. The p pC , curve is approximated as
follows [21]: 12.5-
ip pi
116C 0.22 - 0.4 -5 e
(4)
3i p p
1 1 0.035 =+ 0.08 1
(5)
2.1.2 Electrical System Using the generator convention, the machine equations of the DFIG written in a d-q synchronous reference frame are given in per-unit [19]:
ss s s s
s
dΨ1V = -R I + + jΨω dt
(6)
s mrr r r r
s s
ω - ωdΨ1V = -R I + + j Ψω dt ω
(7)
s s s m rX I X I (8) r m s r rX I X I (9)
Where s rV and V are the stator and rotor voltages respectively, s rI and I are the stator and rotor currents respectively, s r and are the stator and rotor flux linkage respectively, Rs and Rr are the stator and rotor resistances respectively, Xm is the magnetizing reactance, Xs and Xr are the stator and rotor reactances respectively, ωs and ωm are the synchronous and rotor angular speed respectively. The stator voltages are functions of the grid voltage magnitude V and phase θ at the DFIG bus:
sdV Vsin (10) sqV V cos (11)
The electrical active and reactive powers generated by the stator are written as:
s sd sd sq sqP V I V I (12)
s sq sd sd sqQ V I V I (13) By choosing the d–q reference frame synchronized with the stator flux [18], the active and reactive powers expressions become:
ms rq
s
XP = VIX (14)
2m rd
ss s
X VI VQX X
(15)
Then, the electromagnetic torque Te is simplified into [20]:
m rqe
s s
X VIT
X
(16)
2.1.3 Converter Control System Converter dynamics are highly simplified, as they are fast with respect to the electromechanical transients [21]. Hence, the converter is modelled as an ideal current source, where the rotor currents Irq and Ird are the state variables and are used for the rotor speed control and voltage control, respectively.
Fig.1. LVRT requirement for wind generation according to E.ON Netz grid code
G
π model
M
Elec
troni
c
Stat
ic
MV bus
π model
MV bus
LV bus
Composite load
HV bus
Fig. 2. Distribution network structure
WSEAS TRANSACTIONS on POWER SYSTEMS Abdelaziz Salah Saidi, Mohammed Ibrahim Y. Al-Rayif
E-ISSN: 2224-350X 3 Volume 12, 2017

Differential equations for the converter currents have the form [22]:
srq w m m rq
m
X 1I P / IX V T
(17)
rd v ref m rdI K V V V/ X I (18) Where Tε is the power control time constant, Kv is the voltage control loop gain, Vref is the reference voltage
and w mP is the power-speed characteristic which roughly optimizes the wind energy capture and is calculated using the current rotor speed value. Currents limits are used to define the active and reactive power generation limits, which are as follows [22]:
maxm rqmin
smin
m rqmax
smax 2
min m rd
s smin 2
max m rd
s s
X VIP -
X
X VIP -
X
X VI VQ - -X X
X VI VQ - -X X
(19)
Consequently, DFIG models incorporate limited voltage control capabilities. 2.2. Modelling of Load Use of appropriate load models in power system studies is essential and an integral part in system planning, operation and stability studies. Load models that have been used in voltage stability studies can be generally divided into static and dynamic part. 2.2.1 Static Voltage-Dependent Load Model Loads in an area are characterized by their load class, the composition of each class and the characteristics of the single components. Typically, load class data is grouped in industrial, commercial and residential load data [23]. Industrial load is related to industrial processes and mainly consists of motors, whereas heavy industries may also include electric heating processes. Residential loads consist of households, i.e. household appliances, including electric heating and air conditioning devices. Commercial load also includes electric heating and air conditioning, as well as a significant amount of discharge lighting. Each category of load class is in [23].
A general form of the voltage-dependent static load model is algebraically described in (20-21). It is commonly known as the exponential load model.
a
Lo
LLoL V
VPP
(20)
b
Lo
LLoL V
VQQ
(21)
Where PL0 and QL0 stand for the real and reactive power consumed at a reference voltage VL0. The exponents a and b depend on the type of the load being represented. By choosing appropriate exponent values, the above model can represent constant impedance (a=b=2) or constant current loads (a=b=1). When both exponent values are zero, the load becomes a constant MVA load (a=b=0). References [24] and [25] show typical values of a and b for several types of loads encountered in power systems. 2.2.2 Dynamic Induction Motor Load Model The load characteristics have profound effect on the system dynamics. So it is necessary to consider the dynamic behaviors of loads [26]. Among the dynamic loads of a power system, induction motors constitute the major portion, and it is generally accepted that, for transient voltage stability, their effect prevails [27]. The aggregated motor load of the system is represented by an asynchronous machine, modeled as a single cage induction motor. The induction motor is modeled using the standard set of p.u. dq0 equations for a synchronously rotating reference frame connected to a balanced three-phase sinusoidal supply [28]. The stator flux transients are significantly fast compared to the rotor dynamics; therefore, reduced order models can be easily obtained from the standard model which is well suited for stability studies by eliminating certain derivative terms. For example, if the stators flux linkage transient are ignored, i.e., Ψqs =Ψds =0, the standard model is reduced to a third-order model:
' ' ' ' 'd b q d o q o' ' ' ' 'q b d q o d o
m e m' '
sd d s sd sq' '
sq q s sq sd
E sE (E (X X )I ) / T
E sE (E (X X )I ) / T
s (T (s) T ) /(2H )
V E R I X I
V E R I X I
(22)
where o s mX X X , 's r m r mX X (X X / X X ) ,
'o r m b rT (X X ) / R
WSEAS TRANSACTIONS on POWER SYSTEMS Abdelaziz Salah Saidi, Mohammed Ibrahim Y. Al-Rayif
E-ISSN: 2224-350X 4 Volume 12, 2017

E’d and E’q are respectively the direct and quadrature
axis voltages behind the transient reactance X’, 'To is the rotor open circuit time constant, s is the slip of the motor, ωb is the angular velocity of the stator field in electrical rad/s and Te and Tm are respectively the developed electrical torque and load torque. The motor mechanical loads are modeled as speed dependent loads. Their mechanical torque depends quadratically on the speed according to the following equation: TL=α+βω+γω2 (23) Where TL: mechanical load torque (p.u) ω: angular velocity α, β, γ: model coefficients 3 Case System Description A typical power system extracted from [29] is used throughout the paper as a test system to demonstrate the transient stability analysis of the power system with large scale wind turbines. The base case line data, bus data and generator data are given in Table 2 and Table 4 of the Appendix. Fig. 3 shows the layout of the power system considered in this paper. In this work slight modifications are at bus 5, changing from a squirrel induction generator to Doubly-Fed Induction Generator and in bus 4 when a static/dynamic load is added. There are 8 buses, 5 branches, and two generators with their associated step-up transformers (0.69 kV/30 kV). Assuming different kinds of load representation, the load in bus 4 is represented by a static voltage-dependent load model or by an induction motor load model. For the static load model representation, the totaling load is 30 MW and 15 Mvar. For the case where the dynamic load model is considered, dynamic parameters of the aggregate induction motors used in load models are specified according to IEEE guidelines for use in large disturbance studies, i.e. IEEE Type 7 motor parameter designations [30]. The parameters of the dynamic load model are presented in [30]. From the simulations, static capacitors with 0.45 pu reactive power compensation, are adjusted for the dynamic load to obtain nominal voltage and power factor of 0.99. The first generator is located at bus 1 and it is based in synchronous generator and equipped with an Automatic Voltage Regulator and Turbine Governor. The generator is modeled using sub-transient models. The second generator is a DFIG wind farm connected to the Point of Common Coupling at bus 5 and can be
represented by a P-V bus with the reactive power limit, since it has the capacity to control the reactive power. The response of wind farms at PCC has been modelled by one single equivalent wind turbine, assuming a uniform wind speed distribution in the wind farm described in [31]. The wind farm under consideration is composed of twenty-five DFIG wind turbines of 2 MW, 690V each. Thus, the equivalent wind farm presents one single equivalent wind turbine with 50 MW rated power at the bus 5. DFIG wind turbine parameters used in this work are presented in [21]. The wind farm is required to maintain a power factor within the range of 0.95 lagging to 0.95 leading which correspond to Qmax=16.43 MVar and Qmin=-16.43 MVar. The frequency stability in the system is assured by the large generator inertia at bus 1. The effect of the loads models on the LVRT on the system voltage stability is demonstrated by performing transient stability analysis of the test power system. All results are performed using PSAT/MATLAB
software by applying severe three-phase short circuit grid fault.
4 Study Cases In this section, the dynamic interaction between variable-speed DFIG wind turbines with power transmission system during and immediately after grid faults is illustrated and explained. The transient stability studies are conducted by applying a sudden three-phase short-circuit on the network with 100% wind penetration. The severe fault is applied near DFIG generator at the high-voltage terminals of the generator transformer at t=20 s with a fault clearance time of 150ms by permanent isolation (tripping the relays). During the fault, it is assumed that the DFIG wind farm operate at its rated capacity with 0.95 power factor. The short circuit path has an impedance Zfault =j0.4 p.u.
Fig. 3. Single-line diagram of the example system
WSEAS TRANSACTIONS on POWER SYSTEMS Abdelaziz Salah Saidi, Mohammed Ibrahim Y. Al-Rayif
E-ISSN: 2224-350X 5 Volume 12, 2017

4.1 Case I: Exponential Load Model Studies Various model types of exponential load model, as defined in Table 3 of the Appendix, has been simulated. In each case, the critical LVRT of wind turbine for two cases has been investigated: base case load and in peak load condition. The following Figs show the dynamic interaction between the DFIG wind turbines and the power system model during the short circuit fault at the bus bar. It can be concluded from Figs 4.a and 4.b that the system sensitivity to LVRT could vary for different type load class and load type. Voltage responses have indicated significant transient voltage drop profiles with the constant power load and least with industrial load model. Among the six different load compositions, the constant power load model has the minimal amount of the LVRT at the DFIG bus which is 0.4452 p.u. and is able to carry the lowest voltage among the six studied load models. An over voltage is depicted at this type of load equal to 1.1608 p.u. The reactive current support is provided within 150 ms after the fault detection in accordance with the E. ON regulation requirement (see Fig. 5). Thus, the reactive power injection curve improves voltage profile and the ride-through capability as shown in Fig. 6. As the active power is reduced (Fig. 6), the excess power of the system is stored as kinetic energy in the rotor, thus increasing the rotor speed. The increase in the speed is shown in Fig. 7. The power control can be implemented to fulfill grid code requirements when the transients have decayed. After fault clearance the wind turbine system can continue with nominal operation. Thus the wind park is maintained connected to the grid increasing the ride-through capacity. In a second set of simulations (peak load condition), the totaling load is 34 MW and 17 Mvar. Fig. 8 shows the grid voltage recovery behavior at the DFIG wind farm. The LVRT is highly affected by the fault in this case and the voltage decrease from 0.44 p.u to 0.34 p.u (respectively Figs. 4.a and 8) as well as an increase in the reactive power generated by the DFIG. The situation becomes quite different since the percentage of the load increased with its maximum. 4.2 case II: Fault Case with Induction Motor Load The impact of dynamic load models on the transient stability is shown in Figs 9 and 10. Voltage responses have indicated significant transient voltage drop profiles with dynamic load compared to constant power load model in the base case.
This fault caused the voltage to drop at the terminals of the wind turbine to a value of 0.3 p.u. As be known, the special characteristic of the induction motor is the stress that it imposes on the system voltages. It can be concluded that the Low Voltage Ride-Through of the system could vary for different type of the loads. This result is important because it indicates that the induction motor has a significant impact on the LVRT and the stability of the associated power system. 4.2.1 Perturbation Case with Three Induction Motor Operated at Full Load 4.2.1.1 Effect of mechanical load torque In this case of simulation, the grid model comprises three induction motors in the place of one motor located respectively at buses 2, 4 and 6 with their associated step-up transformers (6 kV/30 kV). The load of motors 1, connected to bus 4, has a constant
19.8 19.9 20 20.1 20.2 20.3 20.4 20.5 20.6 20.7 20.8
0.5
0.6
0.7
0.8
0.9
1
1.1
time (s)
volt
age
at
DF
IG [
p.u
]
constant powerconstant currentconstant impedance
20 20.1 20.2 20.3 20.4 20.5 20.6 20.7 20.8 20.9
0.5
0.6
0.7
0.8
0.9
1
1.1
time (s)
volt
age
at
DF
IG [
p.u
]
IndustrialCommercialHouse hold
19.6 19.8 20 20.2 20.4 20.6 20.8 21 21.2 21.4-0.35
-0.3
-0.25
-0.2
-0.15
-0.1
-0.05
0
time (s)
roto
r cu
rren
t Ir
d [
p.u
]
19.6 19.8 20 20.2 20.4 20.6 20.8 21 21.2 21.40
0.1
0.2
0.3
0.4
0.5
time (s)
act
ive
an
d r
eact
ive
po
wer
[p
.u]
PDFIG QDFIG
20 22 24 26 28 30 32
1.185
1.19
1.195
1.2
1.205
1.21
time (s)
roto
r sp
eed
at
DF
IG [
p.u
]
19.9 20 20.1 20.2 20.3 20.4 20.5 20.6 20.7 20.8
0.4
0.5
0.6
0.7
0.8
0.9
1
1.1
time (s)
vo
lta
ge
at
DF
IG [
p.u
]
19.8 20 20.2 20.4 20.6 20.8 21 21.2 21.4 21.6 21.8
0.2
0.4
0.6
0.8
1
time (s)
volt
age
at
DF
IG [
p.u
]
19.8 20 20.2 20.4 20.6 20.8 21
0.2
0.4
0.6
0.8
1
time (s)
vo
lta
ge
at
IM [
p.u
]
Fig. 4. Grid fault ride through of DFIG wind turbine for base load
Fig. 4. a. voltage at DFIG
Fig. 4. b. voltage at DFIG
Fig. 5. rotor current Ird Fig. 6. active and reactive power
Fig. 7. rotor speed at DFIG
Fig. 8. voltage at DFIG
Fig. 9. voltage at DFIG Fig. 10. voltage at IM
WSEAS TRANSACTIONS on POWER SYSTEMS Abdelaziz Salah Saidi, Mohammed Ibrahim Y. Al-Rayif
E-ISSN: 2224-350X 6 Volume 12, 2017

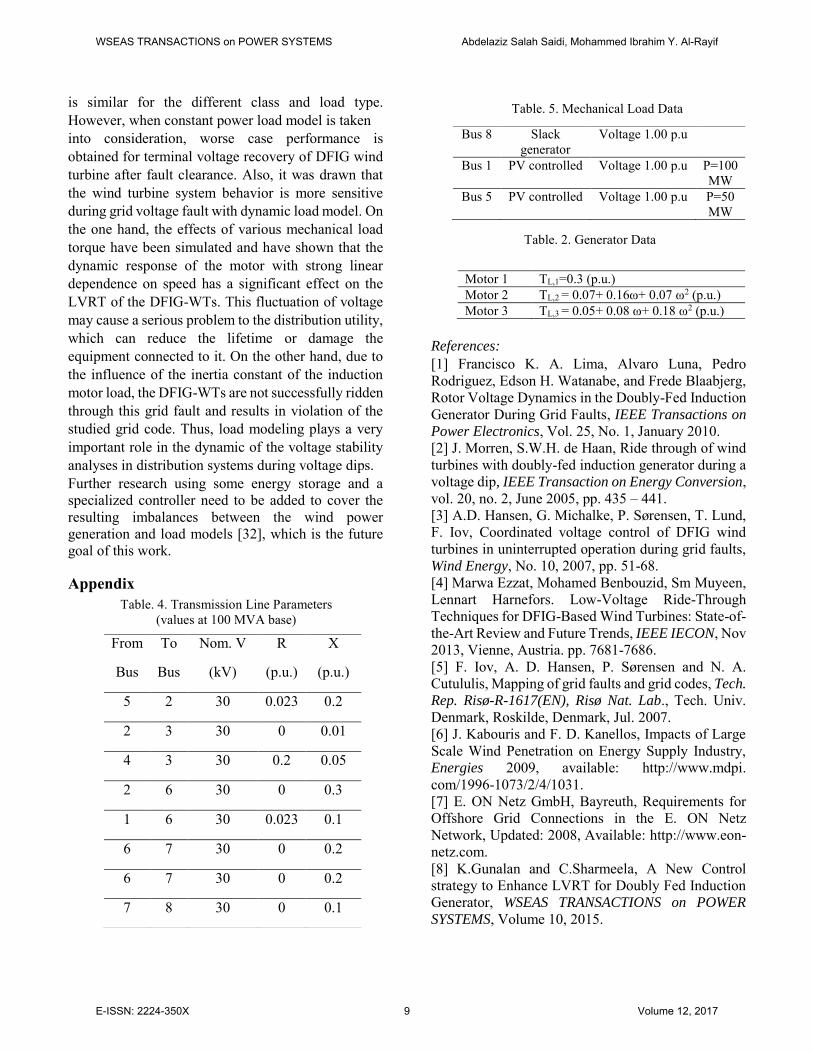
torque load; the load of motor 2, connected to bus 2, has a strong linear dependence on speed, and finally the mechanical load of motor 3, connected to bus 6, has a strong quadratic dependence on speed. The mechanical load model parameters are given in the Table 5 of the Appendix. Fig. 11 illustrates the voltage recovery at the DFIG terminal bus. Fig. 12 presents the DFIG active and reactive power during the pre-fault, fault and post fault phases improving the voltage profile as shown in Fig. 15. Before the fault is applied, the active power output of the wind turbine is 0.5 pu while the reactive power output is kept constant at 0.05 pu. The initial terminal voltage of the DFIG is 1 p.u and the generator operates at super-synchronous speed where the rotor speed is 1.1 pu presented in Fig. 13. According to IEEE Std. 1547 (IEEE 08), voltage of distribution networks should recover to an acceptable level within the time indicated in Table 1. It can be seen that in this case the system takes the permitted time of 2 s to return to its pre-fault condition. In this case, the fault is not enough to trigger the overcurrent protection, and therefore the DFIG is able to ride through the voltage dip without action of protection. The electrical powers return to normal operation. Approximately 150 ms after fault is cleared and the terminal voltage is recovered (back to the steady state value) at 1 pu. This fast voltage recovery is due to the ability of DFIG to control the reactive power. When generator disconnection is not ordered, the rotor speed accelerates abruptly towards synchronous speed. At this instant, the generator is situated in a motoring operation. As can be seen in the results, the generator absorbs a large amount of reactive power until it comes into a generating operation again. The WTGs successfully ride through this grid fault. The dynamic responses of the three inductions motor are shown in Figs. 14 and 15. Fig. 14 shows the motors slip for the three motors during the pre-fault, fault and post-fault phases. Note that the acceleration rate is different for each motor. Fig. 15 illustrates the voltage recovery at the motor terminal buses, for the three motors throughout the period of study. Due to the different electrical and mechanical characteristics of the motors
1 and 2 compared to motor 3, and due to the system topology the recovery is considerably slower at bus 4 and bus 2, compared to bus 6. These simulation results demonstrate the impact of the Low Voltage Ride-Through on the dynamic response of the three motors. Motors 1 and 2 are the most critical cases. The voltage at the PCC, in this case, does not violate the LVRT of the studied grid code. 4.2.1.2 Effect of Load Inertia One of the main disadvantages of the static load models is that it doesn’t take the load inertia constant into consideration. To demonstrate the significant effect of the inertia of the load on the fault ride through capabilities of the wind turbines, the system is simulated for different induction motor inertia. The same fault as in the previous simulation is applied. The fault is cleared at t=20.150s. Fig. 16 demonstrates the voltage at the DFIG wind farms at bus 5, while Fig. 17 shows the active and reactive power delivered by the DFIG wind farms. The rotor current and speed profile are shown respectively in Figs. 18 and 19. The dynamic response of the three induction motor, at different load inertia: H1=0.18 s, H2=0.10s and H3=0.05s are depicted in Figs. 20 and 25.
19.5 20 20.5 21 21.50.3
0.4
0.5
0.6
0.7
0.8
0.9
1
1.1
time (s)
volt
age
at D
FIG
[p
.u]
20 20.5 21 21.5 22 22.5 23 23.5 24 24.50
0.1
0.2
0.3
0.4
0.5
time (s)
acti
ve a
nd
rea
cti
ve p
ow
er [
p.u
]
PDFIG QDFIG
20 22 24 26 28 30 32
1.1
1.11
1.12
1.13
1.14
1.15
1.16
time (s)
roto
r sp
eed
at
DF
IG [
p.u
]
19.8 20 20.2 20.4 20.6 20.8 21 21.2 21.4
0
0.05
0.1
0.15
0.2
0.25
time (s)
mo
tor
slip
[p
.u]
sMot 1sMot 2sMot 3
19.5 20 20.5 21 21.50.2
0.3
0.4
0.5
0.6
0.7
0.8
0.9
1
time (s)mo
tor te
rmina
l volt
age [
p.u]
Vbus 4Vbus 9Vbus 10
Voltage range (p.u) Clearing time (s) 0<0.5 0.16
0.5≤V<0.88 2.00 1.1<V<1.2 1.00
V≥1.2 0.16
Table. 1. Interconnection system response to abnormal voltage
Fig. 11. voltage at DFIG Fig. 12. active and reactive power
Fig. 13. rotor speed at DFIG Fig. 14. Motor slip
Fig. 15. Voltage recovery at motor terminal buses after a 3-phase line fault.
WSEAS TRANSACTIONS on POWER SYSTEMS Abdelaziz Salah Saidi, Mohammed Ibrahim Y. Al-Rayif
E-ISSN: 2224-350X 7 Volume 12, 2017

The fault causes the rotor current to increase rapidly and reaches the setting value of the protection. Subsequently, the converter is locked and this action is followed by a shorting of the rotor circuit. At this moment, the generator behaves like a squirrel cage induction generator. The DFIG draws 0.20 reactive power from the grid and it does not recover the steady-state level after the fault clearance. The absorption of the large amount of the reactive power induces instability on the wind park. By comparing the dynamic response of the three inductions motor (Figs. 20-21), it could be concluded from these Figs, that the DFIG steady state condition is different to the previous section. The DFIG fails to regain its pre-fault operating and it’s disconnected from the grid to avoid any possible damages to the turbine. This could be explained that the variation of the inertia constant of the motors 1 and 2 has a negative impact on the LVRT of the DFIG wind farm; while the variation of the inertia constant of motor 3 has not affected the LVRT in spite of its low value of H. The induction motor 3 persists to the fault and has better ride-through capacity. Instability problems occurred in this configuration due to the influence of the inertia constant of the dynamic load. From these plots, one can see that the induction machine with lower inertia (motor 3 at bus 6) has better ride-through capacity. It can be concluded that the load inertia has a profound effect on the dynamic of the DFIG, as it creates a large voltage dip and thus it is not able to recover the voltage level to its nominal value quickly after the voltage dip. The turbine is disconnected after the instant and the converter is blocked. The voltage at the PCC, due to the effect of load inertia, violates the voltage level within the studied grid code at the instant of fault clearance as seen in Fig.16.
5 Conclusion The present research paper has investigated the effects of different load models on the Low Voltage Ride-Through of DFIG-WTs. Three types of load models consisting of a static voltage-dependent load, an aggregate of induction motors and composite load model have been considered. The analysis shows that the instantaneous voltage drops at the DFIG terminals
20 20.5 21 21.5 220.2
0.3
0.4
0.5
0.6
0.7
0.8
0.9
1
time (s)
voltag
e at D
FIG [p
.u]
19.5 20 20.5 21 21.5 22 22.5 23 23.5 24
0.1
0.2
0.3
0.4
0.5
time (s)
active
and r
eactiv
e pow
er [p.
u]
PDFIG QDFIG
19.5 20 20.5 21 21.5 22 22.5
-0.3
-0.25
-0.2
-0.15
-0.1
-0.05
time (s)
roto
r cur
rent
Ird
at D
FIG
[p.u
]
0 5 10 15 20 251
1.1
1.2
1.3
1.4
1.5
1.6
1.7
1.8
time (s)
roto
r spe
ed o
f DFI
G [p
.u]
20 20.5 21 21.5 22 22.5 23
0.2
0.4
0.6
0.8
1
time (s)
motor
term
inal v
oltag
e [p.u
]
Vbus 4Vbus 9Vbus 10
20 20.5 21 21.5 22
0
0.5
1
1.5
time (s)
mot
or sl
ip [p
.u]
sMot 1sMot 2sMot 3
Industrial Commercial households
a 0.1 0.6 1.7
b 0.6 2.5 2.6
Fig. 16. Voltage at DFIG
Fig. 17. active and reactive power at DFIG
Fig. 18. rotor current Ird at DFIG
Fig. 19. rotor speed at DFIG
Fig. 21. Motor slip
Fig. 20. Voltage recovery at Induction Motor
Table. 3. Load Class Parameters
WSEAS TRANSACTIONS on POWER SYSTEMS Abdelaziz Salah Saidi, Mohammed Ibrahim Y. Al-Rayif
E-ISSN: 2224-350X 8 Volume 12, 2017
is similar for the different class and load type. However, when constant power load model is taken into consideration, worse case performance is obtained for terminal voltage recovery of DFIG wind turbine after fault clearance. Also, it was drawn that the wind turbine system behavior is more sensitive during grid voltage fault with dynamic load model. On the one hand, the effects of various mechanical load torque have been simulated and have shown that the dynamic response of the motor with strong linear dependence on speed has a significant effect on the LVRT of the DFIG-WTs. This fluctuation of voltage may cause a serious problem to the distribution utility, which can reduce the lifetime or damage the equipment connected to it. On the other hand, due to the influence of the inertia constant of the induction motor load, the DFIG-WTs are not successfully ridden through this grid fault and results in violation of the studied grid code. Thus, load modeling plays a very important role in the dynamic of the voltage stability analyses in distribution systems during voltage dips. Further research using some energy storage and a specialized controller need to be added to cover the resulting imbalances between the wind power generation and load models [32], which is the future goal of this work. Appendix
References:
[1] Francisco K. A. Lima, Alvaro Luna, Pedro Rodriguez, Edson H. Watanabe, and Frede Blaabjerg, Rotor Voltage Dynamics in the Doubly-Fed Induction Generator During Grid Faults, IEEE Transactions on
Power Electronics, Vol. 25, No. 1, January 2010. [2] J. Morren, S.W.H. de Haan, Ride through of wind turbines with doubly-fed induction generator during a voltage dip, IEEE Transaction on Energy Conversion, vol. 20, no. 2, June 2005, pp. 435 – 441. [3] A.D. Hansen, G. Michalke, P. Sørensen, T. Lund, F. Iov, Coordinated voltage control of DFIG wind turbines in uninterrupted operation during grid faults, Wind Energy, No. 10, 2007, pp. 51-68. [4] Marwa Ezzat, Mohamed Benbouzid, Sm Muyeen, Lennart Harnefors. Low-Voltage Ride-Through Techniques for DFIG-Based Wind Turbines: State-of-the-Art Review and Future Trends, IEEE IECON, Nov 2013, Vienne, Austria. pp. 7681-7686. [5] F. Iov, A. D. Hansen, P. Sørensen and N. A. Cutululis, Mapping of grid faults and grid codes, Tech.
Rep. Risø-R-1617(EN), Risø Nat. Lab., Tech. Univ. Denmark, Roskilde, Denmark, Jul. 2007. [6] J. Kabouris and F. D. Kanellos, Impacts of Large Scale Wind Penetration on Energy Supply Industry, Energies 2009, available: http://www.mdpi. com/1996-1073/2/4/1031. [7] E. ON Netz GmbH, Bayreuth, Requirements for Offshore Grid Connections in the E. ON Netz Network, Updated: 2008, Available: http://www.eon-netz.com. [8] K.Gunalan and C.Sharmeela, A New Control strategy to Enhance LVRT for Doubly Fed Induction Generator, WSEAS TRANSACTIONS on POWER
SYSTEMS, Volume 10, 2015.
Motor 1 TL,1=0.3 (p.u.) Motor 2 TL,2 = 0.07+ 0.16ω+ 0.07 ω2 (p.u.) Motor 3 TL,3 = 0.05+ 0.08 ω+ 0.18 ω2 (p.u.)
From
Bus
To
Bus
Nom. V
(kV)
R
(p.u.)
X
(p.u.)
5 2 30 0.023 0.2
2 3 30 0 0.01
4 3 30 0.2 0.05
2 6 30 0 0.3
1 6 30 0.023 0.1
6 7 30 0 0.2
6 7 30 0 0.2
7 8 30 0 0.1
Bus 8 Slack generator
Voltage 1.00 p.u
Bus 1 PV controlled Voltage 1.00 p.u P=100 MW
Bus 5 PV controlled Voltage 1.00 p.u P=50 MW
Table. 4. Transmission Line Parameters (values at 100 MVA base)
Table. 2. Generator Data
Table. 5. Mechanical Load Data
WSEAS TRANSACTIONS on POWER SYSTEMS Abdelaziz Salah Saidi, Mohammed Ibrahim Y. Al-Rayif
E-ISSN: 2224-350X 9 Volume 12, 2017

[9] H.T. Jadhav and R. Roy, A comprehensive review on the grid integration of doubly fed induction generator, International Journal of Electrical Power
& Energy Systems, vol. 49, July 2013, pp. 8-18. [10] Min Min Kyaw, V. K. Ramachandaramurthy and Dao Trung Hieu, Fault Ride through of Offshore Wind Turbines with Optimum Power Tracking, PEA-AIT
International Conference on Energy and Sustainable
Development: Issues and Strategies (ESD 2010) The Empress Hotel, Chiang Mai, Thailand. 2-4 June 2010. [11] Leszek Jedut, Eugeniusz Rosolowski and Krzysztof Rudion, Investigation of DFIG Based Wind Turbine Influence on the Utility Grid, Modern Electric
Power Systems 2010, Wroclaw, Poland. MEPS'10 - paper 05.5. [12] N. K. Roy, M. J. Hossain, and H. R. Pota, Voltage profile improvement for distributed wind generation using D-STATCOM, in Proc. IEEE Power and
Energy Society General Meeting, Detroit, USA, 24-28 July 2011. [13] Ching-Yin Lee, Li-Chieh Chen, Shao-Hong Tsai, Wen-Tsan Liu, and Yuan-Kang Wu, The impact of SCIG wind farm connecting into a distribution system, in Proc. Asia-Pacific Power and Energy Engineering
Conference (APPEEC 2009), pp. 1-7, China. [14] D.J. Hill, Nonlinear dynamic load models with recovery for voltage stability studies, IEEE Trans.
Power Sys., Vol.8, No.1, Feb. 1993. [15] N. K. Roy, H. R. Pota, and M. J. Hossain, Reactive power management of distribution networks with wind generation for improving voltage stability, Renewable Energy-Elsevier, vol. 58, 2013, pp. 84-95. [16] Western Electricity Coordinating Council Modeling and Validation Work Group, Composite Load Model for Dynamic Simulations, Report 1.0, June 12, 2012. [17] Milano, F., Power System Analysis Toolbox Documentation for PSAT, Version 1.3.4. July 14, 2005.Available: http://www.power.uwaterloo.ca/~fmilano/psat.htm [18] Ghedamsi, K. and D. Aouzellag, Improvement of the performances for wind energy conversions systems. Int. J. Electronic Power Energy Syst., 2010. [19] Ekanayake, J.B., L. Holdsworth and N. Jenkins, Comparison of 5th order and 3rd order machine models for doubly fed induction generator (DFIG) wind turbines, Electr. Power Syst. Res. 67,2003, pp. 207–215. [20] Tsourakis, G., B.M. Nomikos and C.D. Vournas, Effect of wind parks with doubly fed asynchronous
generators on small-signal stability, Electric Power
Syst. Res., 79, 2009, pp. 190–200. [21] Milano, F., Assessing adequate voltage stability analysis tools for networks with high wind power penetration, Proceedings of the 3rd International
Conference on Electric Utility Deregulation and
Restructuring and Power Technologies, April 6-9, Nanjing, China, 2008, pp. 2492-2497. [22] Milano, F., A.J. Conejo and J.L. Garcia-Domelas, Reactive power adequacy in distribution networks with embedded distributed energy resources, J.
Energy Eng. 133, 2007, pp. 132-143. [23] P.Kundur, Power System Stability and Control, McGraw-Hill Inc., 1994. [24] C. W. Taylor, N. J. Balu, and D. Maratukulam, Power system voltage stability, New York: McGraw Hill, 1994. [25] T. Van Cutsem and C. Vournas, Voltage Stability
of Electric Power Systems, Kluwer, 1998. [26] J. Hossain and H. R. Pota, Robust Control for
Grid Voltage Stability: High Penetration of
Renewable Energy, Springer Singapore, 2014. [27] IEEE Task Force on Load Representation for Dynamic Performance, Standard load models for power flow and dynamic performance simulation, IEEE Trans. Power Syst., vol.10, no. 3, August 1995, pp. 1302-1313
[28] A. Borghetti, R. Caldon, A. Mari and C. A. Nucci, Studies, IEEE Transactions on Power Systems, Vol. 12, No. 1, February 1997. [29] Junji Tamura, Masahiro Ueno and Yoshiharu Matsumura, Transient stability simulation of power system including wind generator by PSCAD/EMTDC, IEEE Porto Power Tech Conference, 10-13 Septenber 2001, Porto, Portugal. [30] Mark Gordon, Impact of Load Behavior on Transient Stability and Power Transfer Limitations, IEEE Power and Energy Society General Meeting. July 26-30, 2009. [31] Usaola, J.L., P. Rodriguez, J.M. Fernandez, J.L. Beato, D. Iturbe and Jr. R. Wilhelmi, Transient stability studies in grids with great wind power penetration, Modelling issues and operation requirements, Power Eng. Soc. General Meeting, 2003, pp. 1534-1541. [32] G. Durga Prasad and Mubarak A.Al-Mulhim, Comparative assessment of the effect of the dynamic load models on voltage stability, Electrical Power §
Energy Systems, Vol. 19, No. 5, 1997, pp. 305-309.
WSEAS TRANSACTIONS on POWER SYSTEMS Abdelaziz Salah Saidi, Mohammed Ibrahim Y. Al-Rayif
E-ISSN: 2224-350X 10 Volume 12, 2017