IMPACT OF SOCIO-CULTURAL FACTORS ON ...shodhganga.inflibnet.ac.in/bitstream/10603/4933/13/13...149...
74
149 CHAPTER – V IMPACT OF SOCIO-CULTURAL FACTORS ON ENVIRONMENTAL DEGRADATION India has a long tradition of preserving and worshipping the various objects of nature like trees, animals, rivers, birds, air, mountains, planets etc. The relationship between man and environment has been recognized in Indian culture from the ancient times. Worshipping nature in the form of deity and recognizing and accepting the earth as mother reveals a kind of conservation on ethics even in Guru Granth Sahib it is mentioned that "Pawan Guru Pani Pita, Mata Dharat Mahat." which denotes air as teacher, water as father and earth as mother. This comes to us through the history, culture and religion. Life on this planet is pre-conditioned and dependent upon the existence and sustenance of the natural environment. Environmental sustainability is achievable mainly by protecting the environment. Healthy and clean environment is the natural pre requisite of life right from the time when a child comes to the womb. Environment is the natural condition which exists around human beings and support life. Modern civilization and culture have been already exercising its tremendous potential to alter our environment, too frequently in adverse ways, on regional as well as even on global scales. For the continued development and even survival of civilization man must make every possible effort to understand and the worth of better use his environment. The physical environment and its interrelationship with life on earth and perhaps on other planet is, of course, far to complex to
Transcript of IMPACT OF SOCIO-CULTURAL FACTORS ON ...shodhganga.inflibnet.ac.in/bitstream/10603/4933/13/13...149...
149
CHAPTER – V
IMPACT OF SOCIO-CULTURAL FACTORS ON
ENVIRONMENTAL DEGRADATIONIndia has a long tradition of preserving and worshipping
the various objects of nature like trees, animals, rivers, birds,
air, mountains, planets etc. The relationship between man and
environment has been recognized in Indian culture from the
ancient times. Worshipping nature in the form of deity and
recognizing and accepting the earth as mother reveals a kind of
conservation on ethics even in Guru Granth Sahib it is
mentioned that "Pawan Guru Pani Pita, Mata Dharat Mahat."
which denotes air as teacher, water as father and earth as
mother. This comes to us through the history, culture and
religion.
Life on this planet is pre-conditioned and dependent upon
the existence and sustenance of the natural environment.
Environmental sustainability is achievable mainly by protecting
the environment. Healthy and clean environment is the natural
pre requisite of life right from the time when a child comes to
the womb. Environment is the natural condition which exists
around human beings and support life.
Modern civilization and culture have been already
exercising its tremendous potential to alter our environment,
too frequently in adverse ways, on regional as well as even on
global scales. For the continued development and even survival
of civilization man must make every possible effort to
understand and the worth of better use his environment. The
physical environment and its interrelationship with life on earth
and perhaps on other planet is, of course, far to complex to
150
yield to man's complete control through technology. Despite the
marvelous accomplishments and promises of the recent
scientific revolution and of those to come, human being cannot
deny or more than superficially escape from his biological
lineage and its unbearable ties to the physical world (Platt,
1972).
Nature has gifted man with several blessings and clean
environment is one of them. Since the dawn of civilization man
has been interfering with the nature, hence our environment is
under consent threat. The primitive man gradually discovered
fire, invented tools and used them to fulfill his everlasting favor
of development which resulted in bringing about drastic
changes in the environment.
Early man was nomadic and after exhausting the
available resources, he shifted in groups to other places in
groups limited. Due to population, its impact on the
surrounding was less harmful. Then advent of agriculture and
equally rapid development of industrial sector led to the growth
of population which increased demand for food and basic
amenities. Particularly, the 19th and 20th centuries have
witnessed number of vital changes and growth in the process of
development. It ultimately affected the quality of environment
adversely process. In the name of development, forests
denudated, lakes and rivers have become loaded with
poisonous effluents and hazardous chemicals and air is
degraded with noxious and poisonous gases.
It has been proved beyond any doubt that pollution
especially by sulphur dioxide and suspended matter
particulates is responsible for numerous aspiratory diseases
such as bronchitis, constrictive ventilator disease and asthma

151
etc. Likewise the number of patients suffering from lung cancer
has risen due to the discharge of hydrocarbons from coal
combustion, Petro-chemicals and automobile exhausts.
Chemical in petrol such as lead, barium, manganese
discharged by motor vehicles adversely affect the health of
people. Further a huge amount of consumption of fuels like
wood, gas, coal and oil increase the amount of carbon dioxide
injection in the air. The nature cannot assimilate all through its
regenerative cycle. The excess of carbon dioxide in the
atmosphere results into rise in the temperature of the earth. It
is worth mentioning here that most of the pollutants are
discharged beyond the assimilative capacity of the nature.
Environment quality has deteriorated due to uncontrolled
mechanization, overuse of natural resources deforestation
excessive use of pesticides and fertilizers in farms. Though
greener evolution has unshared era of food self sufficiency but
has resulted in excessive use of harmful pesticides, insecticides
and other chemicals on crops too. The danger of contamination
looms large on human life and food chain. This generally rises
from the extensive use of chemicals of various kinds for the
agriculture crops and plants production.
It is being realized by the humanity at this juncture, that
the life on this earth stands at the crossroads in choosing the
alternative out of environment and development. Moreover the
problem of environmental degradation has assumed alarming
proportion. It has engulfed the entire human race. Not even a
single nation remained unaffected. In the quest for rapid
industrial development over the centuries, the environmental
development over the same period, the environmental quality
has been given subordination to developmental goals. The
152
modern age of technology has brought with it tremendous but
immediate benefits and equally serious long term recovery costs
in return.
Life of dignity and well being for everyone is the chief goal
that has been set for the international community and the
national government to achieve. As far as the role of India, in
this global movement of environment protection is concerned,
the problem of environmental degradation is not as acute as in
fully industrialized developed countries. The developmental
process in India is indeed on a rapid march but it too is
producing adverse effects too.
In the present study a large section of the population is
either unaware or partially aware about different aspects of
environment and environmental degradation. This has been
discussed in the chapter 4th with the help of data collected for
the present study. Here an attempt has been made to explain
how different socio-cultural factors lead to the degradation of
the environment. The data have been analysed with the view to
find out how many respondents have ideas about the specific
effects of various pollutants and further to find out the
characteristics of those who have and of those who do not have
such knowledge. The major factors which are responsible for
environmental degradation, which are discussed in present
chapter are as follows:
(a) Migration from rural to urban
(b) Urbanization
(c) Poverty
(d) Population
(e) Religious rituals
(f) Modern life style
(g) Festivals and fairs

153
(A) MIGRATION FROM RURAL TO URBAN
Migration constitutes the very foundation of the process of
urbanization. It also recognized as the Chief mechanism by
which urban centers continue to grow and develop. One view is
that urbanization stops when migration to urban centers stops.
Yet urban centers grow partly due to natural growth (excess of
births over deaths) and partly by inter-town movement. Such a
migration less situation could be identified as urban continuum
in terms of redistribution of population which is a consequence
of the very process of development. It is being recognized at
present that this type of interpretation is rather simplistic, and
even demographic explanation of migration in terms of age, sex,
education, occupation syndrome does not bring out the
diversity and complexity underlying migration, particularly in
the developing countries (Bose 1970).
A young male adult who is educated is identified as a
typical migrant. Sex composition gets more balanced with the
migrant moving with his family, migration of educated females
to cities in search of employment is an indication of social
change. There is no suggestion of sequence here, and all the
characteristics of migration can coexist in a developing country.
Continuing migration over a long period from polyglot source
areas into a resource potential areas into a resource potential
areas like plantation area, transforms the migrant groups into
"miniature plural societies," as in Coorg and Nilgins in the
Eastern Ghat region of South India (Steen Folke 1968).
Here, it is worth mentioning that the migration scheme
has four migration zones: two migration-source-areas, and two

154
migration-receiving-areas; two less developed and two more
developed The four zones are: (1) distressed areas with small
villages with no infra-structure and limited natural resources
endowment, and hence less developed; (2) areas with resources
potential and with some development but with limited infra-
structure and with larger villages; (3) more developed, but with
low order infra-structure and small towns. Both large villages
as zone two and small towns as zone there have the potential to
become 'urban' centers under integrated planning; (4) highly
developed and resources rich areas with cities and higher order
infrastructure. This is the zone of maximum pull from all the
other three zones. And the distance factor has little or no
significance in migration. This is the zone of metropolitanization
where the immigrant cities have a strong industrial base or
diversified occupational base with a developed territory sector
(Bhaskar et al. 1980).
During the decade 1951-61, the net rural to urban
migration accounted for 40.6 percent of the decade's urban
growth. Thus migration played a major role in urban growth.
During 1951-61 decade, 11.62 million Persons moved from
rural to urban areas, and reverse movement during the decade
was of the order only 3 million persons, both males and
females. In this way the migration from the rural to urban
increased in every decade (Premi 1981).
The migration is due to many reasons like migrant stream
belonging to low income but highly skilled, who both out
migrate and in migrate. These are the artisan classes who due
to lack of demand for their products and skills are forced to

155
leave their traditional profession and become labourers. These
are not drawn into any specific development plans at micro
regional level, and they often get lost in the ocean of 'weaker
sections' (Manmohan Singh 1979).
In contrast to these seasonal migrants, the rural to urban
migrant streams are becoming highly desperate and polarized:
one large stream consisting of the illiterate poor in search of
livelihood, and another, consisting of the rich educated and
elitist, in search of better opportunities. Proximity to a city or a
highway acts as a pull factor. The poor are pushed out of the
village, while the rich are pulled into the city. One stream
consists of the younger generation whose parents belongs to
upper and middle income groups, majority belonging to land
owning and business classes, and hence rooted to villages, but
having with city links. One result of these links is the
realization of the need for education and the associated skills.
This leads to a tendency to spend on education a prelude to
greater migration (Connel, et al. 1976).
In this way migration also effects the environment
because when people migrate to cities they need every thing for
their livelihood to fulfill their needs, on the other hand there is
a pressure on natural resources. We always take from nature
but never gave it back. So in the present study the researcher
finds out that how migration from rural to urban degrades the
environment. The researcher asked the respondents to mention
that is there any impact of migration on environment and how
it degrades the environment. The views and responses of the
respondents have been shown in the following table:

156
Table 5.1
Distribution of respondents according to their views
regarding migration degrades the environment
Whether migration degrades the
environment
Frequency Percentage
Yes 200 69.68
No 87 30.32
Total 287 100.00
The table given above reveals that a vast majority of the
respondents, i.e., 69.68 percent mentioned migration as a
factor of environmental degradation. A very lesser proportion of
the respondents, i.e., 30.32 mentioned "no" regarding migration
as a factor of environmental degradation. Majority of the
respondents mentioned "yes" this may be due to the fact that
they had a lots of problems emerged in urban area like
problems of housing. Over crowding, pollution, slums etc. with
migration.
Further the views of the respondents were correlated with
other socio-economic variables. But the Chi-square value too
reveals that the views of the respondents in this regard did not
have significant association with Age and occupation. However,
a clear trend is visible with regard to correlation with education
and income of the respondents. The data in this regards is
presented below in the following tables:

157
Table 5.2
Distribution of respondents according to their education
and their views regarding migration degrades the
environment
Whether the migration
degrades the environment
Education
Yes No
Total
Uneducated 25 (44.65) 31 (55.35) 56 (100)
Upto middle &
Secondary
18 (70.00) 12 (30.00) 30 (100)
Higher Secondary
& Graduate
55 (79.72) 14 (20.28) 69 (100)
Post Graduate &
Professionals
102 (77.27) 30 (22.73) 132 (100)
Total 200 (69.68) 87 (30.32) 287 (100)
X2 = 24.837, df=3, P > .0001
The table given above clearly shows that the respondents
from all the educational categories mentioned "yes" migration
as a factor of environmental degradation. Only 55.35 percent
from the educational category of uneducated and 30.00 percent
from upto middle and secondary mentioned "no" regarding
migration as a factor of environmental degradation. This may be
due to the fact that they never think about these things. The
Chi-square value also shows a significant association between
these two variables.

158
Further the views of the respondents correlated with
income of the respondents and the data in this regard is
presented in Table 5.3.
Table 5.3Distribution of respondents according to their income andthere views regarding migration degrades the environment
Whether the migration
degrades the environment
Monthly income
Yes No
Total
Less than Rs. 10000 35 (48.61) 37 (51.38) 72 (100)
Rs. 10001 to 20000 105 (77.2) 31 (22.8) 136 (100)
Above Rs. 20000 50 (80.64) 12 (19.36) 62 (100)
Not Applicable 10 (58.82) 7 (41.17) 17 (100)
Total 200 (69.68) 87 (30.32) 287 (100)
X2 = 23.254, df=3, P > .003
The trend is clear in the table given above that the views
of the respondents in "yes" is same in all the income categories
and vice-versa. They have a view that when people migrate to
cities from their native places like from villages there is a great
rush in cities. New colonies emerge without basic amenities.
The Chi-square value also shows a significant association
between these two variables.
Further the responses of the respondents that how
migration effects the environment is shown in the following
table:

159
Table 5.4Distribution of respondents according to their
responses that how migration from rural to urban degradesthe environment
Reasons Frequency Percentage
Cutting of Trees for houses. 81 28.22
Increase in slums 65 22.64
Urban population is increased 58 20.20
Some new unplanned colonies
developed without proper amenities
26 9.05
Increasing number of vehicles 28 9.75
No response. 29 10.14
Total 287 100.00
The table given above shows that 28.22 percent of the
respondents mentioned cutting of trees for houses as a reason
for environmental degradation. While 22.64 percent and 20.20
percent of respondents gave the response as more slums and
no proper sanitation. 9.05 percent and 9.75 percent mentioned
that with migration some unplanned colonies developed without
proper amenities and increased number of vehicles only 10.14
percent respondents had an indifferent view.
(B) URBANIZATION
There is a great deal of confusion in the use of terms
'urbanism' and 'urbanization' for an understanding and the
study of urbanization it is imperative to define such terms as
are used in literature in a loose manner. Urbanization is not
urbanism, as is commonly understood. Urbanism represents a
particular way or style of life, as contrasted with the rural,
agriculturally dominated communities, while urbanization

160
refers to the process whereby a traditionally rural bound
community, either the whole or a section, moves to adopt a
different pattern of living. In fact, the adaptation to the complex
traits or urban characteristics, as describe above, is 'urbanism'
(Beals, Ralph L. 1951).
According to Wirth, it is a way of life of urban places. He
defines urbanism as " that complex of traits which makes up
the characteristics mode of life in cities, and urbanization,
which denotes the development and extensions of these factors,
these are thus not exclusively found in settlements which are
cities in the physical and demographic sense, they do,
nevertheless, find their most pronounced expression in such
areas, especially in metropolitan cities (Wirth, Louis: 1930).
Growth of urban centers occupy significant place from
various angles, specially from India is a country economical and
cultural point of views of villages almost, at present almost 67
percent known for its rural cultures of its citizens live in the
rural areas. Urbanization is a process where by increasing
proportions of the population of a particular region or a country
live in urban areas. Urbanization has become a major
demographic issue in the 21st century not only in India but
also all over the world. There has always been great academic
interest in the Indian scholars in the process of growth and
development of Indian urbanization and a number of scholars
of different disciplines have analyzed India's urban experience,
particularly in the post independence period (Bose, 1978, NIVA
1988, Mohan, 1996). The level and kind of urbanization in
terms of the proportion of urban population of the total number
is quite low in India. However, the urban population in absolute

161
terms is high. Since the first regular census of India was
conducted in 1881, almost all census reports have commented
on the rate of urban growth. During the last three decades of
India, the link between urbanization and environment and the
treatment to the quality of human particular life have emerged
as a major issue (Mohan 1996).
Along with the several other social and economic benefits
of urbanization, there comes a plethora of environmental ills,
some of staggering proportion. Cities span less than three
percent of the land area of the world. But the intense
concentration of population, industry and energy use can lead
to severe local pollution and environmental degradation.
Furthermore, a city's ecological footprint extends far beyond its
urban boundaries of the forests, croplands, coal mines and
watersheds that sustain its inhabitants (UNEP 2008).
In the towns of the developing world where population
growth has out-placed the ability to provide vital infrastructure
and services, the worst environmental problems are
experienced quite close to home; with sever economic and social
impacts for urban residents. Inadequate household water
supplies, waste accumulation, and unsanitary conditions exact
an enormous toll on the world's one billion slum dwellers in
terms of unnecessary death and disease. Cities in developing
countries also experience the world's worst urban area
degradation as a result of rapid industrialization and increased
motorized transport worldwide, urban air degradation is
estimated to cause one million premature deaths each year and

162
cost two percent of GDP in developed countries and five percent
in developing countries (UNEP 2008).
In the present chapter respondents were asked to mention
their views regarding urbanization whether it is degrading the
environment or not. The data in this regard is presented in the
following tables.
Table 5.5
Distribution of the respondents according to their views
whether urbanization degrades the environment
Whether urbanization degrades the
environment
Frequency Percentage
Yes 215 74.91
No 72 25.09
Total 287 100.00
The table given above depicts that majority of the
respondents, i.e., 74.19 percent mentioned that the increasing
urbanization degrades the environment. Only 25.09 percent
mentioned "no". Those respondents who mentioned "yes" this
may be due to the fact that they were aware about the
consequences of unplanned development of urbanization. And
those who stated "no' may not have this kind of vision.
Further the views of the respondents were correlated with
other socio-economic variables like age, education, occupation
and income. And the data in this regard is presented in Table
5.6.

163
Table 5.6
Distribution of the respondents according to their age and
their views regarding whether the growth of urbanization
degrades the environment
Whether the growth of
urbanization degrades the
environment
Age
Yes No
Total
20 to 40 years 145 ( 77.55) 42 (22.45) 187 (100)
41 to 60 years 60 ( 71.43) 24 (28.57) 84 (100)
60 years & above 8 (50.00) 8 (50.00) 16 (100)
Total 215 (74.91) 72 (25.09) 287 (100)
X2 = 6.025, df=2, P < .04
The table given above depicts that a vast majority of the
respondents from the age category of 20 to 40 years and 41 to
60 years mentioned growth of urbanization degrades the
environment. While on the other hand very lesser proportion
from all the age categories said "no' regarding growth of
urbanization degrades the environment. The table also shows
as the age increases their responses decreases in "yes" this may
be due to the fact that they were not much aware about how
growth of urbanization degrades the environment. The Chi-
square value also shows a significant association between these
two variables.
Further the views of the respondents were correlated with
the education of the respondent and their views in this regard
are presented in Table 5.7:

164
Table 5.7
Distribution of the respondents according to their
education and their views regarding whether the growth of
urbanization degrades the environment
Whether the growth of
urbanization degrades the
environment or not
Education
Yes No
Total
Uneducated 26 (46.42) 30 (53.58) 56 (100)
Upto middle &
Secondary
20(66.66) 10 (33.34) 30 (100)
Higher Secondary
& Graduate
49(71.02) 20 (28.98) 69 (100)
Post Graduate &
Professionals
120 ( 90.90) 12 (9.10) 132 (100)
Total 215 (74.91) 72 (25.09) 287 (100)
X2 = 43.792, df=3, P > .001
The table given above clearly shows that an overwhelming
majority from the educational category of post graduates and
professionals mentioned that growth of urbanization degrades
the environment followed by higher secondary and graduate.
The trend is clear in the table that as the education level
increases their responses also increases in "yes" and vice-versa.
The Chi-square value also shows a significant association
between these two variables.
Again the views of the respondents were correlated with
their respective occupation. The data in this regard is presented
in the Table 5.8.

165
Table 5.8
Distribution of the respondents according to their
occupation and their views regarding whether the growth of
urbanization degrades the environment
Whether the growth of
urbanization degrades the
environment
Occupation
Yes No
Total
Agriculture 30 (65.38) 16 (34.62) 46 (100)
Business Class 60(73.17) 22(26.83) 82 (100)
Service Class 105 (89.74) 12 (10.26) 117 (100)
Daily wages & Labour 10 (41.66) 4 (58.34) 24 (100)
Total 205 ( 71.42) 64(22.28) 287 (100)
X2 = 6.396, df=3, P > .09*household category was excluded from the table because household is notconsidered as occupation.
The table given above reveals that a vast majority of the
respondents from the occupational categories of service
mentioned that the growth of urbanization is responsible for
environmental degradation followed by the occupational
categories of business & agriculture. The table also shows that
from the occupational category of daily wages/labourers, i.e.,
41.66 percent mentioned "yes" which means growth of
urbanization degrades the environment. While from the same
category 58.34 percent mentioned "no". Which means this does
not make any impact. This may be due to the fact that they did
not make any mental exercise in these lines and having lack of
knowledge. The Chi-square value also shows a significant
association between these variables.

166
The views of the respondents were also correlated with
their income and the data in this regard is present in the table
given below:
Table 5.9
Distribution of the respondents according to their income
and their views regarding whether the growth of
urbanization degrades the environment
Whether the growth of
urbanization degrades the
environment
Monthly income
Yes No
Total
Less than Rs. 10000 51 (70.83) 21 (29.17) 72 (100)
Rs. 10,001 to 20000 99(72.79) 37 (27.21) 136 (100)
Above Rs. 20,000 55 (88.70) 7(11.30) 62 (100)
Not applicable 10 (58.82) 7 (41.18) 17 (100)
Total 215 (74.91) 72 (25.09) 287 (100)
X2 = 9.584, df=3, P > .05
This table indicates that a very high percentage (88.70%)
of the respondents from the high income category were of the
opinion that environment is degraded by increasing
urbanization followed by middle and lower income groups.
While those who mentioned that it do not have any impact on
environment were more in percentage from not applicable. The
Chi-square value also shows the significant association between
these two variables.
Further the researcher also asked to mention that how
development of urbanization degrades the environment and the
responses, in this regard is shown in the table given below.

167
Table 5.10
Distribution of the respondents according to their
responses regarding the how the growth of urbanization
degrades the environment
Responses Frequency Percentage
Development of new industries in
urban centers
62 21.83
Small scale industry like dairies,
poultry farms, dying cloths etc.
52 18.11
Increasing no. of vehicles. 51 17.77
More automobile workshops 23 8.01
Development of slums 27 9.40
No response 72 25.08
Total 287 100.00
The table given above reveals that 21.83 percent of the
respondents were of the view that with the growth of
urbanization there are developments of new industries. 18.11
percent of the respondents had a view that there is a increase of
small scale industry like dairies, poultry, dying clothes etc.
17.77 percent of the respondents mentioned that with the
growth of urbanization there is a increasing number of vehicles
in urban areas and 9.4 percent and 8.01 percent of the
respondents mentioned that there is increase in slums and
more automobiles workshops are developed in urban centers.
(C) POVERTY
In economic sense, it is defined as a state where in an
individual cannot satisfy his minimum wants for healthy living
in a given social environment (Singh, R.R. 1980). Poverty in this
sense is both relative and absolute. Relative poverty shows that

168
some have more of goods and services at their command than
other. Absolute poverty is the insufficiency of basic necessities
for a healthy life.
Kurein considered poverty as a 'Socio-economic'
phenomenon whereby the resources available to a society are
used to satisfy the wants of the few, while the many do not have
even their basic needs met. It is according to him, essentially a
'Social phenomenon and only secondarily a material or physical
phenomenon (Kurein 1978).
Environmental degradation particularly during the past
few decades has comes to a prominent problem as well as one
of the most important current global issues (Desta 1999). There
is a general consensus that poverty is a major cause of
environmental degradation. Poverty is one of the greatest
threats to the environment. Jalal also argued that
environmental degradation is the consequence of population
growth and stagnant population are closely linked with the fast
spread of acute poverty in several Asian countries. The poor
families who have to meet short term needs damage the natural
capital by excessive cutting of trees for firewood and failure to
replace soil nutrients (Jalal 1993).
Poverty is a curse. So it also affects the environment
adversely. Indeed, there is close and direct relation to between
environment and poverty. More the poverty, more aggregated
will the environmental problems. Nearly half the rural
population of the developing world lives below the official
poverty line. Poverty does not only degrade human environment
but also leads to obstruction in the way of development. It can
be noticed in the form of ultimately lack of these amenities.
Inadequate shelter, the slum dwellers, lack of potable water and
sanitation facilities, result in environment degradation because

169
they do not find any other way but to use the available
alternative e.g. drains for toilet, live in a place which is already
polluted, use contaminated water, generate waste vitiating the
environment further. Moreover the rapidly growing urban areas
of the developing world become vulnerable to environment
crises. Growing pressure on land, removal of forest cover,
callous use of chemicals and fertilizers and soil erosion reduce
the agriculture potential of scarce land resources causing
further increase in poverty. The persistence of mass poverty
places severe pressure on natural resources and public services
and infrastructure.
At the very outset various establishment remain in need
of economic means to deal with issues of water, nutrition and
human settlement of the poor in the developing world. To check
poverty, the foremost measure to be adopted, is to check
population, because it is the increasing population that not
only breeds poverty, it is the mother of all it is related to
environment.
The respondents were asked to mention that is poverty a
factor of environmental degradation. The view of the
respondents in this regard is presented in the following tables:
Table 5.11
Distribution of the respondents according to their views
regarding whether poverty degrades the environment
Whether poverty degrade theenvironment
Frequency Percentage
Yes 243 84.66
No 44 15.34
Total 287 100.00

170
The preceding table depicts that majority of the
respondents 84.66 percent mentioned poverty as a factor of
environmental degradation. A very lesser proportion of the
respondents mentioned "no". This may be due to the fact that
everyone knows if a person has no basic amenities he exploits
environment to fulfill his needs like open toilets, cutting trees
for fuel etc.
Further the views of the respondents were correlated with
other socio-economic variables like age, education occupation
and income of the respondents. And the data in this regard is
presented in the following tables.
Table 5.12
Distribution of the respondents according to their age and
their views regarding whether poverty degrades the
environment
Whether Poverty degrades the
environments
Age
Yes No
Total
20 to 40 years 172 ( 91.97) 15 (8.03) 187 (100)
41 to 60 years 61 ( 72.61) 23 (27.39) 84 (100)
61 years & above 10 (62.5) 6 (37.5) 16 (100)
Total 243 (84.66) 44 (15.34) 287 (100)
X2 = 23.151, df=2, P > .0009
The table given above reveals that an overwhelming
majority of respondents form the age category of 20 to 40 years
mentioned poverty as a factor of environmental degradation.
72.61 from the age category of 41 to 60 years and 62.5 percent
from 61 years and above also mention "yes". On the other hand
37.5 percent form 61 years and above, 27.39 percent form 41 to

171
60 years and only 8.03 percent from the age category of 21 to
40 years. This shows that as the age increases their views
regarding poverty as a factor for environmental degradation
decrease. This may be due to the fact that aged people did not
think poverty as a factor of environmental degradation. The
Chi-square value also shows a significant association between
these two variables.
Further the data was correlated with the education
category of the respondent and the data is presented in the
following table given below.
Table 5.13
Distribution of the respondents according to their
education and their views regarding whether poverty
degrades the environment
Whether the poverty
degrades the environment
Education
Yes No
Total
Uneducated 45 (80.35) 11 (19.65) 56 (100)
Up-to middle &
Secondary
18 (60.00) 12 (40.00) 30 (100)
Higher Secondary &
Graduate
59 (85.50) 10 (14.50) 69 (100)
Post Graduate &
Professionals
121 (91.66) 11 (8.34) 132 (100)
Total 243 (84.66) 44 (15.34) 287 (100)
X2 = 19.884, df=3, P > .0001
The table given above reveals that an overwhelming
majority of the respondents from the educational category of
Post Graduate and professionals mentioned poverty as a factor
172
of environmental degradation. The table also shows that from
all the educational categories respondents mentioned poverty
as a factor of environmental degradation in majority. This may
be due to the fact that everyone knows if a person is poor he
use natural resources to fulfill his needs, this degrades the
environment because he is not above to fulfill natures needs.
The Chi-square value also shows a significant association
between these two variables.
The data is also correlated with the occupation of the
respondents and their views regarding poverty as a factor of
environmental degradation. The data in this regard is presented
below in following table.
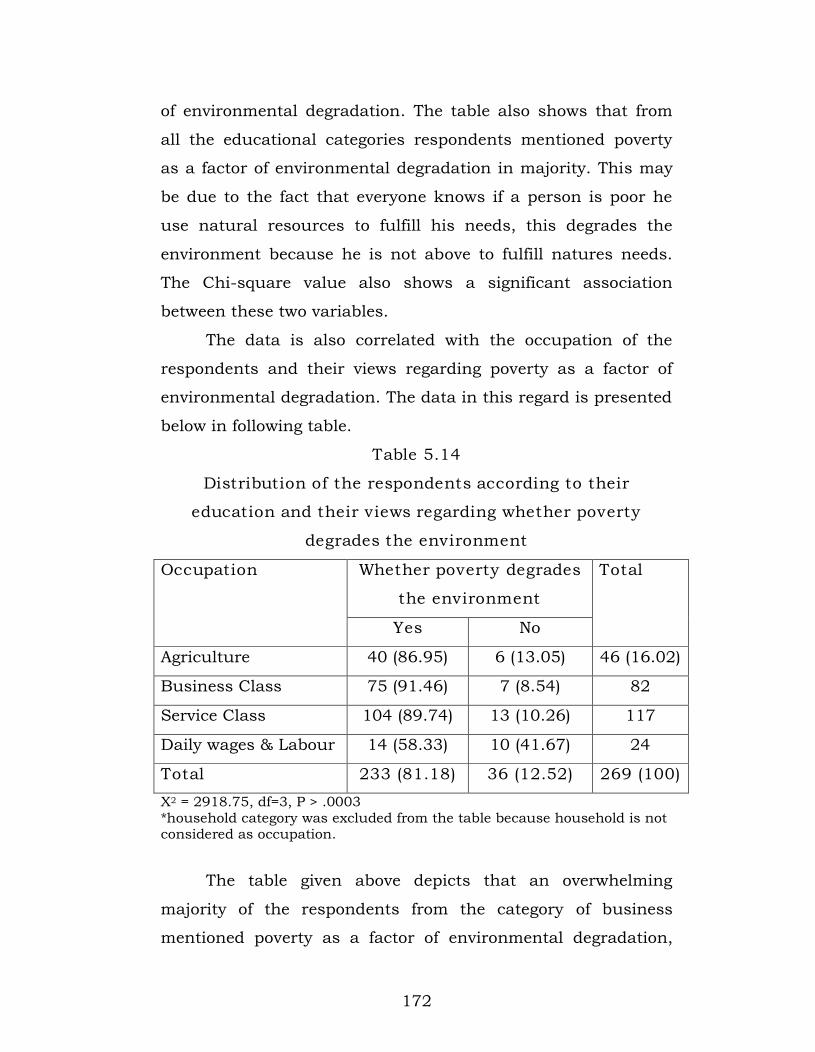
Table 5.14
Distribution of the respondents according to their
education and their views regarding whether poverty
degrades the environment
Whether poverty degrades
the environment
Occupation
Yes No
Total
Agriculture 40 (86.95) 6 (13.05) 46 (16.02)
Business Class 75 (91.46) 7 (8.54) 82
Service Class 104 (89.74) 13 (10.26) 117
Daily wages & Labour 14 (58.33) 10 (41.67) 24
Total 233 (81.18) 36 (12.52) 269 (100)
X2 = 2918.75, df=3, P > .0003*household category was excluded from the table because household is notconsidered as occupation.
The table given above depicts that an overwhelming
majority of the respondents from the category of business
mentioned poverty as a factor of environmental degradation,

173
followed by service and Agriculture categories. On the other
hand very lesser proportion of the respondents said "no". From
the occupational category of daily wages /laborers i.e. 41.67
percent mentioned "no" they too were poor and they were of the
opinion that this made no difference (Es naal Kuj nahi Wigd
da). While those who mentioned 'yes" were have very strong
view regarding this. The Chi-square value also shows a
significant association between these two variables.
Further the views of the respondents were correlated with
their income and the data in this regard is presented in the
following table.
Table 5.15
Distribution of the respondents according to their views
regarding whether poverty degrades the environment
Whether poverty degrades
environment
Monthly income
Yes No
Total
Less than Rs. 10000 55 (76.38) 17 (23.62) 72 (100)
Rs. 10001 to 20000 124 (91.17) 12 (8.83) 136 (100)
Above Rs. 20000 52 (83.87) 10 (16.12) 62 (100)
Not applicable 12 (70.58) 5 (29.42) 17 (100)
Total 243 (84.66) 44 (15.34) 287 (100)
X2 = 10.867, df=3, P < .01
The table given above clearly shows that the respondents
from all the income categories considered poverty as a factor of
environmental degradation. The table also shows that a higher
proportion of those who mentioned that poverty do not make
any dent on the environment were from the income category of
less than Rs. 10000. There were 17 respondents who had no
174
income in majority stated that poverty is responsible for
environmental degradation. But among them even 29.42
percent were of the opinion that poverty is not responsible for
environmental degradation. This clearly shows that income of
an individual has impact on their thinking. The Chi-square
value also shows a significant association between these two
variables.
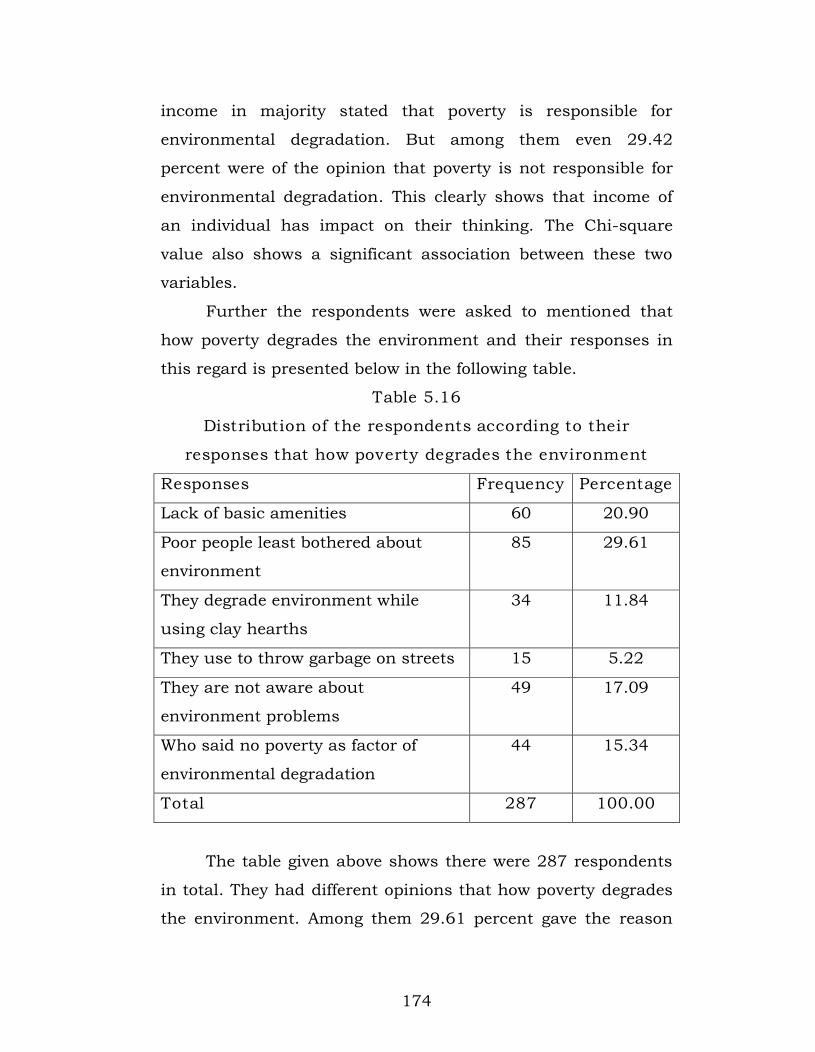
Further the respondents were asked to mentioned that
how poverty degrades the environment and their responses in
this regard is presented below in the following table.
Table 5.16
Distribution of the respondents according to their
responses that how poverty degrades the environment
Responses Frequency Percentage
Lack of basic amenities 60 20.90
Poor people least bothered about
environment
85 29.61
They degrade environment while
using clay hearths
34 11.84
They use to throw garbage on streets 15 5.22
They are not aware about
environment problems
49 17.09
Who said no poverty as factor of
environmental degradation
44 15.34
Total 287 100.00
The table given above shows there were 287 respondents
in total. They had different opinions that how poverty degrades
the environment. Among them 29.61 percent gave the reason
175
that poor people are least bothered about environment, followed
by 20.90 percent who said that the poor have lack of basic
amenities like wash rooms, toilets, proper kitchens etc. 17.09
percent among those said that people of this category are not
aware about environmental problems. There were 15.34 percent
respondents who were of the view that poverty does not degrade
the environment. 11.84 percent of the respondents were of the
view that the poor use clay hearths (Kacha Chulha) using wood,
cow dung which emits carbon-dioxide or smoke which is a big
factor of environmental degrades. Only 5.22 percent stated that
the people living under poverty used to throw garbage in the
open. In this way the poverty becomes a big challenge for the
environment degradation.
(D) POPULATION
Population is indeed an important source of growth and
development, but the same time it becomes a major source of
environmental degradation when it exceeds the threshold limits
of the support systems. Unless the relationship between the
multiplying population and the life support system can be
stabilized, development programmes, however, innovative are
not likely to yield desired results. Population impacts on the
environment primal through the use of natural resources and
production of wastes and is associated with environmental
stresses like loss of biodiversity, air and water degradation and
increased pressure on arable land.
Ecological balance is associated with population growth or
increase because population growth requires facilities which
host plastic vector interaction. Population growth is an
important aspect that determines the production, distribution
and utilization of the natural resources of an area. It is one of

176
the key factors responsible for the environmental degradation.
There is an inmost relationship between individual and
environment.
In this context the respondent were asked to state if
increase of population is a factor of environmental degradation
or not. The data in this regard is cited below in the form of
tables.
Table 5.17
Distribution of the respondents according to their views
whether growth of population degrades the environment
Whether the growth of population
degrades the environment
Frequency Percentage
Yes 215 74.91
No 72 25.09
Total 287 100.00
The table given above show that 74.91 percent of the
respondents mentioned population as factor of environmental
degradation. While only 25.09 percent of the respondents
mentioned "no", means population did not degrade the
environment. This may be due to the fact that every person
knows that if their will be more growth of population it will need
more space for residence, more food grains, more hospitals,
more colleges, universities and more vehicle etc. which we know
that effect the environment adversely.
Further the views of the respondents correlated with other
socio-economic variables like age, education, occupation and
income of the respondents. The data in this regard is presented
in Table 5.18.
177
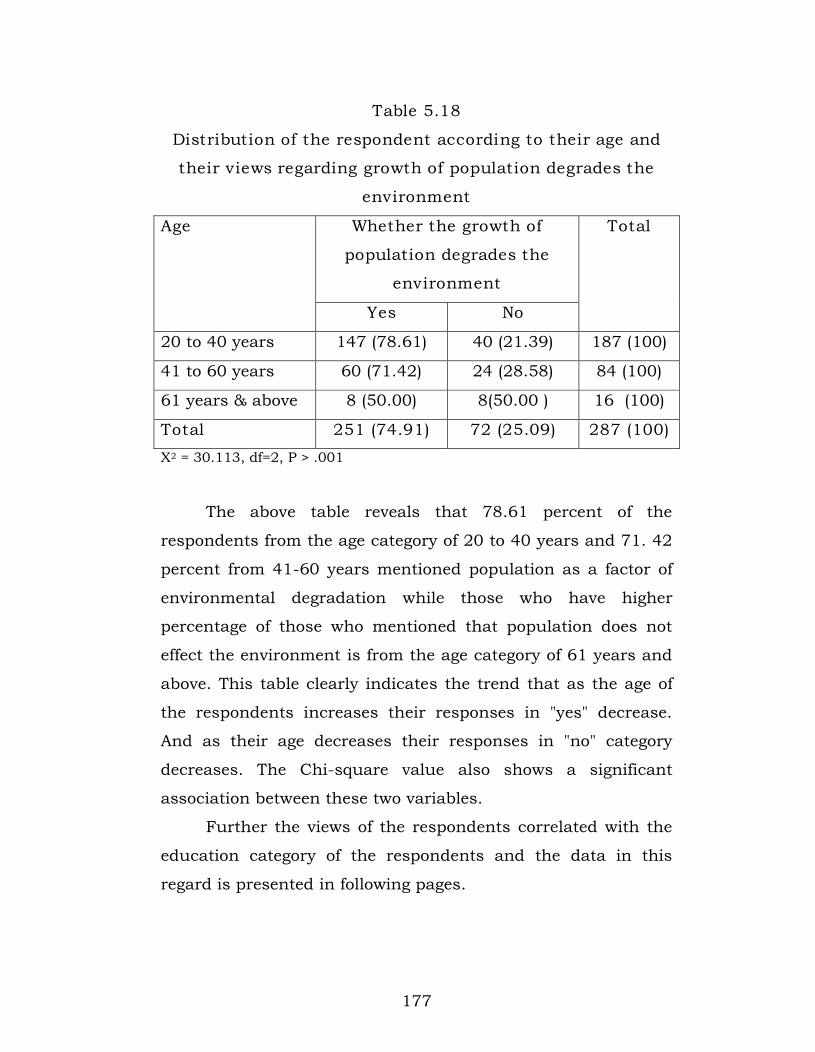
Table 5.18
Distribution of the respondent according to their age and
their views regarding growth of population degrades the
environment
Whether the growth of
population degrades the
environment
Age
Yes No
Total
20 to 40 years 147 (78.61) 40 (21.39) 187 (100)
41 to 60 years 60 (71.42) 24 (28.58) 84 (100)
61 years & above 8 (50.00) 8(50.00 ) 16 (100)
Total 251 (74.91) 72 (25.09) 287 (100)
X2 = 30.113, df=2, P > .001
The above table reveals that 78.61 percent of the
respondents from the age category of 20 to 40 years and 71. 42
percent from 41-60 years mentioned population as a factor of
environmental degradation while those who have higher
percentage of those who mentioned that population does not
effect the environment is from the age category of 61 years and
above. This table clearly indicates the trend that as the age of
the respondents increases their responses in "yes" decrease.
And as their age decreases their responses in "no" category
decreases. The Chi-square value also shows a significant
association between these two variables.
Further the views of the respondents correlated with the
education category of the respondents and the data in this
regard is presented in following pages.

178
Table 5.19
Distribution of the respondent according to their education
and their views regarding growth of population degrades
the environment
Whether the growth of
population degrades the
environment
Education
Yes No
Total
Uneducated 30 (53.57) 26 (46.43) 56 (100)
Upto middle & Secondary 20 (66.66) 10 (33.34) 30 (100)
Higher Secondary &
Graduate
50 (72.46) 19 (27.54) 69 (100)
Post Graduate &
Professionals
115 (87.12) 17 (12.88) 132 (100)
Total 215 (74.91) 72 (25.09) 287 (100)
X2 = 25.346, df=3, P > .0001
The table given above reveals that a vast majority i.e.
87.12 percent of the respondent from the educational category
of post graduate and professionals mentioned that growth of
the population degrades the environment followed by the
educational category of higher secondary and graduates and
upto middle and secondary and uneducated respectively. The
trend is clear in the table that as the education of the
respondent' increases their views also increases in "yes" and
vice-versa. This may be due to the fact an educated person
know about all the parameters of environmental degradation it
means education has the great impact on the individual's life
and its behaviours towards natural environment. The Chi-

179
square value also shows the significant association between
these two variables.
Further the views of the respondents were correlated with
the occupation of the respondents and the data in this regard is
presented below:
Table 5.20
Distribution of the respondent according to their
occupation and their views regarding growth of population
degrades the environment
Whether the growth of
population degrades the
environment
Occupation
Yes No
Total
Agriculture 33 (71.73) 13 (28.27) 46 (100)
Business Class 59 (71.95) 23 (28.05) 82 (100)
Service Class 101 (86.32) 16 (13.68) 117 (100)
Daily wages &
Labour
10 (41.66) 14 (58.34) 24 (100)
Total 203 (75.46) 66 (24.54) 287 (100)
X2 = 23.151, df=3, P > .0003*household category was excluded from the table because household is notconsidered as occupation.
The table given above depicts that the data from service,
business and agricultural occupation represent that majority of
the respondent mentioned "yes" which means population
growth effects the environment negatively. The table also shows
that only 41.66% of the respondent from the occupational
category of and labourers mentioned 'yes'. On the other side a
majority of the respondents from the occupational category of
labourers were of the view that the growth of population is not a
180
factor for environmental degradation. This may be due to the
fact of their lack of knowledge regarding environmental issues.
The Chi-Square values also show a significant association
between these two variables.
The views of the respondents were again correlated with
the income of the respondent and the data in this regard is
presented in the following table.
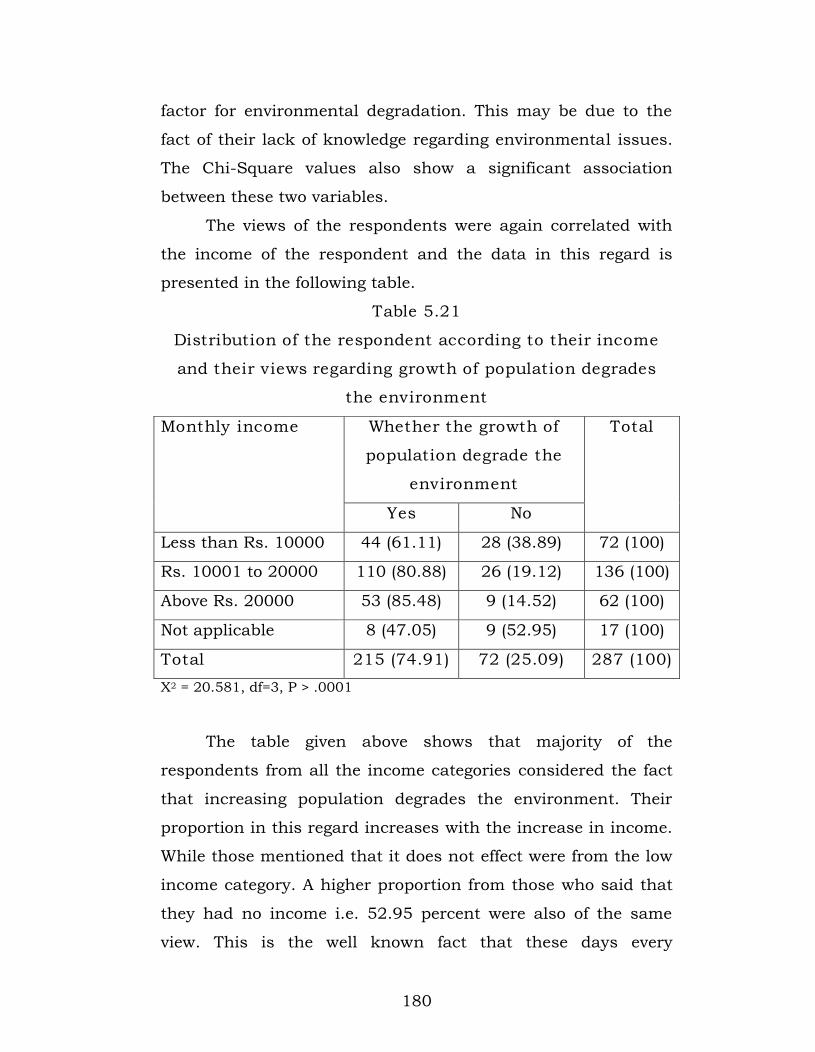
Table 5.21
Distribution of the respondent according to their income
and their views regarding growth of population degrades
the environment
Whether the growth of
population degrade the
environment
Monthly income
Yes No
Total
Less than Rs. 10000 44 (61.11) 28 (38.89) 72 (100)
Rs. 10001 to 20000 110 (80.88) 26 (19.12) 136 (100)
Above Rs. 20000 53 (85.48) 9 (14.52) 62 (100)
Not applicable 8 (47.05) 9 (52.95) 17 (100)
Total 215 (74.91) 72 (25.09) 287 (100)
X2 = 20.581, df=3, P > .0001
The table given above shows that majority of the
respondents from all the income categories considered the fact
that increasing population degrades the environment. Their
proportion in this regard increases with the increase in income.
While those mentioned that it does not effect were from the low
income category. A higher proportion from those who said that
they had no income i.e. 52.95 percent were also of the same
view. This is the well known fact that these days every

181
individual knows the consequences of the increasing
population. The respondents from "Not applicable category
means no income" and the low income may not aware about the
population problems. The Chi-square value also shows a
significant association between these two variables.
Further the respondents were asked to mention that how
growth of population degrades the environment and their
responses are as follows:
Table 5.22
Distribution of the respondents according to their
responses regarding how the growth of population degrades
the environment
Responses Frequency Percentage
Large population disturbs the
balance of earth
62 21.60
More exploitation of natural
resources
59 20.75
More changes to make our
surrounding dirty
23 8.01
More poverty & more slums 61 21.24
Sanitation problems 10 3.40
Lack of space for house, more
cultivation deforestation.
72 25.0
Total 287 100.00
The table given above reveals that 21.60 percent of the
respondents mentioned that with the increasing population
which disturbs the balance of earth. 21.24 percent mentioned
that more changes to make our surrounding dirty. 2075

182
percent mentioned that there are more exploitation of natural
resources. Some of them mentioned that there is more poverty,
sanitation problems are there with increasing population.
(E) RELIGIOUS RITUALS
According to Jonathan Z. Smith ritual is "a means of
performing the way things ought to be in conscious tension to
the way things are" (Jonathan 1982). Emile Durkheim
suggested ritual has important consequences for both the
individual and the group. It is primarily through ritual that
group member some to identify with the group and its goal. At
the same time, rituals allows groups to remember their shared
traditions and to revitalize their collective consciousness
(Durkheim 1976).
Rituals are major components of all religions, and they
are the primary "building blocks" of religious institutions.
Rituals are more or less fixed sequence of behaviour that
assume special importance when performed within a religious
context (Morinis 1992).
India is popularly known as a country of religious rituals,
festivals & fairs. Undoubtedly, here every aspect of life is
governed by religion and its rights and rituals. Since time
immemorial Indians have been living on the mercy of the
nature. The elements of the nature have become part of the
religion in this country.
But with the development and modern lifestyle of people
they don’t bother about the environment. They consciously and
unconsciously degrade the environment at the name of religion.
For instance, they perform certain kind of duties which they

183
said it is related to their religion, like the Jagrata, Kirtan, etc.
According to them it is religious ritual but unconsciously the
loud noises from Jagrata actually creates loud noise, which
degrades the environment. Likewise people go for langar or
banadara which creates a garbage problem like in langar the
utensils are replaced these days by disposable material but
actually they are not dispose off because these are made of
plastic which is not bio-degradable. After the langar or bandara
no one cares about the garbage which creates from langar.
Another ritual is immersion of idols in water in the festival
season like in Navaratras. The idols of deities are made of some
of dayor plast of Paris which is painted by toxic colours which
is very harmful for water and also degrades the environment.
One more thing may be to highlighted that now these days
there is trend of worshipping or showing respect to Sooth
Sayers. People, mostly the ladies go to them for their family or
other personal problems for some solution. To solve their
problems the sooth sayers usually ask them for immersion of a
coconuts or other things like some kind of idols of elephant,
horse etc. some times it is also a toxic material which degrades
the environment. These all practices take place or things
happen in the name of religious rites and rituals. All these
rituals are responsible for environmental degradation in one
way or the other.
The respondents were asked to mention that is the
religious rituals degrade the environment or not. Their views in
this regard are presented below in the following tables.

184
Table 5.23
Distribution of the respondents according to their views
whether religious rituals degrades the environment
Whether religious rituals degrades
the environment
Frequency Percentage
Yes 167 58.18
No 120 41.82
Total 287 100.00
The table given above shows that a higher percentage i.e.
58.18 percent of the total mentioned that the religious rituals
degrades the environment. While on the other hand 41.82
percent of the respondents mention that religious rituals does
not pollute the water by the immersion of idols of the Devi
Devtas. They have a view that with it water becomes pure.
Those respondents who said that water becomes polluted with
these activities may have logical thinking behind their such
consideration.
Further the views of the respondents were correlated with
other socio-economic variables like age, education, occupation
and income. The data in this regard is presented in the
following tables.
185
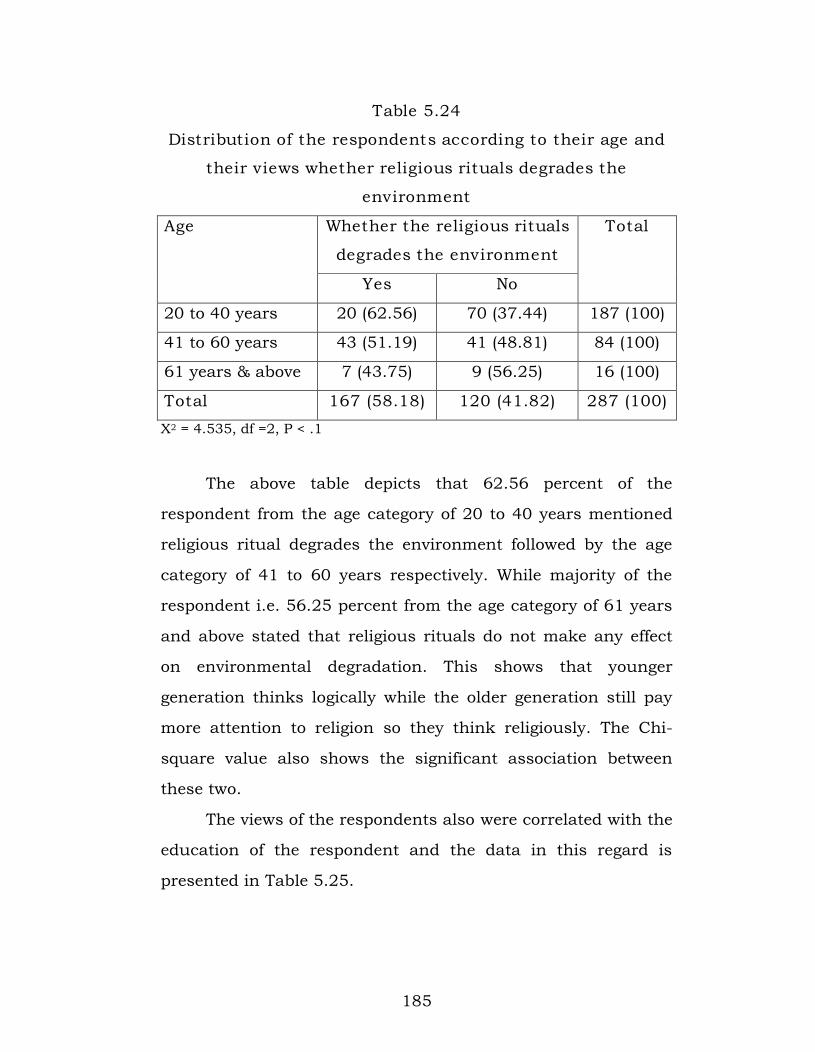
Table 5.24
Distribution of the respondents according to their age and
their views whether religious rituals degrades the
environment
Whether the religious rituals
degrades the environment
Age
Yes No
Total
20 to 40 years 20 (62.56) 70 (37.44) 187 (100)
41 to 60 years 43 (51.19) 41 (48.81) 84 (100)
61 years & above 7 (43.75) 9 (56.25) 16 (100)
Total 167 (58.18) 120 (41.82) 287 (100)
X2 = 4.535, df =2, P < .1
The above table depicts that 62.56 percent of the
respondent from the age category of 20 to 40 years mentioned
religious ritual degrades the environment followed by the age
category of 41 to 60 years respectively. While majority of the
respondent i.e. 56.25 percent from the age category of 61 years
and above stated that religious rituals do not make any effect
on environmental degradation. This shows that younger
generation thinks logically while the older generation still pay
more attention to religion so they think religiously. The Chi-
square value also shows the significant association between
these two.
The views of the respondents also were correlated with the
education of the respondent and the data in this regard is
presented in Table 5.25.

186
Table 5.25
Distribution of the respondents according to their
education and their views regarding whether religious
rituals degrades the environment
Whether the religious
rituals degrades the
environment
Education
Yes No
Total
Uneducated 20 (31.71) 36 (64.29) 56 (100)
Upto middle &
Secondary
15 (50.00) 15 (50.00) 30 (100)
Higher Secondary &
Graduate
44 (63.76) 25 (36.24) 69 (100)
Post Graduate &
Professionals
88 (66.66) 44 (33.34) 132 (100)
Total 167 (58.18) 120 (41.82) 287 (100)
X2 = 17.235, df=3, P < .0006
The above table clearly indicates that as the education of
the respondents increase their views also increase in "yes" and
as the educational level decreases their views increases in "no" .
This may be due to fact that an educated person pay more
attention towards environmental problems while on the other
side uneducated or less educated people may not take this kind
of issues seriously. People do not bother about environment
their only thinking is to perform the rituals to full fill their
wishes. The Chi-square value also shows a significant
association between these two variables.

187
Again the views of the respondent were correlated with the
occupation of the respondents and the data in this regard is
presented below
Table 5.26
Distribution of the respondent according to their
occupation and their views regarding whether religious
rituals degrades the environment
Whether religious rituals
degrades the environment
Occupation
Yes No
Total
Agriculture 24 (52.17) 22 (47.83) 46 (100)
Business Class 45 (54.87) 37 (45.13) 82 (100)
Service Class 80 (68.37) 37 (31.63) 117 (100)
Labour 8 (33.33) 16 (66.67) 24 (100)
Total 157 112 287 (100)
X2 = 12.15, df=3, P < .006*household category was excluded from the table because household is notconsidered as occupation.
The table given above shows that 68.37 percent of the
respondents from service, 54.87 percent from Business, 52.17
percent from Agriculture and only 33.33 percent from laboures
respectively supported this views that religious rituals degrades
the environment. On the other side 66.67 percent from
labourers, 47.83 percent from agriculture, 45.13 percent from
business and only 31.63 percent from agriculture, 45.13
percent from business and only 31.63 percent from service
mentioned "no". A very clear trend is there that a vast majority
of there respondents i.e. 68.37 percent from service class
mentioned that religious rituals degrades the environment while
on the other side vast majority of the respondents from daily
188
wages/ labour means low profile occupations said that this do
not degrade the environment. Which again shows the
respondents from low profile occupation has strong belief in
nature or religious activities. The Chi-square value also shows
that a significant association between these two variables.
The views of the respondents were correlated with the
income of the respondent and the data in this regard is
presented below.
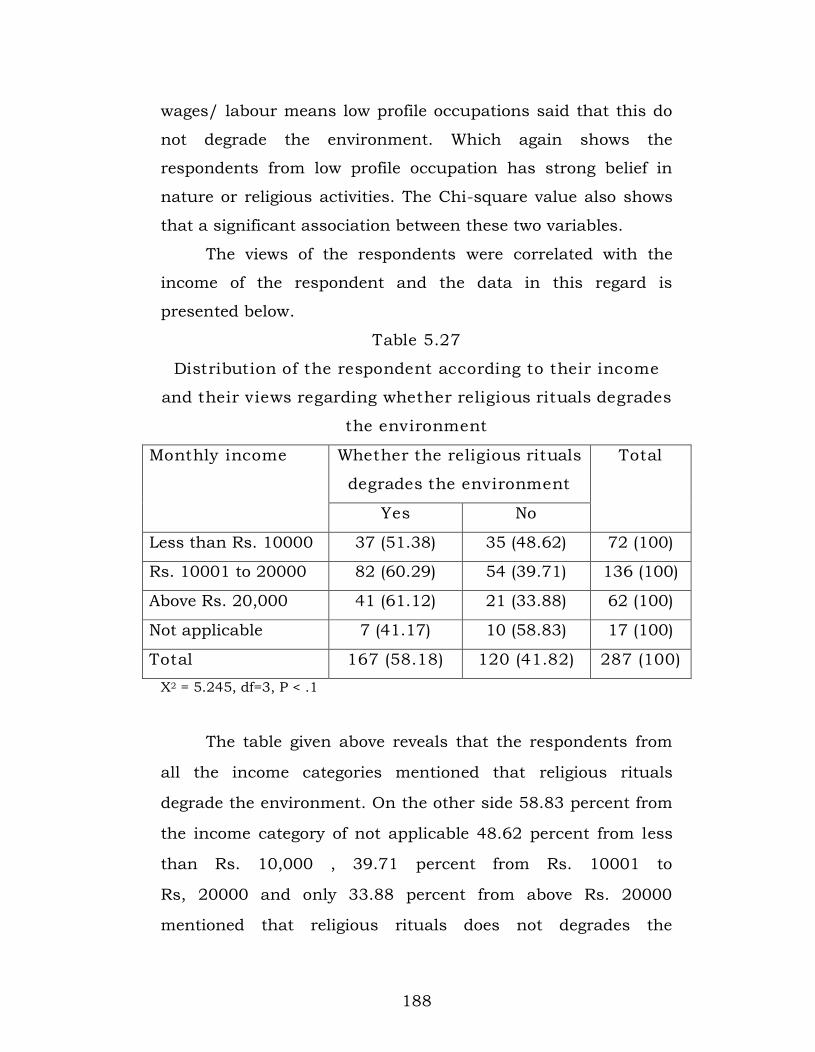
Table 5.27
Distribution of the respondent according to their income
and their views regarding whether religious rituals degrades
the environment
Whether the religious rituals
degrades the environment
Monthly income
Yes No
Total
Less than Rs. 10000 37 (51.38) 35 (48.62) 72 (100)
Rs. 10001 to 20000 82 (60.29) 54 (39.71) 136 (100)
Above Rs. 20,000 41 (61.12) 21 (33.88) 62 (100)
Not applicable 7 (41.17) 10 (58.83) 17 (100)
Total 167 (58.18) 120 (41.82) 287 (100)
X2 = 5.245, df=3, P < .1
The table given above reveals that the respondents from
all the income categories mentioned that religious rituals
degrade the environment. On the other side 58.83 percent from
the income category of not applicable 48.62 percent from less
than Rs. 10,000 , 39.71 percent from Rs. 10001 to
Rs, 20000 and only 33.88 percent from above Rs. 20000
mentioned that religious rituals does not degrades the

189
environment. This shows that as the income level of the
respondent increase their views also increase in "yes" and as
the income level decrease their views increase in "no". This may
be due to the fact that higher income groups of respondents
were much aware and think logically. But lower level income
group respondents have much faith in rituals. The Chi-square
value also shows a significant association between these two
variables.
(F) MODERN LIFE STYLE
When we talk about modern life style first of all one sees
an intense attraction among the youths throughout the world,
for the so called pop music whether it be rock, heavy speakers
or other forms and the wearing of such typically modern
dresses, which reflect the ideas of freedom from constraint and
of mobility and of the individual declaration of independent
from social norms. There is also the craze of fast cars and other
big vehicles which creates thrill. There are sources of
entertainment which involves speed and daring acts which one
can see in western made movies. Most of the Youth are
traveling fast without knowing where to go. This fascination
with the everyday modern life style is shown on television and
other forms of mass media transmitting the cultural values of
the modern or so called post modern world.
The other significant impact of modern lifestyle is the
emergence of fast food restaurants. Fast food is common to all
of us. Now most of us in a hectic life, as a result fast food
become a part of our life, it can be faster to pick up some food
rather than make it yourself. It is easy and faster than we cook
190
it our self at home which we must prepared many ingredients
for cook one meal. Yet, fast food will bring effect to your health
and environment, because if the need of fast food is increasing,
to fulfill the needs more restaurants has been to open for this
they need land and for it cutting of trees is also increased and
the great rush is also increased which degrade the
environment.
An attempt has been made to discuss and highlights the
Bottled and Sachet vended water which is considered a food
product and conveniently used in traveling, hotels and
restaurants. The introduction of bottled and sachet vended
water to consumers is to provide safe, hygienic and affordable
instant drinking water to the public. Although this is a novel ad
fruitful idea, but current trends appear to suggest that bottle or
sachet drinking water could be a route of transmission of
enteric pathogens. The water is thought to be safe for drinking
but available reports indicated that it may not entirely fire of
infectious microorganisms (Reddy 2000, Baba et al. 2008,
Onifade and Clori 2008). The presence of microorganisms in
bottle and sachet water depends on the source and how the
water is treated (Mewari et at. 2005, Okagbue et al. 2002). Most
bottled water apparently is of good quality, but a few may be
contaminated. One should not assure bottled water to be purer
or safer than most tap water hence establish the public's right
to know for bottle and sachet water as now required for tap
water. Bottle and sachet vended water is required to be tested
on weekly basis, and the microbiological standards are the

191
same as for public water supplies (Lal and Kaur 2006, Bharath
et al. 2003, Obiri-Danso et al. 2003).
Another aspect which is also taken in consideration is use
of plastic in our everyday life. Plastic, the most versatile and
wonder material, is the product of spectacular development in
the area of polymer science and technology. The penetration
and acceptance of plastic into the social fabric is so high that it
is now difficult to conceive a world without plastics. It is hard to
trace out any area where plastic is not used. Which ranges from
variety of carry bags to day to day home utensils and
appliances. Needless to say that plastics have reached such a
stage that human survival cannot be ensured without their use.
So our modern life style and daily requirements degrades our
environment and our health at very fast rate.
There are many other things to highlight in modern
lifestyle like in these days people are more dependent on
machines they feel shy in doing manual work. It means more
machines more pollution. Many people in the society want
shows off by showing big cars, expensive mobile phones,
laptops, air conditioners etc. They use these things in excess
without bothering about environment, like in summer they
used air conditioners in excess for their luxurious life. The heat
which is produced by air conditioners, mobile phones, laptops
generate very harmful radiation which needs to environmental
degradation but nobody cares about it.
The respondents were asked to mention that whether our
modern life style degrades the environment or not and their
response in this regard is presented in the following table.

192
Table 5.28
Distribution of the respondent according to their views
whether modern life style degrades the environment
Views whether modern life style
degrades the environment
Frequency Percentage
Yes 202 70.38
No 85 29.62
Total 287 100.00
The above table indicates that 70.38 percent of the
respondents mentioned that modern life style degrades
environment. On the other hand 29.62 percent mentioned
modern life style does not degrade environment. Those
respondents who mentioned yes certain reasons such as, in
modern life style more people want to be modern; this some way
leads to environmental degradation. While those respondents
who mention no may be due to the fact they own wants to
become more modern so they ignore these things and said no or
it also may be they were not much aware about how
advancement of new things which are called modern things like
mobiles phones degrades the environment.
Further the views of the respondents were correlated with
other socio-economic variables and the data in this regard is
presented in the following tables.

193
Table 5.29
Distribution of the respondent according to their age and
their views whether modern life style degrades the
environment
Whether modern life style
degrades the environment
Age
Yes No
Total
20 to 40 years 125 (66.84) 62 (33.16) 187 (100)
41 to 60 years 65 (77.38) 19 (22.61) 84 (100)
61 years & above 12 (75.00) 4 (25.00) 16 (100)
Total 202 (70.38) 85 (29.62) 287 (100)
X2 = 3.26, df=2, P < .1
The above table reveals that majority of the respondents
from the age category of 41 to 60 years i.e. 77.38 percent
mentioned that modern life style degrades the environment
followed by the age category 61 years and above. On the other
side 33.16 percent of the respondents from the age category of
20 to 40 years mentioned that modern life style doest not effect
the environment Those respondents who mentioned "yes" were
of the view that they were from middle and old age category
were of the view that they did not like the modern life style
that’s why they mentioned that it degrades environment. A
higher number of those who were of the view that it does not
effect were from the age category of 20 to 40 years this may be
due to the fact the younger people preferred modern life style,
so they don't bothered about environmental degradation. So
they do not put attention to these things. The Chi-square also
shows a significant association between these two variables.

194
The education of the respondents has also been correlated
with their views regarding modern life style degrades the
environment or not and their response is shown in the table
given below.
Table 5.30
Distribution of the respondent according to their education
and their views whether modern life style degrades the
environment
Whether modern life
style degrades the
environment
Education
Yes No
Total
Uneducated 25 (44.06) 31 (55.04) 56 (100)
Upto middle &
Secondary 55
20 (66.66) 10 (33.34) 30 (100)
Higher Secondary &
Graduate
50 (72.46) 19 (27.54) 69 (100)
Post Graduate &
Professionals
107(81.00) 25(19.00) 132 (100)
Total 202 (70.38) 85 (29.62) 287 (100)
X2 = 4.744, df=3, P < .001
The above table clearly shows that a vast majority of the
respondent who were post graduates and professionals i.e. 81
percent mentioned that modern life style degrades the
environment followed by higher secondary and graduate. While
55.4 percent of the respondents who were uneducated mention
that modern life style does not degrades environment. The table
shows a contrast that the highly educated respondents
mentioned in majority that modern life style degrades the

195
environment. On the other hand uneducated respondents in
majority mentioned that modern life style does not effect the
environment. This shows that education has great impact on
the thinking of people regarding environment. The Chi-square
value also shows a significant association between these two
variables.
The occupation of the respondents has also been
correlated with their views regarding modern life style degrades
the environment or not and their responses are shown in the
following table given below.
Table 5.31
Distribution of the respondent according to their
occupation and their views whether modern life style
degrades the environment
Whether modern life style
degrades the environment
Occupation
Yes No
Total
Agriculture 19 (45.03) 27 (58.7) 46 (100)
Business Class 68 (82.92) 14 (17.08) 82 (100)
Service Class 97 (82.9) 20 (17.01) 117 (100)
Daily wages & Labour 8 (33.34) 16 (66.66) 24 (100)
Total 192 (70.38) 77 (29.62) 269 (100)
X2 = 8.616, df=3, P > .03*household category was excluded from the table because household is notconsidered as occupation.
The table given above shows that an overwhelming
majority of the respondents from two occupational categories of
service business i.e. 82.9 percent stated that modern life style
degrades the environment. While majority i.e. 66.66 percent of
the respondent from daily wagers/labourers followed by

196
agricultural occupation i.e. 58.7 percent mentioned that it does
not degrades the environment. This may be due to the fact that
they themselves living a simple life and may not have
knowledge of the consequences of using air conditioners,
laptops, automobiles, mobiles , loud music etc. The Chi-square
value also shows a significant association between the two.
Income of the respondent has also been correlated with
their views regarding modern life style degrades the
environment or not and the data is presented in the following
table.
Table 5.32
Distribution of the respondent according to their income
and their views whether modern life style degrades the
environment
Whether modern life style
degrades the environment
Monthly income
Yes No
Total
Less than Rs. 10000 37 (57.04) 35 (48.06) 72 (100)
Rs. 10001 to 20000 100 (73.06) 36 (26.04) 136 (100)
Above Rs. 20000 55 (88.71) 7 (11.29) 62 (100)
Not applicable 10 (58.82) 7 (41.18) 17 (100)
Total 230 57 287 (100)
X2 = 24.187, df=3, P > .002
This table reveals that a very large majority of the
respondents i.e. 82.71 percent income was above Rs. 20,000
per month were of the view that modern living is responsible for
environmental degradation followed by the income categories of
Rs. 10000/- to Rs. 20000 and less than Rs. 10000. Even those
respondents who did not have any income also were of the
197
same view point. While a higher percentage of those who stated
that modern living style did not spoil environment were from
the low income group i.e. of less that Rs. 10000 per month.
This indicates that income has the influence on the living style
of the people and their thinking about the environment. The
chi-square value shows a direct association between these two
variables.
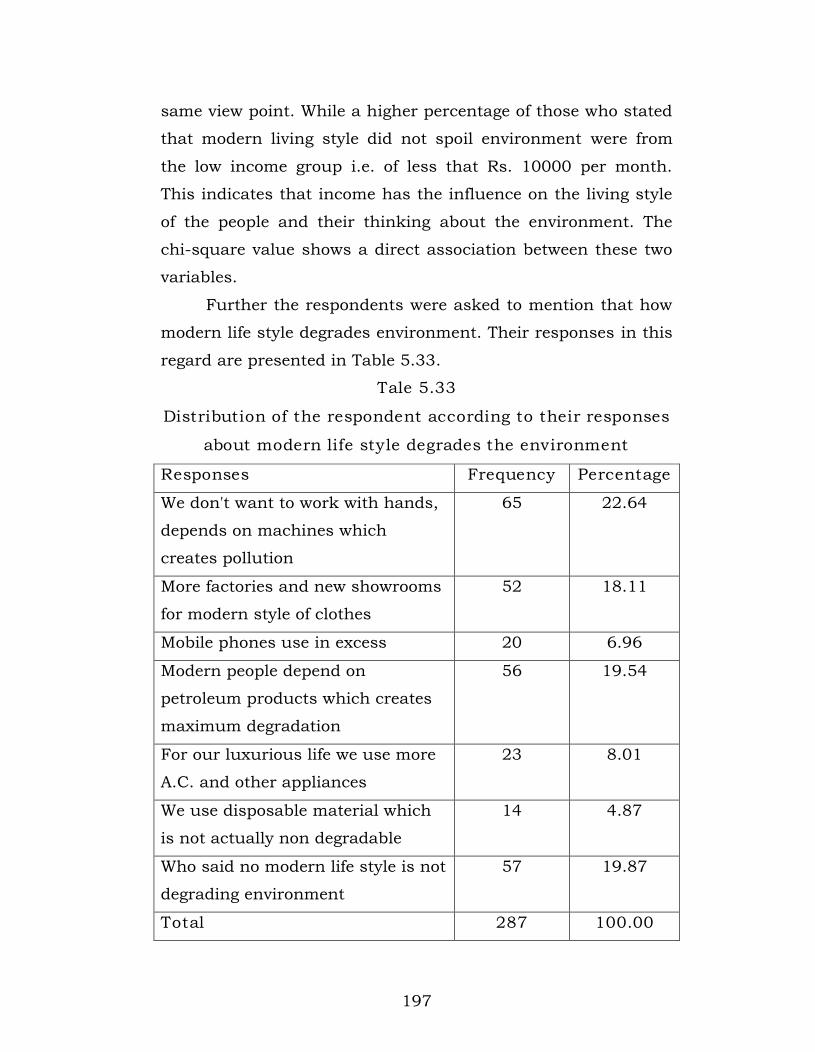
Further the respondents were asked to mention that how
modern life style degrades environment. Their responses in this
regard are presented in Table 5.33.
Tale 5.33
Distribution of the respondent according to their responses
about modern life style degrades the environment
Responses Frequency Percentage
We don't want to work with hands,
depends on machines which
creates pollution
65 22.64
More factories and new showrooms
for modern style of clothes
52 18.11
Mobile phones use in excess 20 6.96
Modern people depend on
petroleum products which creates
maximum degradation
56 19.54
For our luxurious life we use more
A.C. and other appliances
23 8.01
We use disposable material which
is not actually non degradable
14 4.87
Who said no modern life style is not
degrading environment
57 19.87
Total 287 100.00
198
The table given above indicates that 22.64 percent of the
respondents mentioned that people do not want to do manual
work they depend on machines which creates pollution, 19.54
percent mentioned that people depend on petroleum products,
18.11 mentioned that modern people give stress on more
clothes which needs new showrooms and with which
deforestation is increase. 8.01 percent and 6.96 percent of the
respondents mentioned that people use more mobiles and use
luxurious things like AC and other electrical appliances which
create pollution. And 4.87 percent mentioned that people use
disposal material which is not actually bio-degradable.
(G) FESTIVALS
The state Punjab is known for festivals. In this state every
month has a festival. It starts form January and ends with
December. The very first festival in Punjab is Lohri which comes
on the last day at Poh (December, January) extremely popular
festival. A few days before it arrives, youngsters get together in
a group and go round their localities singing songs connected
with Lohri and collecting fuel and money for the bonfire. This is
a special day for making offering to fire. The next day after
Lohri comes Maghi, also called Makar Yonkranti (entry of the
sun in the sign of Capricorn). It is very popular with the
Punjabi's in this day the people go out for a holy dip.
After that the most colorful and hilarious of all the
festivals, which are celebrated in Punjab is Holy and Hola
Mohalla. Each year, spring is ushered in by the people with the
celebration of a vigorous and colorful festival at Anandpur
Sahib and other sides at Punjab. The other famous festivals of
Punjab are Gurupurabs. The festivals held in honor of Sikh
Gurus are called Gurupurabs. They are well spread over the
199
year like birth anniversary of Guru Nanak, Birth anniversary of
Guru Gobind, Martyrdom of Guru Arjan Dev etc.
Baisakhi is one of the most popular festivals of the
Punjab, with fairs held at various places. Baisakhi, the first day
of the month of Baisakhi (April/May) is New Year's Day, going
by the Saka Calendar. Essentially it is a North Indian harvest
festival, for it is a day when the reaping of the rabi (winter crop)
beings. The jubilation at a bountiful harvest becomes the
reason for celebration.
After the Baisakhi there is a festival of Teyan, a festival of
the rainy season, is celebrated on the 3rd of the bright fortnight
of Sawan (July-August). During this period of sky generally
remains overcast and the weather shifts between sultriness and
rainfall.
After these festivals there are some festivals which are
celebrated in a big way like Dussehra, Navratras, Diwali, etc.
Now after discussing all the festivals, the main focus of
the present study is that how all these festivals degrade the
environment. In the earlier times all these festivals were
celebrated in very simpler way but now these days every body
celebrated these festivals by modern ways like a ten day
celebration of the warrior goddess Durga, thousands of pandals
or temporary temple structure set up all over the city to
worship the deity, live music and people from all over
converging on to the city to participate in the festivities, causing
traffic mayhem. The highlight of the festivals occurs when
elaborately decorated figures of the goddess, carried by huge
processions, are immersed ceremoniously in the river, which
degrades the rivers and lakes.

200
Another factor of festivals which degrades the
environment is bursting of crackers on Diwali, Dusherra, at
New Year etc. Like Diwali is known as the 'festival of lights'
Diyas (clay lamps) are lit to chase away the darkness of
ignorance and welcome the bright light of enlightenment.
However, in our zest to overboard carelessness during the
festivals celebration can have a detrimental our safety.
Firecrackers are traditionally perceived as being the highlight of
festival celebrations. Most people believe that greater the
fireworks, better the celebrations. However, very few people stop
to think just how harmful these crackers are for the
environment. These toxic substances are not just harmful to
human beings, but to all living creatures they tend to remain in
the atmosphere for extended periods. So their harmful effects
are experienced long after festivals celebrations are ended. The
noise produced by crackers is extremely hazardous to health.
Sudden noise can cause temporary hearing loss crackers burst
indiscriminately cause disturbances in sleep. This can be
especially upsetting to people who require undisturbed rest like
babies and elderly people.
Besides the immersion of idols, firecrackers, today we face
noise degradation by using loud speakers in festivals season.
The frequent playing of loud speakers even in odd hours,
ceaseless loud sound of radios and televisions deafen us in day
time. When there is near a time of festivals the time of festivals
the shopkeepers display devotional video-audios on T.V. sets,
and also run ca cassettes and CDs on audio-sets to attract the
visitors to boost their sales. In this way they unconsciously
degrade the environment by creating noise.

201
In order to find out the views of the respondents regarding
the festival season degrades the environment or not. Their
views were correlated with other socio-economics variables and
Chi-square value also shows the significant association. The
data in this regard is presented in the following tables.
Table 5.34
Distribution of the respondent according to their views
regarding whether festivals degrades the environment
Whether the festivals degrades the
environment
Frequency Percentage
Yes 180 62.71
No 107 37.69
Total 287 100.00
The table given above shows that 62.71 percent of the
respondents mentioned that festivals degrade the environment.
On the other side 37.69 percent of the respondents mentioned
that festivals does not degrade. Those respondent who celebrate
said "yes" were of the opinion that the activities of the people to
celebrate the festivals, leads to environmental degradation.
While those who said "no" were of the view that festivals do not
come everyday (teohar roj roj nahi aunde, te saal wich je kuj aa
ve jaan taan koi ena farak nahi painda).
The views of the respondents were further correlated with
other socio-economic variables like age, education, occupation
and income of the respondents. The data in this regard is
presented in the following table.

202
Table 5.35
Distribution of the respondent according to their age and
their views whether festivals degrades the environment
Whether the festival season
degrades the environment
Age
Yes No
Total
20 to 40 years 99 ( 52.94) 88 (47.06) 187 (100)
41 to 60 years 65 (77.38) 19 (22.62) 84 (100)
61 years & above 16 (100.00) --- 16 (100)
Total 180 (62.71) 107 (37.69) 287 (100)
X2 = 24.879 df=2, P < .001
The above table depicts that 100.00 percent of the
respondents from the age category of 61 years and above
followed by 77.38 percent from the age category of 41 to 60
years, and 52.94 percent from the age category of 20 to 40
years respectively mentioned that festivals degrades the
environment at large level. On the other side 47.06 percent of
the respondents from the age category of 20 to 40 years and
only 22.62 percent from the age category of 41 to 60 years
mentioned that festivals not effect the environment. This shows
that middle age and old age people had a view that festivals
season the rare lot of problems like smoke, noise, water
pollution etc. But on the other hand youngsters have a view
that festivals are to celebrate and to enjoy. This table clearly
indicates the aged respondents were of the view that festivals
are responsible for environmental degradation. While younger
respondents stated that it does not matter. The Chi-square
value also shows a significant association between these two
variables.

203
Again the views of the respondents were correlated with
the education of the respondents and the data in this regard is
presented in Table 5.36.
Table 5.36
Distribution of respondents according to their education
and their views whether festivals degrades the environment
Whether the festivals season
degrades the environment
Education
Yes No
Total
Low Education 38 (44.19) 48 (55.81) 86 (100)
Medium Education 50 (72.46) 19 (27.54) 69 (100)
Higher Education 92 (69.69) 40 (30.31) 132 (100)
Total 180 107 287 (100)
X2 = 18.184 df=2, P > .0001
For the purpose of better analysis the first two
educational categories have been clubbed and three broad
categories have been made like low education and higher
education.
The table given about shows that an overwhelming
majority of the respondents from medium and higher education
72.46 percent and 69.69 percent respectively stated that
festivals degrade the environment. While a higher proportion
i.e. 55.81 percent of the respondents from the low educational
category mentioned that it does not make any difference. This
shows that education has a great influence on the thinking of
the people. The educated respondents did not believe that much
in celebration in that way. While uneducated or less educated
have their concern only to celebrate. They said that "Eh taan

204
khushian de mauke hunde ne, Es naal vatavarn te koe Farak
nahi painda."
The views of the respondents also correlated with the
occupation of the respondents and the data in this respect is
given below.
Table 5.37
Distribution of respondents according to their occupation
and their views whether festivals degrades the environment
Whether the festivals
degrades the environment
Occupation
Yes No
Total
Agriculture 25 (54.34) 21 (45.66) 46 (100)
Business Class 45 (54.87) 37 (45.13) 82 (100)
Service Class 90 (76.92) 27 (23.08) 117 (100)
Daily wages &
Labour
10 (41.66) 14 (58.34) 24 (100)
Total 170 (63.19) 99 (36.81) 269 (100)
X2 = 18.25 df=3, P > .0003*household category was excluded from the table because household is notconsidered as occupation.
The table given above indicates that a vast majority of the
respondents i.e. 76.92 percent from the occupational category
of service mentioned that festivals degrade the environment.
The table also shows that 58.34 percent of the respondents who
were engaged in labour mentioned that festivals do not degrade
the environment. This may be due to the fact hat they did not
have deep vision about how environment is degraded in the
festivals seasons and they also said that they did not take any
tensions about these things. The Chi-square value also shows a
significant association between these two variables.

205
Further the views of the respondents were correlated with
the income and the data is present the following table.
Table 5.38
Distribution of respondents according to their income and
their views whether festivals degrades the environment
Whether the festivals
degrades the environment
Monthly income
Yes No
Total
Less than 7000 27 (37.5) 45 (62.5) 72 (100)
7100 to 20000 95 (69.85) 41 (30.15) 136 (100)
21,000 & above 48 (77.41) 14 (22.58) 62 (100)
No Income 10 (58.82) 7 (41.18) 17 (100)
Total 180 107 287 (100)
X2 = 28.384, df=3, P > .0003
The table given above clearly shows that a majority of the
respondents i.e. 77.41% from the income category of above Rs.
20,000 mentioned that the festivals degrades the environment
followed by the income category of Rs. 10001 to Rs. 20000 were
having same views. On the other side the respondents from the
income category of less then Rs. 10000 mentioned that the
festivals do not degrades the environment. This shows that
respondents from higher and middle income groups said "yes".
While the respondents from the lower income groups stated
"no". This shows how the income plays a role in the thinking of
an individual. The Chi-square value also shows a significant
association between these two variables.
Further the respondents were asked to mention their
views that how festival season degrades the environment and

206
their responses in this regard in given below in the following
table.
Table 5.39
Distribution of respondents according to their responses
that how festivals degrades the environment
Responses Frequency Percentage
Great rush of vehicles 55 19.16
Air pollution from fire crackers 97 33.79
Loud Music 62 21.60
Soil is degraded due to chemical
Holi colours
45 15.67
Who said no festival season
degrades the environment
28 9.78
Total 287 100.00
The table given above indicates that 33.79 percent of
respondents mentioned that in festivals people use fire crackers
which produce pollution, 21.60 percent of the respondents
mentioned that in festival seasons people use to play loud
music and 19.16 percent and 15.67 percent mentioned that
there is great rush of vehicles in markets and soil is degraded
by using chemical colours like in the festival of Holi degrades
the environment.

207
References
Baba, A.F.S., Erees, V., Hicsobniz, S. Cam and H.G. Ozbilek
(2008) “An Assessment of the Quality of Various Bottled
Mineral Water Marketed in Turkey”, Environmental
Monitoring and Assessment, 139, pp.277-285.
Bharath, J.M., Mosodeen, S. Motilala, S., Sandy, S. Sharma, T.
Tessaro, K. Thomas, M. Umamaheswaran, D. Simeon and
A.A. Adesiyun (2003) “Microbial Quality of National and
Imported Brands of Bottled Water in Trinidad”,
International Journal of Ford Microbiology, 81(1), p.62.
Bhaskar Rao, B. (1977) “Integrated Development of Urban
Regions”, Proceeding of the Coasted Seminar, Madras,
pp.176-198.
Bose A. (1978) India's Urbansiation: 1901-2001, New Delhi: Tata
McGraw Hill Publishing Co. Ltd.
Bose, Asish (1970) Urbanization in India, New Delhi: Academic
Books.
Conne, J. et al. (1976) Migration from Rural Areas: The Evidence
from Village Studies, Madras: Oxford University Press.
Desta, A. (1999) Environmentally Sustainable Economic
Development, Praeger Publisher.
Folke, Steen (1968) “Evaluation of Plantations, Migration and
Population Growth in Nilgiris and Coorg”, Collected
Papers Denmark, N.K. Jacobsan and R.H. Jensen (eds.)
21st Inter-National Geographical Congress, New Delhi.
Jalal, K. (1992) “Environmental Degradation and Economic
Openness in LDCs: The Poverty Linkage”, Am. J. Agr.
Econ., pp.1183-1243.
Kurien, C.T. (1978) Poverty, Planning and Social Transformation,
New Delhi: Allied Publishers.

208
Lal, M. and H. Kaur (2006) “A Microbiological Study of Bottled
Mineral Water Marketed in Ludhiana”, Indian Journal of
Public Health, 50(1), pp.31-32.
Manmohan Singh, H.K. (1979) “Population Pressure and
Labour Availability in Agriculture and Selected Activities”,
Economic and Political Weekly, 14, 11 March.
Mewari, L.O., S. Lwuanyanwu, C.I. Ojelabi, O. Uzochukwer and
W.W. Effiok (2005) “Bacteriology of Sachet Water Sold in
Lagos, Nigeria”, East African Medical Journal, 82(5),
pp.235-240.
Mohan R. (1996) Urbanisation in India: Patterns and Emerging
Policy Issues in the Urban Transformation of the Developing
World. Josef Gurgler (ed.), Oxford: Oxford University
Press.
National Institute of Urban Affairs (NIUA) (1988) Report of the
National Commission on Urbanization, Vol. 2.
Obiri-Danso, K., A. Okare-Hanson and K. Jones (2003) “The
Microbiological Quality of Water Sold of the Streets in
Kumari, Ghana”, Letters in Applied Microbiology, 37(4),
pp.334-339.
Okagbue, R.N. N.R. Dlamini, M. Siwela and F. Mfofer (2002)
“Microbiological Quality of Water Processed and Bottled in
Zimbabwe”, African Journal of Health Science, 9(1-2),
pp.99-103.
Premi, M.K. (1981) “Role of Migration in the Urbanization
Process in Third World Countries: A Case Study of India”,
Social Action, Vol. 31, July-September.
Reddy, P. (2000) “Microbiological Analysis of Bottled Water”,
Indian Journal of Medical Microbiology, 18(2), pp.72-76.
Singh (1980) Poverty and Social Change, New Delhi: Orient
Longman Ltd.
209
CHAPTER – VI
SUMMARY AND CONCLUSIONS
Every century has its challenges before India but the
twenty first century will have more serious challenges than
earlier in the form to protect environment and sustain life on
this earth. Environment has come to occupy an important
position in the agenda of Governments of all nations at the
globe. The present study has been planned to assess the socio-
cultural factors related to environmental degradation in Patiala
city of Punjab, keeping in view the following objectives of the
study:
1. To examine the influence of social factors like caste, class,
education, family size and occupation on environmental
degradation.
2. To examine the impact of an unexpected number of
outsiders i.e. migrants, on existing resources like disposal
of waste, water supply, electricity and sanitary conditions.
3. To examine the extent of environmental problems which
are created by industrialization and urbanization.
4. To evaluate the extent of awareness about environmental
degradation among people.
5. To find out how poverty is responsible for environmental
degradation.
6. To investigate the role of various organizations such as
hospitals, cottage industries, dairies, etc. towards
environmental degradation.
7. To know the cultural factors like style of living, festivals,
ceremonies etc, affecting the environment adversely.
210
The Hypotheses
The following hypotheses have been put to test in the
present study:
1. The type and extent of environmental degradation is
likely to differ according to culture, behavior, education,
economic status, caste, occupation, etc.
2. The migration of population from rural to urban areas
put a burden on the existing infrastructural resources
leading to environmental degradation.
3. Increasing industrialization and urbanization leads to
various types of pollution like dust, smoke, noise,
chemicals and waste exposal.
4. The awareness about environmental degradation is
likely to be influenced by social factors like age,
occupation education, economic status and caste.
5. The environmental degradation is likely to be influenced
by the cultural factors.
6. Different organizations like hospital, industrial units,
dairies, etc. contribute to environmental degradation
and decline.
7. Poverty has a leading impact on environmental
degradation.
8. Increasing population contributes much in degrading
the environment.
The introductory chapter deals with the statement of the
research problem. Methodology and significance of the study.
The Second chapter deals with the review of literature.
Various studies have been reviewed with respect to the different
aspects of environment and its degradation which have been
included in the present study. The conclusions arrived at by

211
these studies have been compared with the findings of the
present study. The analysis of data of the present study has
revealed that the findings are in conformity with those of the
earlier studies.
The third chapter deals with the socio-economic
characteristics of the respondents which are as follows:-
It was found that maximum number of respondents at the
time of data collection were quite young they fall in the age
category of 20 to 40 years. Only one third of the total
respondents fall in the age category of 41 to 60 years and very
few respondents i.e. one twentieth part of the total were above
61 years in age. A vast majority of the respondents were males
(179) followed by the females (108). Majority of the respondents
were from commercial caste (Arora, Bania, Sodhi etc.) followed
by agricultural caste (Jats, Kamboj etc.) and priestly caste
(Brahmins). A number was very low in the category of schedule
(Harizans, Ramdasia, Majhabi etc.) and backward caste
(Tarkhan, Lohar, Sunar, Chimbe etc.).
The data reveal that majority of the respondents were
Sikhs followed by Hindus. It was observed that the highly
educated constituted the major proportion of the sample. Yet
the proportion of other educational categories differed by very
less margin. It was found that majority of them were engaged in
the occupations of service, business and agriculture
respectively. The analysis revealed that majority of the
respondents had medium income at the time of data collection.
The proportion of the high income and low income differed by a
low margin. One fourth of the total respondents have low
income.

212
In present study majority of the respondents were
married, one fourth of the respondents were unmarried and
very lesser proportion of the respondents were widows/
widowers. It was found that majority of the respondents were
living in nuclear family. Near about one third were living in
quasi-joint families and only 17.07 percent were living in joint
families. This shows the extent that how the joint family is
breaking in the urban areas. The analysis with regard to
educational score of family revealed that an overwhelming
majority of the families were placed in high educational score
category, which shows the educational status of the family.
The analysis revealed that majority of the respondents
were living in Pucca houses. Very few respondents were living
in semi-pucca or Kacha houses. The analysis revealed that
majority of the respondents had separate kitchen and they use
Liquid Petroleum Gas (LPG) in the kitchen. The respondents
who mentioned that they did not have separate kitchen they
were using cow dung cakes, wood or kerosene oil. Majority of
the respondents mentioned that they keep the garbage in one
corner of their house in dustbin but did not cover it. Some of
them mentioned hesitatingly that they throw the garbage in the
remote area near their house. It shows that they were aware
about these pollutants but did not care about it. They want to
clean their own house only but not their surroundings.
Majority of the respondents mentioned that they had
proper sanitation facilities. Who did not have proper sanitation
facilities they mentioned that they face of lot of problems. It was
observed that those people who did not have proper sanitation
they contribute a lot in environmental degradation. Like they
use pits for excreta disposal, they made small drains near their

213
house to dispose the liquid waste like waste from kitchen,
washing, bathing etc.
The fourth chapter highlights the extent of awareness
about environmental degradation and specific pollutants such
as unhygienic habits, noise pollutant, dust, insecticide and
pesticide, perfumes, e-waste, polythene, hospital waste was
analyzed.
It was found that majority of the respondents were
partially aware about environmental degradation only one-third
were fully aware. The analysis revealed that majority of the
young respondents were partially aware as compare to other
ones. The analysis with regard to their occupation revealed that
majority of the respondents from all the occupational categories
were partially aware about the environmental degradation. Who
were fully aware were from the occupational category of service.
The data revealed that the majority of the respondents who
were fully aware were from higher income groups. This shows
that income has positive association with the thinking of an
individual. The chi-square value also shows a significant
association. This clearly corroborates the hypotheses that type
and extent of environmental degradation is likely to differ
according to culture, behaviour, education, economic status,
caste, occupation, etc.
The analysis revealed that an overwhelming majority of
the respondents were of the view that unhygienic habits like
smoking, splitting, throwing garbage in the open etc. From the
age point of view majority of the young and highly educated
respondents had the same considerations. While middle aged
and the aged respondents had the opposite views. The analysis
of the occupational aspect of the respondents revealed that an

214
overwhelming majority of the respondents form the service
occupation considered unhygienic habits as the pollutants.
While those who did not considered unhygienic habits as
pollutants were from agriculture and labour class.
Majority of the aged and middle aged respondents
consider noise as pollutant while the younger respondents had
mixed response because the younger generation like loud noise
like bikes without silencers, honking pressure horns, loud
music in their cars and DJs etc. The Majority of the respondent
from higher educational category mentioned noise as pollutant
while who did not consider noise as pollutant were from lower
educational category in majority. With regard to occupation and
income categories the same trend was found.
The analysis with regard to dust as pollutant revealed
that a large majority of the respondents consider dust as
pollutant. A very little proportion of respondent did not concern
about these things. With regard to the education the analysis
depicted that hundred percent of the respondents from the
higher educational category followed by medium educational
category considered dust as a pollutant.
The majority of the respondents considered insecticides
and pesticides as pollutants. Majority of the respondents from
20 to 40 years and 41 to 60 years considered insecticides and
pesticides as pollutant. While from the age category of above 61
years half of them mentioned 'yes' and half mentioned 'no'. A
majority of highly educated mentioned insecticides and
pesticides pollutes the environment. While majority of the
uneducated had the opposite views. The majority of the
respondents from service, business and those who had higher
income considered insecticides and pesticides as pollutants.

215
The majority of the respondents considered perfumes as
pollutant. An overwhelming majority of the aged respondents
mentioned that perfumes degrade the environment while young
respondents mentioned that it makes no differences (eh jado
spray krde aa tan thoda ja tan hunda hai ehne naal environment
khraab nahi hunda). The respondents who were highly educated
considered perfumes as pollutants in majority. While who were
not educated were of the view that perfumes do not effect the
environment. This indicates that either they were not aware or
they may not be using the perfumes. Further data reveals that
those who had high income were of the view that perfumes
create environmental pollution. While the respondents from the
lower income category said perfumes did not pollutes the
environment.
The analysis revealed that majority of the respondents
mentioned that e-wastage is a big pollutant. While one-third of
the total respondents mentioned that e-wastage is not a
pollutant. Majority of the respondents from the age category of
20 to 40 years and 41 to 60 years considered e-wastage as
pollutant, because they were aware about the consequences of
these things. While those respondents who responded in
negative were from 61 years and above age category in majority
because they did not have any concern about these things.
Again with regard to the education, occupation and income of
the respondents showed the same trend that majority of the
respondents who were highly educated; who were having higher
income; and who were from service and business type of
occupations.
The data revealed that a vast majority of the respondents
considered polythene as a pollutant. With regard to the age the

216
analysis revealed that the majority of the respondent from all
the age category considered polythene as a pollutant. With
regard to the education the data revealed that an over whelming
majority of the respondents from the higher educational
categories considered polyethene as a pollutant. The data also
revealed that the respondents who were uneducated did not
considered polythene as pollutant because it becomes a part of
their life and they said (ehna lifafayan bin tan bilkul ne sarda).
The people considered polythene as a pollutant but in practice
they use polythene in their daily routine. Nobody refuse to
accept it when it is given by the shopkeepers. The analysis also
revealed that the respondents from occupational category of
labour and lower income considered polythene as no pollutant.
An overwhelming majority of the respondent considered
hospital wastage as a pollutant with regards to the age the
analysis revealed that majority of the respondents from all the
age categories considered hospital wastage as a pollutant. The
data revealed that an over whelming majority of the
respondents from all the educational categories considered
hospital wastage as a pollutant. And the trend is also same in
occupation and income categories. It was found that an
overwhelming majority of the respondents considered
deforestation as a factor of environmental degradation but it
was observed that upto some extent they themselves were
responsible for deforestation. There was no significant
association with age and occupation was found regarding
deforestation as a factor of environmental degradation. The
analysis revealed that the respondents from high education and
high income categories considered deforestation as a pollutant,
in majority.

217
The fifth chapter highlights impact of socio cultural
factors on environmental degradation. The analysis of the
impact of socio-cultural factors on environmental degradation
points out the following main findings.
The analysis revealed that majority of the respondents
mentioned migration from rural to urban areas as a factor of
environmental degradation. While one-third of the respondents
mentioned that migration did not effect the environment. The
analysis revealed that majority of the respondents from the
higher educational categories mentioned migration as a factor
of environmental degradation. While who were low educated
and uneducated mentioned 'no' regarding migration as a factor
of environmental degradation, because they did not have any
vision about these things. It was observed that a majority of the
respondents from the higher income categories were of the view
that migration is responsible for environmental degradation.
But who placed in the low income category did not feel like.
Who considered migration as factor of environmental
degradation gave some reasons like there is an increase in
cutting of trees for building houses, increase in slums,
increasing number of vehicles etc. Chi-square vale shows a
significant association. This also proves the hypotheses the
migration of population from rural to urban put a burden on
the existing infrastructural resources leading to environmental
degradation.
The analysis revealed that majority of the respondents
had a view that growth of urbanization and industrialization
degrades the environment. It was found that majority of the
respondents from the age category of 20 to 40 years mentioned
growth of urbanization and industrialization leads to

218
degradation of the environment followed by the age category of
41 to 60 years. The data also revealed that from the age
category of 61 years and above half of the respondents
mentioned 'yes' and half mentioned 'no'. It was observed that
majority of the respondents from middle and higher education
stated that the increase in urbanization and industrialization
degrades the environment. In case of occupation majority of the
respondents from service and business occupation had the
same view. It was also found that the respondents from middle
and higher income categories said that urbanization and
industrialization is responsible for degrading the environment.
While the respondent from low education and lower occupation
who consider urbanization and industrialization as a factor of
environmental degradation have given some reasons, like
development of new unplanned colonies, development of
industry and even small scale industries like, dairies, dying
clothes, leather work, poultry. Increasing number of vehicles,
automobiles shops and development of slums, butchers, hair
dressers, and tailors are the consequences of growth of
urbanization and industrialization. Chi-square also shows
significant association between all these independent variables.
This too proves the hypotheses in this context.
The analysis revealed that an over whelming majority of
the respondent mentioned that poverty degrades the
environment. Because it is the well known fact that the poor
has to depend on the nature to fulfill his daily needs by cutting
tree for fuels, using roadside for toilets etc. The analysis
revealed that majority of the respondents from all the age
categories mentioned that poverty is the factor of environmental
degradation. Very lesser respondents mentioned 'no'. A majority

219
of the respondents from the high level of educational category
were of the view that poverty contributes in degrading the
environment. Those who mentioned that it does not effect were
from lower level of education in majority. A majority of the
respondents from service, business and agricultural occupation
further supported the same view. While those who mentioned
that poverty does not play any role in degrading the
environment were from labourers. The same trend was found in
the income categories. Chi-square also shows a significant
association. The respondents gave many reasons in support of
their answers. Such as poor people have lack of basic
amenities; like no proper kitchen; no washrooms; no toilets;
they use clay hearths which produces smoke and they use to
throw garbage in the open etc. And even they did not bother
about the environment. Hence, proving our hypotheses that
poverty has a leading impact of environmental degradation.
It was found that majority of the respondents mentioned
that increasing population degrades the environment. Only one
fourth of the total respondents mentioned 'no'. It was observed
that a majority of the young and middle aged respondents were
of the view that increasing population degrades the
environment, while the aged respondents had fifty-fifty
response. Further a vast majority of the respondents from the
higher educational categories stated that increasing population
plays a big role in the environmental degradation. While a
majority of the low educated and uneducated respondents had
opposite views. Again with regard to occupation the analysis
revealed that from service, business and agriculture occupation
the majority of the respondents mentioned 'yes'. On the other
side from the occupational category of labourers majority of the

220
respondents mentioned 'no'. Which means increasing
population did not degrade the environment because they had
lack of knowledge regarding environment. It was found that a
majority of the respondent from all income categories were of
the view that increasing population has great impact on
environmental degradation. The respondent had different views
regarding how increasing population degrades the environment
like increasing population disturbs the balance of the earth,
more exploitation of natural resources, more poverty, more
slums, lack of space, mining deforestation etc. Hence it
conclude the increasing population is major cause of
environmental degradation. This also proves the hypotheses
that increasing population contributes much in environmental
degradation.
The analysis revealed that majority of the respondents
considered religious rituals as a factor of environmental
degradation. While a lesser proportion of the respondents did
not agree that rituals degrades the environment. It was observe
that the respondents from the age category 20-40 years
mentioned that religious rituals degrades the environment
followed by the age category of 41-60 years. The analysis also
revealed that majority of the respondent from the age category
of 61 years and above did not accept it. Because they still have
faith in religious rituals. With regard to education the analysis
revealed that those who were highly educated stated 'yes', while
those were less educated stated 'no' in majority. The analysis
revealed that the respondent from higher level of occupation
stated that religious rituals degrade the environment. While
who were engaged in lower level of occupation stated that these
rituals did not degrade the environment. They said (eh tan

221
vatavaran nu saaf karde ne na ki khrab). The majority of the
respondent from the higher income were of the view that rituals
degrades the environment, while the respondent from lower
level income did not accept it. Further the respondents were
asked how these rituals degrade the environment. Their views
were like immersion of many kinds of things in the rivers,
smoke created by hawans, cremations of human bodies etc.
The analysis revealed that majority of the respondents
mentioned that modern lifestyle degrade the environment while
near about one third of the respondent reported that modern
life style did not degrades the environment. In this era of
modernity the analysis revealed that majority of the younger
generation reported that modern lifestyle did not degrades the
environment. While the aged respondents mentioned in
majority that modern lifestyle degrades the environment. Again
with regard to education, occupation and income the trend was
found as majority of the respondents from lower level of
education, occupation and income stated that modern lifestyle
did not degrades the environment. While the respondents from
higher education, higher occupation and higher income
reported that modern lifestyle degrades the environment. Some
reason were given by the respondents that how modern lifestyle
degrades the environment like nobody wants to do manual
work; use of mobile phone, TVs, cars computers etc., for
luxurious life excessive use of ACs and other electrical
appliances, use of disposal utensils which are not really
disposed off etc. This also corroborate the hypotheses that the
environmental degradation is likely to be influenced by the
cultural factors like change in living style, festivals, ceremonies,
rituals etc.
222
Majority of the respondent mentioned that festival like
Diwali, Dusshara, Lohri, Holy, Baisakhi, etc. degrades the
environment. But some of the respondents mentioned that
festivals did not degrade the environment. Their views were
cross tabulated with age, education occupation and income. It
was found that hundred percent of the aged respondents were
of the view that our festivals degrades the environment by loud
speakers, bursting crackers; using harmful dust colours; loud
music, loud speakers use in gurudwaras, temples etc. While
majority of the younger were of the view that festivals are there
to enjoy that is why festivals did not has much influence on the
environment.
It was found that majority of the respondents from higher
educational category, higher occupations and higher income
reported that festivals degrades the environment while the
respondents who were low educated, lower occupation and
lower income stated that festivals did not make any affect on
the environment.
In present study it was found that the personal
characteristics like age, education, occupation and income has
great influence on the thinking of the respondents. While other
variables like caste, religion, marital status, type of family did
not have any significant association with the views of the
respondents. It was found that education and income has
significant impact on the views of the respondents regarding
environmental degradation as compared to age and occupation.
It was found that though people from higher age education,
income, occupation were more aware about the environment
but in practice upto some extent they too don't bother. There is
a great difference in thinking and doing (Kathni te Karni vich aje
v bada fark hai).