
Impact of Realignment on County Jail Populations also find evidence of realignment-induced jail...
53
Impact of Realignment on County Jail Populations June 2013 Magnus Lofstrom and Steven Raphael with research support from Brandon Martin Supported with funding from the Smith Richardson Foundation
Transcript of Impact of Realignment on County Jail Populations also find evidence of realignment-induced jail...

Impact of Realignment on County Jail Populations
June 2013
Magnus Lofstrom and Steven Raphael with research support from Brandon Martin
Supported with funding from the Smith Richardson Foundation

http://www.ppic.org/main/home.asp Impact of Realignment on County Jail Populations 2
Summary
California’s recent corrections realignment, authorized under AB 109, is arguably the most significant change in the state’s corrections system in decades. Prompted by a federal court order to reduce the state’s overcrowded prison system, this legislation, signed by Governor Brown in 2011, seeks to reduce the prison population by sentencing lower-level offenders to county jails rather than prison, thereby transferring substantial incarceration responsibility, as well as funding, from the state to its 58 counties. Proponents of realignment argue that it offers an opportunity to shift the focus from costly state incarceration to local approaches that favor rehabilitative services and treatments, while critics argue that this policy will lead to more “street time” for offenders and an increase in criminal activity. There is also concern that realignment has simply shifted the overcrowding problem, and related lawsuits, from state prisons to local jails.
We are now at a point where relevant data are becoming available, allowing researchers to assess the effects of realignment. In this report, we examine how the decline in California’s prison population resulting from realignment affects county jail populations. We also investigate factors that explain the differences between counties that have relied more heavily on jails in implementing their new responsibilities and counties that have emphasized non-jail alternatives.
Our data indicate that realignment has significantly affected county jail populations. Between June 2011 and June 2012, during which time California’s prison population declined by roughly 26,600, the average daily population of California’s jails grew by about 8,600 inmates, or about 12 percent. As a result, 16 counties are operating jails above rated capacity, up from 11 counties in the previous year. On a statewide basis, county jails have been operating above 100 percent of rated capacity since February 2012. In addition, we have observed an increase in the number of counties reporting early release of jail inmates due to insufficient capacity. By June 2012, 35 counties reported releasing pretrial inmates and/or sentenced offenders early due to capacity constraints (compared to 27 counties in June 2011). We note that although the study is limited to data available for only the first nine months of realignment, the fact that the prison population has only declined by an additional 2,700 in the subsequent 11-month period strongly suggests that the majority of the policy’s direct impact on county jails occurred during our study period.
While realignment has certainly increased the population of county jails, the overall California incarceration rate (prisons and jails combined) has declined due to realignment. That is to say, there has not been a statewide, one-to-one transfer of felons from state prison to county jails. We estimate that, on average, a county’s jail population increases by one for every three felons no longer assigned to state prison. However, the effect of realignment on jail populations differs across counties, with some counties incarcerating much higher percentages of their realignment caseloads.
We also find evidence of realignment-induced jail crowd-out effects. Our analysis shows that, to a modest degree, convicted felons sentenced to jail and parolees serving time in jail for technical violations are displacing pretrial detainees as well as sentenced inmates serving time for misdemeanor offenses. More strikingly, we find strong evidence that realignment is leading to increases in capacity-constrained early releases of some inmates, especially in counties under court-ordered population caps; our results suggest that for every four realigned offenders, one sentenced inmate per month is released early due to housing capacity constraints (compared to one among every 16 offenders in non-cap counties). Moreover, we estimate that in court-ordered population-cap counties, realignment is increasing pretrial releases at a rate

http://www.ppic.org/main/home.asp Impact of Realignment on County Jail Populations 3
of roughly one inmate for every seven fewer felons sent to prison. We do not know how much earlier these releases are taking place, only that these practices have significantly increased as a result of realignment.
We also find that factors other than the direct effect of the drawdown in the prison population help explain the post-realignment growth in the jail population. For example, pre-realignment jail capacity constraints and incarceration rates are strong predictors of post-realignment jail population growth. On the other hand, we do not find a relationship between county differences in jail population growth and the use of split sentences, where the offender serves a reduced jail term followed by probation, introduced by realignment. Furthermore, our analysis of data adjusted for county differences in the realignment-induced drawdown in the prison population indicates that underlying county differences in crime do not explain differences in post-realignment jail use.
Although realignment has certainly strained the capacity of county jails, capacity challenges are likely to diminish over time for a number of reasons. First, the impacts of realignment on the state’s prison and jail populations have stabilized. We do not expect that realignment will cause further disproportionate declines in the prison population nor significant increases in the jail population. Second, jail capacity expansions on the order of 10,000 new beds are currently under way, supported in large part by funding from the state. Third, additional capacity can be found in the roughly 4,300 jail beds under federal contracts, used primarily for U.S. Immigration and Customs Enforcement to house immigration detainees. Consideration of the need for maintaining and renewing these contracts is warranted before committing to expensive jail expansions.
Taken together, these points suggest that most counties in the relatively near future will have the capacity to accommodate the considerable number of lower-level offenders redirected to their facilities, including those parolees who violate the terms of their release. However, it should be noted that although the state is funding the majority of the construction costs of the jail expansions, most of the ongoing financial burden will fall on the counties; construction costs account for only a small share of the total cost of a jail over its lifetime. This suggests that budget-challenged counties will need to seek effective alternative strategies to incarceration, including increased use of split sentencing.

Contents
Summary 2
Figures 5
Tables 5
Acronyms 6
Introduction 7
Shifting Corrections Responsibilities to the Counties 9
Trends at the State Level 11
Observed County Responses 15
Realignment’s Prison-to-Jail Transfer Rate 19
Responses and Capacity Constraints 21
High and Low Jail-Use Counties 23
Conclusions and Policy Recommendations 27
References 30
About the Authors 31
Acknowledgments 31
Technical appendix to this paper is available on the PPIC website: www.ppic.org/content/pubs/other/613MLR_appendix.pdf

http://www.ppic.org/main/home.asp Impact of Realignment on County Jail Populations 5
Figures
1. California prison population, January 2010 through June 2012 11
2. California monthly jail population, January 2010 through June 2012 12
3. Relationship between county prison incarceration rates before and after realignment 18
4. Estimated county jail incarceration responses to realignment 20
5. Estimated county jail incarceration responses to realignment by counties with and without a court-ordered population cap 22
6. County jail incarceration responses to realignment 23
7. Realignment changes in jail incarceration rates against corresponding changes in prison incarceration rates 24
8. Estimated realignment jail incarceration growth beyond the realignment-induced population shock 26
Tables
1. California prison and county jail populations, June 2011–June 2012 13
2. Incarceration rates before and after realignment 16

http://www.ppic.org/main/home.asp Impact of Realignment on County Jail Populations 6
Acronyms
ADP Average Daily Population
BSCC Board of State and Community Corrections
CDCR California Department of Corrections and Rehabilitation
PRCS Post-Release Community Supervision
RC Rated Capacity

http://www.ppic.org/main/home.asp Impact of Realignment on County Jail Populations 7
Introduction
California’s recent corrections realignment, authorized under AB 109, represents the most significant change in the state’s corrections system in decades (Petersilia and Snyder 2013). The legislation, implemented in October 2011, shifts substantial criminal justice oversight and funding from the state to its 58 counties. Motivated by a federal court order to reduce overcrowding in the state’s prisons, the legislation affords local governments great discretion in how they exercise their new responsibilities. These include the mandate to locally sanction offenders convicted of less serious felony offenses and to manage most of the less serious offenders paroled from state prison by county probation departments. In exchange, the reform shifts substantial funding resources to the counties and affords local governments great discretion in how they exercise their new responsibilities.
Although Proposition 30 secures funding for realignment as a constitutional guarantee, many other challenges remain. Prominent among these is the management of jail populations. If realignment is to succeed, it cannot simply shift the overcrowding problem, and its related lawsuits, from the state to the counties (American Civil Liberties Union, 2012).1 At the same time, incarceration decisions need to be weighed against their potential effects on public safety. A number of recent proposals in the state legislature reflect serious concerns about the ability of county jails to effectively enforce sanctions or house offenders, in particular parole violators who violate the terms of their release.2 Although we are now approaching the two-year anniversary of realignment, its various effects, including the role of the policy in shaping county jail populations, remain uncertain.3 The intent of this report is to address some of these uncertainties, building on a previous PPIC study (Lofstrom and Kramer 2012).
The greater reliance on local jails as opposed to state prison in the post-realignment era suggests possible advantages as well as disadvantages for both offenders and the counties now in charge of their sanction and rehabilitation. On the positive side, allowing lower-level offenders to remain in their communities, while also emphasizing re-entry treatment and services, may prevent some from becoming hardened criminals; it may be less disruptive to family ties and other social relationships that may prove helpful in their rehabilitation. Moreover, interagency coordination between local sheriffs, probation departments, social services and public health agencies, and the local housing authority may lead to improved reentry and recidivism outcomes, given that offenders must often depend upon the social and public services offered across the multiple domains traditionally managed by county government.
On the negative side, realignment may simply shift the overcrowding problem, and related lawsuits, from state prisons to local jails. Prior to the passage of realignment, many counties were already operating under court-imposed population caps, and others had very little extra capacity in their jail systems. This overcrowding has been aggravated by the substantial transfer of responsibilities of inmates from the state prisons, and it is likely to grow worse if the state is forced to meet the population targets demanded by the federal court overseeing the prison system. In addition, counties face the challenge of housing inmates
1 To date, four counties have already been sued or threatened with a lawsuit: Alameda, Fresno, Monterey, and Riverside. 2 The proposals include AB 2 (which proposes to send sex offenders who violate their parole back to state prisons instead of county jails), AB 605 (which would send sex offenders who violate any provision of their parole back to state prison), AB 63 and SB 57 (which would make it a felony for sex offenders and other criminals to remove court-ordered GPS monitoring devices), and AB 601 (which would allow parole violators to be returned to state prison for up to one year). 3 For detailed discussions of the most pressing issues in evaluating realignment, see Petersilia and Snyder (2013) and Lofstrom, Petersilia, and Raphael (2012).

http://www.ppic.org/main/home.asp Impact of Realignment on County Jail Populations 8
substantially longer than the pre-realignment maximum stay in county jail of one year. As of February 2013, there were 1,155 inmates serving sentences of more than five years in county jails (Lofstrom and Martin 2013). Finally, in truly constrained counties, the inability to retain active criminal offenders may lead to higher local crime rates.
In addition to overcrowding, the flexibility afforded to counties in their treatment of offenders may raise other issues. While this flexibility may spur innovation and permit the tailoring of corrections responses to local conditions, greater local control may also create large disparities across counties in how otherwise similar offenders are treated. Such disparities may result from differences in local politics, differences in jail capacity constraints, or even wealth differentials that shape the local tax base within a county.
The capacity challenges presented by realignment are readily observable in recent trends. Between June 2011 and June 2012, the state prison population declined by 26,600 inmates. Concurrently, California’s county average daily jail population grew by about 8,600 inmates, and the number of counties operating jail systems above rated capacity increased from 11 to 16. If we aggregate all jail inmates and jail beds in California’s 58 counties, we find that the total population of jail inmates has exceeded total rated capacity in every month since February 2012. Furthermore, by June 2012, 35 counties reported releasing pretrial inmates and/or sentenced offenders early due to capacity constraints (compared to 27 counties in June 2011). The fact that 18 counties are operating facilities under court-ordered population caps adds to these challenges.
Clearly, there has not been a statewide, one-to-one transfer of felons from state prison to county jails, as the increase in the overall jail population amounts to roughly one third of the decline in the state prison system. These aggregate statistics, however, mask great differences in how counties have responded to realignment. Some have opted to incarcerate the majority of the realigned felons assigned to them, while others have chosen alternative approaches and sanctions and hence committed relatively few offenders to jail.
This report documents the effects of realignment on local county jail populations and explores the factors that mediate the degree to which counties are employing local jails in their realignment strategies. To assess the extent to which realignment is affecting county jail populations, we take advantage of the fact that due to differences in pre-realignment prison incarceration rates, the legislation affected counties differently. Counties that relied more heavily on state prisons, measured by the number of offenders per 100,000 county residents, received a larger “dose” of realignment. The fact that the “realignment dose” in each county changes over time provides an additional mechanism for identifying the effect of the policy on county jail populations.
We also assess county-level characteristics that explain jail population growth, after accounting for the size of the “realignment dose” per county. Although our study is limited to available data spanning only the initial nine months of realignment, the fact that the prison population has declined by only an additional 2,700 in the subsequent 11-month period strongly suggests that the majority of the policy’s impact on county jails occurred during the study period. In the following sections, we provide a brief overview of the realignment program and then discuss our analysis and findings.

http://www.ppic.org/main/home.asp Impact of Realignment on County Jail Populations 9
Shifting Corrections Responsibilities to the Counties
With the implementation of Assembly Bill 109 in October 2011, the state of California greatly expanded the responsibilities of county governments in managing criminal offenders. The new responsibilities undertaken by the counties fall into three main categories:
First, lower-level offenders convicted of nonsexual, nonviolent, and nonserious crimes with no such crimes appearing in their criminal history records will now serve their sentences under county supervision rather than in state prisons. These offenders are often referred to as “non-non-nons,” “triple-nons,” “n3s,” or 1170(h) felons. Counties are authorized to choose from a number of available sentencing options, including a full jail term, house arrest, GPS monitoring, or a split sentence in which the offender serves a reduced jail term followed by probation (assuming that the jail sentence is successfully completed).
Second, most offenders serving time in state prison for triple-non offenses will now, upon release from prison, be supervised by county probation departments rather than state parole authorities under a function known as Post-Release Community Supervision or PRCS.
Third, parole violators who reoffend (i.e., violate the terms of their release but do not commit a new felony) are no longer revoked to state prison but are sanctioned within counties by short stays in county jails or other forms of graduated sanctions devised by local authorities.
Realignment thus affords counties considerable discretion in exercising their new responsibilities. They are free to rely heavily on the use of local jails, effectively transferring their realigned populations from prisons to local jails. But they are also free to choose from a wide variety of less severe alternatives that rely on community corrections through practices such as electronic monitoring, house arrest, split-sentencing, and short “flash incarcerations” for those who violate the terms of their conditional release. The options that counties choose certainly depend in the short term on local jail capacity and, in many instances, court-ordered population caps. In the longer term, however, several factors are likely to influence how counties respond to their new responsibilities, including the particular characteristics of the realigned offender population and perhaps the ideological predisposition of local criminal justice officials and the county residents that they serve.
A number of factors will determine the extent to which county jail populations change as a result of realignment. To the extent that realigned felons are simply being transferred to local jails, one would expect to see an increase in the total population of local jails equivalent to the reduction in the prison population. However, as noted above, counties have a number of options at their disposal that could lower the one-to-one relationship between the decrease in the state prison population and the increase in the county jail population. For example:
Realignment introduced a new sentencing tool for 1170(h) offenders: split sentences, which consist of a jail sentence followed by a period of probation for lower-level offenders diverted to county jails. The more that counties use this tool, which effectively reduces the time served behind bars, the lower the impact of realignment on their jail populations.
Sanctions for parole violations have also changed in such a way that violators are now likely to spend less time in confinement. Prior to realignment, the maximum prison term for a parole violation was one year, although most parole violators remanded to state custody served substantially less time. Under realignment, the maximum term—which applies to both those on parole and probation (PRCS)—is six months. Furthermore, many PRCS violators are likely to

http://www.ppic.org/main/home.asp Impact of Realignment on County Jail Populations 10
serve less than six months in jail because counties are encouraged to rely instead upon a “flash incarceration” sanction of no more than ten days. Finally, shorter post-release supervision may also contribute to a lower than one-to-one ratio of prison to jail transfer rate. Released offenders on county PRCS can now be discharged after six months of supervision, compared to minimum of 13 months for parolees prior to realignment.
In addition to these changes introduced by realignment, some populations may be displaced from local jails to make way for realigned offenders. For example, local sheriffs may release pretrial detainees to make room for sentenced felons or parole violators ordered to serve time in jail. Or they may provide an early release for misdemeanor offenders, who presumably pose relatively low risk to public safety, to free up more jail beds.
http://www.ppic.org/main/home.asp Impact of Realignment on County Jail Populations 11
Trends at the State Level
Our analysis of state-level trends, which we describe below, led to the following conclusions:
Realignment has produced a substantial decline in the state prison population. Concurrently, the county jail population has increased, but only by an amount equal to about one-fourth to one-third of the numerical decline in the prison population.
State-level statistics show a small, but insufficient, increase in jail capacity; counties appear to be facing increasingly binding capacity constraints.
To a modest degree, realigned offenders appear to have displaced those serving jail sentences or awaiting trial for misdemeanors.
Overall, the number of inmates released due to capacity constraints has increased substantially.
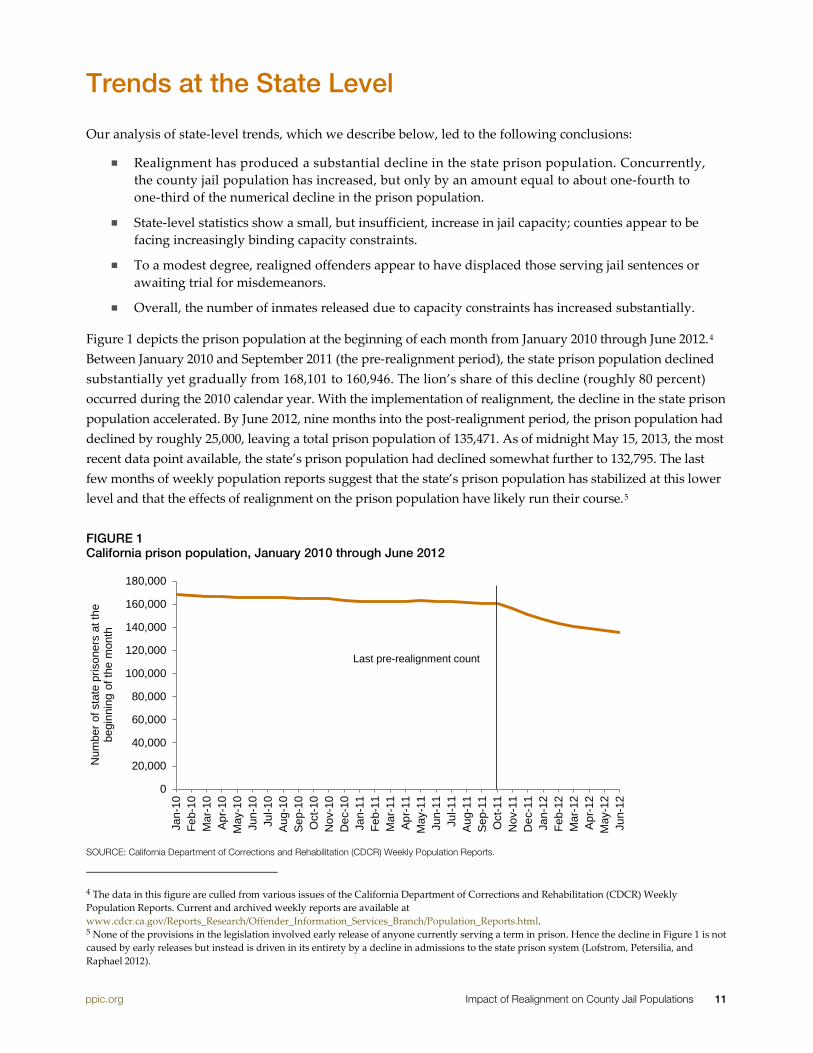
Figure 1 depicts the prison population at the beginning of each month from January 2010 through June 2012.4 Between January 2010 and September 2011 (the pre-realignment period), the state prison population declined substantially yet gradually from 168,101 to 160,946. The lion’s share of this decline (roughly 80 percent) occurred during the 2010 calendar year. With the implementation of realignment, the decline in the state prison population accelerated. By June 2012, nine months into the post-realignment period, the prison population had declined by roughly 25,000, leaving a total prison population of 135,471. As of midnight May 15, 2013, the most recent data point available, the state’s prison population had declined somewhat further to 132,795. The last few months of weekly population reports suggest that the state’s prison population has stabilized at this lower level and that the effects of realignment on the prison population have likely run their course.5
FIGURE 1 California prison population, January 2010 through June 2012
SOURCE: California Department of Corrections and Rehabilitation (CDCR) Weekly Population Reports.
4 The data in this figure are culled from various issues of the California Department of Corrections and Rehabilitation (CDCR) Weekly Population Reports. Current and archived weekly reports are available at www.cdcr.ca.gov/Reports_Research/Offender_Information_Services_Branch/Population_Reports.html. 5 None of the provisions in the legislation involved early release of anyone currently serving a term in prison. Hence the decline in Figure 1 is not caused by early releases but instead is driven in its entirety by a decline in admissions to the state prison system (Lofstrom, Petersilia, and Raphael 2012).
0
20,000
40,000
60,000
80,000
100,000
120,000
140,000
160,000
180,000
Jan-
10Fe
b-10
Mar
-10
Apr-1
0M
ay-1
0Ju
n-10
Jul-1
0Au
g-10
Sep-
10O
ct-1
0N
ov-1
0D
ec-1
0Ja
n-11
Feb-
11M
ar-1
1Ap
r-11
May
-11
Jun-
11Ju
l-11
Aug-
11Se
p-11
Oct
-11
Nov
-11
Dec
-11
Jan-
12Fe
b-12
Mar
-12
Apr-1
2M
ay-1
2Ju
n-12
Num
ber o
f sta
te p
rison
ers
at th
e be
ginn
ing
of th
e m
onth
Last pre-realignment count

http://www.ppic.org/main/home.asp Impact of Realignment on County Jail Populations 12
Figure 2 presents data on statewide average daily jail populations from January 2010 through June 2012, showing the total average daily population (ADP), the population of sentenced inmates (both felons and individuals sentenced for misdemeanors), and the population of unsentenced inmates (including pretrial detainees and parole violators serving short spells in local jails). During the pre-realignment period (January 2010 through September 2011), the average daily population of California’s local jails declined by roughly 3,600 inmates, with nearly all of the decline occurring during 2010 and a general stability evident during 2011. Between September 2011 and June 2012 (the period covering the first nine months of realignment), the total average daily jail population increased by about 6,500. Looking at the data on individual populations, we can see very large increases in the population of sentenced inmates and some evidence of displacement of unsentenced inmates. Specifically, between September 2011 and June 2012, the population of sentenced inmates increases by slightly more than 8,500, while the population of unsentenced inmates declines by roughly 2,000.
FIGURE 2 California monthly jail population, January 2010 through June 2012
SOURCE: Board of State and Community Corrections (BSCC) Monthly Jail Profile Survey.
Taken together, Figures 1 and 2 are suggestive of both a substantial shift in the incarceration site for felony offenders, from state prisons to local county jails, and the displacement of some pretrial and perhaps sentenced jail inmates to make room for these offenders.
To more thoroughly explore the avenues of realignment, we provide a more detailed breakdown in Table 1 of the change in the average daily population (ADP) of local jails. We focus on June 2011 and June 2012 to ensure comparability of the pre- and post-realignment months of analysis. Over this period, the state prison population declined by 26,642 inmates, while the ADP of local jails increased by 8,565. These numbers suggest that at least one-third of realigned inmates were serving time in a county jail rather than state prison. At the same time, we observe a small increase in the rated capacity (RC) of the state’s jails (roughly 800 beds)
0
10,000
20,000
30,000
40,000
50,000
60,000
70,000
80,000
90,000
Jan-
10Fe
b-10
Mar
-10
Apr-1
0M
ay-1
0Ju
n-10
Jul-1
0Au
g-10
Sep-
10O
ct-1
0N
ov-1
0D
ec-1
0Ja
n-11
Feb-
11M
ar-1
1Ap
r-11
May
-11
Jun-
11Ju
l-11
Aug-
11Se
p-11
Oct
-11
Nov
-11
Dec
-11
Jan-
12Fe
b-12
Mar
-12
Apr-1
2M
ay-1
2Ju
n-12
Num
ber o
f jai
l inm
ates
ADP
Unsentenced ADP
Sentenced ADP
Last pre-realignment count

http://www.ppic.org/main/home.asp Impact of Realignment on County Jail Populations 13
and a large increase in the ratio of the ADP of local jails to rated capacity, from 92.2 to 102.4 percent.6 Consequently, the number of counties operating above 100 percent of the rated capacity of their jails increased from 11 to 16. Moreover, the number of counties operating under a court-ordered cap on their jail population increased from 17 to 18, suggesting that many counties were unable to adequately respond to the demands of realignment.
TABLE 1 California prison and county jail populations, June 2011–June 2012
June 2011 June 2012 Change, 2011–12
State prison population 162,113 135,471 -26,642
Jail population and capacity
Average daily population (ADP) 69,698 78,263 8,565
Rated capacity (RC) 75,614 76,430 816
ADP/RC 92.2% 102.4% 10.2%
# of counties operating above 100% RC 11 16 5
# of counties with court-ordered caps 17 18 1
ADP unsentenced 49,189 48,721 -468
ADP sentenced 20,509 29,542 9,033
Average # of unsentenced felons 37,669 38,129 461
Average # of sentenced felons 12,103 20,754 8,652
Average # of unsentenced misdemeanants 7,088 6,247 -841
Average # of sentenced misdemeanants 5,717 5,227 -490
Average # of federal-contract inmates 4,611 4,318 -293
Average # of state-contract inmates 1,484 1 -1,483
Average # of county-contract inmates 15 19 4
# of capacity-constraint pretrial releases 6,192 7,856 1,664
# of capacity-constraint sentenced releases 3,583 6,086 2,503
SOURCES: CDCR Weekly Population Reports and BSCC Monthly Jail Profile Survey.
6 All California jail facilities are given a specific “rated capacity” by the Board of State and Community Corrections. The BSCC defines rated capacity as the number of inmate occupants for which a facility’s single and double occupancy cells or dormitories (except those dedicated to health care or disciplinary isolation housing) were planned and designed in conformity with specific minimum standards and requirements.

http://www.ppic.org/main/home.asp Impact of Realignment on County Jail Populations 14
Dividing the change in the local jail population by whether the inmates are sentenced or unsentenced and by whether the controlling offense is a felony or misdemeanor reveals several of the adjustment mechanisms that counties are employing to handle their new realignment caseloads. First, we see an overall decline of 468 in the number of unsentenced inmates. While this is smaller than the decline from September 2011 through June 2012 discussed above, it is still suggestive of some displacement of the unsentenced from county jails due to realignment. Moreover, we observe an increase in the sentenced population of 9,033, which exceeds the overall increase of 8,565 in the jail population.
The remainder of Table 1 explores whether realignment may have displaced certain inmate populations by disaggregating the populations into felons and misdemeanants.7 We see increases in both the population of sentenced felons (by 8,652) and unsentenced felons (by 461), suggesting both diversion of realigned offenders from prisons to jails as well as some limited diversion of parole violators (who are presumably counted as unsentenced inmates). We also observe declines in the population of unsentenced misdemeanants (841) and sentenced misdemeanants (490). Hence, the statewide statistics suggest that to a modest degree, counties are releasing lower-level offenders among both pretrial detainees and sentenced individuals to make room for realignment inmates.
Finally, the table presents estimates of the total number of inmates released early in June 2011 and June 2012 due to housing capacity constraints. Over this time period, the number of releases among pretrial detainees increased by 26.9 percent (1,664 inmates ), and the number of early releases among sentenced inmates increased by 69.9 percent (2,503 inmates). The data do not include information on how early these releases occurred, and hence we are unable to estimate the ultimate impact of early releases on the average daily jail population. The table also shows a decrease in the number of beds contracted out to federal and state government or to other counties. The virtual elimination of state-contract beds most likely reflects the fact that technical parole violators are no longer the state’s responsibility.
As informative as these state-level changes are, they cannot demonstrate the extent to which realignment is responsible for the observed changes. To unravel the role of realignment, we need to examine county-level responses and, ultimately, adjust for confounding factors. We undertake this task in the following section.
7 The average number of sentenced and unsentenced inmates by felony or misdeamenor is not reported by every county. Hence, these numbers do not necessarily add up to the total ADP or to sub-total ADP in the sentenced and unsentenced categories.

http://www.ppic.org/main/home.asp Impact of Realignment on County Jail Populations 15
Observed County Responses
The degree of county differences in the use of the state prison system prior to realignment is striking, with the highest incarceration counties having prison incarceration rates many times those of low incarceration counties. These differences are critical when it comes to measuring and assessing the impact of realignment on county jails, since counties that used prison more intensively experienced the largest increases in their local corrections caseloads. However, we also found that as the legislation shifted the financial responsibility of incarcerating lower-level felons to the counties, county incarceration differences declined. In sum:
Realignment affects counties differently, depending on prison incarceration rates prior to the implementation of the legislation.
Although counties continue to differ dramatically in the number of residents incarcerated in prison and jail, realignment has narrowed these differences.
A simple strategy for gauging the impact of realignment on a specific county’s corrections caseload is to measure the change in the number of county residents in state prison per 100,000 residents. This measure allows for easy and meaningful comparison across counties. We refer to this measure as the “county-specific prison incarceration rate,” which should be distinguished from the rate of county residents incarcerated in local jails.8
The data show quite clearly that prison incarceration rates vary considerably across counties, as do the reductions in these rates following realignment. For example, as shown in Table 2, between June 2011 and June 2012, the state prison incarceration rate for Kings County declined by 234 inmates per 100,000 county residents. At the other extreme, Marin County experienced a decline in its state prison incarceration rate of only 17 inmates per 100,000 residents. The rate of decline in some of the state’s largest counties fell in the mid-range of the statewide data. For example, in Los Angeles and San Diego Counties, the prison incarceration rate dropped by 70 and 67 inmates per 100,000 residents, respectively, a decline very close to the Sacramento County rate decline of 75 (which is also the statewide rate of decline between June 2011 and June 2012).
8 We refer to county-specific prison incarceration rates throughout this study. This term does not refer to the number of state prisoners housed at a facility within the county, which would be impractical since state prisoners are often housed outside of their county of residence. Rather, we intend for the county-specific incarceration rate to refer to the degree of intensity involved in a county’s use of the state prison system.

http://www.ppic.org/main/home.asp Impact of Realignment on County Jail Populations 16
TABLE 2 Incarceration rates before and after realignment
Incarceration rates per 100,000 residents
Prison Jail Total
County June 2011
June 2012 Change June
2011 June 2012 Change June
2011 June 2012 Change
Largest rate of decline in prison population Kings 1,052 818 -234 215 318 103 1,268 1136 -131
Sutter 461 283 -178 250 253 3 711 536 -175
Shasta 852 679 -174 128 125 -3 980 803 -177
Smallest rate of decline in prison population
Nevada 126 98 -28 152 207 55 278 304 27
Santa Cruz 209 188 -21 171 157 -13 379 345 -35
Contra Costa 182 165 -18 136 150 14 319 315 -4
Marin 152 135 -17 116 122 6 267 257 -10
10 largest counties
Los Angeles 549 479 -70 140 179 39 689 658 -31
San Diego 381 314 -67 152 169 17 533 483 -50
Orange 295 236 -59 202 229 26 497 465 -33
Riverside 485 423 -62 143 174 31 629 597 -32
San Bernardino 590 441 -149 254 260 7 843 701 -142
Santa Clara 300 248 -51 198 200 2 498 449 -49
Alameda 281 235 -46 245 212 -33 526 448 -78
Sacramento 540 465 -75 272 284 12 812 749 -63
Contra Costa 182 165 -18 136 150 14 319 315 -4
Fresno 514 400 -114 184 255 71 698 655 -42
Statewide 435 360 -75 185 207 22 620 567 -53
Lowest 126 98 -28 96 97 1 267 257 -10
Highest 1,052 818 -234 508 574 65 1,268 1,136 -131
25th percentile 280 230 -50 175 189 14 494 448 -46
75th percentile 516 409 -107 254 285 32 747 655 -92
Range Highest-Lowest 927 720 -206 412 477 65 1,000 879 -121
75th-25th 236 180 -57 79 96 17 253 208 -46
SOURCE: County-level prison admissions and release data provided to the authors by CDCR and jail population data from BSCC’s publicly available Jail Profile Survey.

http://www.ppic.org/main/home.asp Impact of Realignment on County Jail Populations 17
Table 2 clearly shows the narrowing in prison incarceration rates between counties after the implementation of realignment. For example, the difference in incarceration rates between the county with the highest rates (Kings at 1,052 before realignment and 818 after) and the lowest (Nevada at 126 before realignment and 98 after) declines by 206 inmates per 100,000. We can also see this narrowing in differences between counties when we compare counties at the 25th and 75th percentiles.9 Before realignment, the difference between a low-incarceration county at the 25th percentile (San Benito at 260) and a high-incarceration county at the 75th percentile (Del Norte at 516) was 236. After realignment, the prison incarceration rates dropped to 230 at the 25th percentile (now San Luis Obispo) and 409 at the 75th percentile (still Del Norte). In other words the difference declined by 57 inmates per 100,000.
However, we also found that the equalizing effect of realignment on prison incarceration rates is somewhat undone by increases in jail incarceration rates. As we can see in Table 2, total incarceration rates (including both prison and jail) are quite a bit higher than prison incarceration rates. Moreover, as with prisons, jail incarceration rates vary substantially across counties. The highest jail incarceration rate both before and after realignment is in Yuba County (508 and 574, respectively), and the lowest is in Sierra County (96 and 97). We can also see considerable difference across counties in the increase in jail incarceration rates following realignment (103 in Kings County, 71 in Fresno, 7 in San Bernardino), and in some cases even a decrease in rates (e.g., Alameda, -33).
Focusing on the extent to which realignment has reduced county differences in total incarceration rates, we see (in the last column of the “Highest” and “Lowest” rows) that the difference between the highest incarceration county (Kings County, declining from 1,268 to 1,136) and the lowest (Marin County, with a modest decline from 267 to 257) decreased by 121 inmates per 100,000 residents. As with prison incarceration rates, the equalization is evident in the difference between the 75th and 25th percentile, which decreased by 46 inmates per 100,000 residents. Statewide, the prison incarceration rate declined by an impressive 75 inmates per 100,000 residents (from 435 to 360), a more than 17 percent decline. The total statewide incarceration inclusive of prison and jail inmates rate also dropped, but by less, 53 per 100,000 (from 620 to 567).
In general, counties that experienced the largest per-capita impact of realignment are those that used the state prison system more intensively prior to the implementation of the reforms. We document this fact in Figure 3. The figure presents a scatter plot of the change in the county-specific prison incarceration rates between June 2011 and June 2012 against each county’s incarceration rate in June 2011. Each data point represents a specific county’s experience over this period. The data cloud reveals a very strong negative relationship between the county’s prison incarceration rate prior to realignment and the decline in the county’s state prison incarceration rate (essentially the number of realigned offenders per 100,000 residents, or the realignment “dose”) corresponding to realignment’s implementation. For example, the dot at the low end and to the far right of the data cloud represents Kings County, which used the prison system more intensively than any other county and experienced the largest per capita reduction in inmates following realignment. At the upper end and to the far left are counties with low pre-realignment prison incarceration rates, such as Marin, Nevada, and San Francisco Counties, where subsequently the realignment “dose” is low.
9 In other words, the incarceration rate at the 25th percentile exceeded that of only 25 percent of California counties, while the incarceration rate at the 75th percentile is greater than that of 75 percent of the counties.

http://www.ppic.org/main/home.asp Impact of Realignment on County Jail Populations 18
FIGURE 3 Relationship between county prison incarceration rates before and after realignment
SOURCE: County-level prison admissions and release data provided to the authors by CDCR.
NOTE: Scatter plot of the change in the number of county residents per 100,000 in a state prison between June 2011 and June 2012 against the county’s incarceration rate in a state prison in June 2011.
The fact that the decline in county differences in incarceration rates becomes smaller when we consider the incarceration rate inclusive of jail inmates suggests that those counties that receive more prison inmates per capita as a result of realignment are also on average experiencing greater increases in their jail population. This is our first hint of the fact that the pattern observed for the state overall (i.e., declining prison populations juxtaposed against growing jail populations) is playing out across the state’s 58 counties. Of course, factors that are county specific are likely to influence this process. (These might include, for example, court-imposed population caps and a general predisposition among local criminal justice representative toward incarceration.) In the following paragraph, we provide a brief description of our methodological strategy for studying the cross-county relationship between the “realignment dose” (i.e., the shift of sending felons to the counties instead of state prison) per capita and jail population growth.
So far, the data we have examined strongly suggest that realignment has led to increases in the state’s total jail population by an amount that partially offsets the decline in the state prison population. However, the observed changes may be the result of factors other than, or in addition to, realignment. To determine realignment’s specific role in the observed changes, we use a regression analysis that isolates the effect of realignment from confounding factors. In our analysis, we use county-level prison admissions and release data from CDCR and monthly county-level jail population data from the BSCC Jail Profile Survey. The Technical Appendix provides a detailed discussion of our empirical approach and a host of results that extensively probe the robustness and reliability of our model estimates to various modeling assumptions.10 We discuss the results of our regression analysis in the following section.
10 In particular, we present two complete sets of results: one that accounts for seasonal variation in jail and prison population based on pre-realignment trends and one that does not. While the results are generally consistent across these two groups, there are a few differences. In the discussions that follow, we focus on our preferred estimates that incorporate seasonal adjustments. However, we provide a complete set of results in the technical appendix so that readers can review the full range of estimates and arrive at their own conclusions with regard to the specific magnitudes of the effects.
-250
-200
-150
-100
-50
0
50
0 200 400 600 800 1,000 1,200
Cha
nge
in p
rison
inca
rcer
atio
n ra
te,
June
201
1 to
Jun
e 20
12
Prison incarceration rate, June 2011

http://www.ppic.org/main/home.asp Impact of Realignment on County Jail Populations 19
Realignment’s Prison-to-Jail Transfer Rate
Our analysis of transfer rates, which we discuss below, produced the following principal findings:
Realignment increased the average daily jail population by roughly one inmate for every three fewer offenders going to state prison.
Roughly three-quarters of the increase in county jail populations stems from realigned felons who have been sentenced for a new crime; unsentenced felons (presumably parole violators) account for the remaining quarter.
The data suggest that parole violators who would have been returned to the custody of the state prison system in the past are spending much less time behind bars as a result of realignment.
We find strong evidence that counties have made room for realigned offenders by increasing the number of pretrial releases and early releases of sentenced offenders.
The empirical results obtained using county differences in the realignment “dose” (i.e., the shift of state prisoners) to determine the rate at which the reduction in the prison population translates into increases in county jails corroborates what we observe in the state-level data. Figure 4 presents our estimates of the effects of a one-person increase in a county’s prison incarceration rate on the county’s jail incarceration rate as well as 95 percent confidence interval of the range of the estimated response. (These results and additional estimates exploring the sensitivity of the choices and assumptions made are presented and discussed in the Technical Appendix.) Negative coefficients indicate that declines in the prison rate increase county jail incarceration rates. The first bar in Figure 4 shows the confidence interval around our estimate (represented by the dot) of realignment’s effect on the overall average daily jail incarceration rate. The estimate indicates that each additional offender realigned from the state prison system to the county results in an increase of 0.367 in the number of jail inmates. That is, realignment increased the average daily jail population by roughly one inmate for every three fewer offenders sent to state prison.
Applying this estimate to the observed June 2011–June 2012 decline in the statewide number of prisoners (about 26,600) suggests that realignment induced an increase in the monthly average number of jail inmates by about 9,800 offenders. This “back of the envelope” calculation is somewhat smaller than the reduction in the prison population of newly sentenced felons and parolees receiving new sentences (10,500). This is consistent with a slight decrease in the reliance on incarceration for offenders convicted of new realignment offenses, due either to shorter sentences in jail relative to the sentence that would have been served in prison prior to realignment or a greater tendency among counties to use sanctions other than incarceration to punish these offenders. Part of the increase in the jail population likely reflects parole violators serving time in county jail. In general, however, the fact that the estimated transfer rate from prison to jail from the regression falls far short of one-for-one indicates that either parolees who technically violate the terms of their parole or triple-nons who have committed new offenses are serving less time under realignment than they would have served in the past.
To further explore this issue, Figure 4 also presents estimates of the effects of realignment on various inmate subpopulations: sentenced inmates (all sentenced inmates and the subcategories of sentenced felons and sentenced misdemeanants) and unsentenced inmates (again, the total and the subcategories of felons and misdemeanants). Last, the two most rightward dots and bars characterize the extent to which counties responded to realignment by resorting to capacity-constrained releases.

http://www.ppic.org/main/home.asp Impact of Realignment on County Jail Populations 20
FIGURE 4 Estimated county jail incarceration responses to realignment
SOURCE: Authors’ estimates based on county level prison admissions and release data provided to the authors by the CDCR and the BSCC Jail Profile Survey.
NOTES: Dots in the figure are regression coefficients from separate regressions of the difference-in-difference characterization of the change in the county’s jail incarceration rate on the corresponding change in the county’s prison incarceration rate, and lines show the 95 percent confidence interval. (See the Technical Appendix for a detailed discussion.) *** Coefficient statistically significant at the one percent level of confidence. ** Coefficient statistically significant at the five percent level of confidence.
* Coefficient statistically significant at the ten percent level of confidence.
The results indicate that the lion’s share of the transfers from prisons to jails is driven by higher jail incarceration rates for sentenced felons. The data suggest a slight increase in the numbers of unsentenced inmates (the category that includes technical parole violators). In addition, those who would have been returned to the custody of the state prison system in the past are spending much less time behind bars (in either prison or jail) as a result of realignment. Technical parole violators make up a large share of the realignment-reduced prison population (about 55 percent); we would therefore expect a substantially greater upward pressure on the unsentenced population than our estimates show if these offenders received sanctions similar to those they received prior to realignment.
The data also reveal strong evidence that counties have made room for realigned offenders by increasing the number of pretrial releases and early releases of sentenced offenders. This includes increasing pretrial releases at a rate of roughly one more such release for every seven fewer felons sent to prison as a result of realignment. Sentenced inmates are also released early, at a rate of approximately one more such release for every four realigned offenders. Unfortunately, we do not know how much earlier these releases are taking place, only that these practices have increased significantly as a result of realignment.
-0.7
-0.6
-0.5
-0.4
-0.3
-0.2
-0.1
0
0.1
0.2
Estim
ated
real
ignm
ent e
ffect
s

http://www.ppic.org/main/home.asp Impact of Realignment on County Jail Populations 21
Responses and Capacity Constraints
Our major findings in this area of our study included the following:
Realignment’s effect on the average daily jail population is roughly the same in counties with a court-ordered population cap as those that are not subject to this constraint.
A major response to realignment in cap counties is to increasingly rely on pretrial and early sentenced releases.
There is some evidence that realigned felons are displacing misdemeanants in non-cap counties.
As noted above, 18 counties are currently operating jails under a court order that limits their inmate populations. One might expect that the adjustment to realignment in terms of jail populations would differ in counties facing population caps relative to counties facing no such caps. Specifically, counties without a population cap may incarcerate less of their realigned offender population through the use of split sentences, longer spells in jail for parole violators, and less use of early release. By contrast, counties facing population caps may be forced to engage in more early releases and to rely more on alternatives to incarceration for triple-non offenders convicted of new offenses and for those who violate the terms of their community supervision. To explore these different responses to realignment, we divided counties into two groups, based upon whether or not they faced court-ordered population caps, and then reestimated our models separately for each of the groups.
Figure 5 presents these results separately for population cap and non-cap counties. The estimates indicate that the effects of realigned offenders on the overall jail incarceration rates are, in fact, similar in counties with and without court-imposed population caps. Moreover, we still find that this relationship is driven principally by an impact of realignment on the number of sentenced felon jail inmates.
However, capacity-driven releases of pretrial inmates due to realignment are limited to counties with court-ordered population caps. These counties increased pretrial releases at an approximate rate of one for every six realigned offenders. In contrast, we find no convincing evidence that counties without court-ordered population caps are increasing their release of pretrial inmates as a result of realignment. However, both groups of counties are increasingly resorting to early releases of sentenced inmates due to the policy shift. The increase is particularly noticeable in the counties facing court-ordered caps; our results imply that one sentenced inmate per month is released early for every four realigned offenders (compared to one for every 16 offenders in non-cap counties). Again, it is important to note that we do not know how much earlier these releases are taking place, only that they have increased as a result of realignment.

http://www.ppic.org/main/home.asp Impact of Realignment on County Jail Populations 22
FIGURE 5 Estimated county jail incarceration responses to realignment by counties with and without a court-ordered population cap
SOURCE: Authors’ estimates based on county level prison admissions and release data provided to the authors by the CDCR and the BSCC Jail Profile Survey.
NOTES: Dots in the figure are regression coefficients from separate regressions of the difference-in-difference characterization of the change in the county’s jail incarceration rate on the corresponding change in the county’s prison incarceration rate and lines show the 95 percent confidence interval. (See the Technical Appendix for a detailed discussion.)
The following coefficients are statistically significant at the one percent level of confidence: Total ADP (cap and no cap), ADP Sentenced (no cap), Average number sentenced felons (no cap) and Total number sentenced released due to capacity (cap).
The following coefficients are statistically significant at the five percent level of confidence: ADP Sentenced (cap), Average number sentenced felons (cap) and Total number sentenced released due to capacity (no cap).
The following coefficients are statistically significant at the ten percent level of confidence: ADP Unsentenced (cap) and Total number pretrial released due to capacity (cap).
The observation that realignment caused roughly the same increase in the overall jail population in counties with and without a population cap, while the cap counties responded with substantially more capacity-constrained releases, raises the question of how non-cap counties absorbed the new population. Our data do not provide a very clear picture, but our estimates suggest that realigned offenders in non-cap counties might have crowded out misdemeanants (both unsentenced and sentenced). However, these estimates are not very precise and thus not statistically distinguishable from a zero response.

http://www.ppic.org/main/home.asp Impact of Realignment on County Jail Populations 23
High and Low Jail-Use Counties
Our analysis of post-realignment jail population growth produced three significant findings:
Counties differ substantially in their jail incarceration response to realignment.
Factors other than the realignment dose contribute to the post-realignment changes in the jail population.
The strongest and most reliable predictors of realignment-adjusted jail population growth are capacity related.
Clearly, the diversion of responsibility for less serious offenders to the counties has increased the population of county jails throughout the state. Our estimates suggest that for every three-person reduction in the prison population caused by realignment, the county jail average daily population has increased by one. Moreover, counties receiving more inmates per capita as a result of realignment also experience relatively larger increases in their jail incarceration rates. However, these responses vary substantially across counties, and the breakdown by court-ordered population caps suggests that capacity constraints are a contributing factor.
Figure 6 presents a measure of the jail-use responses that highlight the range across counties (measures for all counties are shown in Technical Appendix Table A1). The responses represent the ratio of the estimated realignment changes in the jail and prison populations, where -1 represents an increase in the jail population by one for every offender not sent to state prison. The increases in the jail populations in San Diego and Fresno Counties were roughly similar to the overall increases we observed in the state, while in Los Angeles County the jail population increased nearly one-for-one with the reduction in the number of its residents in state prison. At the same time, in a few counties (such as Alameda) the county jail populations declined despite increases in their community corrections caseloads. A number of factors likely contributed to these changes, including the fact discussed above that the realignment dose differs considerably across counties.
FIGURE 6 County jail incarceration responses to realignment
SOURCE: Authors’ estimates based on county-level prison admissions and release data provided to the authors by the CDCR and BSCC Jail Profile Survey.
NOTES: The ratios are calculated by first obtaining the change in the respective populations between September 2011 and June 2012. These are then adjusted to account for seasonality and near-term trends by subtracting out the changes between the same months in the year before realignment was implemented (i.e., changes between September 2010 and June 2011). The ratio is then obtained by dividing the adjusted jail population change by the adjusted prison population change. The ratios for all counties, and the changes in jail and prison populations are presented in Technical Appendix Table A1.
-1.50
-1.00
-0.50
0.00
0.50
1.00
1.50
Rat
io o
f est
imat
ed re
alig
nmen
t ch
ange
s in
jail
and
pris
on p
opul
atio
ns

http://www.ppic.org/main/home.asp Impact of Realignment on County Jail Populations 24
However, we also find considerable variation across counties in recent jail trends that is independent of the realignment dose that any one county received. Figure 7 illustrates this point by presenting a scatter plot of the county-by-county changes in jail incarceration rates against the changes in the prison incarceration rates. The figure also depicts the estimated realignment effect on the average daily population, shown as the regression line through the data cloud. The negative slope of the line indicates that counties experiencing larger declines in their prison incarceration rates experience larger increases in their jail incarceration rates (the basic finding from the previous section).
Many counties deviate from the regression line, clearly showing that factors other than the realignment dose contribute to the post-realignment changes in the jail population. (Data points above the line indicate counties where changes in jail incarceration rates exceed expectations, based on the decline in each county’s prison incarceration rate. Similarly, data points below the line represent counties where the change in each county’s jail incarceration rate falls short of expectations.) The figure reveals many instances of large departures from what one would expect in both the positive and negative direction. Hence, in exercising their new responsibilities in managing lower-level offenders, some counties are pursuing a high jail incarceration rate strategy while others are pursuing a low jail incarceration rate strategy. What distinguishes these counties from one another?
FIGURE 7 Realignment changes in jail incarceration rates against corresponding changes in prison incarceration rates
SOURCE: Authors’ estimates based on county level prison admissions and release data provided to the authors by CDCR and BSCC Jail Profile Survey.
NOTES: The dots represent seasonally adjusted changes in jail incarceration rates against changes in the prison incarceration rates for the last of the post-realignment month in our data. The size of the dot indicates size of the county population. The line represents the predictions resulting from the regression, shown in the top row, middle column of Table A4.
The results so far suggest that differences in capacity constraints might be an important determinant of the incarceration response and growth in the jail population, but other factors may also contribute to this situation. To answer the above question, we first estimate the average change in each county’s jail incarceration rate after netting out the effect of the number of inmates realigned to each county (the details of this estimation is presented in the Technical Appendix). Next, we employ regression analysis to explore the
-60
-40
-20
0
20
40
60
80
100
-200 -150 -100 -50 0 50
Cha
nge
in ja
il in
carc
erat
ion
rate
Change in prison incarceration rate

http://www.ppic.org/main/home.asp Impact of Realignment on County Jail Populations 25
relationship between increases in the jail incarceration rate and particularly capacity constraints. However, in doing so we also need to account for several other plausible factors (which are interesting in and of themselves) that might affect a county’s realignment strategy, including:
Ratio of average daily jail population (ADP) to rated capacity prior to realignment. Counties with relatively full jails prior to realignment’s implementation may have incorporated this capacity constraint into their realignment planning. To the extent that a lack of excess capacity led to realignment plans that deemphasize jail, we would expect lower incarceration growth in jails with high population-to-capacity ratios.
Pre-realignment jail incarceration rate. Counties with already-high jail incarceration rates may be reluctant to devote more resources toward county jails or may face greater constraints in expanding jail capacity. Hence, we would expect such counties to have lower jail incarceration growth during the post-realignment period.
Use of split sentences. Realignment introduced the concept of split sentences for newly sentenced triple-non felons (so-called 1170(h) offenders). This criminal justice approach consists of a jail sentence followed by a period of probation to deal with lower-level offenders diverted to county jail. One might expect that counties that make greater use of split sentences will have lower jail incarceration growth. Hence, we include a measure of the proportion of 1170(h) convictions that employ split sentences.
Local crime rates. Since crime rates vary across California counties, one might expect larger increase in jail incarceration rates in counties with higher crime rates before the introduction of realignment. In consideration of this possibility, we include controls for the number of property crimes and the number of violent crimes per 100,000 residents in 2011.
Local political sentiment regarding crime control policies. Local political conditions vary considerably across California, with residents in some counties demonstrably more favorable of tougher sentencing policies than others. To the extent that criminal justice officials, both elected and appointed, are responsive to the demands of their constituents, one might expect a greater use of local jails in the realignment strategies of more conservative counties relative to more liberal counties. To gauge such ideological variation, we consider the proportion of each county’s voters that supported two propositions on the November 2012 ballot: the failed Proposition 34, which would have eliminated the death penalty, and the successful Proposition 36, which moderated the sentences for some third-strike offenders.
The regression results assessing the role of the above factors in explaining post-realignment jail use reveal several interesting findings.11 We find no statistically significant effect of the use of split sentencing on jail population growth once we account for the realignment dose. Similarly, there is no evidence of effects of pre-realignment violent and property crime rates on jail incarceration growth. However, counties with high pre-realignment jail incarceration rates experience relatively lower increases in their post-realignment incarceration rates. Our regression estimates also indicate, as expected, that high-incarceration counties have lower jail population growth, and that growth is stymied in counties that are more capacity constrained. The data fail to reveal any relationship between the proportion of voters supporting Propositions 34 and 36 and jail growth.12
To characterize the magnitude of these effects, we use the estimated regression coefficients to calculate the predicted difference in growth in county jail incarceration rates between counties below and above the
11 For detailed regression model estimates, see Technical Appendix Table A11. 12 Other potential factors affecting county differences in post-realignment jail growth include changes in law enforcement personnel, changes in criminal charges and court sentences (other than split sentences) as well as county differences in rehabilitative efficacy. Unfortunately, at this time no suitable data exist for these potentially contributing factors.

http://www.ppic.org/main/home.asp Impact of Realignment on County Jail Populations 26
median in terms of the most significant factors analyzed.13 These calculations, shown in Figure 8, reveal that the jail population in high pre-realignment jail incarceration counties (those at the 75th percentile) grew by roughly 16 fewer inmates per 100,000 residents compared to the growth in low-incarceration counties (those at the 25th percentile). Similarly, jail growth in capacity-constrained counties (those counties around the 75th percentile of the ratio of ADP to rated capacity) grew by about 6 fewer inmates per 100,000 than counties with no immediate capacity constraints (those at the 25th percentile).
FIGURE 8 Estimated realignment jail incarceration growth beyond the realignment-induced population shock
SOURCE: Authors’ calculations based on regression coefficients of the county-level change in jail incarceration rates net of the effect of the realignment inmate dose experienced by the county.
NOTES: The shown effects represent the difference in the relevant factor equal to the interquartile range (the value at the 75th percentile minus the value at the 25th percentile).All estimates and discussion of the empirical approach can be found in the Technical Appendix.
Are the effects of these additional factors on jail incarceration rates large? When benchmarked against the statewide change in county jail incarceration rates between June 2011 and June 2012 (22 per 100,000), 14 indeed they are. Another point of comparison is cross-country differences in the realignment dose. Over this period the county at the 25th percentile of this distribution experienced an increase in their local offender caseload of 50 per 100,000 county residents as a result of the decline in the county’s prison incarceration rate. The comparable figure for the county at the 75th percentile of this distribution is 107. Combined with our estimate of the prison-jail transfer rate (0.367), this implies that the county at the 25th percentile would experience an increase in the jail incarceration rate that is 21 per 100,000 lower than the county at the 75th percentile. With a comparable effect for the pre-realignment jail incarceration of 16 and ADP per rated capacity of 6, it becomes clear that counties’ pre-realignment reliance on jail incarceration and capacity constraints both substantially shaped their jail incarceration responses to realignment.
13 Specifically, we calculate the effect of a difference in the relevant factor equal to the interquartile range (the value at the 75th percentile minus the value at the 25th percentile). 14 See Table 2.
-25
-20
-15
-10
-5
0
5
Pre-jail incarceration rate ADP/Rated capacity ratio
Estim
ated
impa
ct o
n
jail
inca
rcer
atio
n ra
te g
row
th

http://www.ppic.org/main/home.asp Impact of Realignment on County Jail Populations 27
Conclusions and Policy Recommendations
California’s recent legislation authorizing corrections realignment, AB 109, arguably represents the most significant change in the state’s corrections system in decades. This legislation shifted substantial corrections responsibilities and funding from the state to its 58 counties. Motivated by state prison overcrowding, this policy shifts responsibility for managing most lower-level criminal offenders from the state to the counties. Although realignment presents opportunities for reducing expenditures on incarceration and for improving public safety outcomes, there is considerable concern about the impact realignment may have on county jails (including the possibility that the legislation will simply shift the overcrowding problem from the state prisons to county jails). More specifically, apprehensions are increasing with regard to crowded, deteriorating jail conditions (to be followed by lawsuits) as well as with sheriffs lacking the capacity to enforce sanctions and house offenders. The intent of this report has been to shed light on these issues by examining how reductions in the prison population initiated by realignment have affected county jail populations across the state over the first nine months of the new policy’s implementation.
We find that the jail population has certainly increased, but not by the magnitude of the corresponding decline in the state prison population. The jail population has increased by an amount equal to roughly one-third of the decline in the state prison population, with most of this driven by an increase in the number of sentenced felons serving their time in county jail. (Parole violators who prior to realignment would be sent to prison constitute another group that exerted pressure on county jails.) Specifically, we estimate that realignment increases the jail population by roughly one inmate for every three-inmate decline in the state prison population. Our analysis also indicates that most of this relationship is driven by relatively large increases in the sentenced jail populations in counties experiencing relatively large doses of realignment (i.e., counties that relied more heavily on state prisons before the policy change).
We find evidence of increasingly binding capacity constraints in the county jail systems; a number of jails statewide are now operating at or above their rated capacity. Our analysis also suggest that newly sentenced realigned felons, as well as released prison inmates now under the jurisdiction of local community corrections, are displacing lower-level offenders from local jails. More specifically, convicted felons sentenced to jail and parolees serving time in jail for parole violations are (at least to a modest degree) displacing pretrial detainees and sentenced inmates serving time for misdemeanor offenses. Our results also provide strong evidence that realignment is leading to increases in early releases of some inmates because of capacity constraints, especially in counties under court-ordered population caps. In cap counties, we estimate that one sentenced inmate per month is released early for every four realigned offenders as a result of housing capacity problems, compared to one early release for every 16 offenders in non-cap counties. Moreover, realignment is increasing pretrial releases at a rate of roughly one for every seven fewer felons sent to prison in cap counties. We do not know how much earlier these releases are occurring, just that these practices have significantly increased as a result of realignment.
Counties vary greatly in how they are using jails in exercising their new responsibilities. To take two extreme examples, the jail population of Los Angeles County has increased almost one-for-one with the number of realigned inmates sent to the county. On the other hand, the jail population of Alameda County has actually declined, despite large increases in their local community corrections caseloads.

http://www.ppic.org/main/home.asp Impact of Realignment on County Jail Populations 28
We find that some pre-realignment factors, especially capacity-related factors, partially explain county differences in jail incarceration responses. Counties with high jail incarceration rates before realignment and counties with high ratios of jail inmates to rated jail capacity tended to experience slower growth in their jail populations. However, we did not find any statistically significant relationships between crime rates prior to realignment and post-realignment jail growth, suggesting that underlying county differences in crime do not explain differences in post-realignment jail use. Nor did we find any evidence, so far, that county differences in the use of split sentences affected jail population growth once we account for differences in the realignment dose.
Our examination of the data provides important insights in light of the number of recent proposals seeking to shift some criminal justice responsibilities back to the state. An underlying assumption in these proposals is that realignment is responsible for severely limiting the ability of counties to enforce sanctions against parole violators, hence jeopardizing public safety. While our analyses support the notion that realignment has increased pressure on county jails, including some incarceration limitations, counties have not yet widely utilized some options that might reduce the pressures they are encountering. Exploring these alternatives before handing lower-level felons back to the state seems particularly prudent, given that the prison system, in spite of realignment, is still struggling with reaching the federal three-judge panel’s mandated population target.
One such option examined in our report, split sentences, is used in only a fraction of all 1170(h) sentences, about 23 percent statewide. As with other realignment responses, the use of this option varies widely across counties. While some capacity-constrained counties are relying heavily on split sentences, others have chosen to avoid this strategy. Kings and Riverside Counties are two examples of jurisdictions that are facing serious capacity constraints (including court-ordered population caps). In addition to making capacity-constrained releases, these counties are alleviating some of the pressure by relying heavily on split sentences: 76 and 60 percent of all 1170(h) sentences in Kings and Riverside Counties are split sentences, respectively. Los Angeles and Kern Counties face similar capacity challenges, but both counties have, so far, been quite reserved in issuing split sentences (respectively, 5.4 and 10.1 percent of their 1170(h) sentences have been split sentences). This suggests that at least in some counties, some of the pressure can be alleviated by using tools and discretions provided by the state. Another potential strategy to free up beds is to reduce the number of inmates on federal contracts (used primarily by U.S. Immigration and Customs Enforcement to house immigration detainees). Statewide in June 2012, there were 4,300 federal-contract inmates, representing 5.5 percent of the average daily population in that month. Careful consideration should be given to the need for maintaining these contracts before committing to expensive expansions.
Looking ahead, the situation might become easier to handle. With funding made available by the state, some of the capacity constraints will be reduced through jail expansions. The Legislature passed AB900 in 2007 and SB1022 in 2012, allocating $1.2 billion and $500 million, respectively, to new jail construction. To date, 21 counties (including the four counties discussed above) have received grants from AB900, which will ultimately support the construction of 10,926 jail beds statewide. SB1022 funding could provide for the construction of up to 3,800 additional jail beds (Legislative Analyst’s Office 2013). Although these expansions should provide counties with additional flexibility, as well as upgraded facilities and infrastructure to more effectively provide programming and services, the need to seek alternatives to incarceration will continue to be of paramount importance. As welcome as the new legislative money might be, the financial burden of the expansions will fall primarily on the counties—construction costs account for less than 10 percent of the total cost of a jail over its lifetime (California State Sheriffs’ Association 2006).

http://www.ppic.org/main/home.asp Impact of Realignment on County Jail Populations 29
And finally, the data and analysis in this report clearly indicate that realignment has significantly reduced incarceration in California. As noted above, at the county level the jail population increased by only about one inmate for every three fewer felons sent to state prison. The statewide reduction in the incarceration rate is also evident in the total combined rate of both jails and prisons, which declined from 620 per 100,000 residents in June 2011 to 567 in June 2012, a reduction of close to 9 percent. However, our data and analysis also clearly point to the fact that the composition of the incarcerated population has changed, with decreases in the pretrial detainee and misdemeanant populations, as well as less time spent behind bars by parole violators. What effect these changes will have on public safety is surely one of the most important questions yet remaining for realignment (Petersilia and Snyder 2013). The answer will depend not only on the fact that some offenders are spending less time locked up, but also on the ability of counties to effectively identify and release only low-risk offenders and to provide effective services and treatment to reduce reoffending. Researchers, including the authors of this report, are in the process of obtaining appropriate data to examine these issues.

http://www.ppic.org/main/home.asp Impact of Realignment on County Jail Populations 30
References
American Civil Liberties Union. 2012. “California Prison Realignment One-Year Anniversary: An American Civil Liberties Union Assessment.” Available at https://www.aclunc.org/issues/criminal_justice/realignment_will_california_confront_its_incarceration_crisis.shtml.
Board of State and Community Corrections, Jail Profile Survey, www.bdcorr.ca.gov/joq/jps/QuerySelection.asp.
California State Sheriffs’ Association. 2006. “Do the Crime, Do the Time? Maybe Not, in California.” Available at www.calsheriffs.org/Documents/do_the_crime,_do_the_time.pdf .
Legislative Analyst’s Office. 2013. Governor’s Criminal Justice Proposals. Available at www.lao.ca.gov/analysis/2013/crim_justice/criminal-justice-proposals/criminal-justice-proposals-021513.pdf.
Lofstrom, Magnus, and Katherine Kramer. 2012. “Capacity Challenges in California's Jails,” Current Topics, Public Policy Institute of California. Available at www.ppic.org/main/publication_quick.asp?i=1034.
Lofstrom, Magnus, Joan Petersilia, and Steven Raphael. 2012. “Evaluating the Effects of California’s Corrections Realignment on Public Safety,” Public Policy Institute of California. Available at www.ppic.org/main/publication.asp?i=1030.
Lofstrom, Magnus, and Brandon Martin. 2013. “California’s County Jails,” Public Policy Institute of California. Avalaible at www.ppic.org/main/publication_show.asp?i=1061.
Petersilia, Joan, and Jessica Greenlick Snyder. 2013. “Looking Past The Hype: 10 Questions Everyone Should Ask About California’s Prison Realignment,” California Journal of Politics and Policy 5(2): 266-306. Available at http://papers.ssrn.com/sol3/papers.cfm?abstract_id=2254110.

http://www.ppic.org/main/home.asp Impact of Realignment on County Jail Populations 31
About the Authors
Magnus Lofstrom is a research fellow at PPIC. He also holds appointments as research fellow at the Institute for the Study of Labor (IZA) in Bonn, Germany; community scholar at the Julian Samora Research Institute at Michigan State University; and research associate at the Center for Comparative Immigration Studies at the University of California, San Diego. He is a member of the California State Controller’s Council of Economic Advisors and serves on the editorial board of Industrial Relations. His research focuses on public safety, immigration, entrepreneurship, and education. He has been widely published in academic journals and books and has been funded by the Russell Sage, Kauffman, and Smith Richardson Foundations. Prior to joining PPIC, he was an assistant professor of economics at the University of Texas, Dallas. He received his Ph.D. in economics from the University of California, San Diego.
Steven Raphael is professor of Public Policy at the Goldman School of Public Policy at the University of California, Berkeley. He is the author of the recently published book Why Are So Many Americans in Prison? His research focuses on the economics of low-wage labor markets, housing, and the economics of crime and corrections. His most recent research focuses on the social consequences of the large increases in U.S. incarceration rates. His research interests also include immigration policy, racial inequality, the economics of labor unions, social insurance policies, homelessness, and low-income housing. He is the editor in chief of Industrial Relations and a research fellow at the University of Michigan National Poverty Center, the University of Chicago Crime Lab, and the Institute for the Study of Labor (IZA) in Bonn, Germany. He holds a Ph.D. in economics from the University of California, Berkeley.
Acknowledgments
This report has benefited significantly from comments and suggestions by Mia Bird, Marshall Clement, Ryken Grattet, Michael Stoll, Sonya Tafoya, and Lynette Ubois. We also would like to thank Jay Atkinson, Brenda Grealish, Jacqui Coder, Lee Seale, and Loran Sheley of the California Department of Corrections and Rehabilitation for timely and insightful assistance with data used in this study.

http://www.ppic.org/main/home.asp Impact of Realignment on County Jail Populations 32
PUBLIC POLICY INSTITUTE OF CALIFORNIA
Board of Directors
Gary K. Hart, Chair Former State Senator and Secretary of Education State of California
Mark Baldassare President and CEO Public Policy Institute of California
Ruben Barrales President and CEO GROW Elect
María Blanco Vice President, Civic Engagement California Community Foundation
Brigitte Bren Attorney
Walter B. Hewlett Chair, Board of Directors William and Flora Hewlett Foundation
Donna Lucas Chief Executive Officer Lucas Public Affairs
Mas Masumoto Author and farmer
Steven A. Merksamer Senior Partner Nielsen, Merksamer, Parrinello, Gross & Leoni, LLP
Kim Polese Chairman ClearStreet, Inc.
Thomas C. Sutton Retired Chairman and CEO Pacific Life Insurance Company

The Public Policy Institute of California is dedicated to informing and improving public policy in California through independent, objective, nonpartisan research on major economic, social, and political issues. The institute’s goal is to raise public awareness and to give elected representatives and other decisionmakers a more informed basis for developing policies and programs.
The institute’s research focuses on the underlying forces shaping California’s future, cutting across a wide range of public policy concerns, including economic development, education, environment and resources, governance, population, public finance, and social and health policy.
PPIC is a private operating foundation. It does not take or support positions on any ballot measures or on any local, state, or federal legislation, nor does it endorse, support, or oppose any political parties or candidates for public office. PPIC was established in 1994 with an endowment from William R. Hewlett.
Mark Baldassare is President and Chief Executive Officer of PPIC. Gary K. Hart is Chair of the Board of Directors.
Short sections of text, not to exceed three paragraphs, may be quoted without written permission provided that full attribution is given to the source.
Research publications reflect the views of the authors and do not necessarily reflect the views of the staff, officers, or Board of Directors of the Public Policy Institute of California.
Copyright © 2013 Public Policy Institute of California All rights reserved. San Francisco, CA
PUBLIC POLICY INSTITUTE OF CALIFORNIA 500 Washington Street, Suite 600 San Francisco, California 94111 phone: 415.291.4400 fax: 415.291.4401 www.ppic.org
PPIC SACRAMENTO CENTER Senator Office Building 1121 L Street, Suite 801 Sacramento, California 95814 phone: 916.440.1120 fax: 916.440.1121

Technical Appendix
Impact of Realignment on County Jail Populations
Magnus Lofstrom and Steven Raphael with research support from Brandon Martin
Supported with funding from the Smith Richardson Foundation

http://www.ppic.org/main/home.asp Technical Appendix Impact of Realignment on County Jail Populations 2
Empirical Strategy for Estimating Cross-County Relationships Between Realignment and Jail Incarceration Rates To assess the degree to which realigned inmates are being transferred into county jails, we exploit the cross-county variation in the impact of realignment that we documented in Figure 3 of the main report. Specifically, we assess whether counties that have experienced larger declines in the rate at which county residents are incarcerated in state prison also experience larger increases in their county jail incarceration rates. This analysis relies on estimation of the regression model
(1)
where i=(1,…,58) indexes counties, t=(1,…9) indexes the first nine post-realignment months (October 2011 through June 2012), ∆County Jail Rateit is the pre-post realignment change in the number of jail inmates per 100,000 county residents in county i in month t, ∆Prison Incarceration Rateit is the pre-post realignment change in the number of county residents incarcerated in a state prison, 𝛼 and β are parameters to be estimated, and εit is a mean-zero error term. The coefficient β reflects the change in the jail incarceration rate caused by a change in the prison incarceration rate, and it provides a gauge of the degree to which realigned prison inmates impact the jail population. We measure the change in the jail incarceration rate using monthly jail data measured at the county level from the Board of State and Community Corrections’ Jail Profile Survey. To measure changes in county level incarceration rates, we calculate the difference between cumulative weekly admissions and releases between specific dates for each county from our weekly admissions and releases files.1
The manner in which we measure the change in jail and prison incarceration rates merits a detailed discussion. Absent some policy-induced shock to the prison population, such as the implementation of AB109, one would expect prison and jail populations to positively co-vary. For example, higher crime leads to more arrests, which leads to a larger jail population of inmates awaiting trial and transfer to prison, which in turn leads to a larger prison population. The reform in question, however, should cause negative covariance between prison and jail populations, as the legislation expands the scope of jails and contracts the scope of the state’s prison system. Hence, our analysis must focus on isolating variation in the prison population that is attributable to the reforms ushered in by AB109.
One possible manner of characterizing the change in the prison population would be to calculate the change in the number of county residents incarcerated in state prison for a given post-realignment month relative to the comparable month one year previous. June 2012 is the latest month for which we have data for both prison and jail populations. Focusing on the change relative to June 2011 ensures that we are making comparisons relative to the same time last year, and that any association we observe between the change in the prison incarceration rate and the change in the jail incarceration rate is not being driven by particular effects of calendar month and potential heterogeneity in these effects across counties. A potential weakness of this strategy, however, is that the change over the course of a full year when only a subset of months of that year fall into the post-realignment period is in part driven by underlying trends in crime and corrections
1 We do not have measures at any point in time of the level of state prison incarceration from any given county. However, since the incarcerated population at time t equals the incarcerated population at time t-1 plus admissions and minus releases during the intervening period, one can gauge changes from admissions and release data alone.
County Jail Rate Prison Incarceration Rate ,it it itα β ε∆ = + ∆ +

http://www.ppic.org/main/home.asp Technical Appendix Impact of Realignment on County Jail Populations 3
that predate the AB 109 reforms. For example, the change in jail incarceration rates from October 2010 through 2011 will be driven principally by what happened during the eleven pre-realignment months. To the extent that pre-realignment factors induce positive covariance between the county prison and jail populations, estimation of trans-institutionalization rates using the year-long differences may be biased towards zero.
An alternative strategy would be to calculate the changes in incarceration and jail populations by focusing on the more narrow time window between September 2011 and each post-realignment month in our data. By using the month immediately preceding the implementation of realignment, we can be sure that covariance in prison and jail is realignment-induced and not reflecting trends in underlying crime rates or enforcement and prosecutorial efforts at the county level. A shortcoming of this alternative characterization of the pre-post change is that the use of different calendar months for the pre and post period may confound seasonal variation in the jail and prison incarceration rates with an impact of realignment.
Our characterization of the dependent and explanatory variables in equation (1) draws on the relative strengths of these two alternatives approaches. Specifically, we calculate the pre-post realignment changes in the jails’ incarceration rate and the county-specific prison incarceration rate relative to September 2011 for each of the nine post-realignment months from October 2011 through June 1012. From each of these changes we subtract the corresponding change from one year previous. Doing so nets out any seasonal variation in prison and jail incarceration rates and isolates variation in the county’s jail and prison incarceration rates above and beyond seasonal variation.
To illustrate our strategy here, let’s focus specifically on our characterization of changes in prison and jail incarceration rates between September 2011 and June 2012. We begin by first tabulating the changes in rates for each county over this time period. The change in the jail and prison incarceration rates over this period will be driven by two factors: (1) the impact of the realignment reforms implemented between these two months and (2) the seasonal factors that influence trends in county jail and prison populations between these particular calendar months. We wish to isolate the first factor for each county and study the cross-county relationship between the effect of realignment on the number of county residents in prison and the number of county resident in local jails. Hence, we need to somehow adjust for the seasonal effect. To do so, we calculate comparable changes in prison and jail incarceration rates from September 2010 through June 2011 and subtract these earlier 2010 changes from the changes in incarceration rates that straddle the implementation of realignment. Our dependent variable thus measures the extent to which the change in the county jail incarceration rates between September 2011 and June 2012 exceeds the change in county jail incarceration rates for the comparable period one-year earlier. Similarly, our key explanatory variable is the extent to which the change in the county-level prison incarceration rate between September 2011 and June 2012 exceeds the comparable change for the county for the same period one year earlier.2
We repeat this process for each county relative to each post-realignment month. Hence, for each county we tabulate the change in jail and prison incarceration rates from September 2011 to October 2011 minus the comparable change from one year earlier, the comparable relative change from September 2011 to November 2011, the comparable relative change from September 2011 through December 2011, and so on through June
2 For all prison change calculations, we use weeks that occur in the middle of the month as end points. We make this specification choice due to the fact that the jail populations measure average daily population over the course of the entire month. The results are not sensitive to this choice.

http://www.ppic.org/main/home.asp Technical Appendix Impact of Realignment on County Jail Populations 4
2012. In all, each county contributes nine data points to the analysis, one for each post-realignment month for which we have complete prison and jail data.
To ensure that our results are not being driven by the difference-in-difference structure of our dependent and explanatory variables, we also present a complete set of parallel results based on the simple first difference of the explanatory and dependent variables.
We use this constructed dependent and explanatory variable to estimate various specifications of equation (1). First, we present results from simple bivariate regressions of the difference-in-difference in county jail incarceration rates on the corresponding difference-in-difference in county prison incarceration rates. The inclusion of the constant in the bivariate regression implies that we estimate the trans-institutionalization effect using variation in our difference-in-difference variables after netting out the state-level average for both. Second, we present a series of models that adds a complete set of county fixed effects to the specification. Doing so identifies the rate of cross-institution transfer making use of variation occurring within county beyond the county-specific average values for our difference-in-difference characterization of the explanatory and dependent variable. Finally, we present estimates including both county fixed effects and nine post-realignment month fixed effects. This latter category nets out both county-level averages for the nine data points per county as well as state-level average values of the difference-in-difference values that vary by end month. This latter specification is the most stringent and identifies the model with variation occurring within counties around a very flexibly-specified state-level time trend. There is, however, a drawback to relying on this specification, and it might, in fact, go one step too far, given how our data are constructed. As described above, using the differenced data we remove seasonal effects, but in doing so we also subtract out any underlying county-specific trend. As a result, all observations used are purged of these potential confounders and we have “cleaned” nine post-realignment observations per county. Including month fixed effects may then simply remove a statewide average treatment effect.
Our preferred specification is the second approach described above, which includes county-level fixed effects but not month effects. We believe that the county-fixed effects adequately adjust for all unobservable factors that influence post-realignment incarceration trends. As we show in subsequent analysis, many of these factors are quite important and are likely to be correlated with the realignment dose. We prefer this specification to the one including time effects due to the fact that there is very little variation remaining in the data, once time effects are added. Because our explanatory and dependent variables are changes, the inclusion of county fixed effects allows for county-specific time trends.
In Appendix Tables A3 through A8 we present complete results for all three specifications and for our two alternative characterizations of the dependent and explanatory variables. While we report our preferred specifications in the main body of the text, we present the more complete set of results here to afford the reader the full range of estimates and the ability to make one’s own judgment.

http://www.ppic.org/main/home.asp Technical Appendix Impact of Realignment on County Jail Populations 5
Measuring County-Level Jail Incarceration Growth Net of the Effect of the Realignment Dose In the main text of the report, we present estimation results that regress growth in local jail incarceration rates at the county level after netting out the effect of the increase in the offender caseload (the realignment dose) caused by the decline in the county’s prison incarceration rate. Table A9 presents a correlation matrix between all of these explanatory variables. We also add the county’s pre-realignment prison incarceration rate, as we control for this variable in some model specifications below. Several notable patterns in this table merit discussion. While there is a weak positive correlation between the use of split sentences and pre-realignment jail incarceration, counties with high prison incarceration rates prior to realignment tend to be less likely to employ split sentences. Moreover, the proportion of county voters supporting three-strike sentencing reform (Proposition 36) is negatively correlated with the use of split sentences. Interestingly, this measure of ideology is also strongly and negatively correlated with the county’s jail and prison incarceration rates before realignment was implemented. In other words, counties where the support for Proposition 36 was the weakest had the highest jail and prison incarceration rates. Finally, both pre-realignment incarceration rate variables are positively correlated with local crime rates.
To estimate this net growth, we employ this simple before-after characterization of the change in jail and prison incarceration rates to estimate the following equation
(2)
where all variables and indices are defined as above. The sole difference between the model specification in equation (2) and the model specification in equation (1) is that equation (2) allows for county-specific fixed effects (indicated by the county subscript on the intercept term α). The county-specific fixed effect estimates from this model provide a gauge of the average increase in the counties’ jail incarceration rate over the nine periods that form the bases for our data set. Moreover, since the change in the county prison incarceration rate is controlled for in the model, the estimates reflect the average change in the county after accounting for the realignment dose. These 57 fixed effect coefficients (Alpine County is not included in any model since it does not have a jail facility), provide our dependent variable for the analysis. Table A10 presents results when we use the first-difference specification of the dependent variable, while Table A11 presents comparable results when we use the difference-in-difference specification.
The structure of tables A10 and A11 are identical. Each column presents the results from a regression of the change in the jail incarceration rate after netting out the effect of the realignment dose on various combinations of the explanatory variables listed above. In model (1) we control for the proportion of sentences that are split, the pre-realignment population-to-capacity ratio, the proportion of local voters supporting Proposition 36, and the jail incarceration rate in June 2011. There is little evidence of an impact of the proportion split share on jail population growth in either table. In addition, while the coefficient on the population-to-capacity ratio has the expected sign, the coefficient is statistically insignificant. We find large, negative, and highly significant effects of both the proportion of voters supporting Proposition 36 and the pre-realignment jail incarceration rates in the models employing the first-difference specification of the dependent variable. In the difference-in-difference specification, the coefficient on the jail incarceration rate is similar, but the significant effect of the vote share variable disappears. We will postpone discussion of the magnitude until somewhat near the end of the discussion of these regression results.
County Jail Rate Prison Incarceration Rate ,it i it itα β ε∆ = + ∆ +

http://www.ppic.org/main/home.asp Technical Appendix Impact of Realignment on County Jail Populations 6
Model (2) adds the pre-realignment prison incarceration rate for each county. Adding this additional control variable has little effect on the other coefficients. This is not surprising since the pre-realignment incarceration rate is strongly correlated with the realignment dose (see Figure 3), the effect of which has already been netted out of our independent variable. We next add controls for the violent and property crime rates in each county in 2011 (shown as Model (3)). While neither coefficient is significant, their inclusion increases the size of the Proposition 36 and pre-realignment jail incarceration rate coefficients in Table A10. In Table A11, Proposition 36 is still statistically insignificant. Moreover, the coefficient on the jail population-to-capacity ratio increases and becomes marginally significant. Most importantly, Model (3) in both tables demonstrates that the results are not being driven by underlying differences across counties in crime rates. Finally, Model (4) substitutes voter support for Proposition 34 (to abolish the death penalty) for the Proposition 36 variable. The results are qualitatively similar, in that support for Proposition 34 is negatively associated with jail incarceration growth in the post-realignment period in Table A10 but not in Table A11. This is not too surprising since the cross-county correlation between these two vote share variables exceeds 0.90.
To characterize the magnitude of these effects, we use the coefficient estimates in our preferred specification, shown as Model (3), in conjunction with the values of each variable at the 25th and 75th percentiles of each distribution to calculate the effect of a difference in the explanatory variable equal to the interquartile range (the value at the 75th percentile minus the value at the 25th). With an interquartile difference in the proportion of voters supporting Proposition 36 of 0.081, our estimate in Table A10 implies that the county at the 75th percentile of this distribution would experience a change in the jail incarceration rate below the comparable change for the county at the 25th percentile by roughly 8 per 100,000, holding all else constant. A comparable calculation for the pre-realignment jail incarceration rate implies that the county at the 75th percentile of this distribution experiences an increase in the jail incarceration rate that is roughly 10 per 100,000 lower than the comparable change for county at the 25th percentile. Similarly, the county at the 75th percentile of the population-to-capacity ratio experiences an increase that is 3.5 inmates per 100,000 lower than that for the county at the 25th percentile of the distribution. When we employ the models in Table A11, there is no measurable effect of support for Proposition 36, while the effects of the jail population-to-capacity ratio and the pre-realignment jail incarceration rate are similar in magnitude.
Are the effects of these additional variables on jail incarceration rates large? When benchmarked against the average change in county jail incarceration rates over this period (17 per 100,000), indeed they are. We could alternatively compare these effect sizes to a comparable calculation for variation in the realignment dose. Between September 2011 and June 2012, the county at the 25th percentile of this distribution experienced an increase in its local offender caseload of 23 per 100,000 county residents as a result of the decline in the county’s prison incarceration rate. The comparable figure for the county at the 75th percentile of this distribution is 56. Combined with our largest estimate of the prison-jail transfer rate (0.367), this implies that the county at the 25th percentile would experience an increase in the jail incarceration rate that is 12.11 per 100,000 lower than the county at the 75th percentile. With a comparable effect for the corrections ideology variable of 8 and for the pre-realignment jail incarceration of 10, it becomes clear that these factors are of comparable importance in explaining what we have seen so far to underlying variation in the realignment dose.
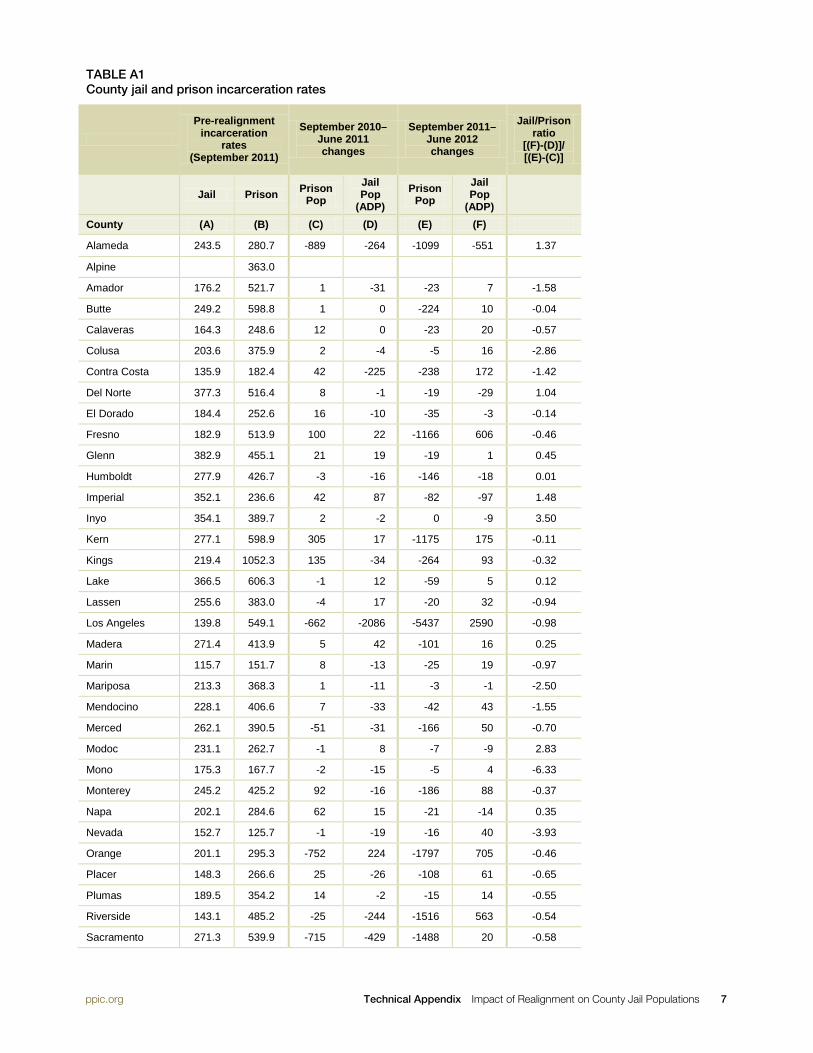
http://www.ppic.org/main/home.asp Technical Appendix Impact of Realignment on County Jail Populations 7
TABLE A1 County jail and prison incarceration rates
Pre-realignment
incarceration rates
(September 2011)
September 2010–June 2011 changes
September 2011–June 2012 changes
Jail/Prison ratio
[(F)-(D)]/ [(E)-(C)]
Jail Prison Prison Pop
Jail Pop
(ADP) Prison
Pop Jail Pop
(ADP)
County (A) (B) (C) (D) (E) (F)
Alameda 243.5 280.7 -889 -264 -1099 -551 1.37
Alpine 363.0 Amador 176.2 521.7 1 -31 -23 7 -1.58
Butte 249.2 598.8 1 0 -224 10 -0.04
Calaveras 164.3 248.6 12 0 -23 20 -0.57
Colusa 203.6 375.9 2 -4 -5 16 -2.86
Contra Costa 135.9 182.4 42 -225 -238 172 -1.42
Del Norte 377.3 516.4 8 -1 -19 -29 1.04
El Dorado 184.4 252.6 16 -10 -35 -3 -0.14
Fresno 182.9 513.9 100 22 -1166 606 -0.46
Glenn 382.9 455.1 21 19 -19 1 0.45
Humboldt 277.9 426.7 -3 -16 -146 -18 0.01
Imperial 352.1 236.6 42 87 -82 -97 1.48
Inyo 354.1 389.7 2 -2 0 -9 3.50
Kern 277.1 598.9 305 17 -1175 175 -0.11
Kings 219.4 1052.3 135 -34 -264 93 -0.32
Lake 366.5 606.3 -1 12 -59 5 0.12
Lassen 255.6 383.0 -4 17 -20 32 -0.94
Los Angeles 139.8 549.1 -662 -2086 -5437 2590 -0.98
Madera 271.4 413.9 5 42 -101 16 0.25
Marin 115.7 151.7 8 -13 -25 19 -0.97
Mariposa 213.3 368.3 1 -11 -3 -1 -2.50
Mendocino 228.1 406.6 7 -33 -42 43 -1.55
Merced 262.1 390.5 -51 -31 -166 50 -0.70
Modoc 231.1 262.7 -1 8 -7 -9 2.83
Mono 175.3 167.7 -2 -15 -5 4 -6.33
Monterey 245.2 425.2 92 -16 -186 88 -0.37
Napa 202.1 284.6 62 15 -21 -14 0.35
Nevada 152.7 125.7 -1 -19 -16 40 -3.93
Orange 201.1 295.3 -752 224 -1797 705 -0.46
Placer 148.3 266.6 25 -26 -108 61 -0.65
Plumas 189.5 354.2 14 -2 -15 14 -0.55
Riverside 143.1 485.2 -25 -244 -1516 563 -0.54
Sacramento 271.3 539.9 -715 -429 -1488 20 -0.58

http://www.ppic.org/main/home.asp Technical Appendix Impact of Realignment on County Jail Populations 8
Pre-realignment
incarceration rates
(September 2011)
September 2010–June 2011 changes
September 2011–June 2012 changes
Jail/Prison ratio
[(F)-(D)]/ [(E)-(C)]
Jail Prison Prison Pop
Jail Pop
(ADP) Prison
Pop Jail Pop
(ADP)
County (A) (B) (C) (D) (E) (F)
San Benito 226.4 280.0 24 -3 -14 -13 0.26
San Bernardino 253.6 589.8 336 -404 -2454 -124 -0.10
San Diego 151.6 381.1 85 -201 -1758 468 -0.36
San Francisco 183.7 182.3 27 -225 -426 87 -0.69
San Joaquin 160.2 505.9 87 -187 -588 183 -0.55
San Luis Obispo 194.1 284.6 -267 43 -334 31 0.18
San Mateo 135.4 217.5 53 -27 -216 59 -0.32
Santa Barbara 215.5 366.6 114 -23 -263 113 -0.36
Santa Clara 196.4 299.9 309 -193 -754 159 -0.33
Santa Cruz 168.6 208.9 -40 -18 -47 -36 2.57
Shasta 127.7 852.2 28 -5 -230 -11 0.02
Sierra 97.1 449.7 -1 -5 0 -2 3.00
Siskiyou 224.2 534.7 25 20 -33 5 0.26
Solano 183.2 387.5 -67 -113 -415 138 -0.72
Sonoma 192.9 251.8 25 33 -141 75 -0.25
Stanislaus 191.9 482.7 42 -96 -567 134 -0.38
Sutter 248.6 461.4 53 31 -117 51 -0.12
Tehama 298.6 787.7 49 -1 -73 10 -0.09
Trinity 348.9 415.4 -3 6 -9 5 0.17
Tulare 311.1 643.5 21 -3 -480 228 -0.46
Tuolumne 220.8 482.2 31 7 -20 5 0.04
Ventura 177.9 267.1 -2 -63 -436 173 -0.54
Yolo 182.1 551.8 111 -67 -133 81 -0.61
Yuba 505.3 691.7 -15 -62 -98 48 -1.33
Statewide 184.3 434.7 -1,180 -4,605 -25,136 6,486 -0.46
SOURCE: Authors’ calculations based on county level prison admissions and release data provided to the authors by CDCR and the BSCC Jail Profile Survey.
TABLE A1 (continued)

http://www.ppic.org/main/home.asp Technical Appendix Impact of Realignment on County Jail Populations 9
TABLE A2 County jail capacity
ADP/Rated capacity (%)
Capacity constrained releases
Share of split
sentences (%)
Court ordered jail cap
Inmates on
federal contract
Expected # of new beds due to AB900
Planned year of
opening
County Sept 2011
June 2012
Sept 2011
June 2012 Change June
2012 June 2012
Alameda 81.1 69.4 0 0 0 8.4 No 340 0 Alpine Amador 118.4 127.6 12 12 0 32.3 No 0 89 TBD
Butte 93.3 95.0 23 195 172 3.6 Yes 96 0 Calaveras 78.5 109.2 0 5 5 33.3 Yes 0 95 2013
Colusa 52.2 69.6 0 0 0 29.4 No 0 0 Contra Costa 72.1 80.8 0 0 0 84.2 No 150 0 Del Norte 111.7 83.5 0 0 0 14.3 No 0 0 El Dorado 81.8 81.1 105 109 4 52.1 Yes 0 0 Fresno 66.0 88.0 1,516 1,550 34 32.5 Yes 201 0 Glenn 69.4 70.1 0 0 0 67.6 No 0 0 Humboldt 93.7 89.3 60 127 67 63.6 No 0 0 Imperial 166.2 140.4 0 0 0 7.8 No 182 232 TBD
Inyo 72.9 63.5 0 0 0 0.0 No 0 0 Kern 88.7 95.2 515 889 374 10.1 Yes 186 822 TBD
Kings 102.4 133.0 0 84 84 76.2 Yes 0 252 2016
Lake 92.0 93.7 0 0 0 3.0 No 0 0 Lassen 51.0 72.5 0 0 0 4.7 No 0 0 Los Angeles 107.9 126.3 1,482 1,658 176 5.4 Yes 903 1024 TBD
Madera 99.5 103.3 0 15 15 48.1 No 2 145 2013
Marin 83.7 89.1 0 0 0 60.0 No 3 0 Mariposa 60.3 58.6 0 0 0 60.0 No 0 0 Mendocino 71.2 85.8 0 0 0 22.9 No 0 0 Merced 87.1 93.8 100 190 90 64.6 Yes 0 0 Modoc 62.8 41.9 0 0 0 0.0 No 0 0 Mono 54.2 62.5 0 0 0 28.6 No 0 0 Monterey 129.7 140.4 334 333 -1 6.3 No 288 TBD
Napa 100.4 95.1 65 80 15 73.8 No 0 0 Nevada 59.3 80.9 0 0 0 41.4 No 55 0 Orange 131.9 138.7 0 0 0 23.2 No 1185 512 2019
Placer 84.1 93.5 49 63 14 7.8 Yes 0 0 Plumas 46.3 67.2 0 11 11 7.1 No 0 0 Riverside 106.7 101.9 0 610 610 60.0 Yes 0 1250 2016
Sacramento 98.7 99.2 0 0 0 45.2 Yes 338 0 San Benito 97.9 88.7 28 17 -11 92.9 No 0 60 TBD

http://www.ppic.org/main/home.asp Technical Appendix Impact of Realignment on County Jail Populations 10
ADP/Rated capacity (%)
Capacity constrained releases
Share of split
sentences (%)
Court ordered jail cap
Inmates on
federal contract
Expected # of new beds due to AB900
Planned year of
opening
County Sept 2011
June 2012
Sept 2011
June 2012 Change June
2012 June 2012
San Bernardino 98.4 96.2 2,493 3,855 1,362 16.5 Yes 329 1368 2013
San Diego 103.6 113.6 664 1,057 393 21.9 Yes 104 838 2016
San Francisco 59.8 63.5 0 0 0 42.7 No 0 0 San Joaquin 83.2 96.9 617 750 133 66.2 Yes 0 1280 TBD San Luis Obispo 114.5 116.4 141 204 63 4.9 No 0 155 2015
San Mateo 117.4 124.5 26 35 9 85.8 No 2 0 Santa Barbara 104.7 118.5 543 494 -49 26.2 Yes 0 376 2018
Santa Clara 91.7 95.8 0 0 0 23.9 No 0 Santa Cruz 76.0 70.0 27 37 10 48.1 No 0 Shasta 61.4 58.5 246 397 151 41.8 No 0 0 Sierra 35.7 21.4 0 5 5 0.0 No 0 0 Siskiyou 86.5 91.3 59 72 13 37.5 No 0 150 TBD
Solano 70.2 82.9 147 43 -104 7.7 No 0 362 2014
Sonoma 69.7 74.6 45 69 24 52.9 No 0 0 Stanislaus 74.3 93.7 499 525 26 83.9 Yes 0 456 2016
Sutter 54.0 68.5 0 0 0 1.7 No 0 42 TBD
Tehama 101.6 106.8 0 0 0 30.3 No 0 0 Trinity 96.2 105.7 0 4 4 23.1 No 0 0 Tulare 80.5 93.8 477 353 -124 62.0 Yes 0 514 TBD
Tuolumne 81.2 84.6 48 6 -42 61.8 No 0 0 Ventura 79.9 89.4 47 80 33 27.3 No 0 0 Yolo 92.6 113.3 0 8 8 42.5 Yes 2 0 Yuba 85.9 98.4 0 0 0 25.9 No 240 0 Statewide 94.9 102.4 10,368 13,942 3,574 22.8 4,318 10,310
SOURCE: Authors’ calculations based on county level prison admissions and release data provided to the authors by CDCR and the BSCC Jail Profile Survey. Data on jail capacity and construction provided by BSCC.
TABLE A2 (continued)

http://www.ppic.org/main/home.asp Technical Appendix Impact of Realignment on County Jail Populations 11
TABLE A3 Estimated effects of the pre-post realignment change in county-level prison incarceration rates on the corresponding changes in county jail incarceration rates using the first difference characterization of the dependent variables
Model dependent variable Bivariate regression results Model inclusive of county fixed effects
Model inclusive of county and month fixed effects
Average daily population (ADP) -0.182b (0.087)
-0.231a
(0.067) -0.008 (0.030)
ADP, sentenced -0.207a
(0.062) -0.281a
(0.069) -0.033 (0.073)
Sentenced felons -0.500b
(0.229) -0.554a
(0.193) 0.140
(0.678)
Sentenced misdemeanants 0.042 (0.059)
-0.035 (0.085)
0.208 (0.154)
ADP, unsentenced 0.025 (0.049)
0.050 (0.037)
0.025 (0.043)
Unsentenced felons 1.398 (1.365)
-0.385 (0.352)
-0.616 (0.830)
Unsentenced misdemenants 0.122c
(0.073) 0.089
(0.060) 0.181
(0.123)
Pre-trial releases due to capacity constraints
-0.079b
(0.032) -0.120c
(0.073) -0.275 (0.177)
Sentenced releases due to capacity constraints
-0.167b
(0.076) -0.166b
(0.076) -0.349b
(0.157)
SOURCE: Authors’ calculations based on county level prison admissions and release data provided to the authors by CDCR and the BSCC Jail Profile Survey.
NOTES: Figures in the table are regression coefficients from regressions of the pre-post realignment difference change in the county’s jail incarceration rate on the corresponding change in the county’s prison incarceration rate. Standard errors are reported in parentheses and are calculated assuming an error variance-covariance matrix clustered at the county level. a Coefficient statistically significant at the one percent level of confidence. b Coefficient statistically significant at the five percent level of confidence. c Coefficient statistically significant at the ten percent level of confidence.

http://www.ppic.org/main/home.asp Technical Appendix Impact of Realignment on County Jail Populations 12
TABLE A4 Estimated effects of the pre-post realignment change in county-level prison incarceration rates on the corresponding changes in county jail Incarceration rates using the difference-in-difference characterization of the dependent variables
Model dependent variable Bivariate regression results Model inclusive of county fixed effects
Model inclusive of county and month fixed effects
Average daily population (ADP) -0.260a
(0.079) -0.367a
(0.105) -0.094 (0.089)
ADP, sentenced -0.060 (0.066)
-0.272a
(0.094) 0.006
(0.046)
Sentenced felons -0.050 (0.083)
-0.268a
(0.091) 0.005
(0.065)
Sentenced misdemeanants 0.016 (0.030)
0.026 (0.026)
0.039 (0.039)
ADP, unsentenced -0.200a
(0.075) -0.095a
(0.037) -0.099 (0.099)
Unsentenced felons -0.157b
(0.078) -0.093b
(0.045) -0.060 (0.103)
Unsentenced misdemenants 0.022 (0.040)
0.039 (0.038)
0.047 (0.067)
Pre-trial releases due to capacity constraints
-0.081b
(0.039) -0.131b
(0.065) -0.205c
(0.115)
Sentenced releases due to capacity constraints
-0.135b
(0.066) -0.245a
(0.063) -0.246b
(0.109)
SOURCE: Authors’ calculations based on county level prison admissions and release data provided to the authors by CDCR and the BSCC Jail Profile Survey.
NOTES: Figures in the table are regression coefficients from regressions of the pre-post realignment difference change in the county’s jail incarceration rate on the corresponding change in the county’s prison incarceration rate. Standard errors are reported in parentheses and are calculated assuming an error variance-covariance matrix clustered at the county level. a Coefficient statistically significant at the one percent level of confidence. b Coefficient statistically significant at the five percent level of confidence. c Coefficient statistically significant at the ten percent level of confidence.

http://www.ppic.org/main/home.asp Technical Appendix Impact of Realignment on County Jail Populations 13
TABLE A5 Estimated effects of the pre-post realignment change in county-level prison incarceration rates on the corresponding changes in county jail incarceration rates for counties without court imposed jail population limits using the first-difference characterization of the dependent variables
Model dependent variable Bivariate regression results Model inclusive of county fixed effects
Model inclusive of county and month fixed effects
Average daily population (ADP) -0.064 (0.149)
-0.193 (0.133)
-0.007 (0.145)
ADP, sentenced -0.236a
(0.063) -0.329a
(0.050) -0.117 (0.077)
Sentenced felons -0.919 (0.669)
-0.792c
(0.431) 0.849
(1.122)
Sentenced misdemeanants -0.268 (0.291)
-0.311 (0.360)
0.082 (0.247)
ADP, unsentenced 0.172 (0.162)
0.136 (0.137)
0.110 (0.149)
Unsentenced felons -0.335 (0.557)
0.112 (0.368)
0.414 (0.383)
Unsentenced misdemenants 0.013 (0.118)
0.207 (0.198)
0.509 (0.326)
Pre-trial releases due to capacity constraints
-0.101 (0.084)
-0.081 (0.060)
-0.207 (0.153)
Sentenced releases due to capacity constraints
-0.013 (0.017)
-0.027b
(0.013) -0.017 (0.027)
SOURCE: Authors’ calculations based on county level prison admissions and release data provided to the authors by CDCR and the BSCC Jail Profile Survey.
NOTES: Figures in the table are regression coefficients from regressions of the difference-in-difference characterization of the change in the county’s jail incarceration rate on the corresponding change in the county’s prison incarceration rate. Standard errors are reported in parentheses and are calculated assuming an error variance-covariance matrix clustered at the county level. a Coefficient statistically significant at the one percent level of confidence. b Coefficient statistically significant at the five percent level of confidence. c Coefficient statistically significant at the ten percent level of confidence.

http://www.ppic.org/main/home.asp Technical Appendix Impact of Realignment on County Jail Populations 14
TABLE A6 Estimated effects of the pre-post realignment change in county-level prison incarceration rates on the corresponding changes in county jail incarceration rates for counties with court-imposed jail population limits using the first-difference characterization of the dependent variables
Model dependent variable Bivariate regression results Model inclusive of county fixed effects
Model inclusive of county and month fixed effects
Average daily population (ADP) -0.184 (0.111)
-0.242a
(0.078) 0.073
(0.103)
ADP, sentenced -0.176b
(0.077) -0.267a
(0.089) 0.032
(0.127)
Sentenced felons -0.428 (0.261)
-0.485b
(0.219) -0.463 (0.593)
Sentenced misdemeanants 0.070 (0.062)
0.044 (0.046)
0.040 (0.097)
ADP, unsentenced -0.009 (0.058)
0.025 (0.027)
0.041 (0.077)
Unsentenced felons 1.731 (1.702)
-0.464 (0.452)
-1.123 (1.184)
Unsentenced misdemenants 0.117 (0.074)
0.056 (0.054)
0.099 (0.107)
Pre-trial releases due to capacity constraints
-0.077c
(0.039) -0.132 (0.094)
-0.319 (0.269)
Sentenced releases due to capacity constraints
-0.210b
(0.094) -0.206b
(0.095) -0.482b
(0.200)
SOURCE: Authors’ calculations based on county level prison admissions and release data provided to the authors by CDCR and the BSCC Jail Profile Survey.
NOTES: Figures in the table are regression coefficients from regressions of the difference-in-difference characterization of the change in the county’s jail incarceration rate on the corresponding change in the county’s prison incarceration rate. Standard errors are reported in parentheses and are calculated assuming an error variance-covariance matrix clustered at the county level. a Coefficient statistically significant at the one percent level of confidence. b Coefficient statistically significant at the five percent level of confidence. c Coefficient statistically significant at the ten percent level of confidence.

http://www.ppic.org/main/home.asp Technical Appendix Impact of Realignment on County Jail Populations 15
TABLE A7 Estimated effects of the pre-post realignment change in county-level prison incarceration rates on the corresponding changes in county jail incarceration rates for counties without court-imposed jail population limits using the difference-in-difference characterization of the dependent variables
Model dependent variable Bivariate regression results Model inclusive of county fixed effects
Model inclusive of county and month fixed effects
Average daily population (ADP) -0.247b
(0.113) -0.382a
(0.090) -0.236 (0.164)
ADP, sentenced -0.035 (0.072)
-0.270a
(0.064) 0.055
(0.061)
Sentenced felons -0.003 (0.095)
-0.211a
(0.070) 0.141
(0.079)
Sentenced misdemeanants 0.118 (0.078)
0.081 (0.061)
0.145 (0.106)
ADP, unsentenced -0.212c
(0.125) -0.112 (0.073)
-0.291 (0.185)
Unsentenced felons -0.109 (0.177)
-0.129 (0.119)
-0.236 (0.283)
Unsentenced misdemenants 0.191 (0.166)
0.190 (0.151)
0.354 (0.282)
Pre-trial releases due to capacity constraints
0.116 (0.068)
-0.046 (0.092)
-0.101 (0.147)
Sentenced releases due to capacity constraints
0.053 (0.058)
-0.061b
(0.029) -0.098 (0.055)
SOURCE: Authors’ calculations based on county level prison admissions and release data provided to the authors by CDCR and the BSCC Jail Profile Survey.
NOTES: Figures in the table are regression coefficients from regressions of the difference-in-difference characterization of the change in the county’s jail incarceration rate on the corresponding change in the county’s prison incarceration rate. Standard errors are reported in parentheses and are calculated assuming an error variance-covariance matrix clustered at the county level. a Coefficient statistically significant at the one percent level of confidence. b Coefficient statistically significant at the five percent level of confidence. c Coefficient statistically significant at the ten percent level of confidence.

http://www.ppic.org/main/home.asp Technical Appendix Impact of Realignment on County Jail Populations 16
TABLE A8 Estimated effects of the pre-post realignment change in county-level prison incarceration rates on the corresponding changes in county jail incarceration rates for counties with court-imposed jail population limits using the difference-in-difference characterization of the dependent variables
Model dependent variable Bivariate regression results Model inclusive of county fixed effects
Model inclusive of county and month fixed effects
Average daily population (ADP) -0.201b
(0.092) -0.363a
(0.134) 0.111
(0.074)
ADP, sentenced 0.021 (0.079)
-0.279b
(0.119) 0.060
(0.125)
Sentenced felons 0.034 (0.108)
-0.280b
(0.116) 0.073
(0.132)
Sentenced misdemeanants -0.019 (0.029)
0.009 (0.027)
-0.009 (0.050)
ADP, unsentenced -0.223b
(0.104) -0.083c
(0.044) 0.050
(0.104)
Unsentenced felons -0.200c
(0.101) -0.077 (0.050)
0.070 (0.110)
Unsentenced misdemenants -0.019 (0.015)
0.009 (0.029)
-0.041 (0.053)
Pre-trial releases due to capacity constraints
-0.118a
(0.039) -0.157c
(0.083) -0.279 (0.209)
Sentenced releases due to capacity constraints
-0.146c
(0.076) -0.278a
(0.073) -0.181 (0.184)
SOURCE: Authors’ calculations based on county level prison admissions and release data provided to the authors by CDCR and the BSCC Jail Profile Survey.
NOTES: Figures in the table are regression coefficients from regressions of the difference-in-difference characterization of the change in the county’s jail incarceration rate on the corresponding change in the county’s prison incarceration rate. Standard errors are reported in parentheses and are calculated assuming an error variance-covariance matrix clustered at the county level. a Coefficient statistically significant at the one percent level of confidence. b Coefficient statistically significant at the five percent level of confidence. c Coefficient statistically significant at the ten percent level of confidence.

http://www.ppic.org/main/home.asp Technical Appendix Impact of Realignment on County Jail Populations 17
TABLE A9 Correlation matrix for county level variables used to model the residual change in county-level jail incarceration rates
Proportion split share
Jail pop-capacity
ratio, June 2011
Proportion supporting
prop 36
Jail inc. rate,
June 2011
Prison inc. rate,
June 2011
Violent crimes per
100,000, 2011
Property crimes per
100,000, 2011
Proportion split share 1 – – – – – –
Jail pop-capacity ratio, June 2011 -0.206 1 – – – – –
Proportion supporting prop 36
-0.158 -0.021 1 – – – –
Jail inc. rate, June 2011 0.014 -0.027 -0.332 1 – – –
Prison inc. rate, June 2011 -0.291 -0.024 -0.419 0.066 1 – –
Violent crimes per 100,000, 2011
-0.133 -0.509 0.115 0.122 0.349 1 –
Property crimes per 100,000, 2011
0.164 -0.430 -0.348 0.277 0.370 0.681 1
SOURCE: Authors’ calculations based on county level prison admissions and release data provided to the authors by CDCR and the BSCC Jail Profile Survey.

http://www.ppic.org/main/home.asp Technical Appendix Impact of Realignment on County Jail Populations 18
Table A10 Regression model estimates investigating the determinants of pre-post realignment jail incarceration growth beyond the realignment-induced population shock using county fixed-effect models from first-difference specification of the dependent variable
(1) (2) (3) (4)
Proportion split share 5.994 (6.950)
6.262 (7.739)
8.875 (8.045)
7.619 (8.348)
Jail pop-capacity ratio, June 2011
-12.445 (9.759)
-12.331 (9.951)
-20.265c
(11.860) -22.794c
(12.078)
Proportion supporting prop 36
-91.871a
(26.337) -90.587a
(30.830) -98.491a
(36.760) -
Jail inc. rate, June 2011
-0.181a
(0.033) -0.181a
(0.033) -0.167a
(0.034) -0.168a
(0.035)
Prison inc. rate, June 2011 – 0.001
(0.014) 0.009
(0.015) 0.015
(0.015)
Violent crimes per 100,000, 2011 – – 0.002
(0.021) -0.002 (0.022)
Property crimes per 100,000, 2011 – – -0.009
(0.007) -0.007 (0.007)
Proportion supporting prop 34 – – – -57.957b
(26.355)
R2 0.417 0.418 0.451 0.427
N 57 57 57 57
SOURCE: Authors’ calculations based on county level prison admissions and release data provided to the authors by CDCR and the BSCC Jail Profile Survey.
NOTES: Standard errors are in parentheses. Each figure comes from a regression of the county-level change in jail incarceration rates net of the effect of the realignment inmate dose experienced by the county on the explanatory variables listed in the table. All models include a constant term. The dependent variable is estimated from the first-difference regression model inclusive of county fixed effects and the change in county-specific prison incarceration rates. The coefficient on the county fixed effects provide the county values for our dependent variables. a Coefficient statistically significant at the one percent level of confidence. b Coefficient statistically significant at the five percent level of confidence. c Coefficient statistically significant at the ten percent level of confidence.

http://www.ppic.org/main/home.asp Technical Appendix Impact of Realignment on County Jail Populations 19
TABLE A11 Regression model estimates investigating the determinants of pre-post realignment jail incarceration growth beyond the realignment-induced population shock using county fixed-effect models from difference-in-difference specification of the dependent variable
(1) (2) (3) (4)
Proportion split share 3.785 (8.145)
9.734 (8.853)
10.123 (9.457)
10.969 (9.592)
Jail pop-capacity ratio, June 2011
-21.547c
(11.437) -19.011c
(11.384) -22.145
(13.949) -22.163
(13.877)
Proportion supporting prop 36
-30.948
(30.867) -2.527
(35.267) -1.066
(43.215) –
Jail inc. rate, June 2011
-0.209a
(0.038) -0.202a
(0.038) -0.198a
(0.040) -0.191a
(0.041)
Prison inc. rate, June 2011 – 0.025
(0.016) 0.028
(0.018) 0.032
(0.017)
Violent crimes per 100,000, 2011 – – -0.004
(0.025) -0.009 (0.025)
Property crimes per 100,000, 2011 – – -0.002
(0.008) -0.000 (0.007)
Proportion supporting prop 34 – – – 12.032
(30.281)
R2 0.397 0.426 0.428 0.429
N 57 57 57 57
SOURCE: Authors’ calculations based on county level prison admissions and release data provided to the authors by CDCR and the BSCC Jail Profile Survey.
NOTES: Standard errors are in parentheses. Each figure comes from a regression of the county-level change in jail incarceration rates net of the effect of the realignment inmate dose experienced by the county on the explanatory variables listed in the table. All models include a constant term. The dependent variable is estimated from the difference-in-difference regression model inclusive of county fixed effects and the change in county-specific prison incarceration rates. The coefficient on the county fixed effects provide the county values for our dependent variables a Coefficient statistically significant at the one percent level of confidence. b Coefficient statistically significant at the five percent level of confidence. c Coefficient statistically significant at the ten percent level of confidence.

The Public Policy Institute of California is dedicated to informing and improving public policy in California through independent, objective, nonpartisan research on major economic, social, and political issues. The institute’s goal is to raise public awareness and to give elected representatives and other decisionmakers a more informed basis for developing policies and programs.
The institute’s research focuses on the underlying forces shaping California’s future, cutting across a wide range of public policy concerns, including economic development, education, environment and resources, governance, population, public finance, and social and health policy.
PPIC is a private operating foundation. It does not take or support positions on any ballot measures or on any local, state, or federal legislation, nor does it endorse, support, or oppose any political parties or candidates for public office. PPIC was established in 1994 with an endowment from William R. Hewlett.
Mark Baldassare is President and Chief Executive Officer of PPIC. Gary K. Hart is Chair of the Board of Directors.
Short sections of text, not to exceed three paragraphs, may be quoted without written permission provided that full attribution is given to the source.
Research publications reflect the views of the authors and do not necessarily reflect the views of the staff, officers, or Board of Directors of the Public Policy Institute of California.
Copyright © 2013 Public Policy Institute of California All rights reserved. San Francisco, CA
PUBLIC POLICY INSTITUTE OF CALIFORNIA 500 Washington Street, Suite 600 San Francisco, California 94111 phone: 415.291.4400 fax: 415.291.4401 www.ppic.org
PPIC SACRAMENTO CENTER Senator Office Building 1121 L Street, Suite 801 Sacramento, California 95814 phone: 916.440.1120 fax: 916.440.1121