Impact of pharmaceutical care interventions on the ... · HIV/AIDS is one of the disease conditions...
17
Special Issue: Development and Sustainability in Africa – Part 1 International Journal of Development and Sustainability Online ISSN: 2168-8662 – www.isdsnet.com/ijds Volume 1 Number 3 (2012): Pages 1170-1186 ISDS Article ID: IJDS13051501 Impact of pharmaceutical care interventions on the occurrence and resolution of side/adverse drug effects associated with antiretroviral drug therapy Ezeudo Ewuziem Nwaozuzu 1* , Mathew J. Okonta 2 , Cletus Nze Aguwa 2 1 Pharmacy Department, Federal Medical Centre, Owerri, Imo State, Nigeria 2 Clinical Pharmacy Department, Faculty of Pharmaceutical Sciences, University of Nigeria, Nsukka Abstract Pharmaceutical care (PC) has been shown to improve the outcome of drug therapy in many disease conditions. HIV/AIDS is one of the disease conditions that are fraught with many problems that can benefit from this new emphasis of pharmacy practice also known as ‘pharmacists care’. Adverse drug reactions or effects are unintended and undesirable effects of drugs other than their known and expected actions which can be unpleasant and sometimes fatal. This study is designed to evaluate the impact of pharmaceutical care activities on the occurrence of side/adverse drug reactions in HIV/AIDS patients receiving antiretroviral drugs. The components of the American society of health-system pharmacists (ASHP) guidelines on ‘standardized method for pharmaceutical care’ was used as a data collection instrument to evaluate, document and intervene in the antiretroviral therapy of about one thousand four hundred and seventy three (1,473) patients. The study identified about sixty (60) different types of side/adverse effects occurring among these patients through observation and patient complaints. The study also showed significant reduction in the incidence of side/adverse drug effects following the Pharmacist’s intervention activities, p ≥ 0.5. The study showed that pharmacists’ interventions in antiretroviral drug therapy through Pharmaceutical care can significantly reduce the incidence of side/adverse drug effects in HIV/AIDS patients receiving antiretroviral drugs. Keywords: Pharmaceutical care, HIV/AIDS, Side/adverse drug effects, Pharmacist interventions, Hospital pharmacy Copyright © 2013 by the Author(s) – Published by ISDS LLC, Japan International Society for Development and Sustainability (ISDS) * Corresponding author. E-mail address: [email protected]
Transcript of Impact of pharmaceutical care interventions on the ... · HIV/AIDS is one of the disease conditions...
Special Issue: Development and Sustainability in Africa – Part 1
International Journal of Development and Sustainability
Online ISSN: 2168-8662 – www.isdsnet.com/ijds
Volume 1 Number 3 (2012): Pages 1170-1186
ISDS Article ID: IJDS13051501
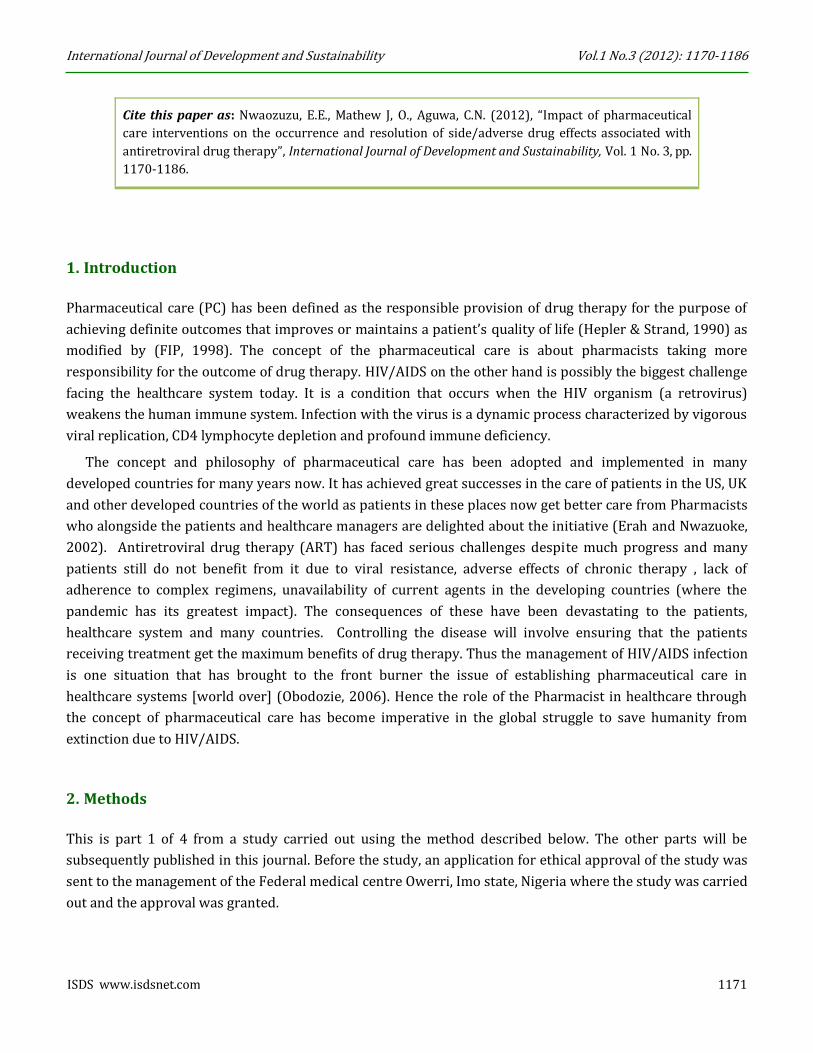
Impact of pharmaceutical care interventions on the occurrence and resolution of side/adverse drug effects associated with antiretroviral drug therapy
Ezeudo Ewuziem Nwaozuzu 1*, Mathew J. Okonta 2, Cletus Nze Aguwa 2
1 Pharmacy Department, Federal Medical Centre, Owerri, Imo State, Nigeria 2 Clinical Pharmacy Department, Faculty of Pharmaceutical Sciences, University of Nigeria, Nsukka
Abstract
Pharmaceutical care (PC) has been shown to improve the outcome of drug therapy in many disease conditions.
HIV/AIDS is one of the disease conditions that are fraught with many problems that can benefit from this new
emphasis of pharmacy practice also known as ‘pharmacists care’. Adverse drug reactions or effects are unintended
and undesirable effects of drugs other than their known and expected actions which can be unpleasant and
sometimes fatal. This study is designed to evaluate the impact of pharmaceutical care activities on the occurrence of
side/adverse drug reactions in HIV/AIDS patients receiving antiretroviral drugs. The components of the American
society of health-system pharmacists (ASHP) guidelines on ‘standardized method for pharmaceutical care’ was used
as a data collection instrument to evaluate, document and intervene in the antiretroviral therapy of about one
thousand four hundred and seventy three (1,473) patients. The study identified about sixty (60) different types of
side/adverse effects occurring among these patients through observation and patient complaints. The study also
showed significant reduction in the incidence of side/adverse drug effects following the Pharmacist’s intervention
activities, p ≥ 0.5. The study showed that pharmacists’ interventions in antiretroviral drug therapy through
Pharmaceutical care can significantly reduce the incidence of side/adverse drug effects in HIV/AIDS patients
receiving antiretroviral drugs.
Keywords: Pharmaceutical care, HIV/AIDS, Side/adverse drug effects, Pharmacist interventions, Hospital pharmacy
Copyright © 2013 by the Author(s) – Published by ISDS LLC, Japan
International Society for Development and Sustainability (ISDS)
* Corresponding author. E-mail address: [email protected]
International Journal of Development and Sustainability Vol.1 No.3 (2012): 1170-1186
ISDS www.isdsnet.com 1171
Cite this paper as: Nwaozuzu, E.E., Mathew J, O., Aguwa, C.N. (2012), “Impact of pharmaceutical
care interventions on the occurrence and resolution of side/adverse drug effects associated with
antiretroviral drug therapy”, International Journal of Development and Sustainability, Vol. 1 No. 3, pp.
1170-1186.
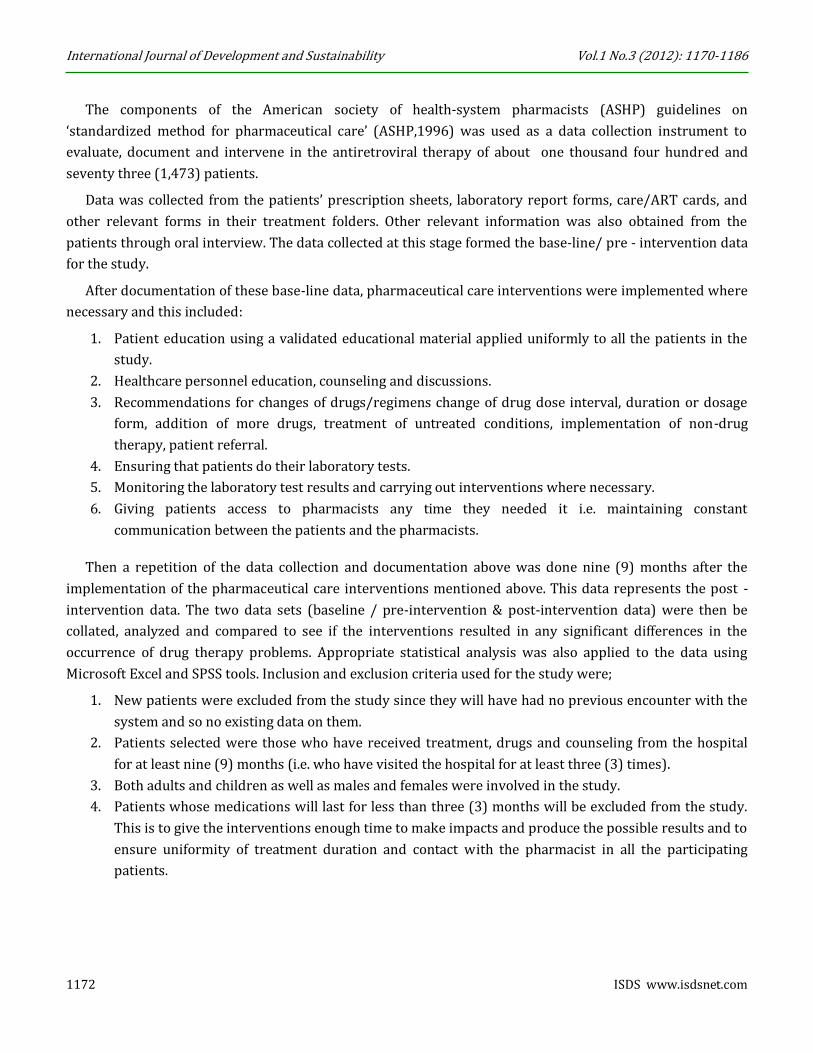
1. Introduction
Pharmaceutical care (PC) has been defined as the responsible provision of drug therapy for the purpose of
achieving definite outcomes that improves or maintains a patient’s quality of life (Hepler & Strand, 1990) as
modified by (FIP, 1998). The concept of the pharmaceutical care is about pharmacists taking more
responsibility for the outcome of drug therapy. HIV/AIDS on the other hand is possibly the biggest challenge
facing the healthcare system today. It is a condition that occurs when the HIV organism (a retrovirus)
weakens the human immune system. Infection with the virus is a dynamic process characterized by vigorous
viral replication, CD4 lymphocyte depletion and profound immune deficiency.
The concept and philosophy of pharmaceutical care has been adopted and implemented in many
developed countries for many years now. It has achieved great successes in the care of patients in the US, UK
and other developed countries of the world as patients in these places now get better care from Pharmacists
who alongside the patients and healthcare managers are delighted about the initiative (Erah and Nwazuoke,
2002). Antiretroviral drug therapy (ART) has faced serious challenges despite much progress and many
patients still do not benefit from it due to viral resistance, adverse effects of chronic therapy , lack of
adherence to complex regimens, unavailability of current agents in the developing countries (where the
pandemic has its greatest impact). The consequences of these have been devastating to the patients,
healthcare system and many countries. Controlling the disease will involve ensuring that the patients
receiving treatment get the maximum benefits of drug therapy. Thus the management of HIV/AIDS infection
is one situation that has brought to the front burner the issue of establishing pharmaceutical care in
healthcare systems [world over] (Obodozie, 2006). Hence the role of the Pharmacist in healthcare through
the concept of pharmaceutical care has become imperative in the global struggle to save humanity from
extinction due to HIV/AIDS.
2. Methods
This is part 1 of 4 from a study carried out using the method described below. The other parts will be
subsequently published in this journal. Before the study, an application for ethical approval of the study was
sent to the management of the Federal medical centre Owerri, Imo state, Nigeria where the study was carried
out and the approval was granted.
International Journal of Development and Sustainability Vol.1 No.3 (2012): 1170-1186
1172 ISDS www.isdsnet.com
The components of the American society of health-system pharmacists (ASHP) guidelines on
‘standardized method for pharmaceutical care’ (ASHP,1996) was used as a data collection instrument to
evaluate, document and intervene in the antiretroviral therapy of about one thousand four hundred and
seventy three (1,473) patients.
Data was collected from the patients’ prescription sheets, laboratory report forms, care/ART cards, and
other relevant forms in their treatment folders. Other relevant information was also obtained from the
patients through oral interview. The data collected at this stage formed the base-line/ pre - intervention data
for the study.
After documentation of these base-line data, pharmaceutical care interventions were implemented where
necessary and this included:
1. Patient education using a validated educational material applied uniformly to all the patients in the
study.
2. Healthcare personnel education, counseling and discussions.
3. Recommendations for changes of drugs/regimens change of drug dose interval, duration or dosage
form, addition of more drugs, treatment of untreated conditions, implementation of non-drug
therapy, patient referral.
4. Ensuring that patients do their laboratory tests.
5. Monitoring the laboratory test results and carrying out interventions where necessary.
6. Giving patients access to pharmacists any time they needed it i.e. maintaining constant
communication between the patients and the pharmacists.
Then a repetition of the data collection and documentation above was done nine (9) months after the
implementation of the pharmaceutical care interventions mentioned above. This data represents the post -
intervention data. The two data sets (baseline / pre-intervention & post-intervention data) were then be
collated, analyzed and compared to see if the interventions resulted in any significant differences in the
occurrence of drug therapy problems. Appropriate statistical analysis was also applied to the data using
Microsoft Excel and SPSS tools. Inclusion and exclusion criteria used for the study were;
1. New patients were excluded from the study since they will have had no previous encounter with the
system and so no existing data on them.
2. Patients selected were those who have received treatment, drugs and counseling from the hospital
for at least nine (9) months (i.e. who have visited the hospital for at least three (3) times).
3. Both adults and children as well as males and females were involved in the study.
4. Patients whose medications will last for less than three (3) months will be excluded from the study.
This is to give the interventions enough time to make impacts and produce the possible results and to
ensure uniformity of treatment duration and contact with the pharmacist in all the participating
patients.
International Journal of Development and Sustainability Vol.1 No.3 (2012): 1170-1186
ISDS www.isdsnet.com 1173
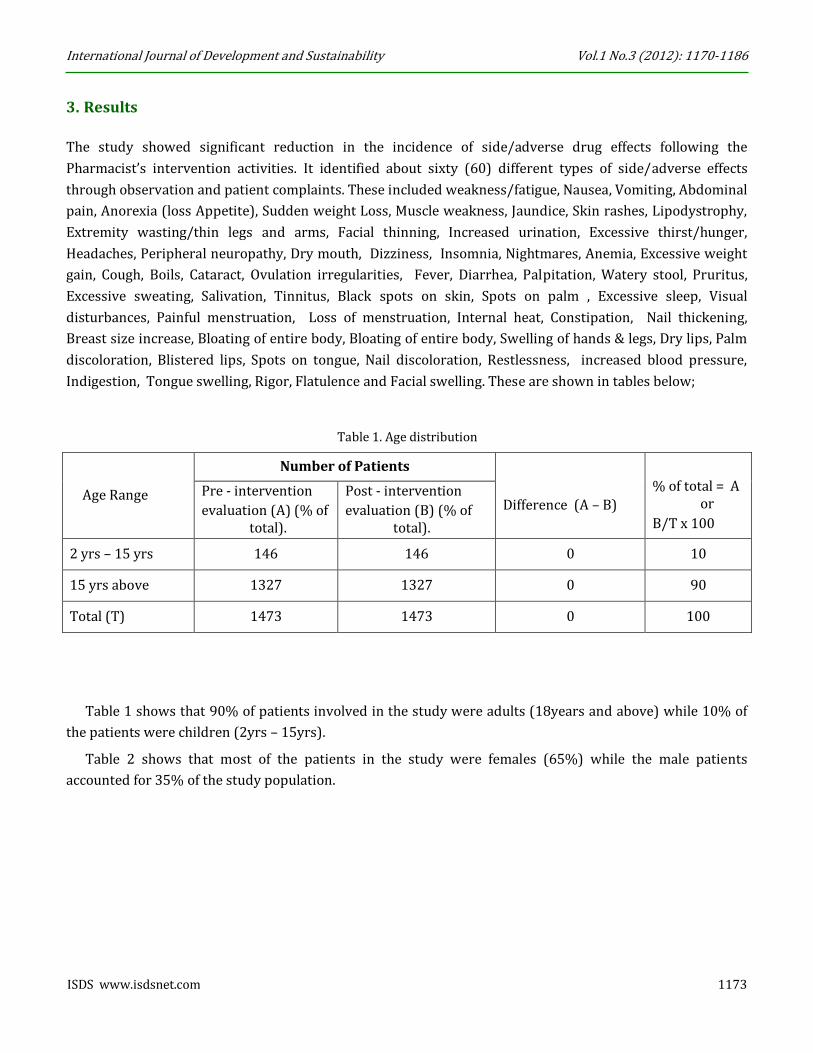
3. Results
The study showed significant reduction in the incidence of side/adverse drug effects following the
Pharmacist’s intervention activities. It identified about sixty (60) different types of side/adverse effects
through observation and patient complaints. These included weakness/fatigue, Nausea, Vomiting, Abdominal
pain, Anorexia (loss Appetite), Sudden weight Loss, Muscle weakness, Jaundice, Skin rashes, Lipodystrophy,
Extremity wasting/thin legs and arms, Facial thinning, Increased urination, Excessive thirst/hunger,
Headaches, Peripheral neuropathy, Dry mouth, Dizziness, Insomnia, Nightmares, Anemia, Excessive weight
gain, Cough, Boils, Cataract, Ovulation irregularities, Fever, Diarrhea, Palpitation, Watery stool, Pruritus,
Excessive sweating, Salivation, Tinnitus, Black spots on skin, Spots on palm , Excessive sleep, Visual
disturbances, Painful menstruation, Loss of menstruation, Internal heat, Constipation, Nail thickening,
Breast size increase, Bloating of entire body, Bloating of entire body, Swelling of hands & legs, Dry lips, Palm
discoloration, Blistered lips, Spots on tongue, Nail discoloration, Restlessness, increased blood pressure,
Indigestion, Tongue swelling, Rigor, Flatulence and Facial swelling. These are shown in tables below;
Table 1. Age distribution
Age Range
Number of Patients
Difference (A – B)
% of total = A or
B/T x 100
Pre - intervention
evaluation (A) (% of total).
Post - intervention
evaluation (B) (% of total).
2 yrs – 15 yrs 146 146 0 10
15 yrs above 1327 1327 0 90
Total (T) 1473 1473 0 100
Table 1 shows that 90% of patients involved in the study were adults (18years and above) while 10% of
the patients were children (2yrs – 15yrs).
Table 2 shows that most of the patients in the study were females (65%) while the male patients
accounted for 35% of the study population.

International Journal of Development and Sustainability Vol.1 No.3 (2012): 1170-1186
1174 ISDS www.isdsnet.com
Table 2. Sex (gender) distribution
Table 3. Distribution of drug regimens
Regimen
Number of Patients
% of total = A/T or
B/T x 100
Difference
Pre -intervention Post - intervention (A - B)
evaluation (A) (% of total).
evaluation (B) (% of total).
AZT/3TC/NVP 339 339 0 23.01
D4T/3TC/NVP 948 948 0 64.3
AZT/3TC/EFV 36 36 0 2.4
D4T/3TC/EFV 105 105 0 7.13
3TC/ABC/NVP 5 5 0 0.34
LPV+r /TDF+ FTC 11 11 0 0.8
D4T/3TC/ABC 3 3 0 0.2
TDF+FTC/LPV+ r/AZT+3TC
3 3 0 0.2
TDF+FTC/LPV+ r/AZT
3 3 0 0.2
TDF+FTC /NVP 6 6 0 0.41
AZT+3TC /TDF /LPV+r. 2 2 0 0.14
TDF+FTC/EFV 11 11 0 0.8
LPV+r/EFV 1 1 0 0.07
TOTAL (T) 1473 1473 0 100
Table 3 shows that most of the patients (64.3%) are on the D4T/3TC/NVP regimen while 23.01% of them
are on the AZT/3TC/NVP regimen. Others are D4T/3TC/EFV (7.13%), TDF+FTC / NVP (0.41%),
AZT/3TC/EFV (2.4%), LPV+r / TDF+FTC and TDF+FTC / EFV (0.8%), (0.41%), D4T/3TC/ABC, LPV+r /
sex
Number of Patients
Difference
(A - B)
% of total = A/T
or
B/T x 100
Pre - intervention
evaluation (A)
(% of total)
Post - intervention
evaluation (B)
(% of total)
Male 513 513 0 35
Female 960 960 0 65
Total (T) 1473 1473 0 100

International Journal of Development and Sustainability Vol.1 No.3 (2012): 1170-1186
ISDS www.isdsnet.com 1175
TDF+FTC / AZT and LPV+r / TDF+FTC/AZT+3TC (0.2%), ABC/3TC/NVP (0.34%), TDF/LPV+r / AZT+3TC
(0.14%) and LPV+r / EFV (0.07).
Table 4. Distribution of frequencies of side effects
S/N
Side Effects
Frequency Difference
(A - B) % Difference
(A-B)/A x 100 Pre-ntervention (% of total)
Post-intervention (% of total)
1 Weakness/fatigue 200(13%) 51(3.2%) 149 75
2 Nausea 29(2%) 9(0.6%) 20 69 3 Vomiting 68(4%) 12(0.8%) 56 82 4 Abdominal pain 62(4%) 21(1.3%) 41 66 5 Anorexia (loss Appetite) 50(3%) 5(0.3%) 45 90 6 Sudden weight Loss 20(1%) 3(0.2%) 17 85 7 Muscle weakness 10(0.6%) 1(0.1%) 9 90 8 Jaundice 5(0.3%) 0(0%) 5 100 9 Skin rashes 327(21%) 97(6.1%) 230 70 10 Lipodystrophy 21(1%) 6(0.4%) 15 71
11 Extremity wasting/thin legs and arms.
1(0.1%) 0(0%) 1 100
12 Facial thinning 3(0.2%) 1(0.1%) 2 67 13 Increased urination 10(0.6%) 5(0.3%) 5 50 14 Excessive thirst/hunger 36(2.3%) 6(0.4%) 30 83 15 Headaches 102(6.4%) 36(2.3%) 66 65 16 Peripheral neuropathy 118(7.5%) 41(2.6%) 77 65 17 Dry mouth 8(0.5%) 2(0.1%) 6 75 18 Dizziness 182(11.5%) 31(2.%) 151 83 19 Insomnia 39(2.5%) 19(1.2%) 20 51 20 Nightmares 15(0.9%) 2(0.1%) 13 87 21 Anaemia 6(0.4%) 2(0.1%) 4 67 22 Excessive weight gain 3(0.2%) 1(0.1%) 2 67 23 Cough 10(0.6%) 2(0.1%) 8 80 24 Boils 3(0.2%) 0(0%) 3 100 25 Cataract 2(0.1%) 0(0%) 2 100 26 Ovulation irregularities 3(0.2%) 0(0%) 3 100 27 Fever 49(3.1%) 18(1.1%) 31 63 28 Diarrhoea 4(0.3%) 1(0.1%) 3 75 29 Palpitation 6(0.4%) 0(0%) 6 100 30 Watery stool 2(0.1%) 0(0%) 2 100 31 Pruritus 70(4.4%) 39(2.5%) 31 44 32 Excessive sweating 4(0.3%) 0(0%) 4 100 33 Salivation 3(0.2%) 0(0%) 3 100 34 Tinnitus 6(0.4%) 2(0.1%) 4 67 35 Black spots on skin 4(0.3%) 2(0.1%) 2 50 36 Spots on palm 3(0.2%) 0(0%) 3 100 37 Excessive sleep 3(0.2%) 2(0.1%) 1 33 38 Visual disturbances 8(0.5%) 3(0.2%) 5 65

International Journal of Development and Sustainability Vol.1 No.3 (2012): 1170-1186
1176 ISDS www.isdsnet.com
39 Painful menstruation 4(0.3%) 1(0.1%) 3 75 40 Loss of menstruation 9(0.6%) 3(0.2%) 6 67 41 Internal heat 16(1%) 7(0.4%) 9 56 42 Constipation 4(0.3%) 0(0%) 4 100 43 Nail thickening 3(0.2%) 2(0.1%) 1 33 44 Breast size increase 2(0.1%) 1(0.1%) 1 50 45 Bloating of entire body 3(0.2%) 1(0.1%) 2 67 46 Swelling of hands & legs 4(0.3%) 1(0.1%) 3 75 47 Dry lips 3(0.2%) 1(0.1%) 2 67 48 Palm discoloration 2(0.1%) 1(0.1%) 1 50 49 Blistered lips 3(0.2%) 1(0.1) 2 67 50 Spots on tongue 2(0.1%) 1(0.1%) 1 50 51 Nail discolouration 3(0.2%) 1(0.1%) 2 67 52 Restlessness 4(0.3%) 0(0%) 4 100 53 Increased blood pressure 7(0.4%) 1(0.1%) 6 86 54 Indigestion 2(0.1%) 1(0.1%) 1 100 55 Tongue swelling 2(0.1%) 1(0.1%) 1 50 56 Rigour 2(0.1%) 1(0.1%) 1 50 57 Flatulence 6(0.4%) 2(0.1%) 4 67 58 Facial swelling 7(0.4%) 3(0.2%) 4 57
Total 1,583 450 1133 72%
Table 4 shows that about 58 different types of side effects were identified. The most prominent of these
side/adverse effects (and their pre and post - intervention incidence trequences) were skin rashes (21% &
6%), weakness/fatigue (13% & 3.2%), dizziness (11.5% & 2%), peripheral neuropathy (7.5% & 2.6%),
headache (6.4% & 2.3%) vomiting (4% & 0.8%), abdominal pain (4% % 1.3%), anorexia/loss of appetite (3%
& 0.3%), fever (3.1% % 1.1%), insomnia (2.5% & 1.2%), nausea (2% & 0.6%), Lipodystrophy (1% & 0.4%),
sudden weight loss (1% & 0.2%), excessive thirst/hunger (2.3% & 0.4%), and pruritus (4.4% & 2.5%).
Generally, there were 1,583 incidences of side effects prior to interventions. This reduced to 450 incidents
after the interventions representing a decrease of 72%.
Table 5. Summary of incidence of side effects
Variable
No. of patients Difference
(A – B) % Difference
(A–B)/A x 100 Pre-intervention (% of total)
Post- intervention (% of total)
No side - effects 705 (48%) 1156 (78%) 451 64
Experienced side effects
768 (52%) 317 (22%) 451 59
Total 1473 1473 0 0
Table 5 shows that there was a 64% increase in the number of patients not experiencing side effects and a
decrease of 59% in the number of patients experiencing side effects.
International Journal of Development and Sustainability Vol.1 No.3 (2012): 1170-1186
ISDS www.isdsnet.com 1177
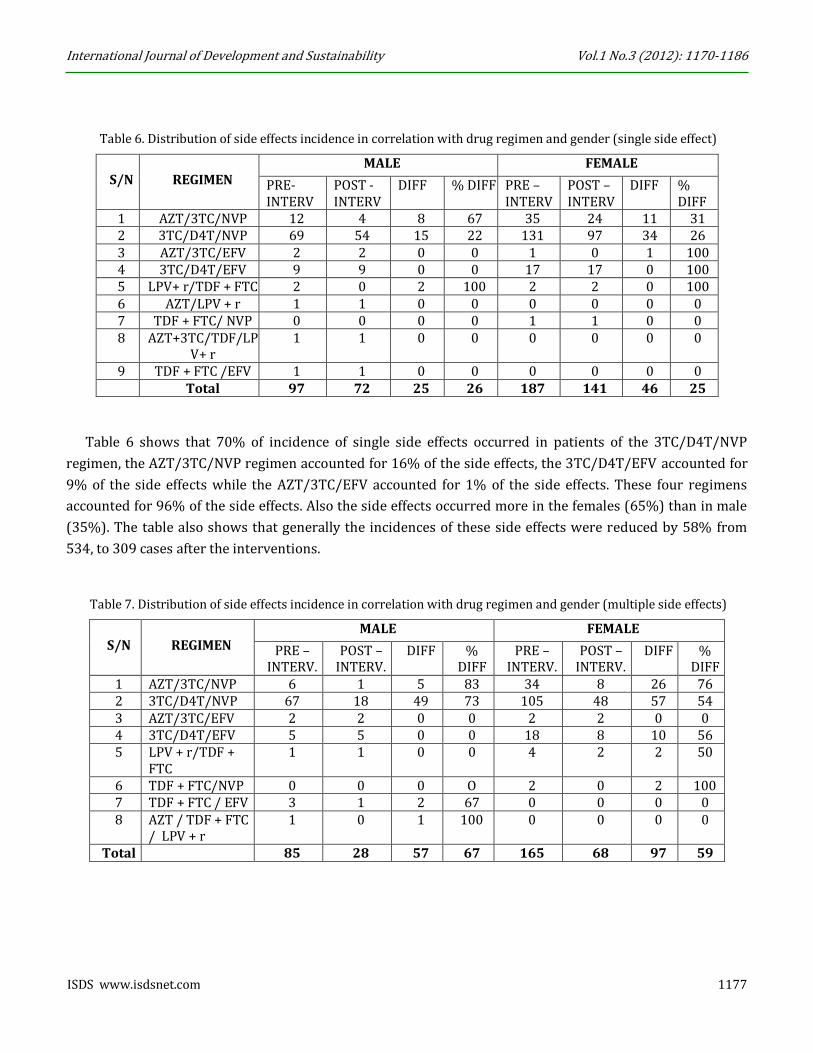
Table 6. Distribution of side effects incidence in correlation with drug regimen and gender (single side effect)
S/N
REGIMEN
MALE FEMALE
PRE-INTERV
POST - INTERV
DIFF % DIFF PRE – INTERV
POST – INTERV
DIFF % DIFF
1 AZT/3TC/NVP 12 4 8 67 35 24 11 31 2 3TC/D4T/NVP 69 54 15 22 131 97 34 26 3 AZT/3TC/EFV 2 2 0 0 1 0 1 100 4 3TC/D4T/EFV 9 9 0 0 17 17 0 100 5 LPV+ r/TDF + FTC 2 0 2 100 2 2 0 100 6 AZT/LPV + r 1 1 0 0 0 0 0 0 7 TDF + FTC/ NVP 0 0 0 0 1 1 0 0 8 AZT+3TC/TDF/LP
V+ r 1 1 0 0 0 0 0 0
9 TDF + FTC /EFV 1 1 0 0 0 0 0 0 Total 97 72 25 26 187 141 46 25
Table 6 shows that 70% of incidence of single side effects occurred in patients of the 3TC/D4T/NVP
regimen, the AZT/3TC/NVP regimen accounted for 16% of the side effects, the 3TC/D4T/EFV accounted for
9% of the side effects while the AZT/3TC/EFV accounted for 1% of the side effects. These four regimens
accounted for 96% of the side effects. Also the side effects occurred more in the females (65%) than in male
(35%). The table also shows that generally the incidences of these side effects were reduced by 58% from
534, to 309 cases after the interventions.
Table 7. Distribution of side effects incidence in correlation with drug regimen and gender (multiple side effects)
S/N
REGIMEN
MALE FEMALE
PRE – INTERV.
POST – INTERV.
DIFF % DIFF
PRE – INTERV.
POST – INTERV.
DIFF % DIFF
1 AZT/3TC/NVP 6 1 5 83 34 8 26 76 2 3TC/D4T/NVP 67 18 49 73 105 48 57 54 3 AZT/3TC/EFV 2 2 0 0 2 2 0 0 4 3TC/D4T/EFV 5 5 0 0 18 8 10 56 5 LPV + r/TDF +
FTC 1 1 0 0 4 2 2 50
6 TDF + FTC/NVP 0 0 0 O 2 0 2 100 7 TDF + FTC / EFV 3 1 2 67 0 0 0 0 8 AZT / TDF + FTC
/ LPV + r 1 0 1 100 0 0 0 0
Total 85 28 57 67 165 68 97 59

International Journal of Development and Sustainability Vol.1 No.3 (2012): 1170-1186
1178 ISDS www.isdsnet.com
Table 7 above shows the distribution of the incidence of multiple side effects in correlation with drug
regimen and gender. The trend here is the same as the trend in the distribution for single side affects as
shown in table 6 above.
Table 8. Combination of Tables 6 & 7 (single plus multiple side effects)
S/N
REGIMEN
MALE FEMALE
PRE – INTERV.
POST – INTERV.
DIFF % DIFF
PRE – INTERV.
POST – INTERV.
DIFF % DIFF
1 AZT/3TC/NVP 18 5 13 72 69 42 27 39 2 3TC/D4T/NVP 136 72 64 47 236 145 91 39 3 AZT/3TC/EFV 4 4 0 0 3 2 1 33 4 3TC/D4T/EFV 14 14 0 0 35 25 10 29 5 LPV + r/TDF + FTC 3 1 2 67 6 4 2 33 6 AZT/ LPV + r/ TDF
+ FTC 2 1 1 50 0 0 0 0
7 TDF + FTC/NVP 0 0 0 0 1 1 0 0 8 AZT+3TC/TDF/LPV
+ r 1 1 0 0 0 0 0 0
9 TDF + FTC /EFV 4 2 2 50 0 0 0 0 Total 182 100 82 45 352 209 143 41
Table 8 is combination of table 6 and 7 above to give an overall picture of the correlation of side/adverse
effects with drug regimen and gender.
Table 9. Distribution of side effect incidence in correlation with drug regimen and age (single side effect)
S/N
REGIMEN
CHILDREN ADULT
PRE – INTERV.
POST – INTERV.
DIFF % DIFF PRE –INTERV.
POST – INTERV.
DIFF % DIFF
1 AZT/3TC/NVP 5 4 1 20 42 24 18 43 2 3TC/D4T/NVP 11 6 5 45 186 145 41 22 3 AZT/3TC/EFV 0 0 0 0 2 2 0 0 4 3TC/D4T/EFV 0 0 0 0 28 26 2 7 5 LPV + r/ TDF + FTC 0 0 0 0 2 2 0 0 6 AZT/LPV + r/ TDF +
FTC 0 0 0 0 1 1 0 0
7 TDF + FTC/NVP 0 0 0 0 1 1 0 0 8 AZT+3TC/TDF/LPV+
r 0 0 0 0 1 1 0 0
9 TDF + FTC /EFV 0 0 0 0 1 1 0 0 Total 16 10 61 38 264 203 61 23

International Journal of Development and Sustainability Vol.1 No.3 (2012): 1170-1186
ISDS www.isdsnet.com 1179
Table 9 shows the distribution of the incidence of single side effects correlated with drug regimen and age.
The trend is the same as the trend tables 6 and 7above in terms of incidence per regimen. However most of
the side effects occurred in adults (95%) while the paediatric cases accounted for only 5% of the side effects.
Table 10. Distribution of side effect incidence in correlation with drug regimen and age (multiple side effects)
S/N
REGIMEN
CHILDREN ADULT
PRE – INTERV.
POST –INTERV.
DIFF % DIFF PRE – INTERV.
POST – INTERV.
DIFF % DIFF
1 AZT/3TC/NVP 4 2 2 50 36 7 29 81 2 3TC/D4T/NVP 8 1 7 88 169 66 8 61 3 AZT/3TC/EFV 0 0 0 0 3 3 0 0 4 3TC/D4T/EFV 0 0 0 0 23 13 10 43 5 LPV + r/TDF +
FTC 0 0 0 0 5 3 2 40
6 AZT / LPV + r / TDF + FTC
0 0 0 0 2 0 2 100
7 TDF + FTC / NVP 0 0 0 0 3 1 2 67 8 TDF + FTC / EFV 0 0 0 0 1 0 1 100
Total 12 3 9 75 242 93 149 62
Table 10 shows the distribution of the incidence of multiple side effects as correlated with drug regimen
and age. The trend is the same as the trend in the distribution for single side effects in table 9 above.
Table 11. Combination of tables 9 & 10 (single plus multiple side effects)
S/N
REGIMEN
MALE FEMALE
PRE - INTER
POST - INTER
DIFF % DIFF PRE – INTER
POST - INTER
DIFF % DIFF
1 AZT/3TC/NVP 9 6 3 33 78 31 47 60 2 3TC/D4T/NVP 19 7 12 63 355 211 144 41 3 AZT/3TC/EFV 0 0 0 0 5 5 0 0 4 3TC/D4T/EFV 0 0 0 0 51 39 12 24 5 LPV + r/TDF + FTC 0 0 0 0 7 5 2 29 6 AZT/LPV+r/TDF+ FTC 0 0 0 0 1 1 0 0 7 TDF + FTC/NVP 0 0 0 0 3 1 2 67 8 AZT + 3TC/TDF/LPV +
r 0 0 0 0 1 1 0 0
9 TDF + FTC /EFV 0 0 0 0 4 2 2 50 Total 28 13 15 54 506 296 210 42
Table 11 is combination of table 9 and 10 above to give an overall picture of the correlation of
side/adverse effects occurrence with drug regimen and age.
International Journal of Development and Sustainability Vol.1 No.3 (2012): 1170-1186
1180 ISDS www.isdsnet.com
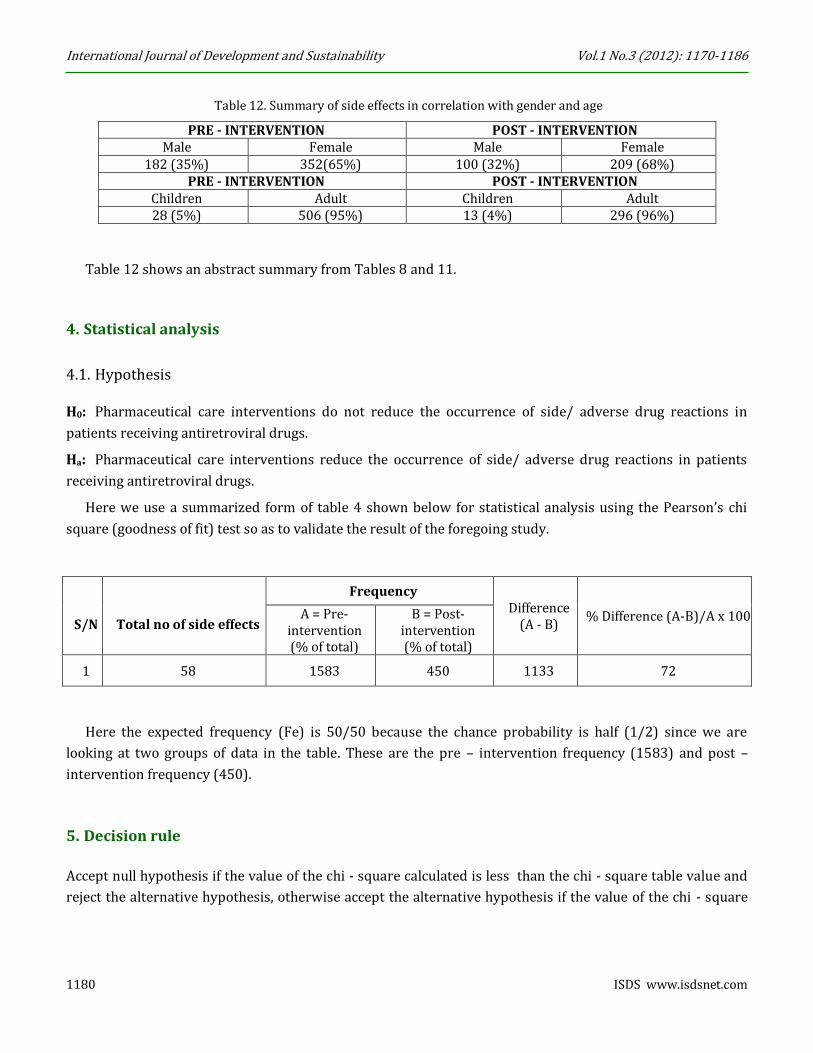
Table 12. Summary of side effects in correlation with gender and age
PRE - INTERVENTION POST - INTERVENTION Male Female Male Female
182 (35%) 352(65%) 100 (32%) 209 (68%) PRE - INTERVENTION POST - INTERVENTION
Children Adult Children Adult 28 (5%) 506 (95%) 13 (4%) 296 (96%)
Table 12 shows an abstract summary from Tables 8 and 11.
4. Statistical analysis
4.1. Hypothesis
H0: Pharmaceutical care interventions do not reduce the occurrence of side/ adverse drug reactions in
patients receiving antiretroviral drugs.
Ha: Pharmaceutical care interventions reduce the occurrence of side/ adverse drug reactions in patients
receiving antiretroviral drugs.
Here we use a summarized form of table 4 shown below for statistical analysis using the Pearson’s chi
square (goodness of fit) test so as to validate the result of the foregoing study.
S/N
Total no of side effects
Frequency Difference
(A - B) % Difference (A-B)/A x 100 A = Pre-
intervention (% of total)
B = Post-intervention (% of total)
1 58 1583 450 1133 72
Here the expected frequency (Fe) is 50/50 because the chance probability is half (1/2) since we are
looking at two groups of data in the table. These are the pre – intervention frequency (1583) and post –
intervention frequency (450).
5. Decision rule
Accept null hypothesis if the value of the chi - square calculated is less than the chi - square table value and
reject the alternative hypothesis, otherwise accept the alternative hypothesis if the value of the chi - square

International Journal of Development and Sustainability Vol.1 No.3 (2012): 1170-1186
ISDS www.isdsnet.com 1181
calculated is greater than the chi - square table value and reject the null hypothesis. Mathematically, the
above decision rule is stated as follows:
Accept Ho if X2 (Cal) < X2 (tab).
Accept Ha if X2 (Cal) > X2 (tab).
As such,
where Fo = Observe frequency
Fe = Expected frequency
Thus,
Now, degree of freedom (Df) = (R – 1) (C – 1)
= (2 – 1) (2 – 1)
= (1) (1)
= 1
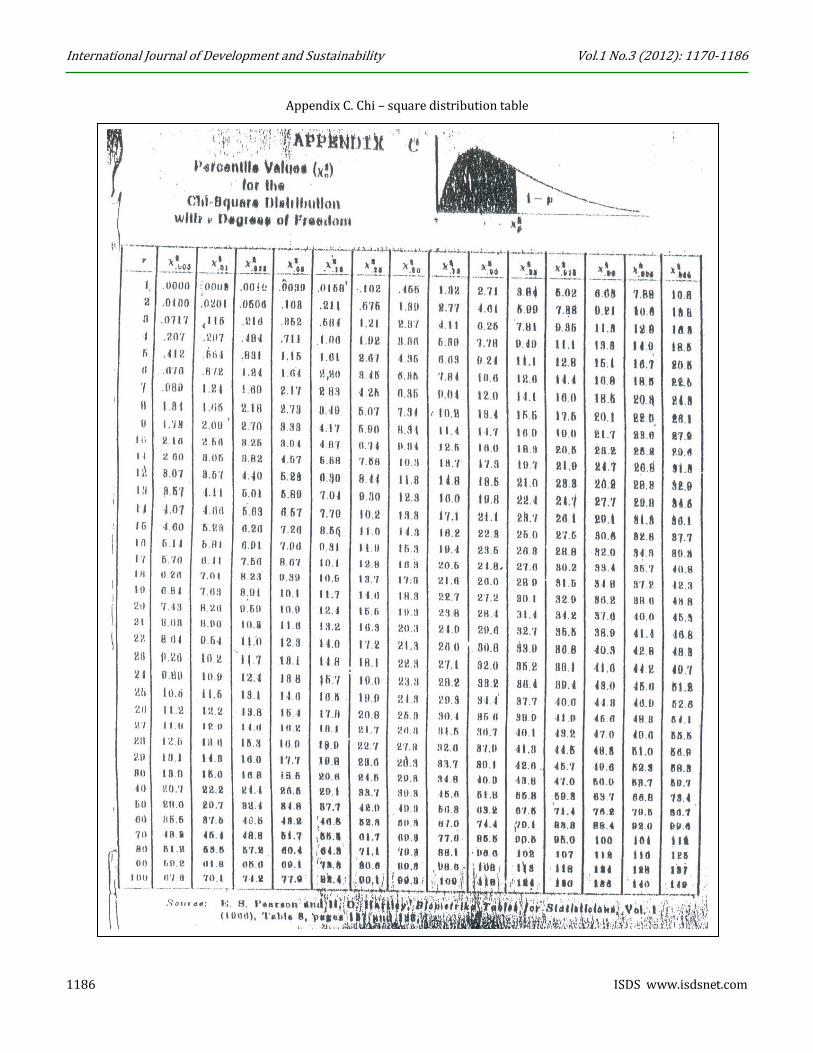
Then from Chi-square table,
Df 1 at 95% confidence level = 3.84
Thus, we now have
X2 cal = 50,201.78 and
X2 tab = 3.84
Therefore based on our chi - square decision rule above, we reject Ho and accept Ha since X2 cal > X2 tab
and conclude that Pharmaceutical care interventions reduce the occurrence of side/adverse drug reactions in
patients receiving antiretroviral drugs.

International Journal of Development and Sustainability Vol.1 No.3 (2012): 1170-1186
1182 ISDS www.isdsnet.com
6. Discussion
A very important discovery of the study is that 52% of the patients experienced and complained of one side
effect or the other. This number was reduced to 22% after the intervention activities. About sixty (60)
different types of side effects were identified during the study as shown in table 4 above. Earlier reports
portrayed the general incidence of side effects as being below 5%. This has now been shown to be different
for patients on chronic anti - infective therapy like antiretroviral drug therapy. Worthy of note also is the fact
that the pharmacist intervention activities impacted greatly on the incidence of these side effects reducing
the number experiencing them by 30%.
A correlation of the incidence of side effects with the corresponding drug regimen and sex (gender)
showed that most of the side effects (70%) occurred in patients on the 3TC/D4T/NVP regimen followed by
the AZT/3TC/NVP regimen (16%), D4T/3TC/EFV regimen (9%) and AZT/3TC/EFV regimen (1%). This
trend was the same in both the patients experiencing single side effect and those experiencing multiple side
effects. These four (4) regimens accounted for 96% of the side effects. Also the side effects occurred most in
the female (65%) than in the males (35%). The interventions impacted positively on the incidence of these
side effects as the number of patients experiencing them reduced by 58% to 309 from 534.
Another correlation of the incidence of side effects with drug regimen and age corroborated the above
incidence pattern with the regimen. The 3TC/D4T/NVP regimen had the highest incidence of 70% followed
by the AZT/3TC/NVP regimen (16%), D4T/3TC/EFV (9%) and AZT/3TC/EFV (1%). Also the side effects
occurred more in adults (95%) with only 5% of the incidence occurring in children. The low incidence of side
effects in the children may be attributed to the fact that many of them could have been too tender to know
and detect the occurrence of these in them.
Also the high incidence of these side effects in women can be attributed to their physiological
configuration as they usually have more fatty/adipose tissue into which most of these drugs are distributed.
They are also less tolerant to pain and discomfort and so may complain of these discomforting side effects
more than the stronger and more resilient men. The high incidence with the 3TC/D4T/NVP regimen may be
attributed to the stavudine component which is now being withdrawn from the Nigerian market and being
replaced with zidovudine where appropriate. Also implicated is nevirapine which is known to cause skin
rashes in many patients and thus is being considered for withdrawal and replacement with efavirenz. This
consideration is being weighed carefully as Efavirenz has its problem of CNS problems including nightmares,
hallucinations, insomnia and suicidal ideation. These improvements were significant at p>0.5 as shown in the
statistical analysis above.
7. Conclusion
Based on the results of the study, we conclude that pharmacists’ interventions in antiretroviral drug therapy
through Pharmaceutical care can significantly reduce the incidence of side/adverse drug effects in HIV/AIDS
patients receiving antiretroviral drugs.

International Journal of Development and Sustainability Vol.1 No.3 (2012): 1170-1186
ISDS www.isdsnet.com 1183
8. Recommendations
Based on the results of the study above, the following policy measures are proffered.
1. Efforts should be made to increase the enrollment and care of children as the number of them
enrolled is far below the number affected by the disease.
2. Efforts should also be made to encourage male enrollment since the number enrolled is far below
that of females indicating a possible shortfall in their enrollment.
3. Patients should also be educated on the need to report side/adverse effect as well as other problems
they may encounter in the course of treatment.
4. To be able to achieve the laudable goals of healthcare, adequate manpower should be made available.
As such government should make effort to train and employ more healthcare workers especially
pharmacists whose numbers in hospitals are too small compared to the number of patients that need
their attention.
5. Finally, the role of the pharmacist in patient care can no longer be over emphasized. As such
government should make adequate efforts to develop and utilize the abundant skills and potentials of
pharmacist and pharmaceutical care.
Acknowledgement
We are very grateful to;
1. The intern pharmacists, Pharm Damian Obiora, Pharm Cynthia Ozurumba and Pharm John Uzoma
who assisted in the course of this study. We will not forget your help.
2. Federal medical centre Owerri, Imo state, Nigeria (my birth and work place) for the permission to
carry out this study and many other studies there and for always encouraging us the staff to carry out
research studies.
3. My numerous patients who endured many months of questioning, examinations and counseling. We
appreciate your patience and sacrifice. It was all for your good and better health.
References
ASHP - American Society of Health-System Pharmacists (1996), “ASHP guidelines on a standardized method
for pharmaceutical care”, American Journal of Health-System Pharmacists, Vol. 53, pp. 1713-1716.
Erah, P.O. and Nwazuoke, J.C. (2002), “Identification of standards for Pharmaceutical care in Benin city”,
Tropical Journal of Pharmaceutical research”, Vol. 1, No.2, pp. 55-56.
FIP - Federation of International Pharmacists’ (1998), “Pharmaceutical care”, in FIP Statement of Professional
Standards as adopted by the FIP council, Hague, Netherlands, 4th September.
Obodozie, O.O. (2006), “Pharmaceutical care in HIV/AIDS”, in Obiorah, B.A. (Ed), GHAIN’S manual for skills
certification workshop on HIV/AIDS, sexually transmitted diseases and opportunistic infections for Community
Pharmacists, Mindex, Benin Nigeria, pp. 222-281.

International Journal of Development and Sustainability Vol.1 No.3 (2012): 1170-1186
1184 ISDS www.isdsnet.com
Appendix A. Ethical approval for the study

International Journal of Development and Sustainability Vol.1 No.3 (2012): 1170-1186
ISDS www.isdsnet.com 1185
Appendix A. Data collection form
International Journal of Development and Sustainability Vol.1 No.3 (2012): 1170-1186
1186 ISDS www.isdsnet.com
Appendix C. Chi – square distribution table