Impact of New Global Models and Ensemble Prediction Systems on Consensus TC Track Forecasts
31
mpact of New Global Models and Ensemble Prediction Systems on Consensus TC Track Forecasts James S. Goerss NRL Monterey July 22, 2010
-
Upload
kuame-simon -
Category
Documents
-
view
22 -
download
0
description
Impact of New Global Models and Ensemble Prediction Systems on Consensus TC Track Forecasts James S. Goerss NRL Monterey July 22, 2010. Background. Evolution of TC Track Forecast Error (nm) at NHC and JTWC. NHC. JTWC. - PowerPoint PPT Presentation
Transcript of Impact of New Global Models and Ensemble Prediction Systems on Consensus TC Track Forecasts

Impact of New Global Models and Ensemble Prediction Systems on Consensus TC Track Forecasts
James S. GoerssNRL Monterey
July 22, 2010

Background

Evolution of TC Track Forecast Error (nm)at NHC and JTWC
NHC JTWC
NWP model improvements and the use of ensemble techniques have revolutionized TC track forecasting at NHC and JTWC. Today 5-day track forecast error is comparable to 3-day track forecast error in the 1990’s and 2-day track forecast error in the 1970’s.

Timeline for Operational Use ofGlobal Models for TC Track Prediction
1992 – NOGAPS and UK Met Office global model at JTWC
1996 – Japanese global spectral model at JTWC
1998 – NOGAPS and UK Met Office global model at NHC; first consensus guidance at JTWC
2000 – NCEP GFS and first consensus guidance at NHC
2001 – NCEP GFS at JTWC (JTWC begins official 5-day forecasts)
2003 – NHC begins official 5-day forecasts
2005 – ECMWF global model at NHC
2006 – ECMWF global model at JTWC

Western North Pacific – Global Models3-Year Weighted Mean 72-h Forecast Error (nm)
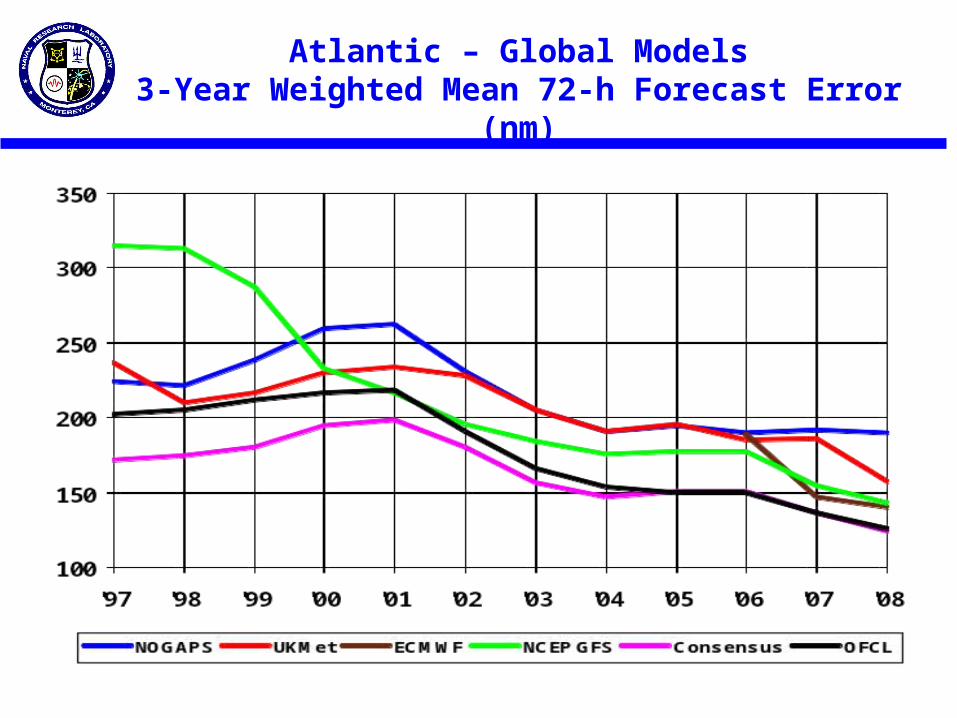
Atlantic – Global Models3-Year Weighted Mean 72-h Forecast Error (nm)
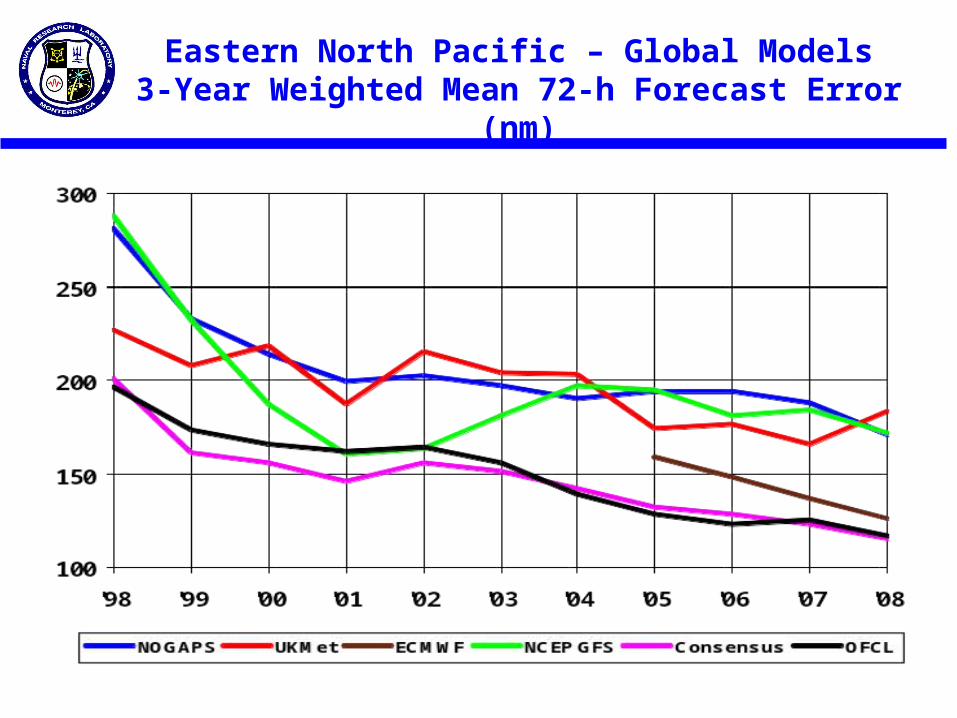
Eastern North Pacific – Global Models3-Year Weighted Mean 72-h Forecast Error (nm)

Background Summary
Routine operational use of global model TC track forecasts began in the early 1990’s at JTWC and in the late 1990’s at NHC.
The number of global models available has increased from 2 in the early 1990’s to the 4-5 that are available today, depending on the forecast center.
Typical global model 72-h TC track forecast error has decreased from 300-400 nm in the early 1990’s to 150-200 nm today while typical 120-h error has decreased from 400-500 nm in the early 2000’s to 250-350 nm today.
The increased number of models available coupled with model improvement has resulted in the reduction of consensus 72-h TC track forecast error from ~300 nm in the early 1990’s to ~150 nm today and the reduction of 120-h error from over 300 nm in the early 2000’s to just over 200 nm today.

NHC Track Forecast Guidance
Interpolated Model Guidance
AVNI – Global Forecast System (GFS) run at NCEP
GFDI – GFDL model run at NCEP
HWFI – Hurricane WRF run at NCEP
NGPI – Navy global model (NOGAPS) run at FNMOC
GFNI – GFDL model run at FNMOC
EGRI – UK Met Office global model
EMXI – ECMWF global model
TVCN – Consensus of above models (at least two)
CMCI – Canadian global model

Hurricane Alex
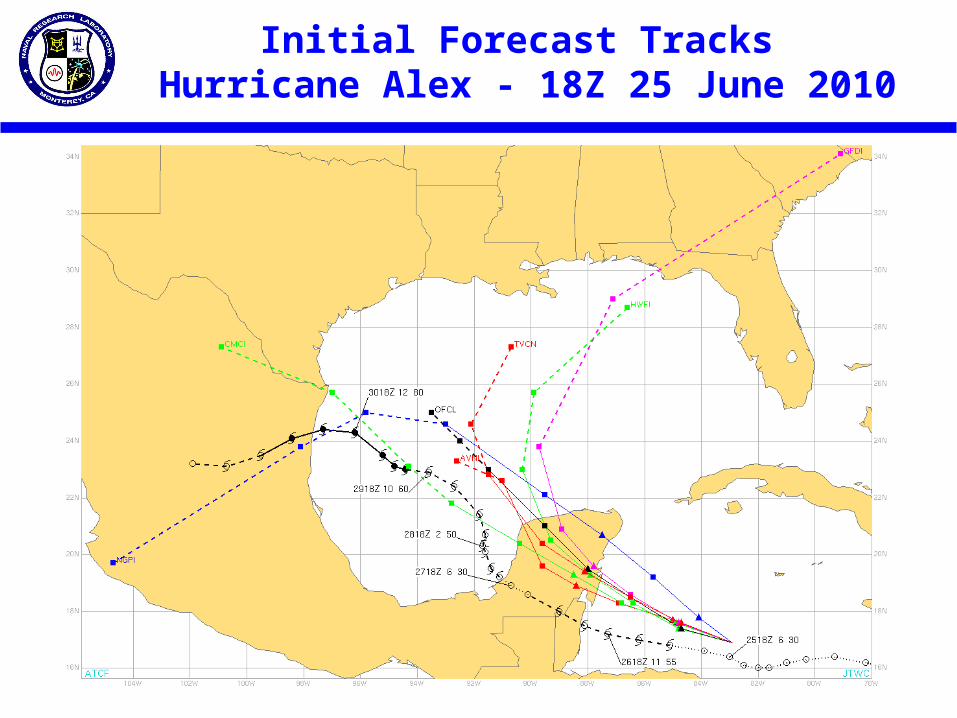
Initial Forecast Tracks Hurricane Alex - 18Z 25 June 2010

Forecast Tracks (24 h Later)Hurricane Alex - 18Z 26 June 2010
0
50
100
150
200
250
300
350
400
450
24 48 72 96 120
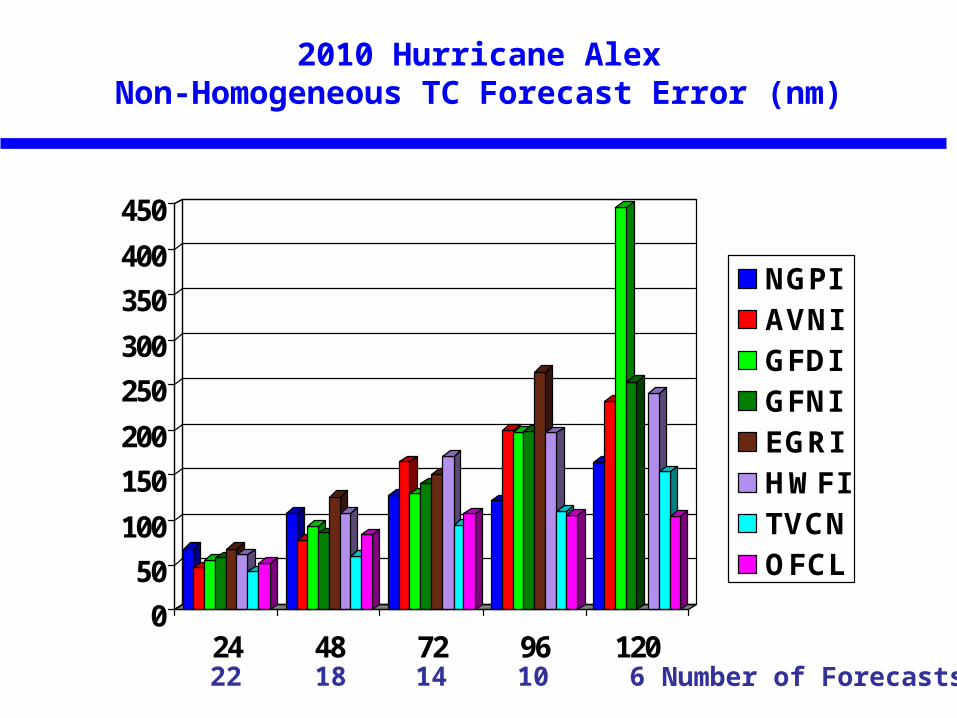
NGPIAVNIGFDIGFNIEGRIHWFITVCNOFCL
2010 Hurricane AlexNon-Homogeneous TC Forecast Error (nm)
22 18 14 Number of Forecasts10 6

2009 Season

050
100150200250300350400450500
24 48 72 96 120
NGPIAVNIGFDIGFNIHWFIEGRIEMXI CMCITVCNOFCL
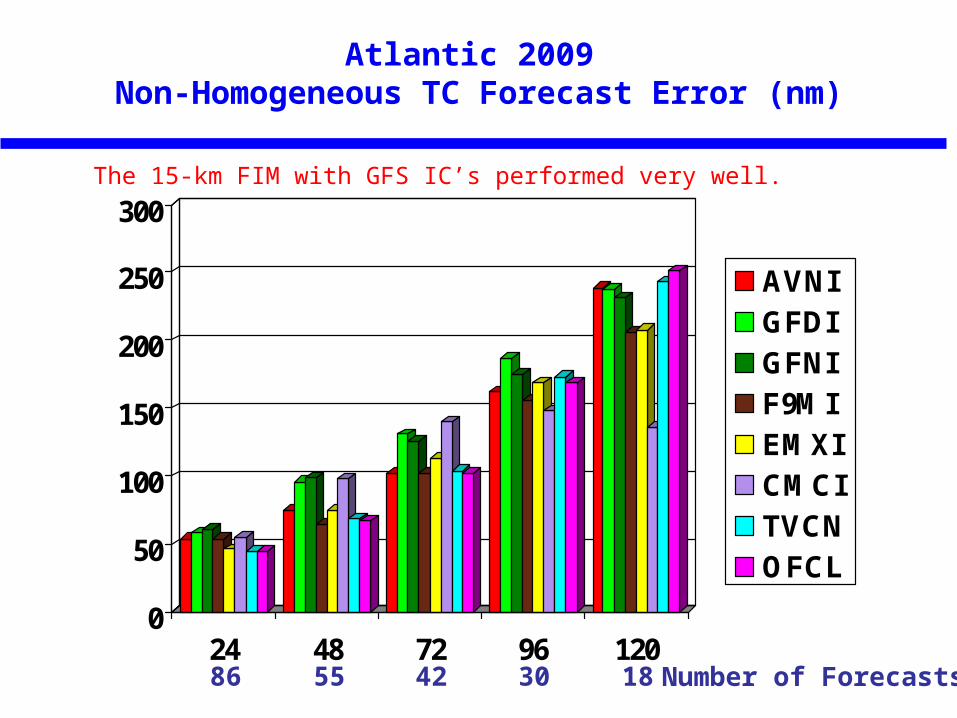
Atlantic 2009 Non-Homogeneous TC Forecast Error (nm)
86 55 42 Number of Forecasts30 18
The Canadian Global Model performed very well.
HFIP Demonstration
As part of the Hurricane Forecast Improvement Project Demonstration, a number of forecasts were made using different configurations of the NOAA/ESRL FIM (a global model using a flow-following vertical coordinate, finite-volume numerics, and an icosahedral global grid). Interpolated guidance was created from these model forecasts.
Interpolated Model Guidance
F8MI – FIM (30 km resolution, GFS initial conditions)
F8EI – FIM (30 km resolution, EnKF initial conditions)
F9MI – FIM (15 km resolution, GFS initial conditions)
F9EI – FIM (15 km resolution, EnKF initial conditions)
F0EI – FIM (10 km resolution, EnKF initial conditions)

0
50
100
150
200
250
300
24 48 72 96 120
F8EIF9EIF9MITVCNOFCL
Atlantic 2009 Homogeneous TC Forecast Error (nm)
56 41 34 Number of Forecasts24 16
0
50
100
150
200
250
300
24 48 72 96 120
AVNIGFDIGFNIF9MIEMXI CMCITVCNOFCL
Atlantic 2009 Non-Homogeneous TC Forecast Error (nm)
86 55 42 Number of Forecasts30 18
The 15-km FIM with GFS IC’s performed very well.
0
50
100
150
200
250
300
24 48 72 96 120
CON8TVCNOFCL
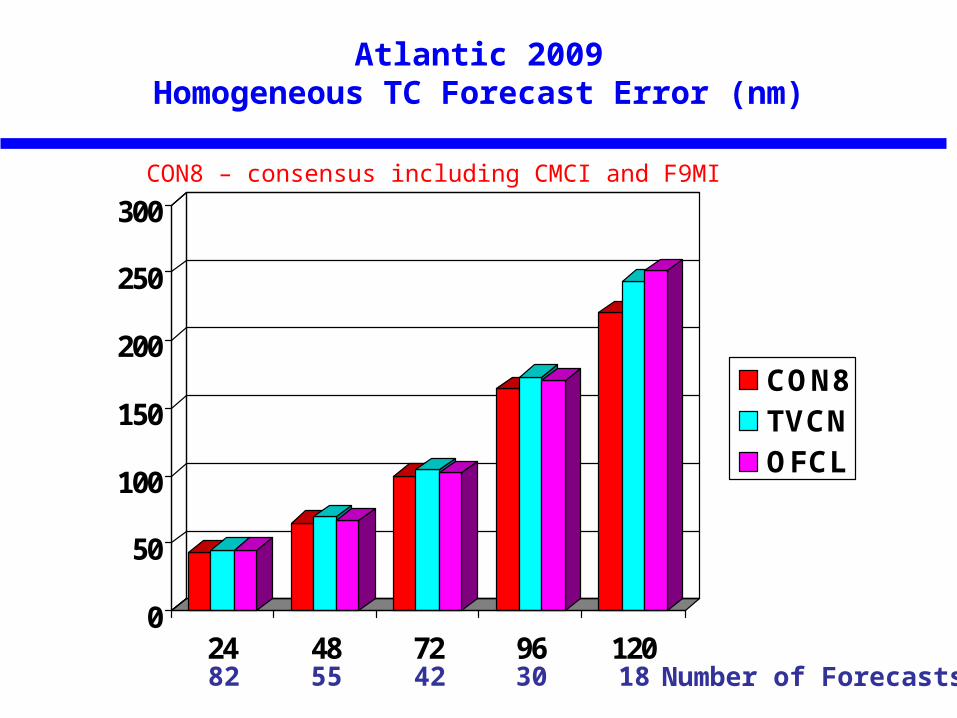
Atlantic 2009Homogeneous TC Forecast Error (nm)
82 55 42 Number of Forecasts30 18
CON8 – consensus including CMCI and F9MI
050
100150200250300350400450500550
24 48 72 96 120
NGPIAVNIGFDIGFNIHWFIEGRIEMXI CMCITVCNOFCL
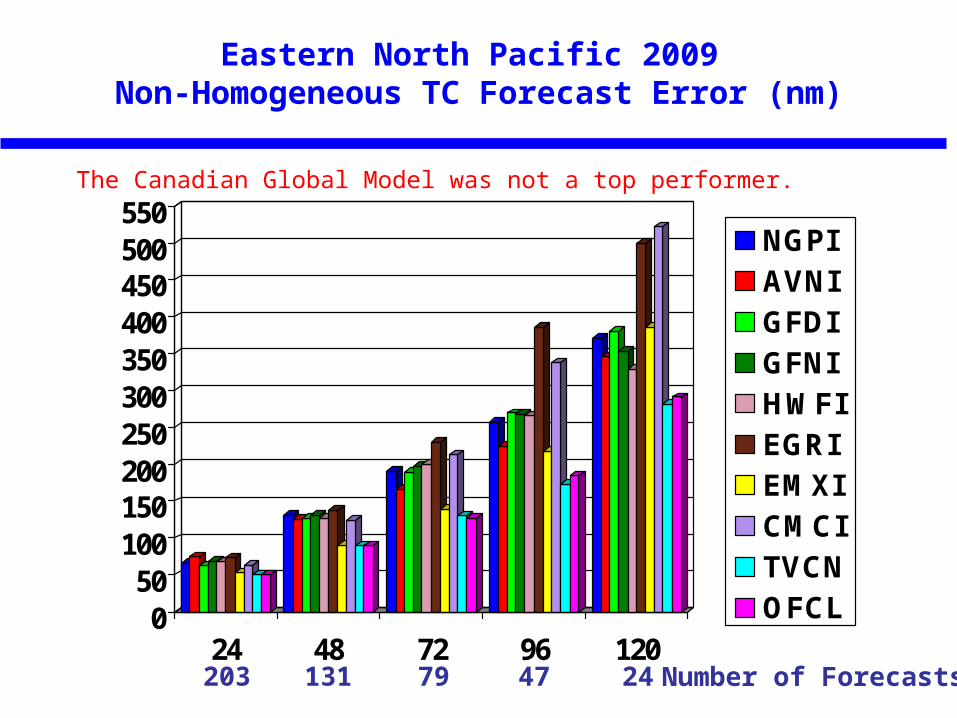
Eastern North Pacific 2009 Non-Homogeneous TC Forecast Error (nm)
203 131 79 Number of Forecasts47 24
The Canadian Global Model was not a top performer.
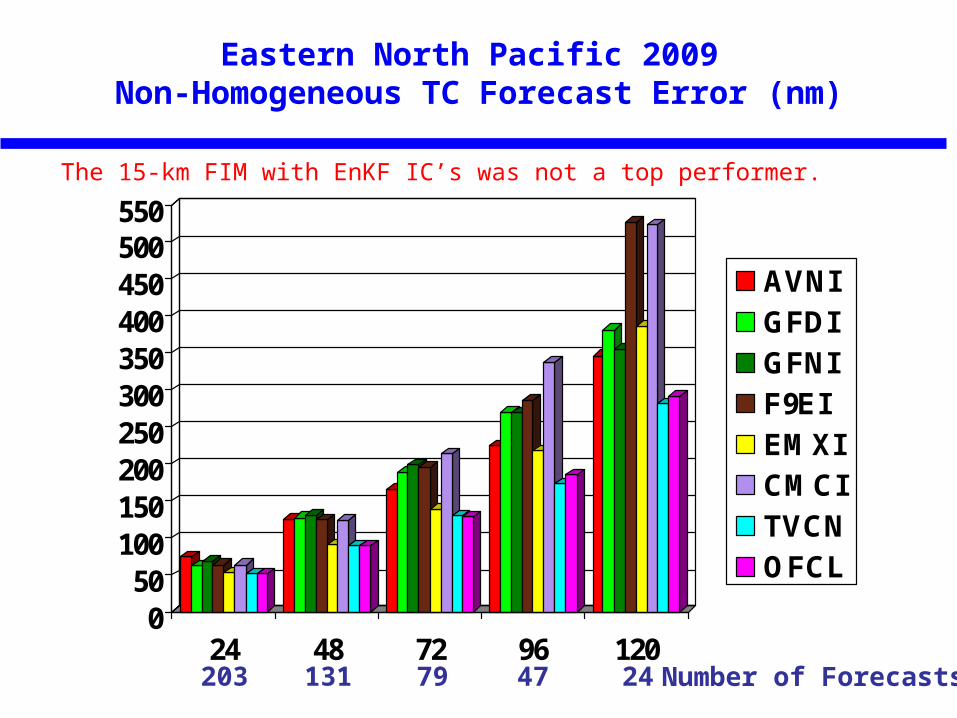
050
100150200250300350400450500550
24 48 72 96 120
AVNIGFDIGFNIF9EIEMXI CMCITVCNOFCL
Eastern North Pacific 2009 Non-Homogeneous TC Forecast Error (nm)
203 131 79 Number of Forecasts47 24
The 15-km FIM with EnKF IC’s was not a top performer.

0
50
100
150
200
250
300
350
400
24 48 72 96 120
NGPIAVNIJGSIGFNIEGRIEMCIF8MICONWJTWC
Western North Pacific 2009 Non-Homogeneous TC Forecast Error (nm)
502 404 311 Number of Forecasts236 179
The 30-km FIM with GFS IC’s performed well.
0
50
100
150
200
250
300
350
400
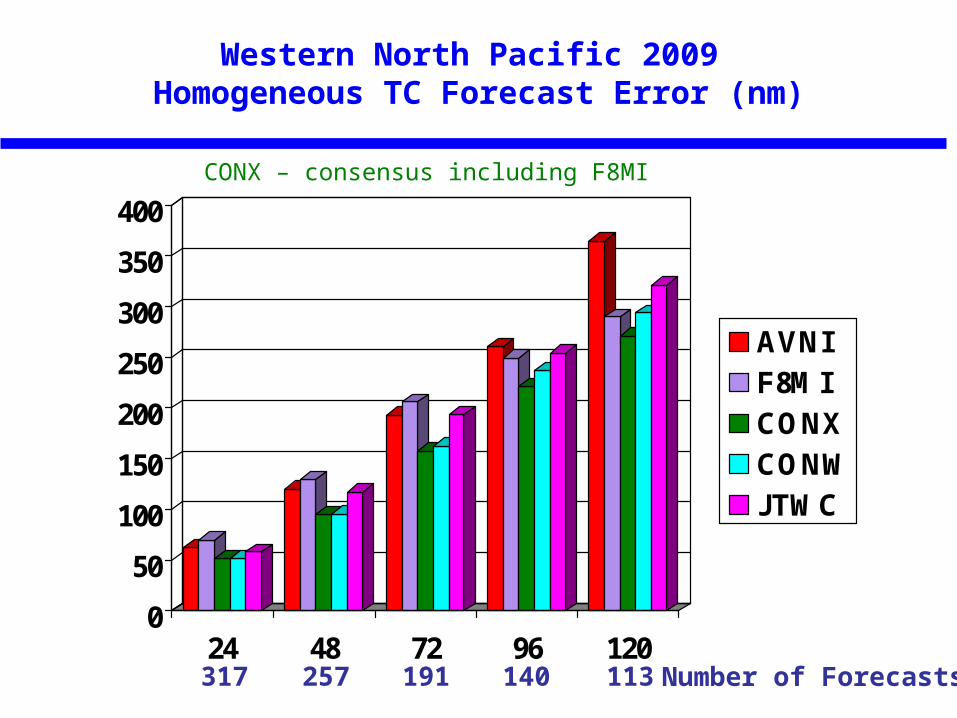
24 48 72 96 120
AVNIF8MICONXCONWJTWC
Western North Pacific 2009 Homogeneous TC Forecast Error (nm)
317 257 191 Number of Forecasts140 113
CONX – consensus including F8MI
HFIP Demonstration
As part of the Hurricane Forecast Improvement Project Demonstration, a 20-member ensemble was run using the 30-km FIM (EnKF IC’s) for a limited number of cases. Interpolated guidance was created from the ensemble mean of the member forecasts.
Interpolated Model Guidance
F8NI – Ensemble mean for 20-member FIM (30 km resolution, EnKF initial conditions) ensemble
0
50
100
150
200
250
300
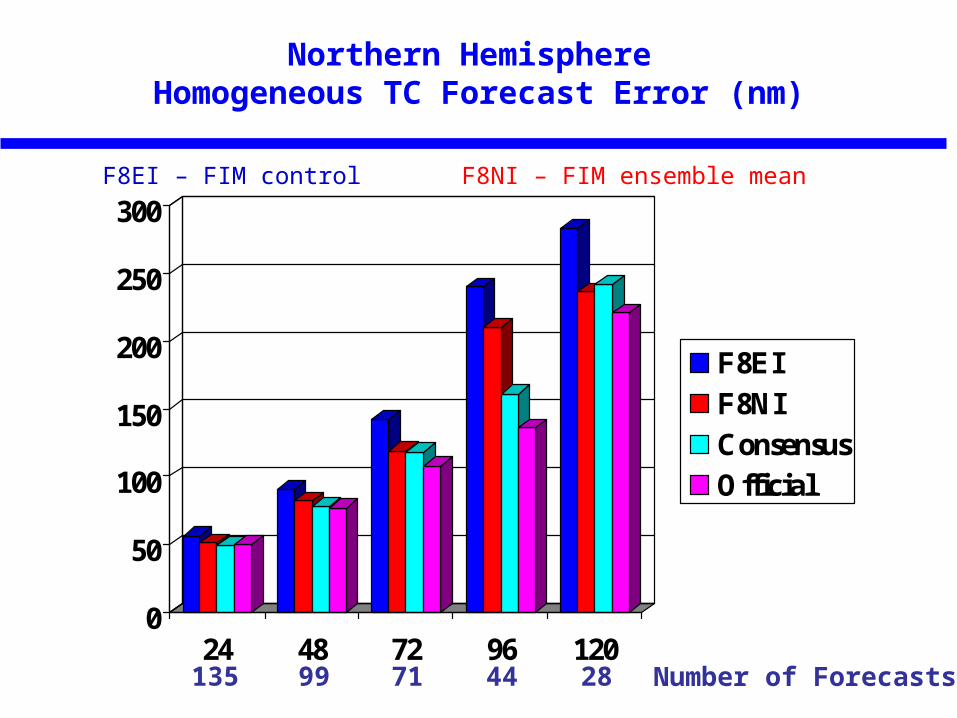
24 48 72 96 120
F8EIF8NIConsensusOfficial
Northern Hemisphere Homogeneous TC Forecast Error (nm)
135 99 71 Number of Forecasts44 28
F8EI – FIM control F8NI – FIM ensemble mean
Summary
• Prior to the start of the 2009 Atlantic season, upgrades were made to the Canadian global model (CMCI) resulting in
greatly improved TC track forecasts.
• As part of the HFIP Demonstration a number of configurations of the FIM were run for the 2009 Atlantic season. It was found that the 15-km FIM using GFS initial conditions (F9MI) had the best TC track forecast performance.
• A new consensus aid was formed by adding CMCI and F9MI to the TVCN models. For the Atlantic, the TC track forecast improvement for this new aid ranged from about 5 percent at 24 h to almost 10 percent at 120 h.

Summary
• Neither the Canadian global model nor the FIM were among the top performers for the eastern North Pacific. Their
addition to consensus did not result in significant impact.
• The 30-km FIM using GFS initial conditions (F8MI) was run regularly for the western North Pacific and performed quite well. Its addition to the CONW consensus resulted in 5-10 percent track forecast improvement at 96 h and 120 h.
• The track forecast improvement for the ensemble mean of the 30-km FIM using EnKF initial conditions EPS ranged
from 10 percent at 24 h to over 15 percent at 120 h with respect to the control run. For a very limited sample,
these ensemble mean forecasts were competitive with those from the multi-model consensus (TVCN/CONW).

Questions?
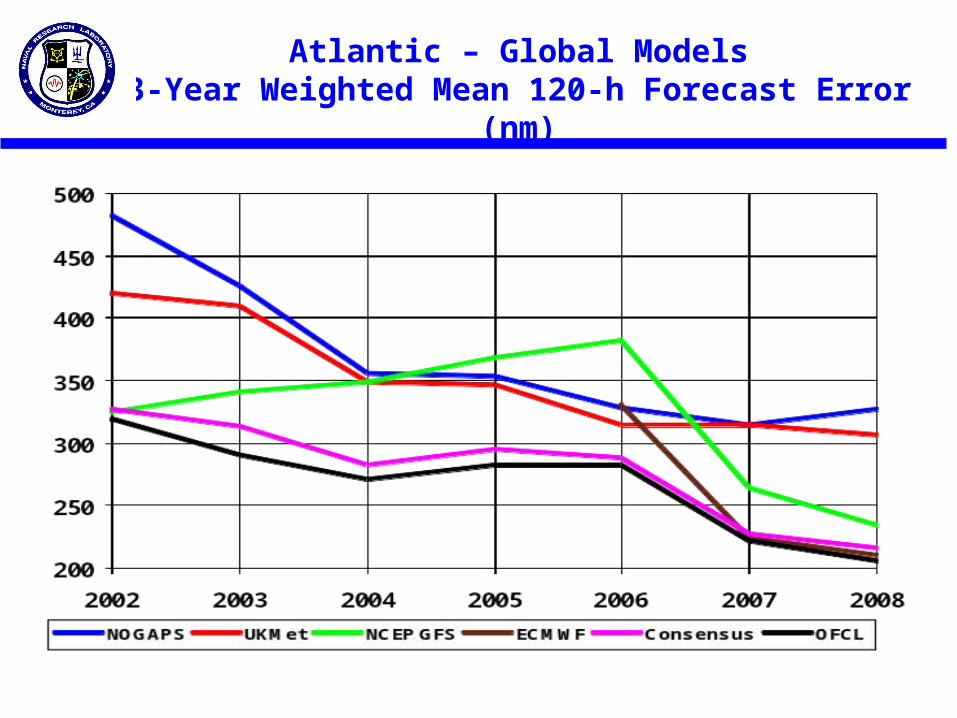
Atlantic – Global Models3-Year Weighted Mean 120-h Forecast Error (nm)

0
50
100
150
200
250
300
24 48 72 96 120
F8EIF8MIF9EIF9MIConsensusOfficial
Northern Hemisphere Homogeneous TC Forecast Error (nm)
136 88 65 Number of Forecasts47 29

0
50
100
150
200
250
300
24 48 72 96 120
F8EIF8MIF9EIF9MITVCNOFCL
Atlantic 2009 Homogeneous TC Forecast Error (nm)
31 25 22 Number of Forecasts18 11