DYNAMIC INTERACTIONS AMONG THE STOCK MARKET, MONETARY POLICY ...
International Journal of Development and Economic Sustainability
Vol.6, No.4, pp. 29-50, September 2018
___Published by European Centre for Research Training and Development UK (www.eajournals.org)
29 ISSN: 2053-2199 (Print), ISSN: 2053-2202(Online)
IMPACT OF MONETARY POLICY ON STOCK MARKET DEVELOPMENT:
IMPLICATIONS FOR THE NIGERIAN ECONOMY
Dr. Nwokoye Ebele S1. and Otu Emmanuel2
1Department of Economics, Nnamdi Azikiwe University, Awka, Anambra State, Nigeria 2Department of Economics and Development Studies, Federal University Otuoke, Bayelsa
State, Nigeria
ABSTRACT: The unsustainable and decreasing contribution of the Nigeria stock market to
economic growth and development is the rationale for this study. Previous studies were unable
to fully address the core developmental problems of the stock market in terms of its contribution
to economic growth. These studies focused on how the monetary authorities can stabilize the
stock market and reduce its volatility but ignored issues bordering on the contribution of the
stock market to economic growth, which of course is the essence of any stock market and as
such characterize its development. Consequently, the objective of this study is to investigate
the impact of monetary policy on the development of the stock market in Nigeria. The study
period covered from 1981 to 2015. Cointegration and vector error correction modelling
(VECM) were employed for the analysis. The cointegration test indicates that there exist long
run equilibrium relationship among the variables of the model. VECM result indicated that
monetary policy, through the growth rate of money supply has impacted positively and
significantly on the development of the stock market in Nigeria. Also, findings further indicated
that prime lending rate has had a negative impact on the development of the stock market in
Nigeria. The study recommended among others, that the Central Bank of Nigeria (CBN) should
use its growth rate of money supply to further boost the development of the stock market but
must however be mindful of the channeling of the increase in money supply in order to curtail
the possible negative impact of inflation.
KEYWORDS: Deposit Money Banks, Economic Growth Monetary Policy, Stock Market
Development
INTRODUCTION
A stock market is an institutional arrangement that facilitates the sale of stocks, which are
equity investments (also referred to as capital). Because of its indispensable role in capital
mobilization and allocation towards the enhancement of economic growth, the stock market is
often referred to as the engine of economic growth. Consequently, the growing importance of
stock market around the world has reinforced the belief that finance is an important ingredient
of economic growth and development (Nowbutsing and Odit, 2009). Development of the stock
market by fostering financial development and financial integration, will promote economic
growth through improving the efficiency of capital allocation and allowing for better risk
sharing (Laeven, 2014). A developed stock market provides a lower cost of equity capital for
firms and allow individuals to effectively price and hedge risk (Aduda, Masila, & Onsongo,
2012). As pointed out by Mishkin (2007), a functional financial market is a key factor in
promoting sustainable economic growth, while poorly performing financial markets is one
reason why many countries in the world remain desperately poor
As a result of the relationship between stock market development and the economy, it is very
vital that the stock market performs efficiently and effectively because poor performance
International Journal of Development and Economic Sustainability
Vol.6, No.4, pp. 29-50, September 2018
___Published by European Centre for Research Training and Development UK (www.eajournals.org)
30 ISSN: 2053-2199 (Print), ISSN: 2053-2202(Online)
disrupts economic activities; the downturn in the level of economic activities during the global
financial crisis of 2008 is a clear indication of this. This is because the stock market is not just
a primary source of income and retirement savings to many, but also an engine of growth
through its indispensable role in capital accumulation. Development of the stock market can
have a major impact on the whole economy as it influences real activities such as savings,
consumption, investment, level of employment, export, etc. Moreover, the development of the
stock market is seen as critical for government to finance large fiscal deficits without having
to suffer financial repression or resort to foreign borrowing with exchange rate risk. A
developed stock market also facilitates the sterilization of large capital inflows (Turner, 2002).
The promotion and maintenance of monetary stability, a sound and efficient financial system
in Nigeria is the core function of the Central Bank of Nigeria (CBN). The stock market is a
component of the financial system and by implication, this study is basically intended to
empirically investigate and determine the extent to which the monetary authority in Nigeria
(CBN) has been able to achieve one of its statutory mandates; the development of the stock
market as entrenched in the act that established the bank. Monetary policy of any economy
refers to measures used by the monetary authority to control money supply and credit
conditions in the economy. Monetary policy and its resultant effects on essential economic
activities is conventionally recognized and given special consideration by economists and
policy makers. Key macroeconomic indicators such as investment, general price level,
employment, etc. are influenced by monetary policy through policy instruments of variation in
money supply and the cost of credit (interest rate). Increase in money supply, for instance,
increases the level of investment in the economy and this has long run effect on the
development of the stock market as it will enhance the contribution of the stock market to
economic growth and development
Globally, the concern about the interaction between monetary policy and the stock market has
been on the increase since the collapse of major stock market boom of 2000 and 2007 (Yoshino,
Hesary, Ali, & Ahmad, 2014). The stock market crash of 2008 resulted in failure of key
businesses, decline in consumer wealth and downturn in economic activities which led to the
great recession of 2008 and contributed to the European sovereign-debt crisis. Consequently,
it is considered to be the worst financial crisis since the (great) depression of the 1930s (Eigner,
Peter, Umlauft, & Thomas, 2015; Temin & Peter, 2010).
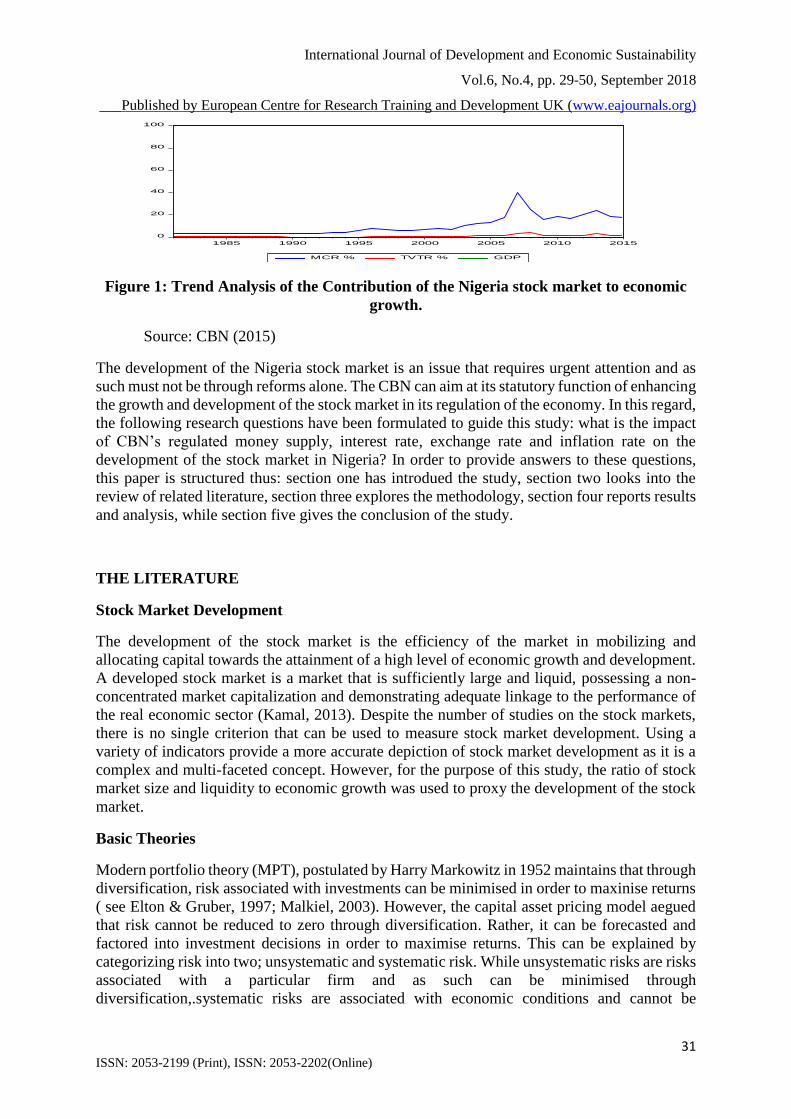
Prior to 2003, the Nigeria stock market contributed less to economic growth, with market
capitalization ratio having a very slow (though steady) growth and total value traded
maintaining an extremely low rate (CBN, 2015). Figure 1 shows that from 2003 to 2006, there
was improvement in stock market capitalization ratio. While from 2006 to early 2008, there
was increase in the contribution of the stock market to economic growth as both market
capitalization ratio and total value traded ratio increased during this period. From 2009 till date,
the contribution of the stock market to economic growth has been low and unsustainable (CBN,
2015). This problem is more severe with the liquidity of the stock market as the ratio of total
value traded to GDP (TVTR) was approximately 1% as at 2015. Though the ratio of market
capitalization recorded a slight improvement from 2012 to 2013, there was a sharp decline from
2013 to 2014.
International Journal of Development and Economic Sustainability
Vol.6, No.4, pp. 29-50, September 2018
___Published by European Centre for Research Training and Development UK (www.eajournals.org)
31 ISSN: 2053-2199 (Print), ISSN: 2053-2202(Online)
Figure 1: Trend Analysis of the Contribution of the Nigeria stock market to economic
growth.
Source: CBN (2015)
The development of the Nigeria stock market is an issue that requires urgent attention and as
such must not be through reforms alone. The CBN can aim at its statutory function of enhancing
the growth and development of the stock market in its regulation of the economy. In this regard,
the following research questions have been formulated to guide this study: what is the impact
of CBN’s regulated money supply, interest rate, exchange rate and inflation rate on the
development of the stock market in Nigeria? In order to provide answers to these questions,
this paper is structured thus: section one has introdued the study, section two looks into the
review of related literature, section three explores the methodology, section four reports results
and analysis, while section five gives the conclusion of the study.
THE LITERATURE
Stock Market Development
The development of the stock market is the efficiency of the market in mobilizing and
allocating capital towards the attainment of a high level of economic growth and development.
A developed stock market is a market that is sufficiently large and liquid, possessing a non-
concentrated market capitalization and demonstrating adequate linkage to the performance of
the real economic sector (Kamal, 2013). Despite the number of studies on the stock markets,
there is no single criterion that can be used to measure stock market development. Using a
variety of indicators provide a more accurate depiction of stock market development as it is a
complex and multi-faceted concept. However, for the purpose of this study, the ratio of stock
market size and liquidity to economic growth was used to proxy the development of the stock
market.
Basic Theories
Modern portfolio theory (MPT), postulated by Harry Markowitz in 1952 maintains that through
diversification, risk associated with investments can be minimised in order to maxinise returns
( see Elton & Gruber, 1997; Malkiel, 2003). However, the capital asset pricing model aegued
that risk cannot be reduced to zero through diversification. Rather, it can be forecasted and
factored into investment decisions in order to maximise returns. This can be explained by
categorizing risk into two; unsystematic and systematic risk. While unsystematic risks are risks
associated with a particular firm and as such can be minimised through
diversification,.systematic risks are associated with economic conditions and cannot be
0
20
40
60
80
100
1985 1990 1995 2000 2005 2010 2015
MCR % TVTR % GDP

International Journal of Development and Economic Sustainability
Vol.6, No.4, pp. 29-50, September 2018
___Published by European Centre for Research Training and Development UK (www.eajournals.org)
32 ISSN: 2053-2199 (Print), ISSN: 2053-2202(Online)
minimised through diversification. Accordingly, by taking more risk, returns can be maximised
(see Elbannan, 2015; Fama & French, 2004). These two theories are very relevant in explaining
stock market development. Because, as investors are able to calculate risk, they become less
risk averse and invest in varieties of stocks which in turn increase the level of activities in the
stock market and boosts its contribution to economic growth and development.
Empirical Literature
In addressing the problems of the stock market development from the monetary perspective,
previous researchers have laid emphasis on how monetary policy affects the stability of the
stock market. The basic idea behind these studies is that stability of the stock market is a perfect
reflection of economic stability and as such, that a relatively stable market can be said to be
developed. While some approached it from the perspective of how monetary policy affects
stock returns in Nigeria, others looked at how it affects stock prices. Furthermore, among
scholars that focused on stock market returns, there is no common consensus in their empirical
findings. Some findings indicate that monetary policy impacted significantly on stock market
returns in Nigeria (Ahmed and Igbinovia, 2013; Aliyu, 2013; Octavio, Martin, & George,
2011); and Godwin 2010), but that of Onyeke (2016) disagreed with previous studies, while
maintaining that monetary policy had no impact on stock returns in Nigeria. Empirical findings
also differed among researchers that studied the impact of monetary policy on stock prices.
While some scholars affirmed its significant impact on stock prices (Yosino, 2014; Babaak,
Navid, Shabriar, & Rozar, 2012 ; Aliyu, 2009), others confirm that monetary policy has no
significant impact on stock prices (Abaenewe & Ndugbu, 2012; Hasan & Javed, 2009).
Research Gap
The controversial findings of previous studies is more than enough justification for a study of
this kind. However, rather than basing the justification of this study on the controversial
findings of previous researchers, this study targeted at achieving a new feat. The research is an
addition to the existing body of knowledge on the essence of the stock market and the role of
the monetary authorities on the development of the stock market. The study shifted emphasis
from volatility of the stock market to the contribution of the stock market to the economy as a
measure of its level of development. Previous researchers focused on the need for the monetary
authorities to work towards the stability of the market, with the view that the stability of the
stock market is a perfect reflection of economic stability and as such characterizes its
development. While this study focuses on how the monetary authorities can enhance the
contribution of the stock market to economic growth and development, with the alternative
view that the development of the stock market is best assessed in terms of its contribution to
economic growth.
RESEARCH METHOD
Theoretical Framework
Theoretical postulations maintain that interest rate is the most influential monetary policy tool;
the important issue that arises when measuring the effect of monetary policy on stock markets
is its correct identification (Nwakoby & Alajekwu, 2016). The theoretical framework adopted
by this study is the discounted cash flow model. The model is a method of valuing a project,
company, or asset using the concepts of the time value of money. Here, all future cash flows
International Journal of Development and Economic Sustainability
Vol.6, No.4, pp. 29-50, September 2018
___Published by European Centre for Research Training and Development UK (www.eajournals.org)
33 ISSN: 2053-2199 (Print), ISSN: 2053-2202(Online)
are estimated and discounted by using cost of capital to give their present values (PVs). It offers
useful insights on stock market effects of monetary policy changes. According to this widely
used model, the stock price (SPt) is the present value of expected future dividends (Dt+j). As
developed by Christos and Alexandros (2006), for simplicity, it is assumed that there are two
alternative investment opportunities over a one period horizon: either a stock with an expected
gross return of Et(SPt+Dt+j)/ SPt or a risk-free bond with constant nominal gross return of
1+R. Arbitrary opportunities imply that for investors to be indifferent, both alternative must
yield the same expected return: Et(SPt+Dt+j)/ SPt=1+R. Under the assumption of constant
discount rate (R), it can be shown that;
SPt = Et ∑𝑗=𝐼
𝑒 (𝐼
𝐼+𝑅)
𝑗
Dt + j + ∑ 𝑡 (𝐼
𝐼+𝑅)
𝑒
SPt + k 1
where, Et is the conditional expectations operator based on information available to market
participants at time t, R is the rate of return used by market participants to discount future
dividends, and K is the investor’s time horizon (stock holding period). The standard
transversality condition implies that as the horizon K increases the second term in the right
hand side of Equation 1 vanishes to zero (no rational stock price bubbles):
LimE t (𝐼
𝐼+𝑅)
𝑒
SPt + k = O 2
Thus, we obtain the familiar version of the present value model
SPt = Et ∑𝑗=𝐼
𝑒 (𝐼
𝐼+𝑅)
𝑗
Dt + j 3
Equation 3 indicates that a change in monetary policy can affect stock returns in a dual manner.
First, there is a direct effect on stock returns by altering the discount rate used by market
participants. This will in turn improve the level of market capitalization. Tighter monetary
policy leads to an increase in the rate at which firms’ future cash flows are capitalized causing
stock prices to decline. The underlying assumptions are that, first, the discount factors used by
market participants are generally linked to market rates of interest and second, the central bank
is able to influence market interest rates. Second, monetary policy changes exert an indirect
effect on the firms’ stock value by altering expected future cash flows. Monetary policy easing
is expected to increase the overall level of economic activity and the stock price responds in a
positive manner (expecting higher cash flows in the future). Hence, this channel generally
assumes the existence of a link between monetary policy and the aggregate real economy. As
Patelis (1997) argued, stocks are claims on future economic output, so if monetary policy has
real economic effects then stock markets should be influenced by monetary conditions.
From Equation 3, stock prices and dividends are functions of interest rate. Since investment in
the stock market is mainly influenced by the price of stock and the dividends earned, Stock
Market Development (SMD) can be expressed as a function of interest rate. Thus;
SMD = f(R) 4

International Journal of Development and Economic Sustainability
Vol.6, No.4, pp. 29-50, September 2018
___Published by European Centre for Research Training and Development UK (www.eajournals.org)
34 ISSN: 2053-2199 (Print), ISSN: 2053-2202(Online)
Model Specification
From the model presented in equation 4, two empirical equations were constructed to estimate
the impact of of monetary policy indicators on stock market development. Stock market size
(ratio of market capitalization to GDP), and market liquidity (ratio of total value traded to GDP)
were used to capture stock market development. Using the ratio of market capitalization and
total value traded to GDP enables us to capture the contributions of the stock market to
economic growth and this is basically what stock market development is all about (Kamal,
2013). The main advantage of using MCR as a measure of stock market development is that it
is positively correlated with the ability of the market to mobilize capital and diversify risk.
Also, it is presumed to include companies’ past retained profit and future growth prospect so
that a higer ratio to GDP can signify growth prospect as well as stock market development.
(Levine and Zervos, 1998b). Other than market size, liquidity is another measure of stock
market development. It is the ability to easily buy and sell securities. Since liquidity allows
investors to alter their portfolio quickly and easily, it makes investment less risky and facilitates
longer term and more profitable investment. Liquidity is an important attribute of stock market
development because theoretically a more liquid market makes for better allocation of capital
and enhances prospects of economic growth. Given that interest rate goes hand-in-glove with
money supply, Equation 3 can be expanded to incorporate money supply. Thus:
MCR = f(INTR, M2R) 5
Where MCR is stock market size, INTR is the interest rate and M2R captures money supply.
The functions of the CBN is categorized into two: growth function and stabilization function.
Economic stability can be measured with the degree of stability of prices of goods and services
in the domestic economy as well as the degree of stability of the local currency (naira). As
such, equation 5 can be further expanded to incorporate inflation rate and exchange rate in
order to capture the stabilization function of the CBN. Thus the first empirical model is given
as:
MCR = a0 + a1M2R + a2INTR + a3EXR + a4INFR +U 6
Where: MCR is the ratio of market capitalization to GDP, M2R is growth rate of broad money
supply (M2), INTR is interest rate (prime lending rate), EX R is exchange rate, IINFR is
inflation rate, U is the error term, a0 = intercept and a1, a2, a3, and a4 are coefficients of the
variables.
The second empirical captures the possible impact of monetary policy on market liquidity,
which is an important aspect of stock market development and its given as:
TV = b0 + b1M2R + b2INTR + b3EXR + b4INFR + V 7
Where TV is the ratio of Total Value Traded to GDP and V is the error term.
The Johansen cointegration test was used to check for long term equilibrium relationships
among the variables of the models. An over-parameterized error correction modelling was
considered for the identification of the main dynamic pattern of the models and to ensure that
the dynamics of the models are not constrained by a too short lag length, after which a
parsimonious model was estimated. Appropriate lag length was chosen using Schwartz criteria.
International Journal of Development and Economic Sustainability
Vol.6, No.4, pp. 29-50, September 2018
___Published by European Centre for Research Training and Development UK (www.eajournals.org)
35 ISSN: 2053-2199 (Print), ISSN: 2053-2202(Online)
Model Justification and a priori expectation
Towards the achievement of its objectives, the monetary authority in Nigeria (CBN) uses
quantitative and/or qualitative monetary policy instruments. The use of any or all of these
instruments results to variation in money supply (M2) and interest rate and these are captured
in both equations 6 and 7.
This study adopts broad money supply (M2) as a proxy money supply because it is the most
acceptable definition of money supply in Nigeria (Afolabi, 1999). The coefficient of money
supply (a1) is expected to be positively signed because the greater the money supply, the greater
the level of economic activities and as such the greater the level of investment in the stock
market. The prime lending rate is a proxy for interest rate because the study is more directly
concerned with the level of activities in the stock market i.e investment and according to
Mishkin (2007), banks are the financial intermediaries which an average person interacts with
most frequently. The coefficient of prime lending rate (a2) is expected to be negatively signed
because of the inverse relationship between interest rate and stock market activities through
investment. It is important to note that the use of money supply and interest rate as part of the
independent variables of this analysis captures the growth function of the CBN.
It is well accepted in economic discourse that the CBN aims primarily at price stabilization.
Price stabilization is an open-ended concept and it is only a shallow knowledge of the concept
that could lead to the false perception that it is all about the stabilization of prices of
commodities in the economy. Currency is also a commodity and just like every other
commodity, it has its own price (exchange rate). As such, for the purpose of this study, the
price stabilization function of the CBN is decomposed into two; inflation control and exchange
rate control and these two are well captured in the model using annual inflation rate and the
exchange rate of naira to USA dollar. The coefficient of exchange rate (a3) is expected to be
positively signed because depreciation makes import costlier while export become cheaper and
this encourage greater investment through the stock market. The coefficient of inflation rate
(a4) is expected to be negatively signed because inflation discourages people from saving as it
erodes monetary values. This affects investment negatively and as such reduces people’s
participation in the stock market.
Data Sources and Estimation Software
All data used for estimation were sourced from CBN statistical bulletin on various issues and
World bank development indicators for Nigeria and all through this paper, we used E-views
9.5 for data analysis.
Result Presentation And Analysis
A unit root test was carried to check the stationarity of the variables of the model using
Augmented Dicky Fuller (ADF) and Philips Peron (PP) tests. The result is as shown on Table
1.
International Journal of Development and Economic Sustainability
Vol.6, No.4, pp. 29-50, September 2018
___Published by European Centre for Research Training and Development UK (www.eajournals.org)
36 ISSN: 2053-2199 (Print), ISSN: 2053-2202(Online)
Table 1: Result of Stationarity Test
Variables
ADF
Philips-
Peron (PP)
Decision
M2R
D(M2R)
-3.643**
-4.840**
-2.356
-6.898**
I(1)
PLR
D(PLR)
-3.375**
-9.127**
-3.334**
-9.255**
I(0)/I(1)
INF
D(INF)
-2.740
-5.958**
-2.613
-8.581**
I(1)
EXR
D(EXR)
0.318
-5.212**
0.324
-5.210**
I(1)
MCR
D(MCR)
-1.781
-5.799**
-1.745
-8.522**
I(1)
TV
D(TV)
-2.251
-5.386**
-2.183
-9.521**
I(1)
Note: (i) D is the first difference operator. (ii) Critical Values: ADF at 1%=3.654, at
5%=2.957, PP at 1%=3.646, at 5%=2.954. (iii) *(**) means significant at 1% and (5%)
respectively.
Except for prime lending rate (PLR) which was stationary at level and at first difference, other
variables became stationary after first difference. This result permits the conduct of
cointegration test on the variables.
The trace statistics of the cointegration test indicates one cointegrating equation; this is an
indication of existing long run equilibrium relationships among all the variables and it is on
Table 2.
Table 2: Summary of Cointegrated Test
Unrestricted Cointegration Rank Test (Trace)
Hypothesized
NO of CE(s)
Model One Model Two
Eigen-
Value
Trace
Statisti
c
0.05
Critical
Value
Prob
Eigen
-
Value
Trace
Statisti
c
0.05
Critical
Value
Prob
None 0.691 79.397 69.819 0.007 0.614 76.520 69.819 0.013
At most 1 0.439 40.643 47.858 0.200 0.518 45.114 47.856 0.089
At most 2 0.351 21.566 29.797 0.323 0.330 21.003 29.797 0.356
At most 3 0.193 7.309 15.495 0.542 0.210 7.793 15.475 0.488
At most 4 0.008 0.248 3.842 0.619 0.001 0.037 3.842 0.847
Unrestricted Cointegration Rank Test (Maximum Eigrn Value)
Model One Model Two

International Journal of Development and Economic Sustainability
Vol.6, No.4, pp. 29-50, September 2018
___Published by European Centre for Research Training and Development UK (www.eajournals.org)
37 ISSN: 2053-2199 (Print), ISSN: 2053-2202(Online)
Hypothesized
NO of CE(s)
Eigen-
Value
Trace
Statisti
c
0.05
Critical
Value
Prob
Eigen
-
Value
Trace
Statisti
c
0.05
Critical
Value
Prob
None 0.691 38.754 33.877 0.012 0.614 31.406 33.877 0.096
At most 1 0.439 19.077 27.583 0.409 0.518 24.081 27.584 0.132
At most 2 0.351 14.257 21.132 0.344 0.331 13.240 21.132 0.430
At most 3 0.193 7.062 14.265 0.482 0.210 7.756 14.265 0.404
At most 4 0.008 0.248 3.842 0.619 0.001 0.037 3.842 0.817
These results permit the estimation of a vector error correction model, we adopt the Hydra-type
general to specific VECM. Consequently, a parsimonious ECM was estimated from an over-
parameterized ECM for the two equations as shown ion table 3 and 4.
Table 3: Parsimonious ECM for Equation 6
Dependent Variable: D(MCR)
Variable Coefficient Std. Error t-Statistic Prob.
D(M2R) 0.198173 0.046672 4.246117 0.0002
D(PLR) -0.269291 0.161425 -1.668205 0.1068
D(EXR(-1)) -0.114332 0.057038 -2.004495 0.0551
D(INF) -0.068844 0.042880 -1.605511 0.1200
ECM(-1) -0.807991 0.164742 -4.904586 0.0000
C 1.135103 0.718913 1.578915 0.1260
R2=59% and D.W=2.21
Table 3: Parsimonious ECM for Equation 7
Dependent Variable: D(TV)
Variable Coefficient Std. Error t-Statistic Prob.
D(PLR(-1)) 0.024440 0.022302 1.095888 0.2828
D(M2R) 0.016660 0.006569 2.536078 0.0173
D(EXR) -0.014128 0.006610 -2.137421 0.0418
D(INF) -0.005619 0.005945 -0.945042 0.3530
ECM(-1) -0.704392 0.163886 -4.298060 0.0002
C 0.120375 0.098819 1.218135 0.2337
R2=58% and D.W=2.21
International Journal of Development and Economic Sustainability
Vol.6, No.4, pp. 29-50, September 2018
___Published by European Centre for Research Training and Development UK (www.eajournals.org)
38 ISSN: 2053-2199 (Print), ISSN: 2053-2202(Online)
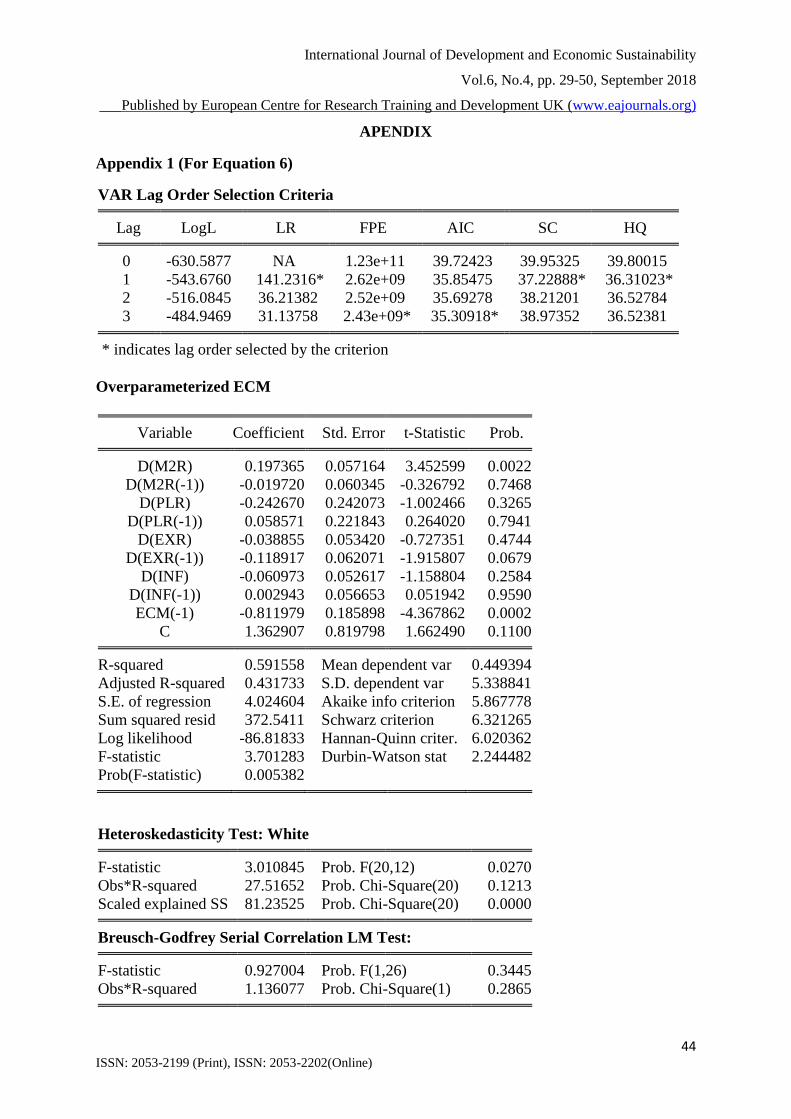
From the overparameterized ECM of the first model (see Appendix 1.3), the current value of
the growth rate in broad money supply (M2R) is positive and statistically significant. The speed
of adjustment (ECM) is well signed and significant, indicating a satisfactory speed of
adjustment. Other variables were not statistically significant. The result further indicated that
changes in the independent variables together account for 59% change in the depended
variable.
On Table 3, growth rate of broad money supply (M2R) and one period lag of exchange rate
(EXR(-1)) are statistically significant while prime lending rate (PLR) and inflation rate (INF)
are not. The ECM is also statistically significant and well signed. This implies a satisfactory
rate of adjustment from disequilibrium. The signs of the coefficients of the variables except
that of exchange rate (EXR) conform with apriori expectation. Against expectation, exchange
rate (EXR) is negatively signed. The result further indicate that changes in the independent
variables together account for about 59% change in the dependent variable.
From the overparameterized ECM of equation 7 (see Appendix 2.3), only the growth rate of
broad money supply (M2R) and ECM are also statistically significant. The ECM is also well
signed and implies a satisfactory rate of adjustment. The significant variables and/ or the less
insignificant variables were used for the Parsimonious ECM and the result is as shown above
in Table 4.
From Table 4, growth rate of broad money supply (M2R), exchange rate (EXR) and ECM are
significant while PLR and INF were not significant. Also, against apriori expectation, exchange
rate (EXR) is negative while PLR is positive. The ECM is well signed and indicates satisfactory
speed of adjustment of about 89%. Changes in the independent variables account for 58%
change in the dependent variable.
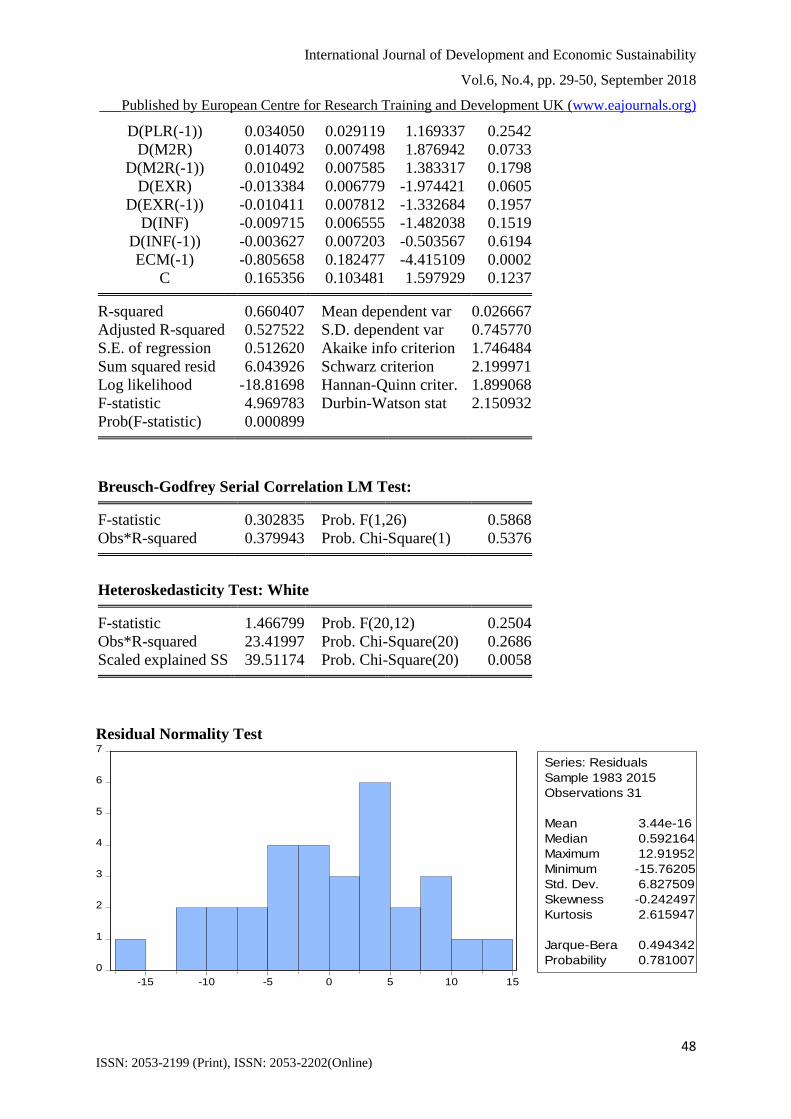
Residual diagnostic test was also carried out on both equation and the result indicates that both
equation had no serial correlation and are not heteroskedastic (see Appendix 1.4, 1.5, 2.4, and
2.5). The two error terms are normally distributed (see Appendix 1.6 and 2.6). Chow stability
test indicated that both equations are stable and are free from errors of misspecification (see
Appendix 1.7 and 2.6).
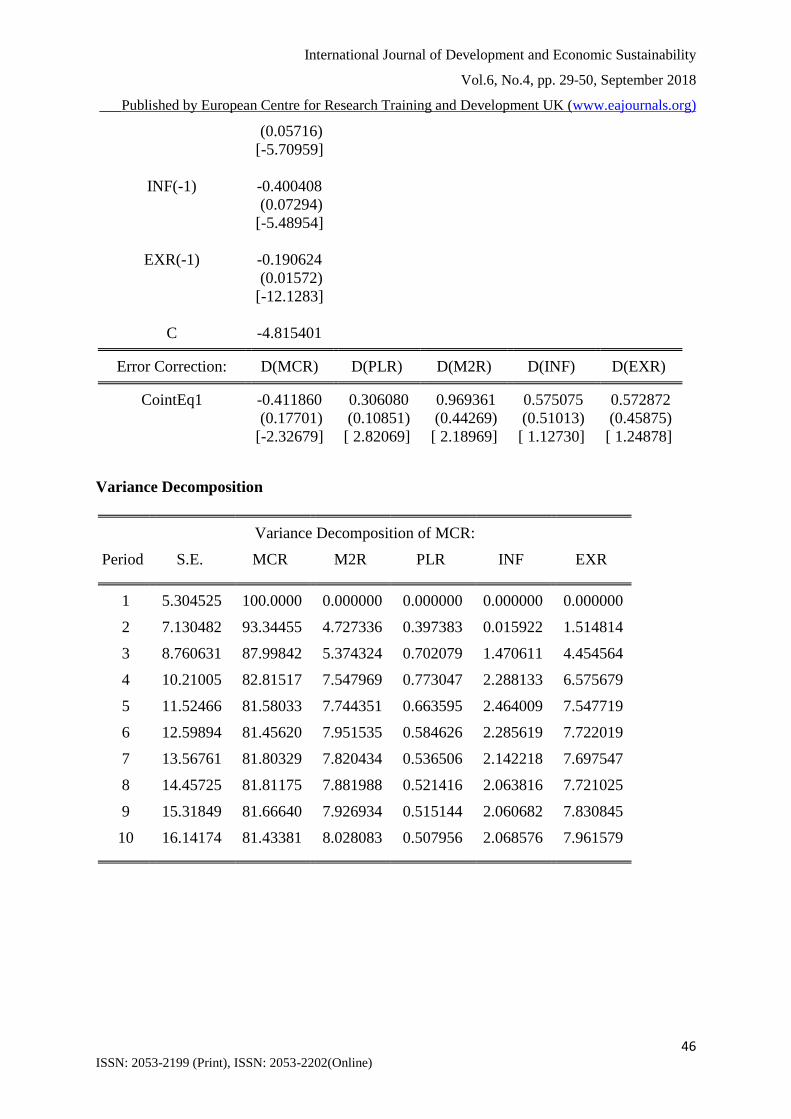
The result of the variance decomposition of Equation 6 (see Appendix 1.9a) indicated that in
the first model, except for money supply, own shocks dominates. It ranges from 81% to 100%
for market capitalization ratio, 13% to 37% for money supply, 71% to 95% for prime lending
rate, 74% to 97% for inflation and 51% to 93% for exchange rate. The result of the impulse
response of equation 6 (see Appendix 1.9b) corroborates the result of the variance
decomposition. The trend indicated that, in the future, stock market capitalization ratio will
respond more positively to own shock and shock in the growth rate of money supply but
negatively to increase in prime lending rate
Variance decomposition of the equation 7 (see Appendix 2.8a) indicates that own shocks
dominates. It ranges from about 53% to 100% for total value traded, 37% to 61% for money
supply, 60% to 90% for prime lending rate, 72% to 94% for inflation and 67% to 82% for
exchange rate. From the result, shock in money supply explained about 40% change in total
value traded. Impulse response analysis of equation 7 (see Appendix 2.8b) indicated that, in
the future, the ratio of total value traded will respond more positively to own shock and shock
in the growth rate of money supply but less to shock in inflation rate and prime lending rate
International Journal of Development and Economic Sustainability
Vol.6, No.4, pp. 29-50, September 2018
___Published by European Centre for Research Training and Development UK (www.eajournals.org)
39 ISSN: 2053-2199 (Print), ISSN: 2053-2202(Online)
DISCUSSION OF MAJOR FINDINGS
Obviously, increase in growth rate of money supply positively and significantly impact on
stock market development in Nigeria. Thus an increase in the growth rate of money supply is
encouraged as this has the tendency of increasing not only the level of market capitalization,
but also the total value traded. With increase in market capitalization and total value traded,
firms are able to raise more funds from the stock market for expansion, and individuals who
invest in the market can easily transfer their securities in order to take advantage of speculation.
This makes investment in the market more attractive, thus leading to greater activities in the
stock market which will culminate to greater level of economic growth.
The findings of the study indicate that the credit conditions in the banking sector has not been
favorable for domestic investment in Nigeria. Prime lending rate has impacted negatively
(though not significantly) on stock market development in Nigeria. This could be as a result
of: the profiteering agenda of the deposit money banks in the country, non-availability of
alternative sources of funds in the country, worse lending conditions in the parallel markets or
probably as a result of the CBN’s inability to curtail the excesses of these banks. The lending
trend if not checked, will lower stock market development as firms become unable to raise
required capital for capacity expansion. This is undesirable as it will ultimately bounce back
on the economy and as such impede the growth rate of the Nigerian economy.
These findings are in conformity with the empirical findings of Yoshino et al (2014), Babaak
et al (2012), and with the theoretical framework of this study which established that monetary
policy easing increases the overall level of economic activity such that increase in money
supply propels a general increase in the level of aggregate demand. The increase in demand
further translates to the stock market through increase in the level of investment. This is because
increase in money supply makes more funds available for investment in stocks and also makes
alternative financial investment such as bonds unattractive. The increase in money supply and
its resulting decrease in interest rates make stock and equity more attractive investment. When
investors obtain a low rate of return through lending, they tend to allocate more money to
investment in stocks. This has every tendency of not just to increase the size of the stock market
but also its liquidity, thus enhancing its contribution to economic growth and developmentt.
Theoretically, a currency depreciation encourages industrialization through increased capital
mobilization and allocation in the stock market. The value of naira is both affected and reflected
in the interest rates, and interest rates have direct impact on the level of activities in the stock
market. Therefore, exchange rates affect stock markets and can be used to make predictions
about the market. A weak naira suggests that consumers are likely patronize locally produced
goods leading to economic expansion. Consequently more businesses will build up capital
stock, expand their production and continue to borrow from the financial sector. In the short
run, cheap money suggests the stock market will show price rises across board. However, the
result indicates that in the case of Nigeria, theory has been violated in this regard as the
continued loss of value of naira has negatively and significantly impact on stock market
development. Hasan and Javed (2009), as well as Onyeke (2016) also had similar findings in
their research.. Probably, this is as a result of import demand inelasticity and expectedly, will
impede the level of economic growth as the bulk of the nation’s resources, which would have
been used for development strides is lost through importation.
The result further indicates that the level of economic instability in the country has worked
against the development of the stock market in Nigeria. Inflation has impacted negatively on

International Journal of Development and Economic Sustainability
Vol.6, No.4, pp. 29-50, September 2018
___Published by European Centre for Research Training and Development UK (www.eajournals.org)
40 ISSN: 2053-2199 (Print), ISSN: 2053-2202(Online)
stock market development in Nigeria (as indicated from the analyses of both equations 6 and
7). This could be as a result of the loss in value of money caused by inflation. Thus, Nigeria
faces a policy dilemma as increase in money supply goes hand-in-glove with increase in
inflation. However this can be resolved by ensuring that the excess funds are channeled to
productive activities such that the increased production crowds out the possible influences of
inflation. Restriction or outright ban on the importation of consumer goods is advised as their
continual inflow will hinder the development of the stock market
Implications for Research and Practice
Previous studies emphasized on the impact of monetary policy on the volatility of the stock
market, with the notion that a less volatile stock market is a perfect approximate of a developed
stock market. This study shifted emphasis from stock market stability to the contribution of the
stock market to economic growth by examining how the monetary authority has affected the
contribution of the stock market to economic growth. Thereby creating awareness in the minds
of subsequent researchers that in the analysis of stock market development, emphasis should
be on the contribution of the market to economic growth. This is because, a developed stock
market is one that is able to meet the needs for which it was established, and the principal need
for the establishment of any stock market is for capital mobilization and allocation for greater
economic growth. Also, in
This study also contributes to existing knowledge by assessing the impact of monetary policy
on both the primary and secondary segments of the stock market. Market capitalization ratio
was used to capture activities in the primary market while the total value ratio was used to
capture the activities in the secondary market. And as pointed out by Kamal (2013), the concept
of stock market development can best be captured with the use of more than one indicator. This
study is holistic and distinct as it captured market size, market liquidity and the linkage of the
stock market to the performance of real economic sectors.
In evolving an efficient and reliable financial system through the application of appropriate
monetary policy instruments and systemic surveillance, the monetary authority must work
towards improving the contribution of the stock market to economic growth through
expansionary monetary policy. Monetary policy must also be directed towards the development
of both the primary and secondary segments of the stock market. With this, capital mobilization
and allocation will be enhanced and investors will be able to transfer their shares in order to
take advantage of speculations in the market.
CONCLUSION AND RECOMMENDATIONS
This study sets out to examine the impact of monetary policy on stock market development in
Nigeria over the period of 1981 to 2015. Cointegration and vector error correction model were
employed for data analysis. The cointegration test indicated that there is a long run relationship
among the variables. From the parsimonious ECM, the growth rate of broad money supply and
the exchange rate have significant impact on the development of the stock market in Nigeria.
While the significant impact of the growth rate of broad money supply was positive, that of
exchange rate was negative. Prime lending rate and inflation impacted significantly and
negatively on stock market development in Nigeria. Diagnostic checks indicated that the
models had no problem of serial correlation and are free from heteroscedasticity. Also, the
International Journal of Development and Economic Sustainability
Vol.6, No.4, pp. 29-50, September 2018
___Published by European Centre for Research Training and Development UK (www.eajournals.org)
41 ISSN: 2053-2199 (Print), ISSN: 2053-2202(Online)
stability tests indicated that the parameters were stable and had no problem of mis-
specification, an indication that the models can be relied upon for policy making and even
forecasting. The study therefore concludes that monetary policy has impacted significantly on
stock market development in Nigeria. However, there is need for policies to be put in place in
order to further enhance the development of the market. This study thus recommends the
following:
The monetary authorities also need to closely monitor the lending activities of commercial
banks in order to ensure that credit conditions are investment friendly. This can be achieved by
setting maximum range for prime lending rate and establishing strong regulation and
enforcement agency to ensure compliance. Also, there should be appropriate sanction for
institutions that fail to comply.
Since it is obvious that the fall in the value of naira over the years has not encouraged
industrialization and its resultant boost in local production, there is need for embargo on the
importation of certain products and if it becomes necessary, outright ban can also be used. With
this, the foreign firms may be forced to relocate plants to the country in order to take advantage
of the available market in the country. This will lead to industrialization through stock market
capitalization and total value traded. Other than this, such embargo/outright ban will serve as
morale boost for local producers and investors. Either of these or both will result to higher level
of economic growth and development through the stock market. It will also help to raise the
value of naira in terms of its competitiveness with other currencies.
There is need for greater effective control of inflation in order to enhance the development of
the stock market. Other than selective credit control of money supply as recommended earlier,
the CBN needs to explore other measures such as contractionary open market operation to mop-
up excess liquidity where and when necessary. The CBN also needs to collaborate with the
fiscal authorities in order to ensure that the contractionary monetary policy is not crowded out
by an opposing expansionary fiscal policy. Thus, the need for better policy coordination in the
economy.
Future Research
There is need for further research on the efficacy and impact of the different monetary policy
instruments on stock market development in Nigeria. Thus relaxing the basic assumption of
this study; that the CBN is effective and efficient in its operations. Also, researchers should
investigate other factors affecting the development of the stock market, the development of the
stock market is not only monetary policy propelled as indicated by the R2 of this research.
Some of the possible factors include; market infrastructure, banking sector developemnt,
portfolio capital flows etc.
REFERENCES
Abaenewe, Z.C., & Ndugbu, M.O. (2012). Analysis of the effect of monetary policy
development on equity prices in Nigeria. West African Journal of Industrial and
Academic Research, 5(1), 140-157.
Aduda, J., Masila. J.M., & Onsongo, E.N. (2012). Determinants of stock market
development: The case for the Nairobi Stock Exchange. International Journal of
Humanities and Social Sciences, 2(9), 214-230.

International Journal of Development and Economic Sustainability
Vol.6, No.4, pp. 29-50, September 2018
___Published by European Centre for Research Training and Development UK (www.eajournals.org)
42 ISSN: 2053-2199 (Print), ISSN: 2053-2202(Online)
Afolabi, L. (1999). Monetary economics. (Revised Edition). Heinemann Education Books
Ahmed, U., & Igbinovia, L.E. (2015). Impact of inflation rate on stock returns in Nigeria
stock market. International Journal of Business and Social Science, 6(11). 155-168.
Aliyu, S.U.R. (2009). Stock prices and exchange rate interaction in Nigeria: An intra-global
financial crisis maiden investigation. MPRA Paper No 13283, 1-24.
Aliyu, S.U.R. (2013). Reactions of stock market to monetary policy shocks during the global
financial crisis: The Nigeria case. CBN Journal of Applied Statistics, 3(1). 17-41.
Babaak, M., Navid, B., Shabriar, E., & Rozar, K. (2012). An empirical study of the
relationship between monetary policy and stock market performance in Malaysia.
Australian Journal of Basic and Applied Sciences, 6(2), 142-148.
CBN. (2015). Statistical bulletin on various issues.
Christos, I., & Alexandros, K. (2006). Monetary policy and the stock market: Some
international evidence. Journal of Economic Literature (JEL), E44, E52, E60.
Eigner, Peter, Umlauft, & Thomas. S. (2015). The great depression(s) of 1929-1933 and
2007-2009 parallels, differences and policy lessons. MTA-ELTE Crisis History
Working Paper. No 2: Hungarian Academy of Science.
Elbannan, M.A. (2015). Capital asset pricing model: an overview of the theory. International
Journal of Economics and Finance; 7(1). 216-228.
Elton, E.J,. & Gruber. M.J. (1997). Modern portfolio theory, 1950 to date. Journal of Banking
and Finance, 27. 1743-1759.
Fama, E.F., French, K.R. (2004). Capital asset pricing model: theory and evidence. Journal of
Economic Perspective, 18(3). 25-46.
Godwin, C.O. (2010). Monetary policy and stock market returns: Evidence from Nigeria. J
Economics, 2(1): 13-21.
Hasan, A., & Javed, M.T. (2009). An empirical investigation of the causal relationship among
monetary variables and equity market returns. Labar Journal of Economics, 14(1),
115-137.
Kamal A. E (2013). The development of stock markets: In search of a theory. International
Journal of Economics and Financial Issues, 3(3), 606-624.
Kelejian, H. H. (1982). An extension of a standard test for heteroskedasticity to a systems
framework. Journal of Econometrics, 20, 325-333.
Laeven, L. (2014). Development of local capital markets: Rationale and challenges. IMF
Working Paper: WP/14/234.
Levine, R. and Zervos, S. (1998b). Stock markets, banks, and economic growth. The
American Economic Review, 88, 537-558.
Malkiel, B.G. (2003). Efficient market hypothesis and its critics. Journal of Economic
Perspectives, 17(1). 59-82.
Mishkin, F.S. (2007). The Economics of money, banking and financial institutions. (7th ed.).
New York: Pearson Publishers.
Nowbutsing, B.H., & Odit, M.P. (2009). Stock market development and economic growth:
The case of Mauritius. International Business and Economic Research Journal, 8, 77-
88
Octavio, F.A., Martin, L., & George, P. (2011). Monetary policy and its impact on stock
market liquidity: Evidence from the Euro zone. University of Innsbruck Working
Papers in Economics and Statistics. Obtained from
https://www2.uibk.ac.at/downloads/c4041030/wpaper/2011-06.pdf. Accessed on
6/4/2017.
International Journal of Development and Economic Sustainability
Vol.6, No.4, pp. 29-50, September 2018
___Published by European Centre for Research Training and Development UK (www.eajournals.org)
43 ISSN: 2053-2199 (Print), ISSN: 2053-2202(Online)
Onyeka, C.E. (2016). Impact of monetary policy on stock returns in Nigeria. Middle-East
Journal of Scientific Research, 24(5), 1778-1787. doi:
10.5829/idosi.mejsr.2016.24.05.23455.
Patelis, A. (1997). Stock market predictability and the role of monetary policy. Journal of
Finance 52, 1951-1972.
Temin & Peter (2010). The great depression and the great recession. National Bureau of
Economic Research. 3(1), 22-35.
Turner, P. (2002). Bond markets in emerging economies: An overview of policy issues. BIS
Paper, 11, 1-12,
Yoshino. N., Hesary. F.T., Ali. H., & Ahmad. D.P. (2014). Response of stock markets to
monetary policy: Asian stock market perspective. Asian Development Bank Institute
Working Paper Series, 497.
International Journal of Development and Economic Sustainability
Vol.6, No.4, pp. 29-50, September 2018
___Published by European Centre for Research Training and Development UK (www.eajournals.org)
44 ISSN: 2053-2199 (Print), ISSN: 2053-2202(Online)
APENDIX
Appendix 1 (For Equation 6)
VAR Lag Order Selection Criteria
Lag LogL LR FPE AIC SC HQ
0 -630.5877 NA 1.23e+11 39.72423 39.95325 39.80015
1 -543.6760 141.2316* 2.62e+09 35.85475 37.22888* 36.31023*
2 -516.0845 36.21382 2.52e+09 35.69278 38.21201 36.52784
3 -484.9469 31.13758 2.43e+09* 35.30918* 38.97352 36.52381
* indicates lag order selected by the criterion
Overparameterized ECM
Variable Coefficient Std. Error t-Statistic Prob.
D(M2R) 0.197365 0.057164 3.452599 0.0022
D(M2R(-1)) -0.019720 0.060345 -0.326792 0.7468
D(PLR) -0.242670 0.242073 -1.002466 0.3265
D(PLR(-1)) 0.058571 0.221843 0.264020 0.7941
D(EXR) -0.038855 0.053420 -0.727351 0.4744
D(EXR(-1)) -0.118917 0.062071 -1.915807 0.0679
D(INF) -0.060973 0.052617 -1.158804 0.2584
D(INF(-1)) 0.002943 0.056653 0.051942 0.9590
ECM(-1) -0.811979 0.185898 -4.367862 0.0002
C 1.362907 0.819798 1.662490 0.1100
R-squared 0.591558 Mean dependent var 0.449394
Adjusted R-squared 0.431733 S.D. dependent var 5.338841
S.E. of regression 4.024604 Akaike info criterion 5.867778
Sum squared resid 372.5411 Schwarz criterion 6.321265
Log likelihood -86.81833 Hannan-Quinn criter. 6.020362
F-statistic 3.701283 Durbin-Watson stat 2.244482
Prob(F-statistic) 0.005382
Heteroskedasticity Test: White
F-statistic 3.010845 Prob. F(20,12) 0.0270
Obs*R-squared 27.51652 Prob. Chi-Square(20) 0.1213
Scaled explained SS 81.23525 Prob. Chi-Square(20) 0.0000
Breusch-Godfrey Serial Correlation LM Test:
F-statistic 0.927004 Prob. F(1,26) 0.3445
Obs*R-squared 1.136077 Prob. Chi-Square(1) 0.2865

International Journal of Development and Economic Sustainability
Vol.6, No.4, pp. 29-50, September 2018
___Published by European Centre for Research Training and Development UK (www.eajournals.org)
45 ISSN: 2053-2199 (Print), ISSN: 2053-2202(Online)
Residual Normality Test
0
1
2
3
4
5
6
-2 -1 0 1 2 3 4
Series: Residuals
Sample 1983 2015
Observations 31
Mean 3.58e-18
Median -0.142741
Maximum 3.561267
Minimum -2.031386
Std. Dev. 1.314554
Skewness 0.682622
Kurtosis 3.187094
Jarque-Bera 2.452738
Probability 0.293356
Stability Tests
a) Chow Breakpoint Test: 2008
F-statistic 0.962230 Prob. F(6,21) 0.4739
Log likelihood ratio 8.015230 Prob. Chi-Square(6) 0.2370
Wald Statistic 5.773382 Prob. Chi-Square(6) 0.4490
a) Ramsey RESET Test
Value Df Probability
t-statistic 0.755693 26 0.4566
F-statistic 0.571072 (1, 26) 0.4566
Likelihood ratio 0.716977 1 0.3971
Vector Error Correction Estimates
Cointegrating Eq: CointEq1
MCR(-1) 1.000000
PLR(-1) 1.357272
(0.24381)
[ 5.56688]
M2R(-1) -0.326379
International Journal of Development and Economic Sustainability
Vol.6, No.4, pp. 29-50, September 2018
___Published by European Centre for Research Training and Development UK (www.eajournals.org)
46 ISSN: 2053-2199 (Print), ISSN: 2053-2202(Online)
(0.05716)
[-5.70959]
INF(-1) -0.400408
(0.07294)
[-5.48954]
EXR(-1) -0.190624
(0.01572)
[-12.1283]
C -4.815401
Error Correction: D(MCR) D(PLR) D(M2R) D(INF) D(EXR)
CointEq1 -0.411860 0.306080 0.969361 0.575075 0.572872
(0.17701) (0.10851) (0.44269) (0.51013) (0.45875)
[-2.32679] [ 2.82069] [ 2.18969] [ 1.12730] [ 1.24878]
Variance Decomposition
Variance Decomposition of MCR:
Period S.E. MCR M2R PLR INF EXR
1 5.304525 100.0000 0.000000 0.000000 0.000000 0.000000
2 7.130482 93.34455 4.727336 0.397383 0.015922 1.514814
3 8.760631 87.99842 5.374324 0.702079 1.470611 4.454564
4 10.21005 82.81517 7.547969 0.773047 2.288133 6.575679
5 11.52466 81.58033 7.744351 0.663595 2.464009 7.547719
6 12.59894 81.45620 7.951535 0.584626 2.285619 7.722019
7 13.56761 81.80329 7.820434 0.536506 2.142218 7.697547
8 14.45725 81.81175 7.881988 0.521416 2.063816 7.721025
9 15.31849 81.66640 7.926934 0.515144 2.060682 7.830845
10 16.14174 81.43381 8.028083 0.507956 2.068576 7.961579

International Journal of Development and Economic Sustainability
Vol.6, No.4, pp. 29-50, September 2018
___Published by European Centre for Research Training and Development UK (www.eajournals.org)
47 ISSN: 2053-2199 (Print), ISSN: 2053-2202(Online)
Impulse Response
-2
0
2
4
6
2 4 6 8 10
Response of MCR to MCR
-2
0
2
4
6
2 4 6 8 10
Response of MCR to M2R
-2
0
2
4
6
2 4 6 8 10
Response of MCR to INF
-2
0
2
4
6
2 4 6 8 10
Response of MCR to EXR
-2
0
2
4
6
2 4 6 8 10
Response of MCR to PLR
-8
-4
0
4
8
12
16
2 4 6 8 10
Response of M2R to MCR
-8
-4
0
4
8
12
16
2 4 6 8 10
Response of M2R to M2R
-8
-4
0
4
8
12
16
2 4 6 8 10
Response of M2R to INF
-8
-4
0
4
8
12
16
2 4 6 8 10
Response of M2R to EXR
-8
-4
0
4
8
12
16
2 4 6 8 10
Response of M2R to PLR
-5
0
5
10
15
20
2 4 6 8 10
Response of INF to MCR
-5
0
5
10
15
20
2 4 6 8 10
Response of INF to M2R
-5
0
5
10
15
20
2 4 6 8 10
Response of INF to INF
-5
0
5
10
15
20
2 4 6 8 10
Response of INF to EXR
-5
0
5
10
15
20
2 4 6 8 10
Response of INF to PLR
-10
-5
0
5
10
15
2 4 6 8 10
Response of EXR to MCR
-10
-5
0
5
10
15
2 4 6 8 10
Response of EXR to M2R
-10
-5
0
5
10
15
2 4 6 8 10
Response of EXR to INF
-10
-5
0
5
10
15
2 4 6 8 10
Response of EXR to EXR
-10
-5
0
5
10
15
2 4 6 8 10
Response of EXR to PLR
-2
-1
0
1
2
3
4
2 4 6 8 10
Response of PLR to MCR
-2
-1
0
1
2
3
4
2 4 6 8 10
Response of PLR to M2R
-2
-1
0
1
2
3
4
2 4 6 8 10
Response of PLR to INF
-2
-1
0
1
2
3
4
2 4 6 8 10
Response of PLR to EXR
-2
-1
0
1
2
3
4
2 4 6 8 10
Response of PLR to PLR
Response to Cholesky One S.D. Innovations
Appendix 2 (For Equation 7)
VAR Lag Order Selection Criteria
Lag LogL LR FPE AIC SC HQ
0 -565.9451 NA 2.16e+09 35.68407 35.91309 35.75998
1 -479.2213 140.9263* 46706385* 31.82633* 33.20046* 32.28181*
2 -456.0098 30.46499 59092711 31.93812 34.45735 32.77317
3 -430.0644 25.94542 78821964 31.87903 35.54337 33.09365
* indicates lag order selected by the criterion
Overparameterized ECM
Variable Coefficient Std. Error t-Statistic Prob.
D(PLR) -0.001249 0.031102 -0.040162 0.9683
International Journal of Development and Economic Sustainability
Vol.6, No.4, pp. 29-50, September 2018
___Published by European Centre for Research Training and Development UK (www.eajournals.org)
48 ISSN: 2053-2199 (Print), ISSN: 2053-2202(Online)
D(PLR(-1)) 0.034050 0.029119 1.169337 0.2542
D(M2R) 0.014073 0.007498 1.876942 0.0733
D(M2R(-1)) 0.010492 0.007585 1.383317 0.1798
D(EXR) -0.013384 0.006779 -1.974421 0.0605
D(EXR(-1)) -0.010411 0.007812 -1.332684 0.1957
D(INF) -0.009715 0.006555 -1.482038 0.1519
D(INF(-1)) -0.003627 0.007203 -0.503567 0.6194
ECM(-1) -0.805658 0.182477 -4.415109 0.0002
C 0.165356 0.103481 1.597929 0.1237
R-squared 0.660407 Mean dependent var 0.026667
Adjusted R-squared 0.527522 S.D. dependent var 0.745770
S.E. of regression 0.512620 Akaike info criterion 1.746484
Sum squared resid 6.043926 Schwarz criterion 2.199971
Log likelihood -18.81698 Hannan-Quinn criter. 1.899068
F-statistic 4.969783 Durbin-Watson stat 2.150932
Prob(F-statistic) 0.000899
Breusch-Godfrey Serial Correlation LM Test:
F-statistic 0.302835 Prob. F(1,26) 0.5868
Obs*R-squared 0.379943 Prob. Chi-Square(1) 0.5376
Heteroskedasticity Test: White
F-statistic 1.466799 Prob. F(20,12) 0.2504
Obs*R-squared 23.41997 Prob. Chi-Square(20) 0.2686
Scaled explained SS 39.51174 Prob. Chi-Square(20) 0.0058
Residual Normality Test
0
1
2
3
4
5
6
7
-15 -10 -5 0 5 10 15
Series: Residuals
Sample 1983 2015
Observations 31
Mean 3.44e-16
Median 0.592164
Maximum 12.91952
Minimum -15.76205
Std. Dev. 6.827509
Skewness -0.242497
Kurtosis 2.615947
Jarque-Bera 0.494342
Probability 0.781007

International Journal of Development and Economic Sustainability
Vol.6, No.4, pp. 29-50, September 2018
___Published by European Centre for Research Training and Development UK (www.eajournals.org)
49 ISSN: 2053-2199 (Print), ISSN: 2053-2202(Online)
Stability Tests
a) Chow Breakpoint Test: 2008
F-statistic 1.675657 Prob. F(6,21) 0.1764
Log likelihood ratio 12.90971 Prob. Chi-Square(6) 0.0445
Wald Statistic 10.05394 Prob. Chi-Square(6) 0.1224
b) Ramsey RESET Test
Value df Probability
t-statistic 0.926338 26 0.3628
F-statistic 0.858102 (1, 26) 0.3628
Likelihood ratio 1.071542 1 0.3006
Vector Error Correction Estimates
Cointegrating Eq: CointEq1
TV(-1) 1.000000
PLR(-1) 0.150760
(0.03887)
[ 3.87832]
M2R(-1) -0.043124
(0.00925)
[-4.65960]
INF(-1) -0.040143
(0.01110)
[-3.61629]
EXR(-1) -0.020764
(0.00241)
[-8.60951]
C -0.177729
Error Correction: D(TV) D(PLR) D(M2R) D(INF) D(EXR)
CointEq1 -0.536633 2.226583 4.124658 5.007618 5.479327
(0.15626) (0.82772) (3.58793) (3.80190) (3.74772)
[-3.43428] [ 2.69002] [ 1.14959] [ 1.31714] [ 1.46204]

International Journal of Development and Economic Sustainability
Vol.6, No.4, pp. 29-50, September 2018
___Published by European Centre for Research Training and Development UK (www.eajournals.org)
50 ISSN: 2053-2199 (Print), ISSN: 2053-2202(Online)
Variance Decomposition
Variance Decomposition of TV:
Perio
d S.E. TV M2R PLR INF EXR
1 0.623808 100.0000 0.000000 0.000000 0.000000 0.000000
2 0.955639 71.04339 27.61729 0.535685 0.066512 0.737127
3 1.136712 61.21583 34.28844 0.653880 0.219999 3.621850
4 1.298811 56.62263 37.56536 0.567462 0.343433 4.901118
5 1.440045 55.08685 38.73429 0.504417 0.327821 5.346626
6 1.568565 54.66894 39.14168 0.454830 0.281784 5.452764
7 1.685613 54.40743 39.40881 0.429930 0.249282 5.504550
8 1.795660 53.99061 39.77841 0.416481 0.229944 5.584550
9 1.899658 53.52716 40.15964 0.406451 0.219733 5.687022
10 1.998394 53.14456 40.46955 0.396247 0.211895 5.777748
Impulse Response Function
- .2
.0
.2
.4
.6
.8
2 4 6 8 10
Response of TV to TV
- .2
.0
.2
.4
.6
.8
2 4 6 8 10
Response of TV to PLR
- .2
.0
.2
.4
.6
.8
2 4 6 8 10
Response of TV to M2R
- .2
.0
.2
.4
.6
.8
2 4 6 8 10
Response of TV to INF
- .2
.0
.2
.4
.6
.8
2 4 6 8 10
Response of TV to EXR
-4
-2
0
2
4
2 4 6 8 10
Response of PLR to TV
-4
-2
0
2
4
2 4 6 8 10
Response of PLR to PLR
-4
-2
0
2
4
2 4 6 8 10
Response of PLR to M2R
-4
-2
0
2
4
2 4 6 8 10
Response of PLR to INF
-4
-2
0
2
4
2 4 6 8 10
Response of PLR to EXR
-10
-5
0
5
10
15
2 4 6 8 10
Response of M2R to TV
-10
-5
0
5
10
15
2 4 6 8 10
Response of M2R to PLR
-10
-5
0
5
10
15
2 4 6 8 10
Response of M2R to M2R
-10
-5
0
5
10
15
2 4 6 8 10
Response of M2R to INF
-10
-5
0
5
10
15
2 4 6 8 10
Response of M2R to EXR
-5
0
5
10
15
20
2 4 6 8 10
Response of INF to TV
-5
0
5
10
15
20
2 4 6 8 10
Response of INF to PLR
-5
0
5
10
15
20
2 4 6 8 10
Response of INF to M2R
-5
0
5
10
15
20
2 4 6 8 10
Response of INF to INF
-5
0
5
10
15
20
2 4 6 8 10
Response of INF to EXR
-5
0
5
10
15
2 4 6 8 10
Response of EXR to TV
-5
0
5
10
15
2 4 6 8 10
Response of EXR to PLR
-5
0
5
10
15
2 4 6 8 10
Response of EXR to M2R
-5
0
5
10
15
2 4 6 8 10
Response of EXR to INF
-5
0
5
10
15
2 4 6 8 10
Response of EXR to EXR
Response to Cholesky One S.D. Innovations