Impact of mergers and acquisitions on companies’ financial ...
14
34 Borodin, A., Sayabek Ziyadin, S., Islyam, G., & Panaedova, G. (2020). Impact of mergers and acquisitions on companies’ financial performance. Journal of International Studies, 13(2), 34-47. doi:10.14254/2071-8330.2020/13-2/3 Impact of mergers and acquisitions on companies’ financial performance Alex Borodin Department of Finance, Plekhanov Russian University of Economics, Russia [email protected] Sayabek Ziyadin Korkyt ata Kyzylorda State University, Kazakhstan [email protected] Gulnara Islyam The Faculty of Economic Sciences, Serikbayev East-Kazakhstan State University Oskemen, Kazakhstan [email protected] Galina Panaedova The Faculty of Economic Sciences, North-Caucasus Federal University, Russia [email protected] Abstract. This paper explores the influence of M&A transactions on the financial performance of US and European companies. We have studied the sample of 138 M&A transactions performed within these two regions during the period between 2014 and 2018. We investigate the correlation between return on sales (ROS) and such variables as equity-to-enterprise value ratio. Moreover, we observe the impact of the financial crisis and industry-relatedness to M&A parties on the performance of a merged company. Most of the corporations studied both in the USA and in Europe were profitable, and remained so after mergers and acquisitions. However, despite the fact that positive values were found for the studied variables, tests for the analysis of average values in the sample show a significant deterioration in ROS in both regions. At the same time, in the USA the change in the EBIT/Total Revenue ratio averaged –6.8 %, and in the European countries –5.3 %. Regression analysis did not reveal a significant relationship between mergers and acquisitions and company performance Received: March, 2019 1st Revision: January, 2020 Accepted: May, 2020 DOI: 10.14254/2071- 8330.2020/13-2/3 Journal of International Studies Scientific Papers © Foundation of International Studies, 2020 © CSR, 2020
Transcript of Impact of mergers and acquisitions on companies’ financial ...

34
Borodin, A., Sayabek Ziyadin, S., Islyam, G., & Panaedova, G. (2020). Impact of mergers and acquisitions on companies’ financial performance. Journal of International Studies, 13(2), 34-47. doi:10.14254/2071-8330.2020/13-2/3
Impact of mergers and acquisitions on companies’ financial performance
Alex Borodin
Department of Finance,
Plekhanov Russian University of Economics,
Russia [email protected]
Sayabek Ziyadin
Korkyt ata Kyzylorda State University, Kazakhstan [email protected]
Gulnara Islyam
The Faculty of Economic Sciences, Serikbayev East-Kazakhstan State University Oskemen, Kazakhstan [email protected]
Galina Panaedova
The Faculty of Economic Sciences, North-Caucasus Federal University, Russia [email protected]
Abstract. This paper explores the influence of M&A transactions on the financial
performance of US and European companies. We have studied the sample of 138
M&A transactions performed within these two regions during the period between
2014 and 2018. We investigate the correlation between return on sales (ROS) and
such variables as equity-to-enterprise value ratio. Moreover, we observe the
impact of the financial crisis and industry-relatedness to M&A parties on the
performance of a merged company. Most of the corporations studied both in the
USA and in Europe were profitable, and remained so after mergers and
acquisitions. However, despite the fact that positive values were found for the
studied variables, tests for the analysis of average values in the sample show a
significant deterioration in ROS in both regions. At the same time, in the USA
the change in the EBIT/Total Revenue ratio averaged –6.8 %, and in the
European countries –5.3 %. Regression analysis did not reveal a significant
relationship between mergers and acquisitions and company performance
Received: March, 2019
1st Revision: January, 2020
Accepted: May, 2020
DOI: 10.14254/2071-
8330.2020/13-2/3
Journal of International
Studies
Sci
enti
fic
Pa
pers
© Foundation of International
Studies, 2020 © CSR, 2020

Alex Borodin, Sayabek Ziyadin, Gulnara Islyam, Galina Panaedova
Impact of mergers and acquisitions on companies’ financial performance
35
indicators, and the difference in values by region can be interpreted by the fact
that the US entered the crisis at an earlier point in time. The significance and the
sign of the EVEQ coefficient indicate that, ceteris paribus, an increase in the
“attractiveness” of target companies leads to an increase in ROS. The results do
not indicate any particular impact of M&A on post-M&A performance in the
companies considered.
Keywords: corporate finance, mergers and acquisitions, M&A deals, ROS, company.
JEL Classification: F53, O51, O52
1. INTRODUCTION
It is difficult to overstate the importance of multinational companies to today’s global economy. For
instance, by the end of 2017, the total revenue generated by the world’s largest 500 corporations ($27.6
billion), as represented in the Fortune Global 500, accounted for almost 37% of Gross World Product
($75.2 billion). Multinationals are becoming the most significant component of the global economy and are
the engine driving evolution and technological progress. One of the key points of concern amongst
executives is how to maintain sustainable growth and the leading role such international actors might play
in the future. In order to accelerate corporate development processes and to react to changes in the
competitive landscape, some top managers have resorted to tactics such as corporate restructuring, which
largely involves mergers and acquisitions (M&A) and leads to changes in organisational structure, the legal
form of an enterprise and its performance.
In 2014, McKinsey & Company found that about 85% of the enterprises with capital of over $1 billion
in developing countries are family owned. The associated shares of this nature are about 75% in Latin
America, 67% in India and 65% in the Middle East. China, where this proportion is about 40%, and sub-
Saharan African countries (35%) are distinguished by their relatively low shares of family-owned firms, since
in both cases many of these countries’ larger firms belong to the state (Kokoulina, 2017). At present,
researchers note that there have been seven waves of M&A activity, which means that such businesses have
been evolving with the passage of time, and the existence of different types of M&A transactions confirms
this information.
The aim of this work is to analyse how mergers and acquisitions affect post-transaction corporate
performance. Moreover, the question as to why companies continue to employ this method to enhance
productivity remains open. There have been a great number of such transactions that have performed well;
however, historical evidence also suggests there to be a large number of poor M&As (Mourdoukoutas,
2011). Hence, it is important to understand how performance varies according to circumstances.
2. LITERATURE REVIEW
According to some of the previous studies concerning the impact of M&A transactions on the financial
performance of companies, the nature of mergers and acquisitions is quite complex and, indeed, apparently
contradictory. Some of these studies have indicated the positive impact of such activities on the economic
efficiency of a number of companies (Kinateder et al., 2017; Blomson, 2016; Betzer et al., 2015), whilst
others suggest mergers and acquisitions have had an entirely negative impact (Ayadi et al., 2014; Borodin et
al., 2019; Tang, 2015), or are otherwise negligible (Andreu & Sarto, 2013; Campello, 2018). Historically,
economists and researchers from around the world have analysed various aspects of M&A deals in the

Journal of International Studies
Vol.13, No.2, 2020
36
attempt to come to a clear understanding of the impact of this phenomenon on the economic efficiency of
enterprises, but to date any associated consensus has yet to be reached.
M. Campello and colleagues (2018) noted that there are certain specific effects of short selling
constraints on corporate policies, and empirically showed how the equity-lending market affects corporate
behaviour. They considered 56 mergers conducted amongst Spanish investment funds between 2016 and
2018. Scientists have concluded that mergers and acquisitions, in general, have a negligible effect on the
performance of investment funds. It should be further noted that despite the fact that prior to acquisition
target companies tended to have lower economic performance than their acquirers, the data on the final
companies (created as a result of the M&A) does not allow one to draw definitive conclusions about the
difference in cost-effectiveness of acquiring companies before and after the completion of such transactions
(Andreu & Sarto, 2013).
Empirical studies by A. Betzer, M. Doumet, and M. Goergen (2015) concentrated on the analysis of
wealth effects after mergers and acquisitions based on data concerning share price fluctuations and changes
in chosen performance indicators. They divided all the investigated transactions into four distinct groups.
The first and the fourth groups included those mergers and acquisitions that both times showed positive
changes in stock price and in the observed measure or measures from the financial statement (group I), or
which in both cases were negative (group IV). Groups II and III included M&As that gave the opposite
results (positive share price change in parallel with negative change in financial statement measure, and vice
versa, respectively). By comparing these groups, researchers noticed that the most typical method of
financing for sample I was “cash”. Group I can also be characterised by positive expectations regarding the
associated effectiveness. Group II is described as a particular set of transactions that have been performed
in order to prevent similar actions by competitors. The “stock” method of financing turned out to be a
more popular approach than “cash” in the third group. In group IV, and indeed in group III, “stock”
financing was frequently observed. When researchers considered the entire sample, they noted that it was
dominated by companies that showed increased observed financial indicators post-M&A (Betzer et
al., 2015).
In this study, the same performance indicators as those observed by M. Blomson (2016) were found.
Moreover, the regression model is similar to the model employed by H. Kinateder, M. Fabich, and N.
Wagner (2017). In addition to conventional methods, the impact of mergers and acquisitions was analysed
by means of a non-traditional method referred to as “economic profit”. After reviewing the results of their
regressions, these researchers concluded that the financial performance of the companies concerned actually
declined; the “Economic profit” model analysis gave similar results (“median industry-adjusted economic
profit” reduced by $4 million after the deal) (Borodin et al., 2019).
H. Kinateder, M. Fabich, and N. Wagner (2017) were amongst the first to perform a regression analysis
of the cost-effectiveness of mergers and acquisitions. They conducted a study of 50 of the largest
transactions realised between 2014 and 2016, concluding that operating cash flows improved after the
completion of M&A transactions. It is important to note that these authors pointed to the direct impact of
improved asset productivity in the cash flow performance of companies (Kinateder et al., 2017).
In 2016, scientists K. Uhlenbruck, M. Hughes-Morgan, and M. A. Hitt (2016) investigated a sample of
859 transactions that occurred between 2014 and 2016. The objective of their study was to analyse the
mutual influence of such factors as (1) a method of financing, (2) the distortion of financial statements, and
(3) the operating efficiency of companies. Based on their results, Heron and Lie came to the conclusion that
the method of funding does not affect the post-M&A efficiency of a given transaction or, indeed, the
discretionary accruals, but after the announcement the company stock price was lower for deals that used
the “stock” method of financing compared to those using “cash”. As for the overall impact of M&A
transactions on economic performance indicators, the researchers found significant improvements in the

Alex Borodin, Sayabek Ziyadin, Gulnara Islyam, Galina Panaedova
Impact of mergers and acquisitions on companies’ financial performance
37
observed parameters after corporate transactions compared with the average for the industry (Uhlenbruck
et al., 2016).
D. Gabor (2016) examined a sample of 35 M&A transactions focussing on the European Commission’s
proposals to include the repo market – a market systemic to European (shadow) banking – in the financial
transactions tax (2016). Scientists employed the same methodology as K. Uhlenbruck and M. Hughes-
Morgan (2016), but preference was given to the analysis of cash flow figures. Regression results showed that
increased “cost-efficiency” and synergy were offset by a fall in industry-adjusted variables. The correlation
between the post-M&A efficiency of the companies and changes in share prices after the announcement of
such transactions was not revealed in the study (Gabor, 2016).
A. Balcerzak et al (2017) and K. Valaskova et al. (2018) propose a methodology for a comprehensive
evaluation of operational efficiency of the banking sectors in EU countries. Also authors measure the degree
of inefficiency of banking sectors in the “new” and “old” EU countries.
In 2014, R. Ayadi and W. De Groen (2014) initiated an annual monitoring exercise of banking business
models in the EU. The researchers noted that the process of adjustment of chosen financial statement
measures could be a major reason for the fact that the results of related studies frequently differ from each
other. For example, the authors pointed out that industry-adjusted indicators grow, while industry, size and
performance-adjusted measures decrease. It must be emphasised that as hostile takeovers tender - negatively
correlate with the tested measures (Ayadi et al., 2014).
It has been concluded that synergies obtained from combining innovation capabilities are important
drivers of acquisitions, as described in the work by J. Bena and K. Li (2014). This study was the most
extensive of all of the above papers in terms of number of indicators analysed. Contrary to the opinion held
by Ayadi (2014), no significant impact of the process of adjustment was found by this study. The “change”
model outcome also revealed an increase in the efficiency of economic performance amongst firms after
M&A (Bena & Li, 2014).
M. A. Hitt continued the study of K. Uhlenbruck and M. Hughes-Morgan (2016), considering 324 US
mergers and acquisitions. Hitt came to the conclusion that the economic performance of the firms formed
as a result of M&A tended to increase. The correlation between such factors as the size of the transaction,
industry and debt-to-equity ratio was not found to be significant. Hitt agreed with the idea that in most cases
M&As are motivated by the anticipated synergy (Hitt, 2016).
The financial sector of the Philippines was analysed in the work of E. Tang. The exact number of
observed transactions was not specified, but the author’s analysis included all mergers and acquisitions that
took place at the Philippines. Regarding the motives for transactions, Tang pointed out that in this sector
M&As mainly aim to achieve synergy and economies of scale, challenging the assertion that the inclusion
of traditional financial indicators (ROA, ROE, ROS, and so on.) creates problems for the analysis instead
of providing answers to the issues raised. The author also expressed the view that traditional measures can
be used to accurately assess the effects of M&As. The results of the research showed a significant
deterioration in ROA after M&A transactions and the absence of significant changes in AROA (Tang, 2015).
Many other scientists have considered these problems, such as Simionescu et al. (2017). Some authors
studied as determinants of economic growth in V4 countries. When studying competition between London-
based companies with regard to their financial performance, there was a merger of companies (Simionescu,
2016). Some authors saw this problem through the lens of sustainable economic development, whilst others
saw it through that of social entrepreneurship (Bilan et al., 2017). Mergers and acquisitions are strongly
influenced by human capital and entrepreneurial competencies for the development of informal
microenterprises (Zainol et al., 2018). Such trends were even considered to be the impact of innovation and
innovative behaviour on the activities of travel companies (Domi et al., 2019).

Journal of International Studies
Vol.13, No.2, 2020
38
3. DATA END METHODOLOGY
The study represents a comparison of regression analysis and two Student’s t-tests performed on the
basis of data on 138 M&As between companies from the US or from the European region between 2016
and 2018.
Sample
In order to form a sample, only those transactions that satisfy the following criteria were selected1:
1. Committed either between companies from the US, or between companies from Europe;
2. Successfully completed;
3. Executed in the time interval between 01/01/2016 and 31/12/2018;
4. Data on both parties is available for the year before and two years after the execution of the
transaction;
5. At least 50% of the shares of the target company were acquired;
6. Minimum value of the transaction was $150 million.
Accordingly, the final sample includes 138 mergers and acquisitions.
Restrictions on the minimum transaction value and the minimum percentage of repurchased shares
were introduced in order to select only those companies that could, in our opinion, more clearly demonstrate
the effect of the transaction.
The Thomson Reuters Advanced Analytics database was used to collect information.
The preliminary sample consisted of 156 transactions, including 65 European transactions and 91
American transactions.
The ratio of the average Return On Sales (ROS) for the absorbing company for two years after the
transaction was chosen as the analysed indicator.
In addition, as a descriptive variable for the Intercept model, the Equity Value/Enterprise Value ratio
(hereinafter, EVEQ) was added to the Pre-M&A ROS, the dummy of companies belonging to the same
microindustry, and the dummy of the crisis. These indicators are actively used in analysing the value of
companies. The magnitude of the Equity Value (Eq. Val.) shows the total value of common shares, while
the Enterprise Value (Ent. Val.) shows the total cost of the company itself.
This ratio was added for the purpose of verifying and evaluating the impact of a give company’s market
capitalisation ratio and its sale price on the subsequent performance of the final firm after the M&A
transaction.
Further, box charts and histograms were constructed for each region based on the average ROS for
two years after the transaction, the total for the buyer company and the target company ROS before the
transaction, and for the EVEQ indicator for the total sample (Fig. 1).
1 All data were taken from Thomson One database.
Alex Borodin, Sayabek Ziyadin, Gulnara Islyam, Galina Panaedova
Impact of mergers and acquisitions on companies’ financial performance
39
Figure 1. Box charts and histograms for EVEQ, Pre-M&A ROS (rat_prev), Av indicators. Post-
M&A ROS (rat_av) for general selection before deleting outliers
As can be seen from the graphs, the EVEQ index for most companies in the sample was more than
one, which can indicate both the structure of assets of the acquired companies (debt obligations = 0, and
cash and cash equivalents exceed the total value of preferred shares and minority shareholders’ shares), and
that the companies were profitable for the transaction since their capitalisation exceeded their value.
It is proposed to consider this variable from the point of view of the “attractiveness” of the target
company (if the ratio is greater than one, then the company is more attractive than if it were less than one).
The average ROS before the transaction is completed exceeds the average ROS after it is completed.
In addition, when looking at these figures, one can see that there are companies in the sample whose
values are strongly distinguished; this can be seen from both box charts and histograms. For this reason, 18
outliers were found in the sample and then deleted.
Figure 2 and Figure 3 show box charts, histograms, as well as scatter plots for Europe and the United
States for the above-listed indicators.

Journal of International Studies
Vol.13, No.2, 2020
40
Figure 2. Box charts and histograms for EVEQ, Pre-, Av indicators. Post-M&A ROS (rat prev,
rat_av) for Europe (EU) and the USA (US) after outlier removal
Based on the study of the graphical presentation of the data under study, the following preliminary
conclusions can be drawn:
1. Transactions conducted in the United States have a higher EVEQ ratio than transactions conducted
in Europe;
2. Both American and European companies show a significant decrease in ROS;
3. Both regions (the United States and European countries) have fairly similar statistical distributions
for each measure;
4. There is a clear correlation between ROS indicators before and after the transaction for both
regions;
5. The number of companies that had a profitable ROS before the M&A transaction, and after it
became unprofitable, is distributed in approximately equal proportions for both the US and Europe;
6. Among those companies that were unprofitable and remained so, firms from the United States
dominate. There is only one such company in Europe;
7. Companies that were unprofitable before M&A and became profitable after they were completed
were distributed in a relatively equal proportion, as well as those that were profitable before the transactions
and became unprofitable after the completion of mergers and acquisitions.
8. Most firms were profitable before making deals, and remained so after M&A.

Alex Borodin, Sayabek Ziyadin, Gulnara Islyam, Galina Panaedova
Impact of mergers and acquisitions on companies’ financial performance
41
Figure 3. Scatter plots of EVEQ, Pre-, & Av indicators. Post-M&A ROS (rat_prev, rat_av)
One of the most important aspects of research is the choice of financial indicators to analyse. The
article considers some indicators of accounting statements of companies that have been studied in work on
similar topics and will be used in the model of this study.
1. Operating profit (EBIT).
Operating profit is calculated as the difference between income and expenses:
EBIT=Revenue-Costs of products sold-Operating costs-depreciation and amortisation Costs
2. Operating profit including depreciation and amortisation (EBITDA).
EBITDA = EBIT + depreciation and amortisation costs
EBIT and EBITDA are among the most commonly used indicators for analysing M&A transactions.
However, these measures have some drawbacks. For example, the fact that they are not GAAP indicators
means that there is no standard method for calculating this measure, i.e., its official calculation may vary
depending on the company in question’s policy.
3. Pre-tax operating cash flow (pre-tax OCF) is calculated using the following formula:
Pre-tax OCF = Revenue-product costs – sales costs –
administrative expenses + depreciation and amortisation + expenses on intangible assets
4. “Net” operating cash flow (“pure” OCF)
The difference between pre-tax OCF and “pure” OCF is that the latter indicator depends on the
research methodology, but usually “net” flows include changes in inventory and accounts receivable.
Research economists Powell and Stark define this indicator as EBIT adjusted for working capital
dynamics.
5. Return on assets ratio (ROA):
Return on Assets = EBIT/(Average Total Assets)
When analysing the effectiveness of M&A transactions, the ROA indicator is considered one of the
most actively used, and objectively reflects the effectiveness of transactions.
This indicator includes the previously described EBIT, which is an indicator of the company’s
operating profit, as well as the average total assets that must be taken into account when performing mergers
and acquisitions.

Journal of International Studies
Vol.13, No.2, 2020
42
In addition to ROA, similar measures (ROE or ROS) can be used, calculated as EBIT/Equity (ROE)
and EBIT/Revenue (ROS).
To analyse the selected data for our 138 transactions, we used the Intercept model and two tests for
the Student's t-test to examine the following hypotheses:
H1: Mergers and acquisitions have a positive impact on financial performance after transactions in
both Europe and the United States;
H2: the Crisis has a negative impact on the studied indicator in at least one of the regions.
The H1 hypothesis is tested by both regressions and tests using the Student's t-test. To confirm the
hypothesis, it is necessary that the regression, which has only the ROS indicator as an explanatory variable
before the transaction, is significant. In addition, the intercept must be significant and have a positive
coefficient. If these conditions are met, then for additional verification, the average value of each sample
(both in Europe and the United States) must be greater than zero based on the results of the two tests.
If these two conditions are met, the hypothesis is confirmed. If any of the conditions are not met, the
hypothesis is rejected.
To analyse the hypothesis about the impact of the fact of the crisis on the studied indicator, only
regression analysis is performed. To confirm this hypothesis, the regressions must be significant, and in at
least one of the countries, the coefficient for the dump of the crisis variable must have a negative sign.
Models
The first model employed in this study examines the correlation between the observed financial
measure (Post-M&A ROS) and the fact of the execution of the transaction being as follows:
ROSPost−M&𝐴 = β0 + β1 ∙ ROSPre−M&𝐴 + ε
In this case, β0 shows how the effects produced by the fact of M&A execution are correlated with the
analysed measure.
The second model is designed to evaluate the correlation between post-M&A ROS and the following
variables:
Pre-M&A ROS;
Equity value-to-enterprise value ratio2;
Method of payment (dummy): 1 – mixed, 2 - cash, 3 - stock;
Crisis (dummy): 1 - deal completed in 2017 or 2018, 0 - completed in 2016;
Industry-relatedness (dummy): 1 – both parties to the transaction operate in the same microindustry,
0 - different microindustries.
Thus, the second model is as follows:
𝑅𝑂𝑆1,2𝑝𝑜𝑠𝑡 𝑀&𝐴
= 𝛽0 ∗ 𝑅𝑂𝑆−1𝑝𝑟𝑒𝑀&𝐴
+ 𝛽1 ∗𝐸𝑞. 𝑉𝑎𝑙
𝐸𝑛𝑡. 𝑉𝑎𝑙+ 𝛾0 ∗ 𝑀𝑂𝑃 + 𝛾1 ∗ 𝐶𝑅𝐼𝑆𝐼𝑆 +
+ 𝛾2 ∗ 𝐼𝑁𝐷𝑈𝑆𝑇𝑅𝑌
2 Equity value to enterprise value (EVEQ) is considered an indicator of the attractiveness of a company since the ratio shows the extent to which the market value of a corporation correlates with its book value. The greater the ratio, the greater the “attractiveness” of a company is.

Alex Borodin, Sayabek Ziyadin, Gulnara Islyam, Galina Panaedova
Impact of mergers and acquisitions on companies’ financial performance
43
4. EMPIRICAL RESULTS AND DISCUSSION
The results of the regression-based analysis are represented in Table 1 and Table 2. Shapiro-Wilk and
Breusch-Pagan tests have been successfully completed. All regressions are statistically significant.
The first model [see Table 1] shows that the intercept (β0) is insignificant in both cases. Therefore, the
impact of mergers and acquisitions on the observed variable is unascertained by the model. The H1
hypothesis is rejected at the first stage.
The second model [see Table 2] reveals a notable correlation between pre- and post-M&A ROS (the
first model also confirmed this), both for the European region and for the United States. This fact supports
the earlier implication, as based on the scatter plot analysis. Moreover, the rate of EVEQ is significant at
0.1 and it has a positive relationship with ROS after the deal in both cases.
Table 1
Model 1 OLS Regression results
Regression results (Europe) Regression results (USA)
Residuals Residuals
Min Q1 Median Q3 Max Min Q1 Median Q3 Max
-0.44459 -0.02973 0.01374 0.06404 0.29093 -0.94429 0.02493 0.03967 0.07347 0.22516
Coefficients Estimate Std. Error t-value Pr(>|t|) Coefficients Estimate Std. Error t-value Pr(>|t|)
Intercept 0.001433 0.025102 0.057 0.954667 Intercept 0.01129 0.02588 0.436 0.663806
Pre-M&A EBIT/Sales
0.558118 0.147984 3.771 0.000393 *** Pre-M&A
EBIT/Sales 0.42808 0.11758 3.641 0.000487
Residual Std. Error
0.1317 on 56 degrees of freedom Residual Std.
Error 0.1798 on 78 degrees of freedom
Multiple R-squared
0.2026 Multiple R-squared
0.1453
Adjusted R-squared
0.1883 Adjusted R-squared
0.1343
F-statistic 14.22 on 1 and 56 DF F-statistic 13.26 on 1 and 78 DF
p-value 0.0003932 p-value 0.0004868
Shapiro-Wilk normality test Shapiro-Wilk normality test
W 0.8603 W 0.7431
p-value 8.446e-06 p-value 1.604e-10
Studentised Breush-Pagan test Studentised Breush-Pagan test
BP 2.0441 BP 3.1915
df 1 df 1
p-value 0.1528 p-value 0.07402
Signif. Codes 0 '***' 0.001'**' 0.01'*' 0.05'.' 0.1' '
Method of payment, crisis and industry-relatedness coefficients differ depending on the region. For
the European deals, the “mixed” (significant at 0.05) and “stock” (significant at 0.01) methods of payment
turned out to be statistically significant and negatively correlated with the observed measure. The other
variables in the regression (European deals) were not statistically significant. However, the significance levels
of the “cash” method and industry relatedness in the European sample are close to 0.1. Thus, there is a high
probability that with an increase in the size of the sample, these variables will become significant. Thus, the
H2 hypothesis is confirmed.
In the US, all methods of payment are significant (at 0.05) with negative coefficients. The industry-
relatedness dummy is not statistically significant, while the model found a slight negative impact of crisis on
post-M&A ROS.
Journal of International Studies
Vol.13, No.2, 2020
44
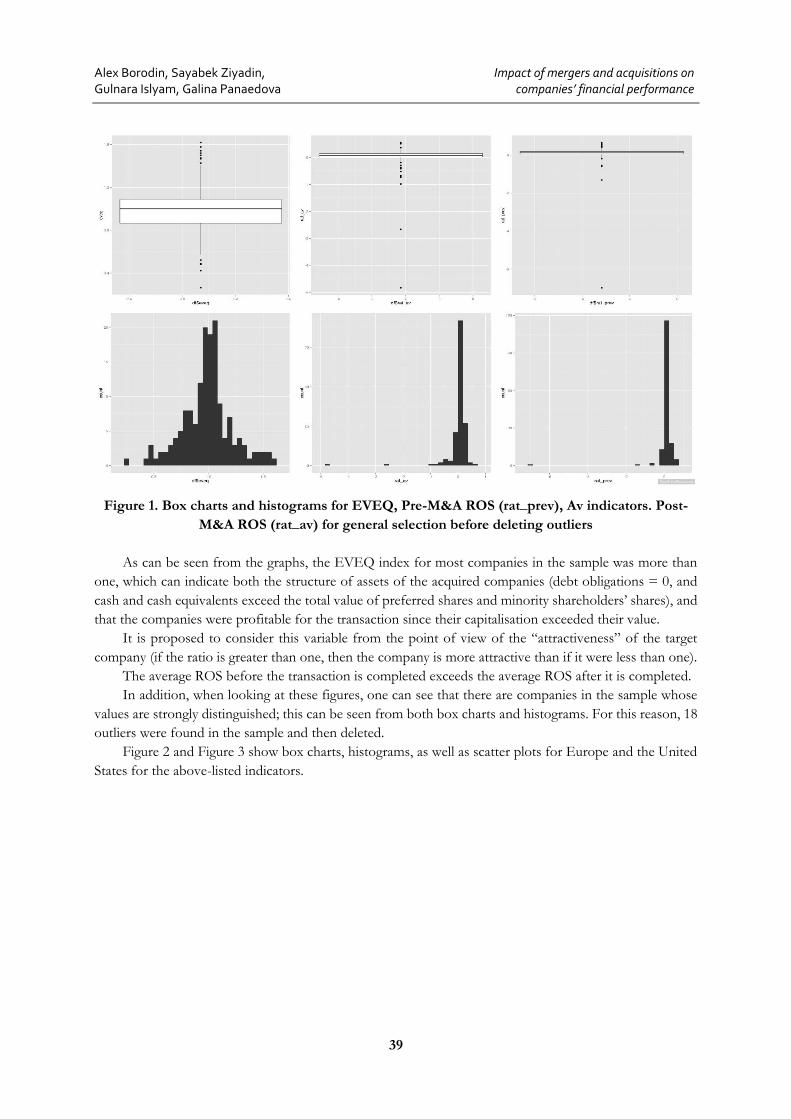
Table 2 Model 2 OLS Regression results
Regression results (Europe) Regression results (USA)
Residuals Residuals
Min Q1 Median Q3 Max Min Q1 Median Q3 Max
-0.35208 -0.06052 0.01899 0.08017 0.27195 -0.82257 -0.04782 0.04115 0.09103 0.25156
Coefficients Estimate Std.
Error t-value Pr(>|t|) Coefficients Estimate
Std. Error
t-value Pr(>|t|)
Pre-M&A EBIT/Sales 0.547 0.142 3.826 0.00035
*** Pre-M&A EBIT/Sales 0.456 0.118 3.842
0.00025 ***
Equity Value/Enterprise Value 0.239 0.107 2.221 0.03078 * Equity Value/Enterprise Value 0.284 0.107 2.640 0.01013*
Cash -0.151 0.108 -1.387 0.17135 Cash -0.208 0.120 -1.733 0.08735 .
Cash & Stock -0.187 0.108 -1.734 0.08891 . Cash & Stock -0.230 0.122 -1.877 0.06446.
Stock -0.236 0.116 -2.036 0.04699 * Stock -0.307 0.144 -2.132 0.03635 *
Crisis yes -0.029 0.036 -0.795 0.43040 Crisis yes -0.085 0.043 -1.971 0.05251.
Microindustry yes -0.050 0.033 -1.527 0.13283 Microindustry yes -0.023 0.040 -0.596 0.55269
Residual Std. Error 0.1254 on 51 degrees of freedom Residual Std. Error 0.1711 on 73 degrees of freedom
Multiple R-squared 0.4664 Multiple R-squared 0.362
Adjusted R-squared 0.3932 Adjusted R-squared 0.3008
F-statistic 6.368 on 7 and 71 DF F-statistic 5.918 on 7 and 73 DF
p-value 2.136e-05 p-value 1.814e-05
Shapiro-Wilk normality test Shapiro-Wilk normality test
W 0.9477 W 0.8297
p-value 0.0143 p-value 3.584e-08
Studentised Breush-Pagan test Studentised Breush-Pagan test
BP 11.4548 BP 9.9174
Df 6 df 6
p-value 0.0753 p-value 0.1282
Signif. Codes 0 '***' 0.001'**' 0.01'*' 0.05'.' 0.1' '
The results of the two Student’s t-tests are given in [Table 3]. The data here allows us to compare
changes in average ROS values before and after M&As. Both tests identified a deterioration in the difference
between pre-M&A and post-M&A ROS.
Thus, the results of these models and tests show a significant deterioration of ROS after M&As, despite
the fact that the majority of investigated corporations from the US or Europe retained positive ROSs. In
the US and in Europe, the EBIT-to-total revenue ratio average change was -6.8% and -5.3%, respectively.
The significance level and the sign of a coefficient EVEQ indicate that the increase of the
“attractiveness” of the target companies leads to an increase in ROS of the merged corporations after the
deal.
At the same time, without additional calculations one cannot draw further conclusions concerning the
relationship between the methods of payment used in the transactions and the financial performance of the
observed companies, as the model only allows the comparison of these methods with each other. In general,
when the acquirer finances the deal with “cash”, the productivity of the post-M&A corporation is greater
than for “stock” or “mixed” financing. This conclusion coincides with Betzer’s opinion (Betzer et al., 2014).
It can be assumed that the attractiveness of the “cash” method is due to the fact that it is often used by
prosperous companies that are able to generate abundant cash inflows.

Alex Borodin, Sayabek Ziyadin, Gulnara Islyam, Galina Panaedova
Impact of mergers and acquisitions on companies’ financial performance
45
Table 3
One-Sample t-test results for both regions
One Sample t-test (Europe) One Sample t-test (USA)
Country Pre-M&A
EBIT/Sales Av. Post-M&A
EBIT/Sales Country
Pre-M&A EBIT/Sales
Av. Post-M&A EBIT/Sales
EU 58 Min -0.2008 Min -0.4186 US 80 min -0.5430 min -0.6853 Q1 0.0456 Q1 0.0269 Q1 0.0547 Q1 0.0347 Median 0.1119 Median 0.0697 Median 0.1227 Median 0.0915 Mean 0.1229 Mean 0.0700 Mean 0.1387 Mean 0.0706 Q3 0.1654 Q3 0.1456 Q3 0.2186 Q3 0.1598 Max 0.5419 Max 0.5535 Max 0.6505 Max 0.3697
Summary (Av. Post-M&A EBIT/Sales - Pre-M&A EBIT/Sales for EU)
Summary (Av. Post-M&A EBIT/Sales - Pre-M&A EBIT/Sales for US)
Min -0.61770 Min -1.26400
Q1 -0.07374 Q1 -0.09665
Median -0.02828 Median -0.01430
Mean -0.05290 Mean -0.06803
Q3 0.02073 Q3 0.01909
Max 0.31140 Max 0.21830
Shapiro-Wilk normality test Shapiro-Wilk normality test
W 0.8303 W 0.6815
p-value 1.169e-06 p-value 6.963e-12
One Sample t-test One Sample t-test
T -2.8671 t -2.9839
Df 57 df 79
p-value 0.005796 p-value 0.003785
alternative hypothesis
true mean is not equal to 1 alternative hypothesis
true mean is not equal to 1
95 percent confidence interval
95 percent confidence interval
-0.08985263 -0.01595395 -0.11340641 -0.02264978
sample estimates sample estimates
mean of x -0.05290329 mean of x -0.0680281
Managerial implication
The findings can also be interpreted in the instance of management decisions. One of the most
important questions for top management is whether M&As are worthwhile or otherwise. The answer is
somewhat difficult to generalise, however, since each deal has its own particularities. When we talk about
the whole sample, the results show that in most cases the final companies remained profitable and, from
this perspective at least, M&As are worthwhile, though some companies that were profitable before the deal
became lossmakers in terms of ROS. It is also important to note that the decrease (in comparison to ROS
pre-M&A) of ROS post-M&A can be the result of various factors such as business reorganisation, crisis
(even if the model did not reveal its influence), business depression, etc., which can be offset in the long
term.
5. CONCLUSION
In conclusion, it should be noted that M&As are complex phenomena, and which have accordingly
been the subject of research for many years. Analysis of the fluctuations of financial activity related to M&A
transaction participants in the US and in other regions have shown that, today, seven distinct waves of such
can be identified, as characterised by the changes in the volumes of such transactions on a year-by-year
basis. Each of these cycles has its own time frame, which usually begins in times of economic recovery from
a crisis that marks the ending of the previous cycle. In addition, each wave is associated with the emergence

Journal of International Studies
Vol.13, No.2, 2020
46
or development of new characteristics of mergers and acquisitions or the emergence of new economically
sound reasons for pursuing them.
This paper investigates 138 cases of mergers and acquisitions committed between 2016 and 2018
between companies headquartered in either the US or Europe.
The results of the models and tests designed have shown that in both regions corporations that were
profitable before M&As maintained positive financial performance after the deals. Nevertheless, these
companies showed a significant deterioration in ROS after the implementation of mergers and acquisitions.
In addition, the first model constructed shows that mergers and acquisitions does not have a significant
effect on the profitability indicator of the selected companies.
It should be added that there is a significant but small impact on the ROS of the US companies, which
may explain a relatively greater reduction in efficiency in the US rather than in Europe.
As for methods of payment, the data shows that the use of the “cash” method typically leads to a
higher ROS after M&As than “mixed” or “stock” financing.
It is also important to note that a number of limitations were imposed on the analysis. These constraints
only allow us to draw conclusions concerning certain types of transactions.
REFERENCES
Andreu, L., Sarto, J.L. (2013). Financial consequences of mutual fund mergers. The European Journal of Finance.
Ayadi, R., & De Groen, W. (2014). Banking business models monitor 2014: Europe.
Balcerzak, A.P., Kliestik, T., Streimikiene, D., & Smrcka, L. (2017). Non-Parametric Approach to Measuring the
Efficiency of Banking Sectors in European Union Countries. Acta Polytechnica Hungarica, 14(7), 51-70.
Bena, J., & Li, K. (2014). Corporate innovations and mergers and acquisitions. The Journal of Finance, 69(5), 1923-1960.
Betzer, A., Doumet, M., Goergen, M. (2015). Disentangling the link between stock and accounting performance in
acquisitions. The European Journal of Finance, 21(9), 755-771.
Bilan, Y., Mishchuk, H., & Pylypchuk, R. (2017). Towards sustainable economic development via social
entrepreneurship. Journal of Security and Sustainability Issues, 6(4), 691-702. doi:10.9770/jssi.2017.6.4(13)
Blomson, D. M. (2016). Caveat Emptor: The Accountabilities and Required Actions of Directors in Securing Value
When Merging or Acquiring Companies. Paper 1 of 4: Review of Commercial or Practitioner M&A Literature
to See What Guidance this Provides Directors Involved in Transactions.
Cretin, F., Dieudonné, S., & Bouacha, S. (2015). M&A activity: Where are we in the cycle. Alternative Investment Analyst
Review, 38-44.
Campello, M., Matta, R., & Saffi, P. A. (2018). The rise of the equity lending market: implications for corporate
policies. Available at SSRN 2703318.
Domi, S., Keco, R., Capelleras, J. L., & Mehmeti, G. (2019). Effects of innovativeness and innovation behavior on
tourism SMEs performance: The case of Albania. Economics & Sociology, 12(3), 67-85.
Gabor, D. (2016). A step too far? The European financial transactions tax on shadow banking. Journal of European Public
Policy, 23(6), 925-945.
Grigorieva, S., & Petrunina, T. (2015). The performance of mergers and acquisitions in emerging capital markets: New
evidence. Journal of Management Control, 26(4), 377-403.
Kinateder, H., Fabich, M., & Wagner, N. (2017). Domestic mergers and acquisitions in BRICS countries: Acquirers
and targets. Emerging Markets Review, 32, 190-199.
Kokoulina, A.M. (2017). The impact of corporate governance on the likelihood of mergers and acquisitions. In
Achievements of University Science (pp. 127-132).
Kovacova, M., Kliestik, T., Valaskova, K., Durana, P., & Juhaszova, Z. (2019). Systematic review of variables applied
in bankruptcy prediction models of Visegrad group countries. Oeconomia Copernicana, 10(4), 743-772.
Mourdoukoutas, P. (2011). Do mergers and acquisitions enhance or destroy shareholders value?
Simionescu, M. (2016). The Competition between London companies regarding their financial performance. Journal of
Competitiveness, 8(2), 5-16, doi:10.7441/joc.2016.02.01

Alex Borodin, Sayabek Ziyadin, Gulnara Islyam, Galina Panaedova
Impact of mergers and acquisitions on companies’ financial performance
47
Simionescu, M., Lazányi, K., Sopková, G., Dobeš, K., & Balcerzak, A. P. (2017). Determinants of economic growth
in V4 countries and Romania. Journal of Competitiveness, 9(1), 103-116. doi:10.7441/joc.2017.01.07
Tang, A. C. (2015, March). Mergers and Acquisitions and its effects on firm Performance: A New Look. In Proceedings
of the DLSU Research Congress.
Uhlenbruck, K., Hughes-Morgan, M., Hitt, M. A., Ferrier, W. J., & Brymer, R. (2017). Rivals’ reactions to mergers and
acquisitions. Strategic Organization, 15(1), 40-66.
Zainol, N.R., Al Mamun, A., Ahmad, G., & Simpong, D. B. (2018). Human Capital and Entrepreneurial Competencies
towards Performance of Informal Microenterprises in Kelantan, Malaysia. Economics and Sociology, 11(4), 31-50.
doi:10.14254/2071-789X.2018/11-4/2.
Ziyadin, S., Streltsova, E., Borodin, A., Kiseleva, N., Yakovenko I., & Baimukhanbetova, E. (2019). Assessment of
investment attractiveness of projects on the basis of environmental factors. Sustainability, 11(9), 1-16.