
Impact of Media Related SIFs on QoE for H.265/HEVC Video ...
14
Abstract—Long term evolution (LTE) has distinguished itself compared to other mobile broadband technologies in its ability to handle the growth of video traffic that has become an important part of user’s mobile broadband experience. Growing trend of video consumption implies that that media-related system influence factors (SIFs) should be identified and well understood in order to determine how they affect the user’s quality of experience (QoE). Therefore, this paper aims to provide a deeper understanding of media-related SIFs and their impact on QoE for video streaming. Experimental study has included two phases, i.e., H.265/ high efficiency video coding (HEVC) coded video streaming emulation over LTE network and end-user survey for collecting mean opinion score (MOS). The original scientific contribution of this study and its results is twofold. For the first time it has been shown that there exists strong and statistically significant impact of media-related SIFs and their interactions on QoE for H.265/HEVC video streaming, and a quantification of relation between QoE and selected media-related SIFs, i.e., prediction model has been provided. The knowledge of these impacts and interactions, as well as prediction model, contributes to increase the awareness of and improvement of video streaming service. This leads to better understanding of end user’s QoE and provides a starting point for development of multidimensional QoE model. Index Terms—ANOVA; H.265; LTE; media-related SIF; MOS; QoE; video streaming. I. INTRODUCTION OBILE video traffic is the fastest growing segment of mobile data traffic driven by proliferation of smartphone subscriptions and increasing average data volume per subscription. Currently, video accounts for over 50% of all mobile traffic and is expected to increase to over 75% by the end of 2023 [1]. However, mobile video traffic forecast may be Manuscript received March 26, 2018; revised June 1, 2018 and June 13, 2018. Date of publication June 27, 2018. Prof. Nikola Rožić has been coordinating the review of this manuscript and approved it for publication. I. Osmanović is with the Systech, d.o.o. Sarajevo, 71217 Sarajevo, Bosnia and Herzegovina (e-mail: [email protected]). J. Baraković Husić is with the University of Sarajevo and BH Telecom, Joint Stock Company, Sarajevo, 71000 Sarajevo, Bosnia and Herzegovina (e- mail: [email protected]). S. Baraković is with the University of Sarajevo, American University in Bosnia and Herzegovina, and Ministry of Security of Bosnia and Herzegovina (e-mail: [email protected]). Digital Object Identifier (DOI): 10.24138/jcomss.v14i2.516 shifted by the appearance of new applications and changes in user behaviour. Millennials being born between early 1980s and the early 2000s [1] play a crucial role in shaping mobile video traffic consumptions. Leading the change in video consumption trends, millennials have high expectations on network performance. This suggests that telecom operators need to focus on how to meet the expectations of this user segment without ignoring the fact that networks need to be designed to support mobile video [2]. Therefore, discussion about mobile video traffic growth is usually directed towards long-term evolution (LTE). This technology has distinguished itself compared to other mobile broadband technologies in its ability of handle growing volume of video traffic. Apart from need to understand the impact that video traffic growth will have on their networks, telecom operators have to shift from technical quality requirements to user quality of experience (QoE) [3]. QoE is influenced by service, content, device, application, and context of use [4]. Therefore, it is necessary to identify and understand multiple influence factors (IFs) in the service delivery chain, and determine how they affect QoE [5]. This is an essential prerequisite for QoE management, which determines the parameters to be monitored and measured, and finally used to develop, test, and implement the QoE control and optimization strategies [6]. In this regard, IF has been defined as any feature of a user, system, service, application, or content whose current state or features affect QoE [4]. Currently adopted classification divides IFs into three categories [4]: human, context, and system IFs. This paper deals with the system IFs (SIFs) referring to features that determine the technically produced quality of service. SIFs are further divided into four sub-categories [4]: content-, media-, network-, and device-related SIFs. Here the focus is on media-related SIFs whose optimization enables the same level of subjective quality with significant savings in network infrastructure. More specifically, this paper aims to provide deeper and more comprehensive understanding of media configuration parameters and their impact on QoE in the context of video streaming over LTE given that, according to the related work provided in the following section, there is a limited number of papers dealing with this challenge. In this regard, video coding H.265/ high efficiency video coding (HEVC) is used as compression standard since it provides the best quality and performance compared to other codecs [7]. In order to accomplish abovementioned aim, we have performed Impact of Media-Related SIFs on QoE for H.265/HEVC Video Streaming Irma Osmanović, Jasmina Baraković Husić, Member, IEEE and Sabina Baraković M JOURNAL OF COMMUNICATIONS SOFTWARE AND SYSTEMS, VOL. 14, NO. 2, JUNE 2018 157 1845-6421/06/516 © 2018 CCIS
Transcript of Impact of Media Related SIFs on QoE for H.265/HEVC Video ...

Abstract—Long term evolution (LTE) has distinguished itself
compared to other mobile broadband technologies in its ability to
handle the growth of video traffic that has become an important
part of user’s mobile broadband experience. Growing trend of
video consumption implies that that media-related system
influence factors (SIFs) should be identified and well understood
in order to determine how they affect the user’s quality of
experience (QoE). Therefore, this paper aims to provide a deeper
understanding of media-related SIFs and their impact on QoE for
video streaming. Experimental study has included two phases, i.e.,
H.265/ high efficiency video coding (HEVC) coded video
streaming emulation over LTE network and end-user survey for
collecting mean opinion score (MOS). The original scientific
contribution of this study and its results is twofold. For the first
time it has been shown that there exists strong and statistically
significant impact of media-related SIFs and their interactions on
QoE for H.265/HEVC video streaming, and a quantification of
relation between QoE and selected media-related SIFs, i.e.,
prediction model has been provided. The knowledge of these
impacts and interactions, as well as prediction model, contributes
to increase the awareness of and improvement of video streaming
service. This leads to better understanding of end user’s QoE and
provides a starting point for development of multidimensional
QoE model.
Index Terms—ANOVA; H.265; LTE; media-related SIF;
MOS; QoE; video streaming.
I. INTRODUCTION
OBILE video traffic is the fastest growing segment of
mobile data traffic driven by proliferation of
smartphone subscriptions and increasing average data volume
per subscription. Currently, video accounts for over 50% of all
mobile traffic and is expected to increase to over 75% by the
end of 2023 [1]. However, mobile video traffic forecast may be
Manuscript received March 26, 2018; revised June 1, 2018 and June 13,
2018. Date of publication June 27, 2018. Prof. Nikola Rožić has been
coordinating the review of this manuscript and approved it for publication. I. Osmanović is with the Systech, d.o.o. Sarajevo, 71217 Sarajevo, Bosnia
and Herzegovina (e-mail: [email protected]).
J. Baraković Husić is with the University of Sarajevo and BH Telecom, Joint Stock Company, Sarajevo, 71000 Sarajevo, Bosnia and Herzegovina (e-
mail: [email protected]).
S. Baraković is with the University of Sarajevo, American University in Bosnia and Herzegovina, and Ministry of Security of Bosnia and Herzegovina
(e-mail: [email protected]).
Digital Object Identifier (DOI): 10.24138/jcomss.v14i2.516
shifted by the appearance of new applications and changes in
user behaviour. Millennials being born between early 1980s and
the early 2000s [1] play a crucial role in shaping mobile video
traffic consumptions. Leading the change in video consumption
trends, millennials have high expectations on network
performance. This suggests that telecom operators need to focus
on how to meet the expectations of this user segment without
ignoring the fact that networks need to be designed to support
mobile video [2]. Therefore, discussion about mobile video
traffic growth is usually directed towards long-term evolution
(LTE). This technology has distinguished itself compared to
other mobile broadband technologies in its ability of handle
growing volume of video traffic. Apart from need to understand
the impact that video traffic growth will have on their networks,
telecom operators have to shift from technical quality
requirements to user quality of experience (QoE) [3].
QoE is influenced by service, content, device, application,
and context of use [4]. Therefore, it is necessary to identify
and understand multiple influence factors (IFs) in the service
delivery chain, and determine how they affect QoE [5]. This is
an essential prerequisite for QoE management, which
determines the parameters to be monitored and measured, and
finally used to develop, test, and implement the QoE control
and optimization strategies [6]. In this regard, IF has been
defined as any feature of a user, system, service, application,
or content whose current state or features affect QoE [4].
Currently adopted classification divides IFs into three
categories [4]: human, context, and system IFs. This paper
deals with the system IFs (SIFs) referring to features that
determine the technically produced quality of service.
SIFs are further divided into four sub-categories [4]:
content-, media-, network-, and device-related SIFs. Here the
focus is on media-related SIFs whose optimization enables the
same level of subjective quality with significant savings in
network infrastructure. More specifically, this paper aims to
provide deeper and more comprehensive understanding of
media configuration parameters and their impact on QoE in
the context of video streaming over LTE given that, according
to the related work provided in the following section, there is a
limited number of papers dealing with this challenge. In this
regard, video coding H.265/ high efficiency video coding
(HEVC) is used as compression standard since it provides the
best quality and performance compared to other codecs [7]. In
order to accomplish abovementioned aim, we have performed
Impact of Media-Related SIFs on QoE for
H.265/HEVC Video Streaming
Irma Osmanović, Jasmina Baraković Husić, Member, IEEE and Sabina Baraković
M
JOURNAL OF COMMUNICATIONS SOFTWARE AND SYSTEMS, VOL. 14, NO. 2, JUNE 2018 157
1845-6421/06/516 © 2018 CCIS
FESB
Typewritten Text
Original scientific paper
FESB
Typewritten Text

an experimental study that includes end-user survey to collect
mean opinion score (MOS) grades for video streaming over
LTE which are further processed by statistical method general
linear model (GLM): analysis of variance (ANOVA) [8]. In
addition, taking into account the results of previous major
studies, summarized in detail in the following section, we have
concluded that what is also missing is the quantification of
impacts of media configuration parameters on QoE for video
streaming. That is why we have produced a prediction model
quantifying the aforementioned relations between the selected
media-related SIFs and QoE (shown in MOS) by using
multiple linear regression (MLR) technique.
In general, there are many approaches, which attempt to
solve many problems in data analysis, such as statistics,
machine learning, or neural networks. However, the suitability
of given approaches to the problem depends on the nature of
the problem, i.e., the nature of the desired output results.
Researchers analyse their data by using different modelling
techniques depending on: (i) the aim of the study; (ii) types of
models that one wants to obtain; (iii) the number of dependent
and independent variables (single or multiple) that are
considered; as well as (iv) the nature of variables. Hence,
focusing only on studies that deal with user gained results such
as MOS, i.e., QoE is, the authors have mostly used statistical
techniques that range from simple descriptive statistics to
more complex methods, such as various types of linear and
non-linear regressions.
We have chosen ANOVA and MLR for achieving two
different goals in this paper. The first one was to find out how
QoE is related to the selected media-related SIFs, and whether
the interactions of these factors impact QoE. ANOVA test was
found to be suitable for this objective, as described in [8, ch
1]. The second one was to quantify the relation between QoE
and the selected media-related SIFs. In other words, we
wanted to find out how our numerical QoE (expressed in
MOS) is related to the selected predictor variables which are
numerical. MLR statistical technique has shown to be the right
approach after consulting [8, ch 1]. In addition, GLM has one
more technique - analysis of covariance (ANCOVA) which
can be used to describe how a numerical dependent variable is
related to categorical independent variables and numerical
predictor variables at the same time [8, ch 1]. Since this is not
the case in our study, this method of analysis has not be
considered.
Therefore, the original scientific contribution of this study
and its results is twofold. Firstly, it has been shown that the
impact of media-related SIFs and their mutual interactions on
QoE for H.265/HEVC video streaming is strong and
statistically significant. Secondly, the relationship between
selected media-related SIFs and QoE for H.265/HEVC video
streaming is quantified, i.e., we have obtained a prediction
equation model. According to the authors’ best knowledge
after reviewing the literature (Section II), this is the first time
that the description and quantification of abovementioned
relations has been provided in such a manner. Consequently,
based on the proposed model, one is able to identify the
importance of distinct media-related SIFs in terms of QoE.
Also, the model indicates and justifies the need for
multidimensional approach to QoE in order for this important
concept to be addressed properly [5, 6]. The knowledge gained
from this study and obtained results may contribute to the
interested stakeholders to: (i) become aware of these impacts
and interactions, (ii) improve video streaming service, which
leads to better end user’s QoE, and (iii) provide the basis for
future multidimensional QoE model which will help in better
QoE management process.
The rest of the paper is organized as follows. Section II
presents the related work considering media-related SIFs and
their impact on QoE for video streaming over LTE network.
Section III describes the experimental study, which includes
two phases, i.e., video streaming emulation over LTE network
and end-user survey for collecting MOS grades. Section IV
presents and discusses experimental results obtained from
statistical analyses. Section V concludes the paper with an
outlook on open issues.
II. RELATED WORK
This section provides a non-exhaustive review of research
activities directed to media-related SIFs and their impact on
QoE for video streaming. Being a measure of the delight or
annoyance of user with a given service [4], QoE is affected
among others [9-11] by media-related SIFs. They refer to
different media configuration parameters, such as coding,
bitrate, resolution, sampling rate, frame rate, media
synchronization, etc. Here we discuss their impact on the
quality perception of H.265/HEVC video streaming. Table I
summarizes the related work considering the mutual impact of
multiple media-related SIFs on subjective/objective quality
perception of video streaming.
Video coding affects the quality perception of video
streaming as stated in literature [12-31]. A variety of video
coding standards have been analysed in this context, such as
H.264/ advanced video coding (AVC) or H.265/HEVC. It has
been shown that H.265/HEVC allows 50% higher
compression than its predecessor H.264/AVC without changes
in subjective quality perception [23, 24, 32, 33]. In addition, it
has been realized that H.265/HEVC has 6dB higher peak
signal to noise ratio (PSNR) than H.264/AVC due to variable
length of code blocks [24, 25]. Furthermore, H.265/HEVC
enables a higher degree of variation of codec parameters, such
as coding block size, motion vector size, etc. in order to
increase network resource savings while keeping the same
quality degree [18, 19, 23]. Therefore, this codec has been
chosen as video compression standard in our experimental
study.
Impact of video coding on the quality perception has been
usually analysed in relation to bitrate and resolution. Higher
bitrate enables higher degree of user satisfaction [16, 34], but
also requires higher resolution and more network resources
which can be challenging when bandwidth is limited [15, 21].
Furthermore, bitrate is related to the transmission efficiency.
Simulation of video transmission with different resolutions has
shown that higher resolution means higher quality [12, 20, 21,
158 JOURNAL OF COMMUNICATIONS SOFTWARE AND SYSTEMS, VOL. 14, NO. 2, JUNE 2018

24, 26, 28], but also requires more bits to transmit through a
network.
In addition, low frame rate decreases the video quality
perception [16, 21, 22, 26, 28], while high frame rate increases
the quality only to a certain extent. Frame rate depends on
many SIFs, such as dynamics of video movement or network
conditions [13, 14, 35] which should be considered in video
adaptation [18]. Furthermore, high sampling rate increases the
quality perception, but requires more resources and processing
time. Therefore, it is necessary to take care of the price-quality
ratio to find their optimal relationship [15, 28, 31].
Aforementioned media-related SIFs have been manipulated
at different levels in order to describe their impact on quality
perception of the given service. In order to measure quality
perception of video streaming service, subjective and objective
quality assessment can be used. Considering the related work
summarized in Table I, one can conclude that video quality
perception has been measured using subjective quality
assessment (45%), objective quality assessment (35%), and
both of them (20%). Although it is more complicated,
subjective quality assessment has been selected for our
experimental study since it provides more reliable results
compared to the objective one. Accordingly, subjective quality
metric, i.e. mean opinion score (MOS), is used to express the
user’ quality perception, while the objective ones, such as
PSNR, structural similarity (SSIM), or video quality metric
(VQM), are not considered in our experimental study.
Considering the aim of this paper, the related work review
focuses on the identification of media-related SIFs and their
impact on subjective/objective quality perception of video
streaming service. Summarizing the related work presented in
Table I, one may conclude that video quality perception has
been analysed in terms of frame rate (29%), bitrate (25%),
resolution (23%), codec (12%), sampling rate (6%), and media
synchronization (2%). However, previous research studies
have neglected to consider the simultaneous impact of these
media-related SIFs on the quality perception of video
streaming service, which can be explained by the complexity
that such studies incur. Also, existing studies missed to
quantify QoE and its relation to media-related SIFs in this
context. Therefore, this paper intends to provide deeper and
more comprehensive understanding of selected media-related
SIFs and their interactions in the context of quality perception
of video streaming, together with their quantification, i.e.,
modelling. Although H.265/HEVC is the most effective video
compression standard [32], it has received not nearly as much
attention as its predecessor H.264/AVC. This motivated us to
investigate the impact of media-related SIFs and their
interactions on QoE in the context of H.265/HEVC coded
video streaming.
III. RESEARCH METHODOLOGY
Based on the literature review summarized in previous
section, the objectives of this paper can be derived as follows:
(i) examination of impact of media-related SIFs and their
interactions on the QoE for H.265/HEVC video streaming;
and (ii) quantification of relation between media-related SIFs
and QoE for H.265/HEVC video streaming.
According to Table I, one can conclude that quality perception
of H.265/HEVC video streaming has been usually analysed in
terms of bitrate and resolution. This is the reason why we have
selected these media-related SIFs to be our main research focus
with addition of compression artefacts that were discussed in [36].
As shown in Table II, these media-related SIFs can be
manipulated by changing ffmpeg-specific parameters [37], i.e.,
resolution, coding tree unit (CTU), and, constant rate factor
(CRF). Accordingly, seven hypotheses have been formulated and
tested by using appropriate statistical methods.
H1: The differences in QoE for video streaming caused by
the change in resolution are not statistically significant.
H2: The differences in QoE for video streaming caused by
the change in CTU parameter are not statistically significant.
H3: The differences in QoE for video streaming caused by
the change in CRF parameter are not statistically significant.
H4: The differences in QoE for video streaming caused by
the change in interaction between resolution and CTU
parameter are not statistically significant.
H5: The differences in QoE for video streaming caused by
the change in interaction between resolution and CRF
parameter are not statistically significant.
H6: The differences in QoE for video streaming caused by
the change in interaction between CTU and CRF parameters
are not statistically significant.
H7: The differences in QoE for video streaming caused by
the change in interaction of resolution, CTU, and CRF
parameters are not statistically significant.
The aforementioned hypothesis are formed in the way that
we do not expect the existence of statistically significant
impact of individual ffmpeg parameters (i.e., resolution, CTU,
and CRF) and their interactions on QoE. The reason for such
hypotheses formulations comes from the rules of GLM:
ANOVA statistical test (p>0.05), according to which the null
hypothesis for the test is that the all means are equal (i.e., no
difference between them). However, it is expected to have
statistically significant impacts of individual parameters and
their interactions on QoE (p<0.05) because considered ffmpeg
parameters affect the media-related SIFs and consequently
influence the QoE.
In general, the ANOVA, as one of GLM techniques, refers
to statistical models and associated procedures in which the
observed variance is partitioned into components due to
different explanatory variables. In other words, the purpose of
ANOVA is to test for significant differences between two or
more means which are symbolized by μ. The null hypothesis
in ANOVA test (H0) is that all the population group means are
equal (1) versus the alternative one (Ha) that at least one of the
population means differs from the others (2):
𝐻0: 𝜇1 = 𝜇2 = ⋯ = 𝜇𝑛 (1)
𝐻𝑎: 𝑛𝑜𝑡 𝑎𝑙𝑙 𝜇𝑖 (𝑖 = 1, ⋯ , 𝑛) 𝑎𝑟𝑒 𝑒𝑞𝑢𝑎𝑙 (2)
However, in order to conduct the ANOVA test, one must
test the data for basic assumptions: (i) normal distribution, i.e.,
J. BARAKOVIĆ HUSIĆ et al.: IMPACT OF MEDIA-RELATED SIFs ON QoE FOR H.265/HEVC 159

the dependent variable must be normally distributed for each
category of the independent variable; (ii) independence, i.e.,
cases must be independent; and (iii) homoscedasticity, i.e.,
variances of data are the same in all the groups (homogeneity
of variance assumptions). More on this statistical analysis, one
may find in the work of [8].
As stated earlier, we expect to have significant impacts of
selected media-related SIFs on QoE for video streaming, and
therefore, our eighth hypothesis which is related to
quantification of those impacts is formulated as follows:
H8: QoE for video streaming is impacted by the following
media-related SIFs according to the listed order, going from
most to least influential: CTU, CRF, and resolution.
To describe the relationship between QoE and selected
factors and whether the variability of QoE is explained by the
variability of these factors and to which degree, a MLR analysis
with three media-related SIFs as predictors was performed.
Multiple linear regression is a statistical technique that
allows the prediction of someone’s score of one variable on
the basis of their scores on several other variables. This
technique allows the identification of set of predictor variables
which together provide a useful estimate of a participant’s
likely score on a dependent variable. In other words, one may
use MLR to test and develop theories and models about
precisely which set of variables is influencing our behaviour.
The basic idea or MLR method is that an equation is found,
such as follows:
𝑦𝑖 = 𝛽0 + 𝛽1𝑥𝑖1 + 𝛽2𝑥𝑖2 + ⋯ + +𝛽𝑗𝑥𝑖𝑗 + ⋯ + +𝛽𝑝𝑥𝑖𝑝 + 𝜀𝑖, (3)
where i=1 to n is a set of observations where each observation
was selected because of its specific x-values, i.e., the values of
p (j=2 to p) predictor variables 𝑥1, 𝑥2, …, 𝑥𝑗,…, 𝑥𝑝 that were
fixed by the investigator, whereas the y-value for each
observation was sampled from a population of possible y-
values, 𝛽0 is the intercept, 𝛽𝑗 are regression coefficients, and 𝜀𝑖
is the error term.
How well the equation fits the data is expressed by the
coefficient of multiple determination, i.e., R2. The definition of
coefficient of determination is straight-forward; it is the
percentage of the dependent variable variation that is explained
by a linear model. It is calculated by using the following
formula:
𝑅2 = 1 −Σ𝑖(𝑦𝑖−��𝑖
)2
Σ𝑖(𝑦𝑖−��)2 , (4)
where y is the observation of dependent variable, �� is the mean
of the observation, and ��𝑖 is the prediction of the dependent
variable.
This coefficient may range from 0, which means there is no
relationship between the predictor and dependent variable, to
1, which means a perfect fit and that there is no difference
between the observed and expected values of dependent
variable. In general, the higher R2 is, the better the model fits
the data. However, in practice, researchers usually use the
adjusted R2 that is only the adjustment of R2 that penalizes the
addition of extraneous predictors to the model. As it is the case
with ANOVA, in order to perform the analysis, the collected
data needs to satisfy the MLR assumptions: (i) normal
distribution, i.e., the dependent variable must be normally
distributed for each category of the independent variable; (ii)
independence, i.e., cases must be independent; and (iii)
homoscedasticity, i.e., variances of data are the same in all the
groups (homogeneity of variance assumptions).
In order to obtain the data necessary to examine the impact
of ffmpeg parameters (i.e., resolution, CTU, and CRF) on
QoE, the experimental study has been performed. The
experimental procedure included two phases as shown in Fig
1: (i) video streaming emulation over LTE, and (ii) end-user
survey with the aim of collecting MOS values.
A. Video Streaming Emulation over LTE
The first phase involves three steps: (i) preparation of
reference and test video sequences, (ii) configuration of LTE
emulation environment, and (iii) reconstruction of test video
sequences.
To perform this experimental study, we used San Francisco
Cable Car Stock video clip in .mp4 format [38]. This video clip
is characterized by duration of 39 seconds, resolution of
1920×1080 pixels, and frame rate of 30 fps. Audio content was
removed from original video clip, which was shortened to 20
seconds. The selected media-related SIFs (i.e., resolution,
bitrate, and compression) were manipulated according to the
possibilities of the ffmpeg tool [37]. Each ffmpeg parameter is
related to specific media-related SIF or a combination of those
factors. Definition of ffmpeg parameters and their relation to
media-related SIFs are presented in Table II. A total of 27 video
sequences were created based on the variation and combination
of the ffmpeg parameters, i.e., resolution (858×480, 1280×720,
1280×960), CTU (16, 32, 64), and CRF (18, 28, 38).
These video sequences were used for video streaming
emulation over LTE, which was performed in LTE/EPC
network simulator (LENA) using EvalVid framework. LENA
represents LTE module of open source network simulator 3 (ns-
3) [39], which enables modelling of different communication
networks and flexible user interfaces, modularity and scalability
of architecture based on C++ and Python. LENA allows design
and evaluation of the performance of uplink and downlink
routers, radio resource management algorithms, intercellular
interference solutions, mobility management, and end-to-end
QoE [40]. As such, it was used to generate network topology for
video streaming. EvalVid was used as a tool to allow video
streaming emulation and evaluation of its quality [41].
Emulation network topology is shown in Fig. 2. It consists of
user equipment (UEs), eNodeB (eNB) in LTE radio access
network, packet data network – gateway (PGW) in evolved
packet core (EPC) network, and video server denoted as remote
host. Table III summarizes configuration parameters of radio
link (i.e., connection between UEs and eNodeB) and peer-to-
peer (p2p) link (i.e., connection between PGW and remote
host). Network configuration parameters correspond to the
macro base station [42], whereas carrier frequencies correspond
to the European bandwidth [43]. Other LTE network
parameters are set to ns-3 default values [39]. Video sequences
160 JOURNAL OF COMMUNICATIONS SOFTWARE AND SYSTEMS, VOL. 14, NO. 2, JUNE 2018

TABLE I
SUMMARY OF RELATED WORK CONSIDERING THE IMPACT OF MEDIA-RELATED SIFS ON QOE FOR VIDEO STREAMING.
Authors/ Reference Media-related
SIFs Codec Resolution
Bitrate
[kbps]
Frame rate
[fps]
Quality
assessment
Quality
metrics
A. Aqil et al. [12] resolution
bitrate H.264
320×200
640×350
1280×720
1920×1080
111, 236, 293,
619, 802,
1174, 2433,
4656
- objective PSNR
A. Khan et al. [13] frame rate
bitrate MPEG-4 176×144
18, 44, 80,
104, 512 10, 15, 30
subjective
objective
MOS
PSNR
A. Khan et al. [14] frame rate
bitrate H.264/AVC 176×144
48, 88, 128,
90, 130, 200, 256
7.5, 10, 15 subjective objective
MOS PSNR
A.Vakili and J.C.
Grégorie [15]
frame rate
bitrate H.264 176×144 - 5, 10, 15, 30 subjective MOS
C. Alberti et al. [16]
frame rate
bitrate
sampling rate
MPEG-4
AVC 1280×720 0.5, 1, 2, 4, 8 7, 10, 15, 30 subjective MOS
D. Hammerschmidt and C. Wöllner [17]
resolution
frame rate synchronization
H.264
320×240
480×360 1280×720
- 24, 30 subjective [-3, 3]
D. Vranješ et al. [18]
resolution
frame rate
bitrate
codec
H.264/AVC
SVC
WSVC
320×180
640×360
1280×720
520, 768,
1024, 3048
6.25, 12.5, 25,
50 objective
SSIM
MS-SSIM
VQM
VSNR
PSNR
I. Silvar et al. [19] frame rate
bitrate H.264 1280×720
3000, 5000, 10000
15, 20, 25, 30 subjective MOS
J. Joskowicz and J. Ardao
[20]
resolution
bitrate
codec
MPEG-2
H.264/AVC
720×576
640×480
352×288
176×144
[25, 12000] 25 subjective MOS
J. Joskowicz and J. Ardao
[21]
resolution
frame rate bitrate
H.264/AVC
720×576
640×480
352×288 176×144
[25, 6000] 6.25, 12.5, 5,
25 subjecitve MOS
J. Joskowicz et al. [22]
resolution
bitrate
codec
MPEG-2
H.264/AVC
720×576
640×480
352×288
176×144
[50, 12000] 25 subjective MOS
J. R. Ohm et al. [23]
resolution
frame rate
codec
H.262/MPEG-
2 MT MPEG-4 ASP
H.263 CHC
MPEG-4
Visual
H.264/MPEG-
4 AVC
HEVC MP
2560×1000
1920×1080
832×480
416×240
1280×720
- 24, 30, 50, 60 subjective
objective
MOS
PSNR
M. Řeřábek et al. [24]
resolution frame rate
bitrate
codec
H.265/HEVC
VP9
H.264/AVC
1280×720
1920×1080
256, 384, 512, 850, 1000,
1600, 2000,
2500, 3000,
4500
30, 50, 60 subjective
objective
MOS
PSNR
M. Uhrina et al. [25] bitrate
codec
H.265/HEVC
H.264/AVC 3840×2160 [2000, 30000] 30 objective
PSNR
SSIM
VQM
P. McDonagh et al. [26] resolution
frame rate H.264 SVC
704×576
352×280
176×144
- 7.5, 15, 30 objective
PSNR SSIM
blocking
blurring
P. Seeling and M.
Reisslein [27]
bitrate
codec
H.265/HEVC
H.264/AVC 1920×1080 [1000, 50000] 24, 30 objective PSNR
R. M. Naisri et al [28]
resolution
frame rate sampling rate
H.264 1920×1080
640×480 -
5, 10, 15, 30,
45, 60 subjective MOS
T. Zinner et al. [29] resolution
frame rate H.264 SVC
480×270
640×360
960×540
1216×684
- 1.875, 3.75,
7.5, 15, 30 objective
VQM
SSIM
W. Songi and W.D.
Tjondronegoro [30]
resolution
frame rate H.264/AVC ≥1280×720 >3500 12.5, 25 objective
PSNR
VQM
SSIM
Y. F. Ou et al. [31] frame rate
sampling rate H.264 SVC 352×288 -
1.875, 3.75,
7.5, 15, 30 subjective MOS
Legend: ASP (Advanced Simple Profile); AVC (Advanced Video Coding); CHC (Conversational High Compression); HEVC (High Efficiency Video Coding); MOS (Mean Opinion Score);
MP (Main Profile); MS-SSIM (Multi-Scale SSIM); MPEG (Moving Picture Experts Group); MT (Multi-Threaded); SIF (System Influence Factors); SSIM (Structural Similarity); SVC
(Scalable Video Coding); PSNR (Peak Signal to Noise Ratio); VQM (Video Quality Metric); VSNR (Visual Signal-to-Noise Ratio); WSVC (Wireless Scalable Video Coding).
J. BARAKOVIĆ HUSIĆ et al.: IMPACT OF MEDIA-RELATED SIFs ON QoE FOR H.265/HEVC 161
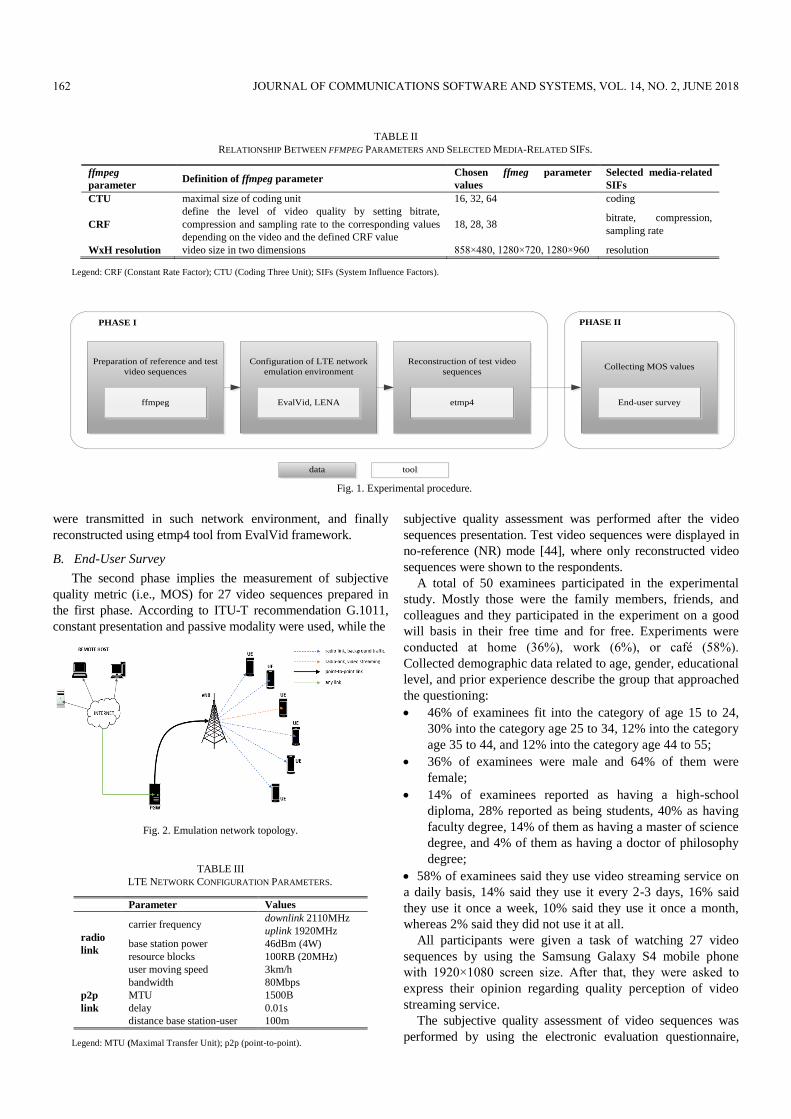
TABLE II
RELATIONSHIP BETWEEN FFMPEG PARAMETERS AND SELECTED MEDIA-RELATED SIFS.
ffmpeg
parameter Definition of ffmpeg parameter
Chosen ffmeg parameter
values
Selected media-related
SIFs
CTU maximal size of coding unit 16, 32, 64 coding
CRF
define the level of video quality by setting bitrate,
compression and sampling rate to the corresponding values
depending on the video and the defined CRF value
18, 28, 38 bitrate, compression,
sampling rate
WxH resolution video size in two dimensions 858×480, 1280×720, 1280×960 resolution
Legend: CRF (Constant Rate Factor); CTU (Coding Three Unit); SIFs (System Influence Factors).
Preparation of reference and test
video sequences
ffmpeg
Configuration of LTE network
emulation environment
EvalVid, LENA
Reconstruction of test video
sequences
etmp4
PHASE I
Collecting MOS values
End-user survey
PHASE II
tooltooldata
Fig. 1. Experimental procedure.
were transmitted in such network environment, and finally
reconstructed using etmp4 tool from EvalVid framework.
B. End-User Survey
The second phase implies the measurement of subjective
quality metric (i.e., MOS) for 27 video sequences prepared in
the first phase. According to ITU-T recommendation G.1011,
constant presentation and passive modality were used, while the
Fig. 2. Emulation network topology.
TABLE III
LTE NETWORK CONFIGURATION PARAMETERS.
Parameter Values
radio
link
carrier frequency downlink 2110MHz
uplink 1920MHz
base station power 46dBm (4W)
resource blocks 100RB (20MHz)
user moving speed 3km/h
p2p
link
bandwidth 80Mbps
MTU 1500B
delay 0.01s
distance base station-user 100m
Legend: MTU (Maximal Transfer Unit); p2p (point-to-point).
subjective quality assessment was performed after the video
sequences presentation. Test video sequences were displayed in
no-reference (NR) mode [44], where only reconstructed video
sequences were shown to the respondents.
A total of 50 examinees participated in the experimental
study. Mostly those were the family members, friends, and
colleagues and they participated in the experiment on a good
will basis in their free time and for free. Experiments were
conducted at home (36%), work (6%), or café (58%).
Collected demographic data related to age, gender, educational
level, and prior experience describe the group that approached
the questioning:
46% of examinees fit into the category of age 15 to 24,
30% into the category age 25 to 34, 12% into the category
age 35 to 44, and 12% into the category age 44 to 55;
36% of examinees were male and 64% of them were
female;
14% of examinees reported as having a high-school
diploma, 28% reported as being students, 40% as having
faculty degree, 14% of them as having a master of science
degree, and 4% of them as having a doctor of philosophy
degree;
58% of examinees said they use video streaming service on
a daily basis, 14% said they use it every 2-3 days, 16% said
they use it once a week, 10% said they use it once a month,
whereas 2% said they did not use it at all.
All participants were given a task of watching 27 video
sequences by using the Samsung Galaxy S4 mobile phone
with 1920×1080 screen size. After that, they were asked to
express their opinion regarding quality perception of video
streaming service.
The subjective quality assessment of video sequences was
performed by using the electronic evaluation questionnaire,
162 JOURNAL OF COMMUNICATIONS SOFTWARE AND SYSTEMS, VOL. 14, NO. 2, JUNE 2018

which contained the part that was completed at the beginning of
the experiment, and it included questions that covered
information related to examinee’s personal data and prior
experience with video streaming service, and the part that deals
with the examinee’s ratings of the statement related to overall
QoE when using video streaming service. The latter statement
was a simple MOS scale used as the de facto standard in QoE
studies and specified in ITU-T Recommendation P.800.1.
The experiment procedure lasted about 30 minutes and
included the following three steps [45]: (i) introduction and
clarification of the experiment tasks that need to be performed
by the examinee (5 minutes), (ii) examinee training (5
minutes), and (iii) testing and rating of video sequences (20
minutes). Video sequences have been displayed in the
landscape mode and in the same order to all examinees. All
examinees were asked not to think about their feelings during
evaluation, but to be intuitive.
IV. RESULTS AND DISCUSSION
In order to statistically analyse the set of hypotheses (H1-
H7) stating that difference in QoE for video streaming over
LTE caused by the change in individual parameters (i.e.,
resolution, CTU, and CRF) and their interactions are not
statistically significant, we used the three-way ANOVA [8]. A
three-way ANOVA has been conducted with MOS as a
dependent variable (DV), and resolution, CTU, and CRF as
independent variables (IV). The analysis has been performed
by using the trial version of the Statistical Package for the
Social Sciences (SPSS) Statistics 20 software [46].
As stated in the Introduction section, we have used
ANOVA given that we wanted to find out how our numerical
DV, i.e., QoE in MOS is related to our three categorical IVs
(CTU, CRF, and resolution) and that is exactly what this
statistical method is for, as described in [8, ch 1]. Further, for
testing our eighth hypothesis we decided to use the MLR,
given that we want to find out how our numerical DV is
related to our several predictor variables which are numerical.
The collected data satisfies the presumptions of ANOVA
(i.e., normally distributed variables, independent observations,
and homogeneity). In order to assess the assumption that the
residuals are normally distributed, we plotted the normal
probability plots and presented it in Fig. 3. In this plot, the
ordered values of the standardized residuals are plotted against
the expected values from the standard normal distribution. If
the residuals are normally distributed, they should lie,
approximately, on the diagonal, as it is the case [47]. Next, in
order to test the data for independence, we calculated the
Durbin-Watson statistics that is used to test the presence of
serial correlation among the residuals. The value of Durbin-
Watson statistic ranges from 0 to 4. As a general rule of
thumb, the residuals are uncorrelated if the Durbin-Watson
statistic is approximately 2. A value close to 0 indicated strong
positive correlation, while a value of 4 indicates a strong
negative correlation. The values of Durbin-Watson statistics
for the data were in the range from 1.850 to 1.930, which
indicates no serial correlation [48]. The represented case, i.e.,
the data used for testing the hypotheses and producing the
QoE model obtained by consideration of media-related SIFs,
has a Durbin-Watson value of 1.890. Finally, to assess
homoscedasticity assumption, we plotted the predicted values
against the residuals. According to [49], if the residuals are
randomly scattered around 0, i.e., the horizontal line, and
thereby provide a relatively even distribution, we may
conclude that the assumption is satisfied. As it can be seen in
Fig. 4, the data in the shown case satisfies the assumption.
In statistics, an interaction may arise when considering the
relationship among three or more variables, and describes a
situation in which the simultaneous influence of two or more
variables on additional one is not additive [50]. In an
experiment with more than one factor, such as this study is
(we consider simultaneous impact of resolution, CTU and
CRF on MOS), as it is evident from the above hypothesis,
these interaction effects between factors are another aspect to
consider. An interaction means that independent variables,
which are in our case previously mentioned resolution, CTU,
and CRF, do not have only independent effect, but they have a
complex and interactive influence on the dependent variable,
which in our case is MOS value. An interaction between IVs
means that the effect of one of those variables on DV is not
constant – the main effect differs at different values of other
[8, ch 2.].
In other words, suppose we have two binary factors A and
B. For example, these factors might indicate male or female
teacher (A) and male or female student (B). One can then
consider the average math score for each student as a function
of these factors (DV). Interaction effect is present on scores in
math (DV) when the effect of factor A (male or female
teacher)
is different across the levels of the factor B (being male or
female student). Therefore, the difference in math scores
between those students that are male and those that are female
(factor B) is not the same and depends on whether they have
been thought by male or female teacher (factor A) [50].
In our work we do not examine whether the considered IVs
correlate with DV because the correlation between two
variables means that the values of one variable relate in some
way to the values of the other and not whether they interact in
their effect on a third variable [51]. However, we used the
Pearson correlation test in order to test the MLR assumption –
linearity, which will be explained in the second part of this
chapter.
Table IV summarizes the results of the statistical analysis
(ANOVA). As stated in Section III, the null hypothesis for
ANOVA is that all population means are exactly equal. If this
holds, then our sample means will probably differ a bit. A
number that tell us how different are sample means is the
variance.
The sums of squares between expresses the total amount of
dispersion among the sample means and is calculated by the
following equation [52]:
𝑆𝑆𝑏𝑒𝑡𝑤𝑒𝑒𝑛 = ∑ 𝑛𝑗(𝑋�� − ��)2, (5)
where 𝑋��denotes a group mean, �� is the overall mean, and nj is
J. BARAKOVIĆ HUSIĆ et al.: IMPACT OF MEDIA-RELATED SIFs ON QoE FOR H.265/HEVC 163

the sample size per group. Dividing the sum of squares between
by its degree of freedom (df) results in mean squares between
[52]:
𝑀𝑆𝑏𝑒𝑡𝑤𝑒𝑒𝑛 =𝑆𝑆𝑏𝑒𝑡𝑤𝑒𝑒𝑛
𝑑𝑓𝑏𝑒𝑡𝑤𝑒𝑒𝑛 . (6)
Mean squares between is basically the variance among
sample means. When comparing k means, the degrees of
freedom is (k-1).
On the other hand, the sum of squares within indicates the total
amount of dispersion within groups and is calculated by [52]:
𝑆𝑆𝑤𝑖𝑡ℎ𝑖𝑛 = ∑(𝑋𝑖 − 𝑋��)2
. (7)
where 𝑋�� denotes a group mean, and Xi denotes an individual
observation. Dividing the sum of squares within by its degree of
freedom (df) results in mean squares between [52]:
𝑀𝑆𝑤𝑖𝑡ℎ𝑖𝑛 =𝑆𝑆𝑤𝑖𝑡ℎ𝑖𝑛
𝑑𝑓𝑤𝑖𝑡ℎ𝑖𝑛. (8)
Mean square within is basically the variance within groups.
For n independent observations and k groups, degree of freedom
within is (n-k).
The F-statistics represents the ratio of the between-group
variance to the within-group variance and is computed by (9)
[52]:
𝐹 =𝑀𝑆𝑏𝑒𝑡𝑤𝑒𝑒𝑛
𝑀𝑆𝑤𝑖𝑡ℎ𝑖𝑛. (9)
If F-statistics is large, the null hypothesis can be rejected.
Since F-statistics itself is not interesting, it can be used to obtain
the statistical significance if it follows F-distribution (which
means that presumptions of ANOVA are met).
Statistical significance referred to as the p-value is the
probability of finding a given deviation from the null
hypothesis. The convention is that the p-value should be smaller
than 0.05 for the F-statistics to be significant. If this is the case
(p<0.05), the null hypothesis should be rejected.
While the p-value tell us whether the difference between the
conditions is statistically significant, partial eta square (𝜂𝑝2)
gives us the idea of how different are the means. As such, we
refer to this as a measure of effect size [52]:
𝜂2 =𝑆𝑆𝑏𝑒𝑡𝑤𝑒𝑒𝑛
𝑆𝑆𝑏𝑒𝑡𝑤𝑒𝑒𝑛+𝑆𝑆𝑤𝑖𝑡ℎ𝑖𝑛. (10)
Some rules of thumbs are that 𝜂𝑝2=0.032 indicates a small
effect, 𝜂𝑝2=0.060 indicates a medium effect, and 𝜂𝑝
2=0.14
indicates a large effect.
According to Table IV, the results of the three-way ANOVA
for MOS show that there exists statistically significant
interaction of resolution, CTU, and CRF parameters with
medium effect size in terms of practical significance.
The existence of this statistically significant interaction
conditioned the performance of two-way ANOVA analysis for
all parameters. After conducting the two-way ANOVA, we
have plotted Fig. 5 – Fig. 13, which tend to provide a good
graphical illustration of obtained results. An interaction effect
can usually be seen as a set of non-parallel lines. One can
noticed from Fig. 5 – Fig. 13 that the lines do not appear to be
parallel (with the lines actually crossing). Therefore, one might
expect there to be a statistically significant interactions, which
are confirmed in Table IV.
Fig. 5, Fig. 6, and Fig. 7 show how CTU and CRF parameters
affect QoE. The effects for CTU interacts with CRF. That is,
CTU affects CRF values differently. The line representing CRF
value of 18 descent quite steeply from CTU value of 32 to CTU
value of 64 (especially on Fig. 6), whereas lines representing
other CRF values are much more horizontal. Since it depends
on CRF, there is no the effect of CTU. So that is why we ignore
the main effect of CTU - even if it is statistically significant.
This main effect puts together the different effects for all CRF
values and this obscures rather than clarifies how CTU really
affects QoE.
There exists statistically significant interaction with low
effect size between CTU and CRF parameters for resolution of
858×480. Statistically significant interactions led to further
consideration of individual impacts of these parameters on QoE.
By using post-hoc analysis, the following results were obtained.
For all CTU values (i.e., 16, 32, and 64), lower CRF values lead
to better QoE when using video streaming services. In general,
for each CTU value, the CRF value affects the QoE for video
streaming, as shown on Fig. 5.
Fig. 3. Normal P-P plot of regression standardized residuals (normality
assumption).
Fig. 4. Scatter plot of predicted values against the residuals
(homoscedasticity).
164 JOURNAL OF COMMUNICATIONS SOFTWARE AND SYSTEMS, VOL. 14, NO. 2, JUNE 2018

TABLE IV
SUMMARY OF STATISTICAL ANALYSIS RESULTS.
Three-Way ANOVA
Influence factor F(1,441) p(α=0.05) 𝜼𝒑𝟐
Interaction of resolution, CTU, and CRF 19.780 <0.001 0.107
Two-Way ANOVA
Influence factor F(1,441) p(α=0.05) 𝜼𝒑𝟐
Interaction of CTU and CRF (resolution - 858×480) 2.949 0.02 0.026
Interaction of CTU and CRF (resolution - 1280×720) 53.596 <0.001 0.327
Interaction of CTU and CRF (resolution - 1280×960) 28.397 <0.001 0.205
Interaction of resolution and CRF (CTU - 16) 11.729 <0.001 0.096
Interaction of resolution and CRF (CTU - 32) 28.726 <0.001 0.207
Interaction of resolution and CRF (CTU - 64) 34.677 <0.001 0.239
Interaction of resolution and CTU (CRF - 18) 39.121 <0.001 0.262
Interaction of resolution and CTU (CRF - 28) 24.394 <0.001 0.181
Interaction of resolution and CTU (CRF - 38) 4.568 <0.001 0.040
One-way ANOVA
Influence factor F(1,441) p(α=0.05) 𝜼𝒑𝟐
CRF (resolution - 858×480 and CTU - 16) 15.257 <0.001 0.065
CRF (resolution - 858×480 and CTU - 32) 34.924 <0.001 0.137
CRF (resolution - 858×480 and CTU - 64) 11.778 <0.001 0.051
CRF (resolution - 1280×720 and CTU - 16) 29.194 <0.001 0.117
CRF (resolution - 1280×720 and CTU - 32) 43.747 <0.001 0.166
CRF (resolution - 1280×720 and CTU - 64) 78.466 <0.001 0.262
CRF (resolution - 1280×960 and CTU - 16) 5.994 0.003 0.026
CRF (resolution - 1280×960 and CTU - 32) 48.532 <0.001 0.180
CRF (resolution - 1280×960 and CTU - 64) 12.547 <0.001 0.054
Resolution (CTU - 16 and CRF - 18) 0.479 0.620 0.002
Resolution (CTU - 16 and CRF - 28) 34.559 <0.001 0.135
Resolution (CTU - 16 and CRF - 38) 4.953 0.007 0.022
Resolution (CTU - 32 and CRF - 18) 3.262 0.039 0.015
Resolution (CTU - 32 and CRF - 28) 15.406 <0.001 0.065
Resolution (CTU - 32 and CRF - 38) 45.581 <0.001 0.171
Resolution (CTU - 64 and CRF - 18) 79.099 <0.001 0.264
Resolution (CTU - 64 and CRF - 28) 5.337 0.005 0.024
Resolution (CTU - 64 and CRF - 38) 16.261 <0.001 0.069
CTU (resolution - 858×480 and CRF - 18) 0.570 0.566 0.003
CTU (resolution - 1280×720 and CRF - 18) 3.744 0.024 0.017
CTU (resolution - 1280×960 and CRF - 18) 101.661 <0.001 0.316
CTU (resolution - 858×480 and CRF - 28) 39.720 <0,001 0.153
CTU (resolution - 1280×720 and CRF - 28) 17.077 <0.001 0.072
CTU (resolution - 1280×960 and CRF - 28) 6.625 <0.001 0.029
CTU (resolution - 858×480 and CRF - 38) 3.713 0.025 0.017
CTU (resolution - 1280×720 and CRF -38) 32.952 <0.001 0.130
CTU (resolution - 1280×960 and CRF - 38) 13.164 <0.001 0.056
Legend: ANOVA (Analysis of Variance); CRF (Constant Rate Factor); CTU (Coding Tree Unit); QoE (Quality of Experience).
Also, there exists statistically significant interaction between
CTU and CRF parameters for resolution 1280×720, but with
large practical significance. As in the previous case (and every
subsequent one), the impact of individual parameters on QoE
for video streaming service has been considered. The results are
different compared to the higher resolution, as shown on the
Fig. 6. For all CTU values (i.e., 16, 32, and 64), higher CRF
values lead to better QoE when using video streaming services.
Furthermore, there exists statistically significant interaction
between CTU and CRF parameters for the resolution 1280×960
with large practical significance. In addition, as in the previous
case, for all CTU values (i.e., 16, 32, and 64) the results show
that CRF values affect the QoE when using the video streaming
service (Fig. 7).
Fig. 8, Fig. 9, and Fig. 10 show how CRF and resolution
affect QoE. The effect for CRF interacts with resolution. That
is, CRF affects resolution differently. The line representing
resolution of 858×480 descent quite steeply from CRF value of
18 to CRF value of 38 (especially on Fig. 9), whereas other
resolutions are represented by broken lines. Since it depends on
resolution, there is no the effect of CRF. So that is why we
ignore the main effect of CRF – even if it is statistically
significant. The main effect put together the different effects for
all resolutions and this obscures rather than clarifies how CRF
really affects QoE.
There exists statistically significant interaction with medium
practical significance between resolution and CRF for CTU
value 16. For CRF value 18, the resolution does not affect QoE.
J. BARAKOVIĆ HUSIĆ et al.: IMPACT OF MEDIA-RELATED SIFs ON QoE FOR H.265/HEVC 165
As shown on the Fig. 8, for CRF values 28 and 38, higher
resolution values result in better QoE.
For CTU value 32 there exist statistically and practically
significant interaction between resolution and CRF. Fig. 9
shows that for all CRF values (i.e., 18, 28, and 38), higher
values of resolution lead to better QoE when using video
streaming service.
Also, there exists statistically and practically significant
interaction between resolution and CRF for CTU value 64. As
in the previous case, for all CRF values (i.e., 18, 28, and 38),
higher resolution leads to better QoE when using video
streaming service (Fig. 10).
Fig. 11, Fig. 12, and Fig. 13 show how CTU and resolution
affect QoE. The effects for CTU interacts with resolution.
That is, CTU affects resolution differently. The line
representing resolution of 1280×720 descent quite steeply
from CTU value of 32 to CTU value of 64 (especially on Fig.
11), whereas lines representing other resolutions are much
more horizontal. Since it also depends on resolution, there is
no the effect of CTU. So that is why we ignore the main effect
of CTU - even if it is statistically significant.
Finally, there exist statistically and practically significant
interaction between resolution and CTU for CRF value 18.
Furthermore, analysis of individual effects shows that for CTU
value 16, resolution has no influence on QoE, while for the
CTU values 32 and 64, higher resolution values lead to better
QoE when using the video streaming service (Fig. 11).
Also, there exists statistically and practically significant
interaction between resolution and CTU for CRF value 28, and
CRF value 38. For CRF value 28, it is shown that for all CTU
values (Fig. 12) (i.e., 16, 32, and 64), higher resolution lead to
better QoE when using video streaming. For CRF value 38, it
is shown that the same is true (Fig. 13).
Also, if we approach to ANOVA in more general
conceptual way, it is possible to have the GLM model written
as the sum of a number of components which represent
various aspects of an experiment. In case where we have, for
example three factors, such as this study is, a mathematical
expression representing data values in terms of the structure of
the experiment is as follows [8, ch 5]:
𝑦𝑖𝑗𝑘𝑙 = 𝜇 + 𝐶𝑇𝑈𝑖 + 𝐶𝑅𝐹𝑗 + (𝐶𝑇𝑈 ↔ 𝐶𝑅𝐹)𝑖𝑗 + 𝑅𝐸𝑆𝑘 +
(𝐶𝑇𝑈 ↔ 𝑅𝐸𝑆)𝑖𝑘 + (𝐶𝑅𝐹 ↔ 𝑅𝐸𝑆)𝑗𝑘 + (𝐶𝑇𝑈 ↔ 𝐶𝑅𝐹 ↔ 𝑅𝐸𝑆)𝑖𝑗𝑘 +
𝑆((𝐶𝑇𝑈 ↔ 𝐶𝑅𝐹 ↔ 𝑅𝐸𝑆))𝑖𝑗𝑘𝑙, (11)
where y represents scores or data values, µ represents the
baseline, CTU, CRF, RES effects of considered factors,
(CTU↔CRF), (CTU↔RES), (CRF↔RES), and
(CTU↔CRF↔RES) interaction effects, and S is the error term.
Based on the previous results analysis, it is concluded that all
null hypotheses (H1-H7) have been rejected, since there exist
statistically significant differences in QoE when using video
streaming service for all individual parameter changes (i.e.,
resolution, CTU, and CRF) as well as changes caused by their
interactions. In other words, there exist individual impact of
resolution, CTU, and CRF parameters on QoE when using
video streaming services. Furthermore, QoE for video streaming
is affected by the interaction of pairs of considered parameters
(resolution and CTU, resolution and CRF, CTU and CRF), and
the simultaneous interaction of all three considered parameters.
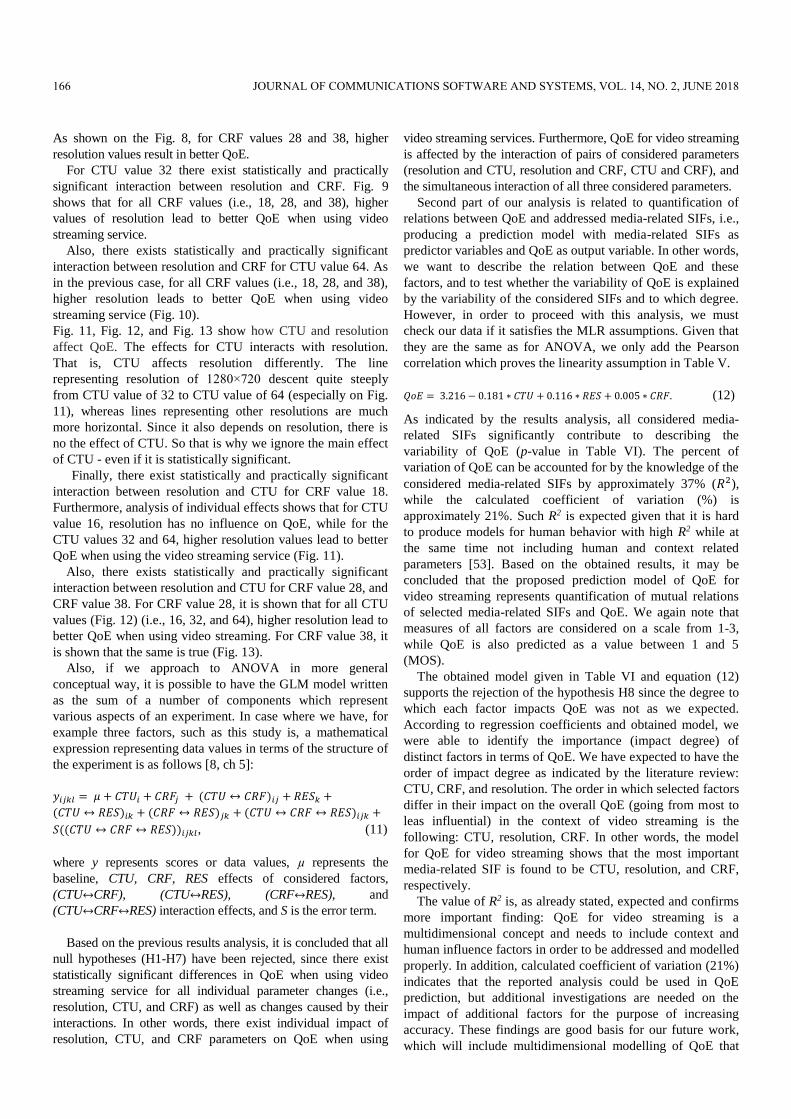
Second part of our analysis is related to quantification of
relations between QoE and addressed media-related SIFs, i.e.,
producing a prediction model with media-related SIFs as
predictor variables and QoE as output variable. In other words,
we want to describe the relation between QoE and these
factors, and to test whether the variability of QoE is explained
by the variability of the considered SIFs and to which degree.
However, in order to proceed with this analysis, we must
check our data if it satisfies the MLR assumptions. Given that
they are the same as for ANOVA, we only add the Pearson
correlation which proves the linearity assumption in Table V.
𝑄𝑜𝐸 = 3.216 − 0.181 ∗ 𝐶𝑇𝑈 + 0.116 ∗ 𝑅𝐸𝑆 + 0.005 ∗ 𝐶𝑅𝐹. (12)
As indicated by the results analysis, all considered media-
related SIFs significantly contribute to describing the
variability of QoE (p-value in Table VI). The percent of
variation of QoE can be accounted for by the knowledge of the
considered media-related SIFs by approximately 37% (𝑅2),
while the calculated coefficient of variation (%) is
approximately 21%. Such R2 is expected given that it is hard
to produce models for human behavior with high R2 while at
the same time not including human and context related
parameters [53]. Based on the obtained results, it may be
concluded that the proposed prediction model of QoE for
video streaming represents quantification of mutual relations
of selected media-related SIFs and QoE. We again note that
measures of all factors are considered on a scale from 1-3,
while QoE is also predicted as a value between 1 and 5
(MOS).
The obtained model given in Table VI and equation (12)
supports the rejection of the hypothesis H8 since the degree to
which each factor impacts QoE was not as we expected.
According to regression coefficients and obtained model, we
were able to identify the importance (impact degree) of
distinct factors in terms of QoE. We have expected to have the
order of impact degree as indicated by the literature review:
CTU, CRF, and resolution. The order in which selected factors
differ in their impact on the overall QoE (going from most to
leas influential) in the context of video streaming is the
following: CTU, resolution, CRF. In other words, the model
for QoE for video streaming shows that the most important
media-related SIF is found to be CTU, resolution, and CRF,
respectively.
The value of R2 is, as already stated, expected and confirms
more important finding: QoE for video streaming is a
multidimensional concept and needs to include context and
human influence factors in order to be addressed and modelled
properly. In addition, calculated coefficient of variation (21%)
indicates that the reported analysis could be used in QoE
prediction, but additional investigations are needed on the
impact of additional factors for the purpose of increasing
accuracy. These findings are good basis for our future work,
which will include multidimensional modelling of QoE that
166 JOURNAL OF COMMUNICATIONS SOFTWARE AND SYSTEMS, VOL. 14, NO. 2, JUNE 2018

Fig. 5. Resolution 858×480 – interaction
between CTU and CRF.
Fig. 8. CTU 16 - interaction between
resolution and CRF.
Fig. 11. CRF 18 - interaction between
resolution and CTU.
Fig. 6. Resolution 1280×720 - interaction
between CTU and CRF.
Fig. 9. CTU 32 - interaction between
resolution and CRF.
Fig. 12. CRF 28 - interaction between
resolution and CTU.
Fig. 7. Resolution 1280×960 - interaction
between CTU and CRF.
Fig. 10. CTU 64 – interaction between
resolution and CRF.
Fig. 13. CRF 38 - interaction between
resolution and CTU.
J. BARAKOVIĆ HUSIĆ et al.: IMPACT OF MEDIA-RELATED SIFs ON QoE FOR H.265/HEVC 167

TABLE V
PEARSON CORRELATION COEFFICIENTS.
QoE CTU CRF Resolution
QoE 1 0.550 -0.862 0.103
CTU - 1 0.747 0.162
CRF - - 1 0.145
Resolution - - - 1
Legend: CRF (Constant Rate Factor); CTU (Coding Tree Unit); QoE (Quality of
Experience).
TABLE VI
SUMMARY OF RESULTS OF MLR ANALYSIS FOR RELATION BETWEEN
QOE AND MEDIA-RELATED SIFS.
Coeff. Std.
coeff.
Std.
error t p-value
Constant 3.216 0.088 36.542 <0.001
CTU -0.181 -0.162 0.030 -6.058 <0.001
Resolution 0.116 0.103 0.030 3.865 <0.001
CRF 0.005 0.005 0.002 1.007 0.002
Legend: Coeff. (Coefficient); CRF (Constant Rate Factor); CTU (Coding Tree Unit);
QoE (Quality of Experience); Std. (Standard).
will gain more accurate prediction equation. This prediction
formula will include in addition to system IFs, several most
important human IFs and context IFs, given the fact that as
already stressed, that the QoE requires a multidimensional
approach.
V. CONCLUSION AND FUTURE WORK
Growing trend of video streaming usage implies that media-
related SIFs should be well understood in order to determine
how they affect the user’s QoE. There lies the motivation for
this paper, which aims to provide a deeper understanding of
impact of media-related SIFs and their interactions on QoE in
the context of H.265/HEVC coded video streaming over LTE
and to produce a prediction model for QoE in this context.
Therefore, non-exhaustive review of related works in the
field of media-related SIFs and their impact on
subjective/objective quality perception of video streaming was
prepared. It has served us to select three media-related SIFs
(i.e., resolution, bitrate, and compression) which were
manipulated by changing ffmpeg parameters (i.e., resolution,
CTU, and CRF) in order to create video sequences used in the
experimental study.
Statistical analysis of data collected by end-user survey
implies that there exist statistically and practically significant
impact of individual parameters (i.e., resolution, CTU, and
CRF) and their interaction on QoE when using H.265/HEVC
video streaming service. Also, we have provided a
quantification of relationship between media-related SIFs and
QoE for H.265/HEVC video streaming, i.e., a prediction QoE
model which shows that the most important media-related SIF
is found to be CTU, resolution, and CRF, respectively.
The original scientific contribution of this study and its
results is twofold. The study shows that the impact of media-
related SIFs and their mutual interactions on QoE for
H.265/HEVC video streaming is strong and statistically and
practically significant. Also, the relationship between selected
media-related SIFs and QoE for H.265/HEVC video streaming
is quantified. This is the first time that the description and
quantification of abovementioned relations has been provided
in such a manner. Consequently, based on the proposed model,
one is able to identify the importance of distinct media-related
SIFs in terms of QoE. However, more important is that we
have confirmed that QoE needs to be approached as a
multidimensional concept, i.e., we need to consider human and
context IFs along with other system IFs.
The knowledge of these impacts and interactions, as well as
the prediction model, can be used by interested stakeholders to
become aware of and to understand how their work affects
others in the service provisioning chain. In addition, they may
utilize these findings to enhance their services and to improve
their pieces of the QoE puzzle, which jointly lead to better end
user’s QoE.
However, our experimental study has certain limitations
that may be overcome in the future work. Given the fact that
video streaming over LTE is probably influenced by additional
parameters except those three investigated in this paper, a
broader range of various parameters and their interactions
should be included in future research studies. Moreover, larger
number of examinees should be included in the further studies
in order to draw non-misleading conclusions. Since examinees
involved in this study were instructed on what task to perform,
the field studies should be performed in the future. In addition,
the subject of future work should be the proposal of predictive
multidimensional model for video streaming which may be
helpful in a practical sense.
REFERENCES
[1] P. Corwall, et al., “Ericsson Mobility Report,” Ericsson, Nov., 2017.
[Online]. Available: https://www.ericsson.com/assets/local/mobility-report/documents/2017/ericsson-mobility-report-november-2017.pdf
[2] E. Cero, J. Baraković Husić, and S. Baraković, “IoT’s Tiny Steps
towards 5G: Telco’s Perspective,” Symmetry, vol. 9, no. 10, 2017. DOI:
10.3390/sym9100213 [3] T. Begluk, J. Baraković Husić, and S. Baraković, “Machine learning-
based QoE prediction for video streaming over LTE network,” in Proc. of 17th International Symposium INFOTEH-JAHORINA, Jahorina,
B&H, Mar. 21-23, 2018. DOI: 10.1109/INFOTEH.2018.8345519
[4] K. Brunnström, et al., “Qualinet White Paper on Definitions of Quality of Experience,” European Network on Quality of Experience in
Multimedia Systems and Services, QUALINET (COST Action IC
1003), Novi Sad, Serbia, Mar. 13, 2013. [Online]. Available: https://hal.archives-ouvertes.fr/hal-00977812/document
[5] S. Baraković and L. Skorin-Kapov, “Survey of research on Quality of
Experience modelling for web browsing,” Quality and User Experience,
vol. 2, no. 6, 2017. DOI: 10.1007/s41233-017-0009-2
[6] S. Baraković and L. Skorin-Kapov, “Survey and Challenges of QoE
Management Issues in Wireless Network,” Journal of Computer
Networks and Communications, vol. 2013, 2013. DOI: 10.1155/2013/165146
[7] J. Blenik, M. Uhrina, M. Kuba, M. Vaculik, “Performance of H.264, H.265, VP8 and VP9 Compression Standards for High Resolutions,” in
Proc. of the 19th International Conference on Network-Based
Information Systems (NBiS), Ostrava, Czech Republic, Sept. 7-9, 2016. DOI: 10.1109/NBiS.2016.70
[8] J. Miller and P. Haden, Statistical Analysis with the General Linear
Model. Creative Commons Attribution, 2006. [9] J. Baraković Husić, S. Baraković, A. Veispahić, “What Factors Influence
the Quality of Experience for WebRTC Video Calls?” in Proc. of 40th
168 JOURNAL OF COMMUNICATIONS SOFTWARE AND SYSTEMS, VOL. 14, NO. 2, JUNE 2018

International Convention on Information and Communication
Technology, Electronics and Microelectronics (MIPRO), Opatija, Croatia, May 22-26, 2017. DOI: 10.23919/MIPRO.2017.7973463
[10] S. Baraković and J. Baraković Husić, “Web categorization and end user
survey addressing mobile web,” J. BH Elektrotehnika, vol. 10, pp. 36-45, 2016.
[11] J. Nightingale, Q. Wang, C. Grecos, S. Goma, “The impact of network
impairment on quality of experience (QoE) in H.265/HEVC video streaming,” IEEE Transactions on Consumer Electronics, vol. 60, no. 2,
pp. 242-250, 2014. DOI: 10.1109/TCE.2014.6852000
[12] A. Aqil, A. O. F. Atya, S. V. Krishnamurthy, and G. Papageorgiou, “Streaming Lower Quality Video over LTE: How Much Energy Can
You Save?,” in Proc. of the IEEE 23rd International Conference on
Network Protocols (ICNP), San Francisco, CA, USA, Nov. 10-13, 2015. DOI: 10.1109/ICNP.2015.50
[13] A. Khan, L. Sun, E. Jammeh, and E. Ifeachor, “Quality of experience-
driven adaptation scheme for video applications over wireless networks,” IET communications, vol. 4, no. 11, pp. 1337-1347, 2010.
DOI: 10.1049/iet-com.2009.0422
[14] A. Khan, L. Sun, E. Ifeachor, J. O. Fajardo, F. Liberal, and H. Koumaras, “Video quality prediction models based on video content
dynamics for H. 264 video over UMTS networks,” International Journal
of Digital Multimedia Broadcasting, 2010. DOI: 10.1155/2010/608138 [15] A.Vakili and J. C. Grégorie, “QoE management for video conferencing
applications,” Computer Networks, vol. 57, pp. 1726-1738, 2013. DOI:
10.1016/j.comnet.2013.03.002 [16] C. Alberti, et al., “Automated QoE evaluation of dynamic adaptive
streaming over HTTP,” in Proc. of the 5th International Workshop on
Quality of Multimedia Experience (QoMEX), Klagenfurt am Wörthersee, Austria, Jul. 3-5, 2013, pp. 58-63. DOI: 10.1109/QoMEX.2013.6603211
[17] D. Hammerschmidt and C. Wöllner, “The influence of image
compression rate on perceived audio quality in music video-clips,” in Proc. of International Conference on the multimodal Experience of
Music (ICMEM), Sheffield, UK, Mar. 23-25, 2015.
[18] D. Vranješ, D. Žagar, and O. Nemčić, “Comparison of objective quality assessment methods for scalable video coding,” in Proc. of the 54th
International symposium ELMAR-2012, Zadar, Croatia, Sept. 12-14,
2012. pp. 19-22. [19] I. Silvar, M. Sužnjević, and L. Skorin-Kapov, “The impact of video
encoding parameters and game type on QoE for cloud gaming: A case study using the steam platform,” in Proc. of the 7th International
Workshop on Quality of Multimedia Experience (QoMEX), 2015, Pylos-
Nestoras, Greece, May 26-29, 2015, pp. 1-6. DOI: 10.1109/QoMEX.2015.7148144
[20] J. Joskowicz and J. Ardao, “A general parametric model for perceptual
video quality estimation,” in Proc. of the International Workshop Technical Committee on Communications Quality and Reliability
(CQR), 2010, Vancouver, BC, Canada, Jun. 8-10, 2010, pp. 1-6. DOI:
10.1109/CQR.2010.5619912 [21] J. Joskowicz and J. Ardao, “Combining the effects of frame rate, bit rate,
display size and video content in a parametric video quality model,” in
Proc. of the 6th Latin America Networking Conference, 2011, Quito, Ecuador, Oct. 12-13, 2011, pp. 4-11. DOI: 10.1145/2078216.2078218
[22] J. Joskowicz, J. C. L. Ardao, and R. Sotelo, “Quantitative modeling of
the impact of video content in the ITU-T G. 1070 video quality estimation function,” Informática na educação: teoria & prática, vol.
14, no. 2, 2011. DOI: 10.22456/1982-1654.21825
[23] J. Ohm, G. J. Sullivan, H. Schwarz, T. K. Tan, and T. Weigand, “Comparison of the coding efficiency of video coding standards—
including high efficiency video coding (HEVC),” IEEE Transactions on
circuits and systems for video technology, vol. 22, pp. 1669-1684, 2012. DOI: 10.1109/TCSVT.2012.2221192
[24] M. Řeřábek, P. Hanhart, P. Korshunov, T. Ebrahimi, “Quality evaluation
of HEVC and VP9 video compression in real-time applications,” in Proc. of the 7th International Workshop on Quality of Multimedia
Experience (QoMEX), 2015, Pylos-Nestoras, Greece, May 26-29, 2015,
pp. 1-6. DOI: 10.1109/QoMEX.2015.7148088 [25] M. Uhrina, J. Frnda, L. Sevcik, M. Vaculik, “Impact of H. 264/AVC and
H. 265/HEVC compression standards on the video quality for 4K
resolution,” Advances in Electrical and Electronic Engineering, vol. 12, pp. 368-376, 2014. DOI: 10.15598/aeee.v12i4.1216
[26] P. McDonagh, C. Vallati, A. Pande, P. Mohapatra, P. Perry, E.
Mingozzi, “Quality-oriented scalable video delivery using H. 264 SVC on an LTE network,” in Proc. of the 14th International Symposium on
Wireless Personal Multimedia Communications (WPMC), 2011, Brest,
France, Oct. 3-7, 2011. DOI: 10.1109/GLOCOM.2011.6133953 [27] P. Seeling and M. Reisslein, “Video traffic characteristics of modern
encoding standards: H. 264/AVC with SVC and MVC extensions and H.
265/HEVC,” The Scientific World Journal, vol. 16, 2014. DOI: 10.1155/2014/189481
[28] R. M. Nasiri, J. Wang, A. Rehman, S. Wang, Z. Wang, “Perceptual
quality assessment of high frame rate video,” in Proc. of the 17th International Workshop on Multimedia Signal Processing (MMSP),
2015, Xiamen, China, Oct. 19-21, 2015, pp. 1-6. DOI:
10.1109/MMSP.2015.7340831 [29] T. Zinner, O. Hohlfeld, O. Abboud, and T. Hossfeld, “Impact of frame
rate and resolution on objective QoE metrics,” in Proc. of the 2nd
International Workshop on Quality of Multimedia Experience (QoMEX), 2010, Trondheim, Norway, Jul. 21-23, 2010, pp. 29-34. DOI:
10.1109/QOMEX.2010.5518277
[30] W. Songi and W. D. Tjondronegoro, “Acceptability-based QoE models for mobile video,” IEEE Transactions on Multimedia, vol. 16, pp. 738-
750, 2014. DOI: 10.1109/TMM.2014.2298217
[31] Y. F. Ou, W. Lin, H. Zeng, and Y. Wang, “Perceptual Quality of Video with Periodic Frame Rate and Quantization Variation-Subjective Studies
and Analytical Modeling,” CoRR abs/1406.2018, 2014.
[32] D. Grois, D. Marpe, A. Mulayoff, B. Itzhaky, and O. Hadar, “Performance comparison of h. 265/mpeg-hevc, vp9, and h. 264/mpeg-
avc encoders,” in Proc. of Picture Coding Symposium (PCS), San Jose,
CA, USA 2013. DOI: 10.1109/PCS.2013.6737766 [33] F. Kuipers, R. Kooij, D. De Vleeschauwer, and K. Brunnström,
“Techniques for measuring quality of experience,” in Proc. of the 8th
International Conference on Wired/Wireless Internet Communications (WWIC), 2010, Lulea, Sweden, Jun. 01-03, 2010, pp. 216-227. DOI:
10.1007/978-3-642-13315-2_18
[34] H. Al-Nuaim and A. Nouf, “A user perceived quality assessment of lossy compressed images,” International Journal of Computer Graphics,
vol. 2, pp. 23-36, 2011.
[35] A. Khan, L. Sun, and E. Ifeachor, “QoE prediction model and its application in video quality adaptation over UMTS networks,” IEEE
Transactions on Multimedia, vol. 14, pp. 431-442, 2012. DOI:
10.1109/TMM.2011.2176324 [36] K. Zeng, T. Zhao, A. Rehman and Z. Wang, “Characterizing Perceptual
Artifacts in Compressed Video Streams,” in Proc. SPIE 9014, Human Vision and Electronic Imaging (HVEI) XIX, Jan. 2014. DOI:
10.1117/12.2043128
[37] FFmpeg development team. (2018, Mar.). ffmpeg Documentation. [Online]. Available: https://ffmpeg.org/ffmpeg.html
[38] S. Rubel. Videezy. [Online]. Available at: https://www.videezy.com/ ,
2017. [39] NS-3 development team. 2017 [Online]. Available:
https://www.nsnam.org/docs/manual/ns-3-manual.pdf
[40] P. Giuseppe, N. Baldo, and M. Miozzo, “An LTE Module for the ns-3 network simulator,” in Proc. of the 4th International ICST Conference on
Simulation Tools and Techniques (SIMUTool’11), Mar. 2011.
[41] J. Klaue, B. Rathke, and A. Wolisz, “EvalVid – A Framework for Video Transmission and Quality Evaluation,” In: Kemper P., Sanders W.H.
(eds) Computer Performance Evaluation. Modelling Techniques and
Tools (TOOLS 2003). Lecture Notes in Computer Science, vol 2794. Springer, Berlin, Heidelberg. DOI: 10.1007/978-3-540-45232-4_16
[42] S. N. Shahab, A. A. Abdulkafi, and A. R. Zainun, “Assessment of Area
Energy Efficiency of LTE Macro Base Stations in Different Environments,” Journal of Telecommunications and Information
Technology, p. 59, 2015.
[43] M. Sauter, “Long Term Evolution,” in From GSM to LTE: an introduction to mobile networks and mobile broadband, West Sussex,
UK: John Wiley & Sons, 2010.
[44] Methodology for the subjective assessment of the quality of television pictures, ITU-T Recommendation BT-500, 2012.
[45] S. Baraković and L. Skorin-Kapov, “Multidimensional Modelling of
Quality of Experience for Mobile Web Browsing,” Computers in Human Behaviour, vol. 50, pp. 314-332, 2015. DOI: 10.1016/j.chb.2015.03.071
[46] IBM development team. IBM SPSS Software. 2018. [Online]. Available:
http://www-01.ibm.com/software/analytics/spss/ [47] Testing Assumptions of linear regression in SPSS. 2018. [Online].
Available: http://www.statisticssolutions.com/testing-assumptions-of-
linear-regression-in-spss/. [48] A. J. Schwab, Course materials - Data analysis II. University of Texas,
2007.
J. BARAKOVIĆ HUSIĆ et al.: IMPACT OF MEDIA-RELATED SIFs ON QoE FOR H.265/HEVC 169

[49] O. Jason and E. Waters, “Four assumptions of multiple regression that
researchers should always test” Practical Assessment, Research and Evaluation, 8(2), 2002.
[50] Interaction (statistics). 2018. [Online] Available:
https://en.wikipedia.org/wiki/Interaction_(statistics) [51] K. Grace-Martin. The difference between interaction and association.
2018 [Online]. Available:
https://www.theanalysisfactor.com/interaction-association [52] SPSS Tutorials. ANOVA - Simple Introduction. 2018. [Online].
Available: https://www.spss-tutorials.com/anova-what-is-it/
[53] S.A. Sweet and K.A. Grace-Martin, “Data Analysis with SPSS. A First Course in Applied Statistics.” 4th edition. Pearson, 2012.
Irma Osmanović received her Bachelor
Degree and Master Degree in Engineering at
the Faculty of Electrical Engineering,
University of Sarajevo in 2015 and 2017,
respectively. In July, 2017, she started three-
month internship as Junior Network Engineer
at Avacom Group Company. She is employed
by Systech, Sarajevo, where she work as a
software engineer. Her research interests
include different topics related to QoS/QoE management in
multimedia networks.
Jasmina Baraković Husić received her PhD
degree in 2009 at the Faculty of Electrical
Engineering and Computing, University of
Zagreb. She is an Associate Professor at the
Faculty of Electrical Engineering, University
of Sarajevo. She is employed by BH Telecom,
Joint Stock Company, Sarajevo as a specialist
in the Department for Planning and
Development of Technologies and Services.
Her research interests include a variety of
topics in signalling and QoS/QoE management in NGN, IoT, 5G
communications.
Sabina Baraković received her PhD degree in
2014 at the Faculty of Electrical Engineering
and Computing, University of Zagreb. She is an
expert adviser at the Ministry of Security of
Bosnia and Herzegovina and an Assistant
Professor at the University of Sarajevo and
American University in Bosnia and
Herzegovina. Her research interests include
multidimensional QoE modelling of
multimedia, mobile Web-based applications, and unified
communications, and management of QoS/QoE in mobile and NGN
environment.
170 JOURNAL OF COMMUNICATIONS SOFTWARE AND SYSTEMS, VOL. 14, NO. 2, JUNE 2018


![UWS Academic Portal Efficient QoE-aware scheme for video ... · the latest video codec standard H.265 (also known as High Efficiency Video Coding or HEVC) [2] and thus the obtained](https://static.fdocuments.net/doc/165x107/5f15e4181aa4cc649668f081/uws-academic-portal-efficient-qoe-aware-scheme-for-video-the-latest-video-codec.jpg)


