Impact of Income on Calorie and Nutrient Intakes: A Cross
35
1 Impact of Income on Calorie and Nutrient Intakes: A Cross-Country Analysis Matthew J. Salois, Richard Tiffin, and Kelvin Balcombe Department of Food Economics and Marketing University of Reading PO Box 237 Reading, Berkshire RG6 6AR UK Email: [email protected] Phone: +44-(0)118-378-7702 Selected Paper prepared for presentation at the Agricultural & Applied Economics Association's 2011 AAEA & NAREA Joint Annual Meeting, Pittsburgh, Pennsylvania, July 24-26, 2011. Copyright 2011 by Matthew J. Salois, Richard Tiffin, and Kelvin Balcombe. All rights reserved. Reader may make verbatim copies of this document for non-commercial purposes by any means, provided that this copyright notice appears on all such copies.
Transcript of Impact of Income on Calorie and Nutrient Intakes: A Cross
1
Impact of Income on Calorie and Nutrient Intakes: A Cross-Country Analysis
Matthew J. Salois, Richard Tiffin, and Kelvin Balcombe
Department of Food Economics and Marketing
University of Reading
PO Box 237
Reading, Berkshire RG6 6AR
UK
Email: [email protected]
Phone: +44-(0)118-378-7702
Selected Paper prepared for presentation at the Agricultural & Applied Economics
Association's 2011 AAEA & NAREA Joint Annual Meeting, Pittsburgh, Pennsylvania,
July 24-26, 2011.
Copyright 2011 by Matthew J. Salois, Richard Tiffin, and Kelvin Balcombe. All rights
reserved. Reader may make verbatim copies of this document for non-commercial
purposes by any means, provided that this copyright notice appears on all such
copies.
2
Abstract
The relationship between income and nutrient intake is explored. Nonparametric,
panel, and quantile regressions are used. Engle curves for calories, fat, and protein are
approximately linear in logs with carbohydrate intakes exhibiting diminishing
elasticities as incomes increase. Elasticities range from 0.10 to 0.25, with fat having
the highest elasticities. Countries in higher quantiles have lower elasticities than those
in lower quantiles. Results predict significant cumulative increases in calorie
consumption which are increasingly composed of fats. Though policies aimed at
poverty alleviation and economic growth may assuage hunger and malnutrition, they
may also exacerbate problems associated with obesity.
Keywords: calorie and nutrient consumption, food and nutrition policy, income
elasticities, nonparametric, panel, quantile regression.

3
Introduction
"For the first time since 1970, more than 1 billion people, about 100 million
more than last year and around one-sixth of all of humanity, are hungry and
undernourished worldwide" FAO (2009).
"Obesity has reached epidemic proportions globally, with more than 1 billion
adults overweight, at least 300 million of them clinically obese, and is a major
contributor to the global burden of chronic disease and disability" WHO (2004).
The number of undernourished people in the world increased from 854 million
in 2006 to an estimated 1.02 billion in 2009, representing the greatest amount of
hungry people in nearly half a century (FAO 2009). The FAO (2009) contends that
while the current economic crisis plays a role in the global escalation of hunger,
surging domestic food prices and deteriorating household incomes are especially to
blame. Paradoxically, the growing international prevalence of hunger and starvation
resulting from energy and nutrient deficiencies continues amidst global concern
regarding the rapidly increasing prevalence of chronic diseases resulting from
overweight and obesity. As of 2005, an estimated 1.6 billion adults over age fifteen
were overweight and 400 million were obese (WHO 2006). Although the spread of
obesity was confined historically to the developed countries, emerging trends indicate
the growth of overweight and obesity in the developing world (Hossain et. al 2007).
In fact, in many developing countries both childhood malnutrition and adult obesity
are concurrently observed within households resulting in a "dual burden of disease"
(Doak et. al 2004; Caballero 2005).
A potential key determinant of nutritional status is income. Therefore, studies
on the relationship between income and nutrient intake receive considerable attention.
4
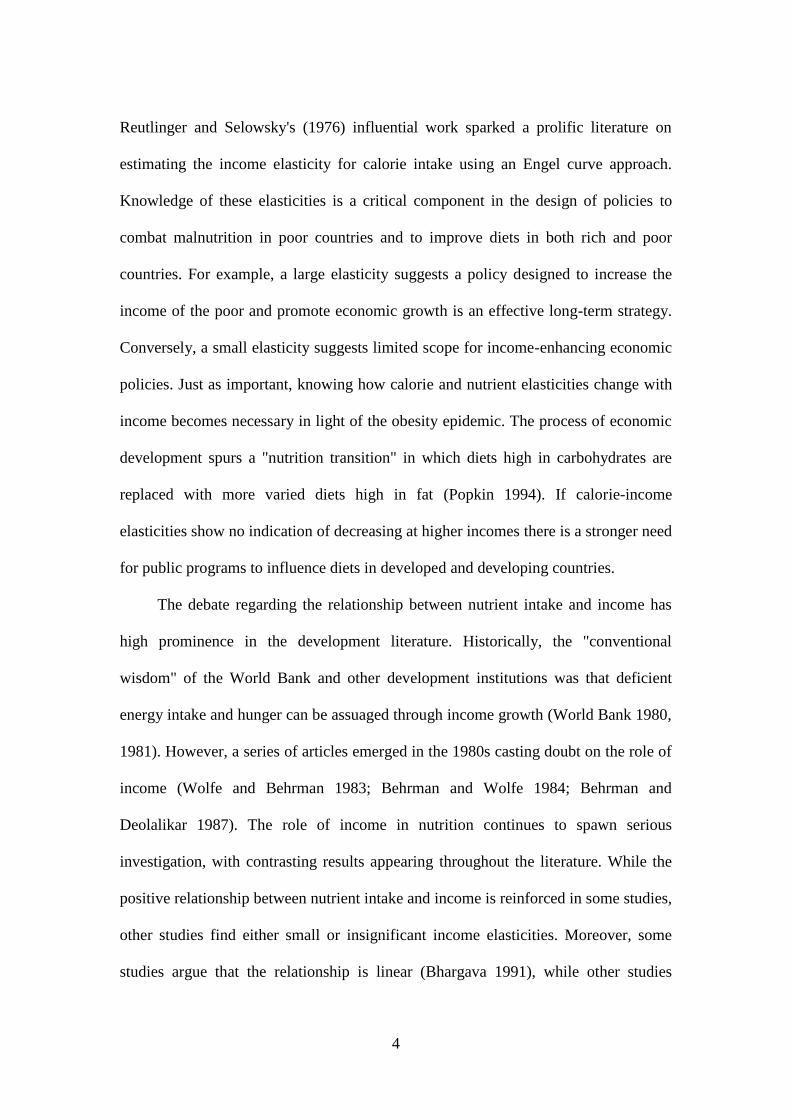
Reutlinger and Selowsky's (1976) influential work sparked a prolific literature on
estimating the income elasticity for calorie intake using an Engel curve approach.
Knowledge of these elasticities is a critical component in the design of policies to
combat malnutrition in poor countries and to improve diets in both rich and poor
countries. For example, a large elasticity suggests a policy designed to increase the
income of the poor and promote economic growth is an effective long-term strategy.
Conversely, a small elasticity suggests limited scope for income-enhancing economic
policies. Just as important, knowing how calorie and nutrient elasticities change with
income becomes necessary in light of the obesity epidemic. The process of economic
development spurs a "nutrition transition" in which diets high in carbohydrates are
replaced with more varied diets high in fat (Popkin 1994). If calorie-income
elasticities show no indication of decreasing at higher incomes there is a stronger need
for public programs to influence diets in developed and developing countries.
The debate regarding the relationship between nutrient intake and income has
high prominence in the development literature. Historically, the "conventional
wisdom" of the World Bank and other development institutions was that deficient
energy intake and hunger can be assuaged through income growth (World Bank 1980,
1981). However, a series of articles emerged in the 1980s casting doubt on the role of
income (Wolfe and Behrman 1983; Behrman and Wolfe 1984; Behrman and
Deolalikar 1987). The role of income in nutrition continues to spawn serious
investigation, with contrasting results appearing throughout the literature. While the
positive relationship between nutrient intake and income is reinforced in some studies,
other studies find either small or insignificant income elasticities. Moreover, some
studies argue that the relationship is linear (Bhargava 1991), while other studies

5
uncover important nonlinearities in the income-calorie relationship (Gibson and
Rozelle 2005; Skoufias 2003). Finding a nonlinear relationship implies the impact of
income on calorie intake is affected by the actual level of calorie intake. For example,
high calorie consumers may not be as greatly affected by a marginal increase in
income as low calorie consumers and as such will have a smaller elasticity.
With the evidenced mixed, the debate persists regarding the actual relationship
between nutrient intake and income and the appropriate economic policies for
combating hunger and malnutrition. Also left unclear is the extent the nutrition
transition is expected to occur in the developing economies, which involves not only a
worsening in diet quality across the developing world but also a likely global
epidemic from diet related chronic disease. The role of income in nutrition is clearly
important for developing countries. However, as people in developed countries
consume calories at increased levels, asking if further increases in income are likely to
aggravate problems associated with obesity also becomes important. The primary
objective of this paper is to assess the relationship between income and nutrient intake
in an international sample of developing and developed countries. In particular, the
analysis utilizes a cross-national sample of 171 developing and developed countries
across two different time periods (1990-1992 and 2003-2005). Most studies tend to
focus on a particular country in a single year using household data. Estimates from an
aggregate Engel curve using international data on nutrient intake and income provides
a global perspective and generalizes results at a macroeconomic level.
The paper proceeds as follows. The second section reviews the recent literature.
The third outlines the data and the econometric methods. The fourth section presents
the empirical results and discusses major implications. The final section concludes.

6
Empirical Literature
While estimates of the income elasticity are abundant, the true approximate
magnitude is a controversial topic because of the wide range of estimates. Bouis and
Haddad (1992) provide a good review and, though not up to date, find elasticity
estimates in the range of 0.01 to 1.18, some statistically significant and others not. In
one of the earliest studies using cross-country data to estimate an aggregate Engel
curve, Reutlinger and Selowsky (1976) obtain a statistically significant but small
income elasticity of around 0.17, suggesting that nutritional status cannot be improved
through income-enhancing economic policies alone. A number of other papers claim
that income is not the most salient factor in malnutrition, such as Sahn (1988),
Ravallion (1990), Bouis and Haddad (1992), and Bouis (1994).
Even though a substantial literature warns against an income-focused policy, the
role of income is still considered important by many development institutions.
According to the latest FAO (2009, p.36) report on the growing concern of food
insecurity, the recent "diminished economic access to food because of higher prices
was compounded by lower incomes." While a number of early papers substantiate the
conventional wisdom of the World Bank before the "revisionist" papers emerged in
the 1980s (Pinstrup-Andersen and Caicedo 1978; Ward and Sanders 1980), more
recent studies also counter the revisionist regime (Subramanian and Deaton 1996;
Dawson and Tiffin 1998; Tiffin and Dawson 2002; Abdulai and Aubert 2004). Table
1 provides a summary of recent studies since the review in Bouis and Haddad (1992).
The estimated elasticities are of moderate magnitude (between 0.2 and 0.5) and most
authors conclude that improving income is crucial to combating malnutrition.
Different approaches partly explain the variation in estimates.

7
One important difference is how the Engel curve and resulting income elasticity
is estimated. Some studies assume a specific parametric relationship between income
and calorie intake while some generalize the relationship using nonparametric
estimators, which allows for potential nonlinearities. For example, a higher income
elasticity of calorie intake ought to be expected for poor households since they may
have insufficient income to pay for adequate nutrition. Nonparametric regression
procedures allow for such a possibility and mitigate problems of statistical bias
resulting from a misspecified parametric form. Some studies investigate the potential
for nonlinearities and find they are not present (Subramanian and Deaton 1996;
Abdulai and Aubert 2004). Other studies using nonparametric methods, however,
suggest the income elasticity is better described by a curve rather than a line (Roy
2001; Gibson and Rozelle 2002; Skoufias 2003; Meng, Gong, and Wang 2009). These
studies conclude that nonlinearity is an important characteristic in the relationship
between income and calorie intake.
In addition to using a parametric panel estimator to test for time-effects in the
income-nutrient relationship, this paper also uses a nonparametric estimator. Since the
nonparametric approach lets the relationship be both non-linear and non-monotonic,
calorie intakes between poor households and rich households can respond differently
to income. This paper also employs quantile regression to explore the heterogeneity in
intake response to income across countries over time. Since the effect of income may
differ across the distribution of calorie intake, particular segments of the intake
distribution are of great interest, especially from a public health and nutrition policy
perspective. Concerns regarding obesity and hunger solicit special attention to the
tails of the intake distribution, where dietary excess and deficiency occurs, rather than

8
at the means. Since most previous studies rely on a form of ordinary least squares
(either parametric or nonparametric), the marginal effects of income derived from
these studies are assumed to be the same over the distribution of calorie intake. Since
this is a very strong assumption, results from these studies are of limited value.
Quantile regression relaxes this assumption and allows for heterogeneous responses of
calorie intake to income. Despite the strong appeal of quantile regression in
application to nutrition problems, very few studies employ them. The few that do use
a quantile approach focus on the nutrient intake for one country only (Fousekis and
Lazaridis 2005; Skoufias et. al 2009; Shankar 2010).
Even if a reasonably sized and statistically significant income-calorie elasticity
is found, the role of income in nutritional status is still unclear since people may shift
the composition of their nutrient consumption as income increases (Behrman and
Deolalikar 1989). Evidence suggests that as incomes rise household expenditure on
food increases because more expensive food is being purchased, but the nutrient
content of these foods does not increase proportionately (Pitt 1983; Behrman,
Deolalikar, and Wolfe 1988). In other words, improvements in income may result in
increases in food expenditures or total calorie intake but this may not coincide with a
diet more rich in nutrients (Brinkman et. al 2010; Behrman and Deolalikar 1987).
Households tend to increase the variety of their diet based on features other than
nutrient content, such as taste and quality, as they substitute away from cheaper
sources of calories towards more expensive ones. Conversely, studies that uncover a
small or zero elasticity do not necessarily imply that a change in income does not
affect nutrition. For example, a drop in income may result in unchanged calorie
intake, but the consumption of vital nutrients may fall as households substitute

9
towards cheaper and less nutritious foods. Regardless of the size of the estimated
income elasticity for calories, there is little room for conclusions regarding the
consumption of important nutrients, such as proteins, fats, and carbohydrates
(Skoufias 2009).
The existing evidence on income elasticities for nutrient intake from single-
country studies reveals considerable differences (Pitt and Rosenzweig 1985; Berhman
and Deolalikar 1989).The present paper decomposes calorie intake into proteins, fats,
and carbohydrates. In so doing, this paper provides the first income elasticity
estimates of key macronutrients for an international cross-country sample. Obtaining
income elasticity estimates that break down total calorie intake into individual
nutrients is important from a policy perspective. For example, economic growth may
increase total calorie intake, reducing problems related to hunger and malnutrition,
but may also result in a greater proportion of fat in the diet, causing higher rates of
obesity and diet-related chronic diseases. The income-calorie elasticity alone is not
enough to guide policy makers. Understanding the general composition of the diet and
the consumption of particular nutrients becomes crucial in this context.
In addition to problems of deficient calorie and nutrient intake is the problem of
excessive intake leading to overweight and obesity. The World Health Organization
(2006) projects that by 2015 nearly 2.3 billion adults will be overweight and over 700
million will be obese. As developing countries experience economic growth,
overweight and obesity are on the rise in low- and middle-income countries,
particularly in urban areas (WHO 2006). Higher income countries tend to obtain most
of their dietary energy supply from fat (Drewnowski 2003). The analysis in
Drewnowski and Popkin (1997) reveals a global convergence towards a diet deriving

10
a higher proportion of energy from fat across a sample of developed and developing
countries. Specifically, they warn about the possibility that a diet containing close to
30% of energy from fat could become the global norm. Also worrying is the trend that
the nutrition transition is occurring at lower levels of income than previously thought.
As pointed out in Popkin and Ng (2007, p.200), "even poor nations had access to a
relatively high-fat diet by 1990 when a diet deriving 20% of energy (kilocalories)
from fat was associated with countries that have a GNP of only $750 per capita".
Data and Econometric Methods
Aggregate data on average per capita dietary energy supply are derived from
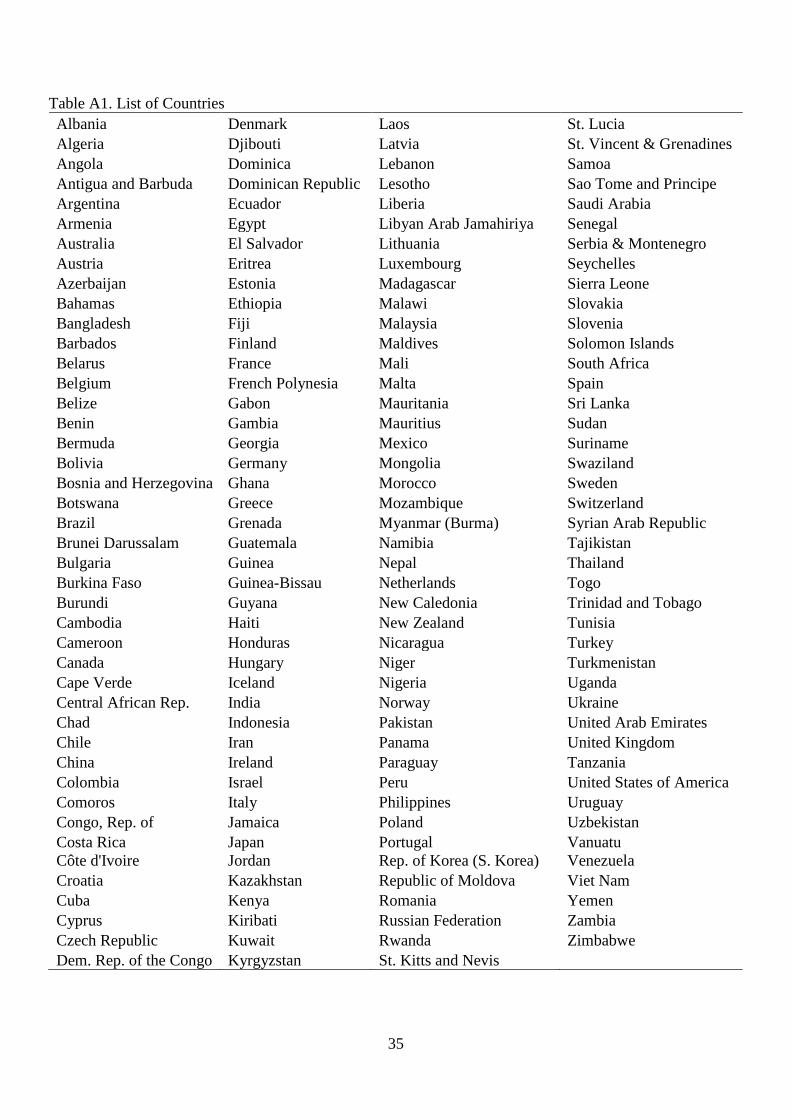
national food balance sheets obtained from the FAO Statistics Division. A cross-
sectional sample of 171 developing and developed countries across two different time
periods (1990-1992 and 2003-2005) is constructed (refer to table A1 in the appendix
for countries included). Dietary energy consumption per person is defined as the
amount of food, in kilocalories per day, for each individual in the total population.
The measure is based on food available for human consumption computed as the
residual from the total food supply less waste and other uses, such as from industry or
agriculture. Income data is sourced from the International Financial Statistics of the
International Monetary Fund and is the Gross Domestic Product (GDP) for each
country in billions of 2005 U.S. dollars. To convert these values to GDP per capita,
population data is obtained from the Penn World Tables.
Three main estimation methods are employed in this paper. All three are
Bayesian. First, there is the nonparametric approach outlined in Chapter 10 of Koop
(2003). The second is a linear (in parameters) panel regression that can be estimated
using the framework outlined in Chib and Greenberg (1995). Finally, the recently
11
developed method for estimating quantile regressions (the Bayesian Exponentially
Tilted Empirical Likelihood, BETEL method) outlined in Lancaster and Sung (2010).
When using the panel approach, alternative models are evaluated using the Bayesian
Deviance Information Criteria (DIC) outlined in Spiegelhalter et al. (2002). A full
description of each of the methods can be found in the references above, therefore, the
coverage here is succinct.
The Nonparametric Approach
The motivation for a nonparametric approach is because the relationships
between calorie or nutrient consumption and incomes may be highly non-linear and
plausibly non-monotonic. The flexibility of the nonparametric approach allows the
examination of whether simple functional forms may be viable. Therefore, the
nonparametric approach is employed first before investigating the relationships using
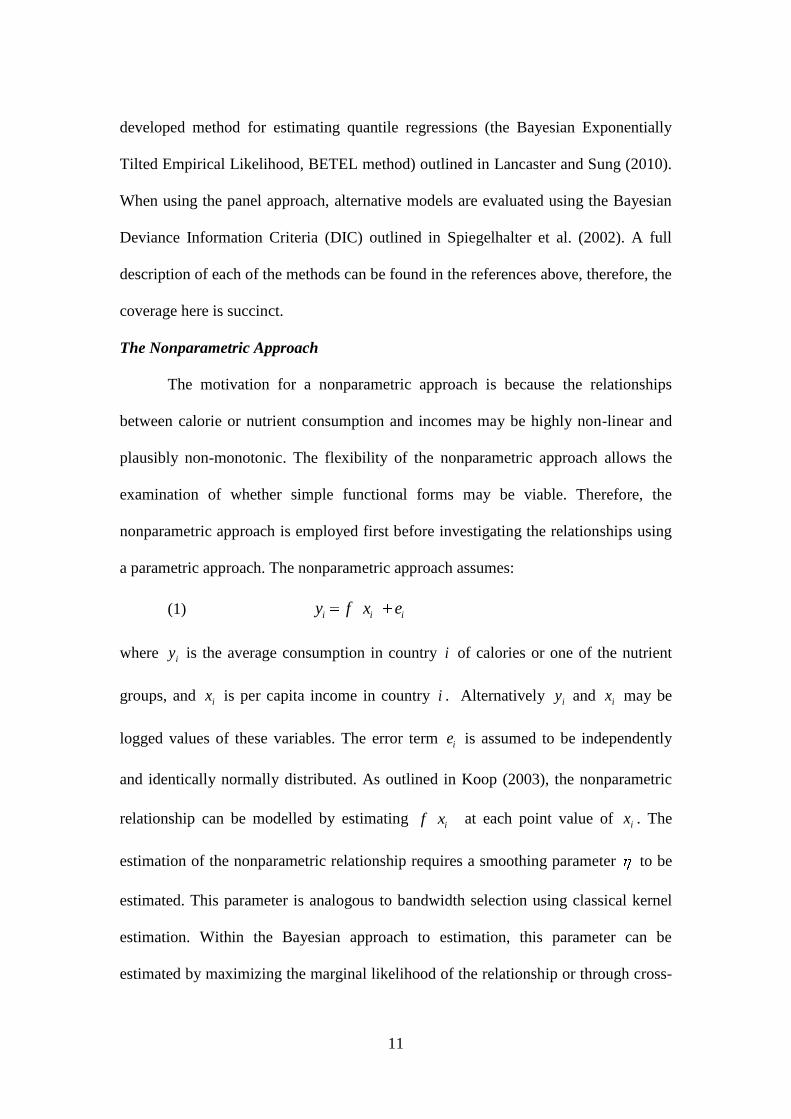
a parametric approach. The nonparametric approach assumes:
(1) i i iy f x e
where iy is the average consumption in country i of calories or one of the nutrient
groups, and ix is per capita income in country i . Alternatively iy and ix may be
logged values of these variables. The error term ie is assumed to be independently
and identically normally distributed. As outlined in Koop (2003), the nonparametric
relationship can be modelled by estimating if x at each point value of ix . The
estimation of the nonparametric relationship requires a smoothing parameter to be
estimated. This parameter is analogous to bandwidth selection using classical kernel
estimation. Within the Bayesian approach to estimation, this parameter can be
estimated by maximizing the marginal likelihood of the relationship or through cross-

12
validation, with the former method used (Koop 2003). When using the nonparametric
approach, the models are estimated for the two periods separately. Thus, there are two
sets of nonparametric regressions for each of the time periods.
The Panel Approach
For the panel approach, the models investigated are of the form
(2) 2 3
1 2 3it t t it t it t it ity x x x e
where 2~ 0,ite N , , 0it jtE e e for all i j and
2
*,it jtE e e where *t t .
Also, ity denotes the dependent variable (calories or nutrients or logs of these
variables) for country i at time t and itx is per capita income (or logged values) for
country i at time t . Since there are only two time periods, the values of t are one and
two . By allowing the relationship to be cubic, the model deals with functions that
have variable second derivatives whereby the function may be convex and concave
over alternative regions of the variable space. The imposition of restrictions are
investigated, such as *it it (no time effects) and/or 2 0t and/or 3 0t , in
which case the function may become quadratic or linear (or linear in logs). The
Bayesian approach further allows imposition and investigation of whether inequality
restrictions are consistent with the data. For example, in the cubic relationship the
hypothesis might be that 3 0t since one might expect that consumption of calories
or nutrients would not increase at an accelerating rate as incomes rise. Finally, an
alternative panel approach assumes that *jt jt for all j along with *it it ie e z
where iz is a normally distributed country effect. This "within country/between time"
regression is also estimated.

13
The Quantile Approach
Unlike the previous two approaches, the BETEL does not have an explicit
functional form for the likelihood. Instead, the empirical likelihood is constructed by
optimizing an entropy measure for any given value of the parameters. The empirical
likelihood is multiplied by some relatively diffuse priors to obtain the posterior
distribution of the parameters, and then this can be mapped using a Metropolis-
Hastings algorithm. The BETEL approach can be used more generally than for
quantile regressions. The moment conditions are derived from the condition that (for
two variables iy and ix )
(3) Pr |i i iy x x
The parameters and represent the intercept and slopes for the th
quantile. Like the nonparametric regressions, quantile regressions are run separately
for each time period.
Results and Discussion
Discussion of the results proceeds sequentially examining the nonparametric
results first, followed panel regression results, and then the quantile results. As stated,
the nonparametric regressions were run separately over the two periods (1990-1992
and 2003-2005). Only the latter period is presented, since the nonparametric plots are
almost the same between the two periods. First, figure 1 examines the raw nutrient
shares modelled as a function of the raw per capita variable. The middle line is the
fitted (mean) nonparametric relationship, with the two outside lines containing the
95% confidence intervals for the mean. As seen from the plots, the relationship
between shares of nutrients and per capita income appears to be non-linear, with

14
poorer countries having relatively high levels of carbohydrates as a proportion of their
diet (top left hand corner of figure 1). As incomes increase, however, the shares of
carbohydrates decrease with a small rise in proteins but a much larger rise in fats. In
the poorest countries, about 80% to 85% of the diet is in the form of carbohydrates
and only around 10% in fats. As incomes increase though, there is a rapid switch to
fats, levelling off at around a 50% share in carbohydrates and a 38% share in fats,
with the remainder being proteins. The warnings from Drewnowski and Popkin
(1997) about the possibility of a diet containing close to 30% of energy from has in
fact become the norm for many countries already.
The second set of nonparametric plots in figure 2 are for the logged calorie and
nutrient consumptions regressed against logged per capita income (the relationships
between the raw data were also examined, and these were highly nonlinear and are
not presented). What is more interesting about the fitted curves using the logged data
is that for each of the variable pairs, the nonparametric curves are quite linear. In
other words, the data are consistent with being linear in logs, and therefore have
constant elasticities. There is some evidence of a slightly lower slope at very low
levels of per capital income for total calories, fats, and proteins. Surprisingly,
however, the increases in consumption of these quantities towards the upper end of
the income range does not appear to level off. This implies that as per capita incomes
rise, a percentage increase in per capita incomes continues to give the same
percentage increase in calories, along with increases in fats, proteins, and
carbohydrates. Also evident is that the carbohydrate line is much flatter, meaning that
increases in incomes are not leading to the same increases in carbohydrates as for fats
and proteins. This is consistent with the nonparametric results using nutrient shares.

15
In view of the nonparametric results, the linear in log specifications represent
plausible empirical characterizations of the relationships between calories/nutrients
and per capita income. This hypothesis is explored further using parametric methods.
As outlined in the methods section, a set of panel regressions are specified, where the
variables have been logged prior to estimation. Before presenting parameter estimates,
alternative specifications including only a quadratic term and excluding a cubic or
quadratic term are investigated first. No other restrictions are imposed at this stage,
with further restrictions investigated subsequently. The DIC for each of the models is
computed, with the preferred model being the one with the lowest DIC. The results
are presented in table 2. The models with the lowest DIC are highlighted in bold, and
the linear (in variables) specification is preferred for total calories, protein, and fats.
However, the quadratic model is preferred for carbohydrates. Results conclude
therefore that the panel results are broadly in concordance with the nonparametric
results. The evidence suggests that total calories, protein, and fats have approximately
constant elasticities over per capita incomes. This is not the case, however, for
carbohydrates. The restrictions on the parameters across the time periods are
investigated in table 3 in order to test whether the relationships differ across the two
periods (1990-2 and 2003-5). For these comparisons the linear models are used, even
for carbohydrates. As can be seen from the results in table 3, while there is evidence
that the constants in the models can be restricted across the two periods none of the
models support constant elasticities across the two periods, suggesting that there have
been changes in consumption patterns other than those driven by incomes.
Table 4 presents the elasticities estimated using the panel approach. Again, the
linear model results are given in table 4. As mentioned above, the quadratic model is

16
preferred for carbohydrates, therefore carbohydrates are discussed further below. The
estimates in table 4 reveal that while the DIC does not support constant elasticities
over the two periods, the differences in elasticities across the periods is very small.
The calorie elasticity is around 0.09 for both periods and both periods have 95%
elasticity confidence intervals that would be contained within the interval (0.072,
0.104). Both protein and fat elasticities are significantly larger than the calorie
elasticities (at about 0.14-0.15 and 0.23-0.24, respectively), whereas the carbohydrate
elasticity is much smaller (at around 0.02-0.025). This is consistent with the previous
results regarding nutrient shares. Overall, results suggest that a 10% increase in per
capita incomes will lead to around a 1% rise in calorie consumption, but with the
larger components being an increase in fat consumption, followed by protein
consumption, with a very small increase in carbohydrate consumption. As already
noted, however, the carbohydrate elasticity does not appear to be constant. To further
investigate carbohydrate consumption the income elasticity is estimated at each level
of income. These are plotted in figure 3 for the two time periods, which again are very
similar. The basic picture that emerges is that the carbohydrate elasticity is around
0.10 for very low levels of income, decreasing at a decreasing rate from there on, but
remaining positive until around $US7500 per year. Beyond this point carbohydrate
consumption has a negative elasticity.
The results for the quantile regressions are presented in table 5. Again, these are
linear in log specifications for each of the variables. Table 5 reports the upper 75%,
the median, and the lower 25% percentile elasticity estimates. In all cases, for all
quantiles, the results are very similar to the estimated elasticities from the panel
results. Of central interest is whether there seems to be a divergence between the

17
different percentile values. As can be seen by table 5, these are very small. A large
divergence between the lower and the upper percentiles would mean that countries
with a higher consumption (for a given level of per capita income) are responding
differently to those with a lower consumption (for a given level of per capita income).
For example, if for calories the 0.25 was much smaller than 0.75 then
countries with lower consumption of calories or nutrients would be less responsive to
income changes than those with relatively high consumption of calories. This,
arguably would be the most worrying scenario, since increased incomes would be
having the least effect on those with the lowest consumption, and increased incomes
would be having the highest effect on those with the highest income. From table 5,
however, the opposite tends to be true. For both periods, the majority of the variables
have non-decreasing or increasing elasticities moving down the percentile groups.
Therefore, those consuming relatively small amounts of calories or nutrients (for a
given level of income) tend to be the most responsive to changes in the levels of
income. As already noted though, the divergence between the quantiles is small.
To summarize, calories, fats, and proteins are found to have positive significant
income elasticities. The data on these variables are also consistent with having
constant elasticities across the income range. Carbohydrate consumption is found to
have high positive elasticities only at low income levels, becoming negative at high
incomes. A quantile regression approach yields similar elasticity estimates to the
nonparametric and panel approaches at both the upper and lower quantiles, but there
is some evidence to suggest that the higher consuming countries (for both calories and
nutrient components) had slightly lower elasticities than for those in the lower
quantiles. These findings have both positive and negative implications. First, in line

18
with the majority of previous studies, the small but positive income elasticities
suggest that income growth will increase calorie consumption and increase all nutrient
consumption for low income countries (below US$7500). However, the elasticity
estimates fall below the majority of existing estimates.
In terms of overall calorie consumption, a 10% rise in incomes is required for
1% rise in calorie consumption. Thus, rather large increases in income are needed for
an improvement in the nutrition status of people in poorer countries. The implications
for higher income countries are perhaps no less important. Findings suggest that this
overall rise in calorie consumption as incomes rise holds also for rich countries. Thus,
for countries that are already consuming well beyond the recommended calorie levels,
further increases in income will lead to even larger consumption of calories.
Moreover, the consumption of fat has the largest elasticity at around 2.5 that of
overall calorie consumption, meaning that the larger component of increased calorie
consumption will be in terms of fats. While these elasticities may seem small, in the
absence of any other change in behavior, extrapolating current income growth
predicts significant cumulative increase in calorie consumption that would exacerbate
existing problems associated with obesity. Indeed, such has been the case in parts of
Asia, such as China, in which substantial economic growth has been met with marked
increases in rates of obesity (Popkin and Ng 2007).
Overall, the results obtained in this paper have two important implications.
First, economic growth does have the potential to assuage hunger and malnutrition in
the developing world, however, the impacts are likely to be small and not as
substantial as some studies have concluded (Subramanian and Deaton 1996; Meng,
Gong, and Wang 2009). In fact, some studies suggest that good nutrition is a driver of

19
economic growth and therefore development policies should be geared specifically
towards reducing chronic malnutrition in order to spur economic growth rather than
focusing on economic growth to spur good nutrition (Correa and Cummins 1970;
Strauss 1986; Strauss and Thomas 1998; Fogel 2004). Second, economic growth may
also change the structure of diets and the composition of nutrient intakes. In
particular, result here suggest that as countries become richer not only are calorie
intakes on an increasing trajectory, but that diets becomes increasingly composed of
fats rather than proteins or carbohydrates. These results are in accord with the
nutrition transition hypothesis of Popkin (2004). Economic growth, while contributing
to the alleviation of malnutrition, also results in diets that become composed more of
fats, worsening rates of obesity and obesity-related diseases.
Summary and Conclusion
Understanding the relationship between calorie intake and income is crucial to
designing economic strategies towards combating chronic diseases associated with
both nutrient deficiency and nutrient excess. Given the nature of the dual burden of
hunger and obesity, careful analysis must pay special attention to the tails of the
nutrient intake distribution. Given the historical difficulty in coordinating effective
international action against hunger and undernutrition, in addition to the escalating
global obesity epidemic, there is a continued need for research on effective policy
instruments to combat these dual burdens.
This paper examined the relationship between calorie/nutrient consumption and
per capita incomes using a two-period panel of 171 countries and extends the
literature in two important ways. First, the relationship between income and average
calorie intake is disaggregated into important nutrient components: carbohydrates,

20
proteins, and fats. The disaggregation of calorie intake permits the relationship with
income to differ between each nutrient. Most of the literature on nutrition and income,
especially in the development literature, focuses entirely on total energy (calorie)
intake. While the income elasticity of calories infers how the total level of energy is
affected by income, it reveals nothing about how income affects diet composition.
The few studies that do estimate nutrient-income elasticities (Pitt and Rosenzweig
1985; Behrman and Deolalikar 1987; Behrman and Wolfe 1987; Skoufias et. al 2009)
confine their analysis to a single country.
Second, this study employs three different estimators (nonparametric,
parametric, and quantile) for a robust interpretation of the income-nutrient
relationship. A nonparametric estimator allows the relationship between income and
calorie or nutrient consumption to be non-linear and non-monotonic. The parametric
panel estimator permits estimation of both 'within-country' and 'between-time' effects
and allows for testing of changes in the relationship over time. The quantile estimator
lets the marginal effect of income on calorie/nutrient intake to be different over the
entire intake distribution. In other words, the impact of income may be different
between rich and poor countries, which consume calories at different levels, so
improvements in income may not impart equal benefits. While some studies use both
parametric and nonparametric estimators, few studies utilize quantile regression.
Results suggest that development strategies aimed at improving economic
growth may prove to be insufficient at alleviating hunger and may at worst exacerbate
problems of poor diet and obesity in both developing and developed countries. Even
in the absence of targeted food policies, the global economic crisis will likely worsen
the quality of diets internationally. In response to falling incomes, households will

21
turn to fatty and calorie-dense, but nutrient poor, inexpensive processed foods. As the
composition of diets change towards more fatty foods, countries across the globe will
experience deteriorating nutritional status and health. Global efforts to improve diets
require the coordinated design and implementation of policies that can address the
dual public health problems of nutrient excess and deficiency.

22
REFERENCES
Abdulai, A., and D. Aubert. 2004. Nonparametric and parametric analysis of calorie
consumption in Tanzania. Food Policy 29(2): 113-129.
Aromolaran, A.B. 2004. Household income, women's income share and food calorie intake in
South Western Nigeria. Food Policy 29(5): 507-530.
Babatunde, R.O., A.O. Adejobi, and S.B. Fakayode. 2010. Income and calorie intake among
farming households in rural Nigeria: results of parametric and nonparametric analysis.
Journal of Agricultural Science 2(2): 135-146.
Behrman, J.R., and A.B. Deolalikar. 1987. Will developing country nutrition improve with
income? Journal of Political Economy 95(3): 492-507.
Behrman, J.R., and A.B. Deolalikar. 1989. Is variety the spice of life? Implications for calorie
intake. Review of Economics and Statistics 71(4): 666-672.
Behrman, J.R., A.B. Deolalikar, and B.L. Wolfe. 1988. Nutrients: impacts and determinants.
World Bank Economic Review 2(3): 299-320.
Behrman, J.R., and B.L. Wolfe. 1984. More evidence on nutrition demand: income seems
overrated and women's schooling underemphasized. Journal of Development
Economics 14(1): 105-128.
Behrman, J.R.., and B.L. Wolfe. 1987. How does mother's schooling affect family health,
nutrition, medical care usage, and household sanitation? Journal of Econometrics 36(1-
2): 185-204.
Bhargava, A. 1991. Estimating short and long run income elasticities of foods and nutrients
for rural South India. Journal of the Royal Statistical Society (Series A) 154(1): 157-
174.
23
Bouis, H.E. 1994. The effect of income on demand for food in poor countries: are our food
consumption databases giving us reliable estimates? Journal of Development
Economics 44(1): 199-226.
Bouis, H.E., and L.J. Haddad. 1992. Are estimates of calorie-income elasticities too high? A
recalibration of the plausible range. Journal of Development Economics 39(2): 333-
364.
Caballero, B. 2005. A nutrition paradox -- underweight and obesity in developing countries.
New England Journal of Medicine 352(15): 1514-1516.
Chibb, S. and E. Greenberg 1995. Hierarchical analysis of SUR models with extensions to
correlated serial errors and time-varying parameter models. Journal of Econometrics
68(2): 339-360.
Correa, H., and G. Cummins. 1970. Contribution of nutrition to economic growth. American
Journal of Clinical Nutrition 23(5): 560-565.
Dawson, P.J. 1997. The demand for calories in developing countries. Oxford Development
Studies 25(3): 361-369.
Dawson, P.J. 2002. Nutrition in Pakistan: estimating the economic demand for calories.
Pakistan Journal of Nutrition 1(1): 64-66.
Dawson, P.J., and R. Tiffin. 1998. Estimating the demand for calories in India. American
Journal of Agricultural Economics 80(3): 474-481.
Doak, C.M., L.S. Adair, M. Bentley, C. Monteiro, and B.M. Popkin. 2005. The dual burden
household and the nutrition transition paradox. International Journal of Obesity 29(1):
129-136.
Drewnowski, A. 2003. Fat and sugar: an economic analysis. Journal of Nutrition 133(3):
838S-840S.
24
Drewnowski, A., and B.M. Popkin. 1997. The nutrition transition: new trends in the global
diet. Nutrition Reviews 55(2): 31-43.
Food and Agriculture Organization. 2009. State of Food Insecurity in the World. Rome, Italy.
Fogel, R.W. 2004. Health, nutrition, and economic growth. Economic Development and
Cultural Change 52(3): 643-658.
Fousekis, P., and P. Lazaridis. 2005. The demand for selected nutrients by Greek households:
an empirical analysis with quantile regressions. Agricultural Economics 32(3): 267-
279.
Gibson, J., and S. Rozelle. 2002. How elastic is calorie demand? Parametric, Nonparametric
and Semiparametric results for urban Papua New Guinea. Journal of Development
Studies 38(6): 23-46.
Grimard, F. 1996. Does the poor's consumption of calories respond to changes in income?
Evidence from Pakistan. Pakistan Development Review 35(3): 257-283.
Hossain, P., B. Kawar, and M. El Nahas. 2007. Obesity and diabetes in the developing world:
a growing challenge. New England Journal of Medicine 356(13): 213-215.
Koop G. 2003. Bayesian Econometrics. Sussex, England: Wiley.
Lancaster T. and Sung .J.J. 2010. Bayesian Quantile Regression Methods. Journal of Applied
Econometrics 25(2): 287-307.
Meng, X., X. Gong, and Y. Wang. 2009. Impact of growth and economic reform on nutrition
availability in urban China: 1986-2000. Economic Development and Cultural Change
57(2): 261-295.
Pinstrup-Andersen, P., and E. Caicedo. 1978. The potential impact of changes in income
distribution on food demand and human nutrition. American Journal of Agricultural
Economics 60(3): 402-415.

25
Popkin, B.M. 1994. The nutrition transition in low-income countries: an emerging crisis.
Nutrition Reviews 52(9): 285-298.
Popkin, B.M. 2004. The nutrition transition: worldwide obesity dynamics and their
determinants. International Journal of Obesity 28: S2-S9.
Popkin, B.M., and S.W. Ng. 2007. The nutrition transition in high- and low-income
countries: what are the policy lessons? Agricultural Economics 37(S1): 199-211.
Pitt, M.M. 1983. Food preferences and nutrition in rural Bangladesh. Review of Economics
and Statistics 65(1): 105-114.
Pitt, M.M., and M.R. Rosenzweig. 1985. Health and nutrient consumption across and within
households. Review of Economics and Statistics 67(2): 212-223.
Ravallion, M. 1990. Income effects on undernutrition. Economic Development and Cultural
Change 38(3): 489-515.
Reutlinger, S. and M. Selowsky. 1976. Malnutrition and poverty: magnitude and policy
options. World Bank staff occasional papers no. 23; Johns Hopkins University Press.
Baltimore, USA.
Roy, N. 2001. A semiparametric analysis of calorie response to income change across income
groups and gender. Journal of International Trade and Economic Development 10(1):
93-109.
Sahn, D.E. 1988. The effect of price and income changes on food-energy intake in Sri Lanka.
Economic Development and Cultural Change 36(2): 315-340.
Shankar, B. 2010. Socio-economic drivers of overnutrition in China. Journal of Human
Nutrition and Dietetics 23(5): 471-479.
Skoufias, E. 2003. Is the calorie-income elasticity sensitive to price changes? Evidence from
Indonesia. World Development 31(7): 1291-1307.

26
Skoufias, E., V. Di Maro, T. Gonzalez-Cossiom, and S. Rodriguez Ramirez. 2009. Nutrient
consumption and household income in rural Mexico. Agricultural Economics 40(6):
657-675.
Spiegelhalter D.J., N.G. Best, B.P. Carlin, and A. van der Linde. 2002. Bayesian Measures of
Model Complexity and Fit. Journal of the Royal Statistical Society: Series B (Statistical
Methodology) 64 (4): 583 - 639.
Strauss, J. 1986. Does better nutrition raise farm productivity? Journal of Political Economy
94(2): 297-320.
Strauss, J., and D. Thomas. 1998. Health, nutrition, and economic development. Journal of
Economic Literature 36(2): 766-817.
Subramanian, S., and A. Deaton. 1996. The demand for food and calories. Journal of
Political Economy 104(1): 133-162.
Tiffin, R. and P.J. Dawson. 2002. The demand for calories: some further estimates from
Zimbabwe. Journal of Agricultural Economics 53(2): 221-232.
Ward, J.O., and J.H. Sanders. 1980. Nutritional determinants and migration in the Brazilian
Northeast: a case study of rural and urban Ceará. Economic Development and Cultural
Change 29(1): 141-163.
Wolfe, B.L. and J.R. Behrman. 1983. Is income overrated in determining adequate nutrition?
Economic Development and Cultural Change 31(3): 525-549.
World Bank. 1980. World Development Report. Washington, DC: USA.
World Bank. 1981. World Development Report. Washington, DC: USA.
World Health Organization. 2004. Global Strategy on Diet, Physical Activity and Health.
Geneva: Switzerland.
World Health Organization. 2006. Obesity and Overweight Factsheet. Geneva: Switzerland.

27
Table 1. Summary of Recent Studies
Author Year Data Level Model Timeframe Country Elasticity
Bhargava 1991 Individual Panel 1976-1977 India 0.13
Grimard 1996 Household Cross-sectional 1984-1985 Pakistan 0.40-0.50
Subramanian and Deaton 1996 Household Cross-sectional 1983 India 0.40-0.55
Dawson 1997 Aggregate Cross-sectional 1992 41 DCs 0.07
Dawson and Tiffin 1998 Aggregate Time-series 1961-1992 India 0.34
Roy 2001 Individual Panel 1976-1978 India <0-0.15
Dawson 2002 Aggregate Time-series 1961-1998 Pakistan 0.19
Gibson and Rozelle 2002 Household Cross-sectional 1985-1987 Papua New Guinea 0.18-0.59
Tiffin and Dawson 2002 Aggregate Time-series 1961-1992 Zimbabwe 0.31
Skoufias 2003 Household Cross-sectional 1996, 1999 Indonesia 0.01-0.45
Abdulai and Aubert 2004 Household Panel 1998-1999 Tanzania 0.49
Aromolaran 2004 Household Cross-sectional 1999-2000 Nigeria 0.19
Skoufias et. al 2009 Household Cross-sectional 2003-2004 Mexico <0-0.07
Meng, Gong, and Wang 2009 Household Panel 1986-2000 China 0.20-0.49
Babatunde et.al 2010 Household Cross-sectional 2006 Nigeria 0.18

28
Table 2. DIC for Functional Forms
Calories Carbs Protein Fats
Cubic -1180.25 -1109.16 -966.52 -738.66
Quadratic -1178.46 -1109.56 -967.91 -738.32
Linear -1180.93 -1102.93 -969.28 -741.57

29
Table 3. DIC for Restrictions Across Periods for Linear Models
Calories Carbs Protein Fats
Unrestricted -1180.93 -1102.93 -969.28 -741.57
Constant Elasticities -1178.20 -1103.60 -969.27 -733.40
Constant Intercept -1182.60 -1104.83 -971.27 -739.89
Constant All Parameters -1151.22 -1090.24 -947.37 -716.88

30
Table 4. Elasticity Estimates from Linear Panel Regression
Calories Carbohydrates Proteins Fats
Mean Stdv Mean Stdv Mean Stdv Mean Stdv
2003-05 0.086 0.006 0.020 0.007 0.140 0.009 0.230 0.014
1990-02 0.092 0.006 0.025 0.007 0.148 0.009 0.241 0.014
Difference 0.074 0.030 0.026 0.036 0.162 0.041 0.209 0.060

31
Table 5. Quantile Elasticity Estimates
Calories Carbohydrates Proteins Fats
2003-05 beta stdv beta stdv beta stdv beta stdv
0.75 0.083 0.009 0.016 0.007 0.130 0.012 0.197 0.020
0.50 0.088 0.007 0.020 0.009 0.140 0.007 0.229 0.016
0.25 0.089 0.010 0.026 0.010 0.152 0.011 0.257 0.024
1990-92 beta stdv beta stdv beta stdv beta stdv
0.75 0.093 0.008 0.019 0.007 0.137 0.012 0.217 0.018
0.50 0.094 0.007 0.019 0.010 0.147 0.010 0.264 0.021
0.25 0.094 0.008 0.028 0.007 0.156 0.014 0.274 0.027

32
Figure 1. Nutrient shares versus per capita income

33
Figure 2. Log nutrient consumption versus per capita income

34
Figure 3. Carbohydrate income elasticity
35
Table A1. List of Countries
Albania Denmark Laos St. Lucia
Algeria Djibouti Latvia St. Vincent & Grenadines
Angola Dominica Lebanon Samoa
Antigua and Barbuda Dominican Republic Lesotho Sao Tome and Principe
Argentina Ecuador Liberia Saudi Arabia
Armenia Egypt Libyan Arab Jamahiriya Senegal
Australia El Salvador Lithuania Serbia & Montenegro
Austria Eritrea Luxembourg Seychelles
Azerbaijan Estonia Madagascar Sierra Leone
Bahamas Ethiopia Malawi Slovakia
Bangladesh Fiji Malaysia Slovenia
Barbados Finland Maldives Solomon Islands
Belarus France Mali South Africa
Belgium French Polynesia Malta Spain
Belize Gabon Mauritania Sri Lanka
Benin Gambia Mauritius Sudan
Bermuda Georgia Mexico Suriname
Bolivia Germany Mongolia Swaziland
Bosnia and Herzegovina Ghana Morocco Sweden
Botswana Greece Mozambique Switzerland
Brazil Grenada Myanmar (Burma) Syrian Arab Republic
Brunei Darussalam Guatemala Namibia Tajikistan
Bulgaria Guinea Nepal Thailand
Burkina Faso Guinea-Bissau Netherlands Togo
Burundi Guyana New Caledonia Trinidad and Tobago
Cambodia Haiti New Zealand Tunisia
Cameroon Honduras Nicaragua Turkey
Canada Hungary Niger Turkmenistan
Cape Verde Iceland Nigeria Uganda
Central African Rep. India Norway Ukraine
Chad Indonesia Pakistan United Arab Emirates
Chile Iran Panama United Kingdom
China Ireland Paraguay Tanzania
Colombia Israel Peru United States of America
Comoros Italy Philippines Uruguay
Congo, Rep. of Jamaica Poland Uzbekistan
Costa Rica Japan Portugal Vanuatu
Côte d'Ivoire Jordan Rep. of Korea (S. Korea) Venezuela
Croatia Kazakhstan Republic of Moldova Viet Nam
Cuba Kenya Romania Yemen
Cyprus Kiribati Russian Federation Zambia
Czech Republic Kuwait Rwanda Zimbabwe
Dem. Rep. of the Congo Kyrgyzstan St. Kitts and Nevis