Impact of First Tower Earthing Resistance on Fast Front ...
20
energies Article Impact of First Tower Earthing Resistance on Fast Front Back-Flashover in a 66 kV Transmission System Abdullah H. Moselhy 1, * , Abdelaziz M. Abdel-Aziz 2 , Mahmoud Gilany 3 and Ahmed Emam 3, * 1 Smart Power Company, 10-A/4 Takseem El Laselky, New Maadi, Cairo 11742, Egypt 2 Electrical Engineering Department, Faculty of Engineering, Al-Azhar University, Cairo 11651, Egypt; [email protected] 3 Electrical Power Engineering Department, Faculty of Engineering, Cairo University, Giza 12613, Egypt; [email protected] * Correspondence: [email protected] (A.H.M.); [email protected] (A.E.); Tel.: +2-0106-651-4474 (A.H.M.); +2-0109-433-5676 (A.E.) Received: 29 June 2020; Accepted: 1 September 2020; Published: 8 September 2020 Abstract: Lightning stroke on a transmission tower structure is one of the major reasons that results in high voltages at the tower arms due to the excessive lightning current flowing through the transmission tower to earth. The Surge voltage seen at the tower cross arm on the first tower close to a substation is the worst case. If this voltage is higher than the withstand level of the insulator string, the insulation of substation equipment will be exposed to transient over-voltage called fast front back-flashover (FFBF). The peak of this transient overvoltage is affected by the value of the system’s earthing resistance. This paper studies the effect of reducing the grounding resistance of both the surge arrestor (SA) and the first transmission line tower adjacent to a 66 kV substation on FFBF. Three case studies using PSCAD/EMTDC software are presented to simulate the variation of the potential sire at the substation equipment with different resistance values for the first tower and SA earthing resistance. The paper also addresses the economic protection system for solving the problem of transient overvoltage. The study proves that the proper design of the first tower grounding system enhances the safety of the system and reduces the cost for the grounding system to the minimum. Keywords: back-flashover; insulation coordination; fast front transient study; footing resistance; lightning impulse withstand voltage; PSCAD/EMTDC 1. Introduction Fast front back-flashover (FFBF) is an effective phenomenon across the insulator. It occurs when a fast front time lightning stroke hits an overhead transmission line (OHTL) sky wire or overhead tower. The high-current flowing through the tower surge impedance and footing resistance produces a transient overvoltage on this tower [1]. If the voltage across the tower insulator exceeds the insulator voltage withstand capability, a back-flashover will occur causing a significant overvoltage on the power line. If the resulting overvoltage at the equipment exceeds the basic insulation level (BIL) of installed equipment, insulation damage will likely happen [2]. The insulation strength of any equipment must be selected to avoid damage in case of overvoltages related to lightning strikes. The occurred overvoltage includes fast front overvoltage (FFO), switching actions (slow front overvoltage (SFO)), or the phenomena related to fundamental frequency overvoltages (temporary overvoltage (TOV)). A suitable surge arrestor (SA) should be designed and located properly to avoid exceeding the basic insulation level (BIL) of equipment [3,4]. Energies 2020, 13, 4663; doi:10.3390/en13184663 www.mdpi.com/journal/energies
Transcript of Impact of First Tower Earthing Resistance on Fast Front ...
energies
Article
Impact of First Tower Earthing Resistance on FastFront Back-Flashover in a 66 kV Transmission System
Abdullah H. Moselhy 1,* , Abdelaziz M. Abdel-Aziz 2, Mahmoud Gilany 3 andAhmed Emam 3,*
1 Smart Power Company, 10-A/4 Takseem El Laselky, New Maadi, Cairo 11742, Egypt2 Electrical Engineering Department, Faculty of Engineering, Al-Azhar University, Cairo 11651, Egypt;
[email protected] Electrical Power Engineering Department, Faculty of Engineering, Cairo University, Giza 12613, Egypt;
[email protected]* Correspondence: [email protected] (A.H.M.); [email protected] (A.E.);
Tel.: +2-0106-651-4474 (A.H.M.); +2-0109-433-5676 (A.E.)
Received: 29 June 2020; Accepted: 1 September 2020; Published: 8 September 2020
Abstract: Lightning stroke on a transmission tower structure is one of the major reasons that resultsin high voltages at the tower arms due to the excessive lightning current flowing through thetransmission tower to earth. The Surge voltage seen at the tower cross arm on the first tower closeto a substation is the worst case. If this voltage is higher than the withstand level of the insulatorstring, the insulation of substation equipment will be exposed to transient over-voltage called fastfront back-flashover (FFBF). The peak of this transient overvoltage is affected by the value of thesystem’s earthing resistance. This paper studies the effect of reducing the grounding resistance ofboth the surge arrestor (SA) and the first transmission line tower adjacent to a 66 kV substation onFFBF. Three case studies using PSCAD/EMTDC software are presented to simulate the variation of thepotential sire at the substation equipment with different resistance values for the first tower and SAearthing resistance. The paper also addresses the economic protection system for solving the problemof transient overvoltage. The study proves that the proper design of the first tower grounding systemenhances the safety of the system and reduces the cost for the grounding system to the minimum.
Keywords: back-flashover; insulation coordination; fast front transient study; footing resistance;lightning impulse withstand voltage; PSCAD/EMTDC
1. Introduction
Fast front back-flashover (FFBF) is an effective phenomenon across the insulator. It occurs whena fast front time lightning stroke hits an overhead transmission line (OHTL) sky wire or overheadtower. The high-current flowing through the tower surge impedance and footing resistance produces atransient overvoltage on this tower [1]. If the voltage across the tower insulator exceeds the insulatorvoltage withstand capability, a back-flashover will occur causing a significant overvoltage on the powerline. If the resulting overvoltage at the equipment exceeds the basic insulation level (BIL) of installedequipment, insulation damage will likely happen [2].
The insulation strength of any equipment must be selected to avoid damage in case of overvoltagesrelated to lightning strikes. The occurred overvoltage includes fast front overvoltage (FFO), switchingactions (slow front overvoltage (SFO)), or the phenomena related to fundamental frequency overvoltages(temporary overvoltage (TOV)). A suitable surge arrestor (SA) should be designed and located properlyto avoid exceeding the basic insulation level (BIL) of equipment [3,4].
Energies 2020, 13, 4663; doi:10.3390/en13184663 www.mdpi.com/journal/energies
Energies 2020, 13, 4663 2 of 20
The effect of tower footing earthing resistance on the fast front back-flashover study has beenconducted in some research [4,5]. The striking current and the tower footing resistance values requiredto make back-flashover on the tower insulators are determined in [4,5]. According to these references,if the magnitude of lightning stroke is more than 50 kA, the back-flashover on the tower insulators willoccur whatever the value of the tower footing resistance.
The propagation of lightning surge is analyzed with the variation of tower footing resistancein [6]. The value of footing resistance was varying between 4–35 Ω, while the proper design for thetower footing resistance was found to be maintained between 5–6 Ω to avoid the electrical stresses onboth the power line insulation and surrounding structures [6]. Preventing the back-flashover on towerinsulators by controlling the towers’ footing resistance is studied in [4–6].
When a lightning strike hits the transmission tower or ground protection wire, a conducted surgevoltage on the tower structure will be produced. Another surge voltage with the same wave shapeand less magnitude will be induced on the power phases [7,8]. The voltage magnitude across to theinsulators is the same as the difference between the two surge voltages. The back flashover is expectedto occur on the phase which has the highest instantaneous power-frequency voltage value of oppositepolarity [3].
Reference [9] stated that when a lightning stroke current hits an object, the induced voltage isinversely proportional to the distance from the hit object. It also stated that the magnitude of inducedvoltage decreases while increasing striking distance. The maximum induced voltage is at the pointnearest to the strike point location.
Reference [10] studied the high efficient lightning protection system using underbuilt wires.The underbuilt wire has effective protection, easy for installation, and low cost. Nevertheless,it decreases the phases to ground clearance. So, the underbuilt wires are not appropriate for the oldtransmission lines with weak towers and for the road crossing lines, or crossing buildings, rivers, etc.,where high clearances to the ground are required.
Using counterpoise wires for the towers’ grounding system will improve in the earthing systempower frequency resistance value and the related impulse grounding resistance will be improved.The transient overvoltage will be decreased accordingly. In [11], the influences of the length ofcounterpoise earth wire are studied and the effective length formula for the counterpoise wire isproposed. The effective length of the counterpoise wire is in direct proportion to the soil resistivityvalues and front time of applied impulse current, while it varies inversely with the lighting currentmagnitude [11].
Reference [12] illustrates the guidelines for lightning surge analysis using the electromagnetictransient program (EMTP) recommended in Japan where a comparison study between lightning surgeanalysis using EMTP and the numerical electromagnetic analysis method is made in [13].
Reference [14] describes the factors affecting the back-flashover across insulator in a transmissionsystem. This study focused on the magnitude of lightning stroke current and front/tail times oflightning stroke impulse.
SA grounding resistance is important to protect the equipment against back-flashover, so a goodgrounding system for SA’s earthing point will considerably reduce the corresponding insulationbreakdowns. IEEE Std.80 [15] and IEEEStd.142 [16] standards recommend that surge arresters earthingresistance should be as low as possible and shall be connected by a direct path to the main groundingsystem. Also, UK earthing design standard EA TS 41-24 [17] and reference [18] stated that the surgearrester effectivity may be impaired unless connected to the low grounding resistance value. However,very low grounding resistance values may cause increasing the probabilities for surge arresters’ damagedue to the high discharged currents flowing through them and energy absorption capability [19].
The ground protection wires installed in the transmission lines are not sufficient to protect theelectrical network against lightning strikes. So, the towers footing resistances should be improved.Otherwise, the substation connected to these transmission lines is not safe against lightning stroke inthe adjacent towers [8].
Energies 2020, 13, 4663 3 of 20
Some techniques are introduced to control the back-flashover by reducing the grounding systemof the towers located closed to the substation [8,20]. These studies investigated the impact of keepingthe foot impedances of the first three towers or the first five to seven towers close to a minimum;however, no analysis, case studies, or recommendation criteria are presented in these references. Also,studying the impact of the first tower only has not been studied in these references.
Reference [21] studied the effect of installing lightning protection devices attached to towerinsulators (insulator with a built-in surge arrester) on reducing fast front overvoltage on distribution lines.
Reference [22] studied the performance of back-flashover with the installation of the multi-chamberinsulator arresters (MCIA) using software simulation to compare between transmission line model withand without MCIA. It is recommended to replace all the conventional insulators strings with MCIAstrings to protect the system from the back-flashover effect. Nevertheless, replacing all the conventionalinsulators with new MCIA insulators becomes a strenuous effort and a very costly solution.
Reference [23] studied the effect of changing tower footing resistance on FFO during FFBF in themedium voltage (MV) traction system.
Preventing back-flashover on tower insulators is investigated in [5,14] via determining themagnitude and shape of the lighting current that leads to back-flashover on the tower insulators.Moreover, some efforts were discussed in [9–11] to prevent the back-flashover on tower insulators byusing counterpoise wires to improve the towers’ footing resistance. Nevertheless, these researchersdid not study the transferred back-flashover on the phase conductors. They also did not analyze theeffect of the FFO on the substation components and they did not investigate the behavior of installedSA for overvoltage protection during the FFO.
The work proposed in [15–19] mentioned the importance of the SA earthing resistance to reducethe insulation breakdown. However, the detailed influence of SA earthing resistance on the FFO hasnot been studied. Furthermore, no analysis, case studies, results, or recommendation criteria for theSA earthing resistance are provided.
References [24–27] studied the behavior of power frequency earthing resistance and soil resistivityduring fast front overvoltages The different forms for impulse resistance with the lightning strikecurrent are illustrated. Nevertheless, the impact of reducing footing resistance is not investigated inthese studies.
The work proposed in [8,20,23] mentioned the importance of the interconnection between theearthing system of transmission lines and substation earthing mat. However, the detailed influence ofthe interconnection on the FFO has not been studied. Furthermore, no analysis, case studies, results,or advantages or disadvantages for the interconnection are provided.
The main contributions of the proposed approach in this paper can be summarized as follows:
1. Solving the insulation damage problem for the substation elements due to back-flashover byimproving the footing resistance of only the first adjacent tower to the substation. This isconsidered the most techno-economic solution to prevent substation equipment insulation damagedue to FFBF.
2. Economic evaluation and substantive costing studies are provided for the proposed technique.Hence, the study validated the proper design of the first tower grounding system, enhances thesafety of the system, and reduces the cost for the grounding system to the minimum.
3. The impact of the second, third, and fourth towers footing resistance on the FFO on the powerline during back-flashover is analyzed. Furthermore, the percentage of maximum overvoltagedecreasing (PMOD) for each tower due to FFBF is proposed.
4. The detailed influence of SA earthing resistance on the FFO to prevent the damage of equipmentinsulation is studied. Moreover, the recommended criteria for the SA earthing resistanceare provided.
5. The advantages and disadvantages of interconnection between the transmission line groundingsystem and substation grounding system on the calculation of fast front overvoltage (FFO) andground potential rise (GPR) are proposed in this paper.
Energies 2020, 13, 4663 4 of 20
The study in this paper starts in Section 2, where the guidelines for complete modeling of a 66 kVsubstation are presented. The modeling of the back-flashover is described in Section 3. Three casestudies and the simulations results are illustrated in Section 4 and the conclusions are presented inSection 5.
2. Power System Modeling
The proposed study was applied to a 66 kV transmission line for the following reasons:
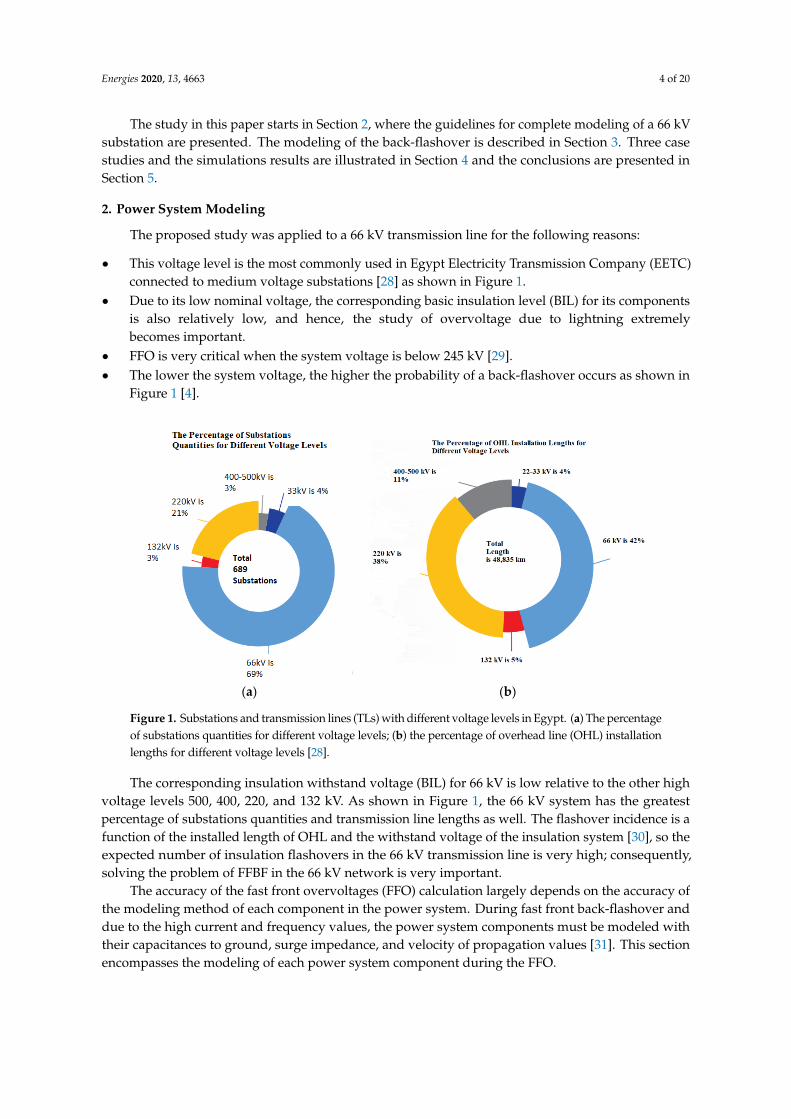
• This voltage level is the most commonly used in Egypt Electricity Transmission Company (EETC)connected to medium voltage substations [28] as shown in Figure 1.
• Due to its low nominal voltage, the corresponding basic insulation level (BIL) for its componentsis also relatively low, and hence, the study of overvoltage due to lightning extremelybecomes important.
• FFO is very critical when the system voltage is below 245 kV [29].• The lower the system voltage, the higher the probability of a back-flashover occurs as shown in
Figure 1 [4].
Energies 2020, 13, x FOR PEER REVIEW 4 of 22
5. The advantages and disadvantages of interconnection between the transmission line grounding system and substation grounding system on the calculation of fast front overvoltage (FFO) and ground potential rise (GPR) are proposed in this paper.
The study in this paper starts in Section 2, where the guidelines for complete modeling of a 66 kV substation are presented. The modeling of the back-flashover is described in Section 3. Three case studies and the simulations results are illustrated in Section 4 and the conclusions are presented in Section 5.
2. Power System Modeling
The proposed study was applied to a 66 kV transmission line for the following reasons:
• This voltage level is the most commonly used in Egypt Electricity Transmission Company (EETC) connected to medium voltage substations [28] as shown in Figure 1.
• Due to its low nominal voltage, the corresponding basic insulation level (BIL) for its components is also relatively low, and hence, the study of overvoltage due to lightning extremely becomes important.
• FFO is very critical when the system voltage is below 245 kV [29]. • The lower the system voltage, the higher the probability of a back-flashover occurs as shown in
Figure 1 [4].
(a) (b)
Figure 1. Substations and transmission lines (TLs) with different voltage levels in Egypt. (a) The percentage of substations quantities for different voltage levels; (b) the percentage of overhead line (OHL) installation lengths for different voltage levels [28].
The corresponding insulation withstand voltage (BIL) for 66 kV is low relative to the other high voltage levels 500, 400, 220, and 132 kV. As shown in Figure 1, the 66 kV system has the greatest percentage of substations quantities and transmission line lengths as well. The flashover incidence is a function of the installed length of OHL and the withstand voltage of the insulation system [30], so the expected number of insulation flashovers in the 66 kV transmission line is very high; consequently, solving the problem of FFBF in the 66 kV network is very important.
The accuracy of the fast front overvoltages (FFO) calculation largely depends on the accuracy of the modeling method of each component in the power system. During fast front back-flashover and due to the high current and frequency values, the power system components must be modeled with their capacitances to ground, surge impedance, and velocity of propagation values [31]. This section encompasses the modeling of each power system component during the FFO.
Figure 1. Substations and transmission lines (TLs) with different voltage levels in Egypt. (a) The percentageof substations quantities for different voltage levels; (b) the percentage of overhead line (OHL) installationlengths for different voltage levels [28].
The corresponding insulation withstand voltage (BIL) for 66 kV is low relative to the other highvoltage levels 500, 400, 220, and 132 kV. As shown in Figure 1, the 66 kV system has the greatestpercentage of substations quantities and transmission line lengths as well. The flashover incidence is afunction of the installed length of OHL and the withstand voltage of the insulation system [30], so theexpected number of insulation flashovers in the 66 kV transmission line is very high; consequently,solving the problem of FFBF in the 66 kV network is very important.
The accuracy of the fast front overvoltages (FFO) calculation largely depends on the accuracy ofthe modeling method of each component in the power system. During fast front back-flashover anddue to the high current and frequency values, the power system components must be modeled withtheir capacitances to ground, surge impedance, and velocity of propagation values [31]. This sectionencompasses the modeling of each power system component during the FFO.
Energies 2020, 13, 4663 5 of 20
2.1. Modeling of Tower
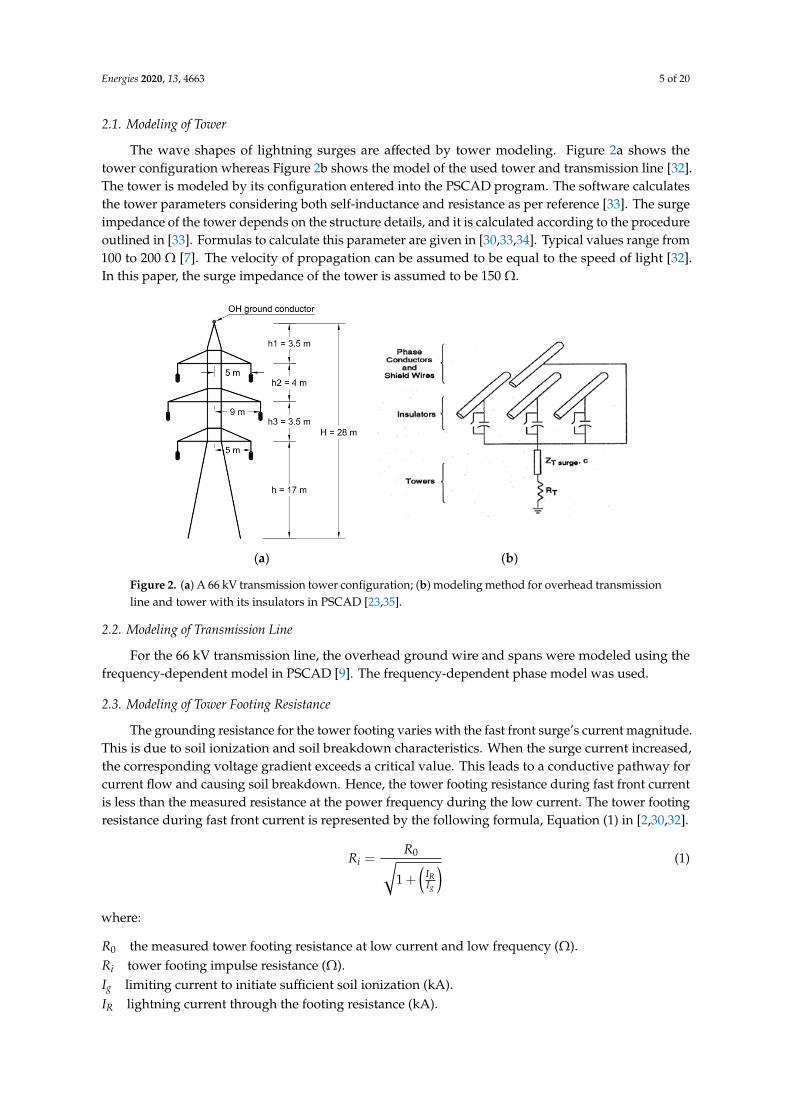
The wave shapes of lightning surges are affected by tower modeling. Figure 2a shows thetower configuration whereas Figure 2b shows the model of the used tower and transmission line [32].The tower is modeled by its configuration entered into the PSCAD program. The software calculatesthe tower parameters considering both self-inductance and resistance as per reference [33]. The surgeimpedance of the tower depends on the structure details, and it is calculated according to the procedureoutlined in [33]. Formulas to calculate this parameter are given in [30,33,34]. Typical values range from100 to 200 Ω [7]. The velocity of propagation can be assumed to be equal to the speed of light [32].In this paper, the surge impedance of the tower is assumed to be 150 Ω.
Energies 2020, 13, x FOR PEER REVIEW 5 of 22
2.1. Modeling of Tower
The wave shapes of lightning surges are affected by tower modeling. Figure 2a shows the tower configuration whereas Figure 2b shows the model of the used tower and transmission line [32]. The tower is modeled by its configuration entered into the PSCAD program. The software calculates the tower parameters considering both self-inductance and resistance as per reference [33]. The surge impedance of the tower depends on the structure details, and it is calculated according to the procedure outlined in [33]. Formulas to calculate this parameter are given in [30,33,34]. Typical values range from 100 to 200 Ω [7]. The velocity of propagation can be assumed to be equal to the speed of light [32]. In this paper, the surge impedance of the tower is assumed to be 150 Ω.
(a) (b)
Figure 2. (a) A 66 kV transmission tower configuration; (b) modeling method for overhead transmission line and tower with its insulators in PSCAD [23,35].
2.2. Modeling of Transmission Line
For the 66 kV transmission line, the overhead ground wire and spans were modeled using the frequency-dependent model in PSCAD [9]. The frequency-dependent phase model was used.
2.3. Modeling of Tower Footing Resistance
The grounding resistance for the tower footing varies with the fast front surge’s current magnitude. This is due to soil ionization and soil breakdown characteristics. When the surge current increased, the corresponding voltage gradient exceeds a critical value. This leads to a conductive pathway for current flow and causing soil breakdown. Hence, the tower footing resistance during fast front current is less than the measured resistance at the power frequency during the low current. The tower footing resistance during fast front current is represented by the following formula, Equation (1) in [2,30,32].
0
1i
R
g
RRII
= +
(1)
where:
R0 the measured tower footing resistance at low current and low frequency (Ω). Ri tower footing impulse resistance (Ω). Ig limiting current to initiate sufficient soil ionization (kA). IR lightning current through the footing resistance (kA).
Figure 2. (a) A 66 kV transmission tower configuration; (b) modeling method for overhead transmissionline and tower with its insulators in PSCAD [23,35].
2.2. Modeling of Transmission Line
For the 66 kV transmission line, the overhead ground wire and spans were modeled using thefrequency-dependent model in PSCAD [9]. The frequency-dependent phase model was used.
2.3. Modeling of Tower Footing Resistance
The grounding resistance for the tower footing varies with the fast front surge’s current magnitude.This is due to soil ionization and soil breakdown characteristics. When the surge current increased,the corresponding voltage gradient exceeds a critical value. This leads to a conductive pathway forcurrent flow and causing soil breakdown. Hence, the tower footing resistance during fast front currentis less than the measured resistance at the power frequency during the low current. The tower footingresistance during fast front current is represented by the following formula, Equation (1) in [2,30,32].
Ri =R0√
1 +(
IRIg
) (1)
where:
R0 the measured tower footing resistance at low current and low frequency (Ω).Ri tower footing impulse resistance (Ω).Ig limiting current to initiate sufficient soil ionization (kA).IR lightning current through the footing resistance (kA).
Energies 2020, 13, 4663 6 of 20
The limiting current is a function of soil ionization and is given by Equation (2) [30]:
Ig =1
2πE0ρ
R20
(2)
where:
ρ soil resistivity (Ωm) and can be considered about 800 Ωm.E0 soil ionization gradient and can be considered about 400 kV/m.
As per IEEE 80 [14], the sandy loam soil resistivity is 800 Ωm, and the average soil resistivity fordry soil is 1000 Ωm. Most of the new projects in Egypt are located in the east and west Egyptian desert,where the soil is sandy. So, 800 Ωm value is assumed.
The towers’ footing resistance is modeled by impulse resistance instead of the measuredlow-frequency footing resistance.
2.4. Modeling of Line Insulators
The tower insulators are modeled as capacitors. The insulator capacitance is around 10 pF.So, each line insulator is represented in the PSCAD model with a 10 pF capacitor [2,32].
2.5. Modeling of Surge Arrester
The surge arrester is designed to limit transient overvoltages and divert current waves to earththrough its nonlinear resistance and limit the amplitude of this overvoltage to a value less than BIL ofthe substation protected equipment.
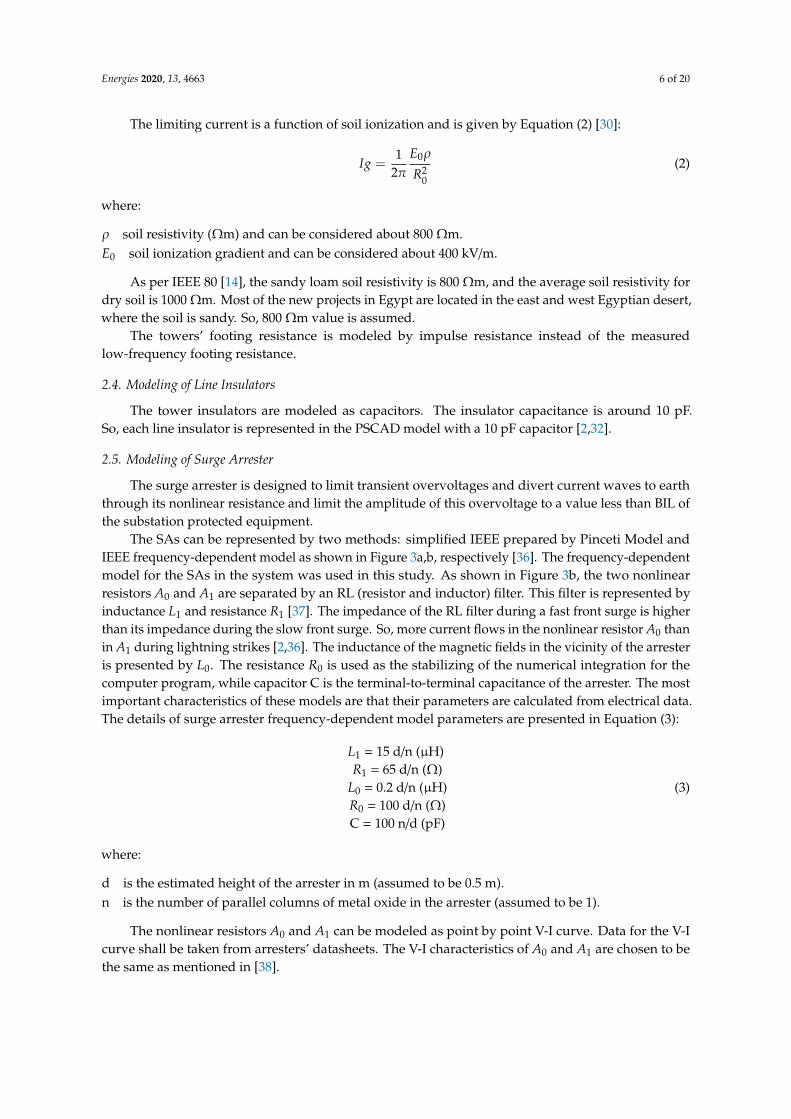
The SAs can be represented by two methods: simplified IEEE prepared by Pinceti Model andIEEE frequency-dependent model as shown in Figure 3a,b, respectively [36]. The frequency-dependentmodel for the SAs in the system was used in this study. As shown in Figure 3b, the two nonlinearresistors A0 and A1 are separated by an RL (resistor and inductor) filter. This filter is represented byinductance L1 and resistance R1 [37]. The impedance of the RL filter during a fast front surge is higherthan its impedance during the slow front surge. So, more current flows in the nonlinear resistor A0 thanin A1 during lightning strikes [2,36]. The inductance of the magnetic fields in the vicinity of the arresteris presented by L0. The resistance R0 is used as the stabilizing of the numerical integration for thecomputer program, while capacitor C is the terminal-to-terminal capacitance of the arrester. The mostimportant characteristics of these models are that their parameters are calculated from electrical data.The details of surge arrester frequency-dependent model parameters are presented in Equation (3):
L1 = 15 d/n (µH)R1 = 65 d/n (Ω)
L0 = 0.2 d/n (µH)R0 = 100 d/n (Ω)C = 100 n/d (pF)
(3)
where:
d is the estimated height of the arrester in m (assumed to be 0.5 m).n is the number of parallel columns of metal oxide in the arrester (assumed to be 1).
The nonlinear resistors A0 and A1 can be modeled as point by point V-I curve. Data for the V-Icurve shall be taken from arresters’ datasheets. The V-I characteristics of A0 and A1 are chosen to bethe same as mentioned in [38].
Energies 2020, 13, 4663 7 of 20Energies 2020, 13, x FOR PEER REVIEW 7 of 22
(a) (b)
Figure 3. (a) Surge arrestor SA simplified IEEE model prepared by Pinceti; (b) SA IEEE frequency-dependent model.
2.6. Modeling of Voltage and Current Transformers
The voltage and current transformers were simulated by their stray capacitance to the ground, which was 500 and 250 pF, respectively [2,32,35].
2.7. Modeling of Disconnecting Switch
The disconnecting switch was simulated by its stray capacitance to the ground. The capacitance-to-ground was 100 pF [2,32,35].
2.8. Modeling of Bus-Bar Support Insulator
The bus-bar support insulator was simulated by its stray capacitances to ground. The capacitance-to-ground was 80 pF [2,32,35].
2.9. Modeling of Circuit Breaker
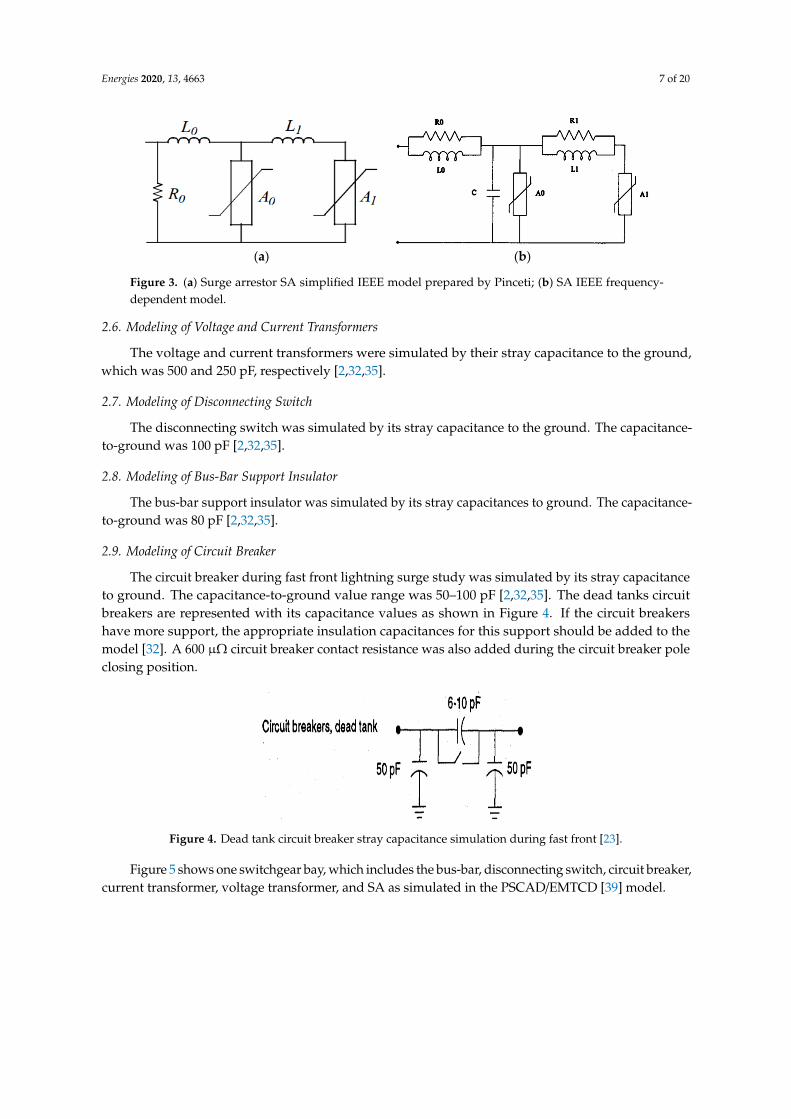
The circuit breaker during fast front lightning surge study was simulated by its stray capacitance to ground. The capacitance-to-ground value range was 50–100 pF [2,32,35]. The dead tanks circuit breakers are represented with its capacitance values as shown in Figure 4. If the circuit breakers have more support, the appropriate insulation capacitances for this support should be added to the model [32]. A 600 µΩ circuit breaker contact resistance was also added during the circuit breaker pole closing position.
Figure 4. Dead tank circuit breaker stray capacitance simulation during fast front [23].
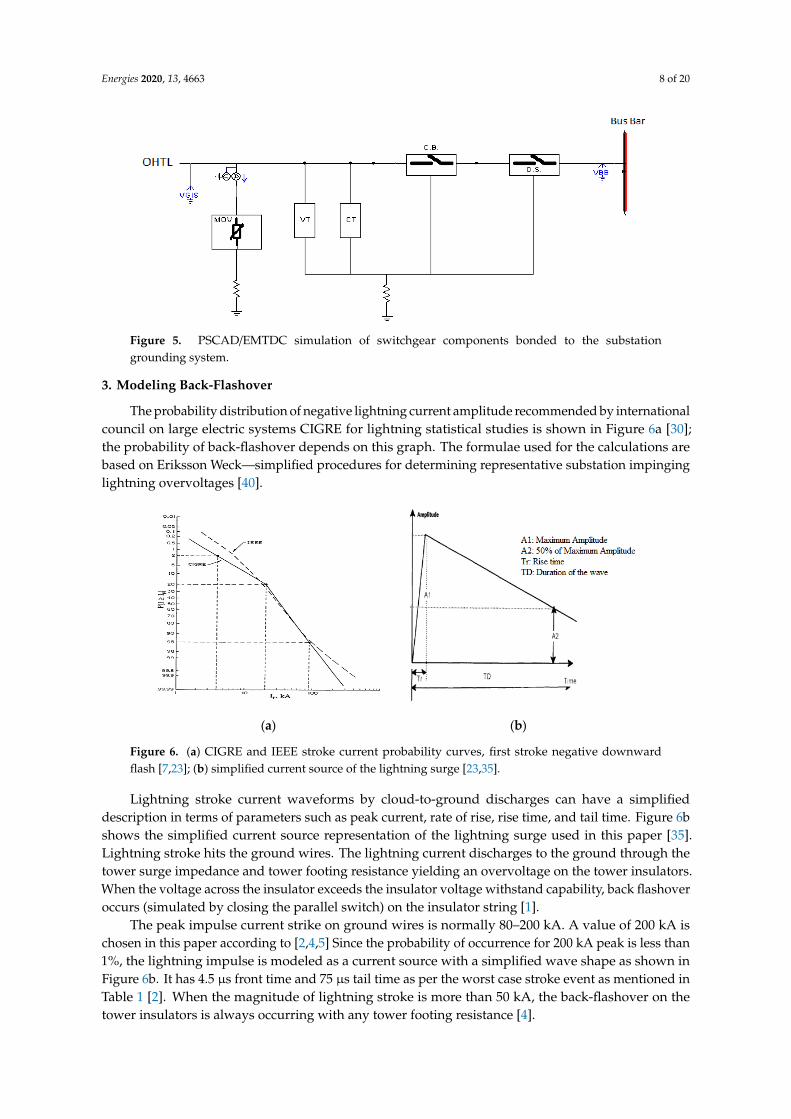
Figure 5 shows one switchgear bay, which includes the bus-bar, disconnecting switch, circuit breaker, current transformer, voltage transformer, and SA as simulated in the PSCAD/EMTCD [39] model.
Figure 3. (a) Surge arrestor SA simplified IEEE model prepared by Pinceti; (b) SA IEEE frequency-dependent model.
2.6. Modeling of Voltage and Current Transformers
The voltage and current transformers were simulated by their stray capacitance to the ground,which was 500 and 250 pF, respectively [2,32,35].
2.7. Modeling of Disconnecting Switch
The disconnecting switch was simulated by its stray capacitance to the ground. The capacitance-to-ground was 100 pF [2,32,35].
2.8. Modeling of Bus-Bar Support Insulator
The bus-bar support insulator was simulated by its stray capacitances to ground. The capacitance-to-ground was 80 pF [2,32,35].
2.9. Modeling of Circuit Breaker
The circuit breaker during fast front lightning surge study was simulated by its stray capacitanceto ground. The capacitance-to-ground value range was 50–100 pF [2,32,35]. The dead tanks circuitbreakers are represented with its capacitance values as shown in Figure 4. If the circuit breakershave more support, the appropriate insulation capacitances for this support should be added to themodel [32]. A 600 µΩ circuit breaker contact resistance was also added during the circuit breaker poleclosing position.
Energies 2020, 13, x FOR PEER REVIEW 7 of 22
(a) (b)
Figure 3. (a) Surge arrestor SA simplified IEEE model prepared by Pinceti; (b) SA IEEE frequency-dependent model.
2.6. Modeling of Voltage and Current Transformers
The voltage and current transformers were simulated by their stray capacitance to the ground, which was 500 and 250 pF, respectively [2,32,35].
2.7. Modeling of Disconnecting Switch
The disconnecting switch was simulated by its stray capacitance to the ground. The capacitance-to-ground was 100 pF [2,32,35].
2.8. Modeling of Bus-Bar Support Insulator
The bus-bar support insulator was simulated by its stray capacitances to ground. The capacitance-to-ground was 80 pF [2,32,35].
2.9. Modeling of Circuit Breaker
The circuit breaker during fast front lightning surge study was simulated by its stray capacitance to ground. The capacitance-to-ground value range was 50–100 pF [2,32,35]. The dead tanks circuit breakers are represented with its capacitance values as shown in Figure 4. If the circuit breakers have more support, the appropriate insulation capacitances for this support should be added to the model [32]. A 600 µΩ circuit breaker contact resistance was also added during the circuit breaker pole closing position.
Figure 4. Dead tank circuit breaker stray capacitance simulation during fast front [23].
Figure 5 shows one switchgear bay, which includes the bus-bar, disconnecting switch, circuit breaker, current transformer, voltage transformer, and SA as simulated in the PSCAD/EMTCD [39] model.
Figure 4. Dead tank circuit breaker stray capacitance simulation during fast front [23].
Figure 5 shows one switchgear bay, which includes the bus-bar, disconnecting switch, circuit breaker,current transformer, voltage transformer, and SA as simulated in the PSCAD/EMTCD [39] model.
Energies 2020, 13, 4663 8 of 20Energies 2020, 13, x FOR PEER REVIEW 8 of 22
Figure 5. PSCAD/EMTDC simulation of switchgear components bonded to the substation grounding system.
3. Modeling Back-Flashover
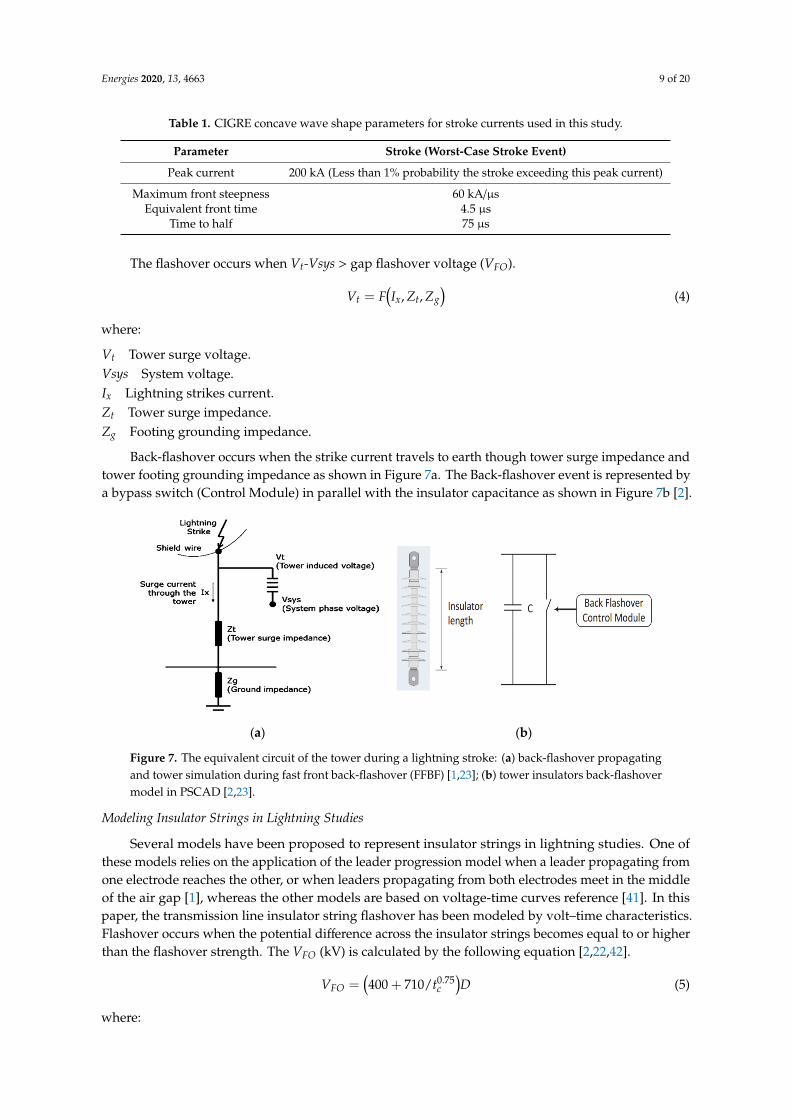
The probability distribution of negative lightning current amplitude recommended by international council on large electric systems CIGRE for lightning statistical studies is shown in Figure 6a [30]; the probability of back-flashover depends on this graph. The formulae used for the calculations are based on Eriksson Weck—simplified procedures for determining representative substation impinging lightning overvoltages [40].
Lightning stroke current waveforms by cloud-to-ground discharges can have a simplified description in terms of parameters such as peak current, rate of rise, rise time, and tail time. Figure 6b shows the simplified current source representation of the lightning surge used in this paper [35]. Lightning stroke hits the ground wires. The lightning current discharges to the ground through the tower surge impedance and tower footing resistance yielding an overvoltage on the tower insulators. When the voltage across the insulator exceeds the insulator voltage withstand capability, back flashover occurs (simulated by closing the parallel switch) on the insulator string [1].
The peak impulse current strike on ground wires is normally 80–200 kA. A value of 200 kA is chosen in this paper according to [2,4,5] Since the probability of occurrence for 200 kA peak is less than 1%, the lightning impulse is modeled as a current source with a simplified wave shape as shown in Figure 6b. It has 4.5 µs front time and 75 µs tail time as per the worst case stroke event as mentioned in Table 1 [2]. When the magnitude of lightning stroke is more than 50 kA, the back-flashover on the tower insulators is always occurring with any tower footing resistance [4].
(a) (b)
Figure 6. (a) CIGRE and IEEE stroke current probability curves, first stroke negative downward flash [7,23]; (b) simplified current source of the lightning surge [23,35].
Figure 5. PSCAD/EMTDC simulation of switchgear components bonded to the substationgrounding system.
3. Modeling Back-Flashover
The probability distribution of negative lightning current amplitude recommended by internationalcouncil on large electric systems CIGRE for lightning statistical studies is shown in Figure 6a [30];the probability of back-flashover depends on this graph. The formulae used for the calculations arebased on Eriksson Weck—simplified procedures for determining representative substation impinginglightning overvoltages [40].
Energies 2020, 13, x FOR PEER REVIEW 8 of 22
Figure 5. PSCAD/EMTDC simulation of switchgear components bonded to the substation grounding system.
3. Modeling Back-Flashover
The probability distribution of negative lightning current amplitude recommended by international council on large electric systems CIGRE for lightning statistical studies is shown in Figure 6a [30]; the probability of back-flashover depends on this graph. The formulae used for the calculations are based on Eriksson Weck—simplified procedures for determining representative substation impinging lightning overvoltages [40].
Lightning stroke current waveforms by cloud-to-ground discharges can have a simplified description in terms of parameters such as peak current, rate of rise, rise time, and tail time. Figure 6b shows the simplified current source representation of the lightning surge used in this paper [35]. Lightning stroke hits the ground wires. The lightning current discharges to the ground through the tower surge impedance and tower footing resistance yielding an overvoltage on the tower insulators. When the voltage across the insulator exceeds the insulator voltage withstand capability, back flashover occurs (simulated by closing the parallel switch) on the insulator string [1].
The peak impulse current strike on ground wires is normally 80–200 kA. A value of 200 kA is chosen in this paper according to [2,4,5] Since the probability of occurrence for 200 kA peak is less than 1%, the lightning impulse is modeled as a current source with a simplified wave shape as shown in Figure 6b. It has 4.5 µs front time and 75 µs tail time as per the worst case stroke event as mentioned in Table 1 [2]. When the magnitude of lightning stroke is more than 50 kA, the back-flashover on the tower insulators is always occurring with any tower footing resistance [4].
(a) (b)
Figure 6. (a) CIGRE and IEEE stroke current probability curves, first stroke negative downward flash [7,23]; (b) simplified current source of the lightning surge [23,35]. Figure 6. (a) CIGRE and IEEE stroke current probability curves, first stroke negative downwardflash [7,23]; (b) simplified current source of the lightning surge [23,35].
Lightning stroke current waveforms by cloud-to-ground discharges can have a simplifieddescription in terms of parameters such as peak current, rate of rise, rise time, and tail time. Figure 6bshows the simplified current source representation of the lightning surge used in this paper [35].Lightning stroke hits the ground wires. The lightning current discharges to the ground through thetower surge impedance and tower footing resistance yielding an overvoltage on the tower insulators.When the voltage across the insulator exceeds the insulator voltage withstand capability, back flashoveroccurs (simulated by closing the parallel switch) on the insulator string [1].
The peak impulse current strike on ground wires is normally 80–200 kA. A value of 200 kA ischosen in this paper according to [2,4,5] Since the probability of occurrence for 200 kA peak is less than1%, the lightning impulse is modeled as a current source with a simplified wave shape as shown inFigure 6b. It has 4.5 µs front time and 75 µs tail time as per the worst case stroke event as mentioned inTable 1 [2]. When the magnitude of lightning stroke is more than 50 kA, the back-flashover on thetower insulators is always occurring with any tower footing resistance [4].
Energies 2020, 13, 4663 9 of 20
Table 1. CIGRE concave wave shape parameters for stroke currents used in this study.
Parameter Stroke (Worst-Case Stroke Event)
Peak current 200 kA (Less than 1% probability the stroke exceeding this peak current)
Maximum front steepness 60 kA/µsEquivalent front time 4.5 µs
Time to half 75 µs
The flashover occurs when Vt-Vsys > gap flashover voltage (VFO).
Vt = F(Ix, Zt, Zg
)(4)
where:
Vt Tower surge voltage.Vsys System voltage.Ix Lightning strikes current.Zt Tower surge impedance.Zg Footing grounding impedance.
Back-flashover occurs when the strike current travels to earth though tower surge impedance andtower footing grounding impedance as shown in Figure 7a. The Back-flashover event is represented bya bypass switch (Control Module) in parallel with the insulator capacitance as shown in Figure 7b [2].
Energies 2020, 13, x FOR PEER REVIEW 9 of 22
The flashover occurs when Vt-Vsys > gap flashover voltage (VFO).
( )gtxt ZZIFV ,,= (4)
where:
Vt Tower surge voltage. Vsys System voltage. Ix Lightning strikes current. Zt Tower surge impedance. Zg Footing grounding impedance.
Table 1. CIGRE concave wave shape parameters for stroke currents used in this study.
Parameter Stroke (Worst-Case Stroke Event)
Peak current 200 kA (Less than 1% probability the stroke exceeding this peak current)
Maximum front steepness 60 kA/µs Equivalent front time 4.5 µs
Time to half 75 µs
Back-flashover occurs when the strike current travels to earth though tower surge impedance and tower footing grounding impedance as shown in Figure 7a. The Back-flashover event is represented by a bypass switch (Control Module) in parallel with the insulator capacitance as shown in Figure 7b [2].
(a) (b)
Figure 7. The equivalent circuit of the tower during a lightning stroke: (a) back-flashover propagating and tower simulation during fast front back-flashover (FFBF) [1,23]; (b) tower insulators back-flashover model in PSCAD [2,23].
Modeling Insulator Strings in Lightning Studies
Several models have been proposed to represent insulator strings in lightning studies. One of these models relies on the application of the leader progression model when a leader propagating from one electrode reaches the other, or when leaders propagating from both electrodes meet in the middle of the air gap [1], whereas the other models are based on voltage-time curves reference [41]. In this paper, the transmission line insulator string flashover has been modeled by volt–time characteristics. Flashover occurs when the potential difference across the insulator strings becomes equal to or higher than the flashover strength. The VFO (kV) is calculated by the following equation [2,22,42].
400 710/ . (5)
Figure 7. The equivalent circuit of the tower during a lightning stroke: (a) back-flashover propagatingand tower simulation during fast front back-flashover (FFBF) [1,23]; (b) tower insulators back-flashovermodel in PSCAD [2,23].
Modeling Insulator Strings in Lightning Studies
Several models have been proposed to represent insulator strings in lightning studies. One ofthese models relies on the application of the leader progression model when a leader propagating fromone electrode reaches the other, or when leaders propagating from both electrodes meet in the middleof the air gap [1], whereas the other models are based on voltage-time curves reference [41]. In thispaper, the transmission line insulator string flashover has been modeled by volt–time characteristics.Flashover occurs when the potential difference across the insulator strings becomes equal to or higherthan the flashover strength. The VFO (kV) is calculated by the following equation [2,22,42].
VFO =(400 + 710/t0.75
c
)D (5)
where:
Energies 2020, 13, 4663 10 of 20
D (m) The insulator string length.tc (µs) The time to flashover.
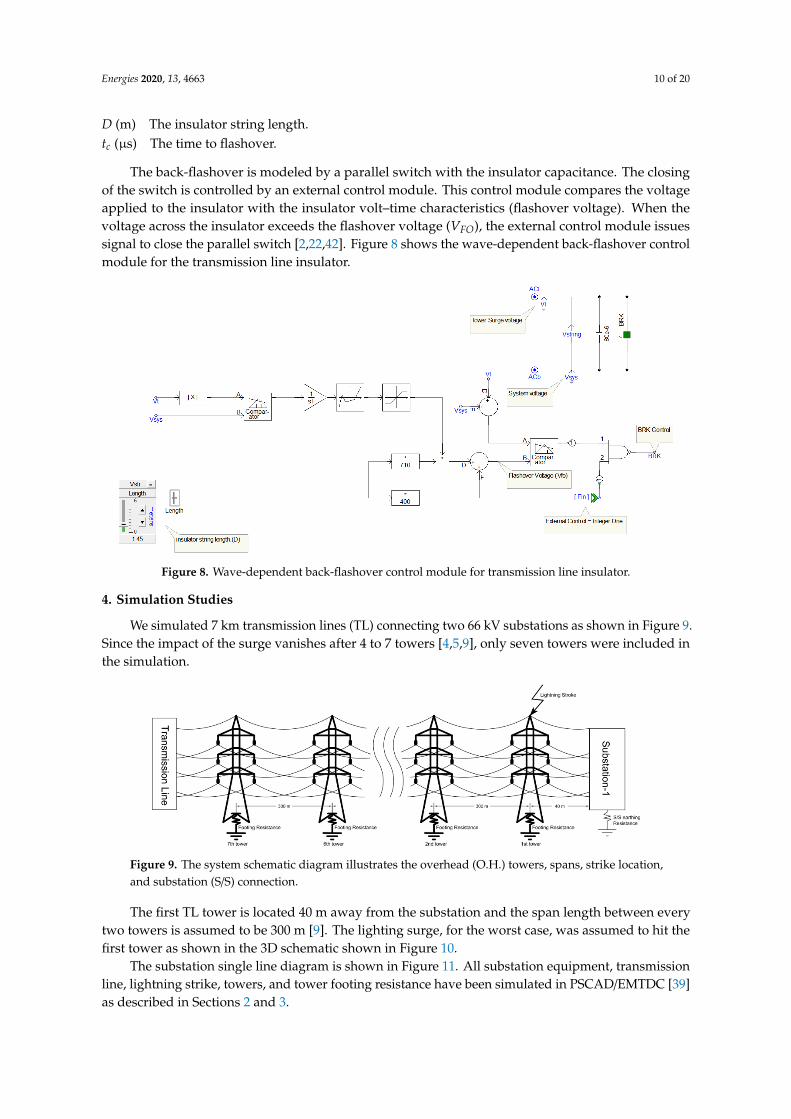
The back-flashover is modeled by a parallel switch with the insulator capacitance. The closingof the switch is controlled by an external control module. This control module compares the voltageapplied to the insulator with the insulator volt–time characteristics (flashover voltage). When thevoltage across the insulator exceeds the flashover voltage (VFO), the external control module issuessignal to close the parallel switch [2,22,42]. Figure 8 shows the wave-dependent back-flashover controlmodule for the transmission line insulator.
Energies 2020, 13, x FOR PEER REVIEW 10 of 22
where:
D (m) The insulator string length. tc (µs) The time to flashover.
The back-flashover is modeled by a parallel switch with the insulator capacitance. The closing of the switch is controlled by an external control module. This control module compares the voltage applied to the insulator with the insulator volt–time characteristics (flashover voltage). When the voltage across the insulator exceeds the flashover voltage (VFO), the external control module issues signal to close the parallel switch [2,22,42]. Figure 8 shows the wave-dependent back-flashover control module for the transmission line insulator.
Figure 8. Wave-dependent back-flashover control module for transmission line insulator.
4. Simulation Studies
We simulated 7 km transmission lines (TL) connecting two 66 kV substations as shown in Figure 9. Since the impact of the surge vanishes after 4 to 7 towers [4,5,9], only seven towers were included in the simulation.
Figure 9 The system schematic diagram illustrates the overhead (O.H.) towers, spans, strike location, and substation (S/S) connection.
The first TL tower is located 40 m away from the substation and the span length between every two towers is assumed to be 300 m [9]. The lighting surge, for the worst case, was assumed to hit the first tower as shown in the 3D schematic shown in Figure 10.
Figure 8. Wave-dependent back-flashover control module for transmission line insulator.
4. Simulation Studies
We simulated 7 km transmission lines (TL) connecting two 66 kV substations as shown in Figure 9.Since the impact of the surge vanishes after 4 to 7 towers [4,5,9], only seven towers were included inthe simulation.
Energies 2020, 13, x FOR PEER REVIEW 10 of 22
where:
D (m) The insulator string length. tc (µs) The time to flashover.
The back-flashover is modeled by a parallel switch with the insulator capacitance. The closing of the switch is controlled by an external control module. This control module compares the voltage applied to the insulator with the insulator volt–time characteristics (flashover voltage). When the voltage across the insulator exceeds the flashover voltage (VFO), the external control module issues signal to close the parallel switch [2,22,42]. Figure 8 shows the wave-dependent back-flashover control module for the transmission line insulator.
Figure 8. Wave-dependent back-flashover control module for transmission line insulator.
4. Simulation Studies
We simulated 7 km transmission lines (TL) connecting two 66 kV substations as shown in Figure 9. Since the impact of the surge vanishes after 4 to 7 towers [4,5,9], only seven towers were included in the simulation.
Figure 9 The system schematic diagram illustrates the overhead (O.H.) towers, spans, strike location, and substation (S/S) connection.
The first TL tower is located 40 m away from the substation and the span length between every two towers is assumed to be 300 m [9]. The lighting surge, for the worst case, was assumed to hit the first tower as shown in the 3D schematic shown in Figure 10.
Figure 9. The system schematic diagram illustrates the overhead (O.H.) towers, spans, strike location,and substation (S/S) connection.
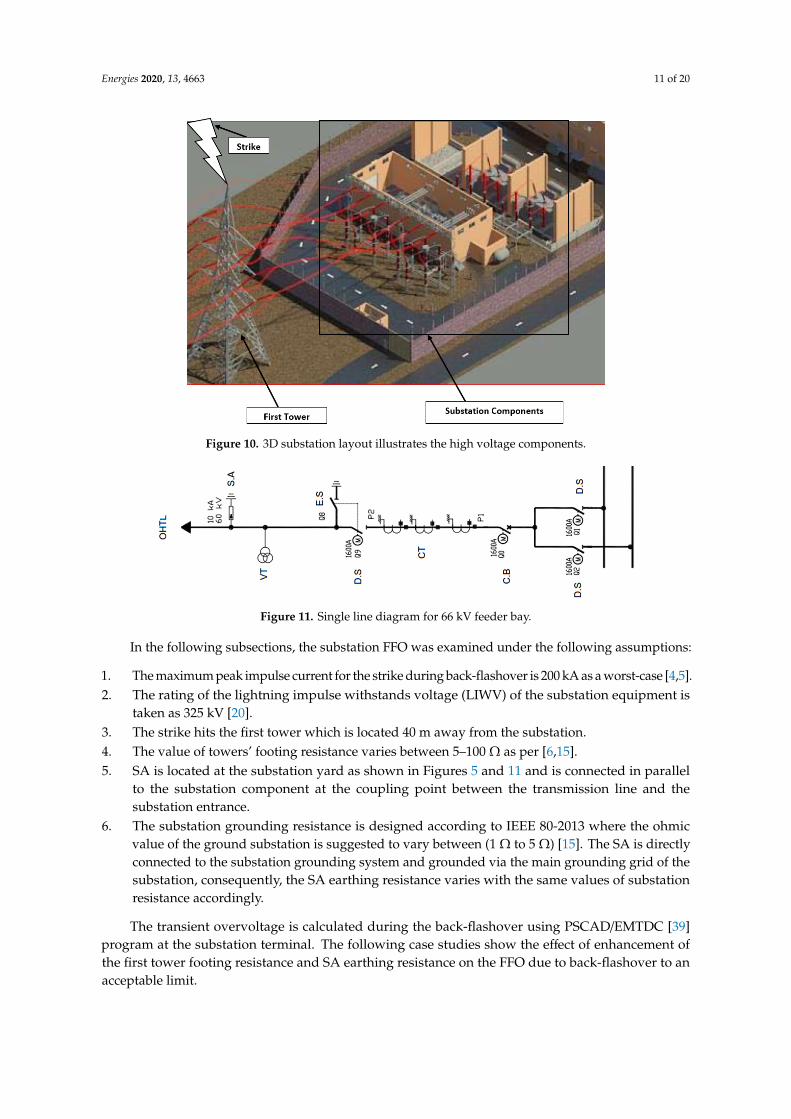
The first TL tower is located 40 m away from the substation and the span length between everytwo towers is assumed to be 300 m [9]. The lighting surge, for the worst case, was assumed to hit thefirst tower as shown in the 3D schematic shown in Figure 10.
The substation single line diagram is shown in Figure 11. All substation equipment, transmissionline, lightning strike, towers, and tower footing resistance have been simulated in PSCAD/EMTDC [39]as described in Sections 2 and 3.
Energies 2020, 13, 4663 11 of 20Energies 2020, 13, x FOR PEER REVIEW 11 of 22
Figure 10. 3D substation layout illustrates the high voltage components.
The substation single line diagram is shown in Figure 11. All substation equipment, transmission line, lightning strike, towers, and tower footing resistance have been simulated in PSCAD/EMTDC [39] as described in Sections 2 and 3.
Figure 11. Single line diagram for 66 kV feeder bay.
In the following subsections, the substation FFO was examined under the following assumptions:
1. The maximum peak impulse current for the strike during back-flashover is 200 kA as a worst-case [4,5].
2. The rating of the lightning impulse withstands voltage (LIWV) of the substation equipment is taken as 325 kV [20].
3. The strike hits the first tower which is located 40 m away from the substation. 4. The value of towers’ footing resistance varies between 5–100 Ω as per [6,15]. 5. SA is located at the substation yard as shown in Figures 5 and 11 and is connected in parallel to
the substation component at the coupling point between the transmission line and the substation entrance.
6. The substation grounding resistance is designed according to IEEE 80-2013 where the ohmic value of the ground substation is suggested to vary between (1 Ω to 5 Ω) [15]. The SA is directly connected to the substation grounding system and grounded via the main grounding grid of the substation, consequently, the SA earthing resistance varies with the same values of substation resistance accordingly.
Figure 10. 3D substation layout illustrates the high voltage components.
Energies 2020, 13, x FOR PEER REVIEW 11 of 22
Figure 10. 3D substation layout illustrates the high voltage components.
The substation single line diagram is shown in Figure 11. All substation equipment, transmission line, lightning strike, towers, and tower footing resistance have been simulated in PSCAD/EMTDC [39] as described in Sections 2 and 3.
Figure 11. Single line diagram for 66 kV feeder bay.
In the following subsections, the substation FFO was examined under the following assumptions:
1. The maximum peak impulse current for the strike during back-flashover is 200 kA as a worst-case [4,5].
2. The rating of the lightning impulse withstands voltage (LIWV) of the substation equipment is taken as 325 kV [20].
3. The strike hits the first tower which is located 40 m away from the substation. 4. The value of towers’ footing resistance varies between 5–100 Ω as per [6,15]. 5. SA is located at the substation yard as shown in Figures 5 and 11 and is connected in parallel to
the substation component at the coupling point between the transmission line and the substation entrance.
6. The substation grounding resistance is designed according to IEEE 80-2013 where the ohmic value of the ground substation is suggested to vary between (1 Ω to 5 Ω) [15]. The SA is directly connected to the substation grounding system and grounded via the main grounding grid of the substation, consequently, the SA earthing resistance varies with the same values of substation resistance accordingly.
Figure 11. Single line diagram for 66 kV feeder bay.
In the following subsections, the substation FFO was examined under the following assumptions:
1. The maximum peak impulse current for the strike during back-flashover is 200 kA as a worst-case [4,5].2. The rating of the lightning impulse withstands voltage (LIWV) of the substation equipment is
taken as 325 kV [20].3. The strike hits the first tower which is located 40 m away from the substation.4. The value of towers’ footing resistance varies between 5–100 Ω as per [6,15].5. SA is located at the substation yard as shown in Figures 5 and 11 and is connected in parallel
to the substation component at the coupling point between the transmission line and thesubstation entrance.
6. The substation grounding resistance is designed according to IEEE 80-2013 where the ohmicvalue of the ground substation is suggested to vary between (1 Ω to 5 Ω) [15]. The SA is directlyconnected to the substation grounding system and grounded via the main grounding grid of thesubstation, consequently, the SA earthing resistance varies with the same values of substationresistance accordingly.
The transient overvoltage is calculated during the back-flashover using PSCAD/EMTDC [39]program at the substation terminal. The following case studies show the effect of enhancement ofthe first tower footing resistance and SA earthing resistance on the FFO due to back-flashover to anacceptable limit.
Energies 2020, 13, 4663 12 of 20
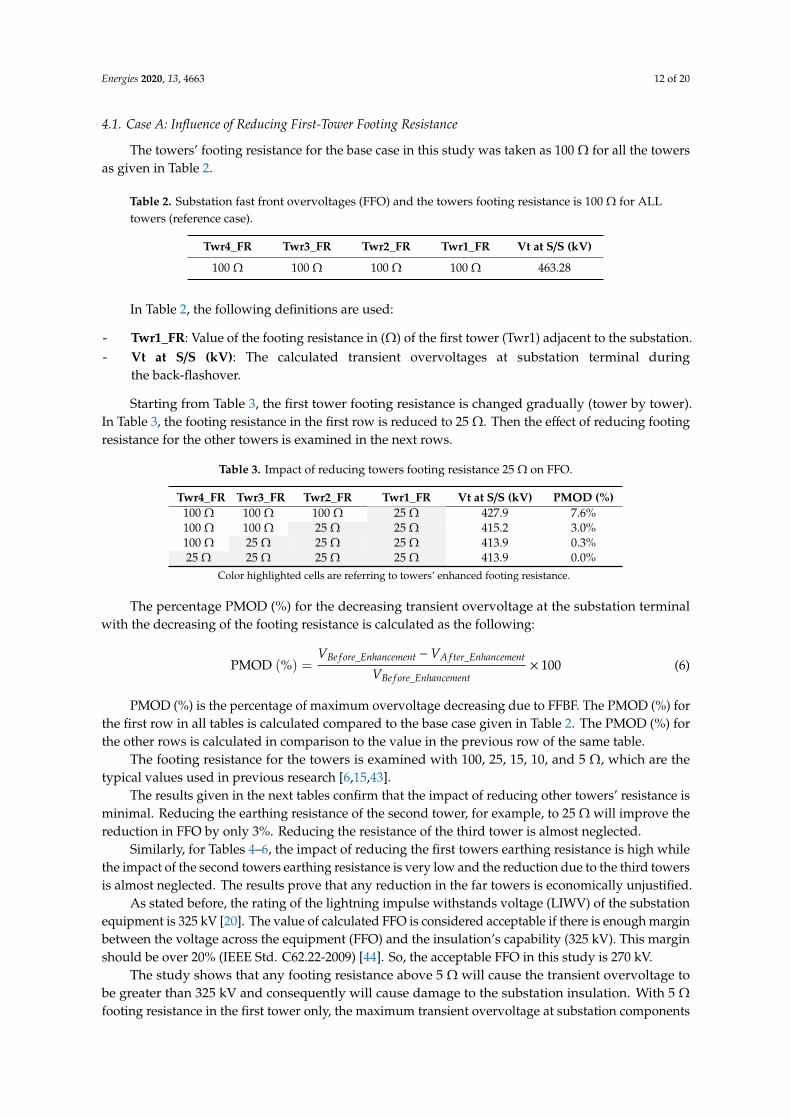
4.1. Case A: Influence of Reducing First-Tower Footing Resistance
The towers’ footing resistance for the base case in this study was taken as 100 Ω for all the towersas given in Table 2.
Table 2. Substation fast front overvoltages (FFO) and the towers footing resistance is 100 Ω for ALLtowers (reference case).
Twr4_FR Twr3_FR Twr2_FR Twr1_FR Vt at S/S (kV)
100 Ω 100 Ω 100 Ω 100 Ω 463.28
In Table 2, the following definitions are used:
- Twr1_FR: Value of the footing resistance in (Ω) of the first tower (Twr1) adjacent to the substation.- Vt at S/S (kV): The calculated transient overvoltages at substation terminal during
the back-flashover.
Starting from Table 3, the first tower footing resistance is changed gradually (tower by tower).In Table 3, the footing resistance in the first row is reduced to 25 Ω. Then the effect of reducing footingresistance for the other towers is examined in the next rows.
Table 3. Impact of reducing towers footing resistance 25 Ω on FFO.
Twr4_FR Twr3_FR Twr2_FR Twr1_FR Vt at S/S (kV) PMOD (%)100 Ω 100 Ω 100 Ω 25 Ω 427.9 7.6%100 Ω 100 Ω 25 Ω 25 Ω 415.2 3.0%100 Ω 25 Ω 25 Ω 25 Ω 413.9 0.3%25 Ω 25 Ω 25 Ω 25 Ω 413.9 0.0%
Color highlighted cells are referring to towers’ enhanced footing resistance.
The percentage PMOD (%) for the decreasing transient overvoltage at the substation terminalwith the decreasing of the footing resistance is calculated as the following:
PMOD (%) =VBe f ore_Enhancement −VA f ter_Enhancement
VBe f ore_Enhancement× 100 (6)
PMOD (%) is the percentage of maximum overvoltage decreasing due to FFBF. The PMOD (%) forthe first row in all tables is calculated compared to the base case given in Table 2. The PMOD (%) forthe other rows is calculated in comparison to the value in the previous row of the same table.
The footing resistance for the towers is examined with 100, 25, 15, 10, and 5 Ω, which are thetypical values used in previous research [6,15,43].
The results given in the next tables confirm that the impact of reducing other towers’ resistance isminimal. Reducing the earthing resistance of the second tower, for example, to 25 Ω will improve thereduction in FFO by only 3%. Reducing the resistance of the third tower is almost neglected.
Similarly, for Tables 4–6, the impact of reducing the first towers earthing resistance is high whilethe impact of the second towers earthing resistance is very low and the reduction due to the third towersis almost neglected. The results prove that any reduction in the far towers is economically unjustified.
As stated before, the rating of the lightning impulse withstands voltage (LIWV) of the substationequipment is 325 kV [20]. The value of calculated FFO is considered acceptable if there is enough marginbetween the voltage across the equipment (FFO) and the insulation’s capability (325 kV). This marginshould be over 20% (IEEE Std. C62.22-2009) [44]. So, the acceptable FFO in this study is 270 kV.
The study shows that any footing resistance above 5 Ω will cause the transient overvoltage tobe greater than 325 kV and consequently will cause damage to the substation insulation. With 5 Ωfooting resistance in the first tower only, the maximum transient overvoltage at substation components
Energies 2020, 13, 4663 13 of 20
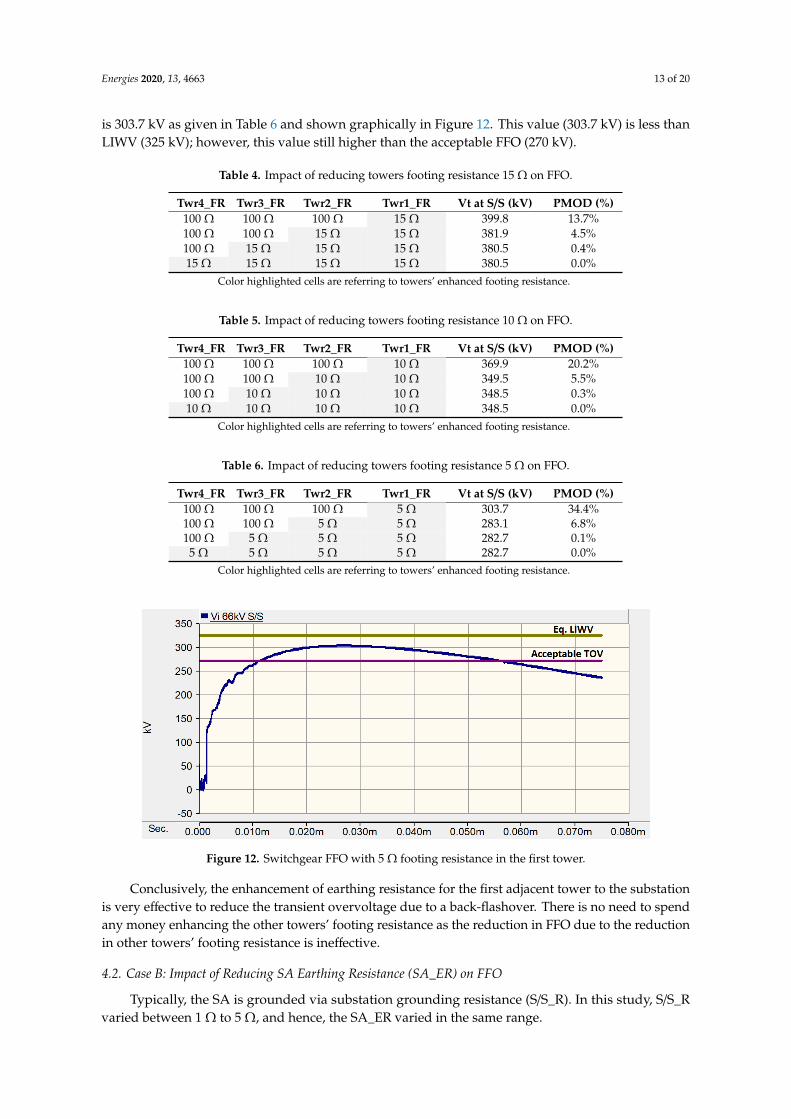
is 303.7 kV as given in Table 6 and shown graphically in Figure 12. This value (303.7 kV) is less thanLIWV (325 kV); however, this value still higher than the acceptable FFO (270 kV).
Table 4. Impact of reducing towers footing resistance 15 Ω on FFO.
Twr4_FR Twr3_FR Twr2_FR Twr1_FR Vt at S/S (kV) PMOD (%)100 Ω 100 Ω 100 Ω 15 Ω 399.8 13.7%100 Ω 100 Ω 15 Ω 15 Ω 381.9 4.5%100 Ω 15 Ω 15 Ω 15 Ω 380.5 0.4%15 Ω 15 Ω 15 Ω 15 Ω 380.5 0.0%
Color highlighted cells are referring to towers’ enhanced footing resistance.
Table 5. Impact of reducing towers footing resistance 10 Ω on FFO.
Twr4_FR Twr3_FR Twr2_FR Twr1_FR Vt at S/S (kV) PMOD (%)100 Ω 100 Ω 100 Ω 10 Ω 369.9 20.2%100 Ω 100 Ω 10 Ω 10 Ω 349.5 5.5%100 Ω 10 Ω 10 Ω 10 Ω 348.5 0.3%10 Ω 10 Ω 10 Ω 10 Ω 348.5 0.0%
Color highlighted cells are referring to towers’ enhanced footing resistance.
Table 6. Impact of reducing towers footing resistance 5 Ω on FFO.
Twr4_FR Twr3_FR Twr2_FR Twr1_FR Vt at S/S (kV) PMOD (%)100 Ω 100 Ω 100 Ω 5 Ω 303.7 34.4%100 Ω 100 Ω 5 Ω 5 Ω 283.1 6.8%100 Ω 5 Ω 5 Ω 5 Ω 282.7 0.1%5 Ω 5 Ω 5 Ω 5 Ω 282.7 0.0%
Color highlighted cells are referring to towers’ enhanced footing resistance.
Energies 2020, 13, x FOR PEER REVIEW 13 of 22
Table 4: Impact of reducing towers footing resistance 15 Ω on FFO.
Twr4_FR Twr3_FR Twr2_FR Twr1_FR Vt at S/S (kV) PMOD (%) 100 Ω 100 Ω 100 Ω 15 Ω 399.8 13.7% 100 Ω 100 Ω 15 Ω 15 Ω 381.9 4.5% 100 Ω 15 Ω 15 Ω 15 Ω 380.5 0.4% 15 Ω 15 Ω 15 Ω 15 Ω 380.5 0.0%
Color highlighted cells are referring to towers’ enhanced footing resistance.
Table 5: Impact of reducing towers footing resistance 10 Ω on FFO.
Twr4_FR Twr3_FR Twr2_FR Twr1_FR Vt at S/S (kV) PMOD (%) 100 Ω 100 Ω 100 Ω 10 Ω 369.9 20.2% 100 Ω 100 Ω 10 Ω 10 Ω 349.5 5.5% 100 Ω 10 Ω 10 Ω 10 Ω 348.5 0.3% 10 Ω 10 Ω 10 Ω 10 Ω 348.5 0.0%
Color highlighted cells are referring to towers’ enhanced footing resistance.
Table 6: Impact of reducing towers footing resistance 5 Ω on FFO.
Twr4_FR Twr3_FR Twr2_FR Twr1_FR Vt at S/S (kV) PMOD (%) 100 Ω 100 Ω 100 Ω 5 Ω 303.7 34.4% 100 Ω 100 Ω 5 Ω 5 Ω 283.1 6.8% 100 Ω 5 Ω 5 Ω 5 Ω 282.7 0.1% 5 Ω 5 Ω 5 Ω 5 Ω 282.7 0.0%
Color highlighted cells are referring to towers’ enhanced footing resistance.
As stated before, the rating of the lightning impulse withstands voltage (LIWV) of the substation equipment is 325 kV [20]. The value of calculated FFO is considered acceptable if there is enough margin between the voltage across the equipment (FFO) and the insulation’s capability (325 kV). This margin should be over 20% (IEEE Std. C62.22-2009) [44]. So, the acceptable FFO in this study is 270 kV.
The study shows that any footing resistance above 5 Ω will cause the transient overvoltage to be greater than 325 kV and consequently will cause damage to the substation insulation. With 5 Ω footing resistance in the first tower only, the maximum transient overvoltage at substation components is 303.7 kV as given in Table 6 and shown graphically in Figure 12. This value (303.7 kV) is less than LIWV (325 kV); however, this value still higher than the acceptable FFO (270 kV).
Figure 12. Switchgear FFO with 5 Ω footing resistance in the first tower. Figure 12. Switchgear FFO with 5 Ω footing resistance in the first tower.
Conclusively, the enhancement of earthing resistance for the first adjacent tower to the substationis very effective to reduce the transient overvoltage due to a back-flashover. There is no need to spendany money enhancing the other towers’ footing resistance as the reduction in FFO due to the reductionin other towers’ footing resistance is ineffective.
4.2. Case B: Impact of Reducing SA Earthing Resistance (SA_ER) on FFO
Typically, the SA is grounded via substation grounding resistance (S/S_R). In this study, S/S_Rvaried between 1 Ω to 5 Ω, and hence, the SA_ER varied in the same range.
Energies 2020, 13, 4663 14 of 20
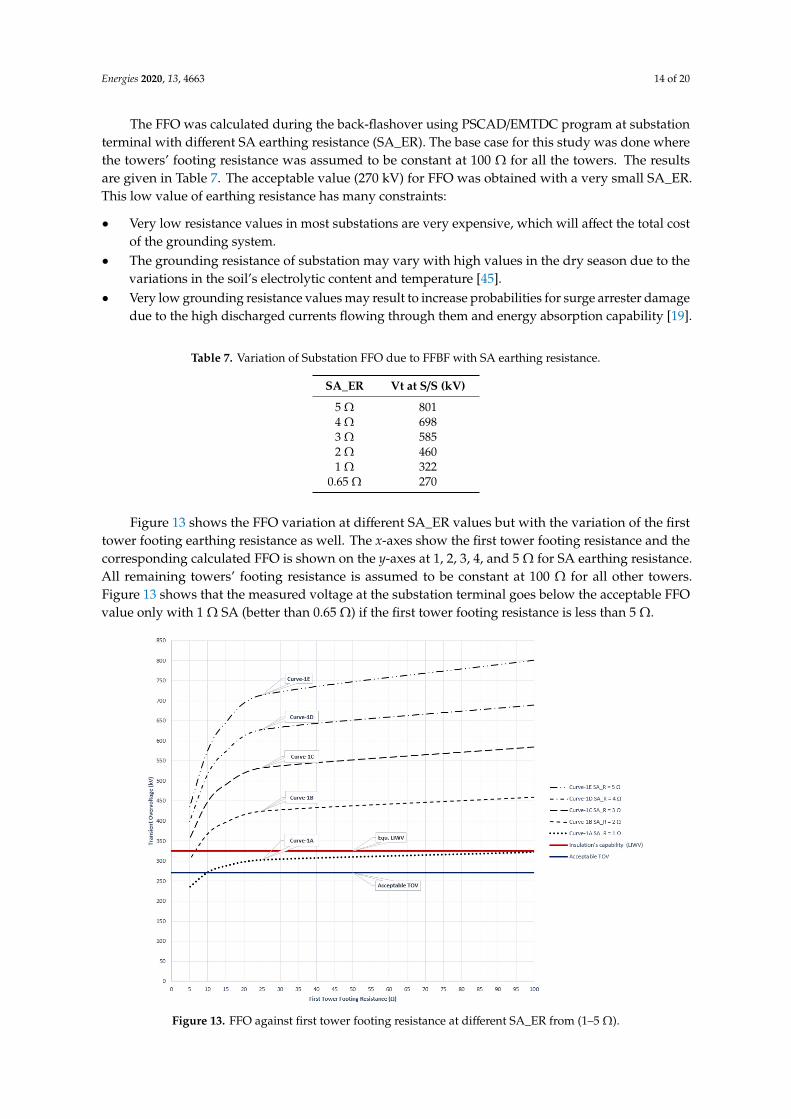
The FFO was calculated during the back-flashover using PSCAD/EMTDC program at substationterminal with different SA earthing resistance (SA_ER). The base case for this study was done wherethe towers’ footing resistance was assumed to be constant at 100 Ω for all the towers. The resultsare given in Table 7. The acceptable value (270 kV) for FFO was obtained with a very small SA_ER.This low value of earthing resistance has many constraints:
• Very low resistance values in most substations are very expensive, which will affect the total costof the grounding system.
• The grounding resistance of substation may vary with high values in the dry season due to thevariations in the soil’s electrolytic content and temperature [45].
• Very low grounding resistance values may result to increase probabilities for surge arrester damagedue to the high discharged currents flowing through them and energy absorption capability [19].
Table 7. Variation of Substation FFO due to FFBF with SA earthing resistance.
SA_ER Vt at S/S (kV)
5 Ω 8014 Ω 6983 Ω 5852 Ω 4601 Ω 322
0.65 Ω 270
Figure 13 shows the FFO variation at different SA_ER values but with the variation of the firsttower footing earthing resistance as well. The x-axes show the first tower footing resistance and thecorresponding calculated FFO is shown on the y-axes at 1, 2, 3, 4, and 5 Ω for SA earthing resistance.All remaining towers’ footing resistance is assumed to be constant at 100 Ω for all other towers.Figure 13 shows that the measured voltage at the substation terminal goes below the acceptable FFOvalue only with 1 Ω SA (better than 0.65 Ω) if the first tower footing resistance is less than 5 Ω.Energies 2020, 13, x FOR PEER REVIEW 15 of 22
Figure 13. FFO against first tower footing resistance at different SA_ER from (1–5 Ω).
4.3. Case C: Impact of Reducing Both First Tower Footing Resistance and SA Earthing Resistance on FFO
The risk of a back-flashover can be reduced by keeping the tower foot impedances to a minimum, particularly close to the substation (first five to seven towers) [20]. In this study, the first tower footing resistance, and the SA earthing resistance were reduced. while all other towers footing resistance were maintained at 100 Ω.
Table 8 shows that a value of 2.87 Ω for both SA_ER and Twr1_FR is enough for the FFO to go below the acceptable setting (270 kV FFO) at the substation terminal.
Table 8. Impact of reducing the Twr1_FR and SA_ER on FFO.
Twr1_FR S/S_R Vt at S/S (kV) 5 Ω 5 Ω 433 4 Ω 4 Ω 356 3 Ω 3 Ω 279
2.87 Ω 2.87 Ω 270 2 Ω 2 Ω 205
Case B achieved a value of FFO equal to 270 kV at SA_ER = 0.65 ohms, while case C achieved the same value of FFO at earthing resistance of both Tw1_FR and SA_ER = 2.87 Ω.
Although an acceptable FFO can be achieved with an unattainable grounding resistance as case B, it can be obtained with an achievable value of grounding resistance as illustrated in case C.
So, case C represents an economic solution since a very low resistance value for substations is unattainable due to high soil resistivity and seasonal effect.
4.4. Economical Comparison Study
An economical comparison study is presented for case B and case C. The potential rise due to back-flashovers at the substation terminal is 270 kV in Case B when the substation grounding is
Figure 13. FFO against first tower footing resistance at different SA_ER from (1–5 Ω).
Energies 2020, 13, 4663 15 of 20
4.3. Case C: Impact of Reducing Both First Tower Footing Resistance and SA Earthing Resistance on FFO
The risk of a back-flashover can be reduced by keeping the tower foot impedances to a minimum,particularly close to the substation (first five to seven towers) [20]. In this study, the first tower footingresistance, and the SA earthing resistance were reduced. While all other towers footing resistance weremaintained at 100 Ω.
Table 8 shows that a value of 2.87 Ω for both SA_ER and Twr1_FR is enough for the FFO to gobelow the acceptable setting (270 kV FFO) at the substation terminal.
Table 8. Impact of reducing the Twr1_FR and SA_ER on FFO.
Twr1_FR S/S_R Vt at S/S (kV)
5 Ω 5 Ω 4334 Ω 4 Ω 3563 Ω 3 Ω 279
2.87 Ω 2.87 Ω 2702 Ω 2 Ω 205
Case B achieved a value of FFO equal to 270 kV at SA_ER = 0.65 ohms, while case C achieved thesame value of FFO at earthing resistance of both Tw1_FR and SA_ER = 2.87 Ω.
Although an acceptable FFO can be achieved with an unattainable grounding resistance as case B,it can be obtained with an achievable value of grounding resistance as illustrated in case C.
So, case C represents an economic solution since a very low resistance value for substations isunattainable due to high soil resistivity and seasonal effect.
4.4. Economical Comparison Study
An economical comparison study is presented for case B and case C. The potential rise due toback-flashovers at the substation terminal is 270 kV in Case B when the substation grounding isenhanced to 0.65 Ω. The potential rise due to back-flashovers at the substation terminal is 270 kV incase C when both first tower footing resistance and SA grounding system is 2.87 Ω.
For the economic study, the following typical data were assumed:
• The soil resistivity for the first layer is 300 Ωm.• The depth of the first layer is 2 m.• Soil resistivity for the second layer is 100 Ωm.• The conductor used for the grounding system is 120 Sq.mm, copper, annealed soft-drawn.• The cost/meter for 120 mm2, copper, annealed soft-drawn is assumed to be 17 USD as per [46].• The rod used for the grounding system is 2 cm diameter, 10 m length, copper-clad steel rod.• The cost of the one rod is assumed 100 USD as per [46].
Two studies were conducted using ETAP [47] software as shown in Table 9.Obviously, from Table 9, enhancing both SA_ER and Twr1_FR results in a noticeably lower cost
compared to enhancing SA_ER only. More than 75% cost saving by using the proposed technique forcontrolling the FFO via enhancing the first tower footing resistance.
4.5. Impact of Bonding the First Tower Earthing System with Substation Earthing System
Practically, the first tower is located at a short distance to the substation. There are two differentmethods for connecting the towers lightning protection system earthing resistance (tower footingresistance or ground wire) and substation grounding grid as follows:
1. It may be connected through the connection of the guard protection wire (GW) or OPGW(optical ground wire) to the gantry grounding system [48,49]. References [48,49] illustrate thedifferent ways of grounding the guard protection wire/OPGW with the substation earthing mat.
Energies 2020, 13, 4663 16 of 20
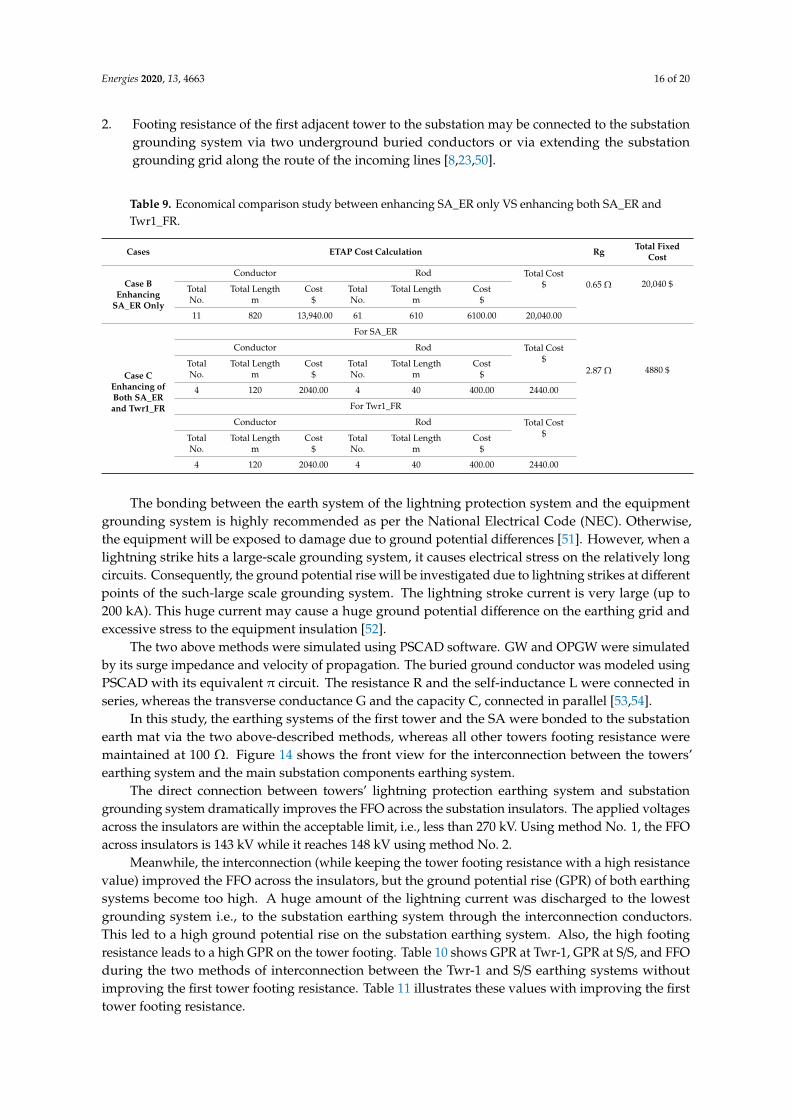
2. Footing resistance of the first adjacent tower to the substation may be connected to the substationgrounding system via two underground buried conductors or via extending the substationgrounding grid along the route of the incoming lines [8,23,50].
Table 9. Economical comparison study between enhancing SA_ER only VS enhancing both SA_ER andTwr1_FR.
Cases ETAP Cost Calculation Rg Total FixedCost
Case BEnhancing
SA_ER Only
Conductor Rod Total Cost$ 0.65 Ω 20,040 $Total
No.Total Length
mCost
$TotalNo.
Total Lengthm
Cost$
11 820 13,940.00 61 610 6100.00 20,040.00
Case CEnhancing ofBoth SA_ERand Twr1_FR
For SA_ER
2.87 Ω 4880 $
Conductor Rod Total Cost$Total
No.Total Length
mCost
$TotalNo.
Total Lengthm
Cost$
4 120 2040.00 4 40 400.00 2440.00
For Twr1_FR
Conductor Rod Total Cost$Total
No.Total Length
mCost
$TotalNo.
Total Lengthm
Cost$
4 120 2040.00 4 40 400.00 2440.00
The bonding between the earth system of the lightning protection system and the equipmentgrounding system is highly recommended as per the National Electrical Code (NEC). Otherwise,the equipment will be exposed to damage due to ground potential differences [51]. However, when alightning strike hits a large-scale grounding system, it causes electrical stress on the relatively longcircuits. Consequently, the ground potential rise will be investigated due to lightning strikes at differentpoints of the such-large scale grounding system. The lightning stroke current is very large (up to200 kA). This huge current may cause a huge ground potential difference on the earthing grid andexcessive stress to the equipment insulation [52].
The two above methods were simulated using PSCAD software. GW and OPGW were simulatedby its surge impedance and velocity of propagation. The buried ground conductor was modeled usingPSCAD with its equivalent π circuit. The resistance R and the self-inductance L were connected inseries, whereas the transverse conductance G and the capacity C, connected in parallel [53,54].
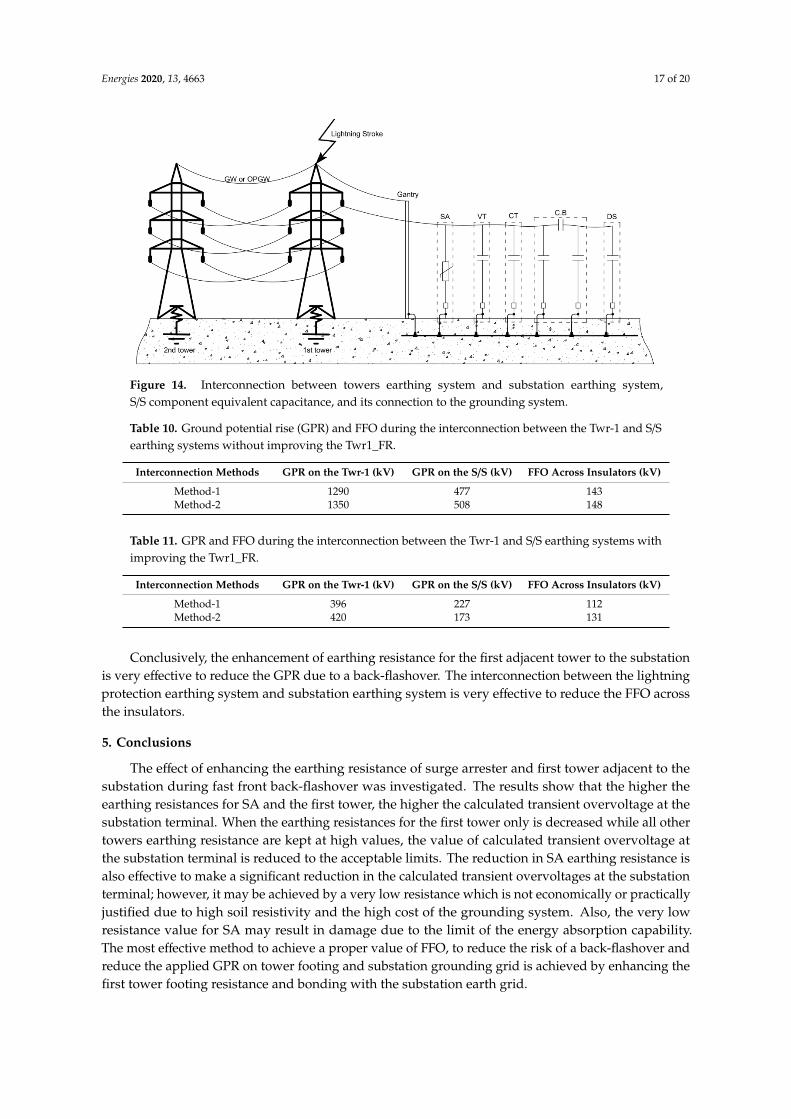
In this study, the earthing systems of the first tower and the SA were bonded to the substationearth mat via the two above-described methods, whereas all other towers footing resistance weremaintained at 100 Ω. Figure 14 shows the front view for the interconnection between the towers’earthing system and the main substation components earthing system.
The direct connection between towers’ lightning protection earthing system and substationgrounding system dramatically improves the FFO across the substation insulators. The applied voltagesacross the insulators are within the acceptable limit, i.e., less than 270 kV. Using method No. 1, the FFOacross insulators is 143 kV while it reaches 148 kV using method No. 2.
Meanwhile, the interconnection (while keeping the tower footing resistance with a high resistancevalue) improved the FFO across the insulators, but the ground potential rise (GPR) of both earthingsystems become too high. A huge amount of the lightning current was discharged to the lowestgrounding system i.e., to the substation earthing system through the interconnection conductors.This led to a high ground potential rise on the substation earthing system. Also, the high footingresistance leads to a high GPR on the tower footing. Table 10 shows GPR at Twr-1, GPR at S/S, and FFOduring the two methods of interconnection between the Twr-1 and S/S earthing systems withoutimproving the first tower footing resistance. Table 11 illustrates these values with improving the firsttower footing resistance.
Energies 2020, 13, 4663 17 of 20
Energies 2020, 13, x FOR PEER REVIEW 18 of 22
maintained at 100 Ω. Figure 14 shows the front view for the interconnection between the towers’ earthing system and the main substation components earthing system.
Figure 14. Interconnection between towers earthing system and substation earthing system, S/S component equivalent capacitance, and its connection to the grounding system.
The direct connection between towers’ lightning protection earthing system and substation grounding system dramatically improves the FFO across the substation insulators. The applied voltages across the insulators are within the acceptable limit, i.e., less than 270 kV. Using method No. 1, the FFO across insulators is 143 kV while it reaches 148 kV using method No. 2.
Meanwhile, the interconnection (while keeping the tower footing resistance with a high resistance value) improved the FFO across the insulators, but the ground potential rise (GPR) of both earthing systems become too high. A huge amount of the lightning current was discharged to the lowest grounding system i.e., to the substation earthing system through the interconnection conductors. This led to a high ground potential rise on the substation earthing system. Also, the high footing resistance leads to a high GPR on the tower footing. Table 10 shows GPR at Twr-1, GPR at S/S, and FFO during the two methods of interconnection between the Twr-1 and S/S earthing systems without improving the first tower footing resistance. Table 11 illustrates these values with improving the first tower footing resistance.
Table 10. Ground potential rise (GPR) and FFO during the interconnection between the Twr-1 and S/S earthing systems without improving the Twr1_FR.
Interconnection Methods
GPR on the Twr-1 (kV)
GPR on the S/S (kV)
FFO Across Insulators (kV)
Method-1 1290 477 143 Method-2 1350 508 148
Table 11. GPR and FFO during the interconnection between the Twr-1 and S/S earthing systems with improving the Twr1_FR.
Interconnection Methods
GPR on the Twr-1 (kV)
GPR on the S/S (kV)
FFO Across Insulators (kV)
Method-1 396 227 112 Method-2 420 173 131
Conclusively, the enhancement of earthing resistance for the first adjacent tower to the substation is very effective to reduce the GPR due to a back-flashover. The interconnection between
Figure 14. Interconnection between towers earthing system and substation earthing system,S/S component equivalent capacitance, and its connection to the grounding system.
Table 10. Ground potential rise (GPR) and FFO during the interconnection between the Twr-1 and S/Searthing systems without improving the Twr1_FR.
Interconnection Methods GPR on the Twr-1 (kV) GPR on the S/S (kV) FFO Across Insulators (kV)
Method-1 1290 477 143Method-2 1350 508 148
Table 11. GPR and FFO during the interconnection between the Twr-1 and S/S earthing systems withimproving the Twr1_FR.
Interconnection Methods GPR on the Twr-1 (kV) GPR on the S/S (kV) FFO Across Insulators (kV)
Method-1 396 227 112Method-2 420 173 131
Conclusively, the enhancement of earthing resistance for the first adjacent tower to the substationis very effective to reduce the GPR due to a back-flashover. The interconnection between the lightningprotection earthing system and substation earthing system is very effective to reduce the FFO acrossthe insulators.
5. Conclusions
The effect of enhancing the earthing resistance of surge arrester and first tower adjacent to thesubstation during fast front back-flashover was investigated. The results show that the higher theearthing resistances for SA and the first tower, the higher the calculated transient overvoltage at thesubstation terminal. When the earthing resistances for the first tower only is decreased while all othertowers earthing resistance are kept at high values, the value of calculated transient overvoltage atthe substation terminal is reduced to the acceptable limits. The reduction in SA earthing resistance isalso effective to make a significant reduction in the calculated transient overvoltages at the substationterminal; however, it may be achieved by a very low resistance which is not economically or practicallyjustified due to high soil resistivity and the high cost of the grounding system. Also, the very lowresistance value for SA may result in damage due to the limit of the energy absorption capability.The most effective method to achieve a proper value of FFO, to reduce the risk of a back-flashover andreduce the applied GPR on tower footing and substation grounding grid is achieved by enhancing thefirst tower footing resistance and bonding with the substation earth grid.
Energies 2020, 13, 4663 18 of 20
Author Contributions: Conceptualization, A.H.M., A.M.A.-A., and A.E.; data curation, A.M.A.-A.; formal analysis,A.H.M., M.G., and A.E.; funding acquisition, A.H.M. and A.E.; investigation, A.H.M. and A.E.; methodology,A.H.M., A.M.A.-A., M.G., and A.E.; project administration, A.H.M. and A.M.A.-A.; resources, A.H.M. andA.M.A.-A.; software, A.H.M. and A.E.; supervision, A.M.A.-A., M.G., and A.E.; validation, A.M.A.-A., M.G., andA.E.; visualization, A.H.M., A.M.A.-A., and A.E; writing—original draft, A.H.M.; writing—review and editing,A.M.A.-A., M.G., and A.E. All authors have read and agreed to the published version of the manuscript.
Funding: There was no funding provided for this research.
Acknowledgments: We acknowledge Smart Power Co.’s teamwork for data collection and support. A particularmention shall be made to Tawfic Sayed and Mahmoud Magdy.
Conflicts of Interest: The authors declare no conflict of interest.
References
1. Muthumuni, D.; Kothalawala, L.; Darbandi, A. Lightning Studies, Webinar on Lightning Over Voltage Simulationsin PSCADTM EMTDCTM 2016; Manitoba HVDC Research Centre, PSCAD: Winnipeg, MB, Canada,8 September 2016.
2. Perera, L.B.; Mishra, Y. Insulation coordination study for a 50 kV traction feeder station. In Proceedings of the2014 Australasian Universities Power Engineering Conference AUPEC 2014–Procurement, Perth, Australia,28 September–1 October 2014. [CrossRef]
3. IEC 60071-2 International Standard Internationale, Insulation co-ordination–Part. 2. In Application Guidelines,4th ed.; IEC Publication: Geneva, Switzerland, 2008; ISBN 2831896649.
4. Yadee, P.; Premrudeepreechacharn, S. Analysis of Tower Footing Resistance Effected Back Flashover AcrossInsulator in a Transmission System. In Proceedings of the International Conference on Power SystemsTransients, Lyon, France, 4–7 June 2007.
5. Marungsri, B.; Boonpoke, S.; Rawangpai, A.; Oonsivilai, A.; Kritayakornupong, C. Study of Tower GroundingResistance Effected Back Flashover to 500 kV Transmission Line in Thailand by using ATP/EMTP. Int. J.Energy Power Eng. 2009, 2, 2.
6. Mariut, E.L.; Helerea, E. Variation of tower footing resistance on the lightning surge propagation throughoverhead power distribution lines. Adv. Electr. Comput. Eng. 2016, 16, 99–106. [CrossRef]
7. Cigre, W.S. Guide to Procedures for Estimating the Lightning Performance of Transmission Lines; CIGRE Rep. 63:Cambridge, MA, USA, 1991; Volume 1, p. 64.
8. Mobarakei, S.T.; Sami, T.; Porkar, B. Back Flashover phenomenon analysis in power transmission substationfor insulation coordination. In Proceedings of the 11th International Conferene of Environment and Electrical.Enineering. EEEIC 2012–Conference Procurement, Venice, Italy, 17–19 May 2012; pp. 170–174. [CrossRef]
9. El-Sayed Gouda, O.; Elshesheny, N.A. Simulation of the lightning back-flashover for medium voltagedistribution network. Indones. J. Electr. Eng. Comput. Sci. 2016, 3, 264–272. [CrossRef]
10. Banjanin, M.S. Application possibilities of special lightning protection systems of overhead distribution andtransmission lines. Int. J. Electr. Power Energy Syst. 2018, 100, 482–488. [CrossRef]
11. He, J.; Gao, Y.; Zeng, R.; Zou, J.; Liang, X.; Zhang, B.; Lee, J.; Chang, S. Effective length of counterpoise wireunder lightning current. IEEE Trans. Power Deliv. 2005, 20, 1585–1591. [CrossRef]
12. Ametani, A.; Kawamura, T. A method of a lightning surge analysis recommended in Japan using EMTP.IEEE Trans. Power Deliv. 2005, 20, 867–875. [CrossRef]
13. Ametani, A. Lightning surge analysis by EMTP and numerical electromagnetic analysis method.In Proceedings of the 2010 30th International Conference on Lighthing Protection. ICLP 2010, Cagliari, Italy,13–17 September 2010; pp. 1–18. [CrossRef]
14. Gouda, O.; El Dein, A.Z.; Amer, G. Parameters affecting the back flashover across the overhead transmissionline insulator caused by Lightning. In Proceedings of the 14th International Middle East. Power SystemConference (MEPCON’10), Cairo University, Cairo, Egypt, 19–21 December 2010; pp. 44–49.
15. IEEE Std 80TM-2013 IEEE Guide for Safety in AC Substation Grounding; IEEE: Piscataway, NJ, USA, 2015;ISBN 0738119261.
16. IEEE. IEEE Std 142TM-2007, Grounding of Industrial and Commercial Power Systems; IEEE: Piscataway, NJ, USA,2007; ISBN 0738156396.
17. EA-TS 41-24, Guidelines for the Design, Installation, Testing and Maintenance of Main Earthing Systems inSubstations; Electricity Association, Technical Specification: UK, 1992.
Energies 2020, 13, 4663 19 of 20
18. HD637 S1, Power Installations Exceeding 1 kV A.C.; European Committee for Electrotechnical Standardisation(CENELEC): Brussels, Belgium, 1999.
19. Christodoulou, C.A.; Ekonomou, L.; Papanikolaou, N.; Gonos, I.F. Effect of the grounding resistance tothe behaviour of high-voltage transmission lines’ surge arresters. IET Sci. Meas. Technol. 2014, 8, 470–478.[CrossRef]
20. Ryan, H.M. High Voltage Engineering and Testing, 3rd ed; IET: Stevenage, UK, 2013; ISBN 9781849192637.21. Asaoka, Y.; Asakawa, A.; Yokoyama, S.; Yokoyama, S.; Nakada, K.; Sugimoto, H. Effect of Lightning Protective
Devices Attached to Pole Transformers on Reduction of Overvoltage on Distribution Lines. IEEJ Trans.Power Energy 2004, 124, 150–155. [CrossRef]
22. Hemapala, K.T.M.U.; Gnana Swathika, O.V.; Dharmadasa, K.P.R.D.S.K. Techno-economic feasibility oflighting protection of overhead transmission line with multi-chamber insulator arrestors. Dev. Eng. 2018, 3,100–116. [CrossRef]
23. Hassan, A.; Gilany, M.; Emam, A. Earthing resistance impact on fast front back–Flashover of a 25 kV tractionfeeder station. IEEE 2020, 7, 81–89. [CrossRef]
24. Shariatinasab, R.; Gholinezhad, J. The effect of grounding system modeling on lightning-related studies oftransmission lines. J. Appl. Res. Technol. 2017, 15, 545–554. [CrossRef]
25. Popov, M.; Grcev, L.; Hoidalen, H.K.; Gustavsen, B.; Terzija, V. Investigation of the overvoltage and fasttransient phenomena on transformer terminals by taking into account the grounding effects. IEEE Trans.Ind. Appl. 2015, 51, 5218–5227. [CrossRef]
26. Koehler, F.; Swingler, J. Practical model for tower earthing systems in lightning simulations. Electr. PowerSyst. Res. 2018, 158, 306–314. [CrossRef]
27. Visacro, S.; Alipio, R.; Murta Vale, M.H.; Pereira, C. The response of grounding electrodes to lightningcurrents: The effect of frequency-dependent soil resistivity and permittivity. IEEE Trans. Electromagn. Compat.2011, 53, 401–406. [CrossRef]
28. EEHC. Egypt Electricity Holding Company EEHC Annual Report 2018–2019; EEHC: Cairo, Egypt, 2019.29. IEC. First Edition, Insulation Co-Ordination–Part. 4: Computational Guide to Insulation Co-Ordination and
Modelling of Electrical Networks; Technical Report No. 60071-4; IEC: London, UK, 2004; pp. 1–9.30. Hileman, A.R. Insulation Coordination for Power Systems; CRC Press: Boca Raton, FL, USA, 1999; Volume 19,
ISBN 9780824799571.31. Savic, M.S.; Stojkovic, Z. An expert system for high-voltage substations lightning performance estimation.
IEEE Trans. Power Deliv. 1992, 7, 1223–1231. [CrossRef]32. Imece, A.F.; Durbak, D.W.; Hamid, E.; Sharma, K.; Andre, L.; Doug, M.; McDemott, T.E.; Morched, A.;
Mousa, A.M.; Natarajan, R.; et al. Modeling guidelines for fast front transients. IEEE Trans. Power Deliv.1996, 11, 493–506.
33. Sargent, M.A.; Darveniza, M. Tower Surge Impedance. IEEE Trans. Power Appar. Syst. 1969, PAS-88, 680–687.[CrossRef]
34. Goni, M.O.; Ametani, A. Analysis and estimation of surge impedance of tower. Appl. Comput. Electromagn.Soc. J. 2009, 24, 72–78.
35. Dekker, M. Lightning surge analysis. In Computer Aided Power System Analysis; Chapter 13; Marcel DekkerInc: New York, NY, USA, 2002.
36. Pinceti, P.; Giannettoni, M. A simplified model for zinc oxide surge arresters. IEEE Trans. Power Deliv. 1999,14, 393–398. [CrossRef]
37. Radhika, G.; Suryakalavathi, M.G.S. Effective Placement of Surge Arrester during Lightning. Int. J. Comput.Commun. Inf. Syst. (IJCCIS) 2011, 2, 1–5.
38. IEEE; Working Group. Modeling of metal oxide surge arresters, application of surge protective devicessubcommittee surge protective devices committee. Trans. Power Deliv. 1992, 7, 302–309.
39. Manitoba HV. PSCAD. Power Systems Computer Aided Design. Electro.-Magnetic Transient Design and Control.EMTDCTM, PSCADTM Version X4 User’s Guide; Manitoba Hydro International: Winnipeg, MB, Canada, 2003.
40. Eriksson, J.A.; Weck, K.H. Simplified Procedures for Determining Representative Substation Impinging LightningOvervoltages; In CIGRE Session: Paris, France, 1988; pp. 1–8.
41. Martínez Velasco, J.A.; Corea Araujo, J.; Bedoui, S. Lightning performance analysis of transmission linesusing the Monte Carlo method and parallel computing. Ingeniare 2018, 26, 398–409. [CrossRef]
Energies 2020, 13, 4663 20 of 20
42. Datsios, Z.G.; Mikropoulos, P.N.; Tsovilis, T.E. Insulator string flashover modeling with the aid of anATPDraw object. In Proceedings of the 46th International Universities Power Engineering Conference, Soest,Germany, 5–8 September 2011.
43. Rodrigo, A.S.; Akarawita, N.M.; Ambanwala, A.M.P.B.; Ariyapala, D.N.; Chaminda, W.C. Safety in ACSubstation Grounding Systems under Transient Conditions: Development of Design Software. In Proceedingsof the IEEE 8th International Conference on Industrial and Information System, Peradeniya, Sri Lanka,18–20 August 2013; pp. 185–190. [CrossRef]
44. IEEE Std. IEEE Guide for the Application of Metal-Oxide Surge Arresters for Alternating-Current Systems; TechnicalReport No. C62.22; IEEE: Piscataway, NJ, USA, 2009; Volume 2009, p. 140.
45. Christy Thomas, E. Seasonal Variation of Soil Resistivity and the Correction Factor. Artic. EE Publ. Artic. Vector.2017. Available online: https://www.ee.co.za/article/seasonal-variation-soil-resistivity-correction-factor.html(accessed on 15 June 2020).
46. The Minister of Housing, Utilities and Urban Communities. The Department of Housing, Architecture andUrban Planning. Price List. Available online: http://www.mhuc.gov.eg/programs/index/2168 (accessed on29 June 2020).
47. ETAP Electrical Power System Analysis & Operation Software; Operation Technology Inc.: Irvine, CA, USA,2019.
48. Zhang, S.; Wang, X.; Cao, Q. A Programme to Solution the Problem of OPGW Substation Structure Grounding.DEStech Trans. Mater. Sci. Eng. 2017. [CrossRef]
49. Peng, Y.N.; Lin, Y.W. Discussion on solving down leading of OPGW under framework with insulation.Adv. Mater. Res. 2014, 1006–1007, 905–908. [CrossRef]
50. 50 Menter, F.E.; Grcev, L. EMTP-Based Model for Grounding System Analysis. IEEE Trans. Power Deliv. 1994,9, 1838–1849. [CrossRef]
51. Haluza, D. Lightning, ground potential rise, and electrical damage: Protecting wayside equipment on theMTA Long Island Rail Road. In Proceedings of the IEEE/ASME Joint Railroad Conference, Oakbrook, IL,USA, 30 April–2 May 1996; pp. 111–135. [CrossRef]
52. Hänninen, S.; Kulmala, A. ESSI: Electric Systems and Safety in Finnish NPP; VTT: Hanahomen, Finland, 2019.53. Celli, G.; Pilo, F. A Distributed Parameter Model for Grounding Systems in the PSCAD/EMTDC Environment.
In Proceedings of the 2003 IEEE Power Engineering. Society General Meeting, Toronto, ON, Canada,13–17 July 2003; pp. 1650–1655. [CrossRef]
54. Gonos, I.F.; Topalis, F.V.; Stathopulos, I.A. Transient behaviour of a horizontal grounding grid under impulsecurrent. Parameters 2002, 5, 4–8.
© 2020 by the authors. Licensee MDPI, Basel, Switzerland. This article is an open accessarticle distributed under the terms and conditions of the Creative Commons Attribution(CC BY) license (http://creativecommons.org/licenses/by/4.0/).