Impact of environmental tax on green development: A ...
23
RESEARCH ARTICLE Impact of environmental tax on green development: A nonlinear dynamical system analysis Xinghua Fan, Xuxia Li, Jiuli Yin ID * Center for Energy Development and Environmental Protection Strategy Research, Jiangsu University, Zhenjiang, Jiangsu, China * [email protected] Abstract With green development becoming a global movement, environmental tax has been adopted by many governments to promote green development. This study analyzes the impact of environmental tax on green development by using a four-dimension dynamical system. The establishment of the system is based on the complex and dynamic interactions among economic development, pollution emissions, resources consumption, and environ- mental tax, where roles of environmental tax are reflected by the linear parameters. A theo- retic analysis shows the complexity of the behavior of the system. Mainly, the existence of chaos is inferred by Lyapunov exponent spectrum and bifurcation diagram, then verified by the presence of a chaotic attractor. An empirical study of the green development dynamical system in China demonstrates the particular evolution paths of economic growth, pollution intensity, and resource intensity under different environmental tax parameters. Results indicate a robust beneficial role of environmental tax on green development. Furthermore, when an environmental tax is imposed, a firm government control, an active consumer awareness, an advanced technology level can stimulate economic growth, decrease pollu- tion intensity, and control the resource intensity. But the government control has a stronger effect. This study provides a viable and promising approach to analyze the role of imposing an environmental tax on green development and may have potential application in other areas and countries. Introduction Green development has become the new contents of sustainable development after the Rio+20 Conference [1]. The Organization for Economic Cooperation and Development defines green development as a solution to promote economic development while prevent the environmental degradation, the loss of biodiversity, and the waste of natural resources [2]. The United Nations Environment Programme (UNEP) regards green development as the process to improve human well-being while significantly reducing environmental risks and mitigating ecological scarcities [3]. The World Bank emphasizes green development as an PLOS ONE | https://doi.org/10.1371/journal.pone.0221264 September 4, 2019 1 / 23 a1111111111 a1111111111 a1111111111 a1111111111 a1111111111 OPEN ACCESS Citation: Fan X, Li X, Yin J (2019) Impact of environmental tax on green development: A nonlinear dynamical system analysis. PLoS ONE 14(9): e0221264. https://doi.org/10.1371/journal. pone.0221264 Editor: Baogui Xin, Shandong University of Science and Technology, CHINA Received: April 30, 2019 Accepted: August 4, 2019 Published: September 4, 2019 Copyright: © 2019 Fan et al. This is an open access article distributed under the terms of the Creative Commons Attribution License, which permits unrestricted use, distribution, and reproduction in any medium, provided the original author and source are credited. Data Availability Statement: The data underlying the results presented in the study are available from http://www.stats.gov.cn/tjsj/ndsj/. Funding: This research is supported by the National Natural Science Foundation of China (No. 71673116) to XF, Natural Science Foundation of Jiangsu Province (No. SBK2015021674) to JY, and the Humanistic and Social Science Foundation from Ministry of Education of China (Grant 16YJAZH007) to XF. The funders had no role in study design, data collection and analysis, decision to publish, or preparation of the manuscript.
Transcript of Impact of environmental tax on green development: A ...

RESEARCH ARTICLE
Impact of environmental tax on green
development: A nonlinear dynamical system
analysis
Xinghua Fan, Xuxia Li, Jiuli YinID*
Center for Energy Development and Environmental Protection Strategy Research, Jiangsu University,
Zhenjiang, Jiangsu, China
Abstract
With green development becoming a global movement, environmental tax has been
adopted by many governments to promote green development. This study analyzes the
impact of environmental tax on green development by using a four-dimension dynamical
system. The establishment of the system is based on the complex and dynamic interactions
among economic development, pollution emissions, resources consumption, and environ-
mental tax, where roles of environmental tax are reflected by the linear parameters. A theo-
retic analysis shows the complexity of the behavior of the system. Mainly, the existence of
chaos is inferred by Lyapunov exponent spectrum and bifurcation diagram, then verified by
the presence of a chaotic attractor. An empirical study of the green development dynamical
system in China demonstrates the particular evolution paths of economic growth, pollution
intensity, and resource intensity under different environmental tax parameters. Results
indicate a robust beneficial role of environmental tax on green development. Furthermore,
when an environmental tax is imposed, a firm government control, an active consumer
awareness, an advanced technology level can stimulate economic growth, decrease pollu-
tion intensity, and control the resource intensity. But the government control has a stronger
effect. This study provides a viable and promising approach to analyze the role of imposing
an environmental tax on green development and may have potential application in other
areas and countries.
Introduction
Green development has become the new contents of sustainable development after the Rio+20
Conference [1]. The Organization for Economic Cooperation and Development defines
green development as a solution to promote economic development while prevent the
environmental degradation, the loss of biodiversity, and the waste of natural resources [2].
The United Nations Environment Programme (UNEP) regards green development as the
process to improve human well-being while significantly reducing environmental risks and
mitigating ecological scarcities [3]. The World Bank emphasizes green development as an
PLOS ONE | https://doi.org/10.1371/journal.pone.0221264 September 4, 2019 1 / 23
a1111111111
a1111111111
a1111111111
a1111111111
a1111111111
OPEN ACCESS
Citation: Fan X, Li X, Yin J (2019) Impact of
environmental tax on green development: A
nonlinear dynamical system analysis. PLoS ONE
14(9): e0221264. https://doi.org/10.1371/journal.
pone.0221264
Editor: Baogui Xin, Shandong University of Science
and Technology, CHINA
Received: April 30, 2019
Accepted: August 4, 2019
Published: September 4, 2019
Copyright: © 2019 Fan et al. This is an open access
article distributed under the terms of the Creative
Commons Attribution License, which permits
unrestricted use, distribution, and reproduction in
any medium, provided the original author and
source are credited.
Data Availability Statement: The data underlying
the results presented in the study are available
from http://www.stats.gov.cn/tjsj/ndsj/.
Funding: This research is supported by the
National Natural Science Foundation of China (No.
71673116) to XF, Natural Science Foundation of
Jiangsu Province (No. SBK2015021674) to JY, and
the Humanistic and Social Science Foundation
from Ministry of Education of China (Grant
16YJAZH007) to XF. The funders had no role in
study design, data collection and analysis, decision
to publish, or preparation of the manuscript.

environmental-friendly and social-inclusive way of economic growth, aiming at efficient use
of natural resources and minimizing pollution emission as well as reducing impacts on envi-
ronment [4]. These universally accepted definitions show that the core of green development
is to improve resource utilization and reduce pollution emissions without slowing economic
growth [5].
The international society has proposed numerous deals and programs to promote green
development. The UNEP proposed the Global Green New Deal which focuses on investing
renewable resources, building environmentally friendly society, and increasing energy effi-
ciency [6]. Many countries, such as the US and the UK, have formulated green policies cen-
tered on new energy development or low-carbon economic growth [7]. Green development
was proposed as China’s national strategy in 2015 [8] to address challenges of resource and
environment problems in it. The fast economic growth of China has been accomplished with
large consumption, huge pollution, and high emissions. China has almost doubled energy
intensity of the developed counties [9]. Haze pollution has attracted international concerns
[10] as 70% of the world’s most polluted cities are in China [11]. Nearly half of water sources
in China’s key cities are not qualified for drinking [12]. Facing these challenges, the Chinese
government adopted lots of measures for sustainable economic growth in the Five-Year Plans.
These measures include the promotion of technological innovation, market-oriented reform,
industrial structure adjustment, and regional balance development. China’s efforts have
brought green effect in the form of the win-win development of resources, environment, and
economy [13].
Environmental tax is one of environmental policy measures to fulfill the goals of green
development. Various forms taxes have been adopted by many countries. France first
imposed forest tax in 1969, which is a kind of resource tax on extraction of raw materials
(except for oil and gas) [14]. Very the next year, the US adopted the SO2 tax [15]. The tax
base was expanded in other countries from SO2 to other emission to air (except CO2) and
water such as CO, NOx, taxable water pollutants, and taxable solid pollutants [16, 17]. Japan’s
aviation fuel tax levied in 1972 [18] is an example of energy tax, which covers tax on energy
products for transport and for stationary use. The CO2 tax [19] is also included in this group
for statistical reasons. The EU introduced the environmental tax reform (ETR) in the 1990s
to shift the burden of taxation away from factors of production to the users of natural
resources and pollution [20].
The motivation of this study lies in three aspects. First of all, the fast expansion of green
practices urged the authors to study the role of environmental tax in green development from
an integrated point of view. Green development means to improve resource utilization and
reduce pollution emissions without slowing economic growth. Therefore, the effect of envi-
ronmental tax on economy, resource, and environment should be considered simultaneously.
Secondly, there is a need both in the practical and academic fields to quantify the impact of
environmental tax on green development. Most studies are still based on qualitative methods,
while quantitative researches are relatively rare. To measure green development, this study
divides green development into three qualitative indicators: economic growth, pollution inten-
sity, and resource intensity. Last but not least, it is crucial to study the status of green develop-
ment in medium and long time periods. Green development is a long-term national strategy,
and environmental tax is an economic means to achieve green development. Therefore, the
evolution regulation of green development should be analyzed, whether in short, medium, or
long terms.
This study aims to analyze the impact of environmental tax on green development. We
focus on the evolution of economic growth, pollution intensity, and resource intensity under
different environmental tax parameters. For scenario analysis, we acquire the actual green
Environmental tax and green development
PLOS ONE | https://doi.org/10.1371/journal.pone.0221264 September 4, 2019 2 / 23
Competing interests: The authors have declared
that no competing interests exist.

development system based on the underlying data through genetic algorithm. The mathemati-
cal results are obtained via a series of comparative analysis on the evolution regulation.
The outlines of this paper are organized as follows. We start with the literature review. In
the next section, the GDDS is set up and analyzed. Then we present the dynamic analysis of
the GDDS. After that a case study in China is showed, continued with the scenario analysis
based on China’s statistical data. In the last section, this paper draws the conclusions.
Literature review
The existing literature proves that green development is influenced by many factors such as
industrial technological, carbon intensity, macroeconomic uncertainty, and environmental
regulation. The regional green development performance shows strong spatial dependence
and spatial differentiation under the constraints of smog [21]. The green development level in
mineral resource-based cities presents a polarizing trend mainly owning to the long-term eco-
nomic and structural contradictions [22]. Jin et al. [23] show that macroeconomic uncertainty
has a more significant negative on urban green development performance in less developed
cities than that in developed and coastal cities. Taking Shanghai as an example, Shao et al. [24]
find that the performance of industrial green development in Shanghai mainly depends on
the technical efficiency change. However, the industrial green development model needs to be
further improved due to the industrial technological change is still not stable. The industrial
green development performance presents a circuitous downward trend after a transient rise in
China. Yang et al. [25] show that the carbon intensity constraint policy has a negative effect on
the industrial green production performance. Fu and Geng [26] think the improvement of cor-
porate regulatory compliance can promote green development. Meanwhile, public participa-
tion plays an essential role in achieving green development.
Some scholars confirm that imposing environmental tax causes a series of influences on
green development from economy, environment, and resources. Researches show different
effects of environmental tax on economic growth. Green tax reforms are found to growth
improving in a rising economy [27]. Such improvement in economic growth comes from envi-
ronmental production externality and a tax-shifting towards profits [28]. Furthermore, higher
energy tax would lead to higher economic growth if the labor input is mobile and the elasticity
of substitution in manufacturing between the scarce factors and energy is less than unity [29].
However, the environmental tax brings a negative effect to economic growth when the impact
of environmental tax on socioeconomic and environment are considered comprehensively via
a Compute General Equilibrium model [15].
At the same time, a great deal of researchers believe that levying environmental tax is
environmentally beneficial in restraining pollution and reducing carbon emissions. Liu et al.
[30] demonstrate that environmental tax could foster not only the effects of pollution control
but also lessen the losses of ecological environment. Piciu and Tric [31] prove that environ-
mental tax can be returned to polluters, that is to say, environmental tax can reduce pollution
and protect the environment under certain conditions. Tamura et al. [32] think environmental
tax is effective for total emission control of carbon dioxide only when high eliminate technol-
ogy with low cost has been developed. Niu et al. [33] find that the environmental tax shocks
can drive the reduction of carbon emissions. Wang et al. [34] demonstrate that higher environ-
mental and carbon tax levels in China would achieve more reduction in CO2 and air pollutant
emission.
From the resource aspect, imposing environmental tax can also save resources to avoid
resources waste. Patrik [35] indicates environmental tax is a factor that affects resources
recovery although the countries with higher environmental tax, the higher the recovery rate
Environmental tax and green development
PLOS ONE | https://doi.org/10.1371/journal.pone.0221264 September 4, 2019 3 / 23

of resources. Piciu and Tric [36] think that environmental tax could encourage the natural
resources recycling and it has a significant part of environmental policy in Europe. Amund-
sen and Schb [37] find levying environmental tax is favorable for countries with depleted
resources.
The above analysis of environmental tax on green development mainly comes from one
aspect of economic, pollution, and resource. In addition, some studies begin to analyze the
impact of environmental tax on green development from two aspects. Based on an endogenous
growth model, Bovenberg and Mooij [28] declare ETR could improve environmental quality
in one side and boost economic welfare in other side. Ekins et al. [38] adopt econometric
modeling to research the effect of ETR in Europe. Their results show that ETR could not only
result in long-term economic development but also promote environment benefits. Bosquet
[39] demonstrates that environmental tax can reduce carbon emissions significantly and
improve the quality of economic environment under certain conditions through a large num-
ber of modeling simulations.
The existing research gap is the present literature fail to reflect the impact of environmen-
tal tax on the green development from a dynamic and multiple interacting point of view. In
fact, the above mentioned researches shed lights on the impact of environmental tax on just
one or two laterals of the green development. In previous models, environmental tax is usu-
ally taken as an explanatory variables, together with other independent variables in some
cases, to explain its impact on economic growth or pollution intensity or resource intensity,
such as endogenous growth model [27], energy-environment-economy dynamic stochastic
general equilibrium model [33], deterministic optimization model [34], and random coeffi-
cient logit model [40]. However, these methods could not analyze the complex interactions
among all variables and influencing factors. As a result, the role of environmental tax on
green development has not been studied in an integrated view of the economy, environment,
and resource.
To fill this gap, this study takes economic growth, pollution emission, resources consumed,
and environmental tax as state variables, a nonlinear dynamical system approach can quantita-
tively analyze the impact of environmental tax on every aspect of green development. A non-
linear dynamical system describes the evolution of a state variable with time in the form of
a set of differential equations or discrete mappings. It can analyze the interactions among
variables simultaneously by combining multiple variables. There are many applications for
nonlinear dynamical systems such as computational fluid dynamics [41], energy-saving and
emission-reduction model [42], and resource-economy-pollution system [43].
Compared with the existing literatures, the contribution of this paper is mainly reflected in
three folds. (1) Environmental tax is regarded as an equivalent state in a green development
dynamical system (GDDS), no longer a control variable as in the existing literature. It seems
nature to take environmental tax as a control variable because environmental tax has impact
on each aspect of the green development. However, introducing environmental tax as a state
variable is of practice base considering that environmental tax is also influenced by different
levels of economy, environment, and resource. (2) Green development is analyzed in an inte-
grated manner from economy, environment, and resource sides by using the nonlinear
dynamical system approach. This study introduces the continuous-time variables to explore
the characteristics of the evolution of every variable with time so that these variables can be
considered together. (3) The GDDS is a quantitative model of green development and could
provide more possible results. Specifically, this paper uses economic growth, pollution inten-
sity, and resource intensity represent the indicators of economic, pollution, and resource
respectively. Therefore, this study can analyze the impact of an environmental tax on green
development based on the evolution of three indicators quantitatively.
Environmental tax and green development
PLOS ONE | https://doi.org/10.1371/journal.pone.0221264 September 4, 2019 4 / 23

The green development dynamical system (GDDS)
This paper establishes a nonlinear dynamical system for green development based on the inter-
actions among resources consumed, economic growth, pollution emission, and environmental
tax. It is an extension of the Resource-Economy-Pollution (REP) system in that the environ-
mental tax is added as a state variable.
Green development dynamical system (GDDS) is a complicated system including many
factors, such as government control, technology level, consumers awareness, pollution invest-
ment, ETR, and environment self-cleaning. These factors are closely connected and mutually
interacted. Fig 1 qualitatively shows the direction of interactions, where square boxes stand
for variables of green development system, unframed blocks indicate influencing factors, the
curved arrow labeled by ki (i = 1, 2, � � �, 22) represents the conductive relationship between cer-
tain variables and factors, and the symbol “+” indicates a promotion effect while “-” an inhibi-
tion effect between different variables and factors.
We will establish the GDDS according to the complex interactions among resources
consumed, economic growth, pollution emission, and environmental tax. Assume that the
resources consumed are water resources as well as fossil fuels, such as coal and oil, while low-
carbon energy is temporarily ignored [44]. The pollution emission is supposed to be the sum
of the discharge of sewage, waste gas, and solid waste. The economy is expected to maintain
steady growth for a certain period [45]. Let x(t), y(t), z(t), and w(t) respectively represent
the total resources consumed, the GDP, the amount of pollution, and the amount of
Fig 1. The interactions among the variables of GDDS.
https://doi.org/10.1371/journal.pone.0221264.g001
Environmental tax and green development
PLOS ONE | https://doi.org/10.1371/journal.pone.0221264 September 4, 2019 5 / 23

environmental tax in an economy during a period. The derivative of these variables is surely
some function of the variables themselves. We will find these functions in explicit forms one
by one.
Firstly, we analyze the form of dwdt ¼ Fðx; y; z;wÞ. The main goal of implementation of envi-
ronmental tax is to reduce air pollution emissions and environment protection. Therefore,
F(x, y, z, w) only contains two variables, namely, pollution z and environmental tax w. The
basic assumption is for environmental tax to grow exponentially, that is, dwdt ¼ dw. When there
is severe pollution, environmental tax will be strengthened in a more fierce frequent to raising
taxpayers’ awareness of environment protection. Otherwise, when pollution is under control,
a loosen environmental tax plan would be carried out [15]. Mathematically, dwdt is positive when
z> N, but negative when z< N. As shown by the close path k5, k6, k7, and k1 in Fig 1, these
influences on dwdt take the form of a product. Then we have
dwdt¼ dwðz � NÞ; ð1Þ
where N is the threshold of pollution discharge to environmental tax [46], the coefficient d is
the positive function of k1, k5, k6, and k7.
Secondly, we consider dxdt ¼ Gðx; y; z;wÞ. It is easy to see that the increase of the total
resources consumed is equal to the increase in resources consumption rate, so the resources
consumed is positively proportional to its rate, i.e., @G@x > 0, where the partial derivative @G
@x rep-
resents the resources coefficient of the resources consumption rate. From Fig 1, we can find
that @G@y is positive for an accelerating economy [23]. Because part of waste can be recycled and
some pollution can also be turned into resources (see k14 and k15), the rate will slow down
under the combined effect of pollution conversion and economic growth (see k12, k13, and
k20). Then dxdt gets the third term −a3yz. Imposing environmental tax can reduce the resources
consumption through the improvement of the technology level [47] (see k8, k9, and k10),
that is, @G@w > 0. The relationship between some variables and factors can be presented by
linear terms in the GDDS [48] as linear relationship is the most simple while important
approximation of a common phenomenon in the complex real world. Combining the above
analysis, we have
dxdt¼ a1xþ a2y � a3yz � a4w: ð2Þ
Thirdly, we considerdydt ¼ Hðx; y; z;wÞ. Intuitively, the rate related to resources consumed
presents a Logistic growth due to the rate is associated with resources consumed x(t) and the
potential share of resources (1 − x/M) simultaneously. The proportiondydt is positive when the
level of resources consumption is low, i.e., x<M, but negative when there is a high resources
consumption, i.e., x>M. In time of resources scarcity and environmental degradation, invest-
ment in resource exploring and environmental techniques would be encouraged to alleviate
the situation, which might obstruct the development of economy to a certain extent [8] (see k17
and k19), i.e., @H@y < 0. The severer pollution, the slower the economy develops, so the pollution
variable is negatively proportional to the rate of GDP (see k16), i.e., @H@z < 0. The rate becomes
greater when the amount of environmental tax increases via the government strengthens pol-
icy regulations over polluting enterprises (see k2, k3, and k4). Thus, the environmental tax
Environmental tax and green development
PLOS ONE | https://doi.org/10.1371/journal.pone.0221264 September 4, 2019 6 / 23

variable is positively proportional to the rate, i.e., @H@w > 0. In summary, we have
dydt¼ b1xð1 � x=MÞ � b2y � b3z þ b4w; ð3Þ
where M is the inflexion of resources consumed to economic growth.
Finally, we consider dzdt ¼ Iðx; y; z;wÞ. Optimizing the economic impact of environmental
issues is an important step in the integrated decision-making process of the development of
environment and economy [49]. At present, the pollution will increase with economic growth
(see k20) and large consumption of resources (see k11). Thus we get the term c1xy. Due to the
self-cleaning functions of the environment, such as pollution filtering, waste sink, and waste
decomposition, the pollution can slow down (k13, k14, and k15), i.e., @I@z < 0. After charged
with environmental tax, tools and techniques are likely to be adopted to decrease the pollution
because that consumers have a positive understanding of environmental tax (see k5, k6, and
k7), i.e., @I@w < 0 [19]. Then we get
dzdt¼ c1xy � c2z � c3w: ð4Þ
In conclusion, simultaneous Eqs (1)–(4), the green development dynamical system is set up
as follows:
dxdt¼ a1xþ a2y � a3yz � a4w;
dydt¼ b1xð1 � x=MÞ � b2y � b3z þ b4w;
dzdt¼ c1xy � c2z � c3w;
dwdt¼ dwðz � NÞ;
8>>>>>>>>>>>>>>>><
>>>>>>>>>>>>>>>>:
ð5Þ
where the coefficients ai, bi, cj (i = 1, 2, 3, 4; j = 1, 2, 3) together with M, N are positive.
The indicators of green development can be derived for the variables of the GDDS. Thus,
this paper selects economic growth, pollution intensity, and resource intensity as the indicators
of green development.
Pollution intensity is devoted to measuring the level of environmental performance. Pollu-
tion intensity is the ratio of the total amount of pollution to economic output during a given
period [50]. A country’s pollution intensity is usually described as pollutant emissions per
GDP, i.e.,
pollution intensity ¼pollution discharge during a given period
gross domestic product during a given period:
The smaller the pollution intensity, the better the green development performance. According
to the dynamical system (5), we can deduce the pollution discharge at time t during a given
period is y(t) = ϕ1(x, k1y, z, w, t), and the GDP z(t) = ϕ2(x, k1y, z, w, t). Thus, the time depen-
dent pollution intensity during a given period can be described as
PðtÞ ¼ �1ðx; k1y; z;w; tÞ=�2ðx; k1y; z;w; tÞ; ð6Þ
where k1 is the pollution discharge coefficient.
Environmental tax and green development
PLOS ONE | https://doi.org/10.1371/journal.pone.0221264 September 4, 2019 7 / 23

Resource intensity is used to measure the resource utilization. Resource intensity is the
ratio of the resources consumption to economic output at time t during a given period [51,
52]. A country’s resource intensity is usually described as resources consumed per GDP, i.e.,
resource intensity ¼resources consumed during a given period
gross domestic product during a given period:
A higher resource intensity indicates a higher environmental cost. Let the resources consumed
at time t during a given period be x(t) = φ1(k2x, y, z, w, t), and the GDP z(t) = φ2(k2x, y, z, w, t).Thus, the resource intensity during a given period can be described as
RðtÞ ¼ φ1ðk2x; y; z;w; tÞ=φ2
ðk2x; y; z;w; tÞ; ð7Þ
where k2 is the resources consumed coefficient.
Dynamic analysis of GDDS
The dynamic analysis of the GDDS confirmed by Eq (5) are analyzed in this part, including
equilibrium points analysis and complex behaviors of the system.
Equilibrium points analysis
For an ordinary differential equations, an equilibrium point is a solution that does not change
with time. In other words, the equilibrium point is the solution that when the right end of the
all equations are zero. For example, the equilibrium point of the system (5) are found by calcu-
lating the following nonlinear algebraic equations
a1xþ a2y � a3yz � a4w ¼ 0;
b1xð1 � x=MÞ � b2y � b3z þ b4w ¼ 0;
c1xy � c2z � c3w ¼ 0;
dwðz � NÞ ¼ 0:
8>>>>>>>>><
>>>>>>>>>:
ð8Þ
The number of equilibrium points depends on the values of parameters. However, the ori-
gin E(0, 0, 0, 0) is always an equilibrium point. This paper selects a possible set of parameters
P0 such that the GDDS would be chaotic. The selection is based on the sign of the eigenvalues
of the Jacobian matrix and the divergence of the system.
The Jacobian matrix of Eq (5) at point E(x, y, z, w) is
J ¼
a1 a2 � a3z � a3y � a4
b1 � 2b1x=M � b2 � b3 b4
c1y c1x � c2 � c3
0 0 dw dðz � NÞ
0
BBBBBBB@
1
CCCCCCCA
: ð9Þ
The characteristic polynomial is
f ðlÞ ¼ jJ � Ilj ¼ lðl3þ p1l
2þ p2l
2þ p3Þ; ð10Þ
Environmental tax and green development
PLOS ONE | https://doi.org/10.1371/journal.pone.0221264 September 4, 2019 8 / 23

where I is the fourth-order unit matrix,
p1 ¼ � a1 þ b2 þ c2;
p2 ¼ b2c2 � a1c2 � a1b2 � a2b1 þ b3c1xþ a3b1z þ a3c1y2 þ 2ða1b1 � a3b1xzÞ=M;
p3 ¼ � a1b2c2 � a2b1c2 þ a3b1c2 � a1b3c1xþ a3b1c1xyþ a2b3c1y �
a3b3c1yz þ a3b2c1y2 þ 2ða2b1c2x � a3b1c2xz � a3b1c1x2yÞ=M:
This study sees that the equilibrium point is stable if each pi (i = 1, 2, 3) is favorable by the
Routh-Hurwitz criterion. For some certain parameters, Eq (10) has unstable saddle-focus
points.
The divergence of the GDDS is
rV ¼@ _x@xþ@ _y@yþ@ _z@zþ@ _w@w¼ a1 � b2 � c2 þ dðz � NÞ: ð11Þ
Chaos might appear for negative divergence.
Considering further the stable conditions, this study finds a possible parameter set P0 lead-
ing to chaos as shown in Eq (12). On such parameters, this paper has the equilibrium points
and their corresponding eigenvalues as shown in Table 1. Analogy to the cases in the 2D and
3D system, this study sees E2 − E6 are unstable saddle-focus points, which might lead to chaos.
a1 ¼ 0:065; a2 ¼ 0:035; a3 ¼ 0:065; a4 ¼ 0:026;
b1 ¼ 0:6; b2 ¼ 0:088; b3 ¼ 0:07; b4 ¼ 0:066;
c1 ¼ 0:468; c2 ¼ 0:065; c3 ¼ 0:816; d ¼ 0:035;
M ¼ 6:6;N ¼ 0:45:
ð12Þ
Complex behaviors
This subsection shows different dynamic behaviors, such as chaotic attractor, limit cycle, and
equilibrium, of the GDDS by numerical simulation.
Chaos is a seemingly irregular and complex phenomenon that exists in the real world.
Therefore, the emergence of chaos may be an important condition to verify whether the model
is consistent with reality [53]. The Lyapunov exponent spectrum and bifurcation diagram are
used to prove the appearance of chaos. Since the main goal of environmental tax is to reduce
pollution, we select the bifurcation parameter to be c2 which is directly related to pollution. All
Table 1. Equilibrium points and their corresponding eigenvalues of Eq (5).
Equilibrium point λ1 λ2 λ3 λ4
E1(0, 0, 0, 0) 0.1524 -0.1754 -0.0600 -0.2310
E2(0.0104, −0.274, 0.4500, −0.0347) 0.0725 -0.2210 −0.0749 + 0.0070i −0.0749 − 0.0070iE3(0.9606, 7.3824, 0.4500, 4.0342) 0.1553 -0.2130 −0.1203 + 1.3543i −0.1203 − 1.3543iE4(8.1926, 4.5817, 0.4500, 21.4948) 2.7109 -0.2733 −1.3679 + 2.6824i −1.3679 − 2.6824iE5(0.2157, 0.5522, 0.9292, 0) 0.0214 -0.1985 −0.0522 + 0.1102i −0.0522 − 0.1102iE6(4.2367, 0.3663, 12.1048, 0) 2.8327 -2.7884 -0.1273 0.1927
E7(8.8345, −0.3542, −24.4057, 0) -0.1168 -1.0852 0.0169 + 6.1251i 0.0169 − 6.1251iE8(−0.0870, −0.9314, 0.6318, 0) -0.1431 -0.2089 0.0301 + 0.1788i 0.0301 − 0.1788i
https://doi.org/10.1371/journal.pone.0221264.t001
Environmental tax and green development
PLOS ONE | https://doi.org/10.1371/journal.pone.0221264 September 4, 2019 9 / 23

results are based on the initial value [0.196, 0.36, 0.88, 0.29] and parameters in set P0 while c2
varying in the interval [0.05 0.13].
Firstly, the existence of chaos is verified by the Lyapunov exponent spectrum. The Lyapu-
nov exponent spectrum is shown in Fig 2. The system might be chaotic at certain parameters
where the maximum Lyapunov exponent is positive and the sum of all Lyapunov exponents is
negative.
Secondly, the existence of chaos is further tested by bifurcation diagram. The bifurcation
diagram is as shown in Fig 3. An abrupt bifurcation occurs in the system about c2 = 0.122, that
is to say, c2 = 0.122 is the critical value between a stable and unstable state of the GDDS. Chaos
would appear at parameters smaller than the critical value.
Among the four state variables, the pollution variable z has a more close relation with envi-
ronmental tax because the base of environmental tax is a physical unit that has a proven, spe-
cific, and negative impact on the environment. Therefore, we only select the bifurcation
diagram of the pollution variable z. Furthermore, z is not isolated. Actually, the four state
variables x, y, z, and w in the GDDS are interrelated. Once chaos is inferred from the bifurca-
tion diagram of z, the same inference can also be drawn from bifurcation diagrams of other
variables.
Finally, a chaotic attractor occurs as shown in Fig 4 when c2 = 0.065. The chaotic attractor
of GDDS is a new attractor compared with the previous chaotic attractors such as Lorenz
attractor, Chen attractor, and Lu attractor. It has different chaotic behaviors, different equilib-
rium points, and various types of equilibrium points based on above analysis.
Generally, there are different chaotic attractors when these parameters changed. For system
(5), in addition to the chaotic attractor as shown in Fig 4, we will have an another new chaotic
attractor (Fig 5) when c2 changes into 0.071.
The limit cycle of the GDDS can be obtained when the maximum Lyapunov exponent is
zero. A in Fig 6 indicates a limit circle of the GDDS. We can see that the trajectories of the
GDDS present a periodic phenomenon when c2 = 0.122.
Fig 2. Lyapunov exponent spectrum.
https://doi.org/10.1371/journal.pone.0221264.g002
Environmental tax and green development
PLOS ONE | https://doi.org/10.1371/journal.pone.0221264 September 4, 2019 10 / 23

We can get stable equilibriums when the maximum Lyapunov exponent is negative. B in
Fig 6 indicates a stable equilibrium of the GDDS with c2 = 0.129. It means that the trajectories
of the GDDS convergence to the equilibrium at the same time.
The above analysis shows that the GDDS has different trajectories under different parame-
ters: a limit cycle, an equilibrium point, or chaos. For an actual system, its evolution has
already been determined by its system parameters and the initial conditions. However, its
phase may be changed once there are some perturbation to the parameters. Like the theoretic
model does, the actual system may change from one of the above mentioned behavior to
another under different sets of parameters [46]. A chaotic state is not conducive to the devel-
opment of economic and social. Different stable states correspond to different socioeconomic
development reality. Therefore, we want to find an empirical way to adjust the parameter to
grantee a desired evolution results.
A case study in China
This section exemplifies a stable case of the GDDS. First, this paper obtains the required data
from the China Statistical Yearbook and process the data through the analytic hierarchy pro-
cess. Then, this paper gets a set of actual parameters P1 by genetic algorithm based on actual
data. Finally, the phase diagram of the actual system is obtained.
Data and preliminary process
In the practice, the variables for resources, economic, pollution, and environmental tax are the
combination of several elements. This study takes the resources variable x(t) as the sum of con-
sumption of coal, oil, natural gas, and water resources. The pollution variable is z = 0.5788z1
+ 0.8059z2 + 0.1247z3, where z1, z2, and z3 represent the emissions of industrial waste water,
Fig 3. Bifurcation diagram of z with parameter c2.
https://doi.org/10.1371/journal.pone.0221264.g003
Environmental tax and green development
PLOS ONE | https://doi.org/10.1371/journal.pone.0221264 September 4, 2019 11 / 23
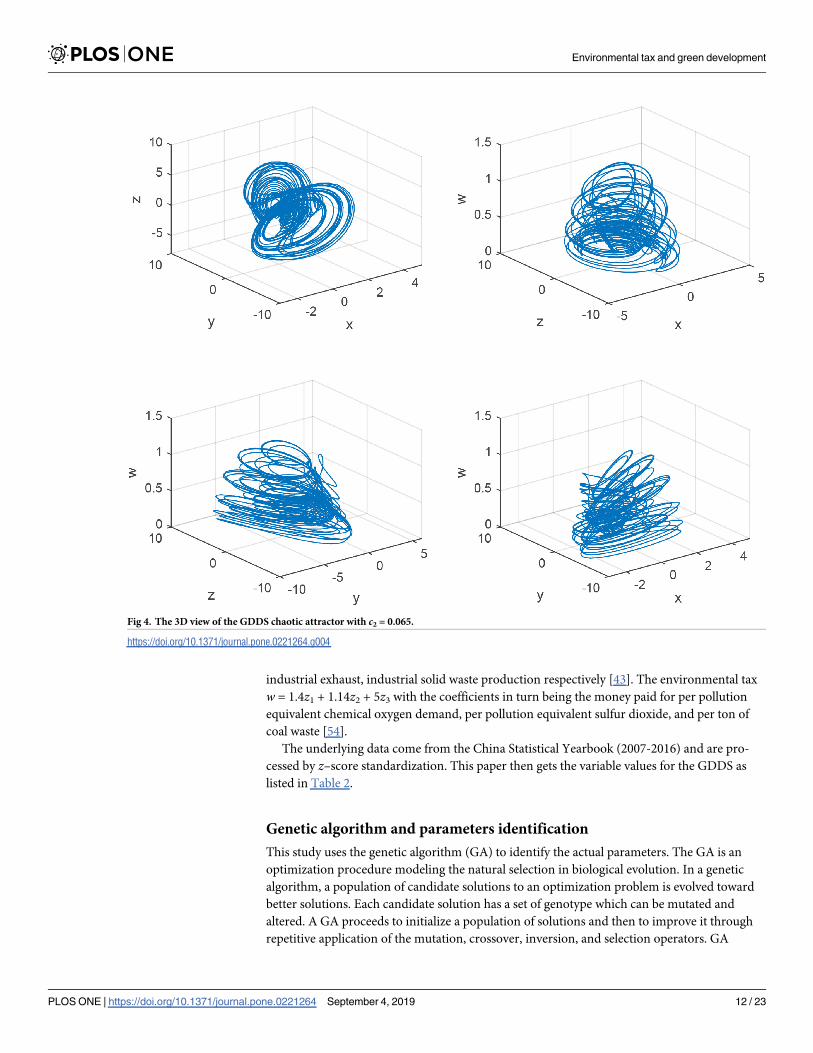
industrial exhaust, industrial solid waste production respectively [43]. The environmental tax
w = 1.4z1 + 1.14z2 + 5z3 with the coefficients in turn being the money paid for per pollution
equivalent chemical oxygen demand, per pollution equivalent sulfur dioxide, and per ton of
coal waste [54].
The underlying data come from the China Statistical Yearbook (2007-2016) and are pro-
cessed by z–score standardization. This paper then gets the variable values for the GDDS as
listed in Table 2.
Genetic algorithm and parameters identification
This study uses the genetic algorithm (GA) to identify the actual parameters. The GA is an
optimization procedure modeling the natural selection in biological evolution. In a genetic
algorithm, a population of candidate solutions to an optimization problem is evolved toward
better solutions. Each candidate solution has a set of genotype which can be mutated and
altered. A GA proceeds to initialize a population of solutions and then to improve it through
repetitive application of the mutation, crossover, inversion, and selection operators. GA
Fig 4. The 3D view of the GDDS chaotic attractor with c2 = 0.065.
https://doi.org/10.1371/journal.pone.0221264.g004
Environmental tax and green development
PLOS ONE | https://doi.org/10.1371/journal.pone.0221264 September 4, 2019 12 / 23

has been successfully applied in identifying parameters of actual nonlinear dynamical systems
[55].
To using the GA, we rewrite the GDDS as a vector form:
_XðtÞ ¼ f ðXðtÞ; aÞ; ð13Þ
where X represents the state of the system, α is the system parameter. We then discrete it as:
Xðkþ 1Þ ¼ XðkÞ þ f ðXðkÞÞ ¼ FðXðkÞ; aÞ: ð14Þ
Therefore, the parameter identification of the GDDS is equivalent to the nonlinear optimiza-
tion problem:
min1
2
XT
k¼1
kX kþ 1ð Þ � F X kð Þ; að Þk2; s:t: ai > 0: ð15Þ
The identification process is carried out on a PC by using the MATLAB software. The pop-
ulation size is set as 200, the crossover rate is 0.4, the mutation rate is 0.1, error tolerance is
10−6. This paper then gets the identified parameter set P1 as shown in Eq (16). This set is
Fig 5. The 3D view of the GDDS chaotic attractor with c2 = 0.071.
https://doi.org/10.1371/journal.pone.0221264.g005
Environmental tax and green development
PLOS ONE | https://doi.org/10.1371/journal.pone.0221264 September 4, 2019 13 / 23

distinct from the set P0. Consequently, different phenomena of other chaos may occur.
a1 ¼ 0:1342; a2 ¼ 0:5525; a3 ¼ 0:7955; a4 ¼ 0:0408;
b1 ¼ 0:0094; b2 ¼ 0:5517; b3 ¼ 0:0396; b4 ¼ 0:2488;
c1 ¼ 0:6705; c2 ¼ 0:5828; c3 ¼ 0:1037; d ¼ 0:4092;
M ¼ 0:1951;N ¼ 0:6873:
ð16Þ
This paper gets a stable state for the actual system. Fig 7 shows the 2D-phases of the actual
system on the parameter set P1 and the initial values [0.14, −0.25, 0.17, 0.25]. It indicates that
the system evolves to a stable point. Furthermore, this point is calculated to be [0.8509, 1.2424,
0.6872, 2.9720] by MATLAB.
Scenario analysis
This section discusses the impact of environmental tax on economic growth, pollution inten-
sity, and resource intensity. The actual GDDS identified in the above section is used as the
benchmark. This paper analyzes the evolution of the three indicators for different values of
parameters a4, b4, and c3. These parameters are closely related with environmental tax. We
recall that a4, b4, and c3 represent the technology level, the government control, and the con-
sumer awareness respectively.
Fig 6. The stable state of the GDDS. A: The limit circle with c2 = 0.122. B: The equilibrium with c2 = 0.129.
https://doi.org/10.1371/journal.pone.0221264.g006
Table 2. Experimental values for x(t), y(t), z(t), and w(t).
Year x(t) y(t) z(t) w(t) Year x(t) y(t) z(t) w(t)2007 -0.2701 -0.2166 0.6828 0.4354 2012 0.7740 0.6066 0.9514 1.0188
2008 -0.1677 -0.0664 0.4772 0.3080 2013 0.9015 0.7738 0.7682 0.8704
2009 -0.0279 0.0237 0.3570 0.2166 2014 0.9359 0.9223 0.6697 0.7900
2010 0.3132 0.2185 0.2841 0.1721 2015 0.9544 1.0597 0.5641 0.6951
2011 0.5783 0.4510 1.0047 1.0727 2016 1.0086 1.2275 -0.7592 -0.5791
https://doi.org/10.1371/journal.pone.0221264.t002
Environmental tax and green development
PLOS ONE | https://doi.org/10.1371/journal.pone.0221264 September 4, 2019 14 / 23

Fig 7. The 2D phase diagram of the 4D actual system.
https://doi.org/10.1371/journal.pone.0221264.g007
Fig 8. Evolution of economic growth with different government control parameter b4. Benchmark case: b4 =
0.2488. Medium case: b4 = 0.4488. Strong case: b4 = 0.6488. The vertical dotted lines separate the evolution period
into three time periods. The sub-figure in the upper-right corner is a partially enlarged view. The figures after this
have the same meanings as this figure.
https://doi.org/10.1371/journal.pone.0221264.g008
Environmental tax and green development
PLOS ONE | https://doi.org/10.1371/journal.pone.0221264 September 4, 2019 15 / 23

This paper sets three scenario cases when environmental tax is employed. The benchmark
case corresponds to using parameters in set P1, while the medium case with a greater parame-
ter, and the strong case with the largest parameter. The case without environmental tax is
called the null case.
The impact on economic growth
This paper first analyzes the impact on economic growth of governmental control and con-
sumer awareness.
Fig 8 shows the evolution of economic growth with different levels of government control.
Firstly, curves for three cases with environmental tax have greater fluctuation than the null
case. This indicates that imposing environmental tax has obvious impacts on the economy.
Secondly, the evolution period can be divided into three periods: the initial stage, the fluctua-
tion phase, and the stable period. In the initial stage, no significant differences exist for the
four curves. In the fluctuation period, the strong case has the highest but delayed peak. This
indicates that the stronger the government control, the bigger yet later the economy peak. In
the stable period, economic growth decrease monotonously then levels off according to the
strength. This indicates that a higher government control could promote economic develop-
ment in the long run.
Fig 9 reveals the evolution of economic growth with different levels of consumer aware-
ness. Curve for the null case is gentler than the three cases with environmental tax and is
almost always below these curves. This demonstrates that imposing environmental tax can
promote economic growth. In the initial period, these four curves roughly coincide. In the
Fig 9. Evolution of economic growth with different consumers control parameter c3. Benchmark case: c3 = 0.1037.
Medium case: c3 = 0.1437. Strong case: c3 = 0.1637.
https://doi.org/10.1371/journal.pone.0221264.g009
Environmental tax and green development
PLOS ONE | https://doi.org/10.1371/journal.pone.0221264 September 4, 2019 16 / 23

fluctuation period, the greater the consumer awareness, the higher and far more right the
peak. In the stable period, all the curves tend to a same approximate stage. But it takes more
time for the strong case. This demonstrates the improvement of consumer awareness can
also improve economy in the long term. But the effect is weaker than that of the government
control.
The impact on pollution intensity
Then, this paper discusses the impact on pollution intensity of government control.
Fig 10 represents the evolution of pollution intensity with different degrees of government
control. Curves for three cases with environmental tax are below that of the null case. This
shows that imposing environmental tax plays a significant role in reducing pollution. In the
initial period, the strong case curve is below the other three curves. In the fluctuation period,
curves for the benchmark case and medium case have strong fluctuation, and the other curves
are almost stable. This indicates there is an upper limit of government control. Under the bor-
der, the corresponding curves fluctuate without determined modes. But in the stable period,
These curves are leveling off between the null case and the strong case. This shows that the
stronger government control has significant impacts on reducing pollution.
The impact on resource intensity
Finally, this study focuses on the impact on resource intensity of government control and tech-
nology level.
Fig 10. Evolution of pollution intensity with different government control parameter b4. Benchmark case: b4 =
0.2488. Medium case: b4 = 0.6488. Strong case: b4 = 0.7488.
https://doi.org/10.1371/journal.pone.0221264.g010
Environmental tax and green development
PLOS ONE | https://doi.org/10.1371/journal.pone.0221264 September 4, 2019 17 / 23

Fig 11 shows the evolution of resource intensity with different strength of government
control. Note that the null case curve is almost below than the curves for three cases with envi-
ronmental tax. This indicates that the increase in resources consumed makes the economy
negative so that the resource intensity is negative without the environmental tax, that is,
imposing environmental tax could help save resources. In the initial period, all curves are neg-
ative and the strong case locates the highest. In the fluctuation period, curves for the three
cases with environmental tax fluctuate more frequently while the null case curve is almost
stable. The stronger the government control, the later the fluctuations occur. But the peak is
not changed much with the increase of government control. In the stable period, the four
curves are tend to stable, and the stable value become smaller and smaller as the government
control increases. This indicates that the strong government control could manage resources
effectively.
Fig 12 demonstrates the evolution of resource intensity with different levels of technology.
The variation patterns are similar to these in Fig 12. For the length of the paper, this paper
omits the detail explanation. This paper summarizes that improve the level of technology can
also save resources and avoid resources waste to manage resources.
Conclusions
The international community has regarded environmental tax as a real policy instrument for
green development. This paper shows the evolution of economic growth, pollution intensity,
and resource intensity when imposing environmental tax from a perspective of dynamical sys-
tem. A four-dimension dynamical system is constructed to model the complex interactions
Fig 11. Evolution of resource intensity with different government control parameter b4. Benchmark case: b4 =
0.2488. Medium case: b4 = 0.4488. Strong case: b4 = 0.6488.
https://doi.org/10.1371/journal.pone.0221264.g011
Environmental tax and green development
PLOS ONE | https://doi.org/10.1371/journal.pone.0221264 September 4, 2019 18 / 23

among the variables of resources, economy, pollution, and environmental tax. Stability of the
GDDS is studied by dissipative analysis and Routh-Hurwitz criteria and this system is proved
to be chaotic by the Lyapunov exponent spectrum and bifurcation diagram. By using genetic
algorithm, system parameters are identified under which the benchmark case of China is sta-
ble. Evolution paths under different scenarios are illustrated to display the role of environmen-
tal tax on green development.
This paper confirms the view in the literature mathematically that imposing environmental
tax plays an active part in green development. The role of environmental tax on green develop-
ment is reflected in this study by the comparison of the evolution of green development indica-
tors between different scenarios. On one hand, when an environmental tax has been levied,
three indicators all deviate away from their null case without environmental tax. The relative
locations of the indicator curves show that environmental tax can promote economic growth,
save resources, and reduce pollution. The influence becomes significantly greater in the long
run. On the other hand, results of the differences in the evolution paths under selected envi-
ronmental tax parameters indicate possible ways to promote green development. The ways
include reinforcing government control, increasing consumers awareness as well as improving
technology level. Among them, the government control surpasses the others. This indicates
the necessity to enhance the government’s functions such as further improve China’s govern-
ment supervision system, establish and improve various environmental tax systems, formulate
strict emission standards, and continuously supplement multiple standards. The enhancement
might be practical for China as the country has a powerful government system. For other
market-oriented economies, although the dynamical system approach can still be used, the
Fig 12. Evolution of resource intensity with different technology level parameter a4. Benchmark case: a4 = 0.0008.
Medium case: a4 = 0.0208. Strong case: a4 = 0.0408.
https://doi.org/10.1371/journal.pone.0221264.g012
Environmental tax and green development
PLOS ONE | https://doi.org/10.1371/journal.pone.0221264 September 4, 2019 19 / 23

preferred consideration is advanced technology and higher consumers awareness rather than
the government control.
There are still some limitations in this research. Firstly, results of this research may be vul-
nerable. As this study applies a small set of data and the status quo in China, different results
may be drawn if study area changes or more abundant data are available. Secondly, the linear
terms in the theoretical dynamical model are simple assumptions of the relations between
green development variables. More sophisticated assumptions and terms may be made and
derived. Thirdly, this study focuses on green development in a country or regional level. Green
development in industries or sectors has not been involved. This study also provides some pos-
sible directions for future researches. One direction can be the application of the GDDS in
other countries and regions. The second direction can be the modification of the GDDS. The
linear assumption can be weakened to more complex forms such as quadratics to set up new
green development models. Future studies can also focus on theoretical modeling or empirical
application of GDDS in industries or sectors.
Author Contributions
Conceptualization: Xinghua Fan, Xuxia Li.
Data curation: Jiuli Yin.
Formal analysis: Xuxia Li.
Funding acquisition: Xinghua Fan, Jiuli Yin.
Methodology: Xuxia Li.
Project administration: Xinghua Fan, Jiuli Yin.
Resources: Xuxia Li.
Software: Xinghua Fan.
Supervision: Jiuli Yin.
Validation: Jiuli Yin.
Visualization: Jiuli Yin.
Writing – original draft: Xinghua Fan, Xuxia Li.
Writing – review & editing: Xinghua Fan, Xuxia Li.
References1. Brand U. Green Economy–the Next Oxymoron? No Lessons Learned from Failures of Implementing
Sustainable Development. GAIA Ecol Perspect Sci Soc. 2012; 21(1): 28–32.
2. Organization for Economic Cooperation and Development (OECD). Towards Green Growth: Monitoring
Progress OECD Indicator. French: OECD library.
3. United Nations Environment Programme (UNEP). Green Economy: Developing Countries Success
Stories. 2010.
4. World Bank. Inclusive Green Growth: the Pathway to Sustainable Development. 2012.
5. Feng C, Wang M, Liu GC, Huang JB. Green development performance and its influencing factors: A
global perspective. J Clean Prod. 2017; 144: 323–333. https://doi.org/10.1016/j.jclepro.2017.01.005
6. Barbier E. How is the Global Green New Deal going? Nat. 2010; 464: 832–833. https://doi.org/10.1038/
464832a
7. Sun CZ, Tong YL, Zou W. The evolution and a temporal-spatial difference analysis of green develop-
ment in China. Sustain Cities Soc. 2018; 41: 52–61. https://doi.org/10.1016/j.scs.2018.05.006
Environmental tax and green development
PLOS ONE | https://doi.org/10.1371/journal.pone.0221264 September 4, 2019 20 / 23

8. Li XX. Scientific development and a new green deal. China Finance Econ Rev. 2014; 2: 2. https://doi.
org/10.1186/2196-5633-2-2
9. BP. Statistical review of world energy 1965–2017. 2018. Available from: https://www.bp.com/.
10. Miao Z, Tomas B, Tian ZH, Shao S, Geng Y, Wu R. Environmental Performance and Regulation Effect
of China’s Atmospheric Pollutant Emissions: Evidence from “Three Regions and Ten Urban Agglomera-
tions”. Environ Resource Econ. 2019; 1–32.
11. Zhang QF, Robert C. Toward an Environmentally Sustainable Future: Country Environmental Analysis
of the People’s Republic of China. 1st ed. Philippines: Asian Development Bank; 2012.
12. Current Situation and Prevention of Water Pollution in China_Water Pollution. 2019 Jan 1. Available
from: http://www.sohu.com/a/290470460_278265.
13. Feng C, Wang M. The heterogeneity of China’s pathways to economic growth, energy conservation
and climate mitigation. J Clean Prod. 2019; 228: 594–605. https://doi.org/10.1016/j.jclepro.2019.04.
326
14. Sabina H, Brati V. “Comparative analysis of environmental taxes in EU and Croatia.” Ekon Misao. 2015;
2: 555–578.
15. Li G, Masui T. Assessing the impacts of China’s environmental tax using a dynamic computable
general equilibrium model. J Clean Prod. 2019; 208: 316–324. https://doi.org/10.1016/j.jclepro.2018.
10.016
16. Ciaschini M, Pretaroli R, Severini F, Socci C. Regional double dividend from environmental tax reform:
An application for the Italian economy. Res Econ. 2012; 66(3): 273–283. https://doi.org/10.1016/j.rie.
2012.04.002
17. Hu XH, Liu Y, Shi QL, Zhang W, Zhong C. SO2 emission reduction decomposition of environmental tax
based on different consumption tax refunds. J Clean Prod. 2018; 186: 997–1010. https://doi.org/10.
1016/j.jclepro.2018.03.144
18. Gonzlez R, Hosoda EB. Environmental impact of aircraft emissions and aviation fuel tax in Japan. J Air
Tran Manage. 2016; 57: 234–240. https://doi.org/10.1016/j.jairtraman.2016.08.006
19. Yu M, Cruzb JM, Li DM. The sustainable supply chain network competition with environmental tax poli-
cies. Int J Prod Econ. 2018. https://doi.org/10.1016/j.ijpe.2018.08.005
20. Ekins P, Pollitt H, Summerton P, Chewpreecha U. Increasing carbon and material productivity through
environmental tax reform. Energy Policy. 2012; 42: 365–376. https://doi.org/10.1016/j.enpol.2011.11.
094
21. Chen LL, Zhang XD, He F, Yuan RS. Regional green development level and its spatial relationship
under the constraints of haze in China. J Clean Prod. 2019; 210: 376–387. https://doi.org/10.1016/j.
jclepro.2018.11.037
22. Yang YY, Guo HX, Chen LF, Liu X, Gu MY, Ke XL. Regional analysis of the green development level dif-
ferences in Chinese mineral resource-based cities. Res Policy. 2019; 61: 261–272. https://doi.org/10.
1016/j.resourpol.2019.02.003
23. Jin PZ, Peng C, Song ML. Macroeconomic uncertainty, high–level innovation, and urban green devel-
opment performance in China. China Econ Rev. 2019; 55: 1–18. https://doi.org/10.1016/j.chieco.2019.
02.008
24. Shao S, Luan RR, Yang ZB, Li CY. Does directed technological change get greener: Empirical evidence
from Shanghai’s industrial green development transformation. Ecol Indicators. 2016; 69: 758–770.
https://doi.org/10.1016/j.ecolind.2016.04.050
25. Yang ZB, Fan MT, Shao S, Yang LL. Does carbon intensity constraint policy improve industrial green
production performance in China? A quasi-DID analysis. Energy Econ. 2017; 68: 271–282. https://doi.
org/10.1016/j.eneco.2017.10.009
26. Fu JY, Geng YY. Public participation, regulatory compliance and green development in China based on
provincial panel data. J Clean Prod. 2019; 230: 1344–1353. https://doi.org/10.1016/j.jclepro.2019.05.
093
27. Oueslati W. Environmental tax reform: Short-term versus long-term macroeconomic effects. J Macroe-
con. 2014; 40: 190–201. https://doi.org/10.1016/j.jmacro.2014.02.004
28. Bovenberg AL, Mooij RA. Environmental tax reform and endogenous growth. J Public Econ. 1997; 63
(2): 207–237. https://doi.org/10.1016/S0047-2727(96)01596-4
29. Karydas C, Zhang L. Green tax reform, endogenous innovation and the growth dividend. J Environ
Econ Manage. 2017. https://doi.org/10.1016/j.jeem.2017.09.005
30. Liu CG, Cai W, Zhang CX, Ma M, Rao W, Li W et al. Developing the ecological compensation criterion
of industrial solid waste based on emergy for sustainable development. Energy. 2018; 157: 940–948.
https://doi.org/10.1016/j.energy.2018.05.207
Environmental tax and green development
PLOS ONE | https://doi.org/10.1371/journal.pone.0221264 September 4, 2019 21 / 23

31. Piciu GC, Tric CL. Assessing the impact and effectiveness of environmental taxes. Proc Econ Finance.
2012; 3: 728–733. https://doi.org/10.1016/S2212-5671(12)00221-3
32. Tamura H, Nakanishi R, Hatono I, Umano M. Is environmental tax effective for total emission control of
carbon dioxide?: Systems analysis of an environmental—economic model. IFAC. 1996; 29(1): 5435–
5440.
33. Niu T, Yao X, Shao S, Li D, Wang W. Environmental tax shocks and carbon emissions: An estimated
DSGE model. Struc Chan Econ Dyna. 2018; 47: 9–17. https://doi.org/10.1016/j.strueco.2018.06.
005
34. Wang B, Liu L, Huang G, Li W, Xie Y. Effects of carbon and environmental tax on power mix planning—
A case study of Hebei province, China. Energy. 2018; 143: 645–657. https://doi.org/10.1016/j.energy.
2017.11.025
35. Sderholm P. Taxing virgin natural resources: Lessons from aggregates taxation in Europe. Resour Con-
serv Recycl. 2011; 55(11): 911–922. https://doi.org/10.1016/j.resconrec.2011.05.011
36. Piciu GC, Tric CL. Trends in the evolution of environmental taxes. Proc Econ Finance. 2012; 3: 716–
721. https://doi.org/10.1016/S2212-5671(12)00219-5
37. Amundsen ES, Schb R. Environmental taxes on exhaustible resources. Eur J Polit Econ. 1999; 15(2):
311–329. https://doi.org/10.1016/S0176-2680(99)00008-7
38. Ekins P, Pollitt H, Barton J, Blobel D. The implications for households of environmental tax reform
(ETR) in Europe. Ecol Econ. 2011; 70(12): 2472–2485. https://doi.org/10.1016/j.ecolecon.2011.08.004
39. Bosquet B. Environmental tax reform: Does it work? A survey of the empirical evidence. Ecol Econ.
2000; 34: 19–32. https://doi.org/10.1016/S0921-8009(00)00173-7
40. Bonnet C, Bouamra MZ, Corre T. An Environmental Tax Towards More Sustainable Food: Empirical
Evidence of the Consumption of Animal Products in France. Ecol Econ. 2018; 147: 48–61. https://doi.
org/10.1016/j.ecolecon.2017.12.032
41. Griffiths W, Boysan F. Computational fluid dynamics (CFD) and empirical modelling of the performance
of a number of cyclone samplers. J Aerosol Sci. 1996; 27(2): 281–304. https://doi.org/10.1016/0021-
8502(95)00549-8
42. Fang G, Tian L, Sun M, Fu M. Analysis and application of a novel three-dimensional energy-saving and
emission-reduction dynamic evolution system. Energy. 2012; 40(1): 291–299. https://doi.org/10.1016/j.
energy.2012.01.071
43. Fan XH, Xu HH, Yin JL, Ning C. Chaotic behaviour in a Resource—Economy—Pollution dynamic sys-
tem. J Multi Engin Sci Tech. 2017; 4: 2458.
44. Fan XH, Zhang Y, Yin JL. Evolutionary Analysis of a Three-Dimensional Carbon Price Dynamic Sys-
tem. Sustainability. 2019; 11: 116. https://doi.org/10.3390/su11010116
45. Gao CX, Sun M, Shen B, Li RR, Tian LX. Optimization of China’s energy structure based on portfolio
theory. Energy. 2014; 77: 890–897. https://doi.org/10.1016/j.energy.2014.09.075
46. Wang MG, Tian LX. Regulating effect of the energy market–theoretical and empirical analysis based on
a novel energy prices–energy supply–economic growth dynamic system. Appl Energy. 2015; 155:
526–546.
47. Pilpola S, Arabzadeh V, Mikkola J, Lund PD. Analyzing National and Local Pathways to Carbon–Neu-
trality from Technology, Emissions, and Resilience Perspectives–Case of Finland. Energies. 2019; 12:
949. https://doi.org/10.3390/en12050949
48. Henning U, Timmer J. Nonlinear Dynamical System Identification From Uncertain And Indirect Mea-
surements. Int J Bifurcat Chaos. 2004; 14(6): 1905–1933. https://doi.org/10.1142/
S0218127404010345
49. Gao Y, Liu GY, Casazzac M, Hao Y, Zhang Y, Giannetti BF. Economy—pollution nexus model of cities
at river basin scale based on multiagent simulation: A conceptual framework. Ecol Modell. 2018; 379:
22–38. https://doi.org/10.1016/j.ecolmodel.2018.04.004
50. Bithas K, Kalimeris P. Unmasking Decoupling: Redefining the Resource Intensity of the Economy. Sci
Total Environ. 2018; 619–620: 338–351. https://doi.org/10.1016/j.scitotenv.2017.11.061 PMID:
29154052
51. Zhang L, Hao Y, Chang Y, Pang M, Tang S. Emergy based resource intensities of industry sectors in
China. J Clean Prod. 2017; 142: 829–836. https://doi.org/10.1016/j.jclepro.2016.03.063
52. Shao S, Yang ZB, Yang LL, Ma S. Can China’s Energy Intensity Constraint Policy Promote Total Factor
Energy Efciency? Evidence from the Industrial Sector. The Energy J. 2019; 40(4): 101–127. https://doi.
org/10.5547/01956574.40.4.ssha
53. Alves PRL. Chaos in historical prices and volatilities with five-dimensional Euclidean spaces. Chaos
Solitons Fractals: X. 2019; 1: 100002. https://doi.org/10.1016/j.csfx.2019.100002
Environmental tax and green development
PLOS ONE | https://doi.org/10.1371/journal.pone.0221264 September 4, 2019 22 / 23

54. Ministry of Ecology and Environment of the People’s Republic of China. The Environmental Protection
Tax Law of the People’s Republic of China. Available from: http://www.npc.gov.cn/npc/xinwen/2018-11/
05/content2065629.htm.
55. Priya K, Babu TS, Balasubramanian K, Kumar KS, Rajasekar N. A novel approach for fuel cell parame-
ter estimation using simple genetic algorithm. Sustain Energy Technol Assess. 2015; 12: 46–52.
Environmental tax and green development
PLOS ONE | https://doi.org/10.1371/journal.pone.0221264 September 4, 2019 23 / 23