IMPACT OF DEMOGRAPHICS ON SERVICE … satisfaction: Perceived service quality is a global judgment...
15
Asia Pacific Journal of Marketing & Management Review__________________________________________ ISSN 2319-2836 Vol.2 (6), June (2013) Online available at indianresearchjournals.com 102 IMPACT OF DEMOGRAPHICS ON SERVICE QUALITY, CUSTOMER SATISFACTION AND LOYALTY IN THE INDIAN BANKING IN VELLORE DISTRICT D. SASIKALA ASSISTANT PROFESSOR, DEPARTMENT OF BUSINESS ADMINISTRATION, AUXILIUM COLLEGE FOR WOMEN, VELLORE- 6. _____________________________________________________________________________________ ABSTRACT Purpose: The main objective of this study is to find the interrelationships between service quality attributes, customer satisfaction and customer loyalty in the retail banking sector in Vellore District. The key strategy for the success and survival of any business institution is the deliverance of quality services to customers. With the aim of sustaining long term relationships with their customers, many businesses have changed their strategic focus to emphasize customer retention. The practice of excellent service quality has been proven that customer satisfaction will significantly lead to customer retention. The present research employs SERVQUAL scale to measure the customers‟ loyalty. The sample size of 200 retail banking customers was drawn from different banks in Vellore District. This study attempts to contribute towards enhancing our understanding of service quality determinants in retail banking and to investigate the interrelationship gap between high quality, customer satisfaction and customer loyalty with the demographic details. Design/methodology/approach: A banking-specific scale was constructed, initially with 36 items with 7 point Likert scale from the literature and focus groups, and used for data collection in a convenience sample in Vellore. It was administered by personal interview, online questionnaire. Data treatment involved Chi- square, ANOVA, Correlation, Regression and Mann Whitney Findings: According to Parasuraman, Tangible, Reliability, Assurance, Responsive, empathy, service quality, Customer satisfaction, Customer loyalty, Price satisfaction, image and reputation, communication, special features like shorter waiting period, more atm centers and counters for elderly and disabled persons are taken. Chi-Square results are: 1.There is an association between marital status and Customer satisfaction.2. There is an association between Income and Customer satisfaction. ANOVA results are 1. There is an association between gender and high quality, Satisfaction and Loyalty. 2. There is an association between Age and high quality, Satisfaction and Loyalty.3. There is an association between marital status and high quality, Satisfaction and Loyalty. 4. There is an association between Employment status and high quality, Satisfaction and Loyalty. 5. There is an association between Income and high quality and Loyalty.6. There is no association between Income and Satisfaction.7. There is no association between Education and high quality, Satisfaction and Loyalty. Research limitations/implications: Poor sampling, drawing from a single industry, drawing from a single geographical location, and not accounting for respondent‟s lifestyle, attitudes were the study‟s main limitations, number of earning family members and total income of the family
Transcript of IMPACT OF DEMOGRAPHICS ON SERVICE … satisfaction: Perceived service quality is a global judgment...

Asia Pacific Journal of Marketing & Management Review__________________________________________ ISSN 2319-2836 Vol.2 (6), June (2013) Online available at indianresearchjournals.com
102
IMPACT OF DEMOGRAPHICS ON SERVICE QUALITY, CUSTOMER
SATISFACTION AND LOYALTY IN THE INDIAN BANKING IN
VELLORE DISTRICT
D. SASIKALA
ASSISTANT PROFESSOR,
DEPARTMENT OF BUSINESS ADMINISTRATION,
AUXILIUM COLLEGE FOR WOMEN,
VELLORE- 6.
_____________________________________________________________________________________
ABSTRACT
Purpose: The main objective of this study is to find the interrelationships between service
quality attributes, customer satisfaction and customer loyalty in the retail banking sector in
Vellore District. The key strategy for the success and survival of any business institution is the
deliverance of quality services to customers. With the aim of sustaining long term relationships
with their customers, many businesses have changed their strategic focus to emphasize customer
retention. The practice of excellent service quality has been proven that customer satisfaction
will significantly lead to customer retention. The present research employs SERVQUAL scale to
measure the customers‟ loyalty. The sample size of 200 retail banking customers was drawn
from different banks in Vellore District. This study attempts to contribute towards enhancing our
understanding of service quality determinants in retail banking and to investigate the
interrelationship gap between high quality, customer satisfaction and customer loyalty with the
demographic details.
Design/methodology/approach: A banking-specific scale was constructed, initially with 36
items with 7 point Likert scale from the literature and focus groups, and used for data collection
in a convenience sample in Vellore. It was administered by personal interview, online
questionnaire. Data treatment involved Chi- square, ANOVA, Correlation, Regression and
Mann Whitney
Findings: According to Parasuraman, Tangible, Reliability, Assurance, Responsive, empathy,
service quality, Customer satisfaction, Customer loyalty, Price satisfaction, image and
reputation, communication, special features like shorter waiting period, more atm centers and
counters for elderly and disabled persons are taken. Chi-Square results are: 1.There is an
association between marital status and Customer satisfaction.2. There is an association between
Income and Customer satisfaction. ANOVA results are 1. There is an association between
gender and high quality, Satisfaction and Loyalty. 2. There is an association between Age and
high quality, Satisfaction and Loyalty.3. There is an association between marital status and high
quality, Satisfaction and Loyalty. 4. There is an association between Employment status and high
quality, Satisfaction and Loyalty. 5. There is an association between Income and high quality and
Loyalty.6. There is no association between Income and Satisfaction.7. There is no association
between Education and high quality, Satisfaction and Loyalty.
Research limitations/implications: Poor sampling, drawing from a single industry, drawing
from a single geographical location, and not accounting for respondent‟s lifestyle, attitudes were
the study‟s main limitations, number of earning family members and total income of the family

Asia Pacific Journal of Marketing & Management Review__________________________________________ ISSN 2319-2836 Vol.2 (6), June (2013) Online available at indianresearchjournals.com
103
leading to obvious further research directions i.e. better sampling, drawing from multiple
banking industries and taking psychographics into consideration. With the development of e-
commerce and web technology, some areas which are not covered in this study are interesting
and need to be explored. Quantitative measurement of service quality is extremely difficult
because of the involvement of human behavioral aspects and the absence of precise numerical
data.
Practical implications: SERVPERF is superior to SERVQUAL in retail banking.
Originality/value: The study helps to provide the guidelines to develop proper strategies and
acknowledge the changes in customers‟ banking behavior more quickly. _____________________________________________________________________________________
Introduction
Due to increased global competition, private banks are put into lot of pressures to survive in the
banking industry. This situation led the banks to think of the strategies to retain the customers by
increasing the level of service quality. The key strategy for the success and survival of any
business institution is the deliverance of quality services to customers. With the aim of sustaining
long term relationships with their customers, many businesses have changed their strategic focus
to emphasize customer retention. Service quality is one of the integral parts in achieving
competitive advantage in most service industries. Globalization has brought a change in terms of
regulatory, structural, technological, environment in the banking industry which led to
restructure their strategies for services offered to the customers.
Service Quality
Service quality is generally perceived to be a tool that can be used to create a competitive
advantage and therefore, substantial research into service and service quality has been
undertaken in the last 20 years. Bitner defines service quality as “the consumers‟ overall
impression of the relative inferiority/superiority of the organization and its services.” The most
common definition of service quality is the discrepancy between consumer‟s expectations and
perceptions of the service received. Accordingly, service quality is defined as how well a
delivered service level matches customer‟s expectation. Parasuraman identified more detailed
dimensions of service quality and developed a well-known instrument, called SERVQUAL, to
measure customer‟s perceptions and expectations from service. The SERVQUAL instrument
consists of five underlying dimensions. The five dimensions of SERVQUAL are
(1) Tangibles, which pertain to the physical facilities, equipment, personnel and communication
materials.
(2) Reliability, which refers to the ability to perform the promised services dependably and
accurately.
(3) Responsiveness, which refers to the willingness of service providers to help customers and
provide prompt service.
(4) Assurance, which relates to the knowledge and courtesy of employees and their ability to
convey trust and confidence.
(5) Empathy, which refers to the provision of caring and individualized attention to customers.
Tangibility: This dimension deal with modern looking equipments and visual appealing part of
banks.

Asia Pacific Journal of Marketing & Management Review__________________________________________ ISSN 2319-2836 Vol.2 (6), June (2013) Online available at indianresearchjournals.com
104
Reliability: This dimension has a direct positive effect on perceived service quality and customer
satisfaction in banking institutions. Banks must provide error free service and secure online
transactions to make customers feel comfortable.
Responsiveness: Customers expect that the banks must respond their inquiry promptly.
Responsiveness describes how often a bank voluntarily provides services that are important to its
customers. Researchers examining the responsiveness of banking services have highlighted the
importance of perceived service quality and customer satisfaction.
Assurance; Customer expects that the bank must be secured and the behavior of the employees
must be encouraging.
Empathy; individual attention, customized service and convenient banking hours are very much
important in today‟s service.
In order to achieve better understanding of service quality in banking sector, the proposed five
service quality dimensions are conceptualized to illustrate the overall service quality of the
banking in relation to customers‟ and providers‟ perspective.
Customer Loyalty: Loyalty is developed over a period of time from a consistent record of
meeting, and sometimes even exceeding customer expectations states the cost of attracting a new
customer may be five times the cost of keeping a current customer happy. Gremler & Brown
offers one definition of customer loyalty that is related to our purpose in this study: the degree to
which a customer exhibits repeat purchasing behavior from a service provider, possesses a
positive attitudinal disposition toward the provider, and considers using only this provider when
a need for this service exists. According to Bloemer & Kasper, loyalty is interpreted as true
loyalty rather than repeat purchasing behavior, which is the actual re-buying of a brand,
regardless of commitment. Zeithaml states loyalty is a multi-dimensional construct and includes
both positive and negative responses. However, a loyal customer may not necessarily be a
satisfied customer. Colgate also noted that it is not always the case that customer defection is the
inverse to loyalty, while Levesque and Mc Dougall suggested that, “even a problem is not
solved, approximately half of the customers would remain with the firm”. This may be due to
switching costs, lack of perceived differentiation of alternatives, location constraints on choice,
time or money constraints, habit or inertia which are not related to loyalty.
Customer satisfaction: Perceived service quality is a global judgment or attitude relating to the
superiority of the service, whereas satisfaction is related to a specific transaction. On the other
hand, customer satisfaction has frequently been suggested to be the leading determinant of
loyalty. Ehigie suggests that there is a significant positive relationship between customer
satisfaction and customer loyalty/retention. As such, customer satisfaction in this research is
acting as a mediator between service quality and customer loyalty.
Reasons for the transformation from servqual to servperf
Cronin and Taylor (1992) conclude that current performance best reflects a customer's perception
of service quality and that expectations are not part of this concept. They perform an empirical
test with four alternative service quality models:
SERVQUAL: Service quality = performance - expectations

Asia Pacific Journal of Marketing & Management Review__________________________________________ ISSN 2319-2836 Vol.2 (6), June (2013) Online available at indianresearchjournals.com
105
Weighted SERVQUAL: Service quality = importance × (performance - expectations)
SERVPERF: Service quality = performance
Weighted SERVPERF: Service quality = importance × performance
From the results of their empirical investigation they conclude that the unweighted SERVPERF
measure (performance only) performs better than any other measure of service quality.
Research Methodology (Survey Design)
The questionnaire consists of two parts. The first part consists of questions concerning the
demographic information of the respondents. The second part consisting of thirty six questions
exploring the respondent‟s perception about the service quality of banking includes Tangibility,
Reliability, Responsiveness, Assurance, Empathy, Over all Service quality, Customer
satisfaction, Customer loyalty, price satisfaction, Clear Communication, Image and reputation,
and special features like more atm centers and special counters for elderly and disabled. The
respondents will be asked to rate each statement using the balanced Likert scale of 1 to 7 with
mid point (1 – strongly disagree, 7 – strongly agree).
Data Collection: For the data collection, we used the Survey Method. In the survey method, we relied primarily
on primary survey as the servqual questionnaire is long and hence, it will ensure complete
information. We also used the electronic method wherein we floated the questionnaire online for
responses. We were able to complete 200 questionnaires.
Sample Selection
Non-Probabilistic sampling method has been employed in this study. The most common type of
non-probabilistic sampling method which is applied in this study is „convenience sampling‟
through which we had selected the sample members who can provide required information and
available to participate in the study. The data was collected by using both personal and electronic
contact approach.
Research Design Exploratory research: A detailed literature review of different models and various research
papers in the exploratory research of secondary data helped us to zero in on the Servqual model
by Parasuraman. Descriptive research will be used to gain insight into customer service quality
offered by banks. We will be using primary data in this research study and the primary data will
be collected through survey method by using an undisguised structured questionnaire.
Data Analyses Methodology
A series of statistical techniques were required before the quantification of service quality. These
statistical analyses were conducted using SPSS; a widely used statistical software package. The
statistical techniques conducted were:
(a) Chi-Square (using SPSS)
(b)One-Way ANOVA (using SPSS)
(c) Correlation and Regression (using SPSS)
(d) Mann – Whitney (using SPSS)
Findings & Discussion
Demographic Findings The basic findings related to demographic characteristics of customers
in banks are given below:

Asia Pacific Journal of Marketing & Management Review__________________________________________ ISSN 2319-2836 Vol.2 (6), June (2013) Online available at indianresearchjournals.com
106
Table1: Demographic details
Factor Category Number percentage
Gender Male 20 20
Female 180 90
Age
Less than 20 20 10
20-30 120 60
30-40 40 20
40 & above 20 10
Marital Status Single 140 70
Married 60 30
Occupation
Government 20 10
Students 100 50
Private 40 20
Professional 20 10
Retired 20 10
Income per month
Less than 10000 20 10
10001-20000 20 10
20001-30000 60 30
30001-40000 100 50
Hypothesis Testing: A hypothesis is an assumption that we make about a population parameter.
The hypothesis, which we wish to test, is called the null hypothesis because it implies that there
is no difference between the true parameter and the hypothesis value so the difference between
the true value and hypothesis value is nil. Hypothesis testing, as described by Neyman and
Pearson, provides for certain decision rules about the null hypothesis. Hypothesis tests are
procedures for making rational decisions about the reality of effects. Hypothesis testing starts
with an assumption of „no differences‟.
Research / Statistical Hypothesis: 1. There is no association between marital status and Customer satisfaction.
2. There is no association between Income and Customer satisfaction.
3. There is no association between gender and high quality, Satisfaction and Loyalty.
4. There is no association between Age and high quality, Satisfaction and Loyalty.
5. There is no association between marital status and high quality, Satisfaction and Loyalty.
6. There is no association between Education and high quality, Satisfaction and Loyalty.
7. There is no association between Employment status and high quality, Satisfaction and Loyalty.
8. There is no association between Income and high quality, satisfaction and Loyalty.
Data Analysis and Interpretations: Chi-square and ANOVA deals with cause-effect
relationship in association of attributes. It allows us to find out that whether there is any
association between two or more variables.

Asia Pacific Journal of Marketing & Management Review__________________________________________ ISSN 2319-2836 Vol.2 (6), June (2013) Online available at indianresearchjournals.com
107
Table 2 - Marital status and satisfaction
Chi-Square Tests
Value df Asymp. Sig. (2-sided)
Pearson Chi-Square 88.889(a) 4 .000
Likelihood Ratio 112.512 4 .000
Linear-by-Linear Association 23.128 1 .000
N of Valid Cases 200
a 0 cells (.0%) have expected count less than 5. The minimum expected count is 6.00.
Interpretation: The Asymp significance value .000 is less than .05 so reject the null hypothesis
and accept the alternate hypothesis. There is association between Marital status and Customer
satisfaction.
Table 3 - Income and satisfaction
Chi-Square Tests
Value df
Asymp. Sig. (2-
sided)
Pearson Chi-Square 200.000(a) 10 .000
Likelihood Ratio 227.345 10 .000
Linear-by-Linear Association 18.665 1 .000
N of Valid Cases 200
a 0 cells (.0%) have expected count less than 5. The minimum expected count is 6.00.
Interpretation: The Asymp significance value .000 is less than .05 so reject the null hypothesis
and accept the alternate hypothesis. There is association between Income and Customer
satisfaction.
Table 4 - Gender and high quality, satisfaction, loyalty
ANOVA
Sum of
Squares df
Mean
Square F Sig.
high quality
service
Between Groups 22.222 1 22.222 14.776 .000
Within Groups 297.778 198 1.504
Total 320.000 199
Completely
satisfied
Between Groups 72.000 1 72.000 35.640 .000
Within Groups 400.000 198 2.020
Total 472.000 199
loyal Between Groups 56.889 1 56.889 11.365 .001
Within Groups 991.111 198 5.006
Total 1048.000 199

Asia Pacific Journal of Marketing & Management Review__________________________________________ ISSN 2319-2836 Vol.2 (6), June (2013) Online available at indianresearchjournals.com
108
Interpretation: The Asymp significance value .000 is less than .05 so reject the null hypothesis
and accept the alternate hypothesis. There is an association between gender and high quality.
There is an association between gender and Satisfaction. There is an association between gender
and Loyalty.
Table 5 - Age and high quality, satisfaction, loyalty
ANOVA
Sum of
Squares df
Mean
Square F Sig.
high quality
service
Between Groups 43.333 3 14.444 10.233 .000
Within Groups 276.667 196 1.412
Total 320.000 199
Completely
satisfied
Between Groups 102.000 3 34.000 18.011 .000
Within Groups 370.000 196 1.888
Total 472.000 199
loyal Between Groups 541.333 3 180.444 69.804 .000
Within Groups 506.667 196 2.585
Total 1048.000 199
Interpretation: The Asymp significance value .000 is less than .05 so reject the null hypothesis
and accept the alternate hypothesis. There is an association between Age and high quality. There
is an association between Age and Satisfaction. There is an association between Age and
Loyalty.
Table 6 - Marital status and high quality, satisfaction, loyalty
ANOVA
Sum of
Squares df
Mean
Square F Sig.
high quality
service
Between Groups 38.095 1 38.095 26.757 .000
Within Groups 281.905 198 1.424
Total 320.000 199
Completely
satisfied
Between Groups 54.857 1 54.857 26.038 .000
Within Groups 417.143 198 2.107
Total 472.000 199
loyal Between Groups 219.429 1 219.429 52.436 .000
Within Groups 828.571 198 4.185
Total 1048.000 199
Interpretation: The Asymp significance value .000 is less than .05 so reject the null hypothesis
and accept the alternate hypothesis. There is an association between marital status and high
quality. There is an association between marital status and Satisfaction
Asia Pacific Journal of Marketing & Management Review__________________________________________ ISSN 2319-2836 Vol.2 (6), June (2013) Online available at indianresearchjournals.com
109
There is an association between marital status and Loyalty.
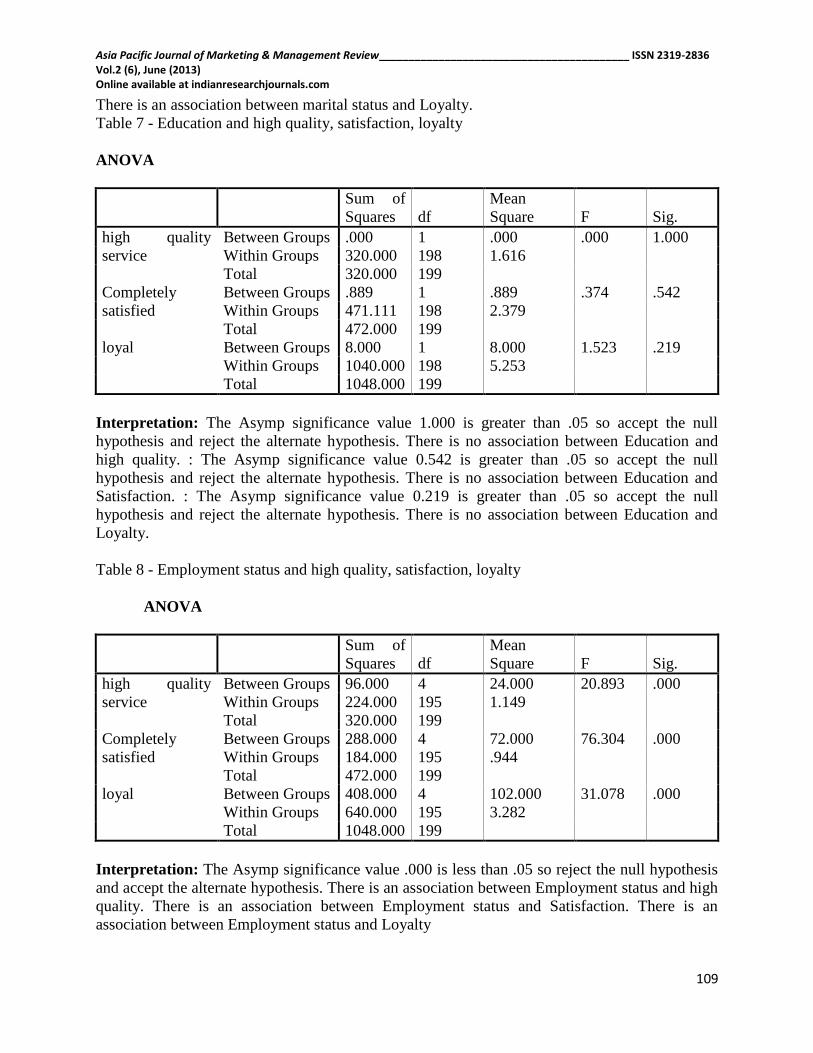
Table 7 - Education and high quality, satisfaction, loyalty
ANOVA
Sum of
Squares df
Mean
Square F Sig.
high quality
service
Between Groups .000 1 .000 .000 1.000
Within Groups 320.000 198 1.616
Total 320.000 199
Completely
satisfied
Between Groups .889 1 .889 .374 .542
Within Groups 471.111 198 2.379
Total 472.000 199
loyal Between Groups 8.000 1 8.000 1.523 .219
Within Groups 1040.000 198 5.253
Total 1048.000 199
Interpretation: The Asymp significance value 1.000 is greater than .05 so accept the null
hypothesis and reject the alternate hypothesis. There is no association between Education and
high quality. : The Asymp significance value 0.542 is greater than .05 so accept the null
hypothesis and reject the alternate hypothesis. There is no association between Education and
Satisfaction. : The Asymp significance value 0.219 is greater than .05 so accept the null
hypothesis and reject the alternate hypothesis. There is no association between Education and
Loyalty.
Table 8 - Employment status and high quality, satisfaction, loyalty
ANOVA
Sum of
Squares df
Mean
Square F Sig.
high quality
service
Between Groups 96.000 4 24.000 20.893 .000
Within Groups 224.000 195 1.149
Total 320.000 199
Completely
satisfied
Between Groups 288.000 4 72.000 76.304 .000
Within Groups 184.000 195 .944
Total 472.000 199
loyal Between Groups 408.000 4 102.000 31.078 .000
Within Groups 640.000 195 3.282
Total 1048.000 199
Interpretation: The Asymp significance value .000 is less than .05 so reject the null hypothesis
and accept the alternate hypothesis. There is an association between Employment status and high
quality. There is an association between Employment status and Satisfaction. There is an
association between Employment status and Loyalty

Asia Pacific Journal of Marketing & Management Review__________________________________________ ISSN 2319-2836 Vol.2 (6), June (2013) Online available at indianresearchjournals.com
110
Table 9 - Income and high quality, satisfaction, loyalty
ANOVA
Sum of
Squares df
Mean
Square F Sig.
high quality
service
Between Groups 38.333 2 19.167 13.405 .000
Within Groups 281.667 197 1.430
Total 320.000 199
Completely
satisfied
Between Groups 3.667 2 1.833 .771 .464
Within Groups 468.333 197 2.377
Total 472.000 199
loyal Between Groups 174.667 2 87.333 19.700 .000
Within Groups 873.333 197 4.433
Total 1048.000 199
Interpretation: The Asymp significance value 0.000 is less than 0.05 so reject the null hypothesis
and accept the alternate hypothesis. There is an association between Income and high quality.
There is an association between Income and Loyalty. The Asymp significance value 0.464 is
greater than 0.05 so accept the null hypothesis and reject the alternate hypothesis. There is no
association between Income and Satisfaction
Correlation: If there is association between two or more variables, then the strength of the
relationship of the variables or the degree of the relationship is found between two variables by
Pearson‟s correlation coefficient.
Interpretation: The output is with two-tailed significance selected and significant correlations
flagged. The structure of the output has 3 sections. The upper portion of each cell identifies the
correlations between variables accurate to three decimals. The middle portion indicates the
significance of each corresponding correlation. The lower portion records the number of subjects
involved in each correlation. Only if there are missing values it is possible that the number of
subjects involved in one correlation may differ from the number of subjects involved in others.
The notes below the table identify the meaning of the asterisks and indicate whether the
significance levels are one-tailed or two-tailed.
The diagonal of 1.000s shows that a variable is perfectly correlated with itself. Since the
computation of correlations is identical regardless of which variable comes first, the half of the
table above the diagonal of 1.000s has identical values to the half of the table below the diagonal.
Note the strong positive relationship between pleasing communication and shorter waiting
period.
Regression: Pearson‟s correlation coefficient just gives the degree of relationship or association.
It is not estimating or predicting the response variable for a given independent variable. The
response variable is also called as dependent variable. Using regression analysis, it is possible to
predict the dependent variable and independent variable. Multiple linear regressions are a logical
extension of the simple linear regression. The number of independent variables will be more than
one.
Asia Pacific Journal of Marketing & Management Review__________________________________________ ISSN 2319-2836 Vol.2 (6), June (2013) Online available at indianresearchjournals.com
111
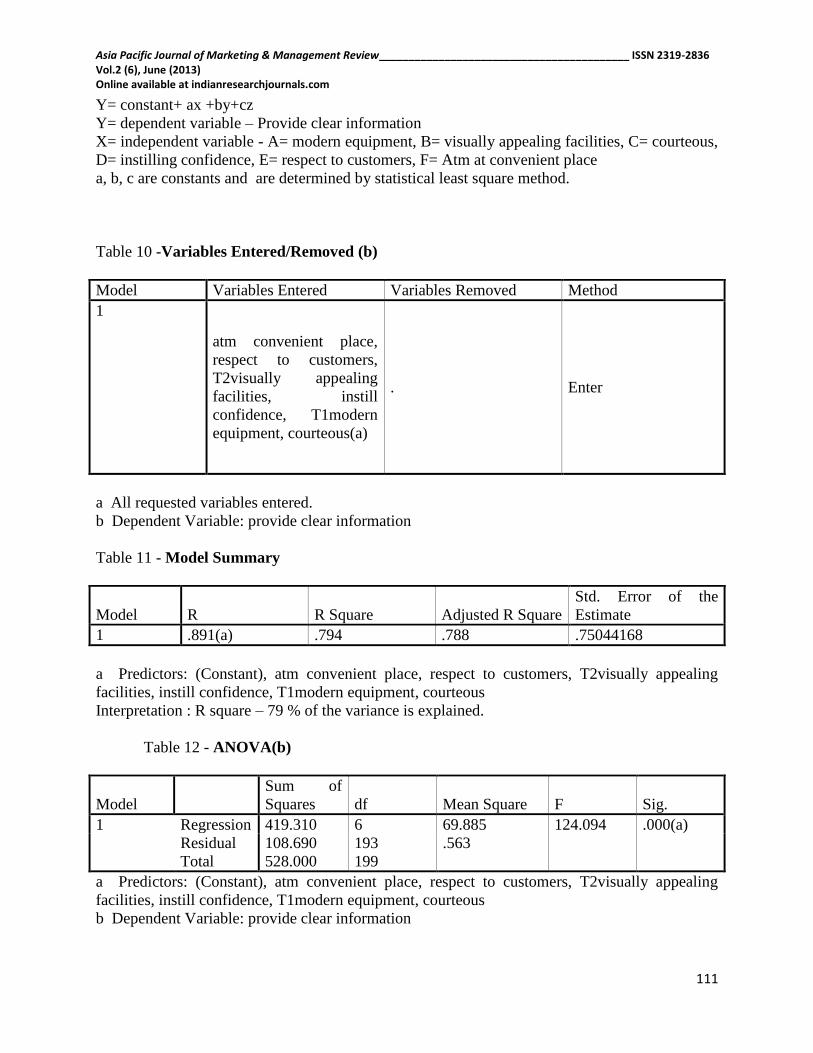
Y= constant+ ax +by+cz
Y= dependent variable – Provide clear information
X= independent variable - A= modern equipment, B= visually appealing facilities, C= courteous,
D= instilling confidence, E= respect to customers, F= Atm at convenient place
a, b, c are constants and are determined by statistical least square method.
Table 10 -Variables Entered/Removed (b)
Model Variables Entered Variables Removed Method
1
atm convenient place,
respect to customers,
T2visually appealing
facilities, instill
confidence, T1modern
equipment, courteous(a)
. Enter
a All requested variables entered.
b Dependent Variable: provide clear information
Table 11 - Model Summary
Model R R Square Adjusted R Square
Std. Error of the
Estimate
1 .891(a) .794 .788 .75044168
a Predictors: (Constant), atm convenient place, respect to customers, T2visually appealing
facilities, instill confidence, T1modern equipment, courteous
Interpretation : R square – 79 % of the variance is explained.
Table 12 - ANOVA(b)
Model
Sum of
Squares df Mean Square F Sig.
1 Regression 419.310 6 69.885 124.094 .000(a)
Residual 108.690 193 .563
Total 528.000 199
a Predictors: (Constant), atm convenient place, respect to customers, T2visually appealing
facilities, instill confidence, T1modern equipment, courteous
b Dependent Variable: provide clear information

Asia Pacific Journal of Marketing & Management Review__________________________________________ ISSN 2319-2836 Vol.2 (6), June (2013) Online available at indianresearchjournals.com
112
Table 12 - Coefficients(a)
Model
Unstandardized
Coefficients
Standardized
Coefficients t Sig.
B Std. Error Beta
1 (Constant) -12.648 1.028 -12.308 .000
T1modern equipment 1.891 .096 1.421 19.623 .000
T2visually appealing
facilities .560 .093 .414 6.025 .000
courteous 1.438 .164 .811 8.743 .000
instill confidence -.440 .076 -.352 -5.803 .000
respect to customers -1.620 .074 -1.984 -21.986 .000
atm convenient place 1.126 .100 .460 11.304 .000
a Dependent Variable: provide clear information
The coefficients and constant for the regression equation that measures predicted values for the
dependent variable( the bank provides clear information for the customers ) and for the
independent variables like modern equipment, Visually appealing facilities, courteous, instilling
confidence, respect to customers, Atm at convenient place.
Overall Service Quality = -12.648+1.891A+0.560B+1.438C-0.440D-1.620E+1.126F
Where, A = modern equipment, B =visually appealing facilities, C = courteous, D = instilling
confidence, E = respect to customers, F = Atm at convenient place.
Interpretation of Mann Whitney: Gender and the 36 attributes of the servqual has been taken
for the Mann Whitney. The Mean Rank for females is higher than the mean rank for males for
the 8 variables like right service, instill confidence, convenient location hours, excellent quality,
interest earned high, bank charges low, pay a little bit more, short waiting period, atm in
convenient locations.
The Z is the standardized score associated with the significance value (p value). Since the p
value is large than the significance value of .005, we conclude that the women did not score
significantly higher than men in certain variables like right service, excellent quality, interest
earned high, bank charges low, pay a little bit more, short waiting period.
The Z is the standardized score associated with the significance value (p value). Since the p
value is large than the significance value of .005, we conclude that the men did not score
significantly higher than women in certain variables like visually appealing interiors, promise,
problem solving attitudes, caring, patronize.
Conclusion: Customer satisfaction depends upon the quality of services provided by these
banks. It can be said that if banks are providing better quality services, then customers would be
satisfied. The majority of the customers felt that banks are not sensitive enough in providing
special services or having special counters for elderly or disabled customers. In addition to that
lack of convenient Atm centers‟ and poor communication regarding the specific needs of the
customers is some of the major drawbacks of banks.
Limitations: The data could have been collected from other sector of working counterparts like
IT, Government etc. Comparison between public, private and foreign banks could have been

Asia Pacific Journal of Marketing & Management Review__________________________________________ ISSN 2319-2836 Vol.2 (6), June (2013) Online available at indianresearchjournals.com
113
taken for the study. Number of dependents, type of account, and frequency of visits to the bank
can also be taken for the study.
Scope for further research: Income wise analysis and geographical segment wise analysis also
would have given better results. Service quality of foreign sector banks with public and private
sector banks also may be considered for another analyzing.
References:
Article
1. Sandip Ghosh Hazra, Dr. Kailash B.L. Srivastava, „Impact of Service quality on
Customer Satisfaction, Loyalty, and commitment in the Indian Banking Sector‟,May
2010, Indian Journal of Marketing .
2. Khong Kok Wei, „Constructing a measurement in service quality for Malaysian Banks‟ .
Books
1. M.Edwin Gnandhas and S. Fatima Holy Ghost, 2011, Service Quality in commercial
Banks, Discovery Publishing house Pvt. Ltd.
2. Dr. L. Natarajan (2010), First Edition, Services Marketing, Margham publications,
Statistical Reference
1. S.N. Murthy U Bhojanna,2007, Research Methodology, first Edition , EXCEL books
2. Dr. N. S Nagarajan and Dr. K. Kaliyaperumal, 2008, Research Methodology, First
Edition, SKM Publications
3. Dr. S. Shajahan, 2009, Research Methods for Management, Third Edition, JAICO
Publishing house.
4. P.K. Viswanathan, Business Statistics, PEARSON Education.
5. Kultar Singh, Quantitative social research methods, 2007, Sage Publications
6. Darren George, Paul Mallery, SPSS for windows step by step A simple Guide and
Reference 13.0 Update, Sixth Edition, Pearson Education
Appendix
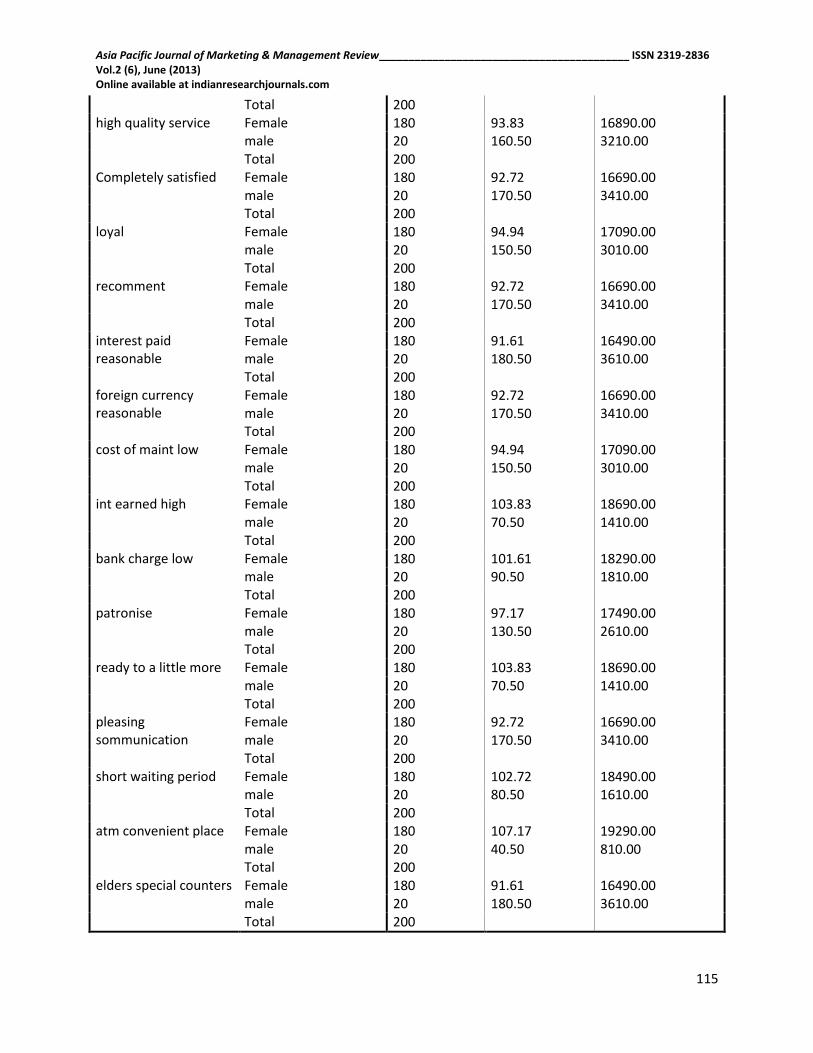
Mann-Whitney
Ranks
Gender N Mean Rank Sum of Ranks
T1modern equipment Female 180 90.50 16290.00 male 20 190.50 3810.00 Total 200
T2visually appealing facilities
Female 180 99.39 17890.00 male 20 110.50 2210.00 Total 200
neat Female 180 91.61 16490.00 male 20 180.50 3610.00 Total 200
promise Female 180 99.39 17890.00 male 20 110.50 2210.00 Total 200
problem solving Female 180 97.17 17490.00 male 20 130.50 2610.00 Total 200

Asia Pacific Journal of Marketing & Management Review__________________________________________ ISSN 2319-2836 Vol.2 (6), June (2013) Online available at indianresearchjournals.com
114
right service Female 180 101.61 18290.00 male 20 90.50 1810.00 Total 200
right time Female 180 91.61 16490.00 male 20 180.50 3610.00 Total 200
error free records Female 180 91.61 16490.00 male 20 180.50 3610.00 Total 200
provide clear information
Female 180 94.94 17090.00 male 20 150.50 3010.00 Total 200
instill confidence Female 180 102.72 18490.00 male 20 80.50 1610.00 Total 200
feel safe Female 180 93.83 16890.00 male 20 160.50 3210.00 Total 200
courteous Female 180 98.28 17690.00 male 20 120.50 2410.00 Total 200
knowledgeable Female 180 93.83 16890.00 male 20 160.50 3210.00 Total 200
prompt service Female 180 91.61 16490.00 male 20 180.50 3610.00 Total 200
willing to help Female 180 92.72 16690.00 male 20 170.50 3410.00 Total 200
respect to customers Female 180 92.72 16690.00 male 20 170.50 3410.00 Total 200
E1Individual attention Female 180 92.72 16690.00 male 20 170.50 3410.00 Total 200
E2Caring Female 180 98.28 17690.00 male 20 120.50 2410.00 Total 200
E3 Convenient location and hours
Female 180 104.94 18890.00 male 20 60.50 1210.00 Total 200
E4 understanding Female 180 91.61 16490.00 male 20 180.50 3610.00 Total 200
Excellent service Female 180 102.72 18490.00 male 20 80.50 1610.00
Asia Pacific Journal of Marketing & Management Review__________________________________________ ISSN 2319-2836 Vol.2 (6), June (2013) Online available at indianresearchjournals.com
115
Total 200 high quality service Female 180 93.83 16890.00
male 20 160.50 3210.00 Total 200
Completely satisfied Female 180 92.72 16690.00 male 20 170.50 3410.00 Total 200
loyal Female 180 94.94 17090.00 male 20 150.50 3010.00 Total 200
recomment Female 180 92.72 16690.00 male 20 170.50 3410.00 Total 200
interest paid reasonable
Female 180 91.61 16490.00 male 20 180.50 3610.00 Total 200
foreign currency reasonable
Female 180 92.72 16690.00 male 20 170.50 3410.00 Total 200
cost of maint low Female 180 94.94 17090.00 male 20 150.50 3010.00 Total 200
int earned high Female 180 103.83 18690.00 male 20 70.50 1410.00 Total 200
bank charge low Female 180 101.61 18290.00 male 20 90.50 1810.00 Total 200
patronise Female 180 97.17 17490.00 male 20 130.50 2610.00 Total 200
ready to a little more Female 180 103.83 18690.00 male 20 70.50 1410.00 Total 200
pleasing sommunication
Female 180 92.72 16690.00 male 20 170.50 3410.00 Total 200
short waiting period Female 180 102.72 18490.00 male 20 80.50 1610.00 Total 200
atm convenient place Female 180 107.17 19290.00 male 20 40.50 810.00 Total 200
elders special counters Female 180 91.61 16490.00 male 20 180.50 3610.00 Total 200

Asia Pacific Journal of Marketing & Management Review__________________________________________ ISSN 2319-2836 Vol.2 (6), June (2013) Online available at indianresearchjournals.com
116
Test Statistics
T1modern
equipment
T2visually
appealing
facilities neat promise
proble
m
solving
right
service
right
time
error
free
records
provide
clear
informatio
n
instill
confidence
Feel
safe courteous knowledgeable
prompt
service
Willing
to help
respect to
customers
E1Indivi
dual
attention
Mann-
Whitney U .000 1600.000 200.000 1600.00 1200.0 1600.000 200.000 200.000 800.000 1400.000 600.000 1400.000 600.000 200.000 400.000 400.000 400.000
Wilcoxon W 16290 17890.000 16490.0 17890.0 17490.0 1810.000 16490.0 16490.0 17090.000 1610.000 16890.000 17690.000 16890.000 16490.000 16690.000 16690.000 16690.000
Z -7.727 -.876 -7.435 -1.007 -2.576 -.842 -6.692 -7.109 -4.381 -1.700 -5.239 -1.852 -5.151 -7.010 -5.837 -5.837 -5.855
Asymp. Sig.
(2-tailed) .000 .381 .000 .314 .010 .400 .000 .000 .000 .089 .000 .064 .000 .000 .000 .000 .000
E2Caring
E3
Convenient
location
and hours
E4 under
standing
Excellent
service
high
quality
service
Completely
satisfied loyal
Re
comment
interest
paid
reasonable
foreign
currency
reasonable
cost
of
maint
low
int
earned
high
bank
charge
low patronise
ready
to
a
little
more
pleasing
communication
short
waiting
period
atm
convenient
place
elders
special
counters
Mann-
Whitney
U
1400.000 1000.000 200.000 1400.000 600.000 400.000 800.000 400.000 200.000 400.000 800.000 1200.000 1600.000 1200.000 1200.0 400.000 1400.000 600.000 200.000
Wilcoxon
W 17690.000 1210.000 16490.000 1610.000 16890.0 16690.000 17090.0 16690.0 16490.00 16690.00 17090.0 1410.000 1810.000 17490.000 1410.0 16690.000 1610.000 810.000 16490.000
Z -1.717 -3.620 -6.800 -1.873 -5.257 -5.893 -4.396 -5.874 -6.735 -6.557 -4.381 -2.526 -.836 -2.526 -2.526 -5.893 -1.700 -6.071 -6.671
Asymp.
Sig. (2-
tailed)
.086 .000 .000 .061 .000 .000 .000 .000 .000 .000 .000 .012 .403 .012 .012 .000 .089 .000 .000
a Grouping Variable: Gender