Impact of Crystal Habit on Biopharmaceutical Performance of Celecoxib
30
Subscriber access provided by MONASH UNIVERSITY Crystal Growth & Design is published by the American Chemical Society. 1155 Sixteenth Street N.W., Washington, DC 20036 Published by American Chemical Society. Copyright © American Chemical Society. However, no copyright claim is made to original U.S. Government works, or works produced by employees of any Commonwealth realm Crown government in the course of their duties. Article Impact of Crystal Habit on Biopharmaceutical Performance of Celecoxib Sameer R Modi, Ajay K Dantuluri, Vibha Puri, Yogesh B Pawar, Prajwal Nandekar, Abhay T. Sangamwar, Sathyanarayana R Perumalla, Changquan C. Sun, and Arvind K. Bansal Cryst. Growth Des., Just Accepted Manuscript • DOI: 10.1021/cg400140a • Publication Date (Web): 21 May 2013 Downloaded from http://pubs.acs.org on May 22, 2013 Just Accepted “Just Accepted” manuscripts have been peer-reviewed and accepted for publication. They are posted online prior to technical editing, formatting for publication and author proofing. The American Chemical Society provides “Just Accepted” as a free service to the research community to expedite the dissemination of scientific material as soon as possible after acceptance. “Just Accepted” manuscripts appear in full in PDF format accompanied by an HTML abstract. “Just Accepted” manuscripts have been fully peer reviewed, but should not be considered the official version of record. They are accessible to all readers and citable by the Digital Object Identifier (DOI®). “Just Accepted” is an optional service offered to authors. Therefore, the “Just Accepted” Web site may not include all articles that will be published in the journal. After a manuscript is technically edited and formatted, it will be removed from the “Just Accepted” Web site and published as an ASAP article. Note that technical editing may introduce minor changes to the manuscript text and/or graphics which could affect content, and all legal disclaimers and ethical guidelines that apply to the journal pertain. ACS cannot be held responsible for errors or consequences arising from the use of information contained in these “Just Accepted” manuscripts.
Transcript of Impact of Crystal Habit on Biopharmaceutical Performance of Celecoxib
Subscriber access provided by MONASH UNIVERSITY
Crystal Growth & Design is published by the American Chemical Society. 1155Sixteenth Street N.W., Washington, DC 20036Published by American Chemical Society. Copyright © American Chemical Society.However, no copyright claim is made to original U.S. Government works, or worksproduced by employees of any Commonwealth realm Crown government in the courseof their duties.
Article
Impact of Crystal Habit on Biopharmaceutical Performance of CelecoxibSameer R Modi, Ajay K Dantuluri, Vibha Puri, Yogesh B Pawar, Prajwal Nandekar, AbhayT. Sangamwar, Sathyanarayana R Perumalla, Changquan C. Sun, and Arvind K. Bansal
Cryst. Growth Des., Just Accepted Manuscript • DOI: 10.1021/cg400140a • Publication Date (Web): 21 May 2013
Downloaded from http://pubs.acs.org on May 22, 2013
Just Accepted
“Just Accepted” manuscripts have been peer-reviewed and accepted for publication. They are postedonline prior to technical editing, formatting for publication and author proofing. The American ChemicalSociety provides “Just Accepted” as a free service to the research community to expedite thedissemination of scientific material as soon as possible after acceptance. “Just Accepted” manuscriptsappear in full in PDF format accompanied by an HTML abstract. “Just Accepted” manuscripts have beenfully peer reviewed, but should not be considered the official version of record. They are accessible to allreaders and citable by the Digital Object Identifier (DOI®). “Just Accepted” is an optional service offeredto authors. Therefore, the “Just Accepted” Web site may not include all articles that will be publishedin the journal. After a manuscript is technically edited and formatted, it will be removed from the “JustAccepted” Web site and published as an ASAP article. Note that technical editing may introduce minorchanges to the manuscript text and/or graphics which could affect content, and all legal disclaimersand ethical guidelines that apply to the journal pertain. ACS cannot be held responsible for errorsor consequences arising from the use of information contained in these “Just Accepted” manuscripts.

1
Impact of Crystal Habit on Biopharmaceutical
Performance of Celecoxib
Sameer R. Modi a, Ajay K. R. Dantuluri
a, Vibha Puri
a, Yogesh B. Pawar
a, Prajwal Nandekar
b,
Abhay T. Sangamwar b, Sathyanarayana R. Perumalla
c, Changquan Calvin Sun
c, and Arvind K.
Bansal a*
a Department of Pharmaceutics, National Institute of Pharmaceutical Education and Research
(NIPER), SAS Nagar, Punjab 160062, India
b Department of Pharmacoinformatics, National Institute of Pharmaceutical Education and
Research (NIPER), SAS Nagar, Punjab 160062, India
c Department of Pharmaceutics, College of Pharmacy, University of Minnesota, 308 Harvard
Street S.E., Minneapolis, Minnesota 55455-0343, USA
*CORRESPONDING AUTHOR’S AFFILIATION
Department of Pharmaceutics
National Institute of Pharmaceutical Education and Research (NIPER)
Sector 67, SAS Nagar, Punjab 160 062, INDIA
Tel: +91-172-2214682-86. Fax: +91-172-2214692.
E- mail: [email protected]
Page 1 of 29
ACS Paragon Plus Environment
Crystal Growth & Design
123456789101112131415161718192021222324252627282930313233343536373839404142434445464748495051525354555657585960
2
ABSTRACT. Poor biopharmaceutical performance of Biopharmaceutical Classification System
(BCS) class II drug molecules is a major hurdle in the design and development of pharmaceutical
formulations. Anisotropic surface chemistry of different facets in crystalline material affects
physicochemical properties, such as wettability, of drugs. In present investigation, a molecule-
centered approach is presented towards crystal habit modification of celecoxib (CEL) and its
effect on oral bioavailability. Two crystal habits of CEL, acicular crystal habit (CEL-A) and
plate shaped crystal habit (CEL-P), were obtained by recrystallization from toluene at 25 °C and
60 °C, respectively. Compared to CEL-A, CEL-P exhibited significantly faster dissolution
kinetics in aqueous media and significantly higher Cmax and shorter Tmax in an oral bioavailability
study. The significant enhancement in dissolution and biopharmaceutical performance of CEL-P
was attributed to its more abundant hydrophilic surfaces than CEL-A. This conclusion was
supported by wettability and surface free energy determination from contact angle
measurements, and surface chemistry determination by X-ray photoelectron spectroscopy (XPS),
crystal structure modeling, and crystal face indexation.
KEYWORDS. Celecoxib, crystal habits, Wettability, Solubility, Anisotropic surface chemistry,
Face indexation, Oral bioavailability
Page 2 of 29
ACS Paragon Plus Environment
Crystal Growth & Design
123456789101112131415161718192021222324252627282930313233343536373839404142434445464748495051525354555657585960
3
1. INTRODUCTION
Variability in biopharmaceutical performance of active pharmaceutical ingredients
(APIs), can affect their bioavailability, safety, and efficacy.1, 2 Solid form of a chemical
compound is usually defined in terms of their internal structure. The ability of a compound to
pack into different crystal lattice arrangements is termed ‘polymorphism’. On the other hand, the
external appearance of crystal is termed as ‘crystal habit’. Both polymorphs and crystal habits of
an API can have considerable influence on physicochemical properties and, therefore, product
performance.3-5
Solvent of crystallization, degree of supersaturation, temperature, rate of change of
temperature, additives, and stirring rate can all influence the outcome of crystallization in terms
of both polymorphism6 and crystal habits.7-13 Crystallization variables that affect growth, either
promotion or inhibition, of different crystal facets subsequently affect the crystal habit.7, 11, 14
Studies have shown differential surface energetics, wetting behavior, and dissolution
kinetics between individual crystalline facets.15-21 Since the surface properties of crystal facets
are directly related to the localized chemical functionality22, a clear understanding of differential
pharmaceutical performance of crystal habits relies on an understanding of the molecular
arrangement on the surface of pharmaceutical solids. It has been shown that variations in
pharmaceutical processes involving interfaces, such as dissolution, of bulk crystalline materials
can be attributed to anisotropic surface chemistry of the crystals.19, 23, 24 This is because that
particle wetting, governed by powder surface energetics, is a prerequisite for interfacial
phenomena.19, 21, 23-31 However, the impact of crystal habits on biopharmaceutical properties of
an API remains poorly understood.
Page 3 of 29
ACS Paragon Plus Environment
Crystal Growth & Design
123456789101112131415161718192021222324252627282930313233343536373839404142434445464748495051525354555657585960
4
The goal of this work was to systematically investigate how crystal habit can impact
biopharmaceutical properties of celecoxib (CEL). Two crystal habits of CEL were obtained by
controlled crystallization32 and evaluated for their surface molecular environment and in vivo
biopharmaceutical performance. The differences in biopharmaceutical performance were
correlated to the anisotropic surface properties of CEL crystals. Surface energetics of both
crystal habits were characterized using sessile drop contact angle technique. Surface chemistry
was determined using X-ray photoelectron spectroscopy (XPS) and MOLCAD® software in an
attempt to rationalize the observed differences in surface energetics. The findings were
confirmed by crystal face indexation experiments.
2. EXPERIMENTAL SECTION
2.1. Materials
The room temperature stable Form III of CEL, chemically designated as 4-[5-(4-methyl-
phenyl)-3-(trifluoromethyl)-1H-pyrazol-1-yl] benzenesulphonamide (assay value > 99%), was
received as a gift from Zydus Cadila Healthcare Ltd. (Ahmadabad, India). Toluene (Merck,
India), ethylene glycol (EG, Merck, India) and diiodomethane (DIM, Sigma–Aldrich, Steinheim,
Germany) were of > 99.0% purity. The solvents used were of high-performance liquid
chromatography (HPLC) grade. All other chemicals used were of analytical grade.
2.2. High-Performance Liquid Chromatography (HPLC)
All the samples from solubility and oral bioavailability experiments were analyzed for
drug content using a validated HPLC method with minor modifications.33, 34 The HPLC system
(Shimadzu Corporation, Kyoto, Japan) included a system 210 controller (SCL-10A), a pump
(LC-10AT), a degasser (DGU-14A), an autosampler (SIL-10AD), a column oven (CTO-10AS)
Page 4 of 29
ACS Paragon Plus Environment
Crystal Growth & Design
123456789101112131415161718192021222324252627282930313233343536373839404142434445464748495051525354555657585960

5
and a UV detector (SPD-10AP) with Class-VP (Release 6.10) software. The analytical column
used was LiChrospher®
100 RP-18e (250 mm x 4.6 mm, 5 μm), attached with a LiChroCART®
100 RP-18e guard column (4mm x 4 mm, 5 μm) (Merck, Darmstadt, Germany). The mobile
phase, acetonitrile (ACN): phosphate buffer (pH 3, 10 mmol) (55:45 v/v), was pumped in
isocratic mode at a flow rate of 1.0 mL/min at ambient temperature. Indomethacin was used as
internal standard for all plasma samples to nullify any processing errors during extraction. The
injection volume was 40 µL. The PDA detector was set at a wavelength of 252 nm.
2.3. Solubility studies
The equilibrium solubility of ‘as received’ CEL in toluene at different temperatures (28,
32, 36 and 40 °C) were determined by adding an excess amount of the drug in 20 mL of toluene
in 25 mL screw capped glass vials. These vials were then shaken mechanically in a shaker water
bath (Julabo Labortechnik GmbH, Seelbach, Germany), at 100 rpm maintained at required
temperature (± 0.2 ºC). Samples were withdrawn after 1, 2, 4, 8, 16, 24, 36, 48 and 72 h, filtered
using 0.22 µm nylon filters, and analyzed by HPLC after appropriate dilution. The equilibrium
solubility values at different temperatures were analyzed by the means of a van’t Hoff plot,
which was used to determine the equilibrium solubility at a different temperature, from which
the degree of supersaturation during crystallization experiments was calculated.
2.4. Crystallization experiments
Different CEL crystal habits were generated by controlling the degree of supersaturation
and crystallization temperature. Accurately weighed amount (about 200 mg) of drug was
dissolved in 10 mL of toluene by heating to 72 ºC. The hot drug solution was immediately
filtered into a glass beaker using 0.22 µm nylon filters and cooled to a predetermined
Page 5 of 29
ACS Paragon Plus Environment
Crystal Growth & Design
123456789101112131415161718192021222324252627282930313233343536373839404142434445464748495051525354555657585960

6
temperature, 25 ºC or 60 ºC, to achieve a desired degree of supersaturation of 190% and 102%,
respectively. The crystals were collected after 72 h by filtration and dried under vacuum at room
temperature sieved, through British sieve size (BSS) No. 50 and retained on BSS No. 72, before
all further experiments.
2.5. Characterization of crystallized solid forms
2.5.1. Optical and polarized light microscopy
Crystals of CEL were observed at a magnification of 500X, under optical and polarized
light microscope (Leica Microsystems Wetzlar GmbH, Wetzlar, Germany) with and without
silicon oil. The birefringence pattern was viewed under cross polarizer. Aspect ratio was
determined using a pre-calibrated stage micrometer. For both crystal habits, the distribution of
particle size, taken as the length along the longest axis of individual crystal, was plotted using
100 particles. D90, i.e., length corresponding to 90% of cumulative undersize particles, was
determined from the size distribution plot.
2.5.2. Scanning electron microscopy (SEM)
SEM photographs of the crystals were captured using scanning electron microscope (S-
3400, Hitachi Ltd., Tokyo, Japan) operated at an excitation voltage of 25 kV. Samples were
prepared by laying particles on to a double-sided adhesive tape pasted over sample stubs and
sputter coated with gold using ion sputter (E-1010, Hitachi Ltd., Tokyo, Japan), before analysis.
2.5.3. Thermogravimetric analysis (TGA)
Presence of solvent or any degradation during heating was examined using Mettler
Toledo 851e TGA/SDTA (Mettler Toledo, Switzerland) operating with Stare software (version
Solaris 2.5.1). Accurately weighed (5-10 mg) samples were loaded in alumina crucibles and
Page 6 of 29
ACS Paragon Plus Environment
Crystal Growth & Design
123456789101112131415161718192021222324252627282930313233343536373839404142434445464748495051525354555657585960

7
heated at a rate of 20 ºC/min over a temperature range of 35 to 200 ºC, under nitrogen purge (50
mL/min), to determine loss in weight.
2.5.4. Hot stage microscopy (HSM)
HSM was carried out to observe thermal transitions using Leica DMLP polarized
microscope (Leica Microsystems Wetzlar GmbH, Wetzlar, Germany) equipped with Linkam
LTS 350 hot stage. Photomicrographs were captured using JVS color video camera and analyzed
using Linksys32 software. Samples were mounted in silicon oil and heated from 35 to 200 ºC, at
a heating rate of 20 ºC /min.
2.5.5. X-Ray powder diffraction (XRPD)
XRPD patterns of samples were recorded at room temperature on Bruker’s D8 Advance
X-ray diffractometer (Karlsruhe, Germany) using Cu-Kα radiation (λ = 1.54 Ǻ) at 35 kV, 30 mA
passing through a nickel filter. Data was collected in a continuous scan mode with a step size of
0.01o and dwell time of 1 s over an angular range of 3° to 40° 2θ. Accurately weighed amount of
powder (about 300 mg) was loaded in a 25 mm poly-methyl methacrylate (PMMA) holder and
gently pressed by a clean glass slide to ensure coplanarity of the powder surface with the surface
of the holder. Obtained diffractograms were analyzed with DIFFRACplus EVA (version 9.0)
diffraction software.
2.5.6. Differential scanning calorimetry (DSC)
Conventional DSC experiments were conducted to determine melting point and heat of
fusion using DSC Q2000 (TA Instruments, Delware, USA) equipped with a refrigerated cooling
system and operating with Universal Analysis 2000 software (version 4.5A). The sample cell
was purged with dry nitrogen at a flow rate of 50 mL/min. Accurately weighed samples (3–5mg)
Page 7 of 29
ACS Paragon Plus Environment
Crystal Growth & Design
123456789101112131415161718192021222324252627282930313233343536373839404142434445464748495051525354555657585960
8
in aluminum crimped pans were scanned at a heating rate of 20 ºC/min over a temperature range
of 35-200 ºC. The DSC instrument was pre-calibrated for temperature and heat flow using high
purity indium. All measurements were performed in triplicate.
2.5.7. Specific surface area
Specific surface area was determined using nitrogen gas sorption (SMART SORB 91
Surface Area analyzer; Smart Instruments, Mumbai, India). The instrument was calibrated by
injecting a known quantity of nitrogen. The measured parameters were then used to calculate the
surface area of the sample by employing the adsorption theories of Brunauer, Emmett and Teller
(BET). The weighed samples (5 g) were degassed to remove moisture. Samples were dipped in
liquid nitrogen and the quantity of the adsorbed gas was measured using a thermal conductivity
detector. The obtained data were integrated using an electronic circuit in terms of counts. The
reported values were average of three measurements.
2.5.8. Solubility study
Solubility of CEL crystals was determined (n=3) in double distilled water and in pH 12
phosphate buffer. Accurately weighed sample (about 20 mg) was added to 20 mL of medium in
a tightly capped vial. The vial is placed in a shaker water bath (Julabo Labortechnik GmbH,
Seelbach, Germany) maintained at 100 rpm and 37 ± 0.5 °C. Samples were withdrawn at
appropriate intervals (up to 72 h), filtered through 0.22 µm nylon filter and analyzed for drug
content using HPLC. Residual solids were analyzed by XRPD for phase identification.
2.5.9. Contact angle measurement
Sessile drop contact angle is most commonly measured on surface of compacted disc.
However, compaction of the material can alter the particle morphology and surface free energy.
Page 8 of 29
ACS Paragon Plus Environment
Crystal Growth & Design
123456789101112131415161718192021222324252627282930313233343536373839404142434445464748495051525354555657585960

9
Alternatively, contact angle may be measured on a powder layer adhered to an inert support.35, 36
The later method was adopted in the present work as it allows the study of ‘as is’ powder
properties.
Advancing and receding contact angles made by double distilled water, pH 12 phosphate
buffer, EG and DIM with powder samples were measured using sessile drop method on a Drop
Shape Analyzer (FTA 1000, First Ten Angstrom, Virginia, USA). Powder samples were
mounted on double sided adhesive tape adhered to a glass slide. Excess powder was removed by
tapping and a drop of liquid medium was dispensed on them. From a captured video, contact
angle was calculated as a function of time by fitting mathematical expression to the shape of the
drop and then calculating the slope of the tangent to the drop at the liquid-solid-vapor interface
line. All measurements were performed under ambient conditions of 25 ± 2 °C and 55 ± 5% RH,
with the reported values being an average of six measurements.
2.5.10. X-Ray photoelectron spectroscopy (XPS)
X-Ray photoelectron spectra were recorded using an ESCA-3000 (VG Scientific Ltd,
England) with a 9 channeltron CLAM4 analyzer under a vacuum better than 1 x 10⁻⁸ Torr, using
Mg-Kα radiation (1253.6 eV) and a constant pass energy of 50 eV. Binding energy range was
from 0 to 1100 eV for regions of C 1s, N 1s, O 1s, F 1s, and S 2p with average peak binding
energy of 286.0, 400.9, 533.0, 688.7, and 170.2 eV, respectively. All spectra were corrected for
baseline and fitted using Gaussian function. Fitting was performed using PeakFit®
(V.4.12,
SeaSolve Software, Inc., MA, USA). Similar curve fitting treatments were given for both the
crystal habits. Surface atomic concentration was determined from integrated peak intensities and
the corresponding relative sensitivity factor.
Page 9 of 29
ACS Paragon Plus Environment
Crystal Growth & Design
123456789101112131415161718192021222324252627282930313233343536373839404142434445464748495051525354555657585960

10
2.5.11. Molecular modelling
Molecular lipophilic surface potential (MLSP) analysis of CEL was carried out using the
MOLCAD program implemented in the SYBYL7.1 molecular modelling package. The
Gasteiger-Hückel charges were assigned to the atoms of CEL structure and surfaces were
generated and visualized. The color ramp for the MLSP ranges from deep blue color,
representing lower lipophilic potential (LP), to the deep red color, representing higher LP. This
analysis can provide LP surrounding each atom or group of atoms and the 3D spatial features of
the molecular interactions in crystal. Molecular arrangement on different crystal facets of CEL
form III was visualized using Mercury (version 2.3, Cambridge Crystallographic Data Centre,
Cambridge, UK).
2.5.12. Face indexation
A crystal was placed onto the tip of a 0.1 mm diameter glass capillary and mounted on a
Bruker Smart Apex 2 diffractometer (Karlsruhe, Germany) with CCD area detector for
determining unit cell parameters and orientation matrices at -100 °C. Cell constants were
determined from reflections harvested from three sets of 12 frames. These initial sets of frames
were oriented such that orthogonal wedges of reciprocal space were surveyed. This produced
initial orientation matrices determined from 89 and 104 reflections for CEL-A and CEL-P
respectively. The data collection was carried out using Mo-Kα radiation having λ = 0.71073 Å
(graphite monochromator) with a frame time of 30 seconds and a detector distance of 6 cm. A
series of images were taken with a video microscope as the crystal is rotated through 360° about
the ψ axis. Miller’s indices of various facets of the crystal were identified using T-tool, the face-
indexing plug-in of APEX 2.
Page 10 of 29
ACS Paragon Plus Environment
Crystal Growth & Design
123456789101112131415161718192021222324252627282930313233343536373839404142434445464748495051525354555657585960

11
2.5.13. Oral bioavailability study
All animal experiments were performed in accordance with the Committee for Purpose of
Control and Supervision on Experiments on Animals (CPCSEA) guidelines and the experimental
protocols were approved by the Institutional Animals Ethics Committee (IAEC/12/40). Male
Sprague–Dawley rats ranging from 250 ± 25 g, were kept on fasting for 12 h before the
experiment and were allowed free access to water before and during the experiment. Both
CEL crystal habits were administered at a dose of 5 mg/kg of rat body weight via an oral gavage.
The powder was filled in wide bore, bulb tipped gastric gavage of sufficient length, to allow
intra-gastric administration. The gavage was attached to a syringe, filled with 1.0 mL double
distilled water, and the dose was delivered with the aid of a jet of water, which drained the
sample along with it. Blood samples were collected from retro-orbital plexus after 0.5, 1, 1.5, 2,
3, 4, 6, 8, 12, 24, and 48 h in heparinzed microcentrifuge tubes. Plasma was separated
immediately by centrifugation at 15000 rpm for 10 min at 4 °C and stored at -80 °C until
processed and analyzed. Plasma samples were extracted with acetonitrile and quantified using a
validated HPLC method.
Various pharmacokinetic parameters were calculated from the mean plasma CEL
concentration–time profiles using the Thermo Kinetica software (V5.0, Thermo Fischer
Scientific, USA). Statistical significance for pharmacokinetic parameters was compared using the
paired t-test assuming equal variances. The test was considered to be statistically significant, if p
< 0.05.
Page 11 of 29
ACS Paragon Plus Environment
Crystal Growth & Design
123456789101112131415161718192021222324252627282930313233343536373839404142434445464748495051525354555657585960

12
3. RESULTS
3.1. Solubility studies
Equilibrium solubility of “as received” CEL in toluene, at different temperatures, is
captured in table 1. The data was used to generate van’t Hoff plot, which allowed extrapolation
of solubility to different temperatures for determining degree of supersaturation during
recrystallization experiments.
Table 1. Equilibrium solubility of CEL in toluene
Equilibrium Solubility (mg/mL)
28 °C 32 °C 36 °C 40 °C
11.56 ± 0.22 12.70 ± 0.16 13.88 ± 0.36 14.97 ± 0.20
3.2. Crystallization experiments
The degree of supersaturation was varied by controlling solution concentration and
temperature of crystallization. Polarized light microscopic images (Figure 1a, 1b) and SEM
photographs (Figure 1c, 1d) revealed that acicular crystals (CEL-A) were obtained from toluene
when saturated solution of CEL was cooled and allowed to crystallize at 25 °C (degree of
supersaturation was 190%). On the other hand, plate shaped crystals (CEL-P) were generated
when solvent was evaporated at 60 °C (degree of supersaturation was 102%). The aspect ratio for
CEL-A was 12-20 while that for CEL-P was 4–8.
Both CEL-A and CEL-P were confirmed to be anhydrous by HSM and TGA. Further, gas
chromatography and Karl Fischer analysis confirmed the absence of residual solvent and water
respectively in these samples (< 0.02%).
Page 12 of 29
ACS Paragon Plus Environment
Crystal Growth & Design
123456789101112131415161718192021222324252627282930313233343536373839404142434445464748495051525354555657585960

13
Figure 1. Polarized microscopic and SEM images of (a, c) CEL-A and (b, d) CEL-P respectively
XRPD patterns of both CEL-A and CEL-P showed characteristic diffraction peaks at 2θ
values of 5.37°, 10.72°, 16.11°, 19.72° and 21.52° corresponding to CEL form III. The observed
variation in relative peak intensity (Figure 2) can be ascribed to preferred orientation of the
crystals during XRPD analysis.
Figure 2. Overlay of XRPD scans of CEL crystal habits
Lin (Counts)
0
100000
200000
3 10 20 30 40
CEL-P
CEL-A
2-Theta Scale
Lin
(C
ou
nts
)
2-Theta scale
Lin
(C
ou
nts
)
Page 13 of 29
ACS Paragon Plus Environment
Crystal Growth & Design
123456789101112131415161718192021222324252627282930313233343536373839404142434445464748495051525354555657585960

14
DSC heating curves (Figure 3) of CEL-A and CEL-P showed melting point of 160.75 ±
1.00 °C and 161.09 ± 1.22 °C with melting enthalpy of 90.92 ± 1.76 J/g and 91.63 ± 1.50 J/g
respectively (Table 2).
Table 2. DSC results for CEL crystal habits
Crystal habit Melting point (οC) Heat of fusion (J/g)
CEL-A 160.75 ± 1.00 90.92 ± 1.76
CEL-P 161.09 ± 1.22 91.63 ± 1.50
Figure 3. Overlay of DSC heating curves of CEL crystal habits
Further, the D90 value and specific surface area of two sieved crystal habits were comparable (Table 3).
Page 14 of 29
ACS Paragon Plus Environment
Crystal Growth & Design
123456789101112131415161718192021222324252627282930313233343536373839404142434445464748495051525354555657585960
15
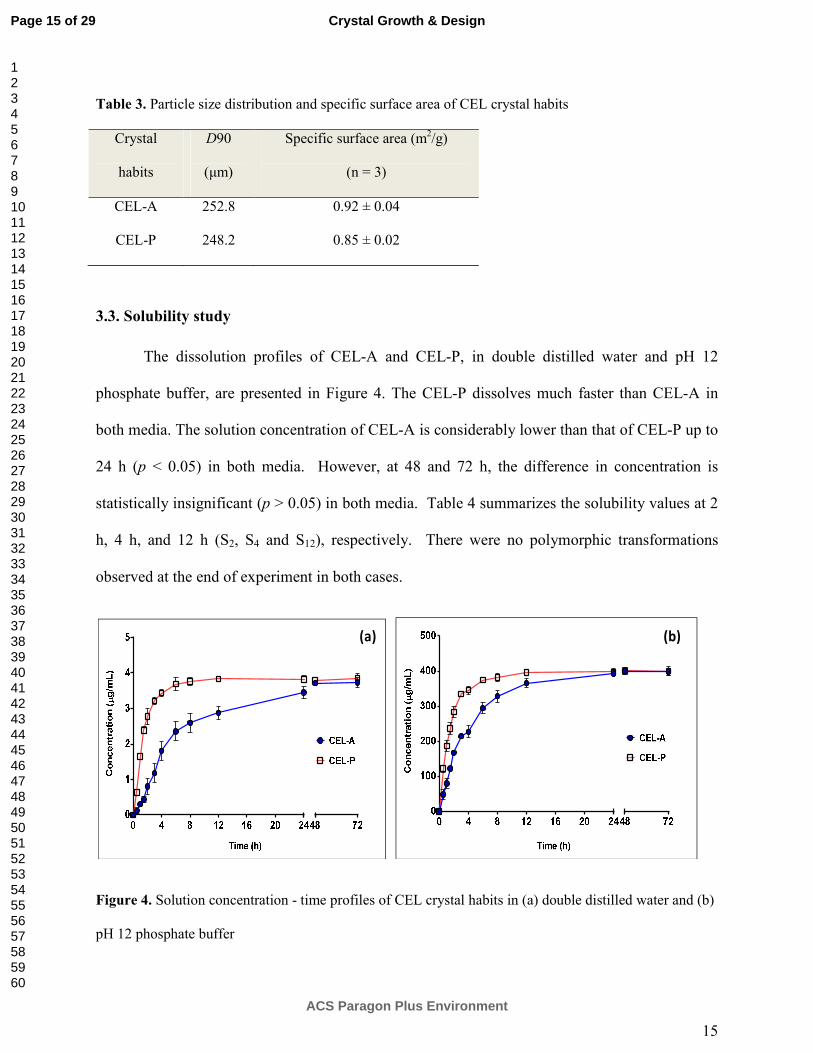
Table 3. Particle size distribution and specific surface area of CEL crystal habits
Crystal
habits
D90
(µm)
Specific surface area (m2/g)
(n = 3)
CEL-A 252.8 0.92 ± 0.04
CEL-P 248.2 0.85 ± 0.02
3.3. Solubility study
The dissolution profiles of CEL-A and CEL-P, in double distilled water and pH 12
phosphate buffer, are presented in Figure 4. The CEL-P dissolves much faster than CEL-A in
both media. The solution concentration of CEL-A is considerably lower than that of CEL-P up to
24 h (p < 0.05) in both media. However, at 48 and 72 h, the difference in concentration is
statistically insignificant (p > 0.05) in both media. Table 4 summarizes the solubility values at 2
h, 4 h, and 12 h (S2, S4 and S12), respectively. There were no polymorphic transformations
observed at the end of experiment in both cases.
Figure 4. Solution concentration - time profiles of CEL crystal habits in (a) double distilled water and (b)
pH 12 phosphate buffer
(a) (b)
Page 15 of 29
ACS Paragon Plus Environment
Crystal Growth & Design
123456789101112131415161718192021222324252627282930313233343536373839404142434445464748495051525354555657585960

16
Table 4. Solution concentration at different time points for two CEL crystal habits
Crystal habits Water (µg/mL) pH 12 buffer (µg/mL)
S2 S4 S12 S2 S4 S12
CEL-A 0.8 ± 0.2 1.8 ± 0.2 2.8 ± 0.1 166.6 ± 7.4 227.1 ± 16.5 365.7 ± 11.8
CEL-P 2.7 ± 0.2 3.4 ± 0.1 3.8 ± 0.1 283.6 ± 16.9 345.3 ± 11.6 396.7 ± 7.1
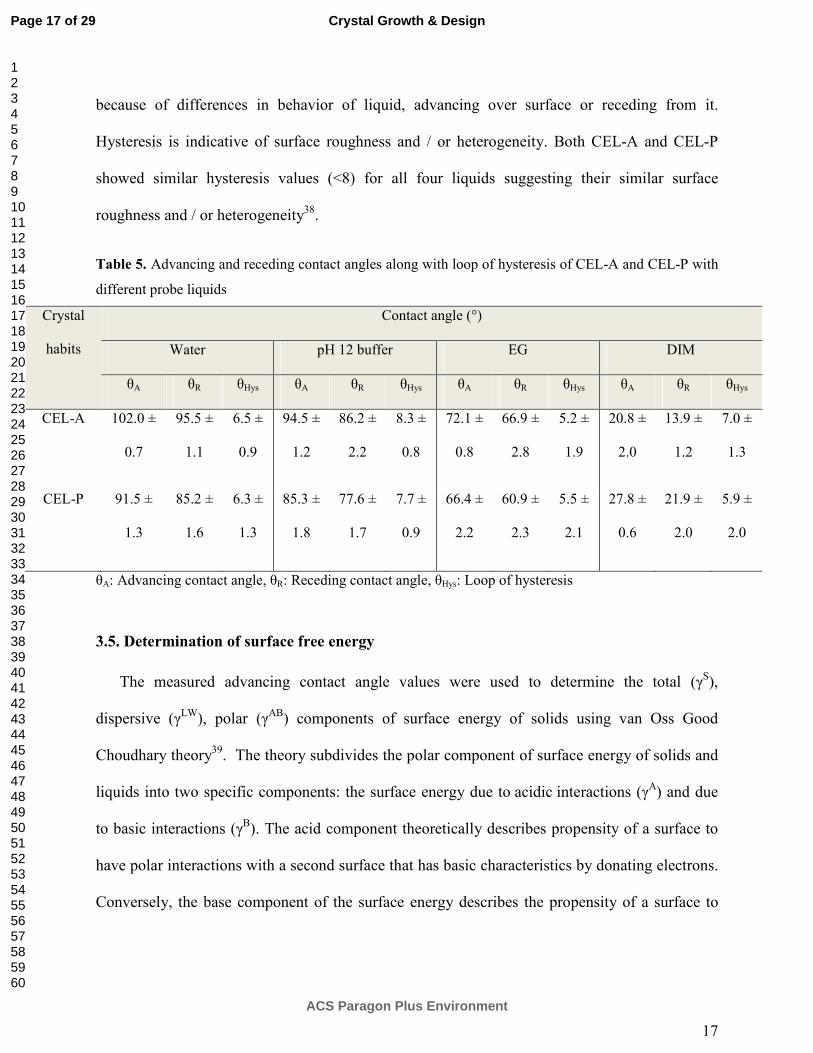
3.4. Contact angle and wettability
Wetting behavior of pharmaceutical solids was assessed by contact angle
measurements.35, 37 The advancing and receding contact angle of drop of different probe liquids,
deposited on powder surface, was determined and also characterized for loop of hysteresis (Table
5).
The advancing contact angles, using double distilled water, were 102.0° ± 0.7° and 91.5°
± 1.3° for CEL-A and CEL-P, respectively (p < 0.05). When using pH 12 phosphate buffer as
the probe liquid, advancing contact angle of CEL-A and CEL-P were 94.5° ± 1.2° and 85.3° ±
1.8°, respectively (p < 0.05). Further, with EG, CEL-A and CEL-P showed a contact angle of
72.1° ± 0.8° and 66.4° ± 2.2°, respectively (p < 0.05). Hence, CEL-P has a higher wetting
tendency with both polar and semipolar media.
When the nonpolar DIM was used as the probe liquid, CEL-A and CEL-P showed an
initial contact angle of 20.8° ± 2.0° and 27.8° ± 0.6°, respectively (p < 0.05). Hence, CEL-A has
a higher wetting tendency in nonpolar medium.
The loop of hysteresis (θHys) was determined by subtracting receding contact angle from
advancing contact angle for each probe liquid. Most liquid-solid interactions exhibit hysteresis
Page 16 of 29
ACS Paragon Plus Environment
Crystal Growth & Design
123456789101112131415161718192021222324252627282930313233343536373839404142434445464748495051525354555657585960
17
because of differences in behavior of liquid, advancing over surface or receding from it.
Hysteresis is indicative of surface roughness and / or heterogeneity. Both CEL-A and CEL-P
showed similar hysteresis values (<8) for all four liquids suggesting their similar surface
roughness and / or heterogeneity38.
Table 5. Advancing and receding contact angles along with loop of hysteresis of CEL-A and CEL-P with
different probe liquids
Crystal
habits
Contact angle (°)
Water pH 12 buffer EG DIM
θA θR θHys θA θR θHys θA θR θHys θA θR θHys
CEL-A 102.0 ±
0.7
95.5 ±
1.1
6.5 ±
0.9
94.5 ±
1.2
86.2 ±
2.2
8.3 ±
0.8
72.1 ±
0.8
66.9 ±
2.8
5.2 ±
1.9
20.8 ±
2.0
13.9 ±
1.2
7.0 ±
1.3
CEL-P 91.5 ±
1.3
85.2 ±
1.6
6.3 ±
1.3
85.3 ±
1.8
77.6 ±
1.7
7.7 ±
0.9
66.4 ±
2.2
60.9 ±
2.3
5.5 ±
2.1
27.8 ±
0.6
21.9 ±
2.0
5.9 ±
2.0
θA: Advancing contact angle, θR: Receding contact angle, θHys: Loop of hysteresis
3.5. Determination of surface free energy
The measured advancing contact angle values were used to determine the total (γS),
dispersive (γLW), polar (γAB) components of surface energy of solids using van Oss Good
Choudhary theory39. The theory subdivides the polar component of surface energy of solids and
liquids into two specific components: the surface energy due to acidic interactions (γA) and due
to basic interactions (γB). The acid component theoretically describes propensity of a surface to
have polar interactions with a second surface that has basic characteristics by donating electrons.
Conversely, the base component of the surface energy describes the propensity of a surface to
Page 17 of 29
ACS Paragon Plus Environment
Crystal Growth & Design
123456789101112131415161718192021222324252627282930313233343536373839404142434445464748495051525354555657585960

18
have polar interactions with another surface that has acidic characteristic by accepting
electrons40. The principle equation for this theory is:
( ) ][ 2 cos1 B
S
A
L
B
L
A
S
LW
L
LW
SLV γγγγγγγθ ++=+ Eq. (1)
The method requires use of at least three liquids –(i) liquid having only a dispersive
component to its surface energy, (ii) liquid having a dispersive and an acidic or basic component
and (iii) liquid having either a dispersive and a basic or acidic component (whichever the second
probe liquid did not have), or a liquid with all three components. In present study, DIM, EG and
water were selected as probe liquids. The dispersive component had a major contribution to total
surface free energy in both powders. However, CEL-P has relatively lower dispersive component
and higher acidic component that contribute to its higher polar component compared to CEL-A
(Table 6).
Table 6. The total (γS), dispersive (γLW ), polar (γAB ), basic (γB) and acidic (γA)surface energies of CEL
crystal habits
3.6. Surface chemistry by XPS
XPS spectra showed presence of carbon (C), nitrogen (N), oxygen (O), sulfur (S) and
fluorine (F) on the surface of both habits. Peak shape and chemical shift for these elements were
similar between the two powders, indicating no qualitative differences in CEL crystal habits.
Crystal habits γS (mJ/m2) γLW(mJ/m2) γAB (mJ/m2) γA(mJ/m2) γB(mJ/m2)
CEL-A 47.93 47.54 0.39 0.04 0.77
CEL-P 47.10 45.10 2.00 2.20 0.45
Page 18 of 29
ACS Paragon Plus Environment
Crystal Growth & Design
123456789101112131415161718192021222324252627282930313233343536373839404142434445464748495051525354555657585960

19
However, the relative abundance of surface elements shows significant differences (Table 7).
The surface of CEL-A sample exhibited a relatively lower concentration of O, N, S and higher
concentration of C than the CEL-P. The surface polarity, expressed as (O + N + S)/(C + F), was
0.42 and 0.52 for CEL-A and CEL-P, respectively.
Table 7. Surface elemental composition of CEL crystal habits
Crystal habits % Elemental composition
O 1s N 1s S 2p F 1s C 1s
CEL-A 8.48 10.51 10.70 10.12 60.17
CEL-P 9.25 13.13 11.72 10.47 55.41
3.7. Molecular modelling studies
Hydrophilic and hydrophobic moieties of CEL were traced using MLSP of the molecule,
which shows sites of high and low LP (Figure 5). Clearly, the lower LP site (shown by blue
shade) is around polarisable sulphonamide group. In contrast, higher LP (shown by orange
shade) of methyl phenyl moiety contributes to hydrophobic domains of molecule.
Page 19 of 29
ACS Paragon Plus Environment
Crystal Growth & Design
123456789101112131415161718192021222324252627282930313233343536373839404142434445464748495051525354555657585960

20
Figure 5. MLSP analysis of CEL using the MOLCAD program implemented in the SYBYL7.1 molecular
modeling package (encircled portion shows the hydrophilic moiety of CEL)
3.8. Face indexation
The unit cell parameters of both CEL-A and CEL-P were in agreement to the reported
cell parameters of CEL form III (CSD Reference code: DIBBUL), i.e., both are triclinic unit
cells with α = 97.62° (7), β = 100.62° (6), γ = 95.95° (4) and a = 10.136 Å (5), b = 16.778 Å (6),
c = 5.066 Å (6).41
Because of the structural anisotropy, the orientation of molecules on the surface of each
facet of a crystal is different. The different relative abundance of crystal facets between crystal
habits will lead to different surface properties of bulk powders. Table 8 shows the face
indexation data for CEL crystal habits. Both crystal habits have shown dominance of (0 0 1) and
(0 1 0) facets and a few minor facets (Figure 6). However, relative abundance of the main facets
differs significantly between the crystal habits. The (0 1 0) and its opposite facet (0 -1 0)
contribute more in CEL-P (32.48%) than CEL-A (21.39%). On the other hand, (0 0 1) and (0 0 -
1) contribute less in CEL-P (57.64%) than CEL-A (74.87%).
Page 20 of 29
ACS Paragon Plus Environment
Crystal Growth & Design
123456789101112131415161718192021222324252627282930313233343536373839404142434445464748495051525354555657585960

21
Table 8. Percentage contribution of major facets in CEL crystal habits
Crystal habit Facets on the surface
(0 0 1) and (0 0 -1) (0 1 0) and (0 -1 0) Other
CEL-A 74.87 21.39 3.74
CEL-P 57.64 32.48 9.88
Figure 6. Face indexation data of (a) CEL-A and (b) CEL-P
3.9. Oral bioavailability
Figure 7 shows the mean plasma concentration-time profiles for CEL-A and CEL-P. The
pharmacokinetic parameters were summarized in Table 9. Although no significant differences
observed in AUC0-48, Cmax and Tmax differ significantly between the two crystal habits. The Cmax
and Tmax of CEL-A are 351.12 ± 31.00 ng/mL and 2.8 ± 0.4 h. On the other hand, CEL-P
exhibits higher Cmax (423.5 ± 33.4 ng/mL) and reduced Tmax (1.0 ± 0.5 h).
Page 21 of 29
ACS Paragon Plus Environment
Crystal Growth & Design
123456789101112131415161718192021222324252627282930313233343536373839404142434445464748495051525354555657585960

22
Table 9. Pharmacokinetic parameters for CEL crystal habits in male Sprague-Dawley rats,
obtained after single oral administration of single dose (5 mg/kg)
Crystal habits AUC0-48 (ng.h/mL) Cmax (ng/mL) Tmax (h)
CEL-A 5399.30 ± 452.51 351.12 ± 31.00 2.8 ± 0.4
CEL-P 6304.00 ± 519.79 423.50 ± 33.40* 1.0 ± 0.5*
* p < 0.05, statistically significant difference in comparison with CEL-A
Figure 7. Mean plasma concentration–time profile for CEL-A and CEL-P
4. DISCUSSION
Crystal growth rate is determined by the rate at which growth units attach and / or remove
themselves from the growing surfaces.42, 43 Crystal habit is determined by the different
deposition kinetics of solute molecules on different crystal facets. 7, 11, 14, 44 Crystal growth rate
differs along various axes of the unit cell and is usually faster in directions associated with
shorter unit cell axis.43 For CEL form III, c axis (a = 10.136 Å, b = 16.778 Å, and c = 5.066 Å)
is the shortest axis. Hence, CEL form III crystal grows faster along ‘c’ direction, which leads to
Page 22 of 29
ACS Paragon Plus Environment
Crystal Growth & Design
123456789101112131415161718192021222324252627282930313233343536373839404142434445464748495051525354555657585960

23
its propensity to form needle-like crystals. However, it is possible to alter the growth rate by
altering crystallization conditions, such as type of solvent, temperature, degree of
supersaturation, and stirring rate.1, 7 In fact, two crystal habits were successfully prepared by
varying degree of supersaturation and crystallization temperature in this study.
The two crystal habits of CEL form III exhibited significantly different dissolution behaviors,
with CEL-P dissolves faster in water and pH 12 phosphate buffer (Figure 4) despite the similar
powder surface area (Table 3). To rationalize the different dissolution behaviors, we consider
different wettability of the two crystal habits since surface wetting of the crystals precedes
dissolution. For the same liquid, a stronger interaction between solid and liquid will predictably
result in a smaller contact angle.22, 45-47 CEL-P possessed greater polar surface free energy and
exhibited better wettability with water and pH 12 phosphate buffer than CEL-A. In contrast,
CEL-A, with more dispersive surface free energy component, showed better wettability with
non-polar solvent DIM. Hence, the faster dissolution of CEL-P in polar solvents is a result of the
better wettability. Differences in wettability of CEL form III crystal habits reflect differences in
intermolecular interactions between surface groups and the liquid medium.48-50 We hypothesized
that these differences resulted from different relative abundance of various facets in the two
crystal habits. XPS have been successfully used for identification and quantification of the
surface elemental composition.16, 17, 51 Prestidge and Tsatouhas had established a correlation
between contact angle and intensity ratios of X-ray photoelectron signals from hydrophilic and
hydrophobic moieties of morphine molecule.52 In this work, XPS results showed that the relative
abundance of each element differed significantly between crystal habits of CEL form III (Table
7).
Page 23 of 29
ACS Paragon Plus Environment
Crystal Growth & Design
123456789101112131415161718192021222324252627282930313233343536373839404142434445464748495051525354555657585960

24
CEL molecules between two adjacent layers, with the electron donating and accepting
groups oriented towards each other, form a hydrogen bonded bi-layered structure (Figure 8a).
The (0 1 0) facet has a bed of –SO2NH2- moieties exposed on its surface and thus making this
facet more hydrophilic (Figure 8b). In case of (0 0 1) facet, the exposure of methyl phenyl
moieties and fluorine makes it relatively more hydrophobic (Figure 8c).
Figure 8. Visualization of (a) hydrogen bonded bilayered structure of CEL form III (b) molecular surface
packing along with surface chemistry of (010) facet and (c) (001) facet using Mercury 2.3 software
Page 24 of 29
ACS Paragon Plus Environment
Crystal Growth & Design
123456789101112131415161718192021222324252627282930313233343536373839404142434445464748495051525354555657585960

25
Face indexation data revealed that the relative abundance of different facets of CEL form
III crystal differs significantly amongst its crystal habits. Hence, we visualized the surface
molecular packing of two prominent facets of CEL crystal habits (Figure 8). As already
mentioned, the relative contribution of (0 1 0) facet in CEL-P is higher than CEL-A. These
observations are in line with the XPS data that indicated a higher presence of O, N, S and F on
the surface of CEL-P. A lower LP around –SO2NH2- group signifies molecular domain having
greater propensity for interactions with polar solvents. However, methyl phenyl moiety has a
higher LP, hence, weaker interaction with aqueous phase. The overall more abundant polar facets
in CEL-P explain its higher dissolution rate in aqueous media.
Importantly, we have found that the better in vitro dissolution performance of CEL-P
translates into in vivo oral bioavailability advantage. There was statistically significant
improvement in Cmax and Tmax of CEL-P (Figure 7). Cmax of CEL-P was approximately 20%
higher than CEL-A while Tmax of CEL-P was also significantly reduced (Table 9). This level of
improvement is relevant to biopharmaceutical performance of BCS class II drugs.
5. CONCLUSIONS
Acicular and plate shaped crystal habits of CEL form III were obtained by varying
crystallization conditions. Although these crystal habits have the identical crystal structure,
significant differences were observed in their dissolution kinetics and wettability. CEL-P
exhibited greater polar component of surface energy due to the higher percentage of crystal
facets richer in polar domains of CEL molecule. Thus differences in physicochemical properties
and oral bioavailability of CEL-A and CEL-P, could be ascribed to surface anisotropy and
different abundance of exposing crystal facets. This study establishes the potentially significant
Page 25 of 29
ACS Paragon Plus Environment
Crystal Growth & Design
123456789101112131415161718192021222324252627282930313233343536373839404142434445464748495051525354555657585960
26
contribution of crystal habit on the performance of crystalline drug, which has special relevance
to BCS class II drugs that have solubility and/or dissolution limited oral bioavailability.
AUTHOR INFORMATION
Corresponding Author
*Arvind K. Bansal
Department of Pharmaceutics
National Institute of Pharmaceutical Education and Research (NIPER)
Sector 67, SAS Nagar, Punjab 160 062, INDIA
Tel: +91-172-2214682-86. Fax: +91-172-2214692.
E- mail: [email protected]
NOTES
The authors declare no competing financial interest
ACKNOWLEDGMENT
We thank the National Chemical Laboratory (NCL), Pune, India for providing facility of X-ray
photoelectron spectroscopy (XPS) and the X-Ray Crystallographic Laboratory, S146 Kolthoff
Hall, Department of Chemistry, University of Minnesota, USA for supporting the crystal face
indexing studies. We are also thankful to Dr. Dimitrios A. Lamprou, University of Strathclyde,
UK for his guidance on surface free energy calculations.
SUPPORTING INFORMATION AVAILABLE
Representative X-ray photoelectron (XP) spectra of different elements of celecoxib. This
material is available free of charge via the Internet at http://pubs.acs.org.
Page 26 of 29
ACS Paragon Plus Environment
Crystal Growth & Design
123456789101112131415161718192021222324252627282930313233343536373839404142434445464748495051525354555657585960
27
ABBREVIATIONS
API, active pharmaceutical ingredient; BCS, biopharmaceutical classification system; CEL,
celecoxib; CEL-A, acicular crystals of celecoxib; CEL-P, plate shaped crystals of celecoxib; LP,
lipophilic potential; MLSP, molecular lipophilic surface potential; XPS, X-ray phaotoelectron
spectroscopy.
REFERENCES
(1) Blagden, N.; de Matas, M.; Gavan, P. T.; York, P. Adv. Drug Deliv. Rev. 2007, 59, 617-30. (2) Hammond, R. B.; Pencheva, K.; Roberts, K. J.; Auffret, T. J. Pharm. Sci. 2007, 96, 1967-73. (3) Agrawal, S.; Ashokraj, Y.; Bharatam, P. V.; Pillai, O.; Panchagnula, R. Eur. J. Pharm.
Sci. 2004, 22, 127-44. (4) Bansal, S. S.; Kaushal, A. M.; Bansal, A. K. Mol. Pharm. 2007, 4, 794-802. (5) Sun, C.; Grant, D. J. W. J. Pharm. Sci. 2001, 90, 569-579. (6) Gu, C. H.; Young, V.; Grant, D. J. J. Pharm. Sci. 2001, 90, 1878-90. (7) Di Martino, P.; Censi, R.; Malaj, L.; Capsoni, D.; Massarotti, V.; Martelli, S. Cryst. Res.
Technol. 2007, 42, 800-806. (8) Ishikawa, K.; Eanes, E. D.; Tung, M. S. J. Dent. Res. 1994, 73, 1462-9. (9) Nokhodchi, A.; Bolourtchian, N.; Dinarvand, R. Int. J. Pharm. 2003, 250, 85-97. (10) Shariare, M. H.; Blagden, N.; Matas, M.; Leusen, F. J. J.; York, P. J. Pharm. Sci. 2012, 101, 1108-19. (11) Stoica, C.; Verwer, P.; Meekes, H.; Van Hoof, P.; Kaspersen, F. M.; Vlieg, E. Cryst.
Growth Des. 2004, 4, 765-768. (12) Umprayn, K.; Luengtummuen, A.; Kitiyadisai, C.; Pornpiputsakul, T. Drug Dev. Ind.
Pharm. 2001, 27, 1047-56. (13) Walker, E. M.; Roberts, K. J.; Maginn, S. J. Langmuir 1998, 14, 5620-5630. (14) Chen, J.; Wang, J.; Ulrich, J.; Yin, Q.; Xue, L. Cryst. Growth Des. 2008, 8, 1490-1494. (15) Heng, J. Y. Y.; Bismarck, A.; Lee, A. F.; Wilson, K.; Williams, D. R. J. Pharm. Sci.
2007, 96, 2134-44. (16) Heng, J. Y. Y.; Bismarck, A.; Williams, D. R. AAPS PharmSci.Tech. 2006, 7, 84. (17) Heng, J. Y. Y.; Bismarck, A.; Lee, A. F.; Wilson, K.; Williams, D. R. Langmuir 2006, 22, 2760-2769. (18) Heng, J. Y. Y.; Thielmann, F.; Williams, D. R. Pharm. Res. 2006, 23, 1918-1927. (19) Heng, J. Y. Y.; Williams, D. R. Langmuir 2006, 22, 6905-6909. (20) Ho, R.; Heng, J. Y. Y.; Dilworth, S. E.; Williams, D. R. The J. Adhe. 2008, 84, 483-501. (21) Puri, V.; Dantuluri, A. K.; Kumar, M.; Karar, N.; Bansal, A. K. Eur. J. Pharm. Sci. 2010, 40, 84-93. (22) Li, T.; Liu, S.; Feng, S.; Aubrey, C. E. J. Am. Chem. Soc. 2005, 127, 1364-1365. (23) Chow, A. H. L.; Hsia, C. K.; Gordon, J. D.; Young, J. W. M.; Vargha-Butler, E. I. Int. J.
Pharm. 1995, 126, 21-28.
Page 27 of 29
ACS Paragon Plus Environment
Crystal Growth & Design
123456789101112131415161718192021222324252627282930313233343536373839404142434445464748495051525354555657585960
28
(24) Lippold, B. C.; Ohm, A. Int. J. Pharm. 1986, 28, 67-74. (25) Buckton, G. J Adhe. Sci. Tech. 1993, 7, 205-219. (26) Ohta, M.; Buckton, G. Int. J. Pharm. 2004, 269, 81-88. (27) Zografi, G.; Tam, S. S. J. Pharm. Sci. 1976, 65, 1145-1149. (28) Danesh, A.; Connell, S. D.; Davies, M. C.; Roberts, C. J.; Tendler, S. J. B.; Williams, P. M.; Wilkins, M. Pharm. Res. 2001, 18, 299-303. (29) Danesh, A.; Davies, M. C.; Steven, J.; Roberts, C. J.; Tendler, S. J. B.; Williams, P. M.; Wilkins, M. J. Anal. chem. 2000, 72, 3419-3422. (30) Tenho, M.; Heinänen, P.; Tanninen, V. P.; Lehto, V. P. J. Pharm. Biomed. Anal. 2007, 43, 1315-1323. (31) Laad, P.; Shete, G.; Modi, S. R.; Bansal, A. K. Eur. J. Pharm. Sci. 2013, 49, 109-116. (32) Banga, S.; Chawla, G.; Varandani, D.; Mehta, B. R.; Bansal, A. K. J. Pharm. Pharmacol.
2007, 59, 29-39. (33) Dhabu, P. M.; Akamanchi, K. G. Drug Dev. Ind. Pharm. 2002, 28, 815-821. (34) Saha, R. N.; Sajeev, C.; Jadhav, P. R.; Patil, S. P.; Srinivasan, N. J. Pharm.Biomed. Anal.
2002, 28, 741-751. (35) Ahfat, N. M.; Buckton, G.; Burrows, R.; Ticehurst, M. D. Eur. J. Pharm. Sci. 2000, 9, 271-276. (36) He, X.; Barone, M. R.; Marsac, P. J.; Sperry, D. C. Int. J. Pharm. 2008, 353, 176-186. (37) Muster, T. H.; Prestidge, C. A. Int. J. Pharm. 2002, 234, 43-54. (38) Marmur, A. J. Colloid Interface. Sci. 1994, 168, 40-46. (39) Van Oss, C. J.; Good, R. J.; Chaudhury, M. K. Langmuir 1988, 4, 884-891. (40) Gindl, M.; Sinn, G.; Gindl, W.; Reiterer, A.; Tschegg, S. Colloids Surf. A Physicochem.
Eng. Asp. 2001, 181, 279-287. (41) Dev, R. V.; Rekha, K. S.; Vyas, K.; Mohanti, S. B.; Kumar, P. R.; Reddy, G. O. Acta
Crystallogr. 1999, 55. (42) Desiraju, G. R., Vittal, J.V., Ramanan, A. Crystal Engineering: A Textbook. 1 ed.; World Scientific Publishing Company Incorporated: New Delhi, 2011; pp 77-95. (43) Mullin, J. W. Crystallization. 4 ed.; Butterworth-Heinemann: Oxford, 2001; pp 181-284. (44) Wang, J. L.; Leiserowitz, L.; Lahav, M. The J. Phys. Chem. 1992, 96, 15-16. (45) Aubrey-Medendorp, C.; Parkin, S.; Li, T. J. Pharm. Sci. 2008, 97, 1361-1367. (46) Muster, T. H.; Prestidge, C. A. J. Pharm. Sci. 2002, 91, 1432-1444. (47) Muster, T. H.; Prestidge, C. A. J. Pharm. Sci. 2005, 94, 861-872. (48) Fowkes, F. M. Adv. Chem. Ser. 1964, 43, 99-111. (49) Hammond, R. B.; Pencheva, K.; Roberts, K. J. Cryst. Growth Des. 2006, 6, 1324-1334. (50) Ho, R.; Wilson, D. A.; Heng, J. Y. Y. Cryst. Growth Des. 2009, 9, 4907-4911. (51) Buckton, G.; Bulpett, R.; Verma, N. Int. J. Pharm. 1991, 72, 157-162. (52) Prestidge, C. A.; Tsatouhas, G. Int. J. Pharm. 2000, 198, 201-212.
Page 28 of 29
ACS Paragon Plus Environment
Crystal Growth & Design
123456789101112131415161718192021222324252627282930313233343536373839404142434445464748495051525354555657585960
29
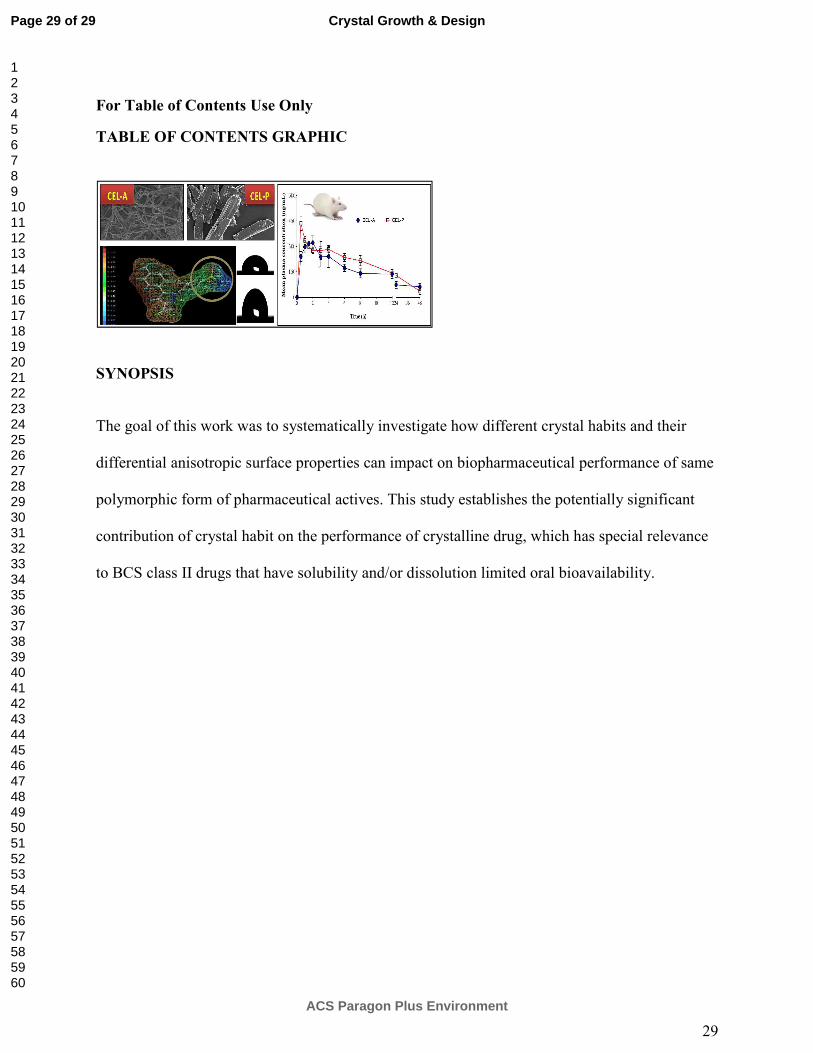
For Table of Contents Use Only
TABLE OF CONTENTS GRAPHIC
SYNOPSIS
The goal of this work was to systematically investigate how different crystal habits and their
differential anisotropic surface properties can impact on biopharmaceutical performance of same
polymorphic form of pharmaceutical actives. This study establishes the potentially significant
contribution of crystal habit on the performance of crystalline drug, which has special relevance
to BCS class II drugs that have solubility and/or dissolution limited oral bioavailability.
Page 29 of 29
ACS Paragon Plus Environment
Crystal Growth & Design
123456789101112131415161718192021222324252627282930313233343536373839404142434445464748495051525354555657585960