Impact of controlled attenuation parameter on detecting ...
12
Impact of controlled attenuation parameter on detecting fibrosis using liver stiffness measurement T. Karlas 1 | D. Petroff 1 | M. Sasso 2 | J.-G. Fan 3 | Y.-Q. Mi 4 | V. de L edinghen 5 | M. Kumar 6 | M. Lupsor-Platon 7 | K.-H. Han 8 | A. C. Cardoso 9,10 | G. Ferraioli 11 | W.-K. Chan 12 | V. W.-S. Wong 13 | R. P. Myers 14 | K. Chayama 15 | M. Friedrich-Rust 16 | M. Beaugrand 17 | F. Shen 3 | J.-B. Hiriart 5 | S. K. Sarin 6 | R. Badea 7 | H. W. Lee 8 | P. Marcellin 10 | C. Filice 11 | S. Mahadeva 12 | G. L.-H. Wong 13 | P. Crotty 14 | K. Masaki 15 | J. Bojunga 16 | P. Bedossa 2,17 | V. Keim 1 | J. Wiegand 1 1 Leipzig, Germany 2 Paris, France 3 Shanghai, China 4 Tianjin, China 5 Pessac, France 6 New Delhi, India 7 Cluj-Napoca, Romania 8 Seoul, Korea 9 Rio de Janeiro, Brazil 10 Clichy, France 11 Pavia, Italy 12 Kuala Lumpur, Malaysia 13 Hong Kong, China 14 Calgary, Canada 15 Hiroshima, Japan 16 Frankfurt, Germany 17 Bondy, France Correspondence Dr. J Wiegand, Division of Gastroenterology and Rheumatology, University Hospital Leipzig, Leipzig, Germany. Email: [email protected]. de Funding information German Federal Ministry of Education and Research, Grant/Award Number: FKZ 01EO1001, unrestricted grant from Echosens Summary Background: Liver fibrosis is often accompanied by steatosis, particularly in patients with non-alcoholic fatty liver disease (NAFLD), and its non-invasive characterisation is of utmost importance. Vibration-controlled transient elastography is the non-invasive method of choice; however, recent research suggests that steatosis may influence its diagnostic performance. Controlled Attenuation Parameter (CAP) added to transient elas- tography enables simultaneous assessment of steatosis and fibrosis. Aim: To determine how to use CAP in interpreting liver stiffness measurements. Methods: This is a secondary analysis of data from an individual patient data meta- analysis on CAP. The main exclusion criteria for the current analysis were unknown aetiology, unreliable elastography measurement and data already used for the same research question. Aetiology-specific liver stiffness measurement cut-offs were determined and used to estimate positive and negative predictive values (PPV/NPV) with logistic regression as functions of CAP. Results: Two thousand and fifty eight patients fulfilled the inclusion criteria (37% women, 18% NAFLD/NASH, 42% HBV, 40% HCV, 51% significant fibrosis ≥ F2). Youden optimised cut-offs were only sufficient for ruling out cirrhosis (NPV of 98%). With sensitivity and speci- ficity-optimised cut-offs, NPV for ruling out significant fibrosis was moderate (70%) and could be improved slightly through consideration of CAP. PPV for significant fibrosis and cirrhosis were 68% and 55% respectively, despite specificity-optimised cut-offs for cirrhosis. Conclusions: Liver stiffness measurement values below aetiology-specific cut-offs are very useful for ruling out cirrhosis, and to a lesser extent for ruling out significant fibro- sis. In the case of the latter, Controlled Attenuation Parameter can improve interpreta- tion slightly. Even if cut-offs are very high, liver stiffness measurements are not very reliable for ruling in fibrosis or cirrhosis. The Handling Editor for this article was Professor Stephen Harrison, and it was accepted for publication after full peer-review. T. Karlas and D. Petroff contributed equally to this work. The names and full addresses of the International CAP-IPDMA group are listed in Appendix 1. Received: 16 October 2017 | First decision: 19 November 2017 | Accepted: 1 January 2018 DOI: 10.1111/apt.14529 Aliment Pharmacol Ther. 2018;47:989–1000. wileyonlinelibrary.com/journal/apt © 2018 John Wiley & Sons Ltd | 989
Transcript of Impact of controlled attenuation parameter on detecting ...

Impact of controlled attenuation parameter on detectingfibrosis using liver stiffness measurement
T. Karlas1 | D. Petroff1 | M. Sasso2 | J.-G. Fan3 | Y.-Q. Mi4 | V. de L�edinghen5 |
M. Kumar6 | M. Lupsor-Platon7 | K.-H. Han8 | A. C. Cardoso9,10 | G. Ferraioli11 |
W.-K. Chan12 | V.W.-S. Wong13 | R. P. Myers14 | K. Chayama15 | M. Friedrich-Rust16 |
M. Beaugrand17 | F. Shen3 | J.-B. Hiriart5 | S. K. Sarin6 | R. Badea7 | H.W. Lee8 |
P. Marcellin10 | C. Filice11 | S. Mahadeva12 | G. L.-H. Wong13 | P. Crotty14 | K. Masaki15 |
J. Bojunga16 | P. Bedossa2,17 | V. Keim1 | J. Wiegand1
1Leipzig, Germany
2Paris, France
3Shanghai, China
4Tianjin, China
5Pessac, France
6New Delhi, India
7Cluj-Napoca, Romania
8Seoul, Korea
9Rio de Janeiro, Brazil
10Clichy, France
11Pavia, Italy
12Kuala Lumpur, Malaysia
13Hong Kong, China
14Calgary, Canada
15Hiroshima, Japan
16Frankfurt, Germany
17Bondy, France
Correspondence
Dr. J Wiegand, Division of Gastroenterology
and Rheumatology, University Hospital
Leipzig, Leipzig, Germany.
Email: [email protected].
de
Funding information
German Federal Ministry of Education and
Research, Grant/Award Number: FKZ
01EO1001, unrestricted grant from
Echosens
Summary
Background: Liver fibrosis is often accompanied by steatosis, particularly in patients with
non-alcoholic fatty liver disease (NAFLD), and its non-invasive characterisation is of
utmost importance. Vibration-controlled transient elastography is the non-invasive
method of choice; however, recent research suggests that steatosis may influence its
diagnostic performance. Controlled Attenuation Parameter (CAP) added to transient elas-
tography enables simultaneous assessment of steatosis and fibrosis.
Aim: To determine how to use CAP in interpreting liver stiffness measurements.
Methods: This is a secondary analysis of data from an individual patient data meta-
analysis on CAP. The main exclusion criteria for the current analysis were unknown
aetiology, unreliable elastography measurement and data already used for the same
research question. Aetiology-specific liver stiffness measurement cut-offs were
determined and used to estimate positive and negative predictive values (PPV/NPV)
with logistic regression as functions of CAP.
Results: Two thousand and fifty eight patients fulfilled the inclusion criteria (37% women,
18% NAFLD/NASH, 42% HBV, 40% HCV, 51% significant fibrosis ≥ F2). Youden optimised
cut-offs were only sufficient for ruling out cirrhosis (NPV of 98%). With sensitivity and speci-
ficity-optimised cut-offs, NPV for ruling out significant fibrosis was moderate (70%) and could
be improved slightly through consideration of CAP. PPV for significant fibrosis and cirrhosis
were 68% and 55% respectively, despite specificity-optimised cut-offs for cirrhosis.
Conclusions: Liver stiffness measurement values below aetiology-specific cut-offs are
very useful for ruling out cirrhosis, and to a lesser extent for ruling out significant fibro-
sis. In the case of the latter, Controlled Attenuation Parameter can improve interpreta-
tion slightly. Even if cut-offs are very high, liver stiffness measurements are not very
reliable for ruling in fibrosis or cirrhosis.
The Handling Editor for this article was Professor Stephen Harrison, and it was accepted for publication after full peer-review.
T. Karlas and D. Petroff contributed equally to this work.
The names and full addresses of the International CAP-IPDMA group are listed in Appendix 1.
Received: 16 October 2017 | First decision: 19 November 2017 | Accepted: 1 January 2018
DOI: 10.1111/apt.14529
Aliment Pharmacol Ther. 2018;47:989–1000. wileyonlinelibrary.com/journal/apt © 2018 John Wiley & Sons Ltd | 989

1 | INTRODUCTION
Liver stiffness measurement (LSM) has quickly grown to become an
established first-line tool for assessment of liver fibrosis, especially
vibration-controlled transient elastography (VCTE).1,2 It is considered
quite accurate for ruling out advanced stages of fibrosis or cirrhosis,
but less so for ruling them in.3 The diagnostic performance is known
to be affected by a number of factors, and protocols have been
devised for minimising their influence, eg, measurements should be
made after fasting4 and B-mode ultrasound should be performed to
exclude patients with biliary obstruction or congestive hepatopathy.3
In addition, aetiology and inflammatory activity must be taken into
account when interpreting liver stiffness measurements.
Fatty liver is commonly related to prevalent aetiologies and may
drive disease progression.5,6 This is particularly relevant for non-alco-
holic fatty liver disease or steatohepatitis (NAFLD/NASH), with dra-
matically increasing numbers as a result of the obesity pandemic.7,8
Current research suggests that fatty liver can lessen LSM accuracy9
and modify cut-offs.10 Non-invasive surrogates of steatosis staging
such as bright echo pattern in conventional ultrasound might help in
interpreting results.11 With the advent of Controlled Attenuation
Parameter (CAP) – an ultrasound-based quantitative estimate of hep-
atic fat incorporated in VCTE – consideration of steatosis in real-
time is facilitated.12 A CAP-based algorithm was explored by Petta
et al for use in patients with non-alcoholic fatty liver disease
(NAFLD).13 There is some debate, however, regarding various
sources of bias,14 patient selection and methodological issues.15
To clarify these issues, and explore aetiology-specific aspects of
the putative connection between LSM and CAP, we performed a
secondary analysis of individual patient data provided by authors of
19 papers that had originally been collected for determining opti-
mised CAP cut-offs.16
2 | PATIENTS AND METHODS
2.1 | Paper and patient selection
This study is a secondary analysis using the database established for
conducting an individual patient data meta-analysis (IPDMA) of Con-
trolled Attenuation Parameter accuracy. The analysis was approved
by the local ethics committee (331/16-ek) and registered prior to
starting the analysis (PROSPERO 2016: CRD42016046271). Studies
published up to May 2015 were included if CAP measurements were
performed with the Fibroscan M-probe and liver biopsies taken.
Measurements with the Fibroscan XL-probe were not considered.
Roughly speaking, patients were excluded if the body mass index
(BMI) was > 35 kg/m² and if the time interval between biopsy and
CAP measurement was > 30 days.16 In the current analysis, patients
were further excluded if they had been used for publications on a
similar research question, if fibrosis staging was unavailable, if the
liver stiffness measurements were unreliable according to established
criteria ( < 10 valid measurements, ratio of median to interquartile
range ≥ 0.3),1,3 if aminotransferases were equal to or above 5 times
the upper limit of normal, or the aetiology was unknown.
2.2 | Steatosis grading and fibrosis staging
As already described,16 steatosis was defined according to the num-
ber of affected hepatocytes: S0 ( < 5% or 10% depending on the
trial), S1 (5% or 10%-33%), S2 (34%-66%) and S3 ( > 66%). Fibrosis
was staged from F0 to F4 according to the Metavir or Kleiner score,
as appropriate.17,18 If the original publication used fibrosis staging
according to Ishak,19 then the following transformation was used:
Ishak F0 = Metavir F0; Ishak F1 = Metavir F1; Ishak F2/3 = Metavir
F2; Ishak F4 = Metavir F3; Ishak F5/6 = Metavir F4.
2.3 | Objectives of the study
The primary objective is to analyse the influence of steatosis either
defined by histology or Controlled Attenuation Parameter on the per-
formance of liver stiffness measurements for distinguishing significant
liver fibrosis ( ≥ F2) from mild or non-existent stages. Secondary
objectives are determination of disease-specific cut-offs for detection
of significant fibrosis, advanced fibrosis ( ≥ F3) and cirrhosis (F4) and
analysis of ruling out and ruling in fibrosis/cirrhosis. The initial goal of
analysing inflammatory activity could not be performed due to lack of
harmonised histological data, but high aminotransferases, indicating
inflammatory activity, were part of the exclusion criteria.
2.4 | Statistical methods
All analyses were performed with the software R version 3.3.3.20
Receiver operating characteristic (ROC) analyses made use of the
pROC package21 and optimal cut-offs were determined by maximis-
ing the Youden index or applying the minimum criterion of 90% for
sensitivity or specificity. Since very wide ranges of cut-offs have
been published,3 we chose optimisations resulting in particularly low
ones when optimising negative predictive values (NPV) and high
ones for positive predictive values (PPV). LSM was always treated
on a logarithmic scale and P-values from linear models comparing
multiple groups were corrected using the Bonferroni-Holm method.
A linear mixed-model was used with liver stiffness measurement
results as the dependent variable and fibrosis staging, aetiology,
steatosis grading, CAP, age, sex, BMI and inflammation status as
fixed effects with the trial (ie, “centre effects”) as a random term and
where P-values for the fixed effects are taken from a Wald chi-
square test.
Logistic regression was used to provide estimates and confidence
intervals for predictive values and for correct classification of fibrosis
stages. In particular, the histologically determined fibrosis category
was taken as the dependent variable with the aetiology-specific
LSM-based classification and the CAP value as independent vari-
ables, including a quadratic term for CAP when necessary. The
regression model yields estimates that can be used to determine a
990 | KARLAS ET AL.

probability given a positive/negative LSM result and a particular CAP
value, which can be interpreted as a PPV/NPV. Prevalence was
taken into account using Bayes’ theorem and the observed values of
sensitivity and specificity. Smoothing splines were used as a sensitiv-
ity analysis to the curves provided by logistic regression.
3 | RESULTS
Of the initial 2735 patients included in the primary analysis of the
CAP-IPDMA, 2058 remained for the current analysis after applying
additional exclusion criteria, Figure 1. Note that 140 patients used
by Petta et al13 to address similar questions to those of the pre-
sent work were excluded from the analysis. Patient characteristics
are presented in Table 1. Of note is the high prevalence of patients
with significant fibrosis or cirrhosis (51%). Patient characteristics
according to geographic location of the study centre can be found
in Table S2.
3.1 | Aetiology-specific liver stiffness measurementcut-offs optimising the Youden index
Significant fibrosis (F2-4) was distinguished from absent or mild
fibrosis (F0-1) at the optimal cut-offs of 8.4 kPa (AUC 0.80, SE 0.68,
SP 0.80) for NAFLD/NASH, 8.2 kPa (AUC 0.77, SE 0.59, SP 0.83)
for HBV and 7.2 kPa (AUC 0.83, SE 0.70, SP 0.82) for HCV.
Cirrhosis (F4) was distinguished from the remainder (F0-3) at the
optimal cut-offs of 13.2 kPa (AUC 0.87, SE 0.84, SP 0.88) for
NAFLD/NASH, 10.8 kPa (AUC 0.86, SE 0.77, SP 0.80) for HBV and
10.2 kPa (AUC 0.94, SE 0.89, SP 0.87) for HCV.
See Table S1 for further details including optimisation with other
criteria and the incorporation of ALT and AST and the cut-offs for
F0-2 vs F3-4, which can be relevant for prognosis.
3.2 | Dependence of liver stiffness measurementson biopsy-based steatosis
As a first step, the dependence of LSM values on biopsy-based
steatosis grading was analysed. Small, but significant elevations in
LSM were seen for higher steatosis stages. For absent or mild fibro-
sis, LSM values in patients with steatosis stages S2 or S3 were a
Unique for this analysis (n = 2595)
Fibrosis staging unavailable (n = 48)
Complete histology (n = 2547)
Aminotransferases ≥5 ULN (n = 31)
Reliable TE (n = 2333)
Analysed (n = 2058)
Unknown etiology (n = 144)
Unreliable LSM measurement (n = 214)
Aminotransferases <5 ULN (n = 2202)
CAP-IPDMA data base (n = 2735)♦ valid CAP measurement with M-probe♦ histologically determined steatosis grading available♦ ≤30 days between TE and biopsy♦ BMI ≤35 kg/m2 or skin-to-liver capsule distance ≤25 mm
Used for similar research question (n = 140)
F IGURE 1 Flowchart of the patients included in the finalanalysis. CAP, Controlled Attenuation Parameter; IPDMA, individualpatient data meta-analysis; LSM, liver stiffness measurement; TE,transient elastography; ULN, upper limit of normal
TABLE 1 Patient characteristics
NAFLD/NASH(n = 372)
HBV(n = 871)
HCV(n = 815)
Female 127 (34%) 295 (34%) 337 (41%)
Age (y) 47 � 13 39 � 12 48 � 12
BMI (kg/m2) 27 � 4 24 � 4 25 � 4
Fibrosis (biopsy)
F0 85 (23%) 104 (12%) 52 (6%)
F1 144 (39%) 308 (35%) 318 (39%)
F2 67 (18%) 294 (34%) 228 (28%)
F3 51 (14%) 81 (9%) 94 (12%)
F4 25 (7%) 84 (10%) 123 (15%)
Steatosis (biopsy)
S0 33 (9%) 515 (59%) 495 (61%)
S1 128 (34%) 257 (30%) 205 (25%)
S2 155 (42%) 74 (8%) 87 (11%)
S3 56 (15%) 25 (3%) 28 (3%)
VCTE (kPa) 7.2 [5.4, 10.4] 7.0 [5.3, 11.0] 8.8 [5.1, 10.2]
cut-offa
(F0-1 vs F2-4)
8.4 8.2 7.2
cut-offa
(F0-3 vs F4)
13.2 10.8 10.2
CAP (dB/m) 307 [262, 338] 229 [196, 262] 222 [193, 260]
Numbers are counts (percentages), mean � standard deviations or med-
ian [interquartile range].
BMI, body mass index; HBV, hepatitis B; HBC, hepatitis C; CAP, con-
trolled attenuation parameter; NAFLD/NASH, non-alcoholic fatty liver
disease/steatohepatitis; VCTE, vibration-controlled transient elastogra-
phy.aCut-offs found by optimising the Youden index.
KARLAS ET AL. | 991

factor 1.14 (95% CI 1.08 to 1.20, P < 0.001) higher than those with
steatosis stages S0 or S1. The corresponding difference in patients
with more advanced fibrosis stages was 1.15 (1.04 to 1.27,
P = 0.0050), Figure 2A. When considering NAFLD/NASH alone, a
similar result was observed for absent or mild fibrosis, but not for
more advanced stages, Figure 2B. These results also hold upon taking
into account the slightly different relative proportions of individual
fibrosis stages between the S0-S1 and the S2-S3 groups. Linear
mixed models, however, do not indicate that steatosis has a signifi-
cant influence on LSM after taking covariates other than CAP into
account (P = 0.056), though the effect becomes significant when
comparing S0-S1 with S2-S3 (P = 0.023). Upon including CAP, the
effect of steatosis vanishes (P = 0.71) and, although CAP is significant
(P = 0.0063), the incremental increase in LSM values is only by a fac-
tor 1.0067 (1.0019 to 1.0116) for an increase in CAP by 10 dB/m.
Similarly small elevations in LSM values were seen in HBV and
HCV patients with steatosis grades S2 and S3 compared to S0 and
S1, though only significantly so for F2-4 HCV patients.
This qualitative behaviour is also seen when detecting advanced
fibrosis or cirrhosis. Significant differences may, sometimes, be seen
between steatosis grades, but they are always very small (Figure S1
and Figure S2).
3.3 | Effect of CAP on correct LSM-classification offibrosis/cirrhosis
Clearly, interpretation of a non-invasive determination of liver fibro-
sis should not rely on a biopsy-based characterisation of steatosis.
Therefore, as a second step, we analysed whether CAP can be used
to increase the diagnostic performance of LSM. For the entire popu-
lation, LSM correctly classified 1509 (73%) of the patients as F0-1
vs F2-4 using aetiology-specific, Youden index optimised cut-offs,
Figure 3. The overall result was very similar for NAFLD/NASH
patients, where 279 (75%) were correctly classified. The probability
of correct classification is independent of the CAP value (P = 0.45
for all patients, P = 0.66 for NAFLD/NASH patients). For example,
12
510
2050
100
Live
r st
iffne
ss (
kPa)
12
510
2050
100
Live
r st
iffne
ss (
kPa)
F0−F1 F2−F4
S0−S1S2−S3 punivariate < 0.001
(A)
(B)
pmultivariate =0.0098
punivariate = 0.005
pmultivariate = 0.18
n = 798 213 835 212
All patients
F0−F1 F2−F4
S0−S1S2−S3
punivariate = 0.028
pmultivariate = 0.076
punivariate = 0.26
pmultivariate = 0.18
n = 91 138 70 73
NAFLD/NASH patients
F IGURE 2 Impact of histologicallydetermined steatosis grade on liverstiffness according to fibrosis stages. Theunivariate analysis is based on a t test andthe multivariate analysis on a linear mixedmodel with aetiology, age, sex and bodymass index as covariates and the study asa random effect. A Bonferroni-Holmcorrection was used. NAFLD/NASH, non-alcoholic fatty liver disease/steatohepatitis
992 | KARLAS ET AL.

the probability of correct classification in all patients is 73% at a
CAP value of 200 dB/m compared to 75% at 350 dB/m.
The probability of correct classification of cirrhosis is 84% and
does not depend on CAP values (P = 0.81), Figure S3. Since only 25
NAFLD/NASH patients have cirrhosis, we refrained from performing
the analogous analysis. In contrast, there was a significant impact of
CAP on classification of F0-2 vs F3-4 (P = 0.0072), though the
impact is small: at CAP values of 200 dB/m, 75% are correctly classi-
fied compared to 82% at 350 dB/m.
3.4 | Effect of CAP on ruling out fibrosis/cirrhosisusing LSM
Ruling out fibrosis or cirrhosis is of particular clinical relevance,
implying that the negative predictive value must be high.
For ruling out fibrosis in our cohort, NPV was found to be 69%
(67% to 72%) at the observed prevalence of 50%, but would reach
88% and 95% at a prevalence of 25% and 10%, respectively. A fairly
strong and nonlinear dependence on CAP was seen (P < 0.001), where
NPV increased from 66% at 200 dB/m to 81% at 350 dB/m and
where a noticeable increase in NPV begins at about 250 dB/m, Fig-
ure 4A. For NAFLD/NASH alone, 211 patients can be analysed, who
have CAP values compatible with presence of steatosis ( > 200 dB/
m). NPV was 79% for 200 dB/m and 85% at 350 dB/m, but the CAP
dependence was not significant (P = 0.33), Figure S4A. Fibrosis can be
ruled out more effectively by choosing cut-offs that require high sensi-
tivity (Table S1), but this results in values that exclude most patients,
eg, in our data only 342 patients (17%) are below this cut-off. Using
ALT and AST optimised cut-offs, 781 (38%) of the patients are below
the cut-off and, at our prevalence, we find an NPV of 70%.
To rule out cirrhosis in our cohort, NPV is 98% (97% to 98%).
There is a nonsignificant dependence on CAP (P = 0.21), which
remains high for all CAP values, eg, it is 97.8% at 200 dB/m and 98.2%
at 350 dB/m, Figure 4B. Even for those above the optimised cut-off, a
large proportion of patients may not have cirrhosis. Introducing speci-
ficity-optimised cut-offs results in a “grey zone” for LSM values in
100 150 200 250 300 350 4000.
00.
20.
40.
60.
81.
00.
00.
20.
40.
60.
81.
0
Controlled attenuation parameter (dB/m)
100 150 200 250 300 350 400Controlled attenuation parameter (dB/m)
Pro
babi
lity
of c
orre
ct
clas
sific
atio
n (F
0−F
1 vs
F2−
F4)
Fibrosis estimation with TE (aetiology specific cut-offs)
Correctly classifiedIncorrectly classifiedLogistic regressionSmoothing spline
All patients(A)
(B)
Pro
babi
lity
of c
orre
ct
clas
sific
atio
n (F
0−F
1 vs
F2−
F4)
Fibrosis estimation with TE(cut-off 8.4 kPa)
Correctly classifiedIncorrectly classifiedLogistic regressionSmoothing spline
NAFLD/NASH patients
F IGURE 3 Impact of ControlledAttenuation Parameter on liver stiffnessbased fibrosis classification. NAFLD/NASH,non-alcoholic fatty liver disease/steatohepatitis, TE, transient elastography
KARLAS ET AL. | 993

which the NPV for ruling out cirrhosis is 80% and increases from 77%
at a CAP value of 250 dB/m, but reaches 85% for 350 dB/m.
The NPV for ruling out advanced fibrosis (F3-4) is 94% (93% to
95%) in our cohort. Although the CAP dependence is nominally sig-
nificant (P = 0.018), NPV changes only from 94.3% at a CAP value
of 200 dB/m to 95.5% at 350 dB/m.
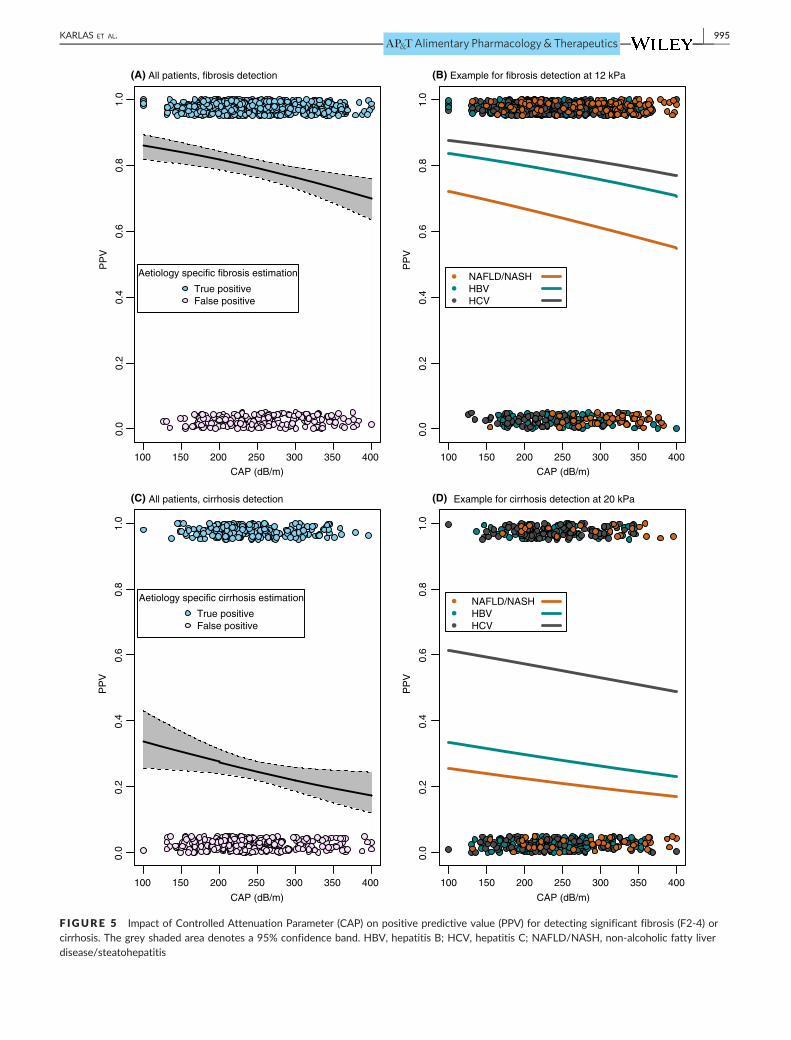
3.5 | Effect of CAP on detecting fibrosis/cirrhosisusing LSM
In another common scenario, LSM is used to “diagnose” fibrosis or
cirrhosis and one must contend with false-positive findings. This too
is highly dependent on prevalence. PPV for detecting fibrosis was
found to be 79% (76% to 82%) at the observed prevalence of 50%,
but falls dramatically to 55% and 29% at a prevalence of 25% and
10% respectively. There is a significant linear dependence on CAP
(P < 0.001) with PPV of 82% for 200 dB/m and 74% at 350 dB/m,
Figure 5A. For NAFLD/NASH patients, the CAP dependence is not
significant (P = 0.33) although PPV falls a similar amount from 72%
to 63% when progressing from 200 to 350 dB/m.
Cirrhosis detection for all aetiologies has a PPV of only 40% (36
to 44)% and does not depend significantly on CAP (P = 0.21) with
PPV changing from 42% to 36% at 200 and 350 dB/m respectively,
Figure 5C. Examples of aetiology-specific PPV at high LSM values
can be found in Figure 5B and 5D. These results do not change
meaningfully if patients with BMI > 30 kg/m2 are excluded or if
models with BMI as a covariate are considered. PPV for detecting
F3-4 is only 53% (50% to 57%) in our cohort.
Even specificity-optimised cut-offs for cirrhosis, which can be as
high as 17.7 kPa for HBV patients (Table S1), result in PPV of 55%
for detecting cirrhosis and is almost independent of CAP, ranging
from 55% at a value of 200 dB/m to 53% at 350 dB/m. Considering
patients with LSM values above the ALT and AST optimised cut-off
for fibrosis and below the specificity cut-off for cirrhosis, the PPV
100
(B)
(A)
150 200 250 300 350 400
0.0
0.2
0.4
0.6
0.8
1.0
CAP (dB/m)
100 150 200 250 300 350 400
CAP (dB/m)
NP
V
Fibrosis estimation with TE (aetiology specific cut-offs)
True negativeFalse negative
All patients, fibrosis estimation0.
00.
20.
40.
60.
81.
0
NP
V
Cirrhosis estimation with TE (aetiology specific cut-offs)
True negativeFalse negative
All patients, cirrhosis estimation
F IGURE 4 Impact of ControlledAttenuation Parameter (CAP) on negativepredictive value (NPV) for ruling outsignificant fibrosis (F2-4) or cirrhosis. Thegrey shaded area denotes a 95%confidence band. TE, transientelastography
994 | KARLAS ET AL.
100 150 200 250 300 350 400
0.0
0.2
0.4
0.6
0.8
1.0
(A) (B)
(C) (D)
CAP (dB/m)
100 150 200 250 300 350 400
CAP (dB/m)
100 150 200 250 300 350 400
CAP (dB/m)
100 150 200 250 300 350 400
CAP (dB/m)
PP
V
0.0
0.2
0.4
0.6
0.8
1.0
PP
V
0.0
0.2
0.4
0.6
0.8
1.0
PP
V
0.0
0.2
0.4
0.6
0.8
1.0
PP
V
Aetiology specific fibrosis estimation
True positiveFalse positive
All patients, fibrosis detection
NAFLD/NASHHBV HCV
Example for fibrosis detection at 12 kPa
Aetiology specific cirrhosis estimation
True positiveFalse positive
All patients, cirrhosis detection
NAFLD/NASHHBV HCV
Example for cirrhosis detection at 20 kPa
F IGURE 5 Impact of Controlled Attenuation Parameter (CAP) on positive predictive value (PPV) for detecting significant fibrosis (F2-4) orcirrhosis. The grey shaded area denotes a 95% confidence band. HBV, hepatitis B; HCV, hepatitis C; NAFLD/NASH, non-alcoholic fatty liverdisease/steatohepatitis
KARLAS ET AL. | 995

for detecting significant fibrosis is 68%. It ranges from 71% for a
CAP value of 200 dB/m to 62% for a value of 350 dB/m.
3.6 | Diagnostic Flowchart using LSM andaccounting for aetiology, ALT, AST and CAP
The above results suggest that LSM be optimised for ruling out cir-
rhosis and, if possible, significant fibrosis, but imply that “ruling in”
will be of limited value. Results can be improved by using specificity-
optimised cut-offs and the resulting flowchart is presented in Fig-
ure 6. The precise performance will depend strongly on prevalence,
but for our cohort, this strategy implied 98% NPV for ruling out cir-
rhosis, but only 55% PPV for “fairly probable” cirrhosis. The chance
of cirrhosis is “quite low” (80% NPV) in a further group with LSM in
a grey zone. The chance of significant fibrosis is also “low” (NPV of
70%) for patients below the ALT and AST optimised cut-off. Neither
fibrosis nor cirrhosis can be ruled in with acceptable certainties (PPV
of 68% or 55%), despite very high, specificity-optimised cut-offs.
The particular values of NPV and PPV will depend on prevalence,
but the qualitative statements in the flowchart hold for a wide range
of scenarios. A very similar picture emerges when ruling out
advanced fibrosis, and the corresponding flowchart is presented in
Figure S6.
4 | DISCUSSION
This paper provides aetiology-specific cut-offs from a very large
cohort and confirms that LSM is a highly accurate tool for ruling out
cirrhosis. This holds independent of the CAP value. Significant fibro-
sis can be ruled out with sufficient certainty only in populations with
low prevalence and consideration of CAP can improve the negative
predictive value slightly. The accuracy of LSM for detecting signifi-
cant fibrosis, advanced fibrosis or cirrhosis is limited, due to high
false-positive rates, which is especially true for large CAP values.
These results have been summarised in diagnostic flowcharts to
facilitate interpretation of LSM in clinical practice.
There is growing pressure to develop reliable tools for screen-
ing programs in large populations aimed at detecting fibrosis.22 The
current standard for non-invasive assessment is vibration-controlled
High CAP values imply somewhat lower risk of fibrosis/cirrhosis.
Slight Relevance of CAP for LSM interpretation Negligible
Optimal cut-off:
• NAFLD 8.4 kPa
• HBV 8.0 kPa*
• HCV 6.6 kPa*
Liver stiffness measurement
ALT/AST < 5x ULN
Cirrhosis?
Optimal cut-off:• NAFLD 13.2 kPa• HBV 10.8 kPa• HCV 10.2 kPa
Ruled out
Significant fibrosis (≥F2)?
Cut-off for90% specificity:• NAFLD 14.6 kPa• HBV 17.7 kPa*• HCV 13.8 kPa*
Really cirrhosis ?
Fairly probableChances quite low
Further evaluation unavoidable.
Consider ALT/AST elevation.
Use independent non-invasive
test or biopsy.
Further evaluationif clinical doubt.
Further evaluation
recommended:
chance of cirrhosis ~55%
depending on prevalence.
Chances low Fairly probable
Rec
omm
ende
d
use
of L
SM
Fur
ther
pos
sibl
e
use
of L
SM
Pot
entia
l
use
of C
AP
Possible
F IGURE 6 Proposed diagnostic flowchart for liver stiffness measurements taking into account aetiology, transaminase values and CAP. Forthe relevant fibrosis cut-off, the sum of sensitivity and specificity (Youden index) were optimised, whereas for positive predictive values (PPV),90% specificity was required. The asterisk indicates that elevated and normal ALT/AST for HBV/HCV were considered and the lower (higher)cut-off for NPV (PPV) was chosen. See Table S1 for more details on cut-offs. ALT, alanine transaminase; AST, aspartate transaminase; HBV,hepatitis B; HCV, hepatitis C; NAFLD, non-alcoholic fatty liver disease
996 | KARLAS ET AL.

transient elastography, which has already been adopted by interna-
tional guidelines.1,2,7,23 Accurate measurement and interpretation
rely on consideration of aetiology, inflammatory activity and other
covariates,3 whereas the relevance of steatosis has been a matter
of debate.10,13-15,24,25 In a large, biopsy controlled NAFLD cohort,
Petta et al concluded that CAP should be used to gauge the risk
of false-positive LSM results and propose a diagnostic flowchart.13
We show that steatosis does indeed affect mean LSM values
slightly and confirm that CAP can be used as a surrogate in inter-
preting LSM measurements, but qualify the recommendations from
Petta et al in important ways. For one thing, CAP does not suffi-
ciently help increase the probability of correct fibrosis classification
for clinical use. Moreover, when focusing on ruling out cirrhosis,
consideration of CAP is unnecessary, but does indeed lead to
slightly higher negative predictive values for ruling out significant
fibrosis. More specifically, aetiology, prevalence and CAP should
be taken into account, particularly above a threshold of about
250 dB/m, which also arose as an optimal cut-off for detecting
steatosis in this cohort.16
We choose to focus on positive and negative predictive values
(PPV/NPV), since these are what the clinician needs to act upon,
and note the prevalence dependence inherent in them. Other mea-
sures of diagnostic precision such as likelihood ratios and areas
under the curve are also precisely interpretable, but do not have
such immediate bearing on the clinical decision to be made: the PPV
(NPV) is precisely the probability that the patient is sick (healthy),
given the test result. In the context of LSM, false-positive results
lead to reduced PPV, which indeed falls with increasing CAP, but is
never high enough to warrant a definite diagnosis. Thus, CAP will
not greatly influence the consequences of a positive/increased LSM
result, since a positive fibrosis or cirrhosis diagnosis cannot be made
on the basis of LSM alone.
The low PPV we observed despite having excluded advanced
obesity and patients with severe hepatic inflammation may seem
surprising at first. However, a comprehensive meta-analysis26
demonstrated that diagnostic performance for detection of cirrhosis
depends significantly on aetiology and country of origin and found
an AUC of 0.94 and optimal cut-off, sensitivity and specificity of
13 kPa, 0.92 and 0.89 respectively, implying a PPV of 51% at our
observed prevalence of 11%. This meta-analysis contained primarily
HCV patients and its results concur quite well with our correspond-
ing AUC of 0.94 and optimal sensitivity and specificity of 0.89 and
0.87. The cut-off chosen depends greatly on choice of optimisation
and we recommended 10.2 kPa for ruling out cirrhosis in HCV
patients, but 13.8 kPa for “ruling it in”. A non-negligible proportion
of false-positive findings seems to be inherent to vibration-con-
trolled transient elastography (Figure S5), which becomes especially
relevant at low prevalence, eg, in the screening setting. This impor-
tant observation also holds for F0-F2 vs F3-F4 in a recently pub-
lished diagnostic flowchart that notes a “low risk of F3-F4 false
positive results” compared to higher risks at higher CAP values, but
also provides a PPV of only 76% even for the lowest CAP tertile.13
A recent study looking at various combinations of non-invasive
methods found comparable PPV for detecting F3-F4.27 The low PPV
indicates the need to develop and use a combination of methods to
detect fibrosis and (even more so) cirrhosis that rely on complemen-
tary and distinct principles.27-30
NPV could be increased for ruling out fibrosis by choosing sensi-
tivity optimised cut-offs. This, however, would result in extremely
low cut-offs well into the normal range, would only include a small
fraction of the population of interest and would still not provide
extremely high NPVs. Hence, we chose a less extreme optimisation
strategy when choosing the respective cut-offs. No universally
accepted cut-offs are available3 and given the size of our cohort, it
was considered appropriate to use those we determined despite
slight overestimations regarding clinical performance. For the basic
approach of the flowchart proposed, the precise choice of cut-off
will have only minor consequences.
An important strength of the current analysis is the well-charac-
terised biopsy controlled LSM cohort, which is one of the largest
whatsoever. Data come from many countries around the world com-
prising three major aetiologies of chronic liver disease: NAFLD, HBV
and HCV. Patients at risk of unreliable results were excluded, as
were invalid measurements. Care was taken to ensure that published
evidence was not artificially “enhanced” by basing conclusions on
those same patients. The cut-offs derived from this large cohort of
individual data with rigorous exclusion criteria confirm results from
many smaller studies.
One weaknesses of the analysis is that it relies on a database
collected for assessing CAP alone and not LSM. As such, it is not a
meta-analysis, since studies were not selected for the purposes of
this analysis, but for the evaluation of CAP. On the other hand, this
suggests that the data are more representative of clinical routine
than is to be expected from a dedicated “LSM study”. However, the
sparse data available for aetiologies such as alcoholic and auto-
immune/cholestatic liver disease mean that a proportion of patients
are underrepresented. This is a void in research that should be filled,
though care must be taken to account for specific LSM characteris-
tics of differing aetiologies. Optimising cut-offs and applying them to
one and the same cohort is known to lead to overoptimistic esti-
mates. Here, we applied the strategy of adopting a wide “grey zone”,
so as to have good PPV and NPV, and do not rely on precise optimi-
sation. An inherent fact when collecting individual patient data
worldwide is that histological evaluation and biopsy quality may dif-
fer between sites as was pointed out in the primary paper, which
may be even more relevant in fibrosis staging and requires conver-
sion between scoring systems.16 This and further limitations can and
have been treated as centre effects in statistical models, but suffer
from uncertainties regarding what can be attributed to differences
between centres and what between aetiologies. Spectrum bias may
also imply that the analyses here are appropriate given current medi-
cal practice, but may have to be reconsidered in a screening setting
or in situations in which the case-mix differs notably from what was
available in our data. An LSM cut-off is not strictly speaking neces-
sary, and much information can be gained by taking into account the
precise value of a measurement, see eg, Thiele et al31 Such analyses
KARLAS ET AL. | 997

go beyond the scope of this paper, however, which orients itself to
clinical routine. CAP may be considered an imperfect surrogate for
steatosis modulated by further metabolic factors16 with the advan-
tage of being a by-product of the LSM process. However, it can also
be regarded as a measure on its own, attaining value through its pre-
dictive power as opposed to its biological interpretation. Recently,
magnetic resonance (MR) elastography and spectroscopy have been
shown to be accurate alternatives for non-invasive fibrosis staging
and steatosis grading.32-34 We were unable to take this technology
into account because of lack of data at the time our database was
created in 2015. Beyond the technical precision of MR methods,
questions regarding clinical relevance, including the effects of preva-
lence and the efficient use of such resources still need to be
answered.35,36 The current analysis only included data from vibra-
tion-controlled transient elastography as opposed to further ultra-
sound-based elastography methods, but these lack an established
means of quantifying steatosis.3 Our database only includes data
from the M-probe, which thus also restricts the BMI range that can
be considered. Moreover, data were not always available on skin to
liver capsule distance, which could be a relevant independent covari-
ate. Although the XL-probe enables examination of obese patients
for LSM,37 there are not yet sufficient data available nor is there
consensus regarding cut-offs to enable an IPDMA of comparable
scope at this point in time. In addition, XL-probe CAP was intro-
duced only recently38 and thus lacks sufficient evaluation. However,
the first comparisons indicate that the probes hardly differ regarding
CAP.39
Liver stiffness is a single number that cannot possibly replace a
multi-dimensional clinical examination. However, after taking into
account covariates, LSM provides an important guide for taking clini-
cal decisions, but the low PPV that prevails demonstrates that “false-
positives” findings are always an issue, regardless of how high the
LSM value may be. Furthermore, liver stiffness has been shown to
provide prognostic information beyond fibrosis staging alone1 imply-
ing that it is not always sound to refer to the histological staging
and grading as the gold standard.40
In conclusion, liver stiffness measurement values below aetiol-
ogy-specific cut-offs are very useful for ruling out cirrhosis and
advanced fibrosis and can help rule out significant fibrosis. High val-
ues alone are never sufficiently predictive to diagnose cirrhosis or
even significant fibrosis. Controlled Attenuation Parameter values
can be used to improve the interpretation of liver stiffness measure-
ment results only slightly. Our data indicate that CAP-guided LSM
will not be of major clinical relevance in routine practice.
ACKNOWLEDGEMENTS
Declaration of personal interests: TK, DP, VK and JW received an
unrestricted grant from Echosens, Paris France. MS is an Echosens
scientific employee in the R&D department, but contributed in her
role as scientist and author of papers in this meta-analysis. In partic-
ular, MS did not disclose scientific contents of this work to her
employer. GF and CF were provided a Fibroscan device for research
purposes. VW, GW and SM received lecture fees from Echosens. No
other authors have conflicts of interest.
Declaration of funding interests: This project is supported in part
by the German Federal Ministry of Education and Research (BMBF,
FKZ 01EO1001). The company Echosens provided funding, but does
not have access to the data, did not influence analyses and did not
receive the manuscript before submission.
AUTHORSHIP
Guarantor of the article: David Petroff is acting as the submission’s
guarantor, taking responsibility for the integrity of the work as a
whole, from inception to published article.
Author contributions: TK, DP, VK, JW, study concept and
design, collected data from participating centres, data review and
analysis, interpretation of data, drafting of the manuscript, statisti-
cal analysis, obtained funding; MS, study concept and design,
drafting of protocol, coded and provided data, interpretation of
data, statistical advice, critical revision of the manuscript; PB,
drafting of protocol, interpretation of data, critical revision of the
manuscript; All remaining authors, drafting of protocol, coded and
provided data, interpretation of data, critical revision of the manu-
script. All authors have approved the final version of the article,
including the authorship list.
ORCID
T. Karlas http://orcid.org/0000-0002-8109-8526
D. Petroff http://orcid.org/0000-0002-6916-1465
V. de L�edinghen http://orcid.org/0000-0001-6414-1951
G. Ferraioli http://orcid.org/0000-0002-6344-697X
W.-K. Chan http://orcid.org/0000-0002-9105-5837
V. W.-S. Wong http://orcid.org/0000-0003-2215-9410
S. K. Sarin http://orcid.org/0000-0002-0544-5610
REFERENCES
1. European Association for Study of Liver. Asociacion Latinoamericana
para el Estudio del Higado.. EASL-ALEH Clinical Practice Guidelines:
non-invasive tests for evaluation of liver disease severity and prog-
nosis. J Hepatology. 2015;63:237-264. https://doi.org/10.1016/j.jhe
p.2015.04.006
2. Singh S, Muir AJ, Dieterich DT, Falck-Ytter YT. American gastroen-
terological association institute technical review on the role of elas-
tography in chronic liver diseases. Gastroenterology. 2017;152:1544-
1577. https://doi.org/10.1053/j.gastro.2017.03.016
3. Dietrich CF, Bamber J, Berzigotti A, et al. EFSUMB guidelines and
recommendations on the clinical use of liver ultrasound elastography,
Update 2017 (Long Version). Ultraschall Med. 2017;38:e16-e47.
https://doi.org/10.1055/s-0043-103952
4. Arena U, Lupsor Platon M, Stasi C, et al. Liver stiffness is influenced
by a standardized meal in patients with chronic hepatitis C virus at
different stages of fibrotic evolution. Hepatology. 2013;58:65-72.
https://doi.org/10.1002/hep.26343
5. Chalasani N, Younossi Z, Lavine JE, et al. The diagnosis and manage-
ment of non-alcoholic fatty liver disease: practice guideline by the
998 | KARLAS ET AL.

American Association for the study of liver diseases, American Col-
lege of Gastroenterology, and the American Gastroenterological
Association. Hepatology. 2012;55:2005-2023. https://doi.org/10.
1002/hep.25762
6. Everhart JE, Lok AS, Kim H, et al. Weight-related effects on disease
progression in the hepatitis C antiviral long-term treatment against
cirrhosis trial. Gastroenterology. 2009;137:549-557. https://doi.org/
10.1053/j.gastro.2009.05.007
7. European Association for the Study of Diabetes (EASD); European
Association for the Study of Obesity (EASO). EASL–EASD–EASO.
EASL–EASD–EASO Clinical Practice Guidelines for the management
of non-alcoholic fatty liver disease. J Hepatol. 2016;64:1388-1402.
https://doi.org/10.1016/j.jhep.2015.11.004.
8. Karlas T, Wiegand J, Berg T. Gastrointestinal complications of obe-
sity: non-alcoholic fatty liver disease (NAFLD) and its sequelae. Best
Pract Res Clin Endocrinol Metab. 2013;27:195-208. https://doi.org/
10.1016/j.beem.2013.02.002
9. Boursier J, de Ledinghen V, Sturm N, et al. Precise evaluation of liver
histology by computerized morphometry shows that steatosis influ-
ences liver stiffness measured by transient elastography in chronic
hepatitis C. J Gastroenterol. 2014;49:527-537. https://doi.org/10.
1007/s00535-013-0819-9
10. Petta S, Maida M, Macaluso FS, et al. The severity of steatosis influ-
ences liver stiffness measurement in patients with nonalcoholic fatty
liver disease. Hepatology. 2015;62:1101-1110. https://doi.org/10.
1002/hep.27844
11. Macaluso FS, Maida M, Camm�a C, et al. Steatosis affects the perfor-
mance of liver stiffness measurement for fibrosis assessment in
patients with genotype 1 chronic hepatitis C. J Hepatol.
2014;61:523-529. https://doi.org/10.1016/j.jhep.2014.04.045
12. Berzigotti A. Getting closer to a point-of-care diagnostic assessment
in patients with chronic liver disease: controlled attenuation parame-
ter for steatosis. J Hepatol. 2014;60:910-912. https://doi.org/10.
1016/j.jhep.2014.01.017
13. Petta S, Wai-Sun Wong V, Camma C, et al. Improved noninvasive
prediction of liver fibrosis by liver stiffness measurement in patients
with nonalcoholic fatty liver disease accounting for controlled atten-
uation parameter values. Hepatology (Baltimore, MD). 2017;65:1145-
1155. https://doi.org/10.1002/hep.28843
14. Eddowes P, Sasso M, Fournier C, Vuppalanchi R, Newsome P.
Steatosis and liver stiffness measurements using transient elastogra-
phy. Hepatology. 2016;64:700. https://doi.org/10.1002/hep.28515
15. Karlas T, Beer S, Babel J, et al. Do we need controlled attenuation
parameter adjustment for fibrosis estimation in nonalcoholic fatty
liver disease patients? Hepatology. 2017;65:2126-2128. https://doi.
org/10.1002/hep.29067
16. Karlas T, Petroff D, Sasso M, et al. Individual patient data meta-ana-
lysis of controlled attenuation parameter (CAP) technology for
assessing steatosis. J Hepatol. 2017;66:1022-1030. https://doi.org/
10.1016/j.jhep.2016.12.022
17. Bedossa P. The French Metavir Cooperative Study Group. Intraob-
server and interobserver variations in liver biopsy interpretation in
patients with chronic hepatitis C. Hepatology. 1994;20:15-20.
https://doi.org/10.1002/hep.1840200104
18. Kleiner DE, Brunt EM, vanNatta M, et al. Design and validation of a
histological scoring system for nonalcoholic fatty liver disease. Hepa-
tology (Baltimore, MD). 2005;41:1313-1321. https://doi.org/10.
1002/hep.20701
19. Ishak K, Baptista A, Bianchi L, et al. Histological grading and staging
of chronic hepatitis. J Hepatol. 1995;22:696-699. PMID:7560864.
20. R Core Team. R: A language and environment for statistical computing.
Vienna, Austria: R Foundation for Statistical Computing; 2017.
21. Robin X, Turck N, Hainard A, et al. pROC: an open-source package
for R and S+ to analyze and compare ROC curves. BMC
Bioinformatics. 2011;12:77. PMID:21414208; https://doi.org/10.
1186/1471-2105-12-77
22. Gin�es P, Graupera I, Lammert F, et al. Screening for liver fibrosis in
the general population: a call for action. The Lancet Gastroenterology
& Hepatology. 2016;1:256-260. https://doi.org/10.1016/S2468-
1253(16)30081-4
23. Shiha G, Ibrahim A, Helmy A, et al. Asian-Pacific Association for the
Study of the Liver (APASL) consensus guidelines on invasive and
non-invasive assessment of hepatic fibrosis: a 2016 update. Hepatol
Int. 2017;11:1-30. PMID:27714681; https://doi.org/10.1007/
s12072-016-9760-3
24. Wong GL-H, Wong VW-S, Chan HL-Y. Is transient elastography
inaccurate in chronic hepatitis B and non-alcoholic fatty liver dis-
ease? J Hepatology. 2011;55:497; author reply 498;
PMID:21251939; https://doi.org/10.1016/j.jhep.2010.12.035
25. Gaia S, Carenzi S, Barilli AL, et al. Reliability of transient elastogra-
phy for the detection of fibrosis in non-alcoholic fatty liver disease
and chronic viral hepatitis. J Hepatol. 2011;54:64-71. https://doi.
org/10.1016/j.jhep.2010.06.022
26. Friedrich-Rust M, Ong MF, Martens S, et al. Performance of tran-
sient elastography for the staging of liver fibrosis: a meta-analysis.
Gastroenterology. 2008;134:960-974. PMID:18395077; https://doi.
org/10.1053/j.gastro.2008.01.034.
27. Petta S, Wong VW-S, Camm�a C, et al. Serial combination of non-
invasive tools improves the diagnostic accuracy of severe liver fibro-
sis in patients with NAFLD. Aliment Pharmacol Ther. 2017;46:617-
627. PMID:28752524; https://doi.org/10.1111/apt.14219.
28. Cales P, Boursier J, Lebigot J, et al. Liver fibrosis diagnosis by blood
test and elastography in chronic hepatitis C: agreement or combina-
tion? Aliment Pharmacol Ther. 2017;45:991-1003; PMID:28164327;
https://doi.org/10.1111/apt.13954.
29. Blond E, Disse E, Cuerq C, et al. EASL-EASD-EASO clinical practice
guidelines for the management of non-alcoholic fatty liver disease in
severely obese people: do they lead to over-referral? Diabetologia.
2017; PMID:28352941; https://doi.org/10.1007/s00125-017-4264-
9.
30. Tilg H. How to approach a patient with nonalcoholic fatty liver dis-
ease. Gastroenterology. 2017;153:345-349. PMID:28647352;
https://doi.org/10.1053/j.gastro.2017.06.016.
31. Thiele M, Detlefsen S, Sevelsted Moller L, et al. Transient and 2-
dimensional shear-wave elastography provide comparable assess-
ment of alcoholic liver fibrosis and cirrhosis. Gastroenterology.
2016;150:123-133. PMID:26435270; https://doi.org/10.1053/j.gas
tro.2015.09.040.
32. Raptis DA, Fischer MA, Graf R, et al. MRI: the new reference stan-
dard in quantifying hepatic steatosis? Gut. 2011;61:117-127.
https://doi.org/10.1136/gutjnl-2011-300155
33. Imajo K, Kessoku T, Honda Y, et al. Magnetic resonance imaging
more accurately classifies steatosis and fibrosis in patients with non-
alcoholic fatty liver disease than transient elastography. Gastroen-
terology. 2016;150:626-637.e7; PMID:26677985; https://doi.org/10.
1053/j.gastro.2015.11.048.
34. Park CC, Nguyen P, Hernandez C, et al. Magnetic resonance elastog-
raphy vs transient elastography in detection of fibrosis and noninva-
sive measurement of steatosis in patients with biopsy-proven
nonalcoholic fatty liver disease. Gastroenterology. 2017;152:598-
607.e2. https://doi.org/10.1053/j.gastro.2016.10.026.
35. Karlas T, Petroff D. Is magnetic resonance imaging really more accu-
rate for classifying steatosis than controlled attenuation parameter?
Gastroenterology. 2016;in press.
36. Karlas T, Petroff D, Wiegand J. Collaboration, not competition: the
role of magnetic resonance, transient elastography, and liver biopsy
in the diagnosis of nonalcoholic fatty liver disease. Gastroenterology.
2017;152:479-481. https://doi.org/10.1053/j.gastro.2016.12.013
KARLAS ET AL. | 999

37. Kumagai E, Korenaga K, Korenaga M, et al. Appropriate use of vir-
tual touch quantification and FibroScan M and XL probes according
to the skin capsular distance. J Gastroenterol. 2016;51:496-505.
PMID:26463734; https://doi.org/10.1007/s00535-015-1127-3.
38. Sasso M, Audiere S, Kemgang A, et al. Liver steatosis assessed by
controlled attenuation parameter (CAP) measured with the XL probe
of the fibroscan: a pilot study assessing diagnostic accuracy. Ultra-
sound Med Biol. 2016;42:92-103. PMID:26386476; https://doi.org/
10.1016/j.ultrasmedbio.2015.08.008.
39. de L�edinghen V, Hiriart J-B, Vergniol J, Merrouche W, Bedossa P,
Paradis V. Controlled Attenuation Parameter (CAP) with the XL
Probe of the Fibroscan: a Comparative Study with the M Probe and
Liver Biopsy. Dig Dis Sci. 2017;62:2569-2577.
40. Bedossa P, Carrat F. Liver biopsy: the best, not the gold standard. J
Hepatol. 2009;50:1-3. PMID:19017551; https://doi.org/10.1016/j.
jhep.2008.10.014.
SUPPORTING INFORMATION
Additional Supporting Information will be found online in the
supporting information tab for this article.
How to cite this article: Karlas T, Petroff D, Sasso M, et al.
Impact of controlled attenuation parameter on detecting
fibrosis using liver stiffness measurement. Aliment Pharmacol
Ther. 2018;47:989–1000. https://doi.org/10.1111/apt.14529
APPENDIX 1
THE NAMES AND FULL ADDRESSES OF THEINTERNATIONAL CAP-IPDMA GROUP
Thomas Karlas, Division of Gastroenterology and Rheumatology,
University Hospital Leipzig, Leipzig, Germany; David Petroff, Clinical
Trial Centre, University of Leipzig, Leipzig, Germany and IFB Adipos-
ityDiseases, University of Leipzig, Leipzig, Germany; Magali Sasso, R &
D Department, Echosens, Paris, France; Jian-Gao Fan, Center for Fatty
Liver, Department of Gastroenterology, XinHua Hospital, Shanghai
Jiao Tong University School of Medicine, Shanghai, China; Yu-Qiang
Mi, Research Institute of Liver Diseases, Tianjin Second People’s
Hospital, Tianjin, China; Victor de L�edinghen, Centre d’Investigation de
la Fibrose h�epatique, Hopital Haut-L�eveque, Centre Hospitalo-Univer-
sitaire de Bordeaux, Pessac, France; Manoj Kumar, Department of
Hepatology, Institute of Liver and Biliary Sciences, New Delhi, India;
Monica Lupsor-Platon, Department of Medical Imaging, Iuliu Hatie-
ganu University of Medicine and Pharmacy, Regional Institute of
Gastroenterology and Hepatology “Prof. Dr. Octavian Fodor”,
Cluj-Napoca, Romania; Kwang-Hyub Han, Department of Internal
Medicine, Yonsei University College of Medicine, Seoul, Korea; Ana C
Cardoso, HUCFF - Universidade Federal do Rio de Janeiro and Depart-
ment of Hepatology and INSERM U773-CRB3, Hopital Beaujon,
APHP, University of Paris 7, Clichy, France; Giovanna Ferraioli,
Department of Infectious Diseases, Fondazione IRCCS Policlinico San
Matteo, Medical School University of Pavia, Pavia, Italy; Wah-Kheong
Chan, Gastroenterology and Hepatology Unit, Department of Medi-
cine, Faculty of Medicine, University of Malaya, Kuala Lumpur, Malay-
sia; Vincent Wai-Sun Wong, Department of Medicine and
Therapeutics, The Chinese University of Hong Kong, Hong Kong;
Robert P Myers, Liver Unit, Division of Gastroenterology and Hepatol-
ogy, Department of Medicine, University of Calgary, Calgary, Alberta,
Canada; Kazuaki Chayama, Departments of Gastroenterology and
Metabolism, Hiroshima University Hospital, Hiroshima, Japan; Mireen
Friedrich-Rust, Department of Internal Medicine, J.W. Goethe-Univer-
sity Hospital, Frankfurt, Germany; Michel Beaugrand, Department of
Hepatology, Hopital Jean Verdier, Bondy, France; Feng Shen, Center
for Fatty Liver, Department of Gastroenterology, XinHua Hospital,
Shanghai Jiao Tong University School of Medicine, Shanghai, China;
Jean-Baptiste Hiriart, Centre d’Investigation de la Fibrose h�epatique,
Hopital Haut-L�eveque, Centre Hospitalo-Universitaire de Bordeaux,
Pessac, France; Shiv K Sarin, Department of Hepatology, Institute of
Liver and Biliary Sciences, New Delhi, India; Radu Badea, Department
of Medical Imaging, Iuliu Hatieganu University of Medicine and Phar-
macy, Regional Institute of Gastroenterology and Hepatology “Prof.
Dr. Octavian Fodor”, Cluj-Napoca, Romania; Hye Won Lee, Depart-
ment of Internal Medicine, Yonsei University College of Medicine,
Seoul, Korea; Patrick Marcellin, Department of Hepatology and
INSERM U773-CRB3, Hopital Beaujon, APHP, University of Paris 7,
Clichy, France; Carlo Filice, Department of Infectious Diseases, Fon-
dazione IRCCS Policlinico San Matteo, Medical School University of
Pavia, Pavia, Italy; Sanjiv Mahadeva, Gastroenterology and Hepatology
Unit, Department of Medicine, Faculty of Medicine, University of
Malaya, Kuala Lumpur, Malaysia; Grace Lai-Hung Wong, Department
of Medicine and Therapeutics, The Chinese University of Hong Kong,
Hong Kong; Pam Crotty, Liver Unit, Division of Gastroenterology and
Hepatology, Department of Medicine, University of Calgary, Calgary,
Alberta, Canada; Keiichi Masaki, Departments of Gastroenterology
and Metabolism, Hiroshima University Hospital, Hiroshima, Japan;
Joerg Bojunga, Department of Internal Medicine, J.W. Goethe-Univer-
sity Hospital, Frankfurt, Germany; Pierre Bedossa, Department of
Hepatology, Hopital Jean Verdier, Bondy, France and Department of
Pathology, Physiology and Imaging, University Paris Diderot, Paris,
France; Volker Keim, Division of Gastroenterology and Rheumatology,
University Hospital Leipzig, Leipzig, Germany; Johannes Wiegand,
Division of Gastroenterology and Rheumatology, University Hospital
Leipzig, Leipzig, Germany.
1000 | KARLAS ET AL.