Impact of contouring methods on pre-treatment and post ...
15
Nodari et al. EJNMMI Res (2021) 11:24 https://doi.org/10.1186/s13550-021-00766-x ORIGINAL RESEARCH Impact of contouring methods on pre-treatment and post-treatment dosimetry for the prediction of tumor control and survival in HCC patients treated with selective internal radiation therapy Guillaume Nodari 1* , Romain Popoff 1,2 , Jean Marc Riedinger 1 , Olivier Lopez 3 , Julie Pellegrinelli 3 , Inna Dygai‑Cochet 1 , Claire Tabouret‑Viaud 1 , Benoit Presles 2 , Olivier Chevallier 2,3 , Sophie Gehin 3 , Matthieu Gallet 1 , Marianne Latournerie 4 , Sylvain Manfredi 4 , Romaric Loffroy 2,3 , Jean Marc Vrigneaud 1,2† and Alexandre Cochet 1,2† Abstract Introduction: The aim of this study was to evaluate the impact of the contouring methods on dose metrics and their predictive value on tumor control and survival, in both situations of pre‑treatment and post‑treatment dosimetry, for patients with advanced HCC treated with SIRT. Methods: Forty‑eight patients who underwent SIRT between 2012 and 2020 were retrospectively included in this study. Target volumes were delineated using two methods: MRI‑based contours manually drawn by a radiologist and then registered on SPECT/CT and PET/CT via deformable registration (Pre‑C MRI and Post‑C MRI ), 99m Tc‑MAA‑SPECT and 90 Y‑microspheres‑PET 10% threshold contouring (Pre‑C SPECT and Post‑C PET ). The mean absorbed dose (Dm) and the minimal absorbed dose delivered to 70% of the tumor volume (D70) were evaluated with both contouring meth‑ ods; the tumor‑to‑normal liver uptake ratio (TNR) was evaluated with MRI‑based contours only. Tumor response was assessed using the mRECIST criteria on the follow‑up MRIs. Results: No significant differences were found for Dm and TNR between pre‑ and post‑treatment. TNR evaluated with radiologic contours (Pre‑C MRI and Post‑C MRI ) were predictive of tumor control at 6 months on pre‑ and post‑ treatment dosimetry (OR 5.9 and 7.1, respectively; p = 0.02 and 0.01). All dose metrics determined with both meth‑ ods were predictive of overall survival (OS) on pre‑treatment dosimetry, but only Dm with MRI‑based contours was predictive of OS on post‑treatment images with a median of 23 months for patients with a supramedian Dm versus 14 months for the others (p = 0.04). © The Author(s) 2021. Open Access This article is licensed under a Creative Commons Attribution 4.0 International License, which permits use, sharing, adaptation, distribution and reproduction in any medium or format, as long as you give appropriate credit to the original author(s) and the source, provide a link to the Creative Commons licence, and indicate if changes were made. The images or other third party material in this article are included in the article’s Creative Commons licence, unless indicated otherwise in a credit line to the material. If material is not included in the article’s Creative Commons licence and your intended use is not permitted by statutory regulation or exceeds the permitted use, you will need to obtain permission directly from the copyright holder. To view a copy of this licence, visit http://creativecommons.org/licenses/by/4.0/. Open Access *Correspondence: [email protected] † Jean Marc Vrigneaud and Alexandre Cochet have contributed equally to this work as co‑last authors 1 Department of Nuclear Medicine, Centre Georges‑François Leclerc, Dijon, France Full list of author information is available at the end of the article
Transcript of Impact of contouring methods on pre-treatment and post ...

Nodari et al. EJNMMI Res (2021) 11:24 https://doi.org/10.1186/s13550-021-00766-x
ORIGINAL RESEARCH
Impact of contouring methods on pre-treatment and post-treatment dosimetry for the prediction of tumor control and survival in HCC patients treated with selective internal radiation therapyGuillaume Nodari1* , Romain Popoff1,2, Jean Marc Riedinger1, Olivier Lopez3, Julie Pellegrinelli3, Inna Dygai‑Cochet1, Claire Tabouret‑Viaud1, Benoit Presles2, Olivier Chevallier2,3, Sophie Gehin3, Matthieu Gallet1, Marianne Latournerie4, Sylvain Manfredi4, Romaric Loffroy2,3, Jean Marc Vrigneaud1,2† and Alexandre Cochet1,2†
Abstract
Introduction: The aim of this study was to evaluate the impact of the contouring methods on dose metrics and their predictive value on tumor control and survival, in both situations of pre‑treatment and post‑treatment dosimetry, for patients with advanced HCC treated with SIRT.
Methods: Forty‑eight patients who underwent SIRT between 2012 and 2020 were retrospectively included in this study. Target volumes were delineated using two methods: MRI‑based contours manually drawn by a radiologist and then registered on SPECT/CT and PET/CT via deformable registration (Pre‑CMRI and Post‑CMRI),
99mTc‑MAA‑SPECT and 90Y‑microspheres‑PET 10% threshold contouring (Pre‑CSPECT and Post‑CPET). The mean absorbed dose (Dm) and the minimal absorbed dose delivered to 70% of the tumor volume (D70) were evaluated with both contouring meth‑ods; the tumor‑to‑normal liver uptake ratio (TNR) was evaluated with MRI‑based contours only. Tumor response was assessed using the mRECIST criteria on the follow‑up MRIs.
Results: No significant differences were found for Dm and TNR between pre‑ and post‑treatment. TNR evaluated with radiologic contours (Pre‑CMRI and Post‑CMRI) were predictive of tumor control at 6 months on pre‑ and post‑treatment dosimetry (OR 5.9 and 7.1, respectively; p = 0.02 and 0.01). All dose metrics determined with both meth‑ods were predictive of overall survival (OS) on pre‑treatment dosimetry, but only Dm with MRI‑based contours was predictive of OS on post‑treatment images with a median of 23 months for patients with a supramedian Dm versus 14 months for the others (p = 0.04).
© The Author(s) 2021. Open Access This article is licensed under a Creative Commons Attribution 4.0 International License, which permits use, sharing, adaptation, distribution and reproduction in any medium or format, as long as you give appropriate credit to the original author(s) and the source, provide a link to the Creative Commons licence, and indicate if changes were made. The images or other third party material in this article are included in the article’s Creative Commons licence, unless indicated otherwise in a credit line to the material. If material is not included in the article’s Creative Commons licence and your intended use is not permitted by statutory regulation or exceeds the permitted use, you will need to obtain permission directly from the copyright holder. To view a copy of this licence, visit http://creat iveco mmons .org/licen ses/by/4.0/.
Open Access
*Correspondence: [email protected]†Jean Marc Vrigneaud and Alexandre Cochet have contributed equally to this work as co‑last authors1 Department of Nuclear Medicine, Centre Georges‑François Leclerc, Dijon, FranceFull list of author information is available at the end of the article

Page 2 of 15Nodari et al. EJNMMI Res (2021) 11:24
IntroductionHepatocellular carcinoma (HCC) is the most common form of primary liver cancer, the sixth for cancer inci-dence and the fourth for cancer death worldwide [1]. Moreover, many patients are diagnosed at an advanced stage. Many treatments have been developed depending on the stage of the disease, ranging from surgery to radi-ofrequency ablation, transarterial chemoembolization (TACE), selective internal radiation therapy (SIRT) and systemic treatments [2].
SIRT with 90Y microspheres is an effective and safe option for the treatment of advanced hepatocellular car-cinoma (HCC), and its use is developing rapidly [3, 4]. This treatment is based on the fact that tumor vascu-larization is mainly arterial as opposed to hepatic vascu-larization. Several studies have reported the effectiveness of SIRT, with a good tumor response and safety profile. However, no superiority in terms of survival was found when compared with TACE or sorafenib [5–8].
As SIRT is a radiotherapy treatment approach, it is clear that dosimetry must be taken into account, as it has been shown that absorbed doses have a good correlation with tumor response or survival [9–13]. Moreover, per-sonalized predictive dosimetry is now an essential pre-requisite in SIRT to optimize absorbed dose delivery and find the optimal balance between efficacy and treatment-related complications [14]. Predictive dose metrics can be obtained on pre-therapeutic liver perfusion scanning performed after selective arterial injection of 99mTc-MAA (macro-aggregated albumin) [10, 15–17]. Absorbed dose actually delivered (post-treatment dosimetry) can be obtained with post-therapeutic 90Y-microspheres PET/CT imaging, provided that 90Y quantitative capabilities has been validated for the system used [18].
In both situations, as in all image-based dosimetric approaches, the choice of the contouring method may have a major influence on dose metrics [19].
There have been several approaches to delineate tar-get regions in the literature [20–24]. Most of them have been supporting the idea of delineating targeted regions directly on SPECT/CT or PET/CT images, trying to use the fusion between both images to have a good compro-mise between the scintigraphic (SPECT or PET) and the morphological volumes (CT) [13, 20, 21]. However, the tumor needs theoretically to be delineated on a high-res-olution and high-contrast image (contrast-enhanced MRI
or CT), whereas the voxel dosimetry is performed on the low-resolution scintigraphic images. But on one hand, truly morphological volumes are only available from diagnostic modalities (with contrast-enhanced possibili-ties) that are generally acquired at different time points within the course of treatment. And on the other hand, thresholding on counts is highly dependent on different characteristics in the image (contrast and volumes for example) but appears to be very simple to use in a clini-cal context [20, 21]. Our aim was to retrospectively study two different methods of contouring regions in order to assess their impact on tumor response and survival.
Materials and methodPatient’s characteristics and study protocolForty-eight patients with unresectable HCC treated in our institution with SIRT based on 90Y-microspheres injection from October 2012 to February 2020 were con-sidered for this retrospective study. Among them, 23 received 90Y glass microspheres (TheraSphere; Biocom-patibles UK Ltd., Surrey, England) and 25 received 90Y resin microspheres (SIR-Spheres; Sirtex Medical Limited, Sidney, Australia), depending on reimbursements nation-wide which have varied over the years.
The inclusion criteria were as follows: clinical indica-tion of SIRT decided by our institution’s multidisciplinary tumor board for palliative consideration, a contrast-enhanced MRI within 8 weeks prior to treatment, and lesions that could be unequivocally segmented on MRI images.
All patients underwent treatment-planning angiog-raphy combined with 99mTc-MAA injection (work-up procedure) in order to estimate the lung shunt fraction, the targeting of the future treatment, and the activity of 90Y-microspheres to inject. This activity was either deter-mined with the body surface area (BSA) model, the parti-tion model (PM), or the vendor dosimetric model, using the 99mTc-MAA SPECT/CT images as recommended [25, 26].
SIRT treatment was performed 2 weeks after the treat-ment planning by the same interventional radiologist as during the work-up and a 90Y-microspheres PET/CT was acquired the day after.
Treatment response to SIRT was evaluated according to the modified response evaluation criteria (mRECIST) [27, 28]. Overall survival (OS) was also evaluated. A
Conclusion: In advanced HCC treated with SIRT, Dm and TNR determined with radiologic contours were predictive of tumor control and OS. This study shows that a rigorous clinical workflow (radiologic contours + registration on scintigraphic images) is feasible and should be prospectively considered for improving therapeutic strategy.
Keywords: Radioembolization, Hepatocellular carcinoma, Dosimetry
Page 3 of 15Nodari et al. EJNMMI Res (2021) 11:24
follow-up contrast-enhanced MRI or CT was performed every 3 months after SIRT as recommended [29].
All procedures were in accordance with the ethical standards of the responsible committee on human exper-imentation (institutional and national) and with the Dec-laration of Helsinki. This manuscript was reviewed and approved by the internal ethic committee of our institu-tion, with waiver of informed consent for this retrospec-tive study.
Planning angiography and 99mTc‑MAA SPECT/CTPlanning angiography and injection of 99mTc-MAA (150 MBq) was performed by a trained interventional radiologist, according to the previously published guide-lines [30]. 99mTc-MAA was injected as much selectively as possible into the supplying arteries split according to the approximate perfused volumes supplied by each artery, in case there were more than two tumor-feeding arteries.
After the injection of 99mTc-MAA, lung and liver planar scan and SPECT/CT tomography acquisitions were per-formed within one hour thereafter, using a hybrid scan-ner combining a dual-head gamma camera and a 16-slice CT scanner (Discovery NM/CT 670, GE healthcare, USA). SPECT acquisitions were performed to cover the whole liver and the lungs, using a low-energy/high-reso-lution (LEHR) collimator and setting 60 projections, 25 s per projection, matrix 128 × 128 with a cubic voxel size of 4.42 mm, automatic body contour and double energy window acquisition: 140 keV ± 10% for the emission win-dow and 120 keV ± 5% for the scattering window. A low-dose CT scan was also acquired (120 kV, automatic tube current modulation with a noise index of 21 and a con-strained maximum value of 150 mA) in order to perform attenuation correction.
Images were then reconstructed on a Xeleris worksta-tion (GE healthcare) according to an OSEM 3D algo-rithm with 4 iterations, 10 subsets, attenuation, scatter and resolution recovery corrections, and no post-recon-struction filtering.
Selective internal radiation therapy and 90Y‑microspheres PET/CTThe planned activity of 90Y-microspheres was injected through a microcatheter according to the same method as the planning angiography, with the same catheter posi-tion, by the same radiologist.
SIRT was planned 2 weeks after planning angiography and PET/CT acquired the next day on a GEMINI TF (Philips healthcare) or a Discovery MI (GE healthcare).
For both PET scanners, two bed positions centered on the liver were acquired during 40 min (20 min per bed position).
For the Gemini TF, low-dose CT scans were acquired with a 16-slice CT scanner (Brilliance 16) using the fol-lowing parameters: 120 kV, longitudinal and angular tube current modulation, a pitch of 0.688 and a slice thickness and increment of, respectively, 5 mm and 2.5 mm, and the reconstructions were performed with the TOF blob-based OSEM algorithm from Philips. As 90Y was not available in the isotope list during the acquisition step, the list mode file was corrected post-acquisition, using the relevant branching ratio and half-life of 90Y. The rec-ommended reconstruction parameters for quantitative purposes [18] were used: 4 iterations, 8 subsets, no filter. The reconstruction voxel size was 4 × 4 × 4 mm3.
For the Discovery MI, low-dose CT scans were acquired with a 64-slice CT scanner (Revolution EVO) using 120 kV, automatic tube current modulation with a noise index of 30 and a constrained maximum value of 300 mA, a pitch of 1.375 and a slice thickness/incre-ment of 2.5/1.25 mm. For the PET reconstruction, as no recommendations were available for this recent digi-tal scanner, the following parameters were used: OSEM algorithm with 2 iterations, 17 subsets, a Gaussian filter of 5 mm and a standard Z-axis filter. The reconstructed voxel size was 2.73 × 2.73 × 2.79 mm3.
For both scanners, all image corrections (random coin-cidences, decay, dead time, scattering and attenuation from low-dose CT scans) were applied.
Segmentation and registrationRetrospectively, two different contouring methods were applied to the pre- and post-treatment images.
In a first method, liver and tumor contours were manu-ally delineated by an experienced Radiologist on MRI images (SIEMENS Healthineers Magnetom 1.5T and 3T—acquisition sequence T1 VIBE 3D post-gadolinium) acquired prior to the planning angiography. In order to assess inter-operators variability, a second operator (an experienced Nuclear Medicine Physician trained in Radi-ology) also delineated both liver and tumor volumes. The root-mean-square (RMS) of the coefficient of variations (standard deviation/mean value) of the volumes deline-ated by the two operators was calculated.
Both 99mTc-MAA SPECT/CT and 90Y-microspheres PET/CT images were then registered with the MRI, in order to use MRI-based liver and tumor contours for pre-treatment and post-treatment dose calculations (“Pre-CMRI” and “Post-CMRI” contours, respectively).
Deformable registrations were performed by a trained Medical Physicist with the help of a multi-modality deformable registration algorithm available in MIM SurePlan (v7.0.1; MIM software Cleveland, USA) [31]. It is a general use Free-Form deformation algorithm that uses a feature similarity scoring metric. It maximizes the

Page 4 of 15Nodari et al. EJNMMI Res (2021) 11:24
correspondence of high-dimensional feature descriptors computed by evaluating each image voxel in the context of its neighboring voxels. In order to assess quality of reg-istrations, the Nuclear Medicine Physician also deline-ated liver contour on both the pre-treatment 99mTc-MAA SPECT/CT and the post-treatment 90Y-microspheres PET/CT images. A quantitative evaluation was then per-formed by computing a DICE index between the liver MRI contour and the liver CT contour from each scin-tigraphic modality (SPECT/CT or PET/CT). The mini-mum accepted DICE index was 0.85.
In a second method, 99mTc-MAA-SPECT and 90Y-microspheres-PET images were used to create a 10%-threshold contour (‘Pre-CSPECT’ and ‘Post-CPET,’ respectively), by selecting, all voxels exhibiting an uptake higher than 10% of the maximum uptake, within a volume of interest (VOI) surrounding the liver. This threshold-based contours was chosen to be a reasonable representation of arterial perfusion of the selected liver area in the context of SIRT [21].
DosimetryThe absorbed dose was calculated on the 99mTc-MAA-SPECT/CT (pre-treatment dosimetry) and on the 90Y-microspheres-PET/CT (post-treatment dosimetry)
images with the contours mentioned above. Three-dimensional voxel-based dosimetry was carried out with a research workflow in MIM SurePlan. In both pre- and post-treatment dosimetry calculations, total 90Y-micro-spheres activity in the field of view was assumed to be proportional to the scintigraphic counts in a region defined by the liver plus the lungs. This relative calibra-tion method was applied for the 99mTc-MAA-SPECT/CT, and to the 90Y-microspheres PET scans to avoid any bias due to the inaccuracy of the absolute quantification in PET systems [18] and also to reduce the effect of tak-ing into account two different PET systems. Doses were calculated with the local deposition method (LDM) for pre- and post-treatment images [32, 33]. This dosimetric method is based on two assumptions. First, the implant of the microspheres is permanent, leading to a fixed rela-tive distribution of the absorbed dose. Second, the energy released by the decay of 90Y-microspheres in a voxel is deposited within the same voxel. This relative patient-dependent dosimetric method is described in depth in literature [21].
3D dose distribution and dose volume histogram (DVH) for each contour were computed. DVH is a 2D graph representation of the dose deposited in segmented contours (Fig. 1). From DVH, we extracted two metrics
Fig. 1 Example of dose volume histogram (DVH) computed with MiM Sureplan 7.0.1 software research workflow on pre‑treatment 99mTc‑MAA SPECT/CT images. Abscissa is the minimal absorbed dose; ordinate is the corresponding relative volume receiving the absorbed dose. Green curve represents the liver contour; blue curve represents Pre‑CMRI tumor contour; red curve represents Pre‑CSPECT 10% threshold target contour

Page 5 of 15Nodari et al. EJNMMI Res (2021) 11:24
commonly used in radiotherapy to qualify dosimetric results: the mean absorbed dose (Dm) and the minimal dose covering 70% of the tumor (D70) (both expressed in Gy). They were evaluated for both contours meth-ods. Tumor-to-normal liver uptake ratio (TNR), which is related to the hypervascularization of the tumor and the selectivity of the targeting, was also considered and was evaluated for MRI-based contours only (Fig. 2). TNR
is defined as the ratio between tumor and healthy liver activity concentrations:
where CNTS is the total number of counts in the con-sidered contour, V is the contour volume in ml and tum
TNR =
CNTStum/Vtum
CNTSNL/VNL
,
MRI
SPECT/CT
PET/CT
First patient Second patient
a b
c d
e fFig. 2 Illustration of two patients with MRI on the top (a and b) and tumors outlined in dark blue then registered on 99mTc‑MAA SPECT/CT and 90Y‑microspheres PET/CT via deformable registration. Yellow and light blue contours correspond to SPECT/CT and PET/CT 10% thresholds contours, respectively. First patient (a, c and e) had a very high TNR determined with MRI‑based contours: 10 on SPECT/CT and 19 on PET/CT. Second patient (b, d and f) had a very low TNR: 4 on SPECT/CT and 3 on PET/CT. In those cases, for example first patient with a very high TNR had a tumor control during 38 months and second patient with a very low TNR had a tumor control during 2 months

Page 6 of 15Nodari et al. EJNMMI Res (2021) 11:24
and NL stand for the target and healthy liver contours, respectively.
Follow‑upAfter treatment, most patients were assessed regularly at our institution. Follow-up contrast-enhanced MRI or CT was performed every 3 months after SIRT as recom-mended. For the patients unable to attend, updates were obtained from family doctors or local oncologists. Details were obtained when appropriate for both the date of tumor progression and death.
StatisticsContinuous data were expressed as median (first quar-tile–third quartile) and dichotomous data as numbers (percentages).
Population was first separated in two subgroups according to the type of SIRT received (glass or resin microspheres). In each subgroup, all dose metrics obtained before treatment (based on 99mTc-MAA SPECT/CT) and after treatment (based on 90Y-micro-spheres PET/CT) were compared, using Spearman’s rank correlation, Wilcoxon test and Bland–Altman analysis.
Dose metrics Dm and D70 were also compared depending on the contouring method. Median values were determined for all dose metrics (Dm, D70 and TNR) in each subgroup.
Predictive factors (tumor control at 6 months, overall survival) were assessed by gathering dose metrics from each kind of spheres according to their respective median values.
Logistic regression was performed to test for predic-tors of absence of progressive disease according to mRE-CIST [27, 28] after 6 months. All dose metrics were tested by univariate analysis, dichotomized according to the median values. For multivariate analysis, only param-eters significant by univariate analysis were considered (p < 0.05). Kaplan–Meier and univariate Cox proportional hazard regression were also performed to determine prognostic value of dose metrics, dichotomized accord-ing to the median values (Table 1).
All the tests were two-sided and a p value less than 0.05 was considered statistically significant.
ResultsPatient characteristics, segmentation and registrationPatients and tumors baseline characteristics are shown in Table 2.
No significant difference was found between resin and glass microspheres groups except for 90Y-microspheres injected activity (median value 1.3 vs 2.3 GBq, p = 0.004).
The inter-operators variability, which was computed here with the RMS of the coefficient of variations of the
liver and tumor volumes delineated by the two operators, was 4.5% and 6.2%, respectively.
After registration, median Dice’s coefficient obtained between MRI-based liver contours and SPECT/CT liver contours was 0.93 [IQR 0.91–0.94] and 0.92 [IQR 0.88–0.93] between MRI-based liver contours and PET/CT liver contours.
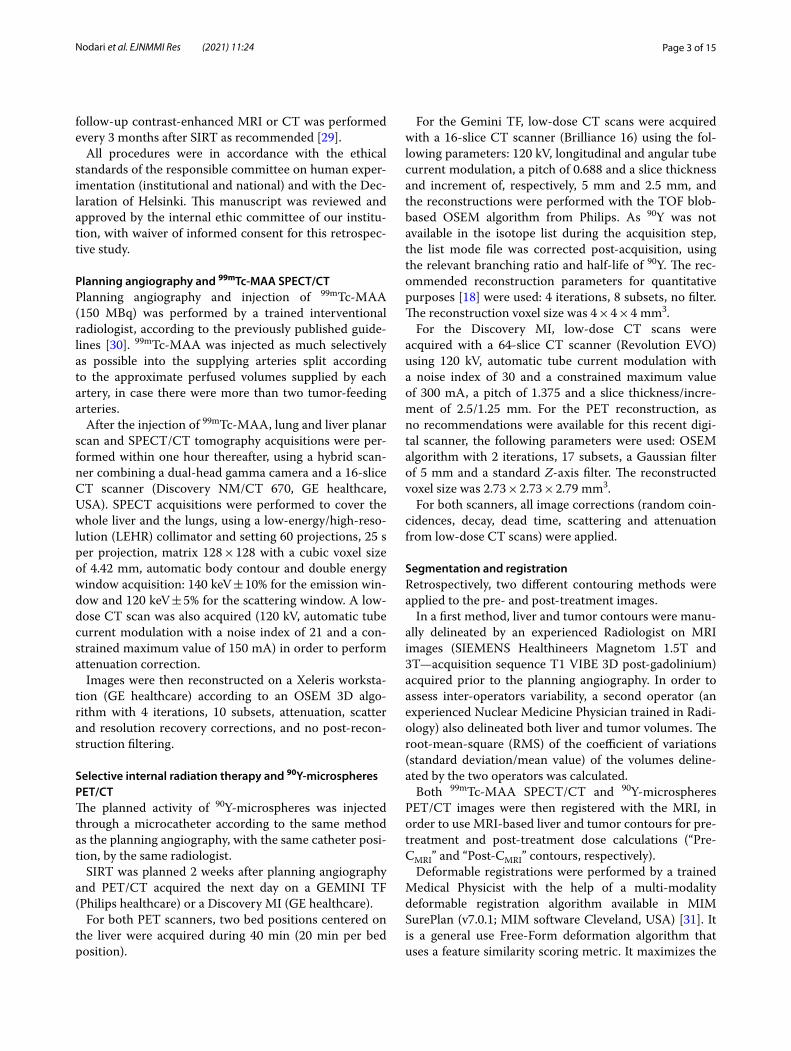
Comparison of pre‑ and post‑treatment dose metricsConcerning comparison of dose metrics calculated on the pre-treatment images versus post-treatment images (Table 3, Figs. 3, 4), there were no significant differences for Dm and TNR. Concerning the D70, there were also no significant differences except for D70 calculated with MRI-based contours, in patients receiving resin micro-spheres: D70-Pre-CMRI (before SIRT) = 68 Gy (32–84); D70-Post-CMRI (after SIRT) = 39 Gy (19–80); p = 0.02. Bland–Altman analysis confirmed a significant disagree-ment between these two measurements: with a mean dif-ference of − 16 Gy (95% confidence interval = − 29.6 to − 2.3); p = 0.02. There was no other disagreement accord-ing to Bland–Altman analysis, between pre- and post-treatment dose metrics.
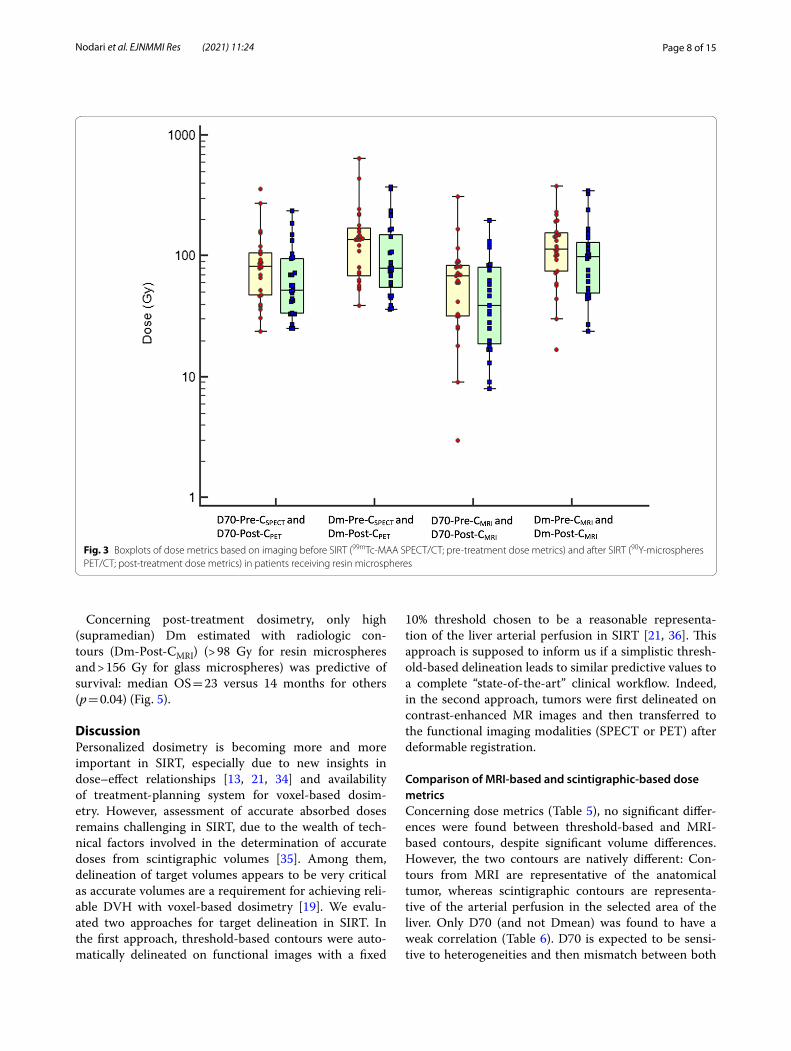
Good correlation was found between pre-treatment and post-treatment dose metrics, except for scinti-graphic-based dose metrics with glass microspheres, and TNR with both microspheres (Table 4).
Comparison of MRI‑based and scintigraphic‑based dose metricsConcerning the comparison of dose metrics calculated with scintigraphic-based contouring and MRI-based con-touring (Table 5), there were no significant differences.
Good correlation was found between scintigraphic-based and MRI-based dose metrics, except for D70-Pre-CSPECT and D70-Pre-CMRI for resin microspheres and D70-Pre-CSPECT and D70-Pre-CMRI for glass micro-spheres (Table 6).
Table 1 Definition of different dose metrics evaluated
MRI‑based contours Scintigraphic‑based contours
Pre‑treatment dose metrics
Dm Dm‑Pre‑CMRI Dm‑Pre‑CSPECT
D70 D70‑Pre‑CMRI D70‑Pre‑CSPECT
TNR TNR‑Pre‑CMRI –
Post‑treatment dose metrics
Dm Dm‑Post‑CMRI Dm‑Post‑CPET
D70 D70‑Post‑CMRI D70‑Post‑CPET
TNR TNR‑Post‑CMRI –

Page 7 of 15Nodari et al. EJNMMI Res (2021) 11:24
Prediction of tumor control and outcomeAmong the 48 patients, median OS was 15 months [IQR 6–22 months], 13 patients had a tumor progres-sion within 6 months and 25 a tumor control (others had a too short follow-up or no follow-up).
Only high (supramedian) TNR estimated before and after SIRT (TNR-Pre-CMRI and TNR-Post-CMRI) was predictive of tumor control at 6 months: OR = 5.9 (95% CI 1.3–27.3; p = 0.02) and 7.1 (95% CI 1.5–33.0; p = 0.01), respectively. Given their redundancy, these two parameters were not associated in a multivariate model.
Concerning the prediction of survival, high (suprame-dian) D70-Pre-CSPECT, Dm-Pre-CSPECT, Dm-Pre-CMRI, TNR-Pre-CMRI and Dm-Post-CMRI were able to provide prognostic stratification (Fig. 5). Same results were found according to Cox analysis (Table 7).
Concerning pre-treatment dosimetry, high (supramed-ian) D70 and Dm obtained with scintigraphic contouring (D70-Pre-CSPECT and Dm-Pre-CSPECT) and Dm and TNR obtained with MRI contouring (Dm-Pre-CMRI and TNR-Pre-CMRI) were predictive of OS, but only high TNR-Pre-CMRI was independent predictor by multivariate analysis (p = 0.02) (Table 7).
Table 2 Patients and tumors baseline characteristics. All values are median (Q1–Q3) or number (percentage)
NASH non-alcoholic steatohepatitis, HBV hepatitis B virus, HCV hepatitis C virusa Mann and Whitney testb χ2 test
All patients (n = 48) Resin microspheres (n = 25) Glass microspheres (n = 23) p
Age (y) 66 (62–73) 68 (63–74) 64 (63–72) NSa
Male gender 42 (88) 23 (92) 19 (83) NSb
Body surface area (m2) 1.9 (1.8–2.0) 1.9 (1.8–2.1) 1.9 (1.7–2) NSa
Cirrhosis 37 (77) 20 (80) 16 (70) NSb
Cause of cirrhosis
Alcohol 24 (65) 14 (56) 10 (43) NSb
NASH 10 (27) 7 (28) 4 (17) NSb
HVC 7 (19) 4 (16) 3 (13) NSb
HBV 2 (5) 2 (8) 0 (0) NSb
Hemochromatosis 2 (5) 0 (0) 2 (9) NSb
Child–Pugh
A5/A6 34 (92) 18 (72) 16 (70) NSb
B7 3 (8) 2 (8) 1 (4) NSb
MRI‑based Liver volume (ml) 1813 (1468–2358) 1912 (1505–2308) 1800 (1436–2435) NSa
MRI‑based Tumor volume (ml) 203 (67–545) 188 (68–312) 284 (61–738) NSa
SPECT threshold‑based target volume (ml) 360 (205–647) 298 (202–406) 593 (414–933) 0.002a
PET threshold‑based target volume (ml) 386 (245–786) 365 (214–643) 398 (267–827) NSa
Tumor burden (%) 11 (5–27) 8 (5–18) 16 (5–34) NSa
Injected activity (GBq) 1.6 (1.1–2.6) 1.3 (1.0–1.8) 2.3 (1.4–3.3) 0.004a
Table 3 Comparison of dose metrics based on imaging before SIRT (99mTc‑MAA SPECT/CT; pre‑treatment dose metrics) and after SIRT (90Y‑microspheres PET/CT; post‑treatment dose metrics) in patients receiving resin and glass microspheres
All values are median (Q1–Q3). p values are based on Wilcoxon test
Resin microspheres (n = 25) Glass microspheres (n = 23)
Pre‑treatment Post‑treatment p Pre‑treatment Post‑treatment p
D70‑Pre‑CSPECT and D70‑Post‑CPET (Gy) 82 [48–106] 52 [34–96] NS 100 [71–123] 121 [102–166] NS
Dm‑Pre‑CSPECT and Dm‑Post‑CPET (Gy) 137 [69–172] 79 [55–150] NS 150 [107–205] 197 [150–264] NS
D70‑Pre‑CMRI and D70‑Post‑CMRI (Gy) 68 [32–84] 39 [19–80] 0.02 91 [40–148] 98 [37–202] NS
Dm‑Pre‑CMRI and Dm‑Post‑CMRI (Gy) 115 [108–204] 98 [50–130] NS 153 [97–241] 156 [94–331] NS
TNR‑Pre‑CMRI and TNR‑Post‑CMRI 7.7 [4.6–12.8] 6.9 [3.2–10.2] NS 5.00 [2.3–8.6] 4.41 [3.1–7.5] NS
Page 8 of 15Nodari et al. EJNMMI Res (2021) 11:24
Concerning post-treatment dosimetry, only high (supramedian) Dm estimated with radiologic con-tours (Dm-Post-CMRI) (> 98 Gy for resin microspheres and > 156 Gy for glass microspheres) was predictive of survival: median OS = 23 versus 14 months for others (p = 0.04) (Fig. 5).
DiscussionPersonalized dosimetry is becoming more and more important in SIRT, especially due to new insights in dose–effect relationships [13, 21, 34] and availability of treatment-planning system for voxel-based dosim-etry. However, assessment of accurate absorbed doses remains challenging in SIRT, due to the wealth of tech-nical factors involved in the determination of accurate doses from scintigraphic volumes [35]. Among them, delineation of target volumes appears to be very critical as accurate volumes are a requirement for achieving reli-able DVH with voxel-based dosimetry [19]. We evalu-ated two approaches for target delineation in SIRT. In the first approach, threshold-based contours were auto-matically delineated on functional images with a fixed
10% threshold chosen to be a reasonable representa-tion of the liver arterial perfusion in SIRT [21, 36]. This approach is supposed to inform us if a simplistic thresh-old-based delineation leads to similar predictive values to a complete “state-of-the-art” clinical workflow. Indeed, in the second approach, tumors were first delineated on contrast-enhanced MR images and then transferred to the functional imaging modalities (SPECT or PET) after deformable registration.
Comparison of MRI‑based and scintigraphic‑based dose metricsConcerning dose metrics (Table 5), no significant differ-ences were found between threshold-based and MRI-based contours, despite significant volume differences. However, the two contours are natively different: Con-tours from MRI are representative of the anatomical tumor, whereas scintigraphic contours are representa-tive of the arterial perfusion in the selected area of the liver. Only D70 (and not Dmean) was found to have a weak correlation (Table 6). D70 is expected to be sensi-tive to heterogeneities and then mismatch between both
Fig. 3 Boxplots of dose metrics based on imaging before SIRT (99mTc‑MAA SPECT/CT; pre‑treatment dose metrics) and after SIRT (90Y‑microspheres PET/CT; post‑treatment dose metrics) in patients receiving resin microspheres
Page 9 of 15Nodari et al. EJNMMI Res (2021) 11:24
contours, especially when the tumor exhibits a necrotic part.
Concerning overall survival (Table 7), threshold-based contours from 99mTc-MAA scans were found to be sig-nificant predictive factors, whereas those from PET/CT imaging were not. 90Y-microspheres PET/CT suffer from count-starving acquisitions and dedicated optimization
of reconstruction parameters should be performed to obtain reliable results [19, 37, 38]. Our study uses two different generations of PET/CT systems and lacks of appropriate 90Y optimization for the most recent scanner.
MRI-based contours only were predictors of overall survival in both pre- and post-treatment images. Fur-thermore, TNR derived from these contours appeared
Fig. 4 Boxplots of dose metrics based on imaging before SIRT (99mTc‑MAA SPECT/CT; pre‑treatment dose metrics) and after SIRT (90Y‑microspheres PET/CT; post‑treatment dose metrics) in patients receiving glass microspheres
Table 4 Spearman correlation between dose metrics calculated before (based on 99mTc‑MAA SPECT/CT; pre‑treatment dose metrics)) and after SIRT (based on 90Y‑microspheres PET/CT; post‑treatment dose metrics) in patients receiving resin microspheres (n = 25) and glass microspheres (n = 23)
Pre‑treatment dose metrics
Post‑treatment dose metrics
Resin microspheres (n = 25) Glass microspheres (n = 23)
r p r p
Scintigraphic‑based contours Dm‑Pre‑CSPECT Dm‑Post‑CPET 0.85 < 0.0001 0.41 NS
D70‑Pre‑CSPECT D70‑Post‑CPET 0.81 < 0.0001 0.37 NS
MRI‑based contours Dm‑Pre‑CMRI Dm‑Post‑CMRI 0.84 < 0.0001 0.82 < 0.0001
D70‑Pre‑CMRI D70‑Post‑CMRI 0.82 < 0.0001 0.81 < 0.0001
TNR‑Pre‑CMRI TNR‑Post‑CMRI 0.48 0.015 0.35 NS

Page 10 of 15Nodari et al. EJNMMI Res (2021) 11:24
to be predictive for tumor control at 6 months as well as for overall survival (in pre-treatment dosimetry). TNR thresholds of 7.7/6.9 (pre-/post-) and 5.0/4.4 (pre-/post-) were identified for resin and glass microspheres, respec-tively. The range of TNR can be very large for a specific pathology in the literature [39] and will directly depend on the method of delineation. However, with a fixed method of determination, these thresholds could be of real interest to help treatment planning in association with lung shunt fraction and available dosimetric cri-teria. Although the process used to generate these con-tours (anatomical delineation plus registration) might appear cumbersome in a clinical workflow, reproducibil-ity was accurate and we believe that this method can be used prospectively to improve accuracy of targets volume determination before dosimetric calculation.
Comparison of pre‑ and post‑treatment dose metricsRegarding glass microspheres, no significant differences were found between pre- and post-treatment dose met-rics. However, with resin microspheres, D70 was found to be significantly different between pre- and post-treat-ment images (Table 3). Even with a relative calibration method, PET quantification from small activities usu-ally administered with resin microspheres is challenging and should require a dedicated optimization of the PET reconstruction parameters, as exposed above. Controver-sial results have been reported in the literature depending
on the type of image studied and the method used to assess the correlation between pre- and post-treatment dose metrics [10, 15, 36, 40, 41]. Apart from the technical gesture that has to be strictly identical, technical discrep-ancies (different kind of particles, injection flow) between the two procedures should explain the large variation of results reported [17] and harmonization of both images (SPECT and PET) should increase their similarity in the context of SIRT [19, 42]. Moreover, as formulated by Lassman et al. [43], the standardization of the SPECT/CT quantification is feasible and should improve results regarding such pre- and post-treatment comparison.
Tumor dosimetry (MRI‑based contours)Regarding resin microspheres, median values of mean tumor absorbed doses were 115 Gy from 99mTc-MAA scans and 98 Gy from 90Y-microspheres PET/CT post-treatment imaging. These results are quite similar with those reported in the literature: In HCC patients treated with resin microspheres, Hermann et al. [13] found a median tumor absorbed dose calculated from 99mTc-MAA scans of 112 Gy with a 100 Gy cutoff identified for longer survival in the SARAH study. Jadoul et al. [16] found tumor absorbed doses to have a median of 69 Gy for 99mTc-MAA scans and 79 Gy for 90Y PET/CT. Pre-dictive mean tumor doses of 129 Gy and 135 Gy were also reported by Gnesin et al. [15] and Song et al. [10], respectively.
Table 5 Comparison of dose metrics based on scintigraphic contours and MRI contouring in patients receiving resin and glass microspheres
All values are median (Q1–Q3). p values are based on Wilcoxon test
Resin microspheres (n = 25) Glass microspheres (n = 23)
Scintigraphic‑based contours
MRI‑based contours p Scintigraphic‑based contours
MRI‑based contours p
D70‑Pre‑(CSPECT and CMRI) (Gy) 82 [48–106] 68 [32–84] NS 100 [71–123] 91 [40–148] NS
Dm‑Pre‑(CSPECT and CMRI) (Gy) 137 [69–172] 115 [108–204] NS 150 [107–205] 153 [97–241] NS
D70‑Post‑(CPET and CMRI) (Gy) 52 [34–96] 39 [19–80] NS 121 [102–166] 98 [37–202] NS
Dm‑Post‑(CPET and CMRI) (Gy) 79 [55–150] 98 [50–130] NS 197 [150–264] 156 [94–331] NS
Table 6 Spearman correlation between dose metrics calculated based on scintigraphic or MRI contourings, in patients receiving resin microspheres (n = 25) and glass microspheres (n = 23)
Scintigraphic‑based contours
MRI‑based contours Resin microspheres (n = 25) Glass microspheres (n = 23)
r p r p
Pre‑treatment dose metrics Dm‑Pre‑CSPECT Dm‑Pre‑CMRI 0.70 0.0001 0.71 0.0002
D70‑Pre‑CSPECT D70‑Pre‑CMRI 0.22 NS 0.47 0.02
Post‑treatment dose metrics Dm‑Post‑CPET Dm‑Post‑CMRI 0.76 < 0.0001 0.54 0.007
D70‑Post‑CPET D70‑Post‑CMRI 0.49 0.01 0.15 NS

Page 11 of 15Nodari et al. EJNMMI Res (2021) 11:24
Regarding glass microspheres, median values of mean tumor absorbed doses were 153 Gy from 99mTc-MAA scans and 156 Gy from 90Y PET/CT. Jadoul et al. [16] found tumor absorbed doses to have a median value of 214 Gy for 99mTc-MAA scans and 211 Gy for 90Y PET/
CT. Regarding dose–response, there is a large consensus in the literature suggesting that a tumor absorbed dose threshold of almost 200 Gy should be appropriate for glass microspheres [21, 44, 45]. Our results, based on a median cutoff, showed that at least 150 Gy was necessary
Fig. 5 Kaplan–Meier curves on overall survival according to inframedian (blue curve) or supramedian (green curve) Dm, D70 and TNR

Page 12 of 15Nodari et al. EJNMMI Res (2021) 11:24
Tabl
e 7
Pred
ictiv
e fa
ctor
s of
ove
rall
surv
ival
. All
dose
met
rics
wer
e di
chot
omiz
ed a
ccor
ding
to s
upra
med
ian
OR
odds
ratio
, CI c
onfid
ence
inte
rval
Pre‑
trea
tmen
t do
se m
etric
sU
niva
riate
ana
lysi
sM
ultiv
aria
te a
naly
sis
OR
[CI 9
5%]
pO
R [C
I 95%
]p
D70
‑Pre
‑CSP
ECT
3.7
[1.6
–9.1
]0.
003
NS
Dm
‑Pre
‑CSP
ECT
3.7
[1.6
–9.1
]0.
003
NS
D70
‑Pre
‑CM
RI1.
4 [0
.7–2
.9]
NS
Dm
‑Pre
‑CM
RI2.
3 [1
.04–
5.0]
0.04
NS
TNR‑
Pre‑
CM
RI3.
3 [1
.4–7
.7]
0.00
52.
9 [1
.2–7
.1]
0.02
Post
‑tre
atm
ent d
ose
met
rics
Uni
varia
te a
naly
sis
OR
[CI 9
5%]
p
D70
‑Pos
t‑C
PET
1.9
[0.9
–4.0
]N
S
Dm
‑Pos
t‑C
PET
2.0
[0.9
–4.2
]N
S
D70
‑Pos
t‑C
MRI
1.5
[0.7
–3.1
]N
S
Dm
‑Pos
t‑C
MRI
2.2
[1.0
2–4.
5]0.
04
TNR‑
Post
‑CM
RI2.
0 [0
.9–4
.3]
NS

Page 13 of 15Nodari et al. EJNMMI Res (2021) 11:24
to be predictive of overall survival with MRI-based con-tours (Table 7). However, large variabilities were also reported in the literature with tumor sizes, heterogenei-ties and delivered doses being keys influencing factors for the determination of dosimetric thresholds [11].
One advantage of voxel dosimetry is to be able to iden-tify DVH-derived thresholds that could tell us if a certain part of the target volume can be highly irradiated without impairing the organ function. D70 was first proposed by Kao et al. [12] as a DVH-derived dose index capable of accounting for the heterogeneous nature of microsphere distribution. Regarding patients treated for HCC with resin spheres, Kao et al. proposed a threshold of 100 Gy for a complete response. Kafrouni et al. [11] found a mean D70 of 34/45 Gy (pre-/post-) in their cohort with a D70 higher than 80 Gy for complete or partial response at 6 months. Chan et al. concluded that their findings (D70 of 140 Gy for responders vs 24 Gy for non-responders) were comparable to the 100-Gy D70 threshold proposed by Kao et al. though they worked only with glass micro-spheres. In this study, we found that D70 could be pre-dictive of overall survival but only when threshold-based contours from 99mTc-MAA scans were used. D70 median values of 82 Gy and 100 Gy were identified as predictive for resin and glass microspheres, respectively.
LimitationsAmong the 48 patients included, 23 were treated with glass microspheres and 25 with resin spheres. It has been shown that liver tolerance is quite different between resin and glass microspheres, leading to higher toler-ated absorbed doses for glass microspheres in compari-son with resin microspheres [46]. To take into account this effect without compromising the statistical power of this study, predictive factors of tumor control and over-all survival were assessed by gathering dose metrics from each kind of spheres according to their respective median values.
The retrospective aspect of the study gives us no con-trol to harmonize information and techniques used for each patient individually. However, our cohort was repre-sentative of standard recruitment for HCC at our institu-tion and no selection was used to perform data analysis. Concerning post-treatment, dosimetry was carried out on two different generations of PET/CT systems with less than optimal reconstruction parameters for 90Y. PET-based voxel dosimetry was performed with a relative cali-bration method to try to reduce the impact of the use of two different scanners. However, we believe that the use of optimal 90Y reconstruction parameters might improve correlations, especially concerning the threshold-based delineation method.
ConclusionIn this retrospective study, we highlighted the impact of different delineation methods on absorbed dose cal-culation and predictive factors of tumor control and survival in SIRT. We found good correlations between pre- and post-treatment voxel dosimetry. We confirmed that absorbed dose is predictive of overall survival and showed that TNR is a robust index for prediction, pro-vided that MRI-based delineation is accurate. Due to the different types of images used in a standard clini-cal workflow, we found that a rigorous process, as made recently approachable with dedicated 90Y-microspheres treatment planning systems, could be beneficial for patients in terms of prognostic stratification and should be prospectively considered for management of thera-peutic strategy.
Abbreviations90Y: Yttrium‑90; BCLC: Barcelona clinic liver cancer; BSA: Body surface area; CT: Computed tomography; D70: Minimal absorbed dose delivered to 70% of the tumor; Dm: Mean absorbed dose; HCC: Hepatocellular carcinoma; LDM: Local deposition model; LEHR: Low energy/high resolution; MAA: Macro‑aggregated albumin; mRECIST: Modified response evaluation criteria in solid tumors; MRI: Magnetic resonance imaging; OS: Overall survival; PET: Positron emission tomography; PFS: Progression‑free survival; PM: Partition model; RMS: Root‑mean‑square; ROI: Region of interest; SIRT: Selective internal radiation therapy; SPECT: Single photon emission computed tomography; TACE: Transarterial chemoembolization; TNR: Tumor‑to‑normal liver uptake ratio; TOF: Time of flight; VDK: Voxel dose kernel.
AcknowledgementsNot applicable.
Authors’ contributionsGN and RP were involved in data collection and performed the dosimetry analysis. GN, RP, JMV and AC designed the study and were major contribu‑tors in writing the manuscript. JMR performed the statistical analysis of the data. GN and OL segmented the volumes. BP was involved in deformable registration protocol and assisted in manuscript preparation. JP, IDC, CTV, OC, SG, MG, ML, SM and RL were involved in preparation and/or performance of radioembolizations and/or clinical care. All authors read and approved the final manuscript.
FundingNot applicable.
Availability of data and materialsThe datasets used and/or analyzed during the current study are available from the corresponding author on reasonable request.
Declarations
Ethics approval and consent to participateThis article does not contain any studies with animals performed by any of the authors. All procedures performed in this study were in accordance with the ethical standards of the responsible committee on human experimentation (both institutional and national) and with the 1964 Declaration of Helsinki and its later amendments.
Consent for publicationAll patients signed a written informed consent to provide permission to review medical records at the time of treatment.

Page 14 of 15Nodari et al. EJNMMI Res (2021) 11:24
Competing interestsRomaric Loffroy, Consultant, Sirtex. All other authors declare that they have no conflict of interest.
Author details1 Department of Nuclear Medicine, Centre Georges‑François Leclerc, Dijon, France. 2 ImViA Laboratory, IFTIM Team, EA 7535, University of Burgundy, Dijon, France. 3 Department of Vascular and Interventional Radiology, University Hospital Dijon, Dijon, France. 4 Department of Gastroenterology, University Hospital Dijon, Dijon, France.
Received: 28 October 2020 Accepted: 23 February 2021
References 1. Global Burden of Disease Cancer Collaboration, Fitzmaurice C, Allen C,
Barber RM, Barregard L, Bhutta ZA, et al. Global, regional, and national cancer incidence, mortality, years of life lost, years lived with disability, and disability‑adjusted life‑years for 32 cancer groups, 1990 to 2015: a systematic analysis for the Global Burden of Disease Study. JAMA Oncol. 2017;3:524–48.
2. European Association for the Study of the Liver. Electronic address: easlof‑[email protected]. EASL clinical practice guidelines: management of hepatocellular carcinoma. J Hepatol. 2018;69:182–236.
3. Sangro B, Salem R, Kennedy A, Coldwell D, Wasan H. Radioembolization for hepatocellular carcinoma: a review of the evidence and treatment recommendations. Am J Clin Oncol. 2011;34:422–31.
4. Loffroy R, Ronot M, Greget M, Bouvier A, Mastier C, Sengel C, et al. Short‑term safety and quality of life outcomes following radioembolization in primary and secondary liver tumours: a multi‑centre analysis of 200 patients in France. Cardiovasc Intervent Radiol. 2020;44:36–49.
5. Salem R, Lewandowski RJ, Kulik L, Wang E, Riaz A, Ryu RK, et al. Radioem‑bolization results in longer time‑to‑progression and reduced toxicity compared with chemoembolization in patients with hepatocellular carcinoma. Gastroenterology. 2011;140(497–507):e2.
6. Vilgrain V, Abdel‑Rehim M, Sibert A, Ronot M, Lebtahi R, Castéra L, et al. Radioembolisation with yttrium‑90 microspheres versus sorafenib for treatment of advanced hepatocellular carcinoma (SARAH): study protocol for a randomised controlled trial. Trials. 2014;15:474.
7. Chow PKH, Gandhi M, Tan S‑B, Khin MW, Khasbazar A, Ong J, et al. SIR‑veNIB: selective internal radiation therapy versus sorafenib in Asia‑Pacific patients with hepatocellular carcinoma. J Clin Oncol. 2018;36:1913–21.
8. Venerito M, Pech M, Canbay A, Donghia R, Guerra V, Chatellier G, et al. NEMESIS: non‑inferiority, individual patient meta‑analysis of selec‑tive internal radiation therapy with yttrium‑90 resin microspheres versus sorafenib in advanced hepatocellular carcinoma. J Nucl Med. 2020;61(12):1736–42.
9. Garin E, Lenoir L, Rolland Y, Edeline J, Mesbah H, Laffont S, et al. Dosimetry based on 99mTc‑macroaggregated albumin SPECT/CT accurately pre‑dicts tumor response and survival in hepatocellular carcinoma patients treated with 90Y‑loaded glass microspheres: preliminary results. J Nucl Med. 2012;53:255–63.
10. Song YS, Paeng JC, Kim H‑C, Chung JW, Cheon GJ, Chung J‑K, et al. PET/CT‑based dosimetry in 90Y‑microsphere selective internal radiation therapy: single cohort comparison with pretreatment planning on (99m)Tc‑MAA imaging and correlation with treatment efficacy. Medicine (Balti‑more). 2015;94:e945.
11. Kafrouni M, Allimant C, Fourcade M, Vauclin S, Delicque J, Ilonca A‑D, et al. Retrospective voxel‑based dosimetry for assessing the ability of the body‑surface‑area model to predict delivered dose and radioemboliza‑tion outcome. J Nucl Med. 2018;59:1289–95.
12. Kao Y‑H, Steinberg JD, Tay Y‑S, Lim GK, Yan J, Townsend DW, et al. Post‑radioembolization yttrium‑90 PET/CT—part 2: dose‑response and tumor predictive dosimetry for resin microspheres. EJNMMI Res. 2013;3:57.
13. Hermann A‑L, Dieudonné A, Ronot M, Sanchez M, Pereira H, Chatellier G, et al. Relationship of tumor radiation‑absorbed dose to survival and response in hepatocellular carcinoma treated with transarterial radioem‑bolization with 90Y in the SARAH study. Radiology. 2020;296(3):673–84.
14. Garin E, Tselikas L, Guiu B, Chalaye J, Edeline J, de Baere T, et al. Personal‑ised versus standard dosimetry approach of selective internal radiation therapy in patients with locally advanced hepatocellular carcinoma (DOSISPHERE‑01): a randomised, multicentre, open‑label phase 2 trial. Lancet Gastroenterol Hepatol. 2021;6:17–29.
15. Gnesin S, Canetti L, Adib S, Cherbuin N, Silva Monteiro M, Bize P, et al. Partition model‑based 99mTc‑MAA SPECT/CT predictive dosimetry com‑pared with 90Y TOF PET/CT posttreatment dosimetry in radioemboliza‑tion of hepatocellular carcinoma: a quantitative agreement comparison. J Nucl Med. 2016;57:1672–8.
16. Jadoul A, Bernard C, Lovinfosse P, Gérard L, Lilet H, Cornet O, et al. Comparative dosimetry between 99mTc‑MAA SPECT/CT and 90Y PET/CT in primary and metastatic liver tumors. Eur J Nucl Med Mol Imaging. 2020;47:828–37.
17. Kafrouni M, Allimant C, Fourcade M, Vauclin S, Guiu B, Mariano‑Goulart D, et al. Analysis of differences between 99mTc‑MAA SPECT‑ and 90Y‑micro‑sphere PET‑based dosimetry for hepatocellular carcinoma selective internal radiation therapy. EJNMMI Res. 2019;9:62.
18. Willowson KP, Tapner M, QUEST Investigator Team, Bailey DL. A multicen‑tre comparison of quantitative (90)Y PET/CT for dosimetric purposes after radioembolization with resin microspheres: the QUEST phantom study. Eur J Nucl Med Mol Imaging. 2015;42:1202–22.
19. Bernardini M, Thevenet H, Berthold C, Desbrée A, Smadja C, Desiré C, et al. Optimisation of reconstruction, volumetry and dosimetry for 99mTc‑SPECT and 90Y‑PET images: towards reliable dose‑volume histograms for selective internal radiation therapy with 90Y‑microspheres. Phys Med PM Int J Devoted Appl Phys Med Biol. 2017;39:147–55.
20. Garin E, Lenoir L, Rolland Y, Laffont S, Pracht M, Mesbah H, et al. Effective‑ness of quantitative MAA SPECT/CT for the definition of vascularized hepatic volume and dosimetric approach: phantom validation and clinical preliminary results in patients with complex hepatic vasculariza‑tion treated with yttrium‑90‑labeled microspheres. Nucl Med Commun. 2011;32:1245–55.
21. Chiesa C, Mira M, Maccauro M, Spreafico C, Romito R, Morosi C, et al. Radioembolization of hepatocarcinoma with (90)Y glass micro‑spheres: development of an individualized treatment planning strategy based on dosimetry and radiobiology. Eur J Nucl Med Mol Imaging. 2015;42:1718–38.
22. Garin E, Rolland Y, Laffont S, Edeline J. Clinical impact of (99m)Tc‑MAA SPECT/CT‑based dosimetry in the radioembolization of liver malignan‑cies with (90)Y‑loaded microspheres. Eur J Nucl Med Mol Imaging. 2016;43:559–75.
23. Garin E, Rolland Y, Edeline J. 90Y‑loaded microsphere SIRT of HCC patients with portal vein thrombosis: high clinical impact of 99mTc‑MAA SPECT/CT‑based dosimetry. Semin Nucl Med. 2019;49:218–26.
24. Meyers N, Jadoul A, Bernard C, Delwaide J, Lamproye A, Detry O, et al. Inter‑observer variability of 90Y PET/CT dosimetry in hepatocellular car‑cinoma after glass microspheres transarterial radioembolization. EJNMMI Phys. 2020;7:29.
25. Giammarile F, Bodei L, Chiesa C, Flux G, Forrer F, Kraeber‑Bodere F, et al. EANM procedure guideline for the treatment of liver cancer and liver metastases with intra‑arterial radioactive compounds. Eur J Nucl Med Mol Imaging. 2011;38:1393–406.
26. Bastiaannet R, Kappadath SC, Kunnen B, Braat AJAT, Lam MGEH, de Jong HWAM. The physics of radioembolization. EJNMMI Phys. 2018;5:22.
27. Lencioni R, Llovet JM. Modified RECIST (mRECIST) assessment for hepato‑cellular carcinoma. Semin Liver Dis. 2010;30:52–60.
28. Seyal AR, Gonzalez‑Guindalini FD, Arslanoglu A, Harmath CB, Lewan‑dowski RJ, Salem R, et al. Reproducibility of mRECIST in assessing response to transarterial radioembolization therapy in hepatocellular carcinoma. Hepatol Baltim Md. 2015;62:1111–21.
29. Vogel A, Cervantes A, Chau I, Daniele B, Llovet JM, Meyer T, et al. Hepa‑tocellular carcinoma: ESMO clinical practice guidelines for diagnosis, treatment and follow‑up. Ann Oncol. 2018;29:iv238–55.
30. Salem R, Lewandowski RJ, Sato KT, Atassi B, Ryu RK, Ibrahim S, et al. Technical aspects of radioembolization with 90Y microspheres. Tech Vasc Interv Radiol. 2007;10:12–29.
31. Piper J, Nelson A, Harper J. Deformable image registration in MIM Maes‑tro® evaluation and description, 5.
32. As P, Wd E. Effect of voxel size and computation method on Tc‑99m MAA SPECT/CT‑based dose estimation for Y‑90 microsphere therapy. IEEE Trans

Page 15 of 15Nodari et al. EJNMMI Res (2021) 11:24
Med Imaging. 2009. https ://pubme d.ncbi.nlm.nih.gov/19884 064/. . Cited 21 Sept 2020.
33. Pasciak AS, Bourgeois AC, Bradley YC. A comparison of techniques for (90)Y PET/CT image‑based dosimetry following radioembolization with resin microspheres. Front Oncol. 2014;4:121.
34. Garin E, Tzelikas L, Guiu B, Chalaye J, Edeline J, De Baere T, et al. Major impact of personalized dosimetry using 90Y loaded glass microspheres SIRT in HCC: final overall survival analysis of a multicenter randomized phase II study (DOSISPHERE‑01). J Clin Oncol. 2020;38:516–516.
35. Pacilio M, Ferrari M, Chiesa C, Lorenzon L, Mira M, Botta F, et al. Impact of SPECT corrections on 3D‑dosimetry for liver transarterial radioembo‑lization using the patient relative calibration methodology. Med Phys. 2016;43:4053.
36. Brosch J, Gosewisch A, Kaiser L, Seidensticker M, Ricke J, Zellmer J, et al. 3D image‑based dosimetry for Yttrium‑90 radioembolization of hepato‑cellular carcinoma: impact of imaging method on absorbed dose esti‑mates. Phys Med PM Int J Devoted Appl Phys Med Biol. 2020;80:317–26.
37. Carlier T, Eugène T, Bodet‑Milin C, Garin E, Ansquer C, Rousseau C, et al. Assessment of acquisition protocols for routine imaging of Y‑90 using PET/CT. EJNMMI Res. 2013;3:11.
38. Siman W, Mawlawi OR, Mourtada F, Kappadath SC. Systematic and random errors of PET‑based 90 Y 3D dose quantification. Med Phys. 2020;47:2441–9.
39. Ho S, Lau WY, Leung TW, Chan M, Johnson PJ, Li AK. Clinical evaluation of the partition model for estimating radiation doses from yttrium‑90 microspheres in the treatment of hepatic cancer. Eur J Nucl Med. 1997;24:293–8.
40. Wondergem M, Smits MLJ, Elschot M, de Jong HWAM, Verkooijen HM, van den Bosch MAAJ, et al. 99mTc‑macroaggregated albumin poorly
predicts the intrahepatic distribution of 90Y resin microspheres in hepatic radioembolization. J Nucl Med. 2013;54:1294–301.
41. Knesaurek K, Machac J, Muzinic M, DaCosta M, Zhang Z, Heiba S. Quan‑titative comparison of yttrium‑90 (90Y)‑microspheres and technetium‑99m (99mTc)‑macroaggregated albumin SPECT images for planning 90Y therapy of liver cancer. Technol Cancer Res Treat. 2010;9:253–62.
42. Mikell JK, Majdalany BS, Owen D, Paradis KC, Dewaraja YK. Assessing spa‑tial concordance between theranostic pairs using phantom and patient‑specific acceptance criteria: application to 99mTc‑MAA SPECT/90Y‑micro‑sphere PET. Int J Radiat Oncol Biol Phys. 2019;104:1133–40.
43. Lassmann M, Eberlein U, Tran‑Gia J. Multicentre trials on standardised quantitative imaging and dosimetry for radionuclide therapies. Clin Oncol R Coll Radiol G B. 2020;33:125–30.
44. Garin E, Palard X, Rolland Y. Personalised dosimetry in radioembolisa‑tion for HCC: impact on clinical outcome and on trial design. Cancers. 2020;12:1557.
45. Chan KT, Alessio AM, Johnson GE, Vaidya S, Kwan SW, Monsky W, et al. Prospective trial using internal pair‑production positron emission tomography to establish the yttrium‑90 radioembolization dose required for response of hepatocellular carcinoma. Int J Radiat Oncol Biol Phys. 2018;101:358–65.
46. Cremonesi M, Chiesa C, Strigari L, Ferrari M, Botta F, Guerriero F, et al. Radioembolization of hepatic lesions from a radiobiology and dosimetric perspective. Front Oncol. 2014;4:210.
Publisher’s NoteSpringer Nature remains neutral with regard to jurisdictional claims in pub‑lished maps and institutional affiliations.