Impact of Common Variations in PLD3 on Neuroimaging...
9
Impact of Common Variations in PLD3 on Neuroimaging Phenotypes in Non-demented Elders Chong Wang 1,2 & Hui-Fu Wang 3 & Meng-Shan Tan 1 & Ying Liu 1 & Teng Jiang 4 & Dao-Qiang Zhang 5 & Lan Tan 1,3 & Jin-Tai Yu 1,6 & Alzheimer’ s Disease Neuroimaging Initiative Received: 2 June 2015 /Accepted: 20 July 2015 /Published online: 1 August 2015 # Springer Science+Business Media New York 2015 Abstract Rare variants of phospholipase D3 (PLD3) have been identified as Alzheimer’ s disease (AD) susceptibility lo- ci, whereas little is known about the potential role of common variants in the progression of AD. To examine the impact of genetic variations in PLD3 on neuroimaging phenotypes in a large non-demented population. A total of 261 normal cogni- tion (NC) and 456 mild cognitive impairment (MCI) individ- uals from the Alzheimer’ s Disease Neuroimaging Initiative (ADNI) database are included in our analysis. Multiple linear regression models were applied to examine the association between four single-nucleotide polymorphisms (SNPs; rs7249146, rs4490097, rs12151243, and rs10407447) with the florbetapir retention on florbetapir 18F amyloid positron emission tomography (AV45-PET), the cerebral metabolic rate for glucose (CMRgl) on 18F-fluorodeoxyglucose PET (FDG-PET), and regional volume on magnetic resonance im- aging (MRI) at baseline and in the cohort study. We did not detect any significant associations of PLD3 SNPs with florbetapir retention on AV45-PET. In the analysis of FDG- PET, rs10407447 was associated with the CMRgl in the left angular gyrus and bilateral posterior cingulate cortex in the MCI group. Regarding the MRI analysis, rs10407447 was also associated with bilateral inferior lateral ventricle and lat- eral ventricle volume in MCI group. The main findings of our study provide evidence that support the possible role of PLD3 common variants in influencing AD-related neuroimaging Data used in preparation of this article were obtained from the Alzheimer’ s Disease Neuroimaging Initiative (ADNI) database (adni. loni.usc.edu). As such, the investigators within the ADNI contributed to the design and implementation of ADNI and/or provided data but did not participate in analysis or writing of this report. A complete listing of ADNI investigators can be found at http://adni.loni.usc.edu/wp-content/ uploads/how_to_apply/ADNI_Acknowledgement_List.pdf. Electronic supplementary material The online version of this article (doi:10.1007/s12035-015-9370-4) contains supplementary material, which is available to authorized users. * Lan Tan [email protected] * Jin-Tai Yu [email protected] 1 Department of Neurology, Qingdao Municipal Hospital, School of Medicine, Qingdao University, No.5 Donghai Middle Road, Qingdao 266071, Shandong, China 2 Department of Neurology and Institute of Neurology, First Affiliated Hospital, Fujian Medical University, Fuzhou, China Mol Neurobiol (2016) 53:4343–4351 DOI 10.1007/s12035-015-9370-4 3 Department of Neurology, Qingdao Municipal Hospital, Nanjing Medical University, Qingdao, China 4 Department of Neurology, Nanjing First Hospital, Nanjing Medical University, Qingdao, China 5 Department of Computer Science and Engineering, Nanjing University of Aeronautics and Astronautics, Nanjing, China 6 Memory and Aging Center, Department of Neurology, University of California, 675 Nelson Rising Lane, Suite 190, Box 1207, San Francisco, CA 94158, USA
Transcript of Impact of Common Variations in PLD3 on Neuroimaging...

Impact of Common Variations in PLD3 on NeuroimagingPhenotypes in Non-demented Elders
Chong Wang1,2 & Hui-Fu Wang3 & Meng-Shan Tan1&
Ying Liu1& Teng Jiang4 & Dao-Qiang Zhang5 & Lan Tan1,3
&
Jin-Tai Yu1,6& Alzheimer’s Disease Neuroimaging Initiative
Received: 2 June 2015 /Accepted: 20 July 2015 /Published online: 1 August 2015# Springer Science+Business Media New York 2015
Abstract Rare variants of phospholipase D3 (PLD3) havebeen identified as Alzheimer’s disease (AD) susceptibility lo-ci, whereas little is known about the potential role of commonvariants in the progression of AD. To examine the impact ofgenetic variations in PLD3 on neuroimaging phenotypes in alarge non-demented population. A total of 261 normal cogni-tion (NC) and 456 mild cognitive impairment (MCI) individ-uals from the Alzheimer’s Disease Neuroimaging Initiative(ADNI) database are included in our analysis. Multiple linearregression models were applied to examine the associationbetween four single-nucleotide polymorphisms (SNPs;rs7249146, rs4490097, rs12151243, and rs10407447) withthe florbetapir retention on florbetapir 18F amyloid positron
emission tomography (AV45-PET), the cerebral metabolicrate for glucose (CMRgl) on 18F-fluorodeoxyglucose PET(FDG-PET), and regional volume on magnetic resonance im-aging (MRI) at baseline and in the cohort study. We did notdetect any significant associations of PLD3 SNPs withflorbetapir retention on AV45-PET. In the analysis of FDG-PET, rs10407447 was associated with the CMRgl in the leftangular gyrus and bilateral posterior cingulate cortex in theMCI group. Regarding the MRI analysis, rs10407447 wasalso associated with bilateral inferior lateral ventricle and lat-eral ventricle volume in MCI group. The main findings of ourstudy provide evidence that support the possible role of PLD3common variants in influencing AD-related neuroimaging
Data used in preparation of this article were obtained from theAlzheimer’s Disease Neuroimaging Initiative (ADNI) database (adni.loni.usc.edu). As such, the investigators within the ADNI contributed tothe design and implementation of ADNI and/or provided data but did notparticipate in analysis or writing of this report. A complete listing ofADNI investigators can be found at http://adni.loni.usc.edu/wp-content/uploads/how_to_apply/ADNI_Acknowledgement_List.pdf.
Electronic supplementary material The online version of this article(doi:10.1007/s12035-015-9370-4) contains supplementary material,which is available to authorized users.
* Lan [email protected]
* Jin-Tai [email protected]
1 Department of Neurology, Qingdao Municipal Hospital, School ofMedicine, Qingdao University, No.5 Donghai Middle Road,Qingdao 266071, Shandong, China
2 Department of Neurology and Institute of Neurology, First AffiliatedHospital, Fujian Medical University, Fuzhou, China
Mol Neurobiol (2016) 53:4343–4351DOI 10.1007/s12035-015-9370-4
3 Department of Neurology, Qingdao Municipal Hospital, NanjingMedical University, Qingdao, China
4 Department of Neurology, Nanjing First Hospital, Nanjing MedicalUniversity, Qingdao, China
5 Department of Computer Science and Engineering, NanjingUniversity of Aeronautics and Astronautics, Nanjing, China
6 Memory and Aging Center, Department of Neurology, University ofCalifornia, 675 Nelson Rising Lane, Suite 190, Box 1207, SanFrancisco, CA 94158, USA

phenotypes. Nevertheless, further work is necessary to explainthe functional mechanisms of differences and confirm thecausal variants.
Keywords Alzheimer’s disease .PLD3 . Neuroimaging .
Association
Introduction
Genetic risk factors have long known to play an impor-tant role in the development of Alzheimer’s disease(AD) [1–3]. To date, several genetic variants are knownto increase the risk for the late-onset AD includingthose in the CLU, PICALM, and CR1 genes and mostnotably the ε4 allele of the APOE gene [4–6]. Recently,rare functional coding variants in phospholipase D3(PLD3) gene have been identified to be significantlyassociated with AD risk using whole-exome sequencingmethod [7]. A single variant rs145999145 (Val232Met)segregates with disease status in two independent fami-lies and is validated to increase AD risk in seven inde-pendent series of European descent. Subsequently, addi-tional variants in PLD3 are also observed to increaserisk for AD through gene-based burden analysis [7].These evidences strongly support PLD3 as an AD riskgene. In this case, we hypothesize that common variantson commercially available genotyping chips, may alsoplay an important role in AD.
New neuroimaging analysis methods are now being used toclarify the genetics of AD pathology, risk, and variability inhuman [8]. Unlike the dichotomous clinical diagnosis, neuro-imaging phenotypes can capture more of the underlying her-itable trait variation and provide a more direct measurementtoward characterizing genetic effects on brain structure andfunction [8]. Thus, genetic analysis of neuroimaging pheno-types may detect novel common variants of PLD3 involved inAD susceptibility.
AD develops following a long pre-clinical phase consistingof mild symptoms, and the pathophysiological processes ofAD begin many years prior to the diagnosis of AD [9, 10].Given that PLD3 is related to AD, it remains unclear whetherthis gene also plays a role in the preclinical phase of AD.Knowledge on this would provide important confirmation ofa role for genetic variations of PLD3 and enhance associationsfor susceptibility alleles. Additionally, genetic factors mightplay different roles at different levels of disease severity. In ourstudy, we examined the impact of common variants at thePLD3 loci in normal cognition (NC) and mild cognitive im-pairment (MCI) population separately, from Alzheimer’s Dis-ease Neuroimaging Initiative (ADNI).
Materials and Methods
Participants
The data used in this article were obtained from the ADNIdatabase. All ADNI studies were carried out in accordancewith the Good Clinical Practice guidelines, the Declarationof Helsinki, and the US 21 CFR Part 50 (Protection of Humansubjects) and Part 56 (Institutional Review Boards). Thisstudy was approved by the Institutional Review Boards ofall participating sites at their respective institutions. Writteninformed consent was obtained from all ADNI participantsbefore the study. ADNI is a longitudinal multisite studylaunched in 2003 by the National Institute on Aging (NIA),the National Institute of Biomedical Imaging and Bioengi-neering (NIBIB), the Food and Drug Administration (FDA),private pharmaceutical companies, and non-profit organiza-tions with over 50 sites across the USA and Canada (http://adni.loni.usc.edu/). The primary goal of ADNI has been toexamine whether serial MRI, PET, other biological markers,and clinical and neuropsychological assessment can becombined to measure the progression of MCI and early AD.Determination of sensitive and specific markers of very earlyAD progression is intended to aid researchers and clinicians todevelop new treatments and monitor their effectiveness, aswell as lessen the time and cost of clinical trials. The initialgoal of ADNI was to recruit 800 subjects, but ADNI has beenfollowed by ADNI-GO and ADNI-2. To date, these threeprotocols have recruited over 1500 adults to participate inthe research, consisting of cognitively normal older individ-uals, individuals with early or late MCI, and individuals withearly AD. The follow-up duration of each group is specified inthe protocols for ADNI-1, ADNI-2, and ADNI-GO. Subjectsoriginally recruited for ADNI-1 and ADNI-GO had the optionto be followed in ADNI-2.
Participants were enrolled based on criteria outlined in theADNI protocol (http://www.adni-info.org/scientists/adnistudyprocedures.aspx). Participants genotyped in bothADNI-1 and ADNI-2/GO were included. Participants werecategorized at baseline as NC, MCI, and AD. More informa-tion on diagnostic criteria utilized is available on ADNIwebsite. Here, we restricted the study to NC andMCI subjectswhose genotype data of PLD3 single-nucleotide polymor-phisms (SNPs; 812 individuals) were available. Populationstructure was assessed by performing principal componentanalysis (PCA) to avoid population stratification effects whichcan lead to spurious genetic associations. We assignedgenotype-determined ancestry by comparing ADNI patientsand populations form HapMap Phase 3 data. Only individualsclustering with European HapMap samples were retained foranalysis. As presented in Supplementary Fig. S1, 48 individ-uals identified as of non-European ancestry were excluded.The final dataset for the present analysis comprised 713
4344 Mol Neurobiol (2016) 53:4343–4351

individuals, including 261 NC and 456MCI at baseline. Base-line and longitudinal data including structural MRI and PETwere collected as parts of this study. Furthermore, all partici-pants underwent a battery of baseline clinical tests includingClinical Dementia Rating Scale Sum of Boxes (CDRSB), theAlzheimer’s Disease Assessment Scale 11 (ADAS11), theAlzheimer’s Disease Assessment Scale 13 (ADAS13), theMini-Mental State Examination (MMSE), the Rey’ AuditoryVerbal Learning Test (RAVLT), and Functional ActivitiesQuestionnaire (FAQ).
Genotyping
In our study, we used the results from direct genotyping ofSNPs in PLD3 that was conducted as part of the Genome-Wide Association Study (GWAS) of ADNI. The GWAS datawas collected from ADNI-1 participants using IlluminaInfinium Human610-Quad BeadChip (Illumina, Inc., SanDiego, CA), and ADNI-2/GO participants using Illumina Hu-man Omni Express BeadChip. Optimized tag SNP contentfrom all three HapMap phases was strategically selected tocapture the greatest amount of common SNP variation [11].SNP genotypes were generated in Illumina BeadStudio soft-ware v3.2 from bead intensity data. The quality control (QC)procedures were performed using PLINK software. We ex-cluded SNPs with the following characteristics: minimum callrates <95 %, minimum minor allele frequencies <0.01, andHardy–Weinberg equilibrium test p<1×10⁻⁶. After QC pro-cedures, four tag SNPs in the intron of PLD3 (rs7249146,rs4490097, rs12151243, rs10407447) remained for data anal-ysis. In addition, we determined the linkage disequilibrium(LD) and detailed other information of the selected SNPs fromphase 1 of the 1000 Genomes Project. LD plot containing 22SNPs for PLD3 was generated from 1000 Genomes genotyp-ing data for the European individuals using Haploview 4.2software. We also included the previously reported rare vari-ants (rs145999145 and rs4819) in the LD plot for comparison.
Neuroimaging
We used the analyzed data of 18F-AV45-PET and the CMRglon FDG-PET that had been processed at the Jagust Lab, theUniversity of Berkeley. A detailed description of PET imageacquisition and processing can be found at http://adni.loni.usc.edu/data-samples/pet/. For AV45-PET, mean florbetapiruptake within four cortical regions (frontal, angerior/posterior cingulate, lateral parietal, and lateral temporal) wasextracted. Cortical standardized uptake value ratios (SUVRs)were calculated by averaging across the four cortical regionsand dividing this average by whole cerebellum. Each meanflorbetapir uptake of the four main regions and cortical SUVRwere used for analysis. The final AV45-PET analyses com-prised 619 individuals (220 NC and 399 MCI) with baseline
AV45-PET and corresponding genetic data. For longitudinalanalysis, we calculated the 2-year changes of AV45-PET in340 individuals (119 NC and 221 MCI).
The FDG uptake for each subject was determined within aset of pre-defined regions of interest (metaROIs) based on aliterature review [12]. PET images were spatially normalizedin Statistical Parametric Mapping (SPM) to the MNI PETtemplate. We extracted the mean counts from the fivemetaROIs (left angular gyrus, right angular gyrus, bilateralposterior cingular, left inferior temporal gyrus, right inferiortemporal gyrus) for each subject’s FDG scans at each timepoint, computing the intensity values with SPM subroutines.Finally, we intensity-normalized each metaROI mean by di-viding it by pons/vermis reference region mean. The finalFDG-PET analyses comprised 574 individuals (193 NC and381 MCI) with baseline FDG-PET and corresponding geneticdata. We also calculated the 2-year changes of CMRgl onFDG-PET for longitudinal analysis (363 individuals including127 NC and 236 MCI).
The high-quality data of structural volumetric MRI wereavailable in the ADNI data archive provided by the Universityof California, San Francisco (UCSF) medical center. Volumesof 119 brain regions were calculated in FreeSurfer (in cubicmillimeters) for each subject in the dataset at each time point.In present study, we focused on the most discriminant ROIsthat had been found to be strongly associated with AD basedon a literature search. These selected regions were the hippo-campus, the entorhinal cortex, primary temporal cortex areas,cingulate cortex, amygdala, thalamus, caudate, and lateralventricle. There were 327 subjects (127 119 NC and 217208 MCI) with baseline imaging volumes from UCSF andcorresponding genetic data included in the MRI analysis. Ad-ditionally, it has been demonstrated that atrophy in the hippo-campus and entorhinal cortex of the temporal lobes were theearliest sites associated to evidences of AD. Thus, we alsocalculated 1-year percent volumetric changes of hippocam-pus, entorhinal cortex, and temporal cortex (including superi-or temporal gyrus, middle temporal gyrus, inferior temporalgyrus, and temporal pole) using baseline and 1-year imagingdata (divide 1-year changes by baseline) for longitudinal anal-ysis (322 individuals, including 116 NC and 206 MCI).
Statistical Analysis
Demographic characteristics of our subjects were presentedusing means and standard deviations (SDs) for continuousvariables and proportions for categorical variables. Demo-graphics and genotypic frequencies were compared using ttest or chi-square tests. Each of the four SNPs was examinedfor associations with the neuroimaging endophenotypes foreach diagnostic group separately (NC and MCI). A multiplelinear regression model was applied to examine the indepen-dent associations and the dosage effect of each minor allele
Mol Neurobiol (2016) 53:4343–4351 4345

(0=major allele homozygotes, 1=heterozygous, 2=minor al-lele homozygotes) between SNPs and quantitative phenotypescontrolling for the covariates, which were baseline age, gen-der, years of education, and number of APOE ε4 allele foreach diagnostic group separately. We used the IBM SPSSsoftware (version 19.0 for Windows; Chicago, IL, USA) forstatistical analyses. We applied correlation matrix analysis tocalculate potential association between all phenotypes. Aspresented in Supplementary Tables S1, S2, and S3, correlationmatrix analysis revealed limited association between pheno-types (correlation coefficient range, 0.92 to 0.98 for AV45-PET, 0.6 to 0.85 for FDG-PET, −0.5 to 0.93 for MRI), sug-gesting that independent analysis was needed for associationwith genetic variants. All results were reported as nominallysignificant if a raw P value is <0.05. To account for multipletesting, we performed a Bonferroni correction (Pc) for thenumber of tests applied in each analysis.
Results
Linkage Disequilibrium Analysis
A representation of PLD3 genomic organization and LD pat-terns, as well as the SNPs evaluated in the present study, isdepicted in Fig. 1. SNP rs7249146 was located in the up-stream of PLD3 gene, and the other three (rs4490097,rs12151243 and rs10407447) were located in the intron. LDanalysis revealed that there were four blocks in the PLD3gene. The selected SNPs distributed from block 1 to block 3,confirming that these SNPs could capture most of commonvariants in PLD3. Rs4490097 and rs12151243 were in thesame LD block (block 2). Furthermore, we found that thesefour SNPs were not in LD with the previously reported rarevariants (rs145999145 and rs4819) which conferred risk forAD.
Demographic and Clinical Characteristics
Subject demographics, cognitive status, and SNP distributionsof NC and MCI groups are summarized in Table 1. The MCIindividuals were significantly younger than NC (p<0.01).Gender and education did not vary significantly between thedifferent groups. As expected, frequency of the APOE ε4allele was significantly higher in MCI patients than NC.CDRSB (P<0.01), ADAS11 (P<0.01), ADAS13 (P<0.01),MMSE (P<0.01), RAVLT (P<0.01), and FAQ (P<0.01)score differed significantly by diagnostic group with betterperformance in the expected direction of NC>MCI.
The MCI group had hippocampal volumes that were sig-nificantly smaller as compared to those of the NC group(P<0.01). Furthermore, no significant differences in the
frequency of four SNPs in the MCI individuals were detectedcompared with NC in this study.
Impacts of PLD3 Genetic Variants on AV45-PETand FDG-PET
In the analysis of AV45-PET, no SNPs showed significanteffects on florbetapir retention in the four main regions (fron-tal, angerior/posterior cingulate, lateral parietal, lateral tempo-ral), as well as the cortical SUVR (Supplementary Table S4).Likewise, we did not detect any significant associations on thechanges over 2 years of these regions in the NC and MCIgroups.
Regarding the FDG-PET analyses, only rs10407447 wasassociated with the CMRgl on FDG-PET in the left angulargyrus and bilateral posterior cingulate cortex in theMCI group(P=0.042 and P=0.028, respectively) (SupplementaryTable S5). The differences in these traits among individualswith different genotypes are presented in Fig. 2. The minor Gallele carriers of rs10407447 had higher CMRgl in both theleft angular gyrus and bilateral posterior cingulate cortex, withthe dosage effect of G allele (AA<GA<GG). However, noassociation remained statistically significant after Bonferronicorrection. We did not detect any significant association for allSNPs on the CMRgl percent changes over 2 years (Supple-mentary Table S6).
Impacts of PLD3 Genetic Variants on Regional Volume
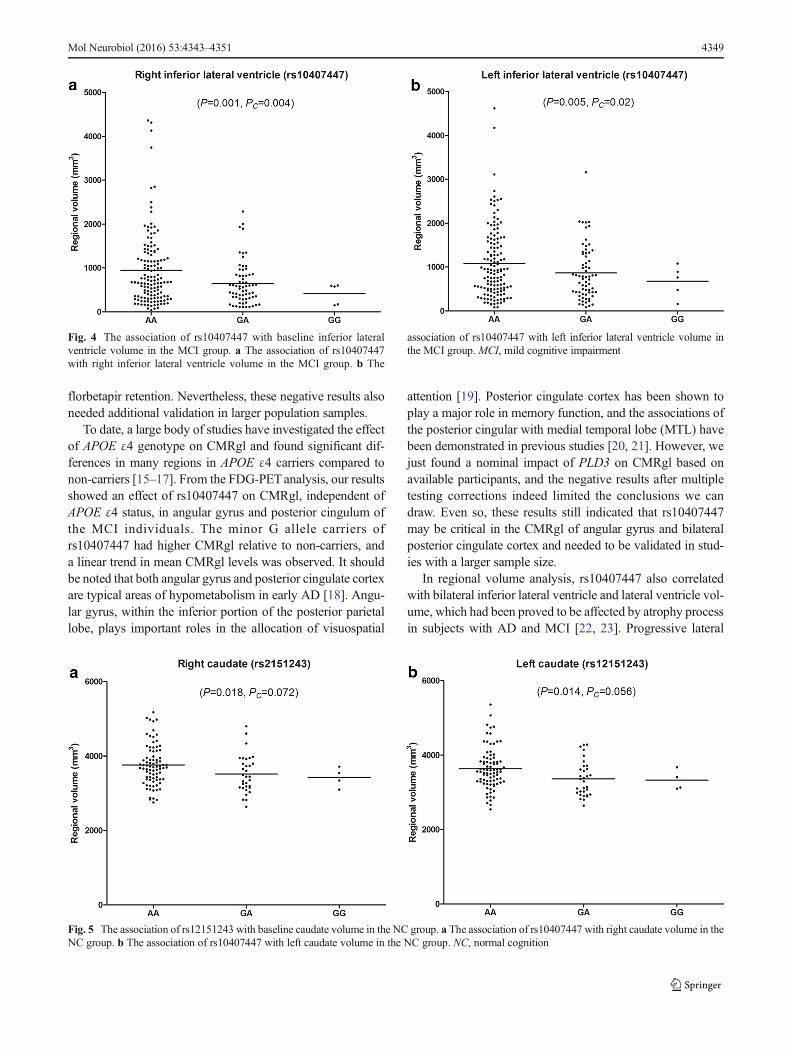
A number of regional volumes, including lateral ventricle,inferior lateral ventricle, and caudate, were identified to havestrong associations with two SNPs (rs10407447 andrs12151243), independent of APOE, in the structural MRIanalyses (Supplementary Tables S5 and S7). There was a sig-nificant association between rs10407447 and baseline rightand left lateral ventricle volumes in the MCI group (Pc=0.032 and Pc=0.048, respectively, Fig. 3). Rs10407447 minorG allele carriers had smaller lateral ventricle volume than Aallele homozygotes subjects in the MCI group (AA>GA>GG). In addition, rs10407447 was also significantly associat-ed with baseline right and left inferior lateral ventricle volumein MCI group (Pc=0.004 and Pc=0.02, respectively, Fig. 4),with minor G allele carriers showing smaller inferior lateralventricle volume (AA>GA>GG). We also detected an asso-ciation between rs10407447 and right hippocampus volumein the MCI group (P=0.023). However, this finding was notsignificant after the Bonferroni correction (Pc=0.092).
Both the right (P=0.018) and left (P=0.014) caudate vol-umes were found to be nominally associated with rs12151243in the NC group (Fig. 5). However, no association remainedstatistically significant after Bonferroni correction. A trend fora relationship was observed in the left caudate volumes, whichdid not reach statistical significance (Pc=0.056). The minor T
4346 Mol Neurobiol (2016) 53:4343–4351

Fig. 1 PLD3 genomicorganization and linkagedisequilibrium plot. a PLD3genomic organization. Exons arepresented as gray blocks; linkagedisequilibrium blocks areindicated by dotted box. TheSNPs analyzed in the presentstudy and the previously reportedSNPs are indicated by arrowsaccording to their genomicposition. The reported SNPs arealso indicated by dotted box. bLinkage disequilibrium plot. TheSNPs analyzed in the presentstudy are indicated by black box;the reported SNPs are indicatedby dotted box
Table 1 Demographic andclinical characteristics Number NC Number MCI P value
Age (years) 261 74.68±5.48 456 72.48±7.37 <0.01
Gender (men/women) 261 131/130 456 271/185 0.06
Education (years) 261 16.42±2.64 456 16.01±2.84 0.074
APOE ε4 (0/1/2) 259a 187/66/6 453a 247/167/39 <0.01
CDRSB 261 0.03±0.13 456 1.43±0.85 <0.01
ADAS11 261 5.82±2.90 456 9.50±4.39 <0.01
ADAS13 261 9.11±4.21 456 15.14±6.90 <0.01
MMSE 261 29.07±1.16 456 27.91±1.67 <0.01
RAVLT total 261 44.58±10.14 456 36.16±10.92 <0.01
FAQ 261 0.17±0.66 456 2.76±3.97 <0.01
Hippocampus (mm3) 237b 7315.57±891.77 396b 6991.99±1132.78 <0.01
Genotypes
rs7249146 (TT/CT/CC) 261 110/123/28 456 200/202/54 0.746
rs4490097 (AA/CA/CC) 260c 90/128/42 453c 146/231/76 0.809
rs12151243 (GG/TG/TT) 261 177/77/7 456 316/124/16 0.697
rs10407447 (AA/GA/GG) 261 184/73/4 455d 315/127/13 0.532
Data are presented as means±SD for continuous variable and proportions for categorical variables. P valueindicates the value for the main effect of each group, as assessed with analyses of t test or chi-square tests
NC normal cognition, MCI mild cognitive impairment, CDRSB Clinical Dementia Rating Scale Sum of Boxes,ADAS Alzheimer’s Disease Assessment Scale, MMSE Mini-Mental State Exam, RAVLT Rey Auditory VerbalLearning Test, FAQ Functional Activities Questionnairea Two NC and three MCI lack corresponding APOE ε4 datab Twenty-four NC and 60 MCI lack corresponding Hippocampus volume datac One NC and three MCI lack the genotyping data of rs4490097dOne MCI lacks the genotyping data of rs10407447
Mol Neurobiol (2016) 53:4343–4351 4347

allele carriers showed significant smaller caudate volume withthe dosage effect of T allele (GG<TG<TT). We did not detectany significant association for all SNPs on the regional vol-ume percent changes over 1 year from the longitudinal anal-ysis (Supplementary Table S7).
Discussion
PLD3, also known as Hu-K4, is located at chromosome19q13.2 and encoded the PLD3 protein which is highlyexpressed in neurons [13]. Some rare variants of PLD3 havebeen identified as AD susceptibility loci, whereas little isknown about the potential role of common variants in the
progression of AD. To our knowledge, this is the first studywhich finds effects of common variations at the PLD3 locuson neuroimaging phenotypes in non-demented elderlysubjects.
Cerebral amyloid deposition, as caused by altered process-ing of amyloid precursor protein (APP), is considered to be aprimary etiologic factor in AD. AV45-PET imaging is corre-lated with the presence and deposition of Aβ and has been inwide use as a research biomarker of AD [14]. More remark-ably, a recent study found that PLD3 appeared to be involvedin the processing of APP independently [7]. Therefore, geneticvariations of PLD3 might influence the cortical amyloid de-position by modifying the expression of PLD3. In our study,no significant effect was detected for all tested SNPs on
Fig. 2 The association of rs10407447 with baseline CMRgl on FDG-PET in the MCI group. a The association of rs10407447 with CMRgl inthe left angular gyrus in the MCI group. b The association of rs10407447
with CMRgl in bilateral posterior cingular in the MCI group. FDG-PET,18F-fluorodeoxyglucose positron emission tomography; MCI, mild cog-nitive impairment; CMRgl, cerebral metabolic rate for glucose
Fig. 3 The association of rs10407447 with baseline lateral ventriclevolume in the MCI group. a The association of rs10407447 with rightlateral ventricle volume in the MCI group. b The association of
rs10407447 with left lateral ventricle volume in the MCI group. MCI,mild cognitive impairment
4348 Mol Neurobiol (2016) 53:4343–4351
florbetapir retention. Nevertheless, these negative results alsoneeded additional validation in larger population samples.
To date, a large body of studies have investigated the effectof APOE ε4 genotype on CMRgl and found significant dif-ferences in many regions in APOE ε4 carriers compared tonon-carriers [15–17]. From the FDG-PETanalysis, our resultsshowed an effect of rs10407447 on CMRgl, independent ofAPOE ε4 status, in angular gyrus and posterior cingulum ofthe MCI individuals. The minor G allele carriers ofrs10407447 had higher CMRgl relative to non-carriers, anda linear trend in mean CMRgl levels was observed. It shouldbe noted that both angular gyrus and posterior cingulate cortexare typical areas of hypometabolism in early AD [18]. Angu-lar gyrus, within the inferior portion of the posterior parietallobe, plays important roles in the allocation of visuospatial
attention [19]. Posterior cingulate cortex has been shown toplay a major role in memory function, and the associations ofthe posterior cingular with medial temporal lobe (MTL) havebeen demonstrated in previous studies [20, 21]. However, wejust found a nominal impact of PLD3 on CMRgl based onavailable participants, and the negative results after multipletesting corrections indeed limited the conclusions we candraw. Even so, these results still indicated that rs10407447may be critical in the CMRgl of angular gyrus and bilateralposterior cingulate cortex and needed to be validated in stud-ies with a larger sample size.
In regional volume analysis, rs10407447 also correlatedwith bilateral inferior lateral ventricle and lateral ventricle vol-ume, which had been proved to be affected by atrophy processin subjects with AD and MCI [22, 23]. Progressive lateral
Fig. 4 The association of rs10407447 with baseline inferior lateralventricle volume in the MCI group. a The association of rs10407447with right inferior lateral ventricle volume in the MCI group. b The
association of rs10407447 with left inferior lateral ventricle volume inthe MCI group. MCI, mild cognitive impairment
Fig. 5 The association of rs12151243 with baseline caudate volume in the NC group. a The association of rs10407447 with right caudate volume in theNC group. b The association of rs10407447 with left caudate volume in the NC group. NC, normal cognition
Mol Neurobiol (2016) 53:4343–4351 4349

ventricular expansion could reflect atrophy of the surroundinggray and white matter [24, 25]. Previous studies had indicatedthat PLD3 was expressed at higher levels in brain, especiallyin neurons, than in non-nervous tissues [26]. In the brain,PLD3 was also observed to be involved in processes associ-ated with cell innervation, neurotransmission, and neuronalsurvival. PLD3 expression appeared to coincide with late neu-ronal development in the hippocampus and the primary so-matosensory cortex [26]. Although the common variantrs10407447 is located in the intron of PLD3 gene, this SNPmight be in same LD block with functional variants and havethe power to affect the function or expression of PLD3 andthen affect the neuronal survival and atrophy progression. Ofnote, rs10407447 was not in LD with the reported risk SNP(rs145999145 and rs4819), indicating that its role cannot beexplained by the original rs145999145 or rs4819 association.
Previous MRI-based studies had repeatedly proved thathippocampal atrophy was a recognized biological marker ofAD [24, 27]. We also provided weak evidence for the associ-ation of rs10407447 and hippocampal volume in MCI indi-viduals. Considering the prior evidence of its involvement inCMRgl, rs10407447 seemed to be a highly associated candi-date locus, especially in individuals with MCI. MCI was themost commonly accepted prodromal AD stage. Therefore, ourfindings provided valuable evidence that rs10407447 may bean important mediator of glucose metabolism and structureespecially in these regions in the early stage of AD.
In addition, we identified an effect of one SNP(rs12151243) on bilateral caudate volume in NC individuals.The caudate volume was a highly heritable brain structure, soit was a reasonable point for investigating genetic influenceson brain structure [28]. Remarkably, caudate had been foundimplicated in subjects with AD and was strongly correlatedwith the formation of new associations to acquire explicitmemories and motor learning [29]. Nevertheless, none of the-se associations survived the multiple testing corrections. Itmay be due to low-power, small sample sizes of the NC group,further suggesting that it is important to validate the effects ofthis SNP on these regions.
In our study, we also analyzed changes over 1 or 2 years onflorbetapir retention, CMRgl, and regional volume. However,we did not find any significant results for longitudinal analy-sis. The small number of participants in the longitudinal co-hort was especially problematic for the negative results. An-other possible explanation could be that the impact of geneticvariations might not be detected with a relatively short follow-up. Therefore, future analyses in the growing ADNI cohort,with greater numbers and longer follow-up of longitudinalsamples, will allow us to evaluate the effects of PLD3variations.
Given the marginal P value after correction, additional rep-lication of our findings with lager samples was necessary.However, no available independent population for replication
limited the conclusions we can draw.Moreover, some variantsmay be not covered by genotyping arrays of ADNI. The se-lected SNPs in our study just distributed from block 1 to block3 in the PLD3 gene, and none of them covered the fourth LDblock; thus, the PLD3 analysis was also limited by the un-availability of more SNPs in ADNI dataset. Batch effectswhich can be detected by principal components analysis arecommon for genotyping arrays. However, we cannot acquiresufficient information (e.g., batches for each sample) from theADNI dataset to evaluate batch effects in our study. Anotherlimitation of our study was that we just provided evidence forassociation of genetic variants in PLD3, but we were unable toknow the mechanistic means by which they may change ex-pression levels or protein structures or how they might affectphenotypes. Unfortunately, no functional and expression datawere available in ADNI dataset. Future studies incorporating adetailed expression of PLD3 would be more advantageous.
In summary, the main finding of the current study providehere, for the first time, evidence supporting the possible role ofPLD3 common variants in influencing AD-related neuroim-aging phenotypes. Therefore, these candidate loci can nowserve as a target of study in future large replication samples.Nevertheless, further work is necessary to explain the func-tional mechanisms of differences and confirm the causalvariants.
Acknowledgments Data collection and sharing for this project wasfunded by the Alzheimer’s Disease Neuroimaging Initiative (ADNI) (Na-tional Institutes of Health Grant U01 AG024904) and DOD ADNI (De-partment of Defense award numberW81XWH-12-2-0012). This researchwas also supported by National Natural Science Foundation of China(81171209, 81371406, 81000544), the Shandong Provincial OutstandingMedical Academic Professional Program, and the Qingdao Key HealthDiscipline Development Fund.
Conflict of interest The authors declare that they have no competinginterests
References
1. Gatz M, Reynolds CA, Fratiglioni L, Johansson B, Mortimer JA,Berg S, Fiske A, Pedersen NL (2006) Role of genes and environ-ments for explaining Alzheimer disease. Arch Gen Psychiatry63(2):168–174. doi:10.1001/archpsyc.63.2.168
2. Jiang T, Yu JT, Tian Y, Tan L (2013) Epidemiology and etiology ofAlzheimer’s disease: from genetic to non-genetic factors. CurrAlzheimer Res 10(8):852–867
3. Jiang T, Yu JT, Tan L (2012) Novel disease-modifying therapies forAlzheimer’s disease. J Alzheimer’s Dis : JAD 31(3):475–492. doi:10.3233/JAD-2012-120640
4. Harold D, Abraham R, Hollingworth P, Sims R, Gerrish A,Hamshere ML, Pahwa JS, Moskvina V et al (2009) Genome-wideassociation study identifies variants at CLU and PICALM associ-ated with Alzheimer’s disease. Nat Genet 41(10):1088–1093. doi:10.1038/ng.440
5. Lambert JC, Heath S, EvenG, CampionD, Sleegers K, HiltunenM,Combarros O, Zelenika D et al (2009) Genome-wide association
4350 Mol Neurobiol (2016) 53:4343–4351

study identifies variants at CLU and CR1 associated withAlzheimer’s disease. Nat Genet 41(10):1094–1099. doi:10.1038/ng.439
6. Saunders AM, Strittmatter WJ, Schmechel D, George-Hyslop PH,Pericak-Vance MA, Joo SH, Rosi BL, Gusella JF et al (1993)Association of apolipoprotein E allele epsilon 4 with late-onsetfamilial and sporadic Alzheimer’s disease. Neurology 43(8):1467–1472
7. Cruchaga C, Karch CM, Jin SC, Benitez BA, Cai Y, Guerreiro R,Harari O, Norton J et al (2014) Rare coding variants in the phos-pholipase D3 gene confer risk for Alzheimer’s disease. Nature505(7484):550–554. doi:10.1038/nature12825
8. Mattay VS, Goldberg TE, Sambataro F, Weinberger DR (2008)Neurobiology of cognitive aging: insights from imaging genetics.Biol Psychol 79(1):9–22. doi:10.1016/j.biopsycho.2008.03.015
9. Salmon DP, Lange KL (2001) Cognitive screening and neuropsy-chological assessment in early Alzheimer’s disease. Clin GeriatrMed 17(2):229–254
10. Bennett DA, Schneider JA, Arvanitakis Z, Kelly JF, Aggarwal NT,Shah RC,Wilson RS (2006) Neuropathology of older persons with-out cognitive impairment from two community-based studies.Neurology 66(12):1837–1844. doi:10.1212/01.wnl.0000219668.47116.e6
11. Saykin AJ, Shen L, Foroud TM, Potkin SG, Swaminathan S, KimS, Risacher SL, Nho K et al (2010) Alzheimer’s DiseaseNeuroimaging Initiative biomarkers as quantitative phenotypes:Genetics core aims, progress, and plans. Alzheimers Dement : JAlzheimers Assoc 6(3):265–273. doi:10.1016/j.jalz.2010.03.013
12. Landau SM, Harvey D, Madison CM, Koeppe RA, Reiman EM,Foster NL, Weiner MW, Jagust WJ (2011) Associations betweencognitive, functional, and FDG-PETmeasures of decline in AD andMCI. Neurobiol Aging 32(7):1207–1218. doi:10.1016/j.neurobiolaging.2009.07.002
13. Wang J, Yu JT, Tan L (2014) PLD3 in Alzheimer’s Disease. MolNeurobiol. doi:10.1007/s12035-014-8779-5
14. Clark CM, Schneider JA, Bedell BJ, Beach TG, BilkerWB,MintunMA, PontecorvoMJ, Hefti F et al (2011) Use of florbetapir-PET forimaging beta-amyloid pathology. JAMA 305(3):275–283. doi:10.1001/jama.2010.2008
15. Small GW, Mazziotta JC, Collins MT, Baxter LR, Phelps ME,Mandelkern MA, Kaplan A, La Rue A et al (1995)Apolipoprotein E type 4 allele and cerebral glucose metabolism inrelatives at risk for familial Alzheimer disease. JAMA 273(12):942–947
16. Jagust WJ, Landau SM (2012) Apolipoprotein E, not fibrillar beta-amyloid, reduces cerebral glucose metabolism in normal aging. JNeurosci : Off J Soc Neurosci 32(50):18227–18233. doi:10.1523/JNEUROSCI.3266-12.2012
17. Reiman EM, Chen K, Alexander GE, Caselli RJ, Bandy D,Osborne D, Saunders AM, Hardy J (2004) Functional brain abnor-malities in young adults at genetic risk for late-onset Alzheimer’sdementia. Proc Natl Acad Sci U S A 101(1):284–289. doi:10.1073/pnas.2635903100
18. Minoshima S, Giordani B, Berent S, Frey KA, Foster NL, Kuhl DE(1997) Metabolic reduction in the posterior cingulate cortex in veryearly Alzheimer’s disease. Ann Neurol 42(1):85–94. doi:10.1002/ana.410420114
19. Cattaneo Z, Silvanto J, Pascual-Leone A, Battelli L (2009) The roleof the angular gyrus in the modulation of visuospatial attention bythe mental number line. NeuroImage 44(2):563–568. doi:10.1016/j.neuroimage.2008.09.003
20. Johnson SC, Christian BT, Okonkwo OC, Oh JM, Harding S, XuG,Hillmer AT,Wooten DWet al (2014) Amyloid burden and neuralfunction in people at risk for Alzheimer’s disease. Neurobiol Aging35(3):576–584. doi:10.1016/j.neurobiolaging.2013.09.028
21. Wu TC, Wilde EA, Bigler ED, Yallampalli R, McCauley SR,Troyanskaya M, Chu Z, Li X et al (2010) Evaluating the relation-ship between memory functioning and cingulum bundles in acutemild traumatic brain injury using diffusion tensor imaging. JNeurotrauma 27(2):303–307. doi:10.1089/neu.2009.1110
22. Chou YY, Lepore N, de Zubicaray GI, Carmichael OT, Becker JT,Toga AW, Thompson PM (2008) Automated ventricular mappingwith multi-atlas fluid image alignment reveals genetic effects inAlzheimer’s disease. NeuroImage 40(2):615–630. doi:10.1016/j.neuroimage.2007.11.047
23. Nestor SM, Rupsingh R, Borrie M, Smith M, Accomazzi V, WellsJL, Fogarty J, Bartha R (2008) Ventricular enlargement as a possi-ble measure of Alzheimer’s disease progression validated using theAlzheimer’s disease neuroimaging initiative database. Brain : JNeurol 131(Pt 9):2443–2454. doi:10.1093/brain/awn146
24. Ridha BH, Barnes J, Bartlett JW, Godbolt A, Pepple T, RossorMN,Fox NC (2006) Tracking atrophy progression in familialAlzheimer’s disease: a serial MRI study. Lancet Neurol 5(10):828–834. doi:10.1016/S1474-4422(06)70550-6
25. Qiu A, Fennema-Notestine C, Dale AM,Miller MI (2009) Regionalshape abnormalities in mild cognitive impairment and Alzheimer’sdisease. NeuroImage 45(3):656–661
26. Pedersen KM, Finsen B, Celis JE, Jensen NA (1998) Expression ofa novel murine phospholipase D homolog coincides with late neu-ronal development in the forebrain. J Biol Chem 273(47):31494–31504
27. Thompson PM, Hayashi KM, de Zubicaray G, Janke AL, Rose SE,Semple J, Herman D, Hong MS et al (2003) Dynamics of graymatter loss in Alzheimer’s disease. J Neurosci : Off J SocNeurosci 23(3):994–1005
28. Kremen WS, Prom-Wormley E, Panizzon MS, Eyler LT, Fischl B,Neale MC, Franz CE, Lyons MJ et al (2010) Genetic and environ-mental influences on the size of specific brain regions inmidlife: theVETSA MRI study. NeuroImage 49(2):1213–1223. doi:10.1016/j.neuroimage.2009.09.043
29. Madsen SK, Ho AJ, Hua X, Saharan PS, Toga AW, Jack CR Jr,Weiner MW, Thompson PM (2010) 3D maps localize caudate nu-cleus atrophy in 400 Alzheimer’s disease, mild cognitive impair-ment, and healthy elderly subjects. Neurobiol Aging 31(8):1312–1325. doi:10.1016/j.neurobiolaging.2010.05.002
Mol Neurobiol (2016) 53:4343–4351 4351