
IMPACT OF CHINA AFRICA INVESTMENT …...IMPACT OF CHINA – AFRICA INVESTMENT RELATIONS: AN IN-DEPTH...
53
IMPACT OF CHINA – AFRICA INVESTMENT RELATIONS: AN IN-DEPTH CASE STUDY OF MAURITIUS Vinaye D. Ancharaz and Baboo M. Nowbutsing Department of Economics and Statistics University of Mauritius Email: [email protected] [email protected] Interim report: October 2009 Final report: May 2010 Submitted to the African Economic Research Consortium (AERC)
Transcript of IMPACT OF CHINA AFRICA INVESTMENT …...IMPACT OF CHINA – AFRICA INVESTMENT RELATIONS: AN IN-DEPTH...

IMPACT OF CHINA – AFRICA INVESTMENT RELATIONS:
AN IN-DEPTH CASE STUDY OF MAURITIUS
Vinaye D. Ancharaz and Baboo M. Nowbutsing
Department of Economics and Statistics
University of Mauritius
Email: [email protected]
Interim report: October 2009
Final report: May 2010
Submitted to the African Economic Research Consortium (AERC)
2
1. Introduction
1.1 Problem Statement
Openness to trade goes hand in hand with liberal investment regimes: countries that espouse
export orientation are also friendly towards foreign investors at home while encouraging
investment abroad. China provides a classic example of this two-pronged approach to economic
liberalization. Chinese private and joint-venture firms have become dominant players in global
trade since the major privatisation efforts of the 1980s, combined with ensuing trade and
investment reforms and China’s accession to the WTO.
With FDI inflows surging to a historic high of US$108 million in 2008, China has become the
third largest FDI host after the USA and France. China’s FDI strategy has evolved significantly
since the 1970s. Initially, the Special Economic Zones (SEZs) attracted the bulk of FDI inflows,
but a re-orientation of the SEZs through greater emphasis on advanced technology, a
bureaucratic overhauling of the FDI process and enhanced incentives to investors resulted in a
resurgence of FDI inflows in the 1980s. In recent years, Chinese FDI policy has become
increasingly proactive, with incentives targeted to specific sectors. The strategy has proved
successful. Data on FDI from UNCTAD show that the inward FDI stock has doubled between
1999 and 2008, amounting to some US$378 billion at the end of 2008. Over 50 percent of the
cumulated flows have been absorbed by the manufacturing sector, followed, far behind, by real
estate development.
China provides an interesting case of a developing country that has emerged rapidly as a key
outward investor even as it continued to attract FDI to its shores. This pattern is rather typical of
industrial countries, which attract large amounts of market-seeking inward FDI while investing
abroad by vertically slicing their production chains. However, China’s outward investments are
primarily natural resource-seeking, rather than efficiency-seeking. And, given Africa’s rich
endowment of oil and minerals, it is hardly surprising that the Chinese have turned to Africa. As
a result, Africa has seen a dramatic increase in FDI flows from China over the past two decades.
Chinese FDI stock in Africa has grown from US$49 million in 1990 to US$ 2.6 billion in 2006,
and the momentum was hardly dampened by the recent financial crisis.
The scale of China’s growing presence in Africa through the trade, investment and aid channels
has raised concerns about its possible adverse impacts on African development. In the case of
investment, these fears are in part fuelled by the underlying motivations of Chinese FDI strategy
in Africa. Besada et al. (2008) argue that the recent surge in FDI is a response to the Chinese
government’s strategic call for a “go out” policy launched in 2000. While the Chinese defend
their aggressive investments on the grounds that they yield mutual benefit, promote common
prosperity and support learning from each other, many researchers have attacked China’s
investment strategy as driven by greed and selfishness – that is, the need to feed the hunger for
growth back home (Zafar, 2007). More damning is China’s practice of bundling together aid,
trade and investment, which reduces the real value of an investment project. The so-called
‘Angola mode’ – whereby aid and investment are paid back in oil – has become a framework for
much of China’s investment activity in Africa (Kaplinsky and Morris, 2008). This framework is
objectionable on the grounds that, by minimizing the local content, it prevents African
economies from effectively participating in major investment projects, which reduces not only

3
the multiplier effect on income but also denies them the opportunity to learn and, ultimately,
fully own the project.
Besada et al (2008) have argued that the hype about China’s engagement in Africa is somewhat
exaggerated. They point out that, while the annual growth rates of trade and investment have
averaged 30 percent per year since the late 1990s, China’s shares of these flows are relatively
low and, in some cases, lower than other countries’ shares. For example, while China accounted
for a lofty $520 million of inward FDI in Africa in 2006, this amount represents less than 1.5
percent of total FDI flows to Africa. Similarly, China represented only 8.6 percent of African
exports and 9.6 percent of African imports in 2006, lower than the trade shares of Africa’s
traditional trading partners. However, African interdependence with China is growing rapidly,
the authors conclude.
Moreover, Wang and Bio-Tchané (2008) demonstrate that Africa’s trade with China is no
different in composition than that of its traditional trade partners, namely the US and the EU,
suggesting that Africa-China trade largely reflects the two countries’ respective comparative
advantages. This finding implies that statements about China exploiting Africa’s natural
resources are unjustified since all of Africa’s other import partners are doing the same.
Be what it may, African countries can see in China’s spectacular rise an opportunity to unleash a
virtuous circle of trade- and investment-led growth long denied to them by a confluence of
historical and political factors. Also, the timing can hardly be better as sub-Saharan Africa has
witnessed a return to democracy and peace (Ndulu and O’Connell, 1999) and as the region
continues to record sustained high rates of economic growth. Foreign investment, and in
particular FDI, is credited for various growth-enhancing benefits to the host country – including
technology and knowledge spillovers, economies of scale and of scope, greater efficiency due to
competition, creation of backward and forward linkages and access to marketing networks that
foreign investors bring along with them (Blomström, and Kokko, 2003).
Mauritius’ position is atypical of the rest of Africa. A small island with no exploitable natural
resources, growing labor shortages, and poor and declining cost competitiveness, Mauritius
offers an unlikely destination for the kind of FDI that the Chinese have generally privileged. Yet,
Mauritius is the very first country in Africa to host one of the seven special economic zones that
the Chinese government has promised to build around Africa. It is clear that the investment flows
into the zone are neither market-seeking, nor resource-seeking nor indeed efficiency-seeking.
What could then explain China’s choice of Mauritius as a host of its industrial zone? This study
argues that Mauritius boasts strong economic fundamentals and, through its various regional
trade agreements and its strategic location in the Indian Ocean as a bridge between Asia and
Africa, offers the perfect gateway to the emerging African market. It is this opportunity, along
with Mauritius’ duty free access to its traditional partners, that China is eying.
Chinese FDI flows into the industrial zone, by their very magnitude and sectoral orientation (into
high-value sectors such as pharmaceuticals and light engineering), are likely to have important
impacts on the economy. The SEZ will generate jobs and foreign exchange earnings even though
the real value to the domestic economy is expected to be smaller since the industrial zone is
likely to be manned mainly by Chinese expatriate workers and export proceeds repatriated to

4
China. However, Mauritius could gain from technology spillovers and linkages with the
domestic economy. We provide a case study of the Chinese SEZ and examine carefully its
potential impacts on the economy.
Finally, much of Africa’s investment relations with China are unidirectional: FDI typically flows
from China to Africa than vice versa. However, Mauritius has defied its small size to become an
important investor in China, with a major spurt of investment in the textile industry by a
Mauritian giant. However, whether that episode is a one-off thing or a harbinger of greater – and
more diversified – investment flows is yet to be determined. Mauritian apparel producers have
been delocalizing to Madagascar to take advantage of its cheap labor. China can offer more:
since the bulk of fabrics originates from China, would it not be more profitable to produce there?
1.2 Objectives
This study follows up on an earlier scoping study of China’s economic impact on Mauritius in
terms of the conventional channels of analysis, that is, trade, investment and aid (see Ancharaz,
2009). It focuses on one of these vectors of influence – namely, investment – and seeks to
provide an in-depth analysis of its magnitude, characteristics and impacts on the Mauritian
economy. The specific objectives are:
1. To compile and present an inventory of FDI inflows by sector and country;
2. To estimate the extent to which such FDI flows represent the creation of new production
capacities (Greenfield investment) as opposed to a mere change in ownership (merger or
acquisition);
3. To analyze the extent to which overall Chinese FDI inflows are bundled with aid;
4. To describe the regulatory regime governing FDI inflows in Mauritius and discuss
whether it is conducive to attracting FDI generally and from China, in particular;
5. To analyze the characteristics of major Chinese FDI, i.e., to determine whether such FDI
is resource-seeking, market-seeking or efficiency-seeking and whether the output is
targeted at the domestic or external market;
6. To compare and contrast the characteristics and practices of Chinese FDI and FDI from
other sources with a view to determining whether Chinese FDI is motivated by strategic
considerations atypical of mainstream FDI;
7. To assess the economic benefits that arise from major Chinese FDI in terms of export
expansion, reduction of import dependence, contribution to value added and employment,
government revenue, etc.
8. To analyze the ownership structure of incoming FDI, i.e., whether FDI is wholly – owned
or is through joint – ventures, in which case the mix of local and foreign equity
participation, as well as the identity of the investors, become of interest.
9. To assess the spread effects, if any, of Chinese FDI to other sectors of the economy in
terms of skill development and capability building, the use of local inputs, supply chain
management and technology transfer.

5
10. To determine the features, size and sectoral distribution of Mauritius’ investment in
China (if any) and the nature of support, or lack thereof, that such outward investments
have received from the home government as well as from Chinese authorities.
1.3 Organization of the Report
The report is organized as follows. By way of background, section 2 describes the structure of
the Mauritian economy; analyzes FDI inflows by country and sector, with an emphasis on
Chinese FDI; documents Chinese aid to Mauritius and examines whether such aid has been
bundled with FDI (or vice versa); and reviews the investment regime in the two countries.
Mauritius’ outward investment in China, though much less important in size than Chinese
investment in Mauritius, is also explored in this section. Section 3 reviews the theoretical and
empirical literature on FDI, focusing on the heated debate that Chinese investment in Africa has
engendered. Section 4 presents the theoretical framework and methodology. An empirical
analysis, relying mainly on a case study of a specific Chinese FDI project in Mauritius; is
attempted in section 5. We conclude in section 6 with a summary of the key findings and a
discussion of the policy implications arising there from.
2. Background
2.1 Structure of the Economy
Mauritius is a small island economy with an estimated multi-ethnic population of 1.2 million in
2007. Being a former colony of France and Great Britain, Mauritius exhibits clear features of its
colonial heritage in its laws, languages, business ownership and trade structure, among others.
Mauritius is a Westminster-type democracy; elections have regularly been held at 5-year, if not
shorter, intervals. Its laws are a combination of British law and the French Code Napoleon.
English is the official language although French is widely spoken and dominates the written
press.
At the time of independence in 1969, Mauritius inherited an economic structure fashioned by its
colonial past. The island was primarily a sugar plantation, with much of the acreage owned by
the Franco-Mauritians, a very small but economically powerful community. This landed
aristocracy has judiciously utilized its proceeds from sugar exports, and opportunistically taken
advantage of economic incentives, to diversify into textiles, tourism and financial services. In
this, Mauritian exporters have benefited most from the market access privileges under the ACP-
EU Lomé Convention. On the downside, however, these preferences have hindered both product
and market diversification, with exports dominated by sugar and clothing, and the bulk of these
exports still being absorbed by the EU.
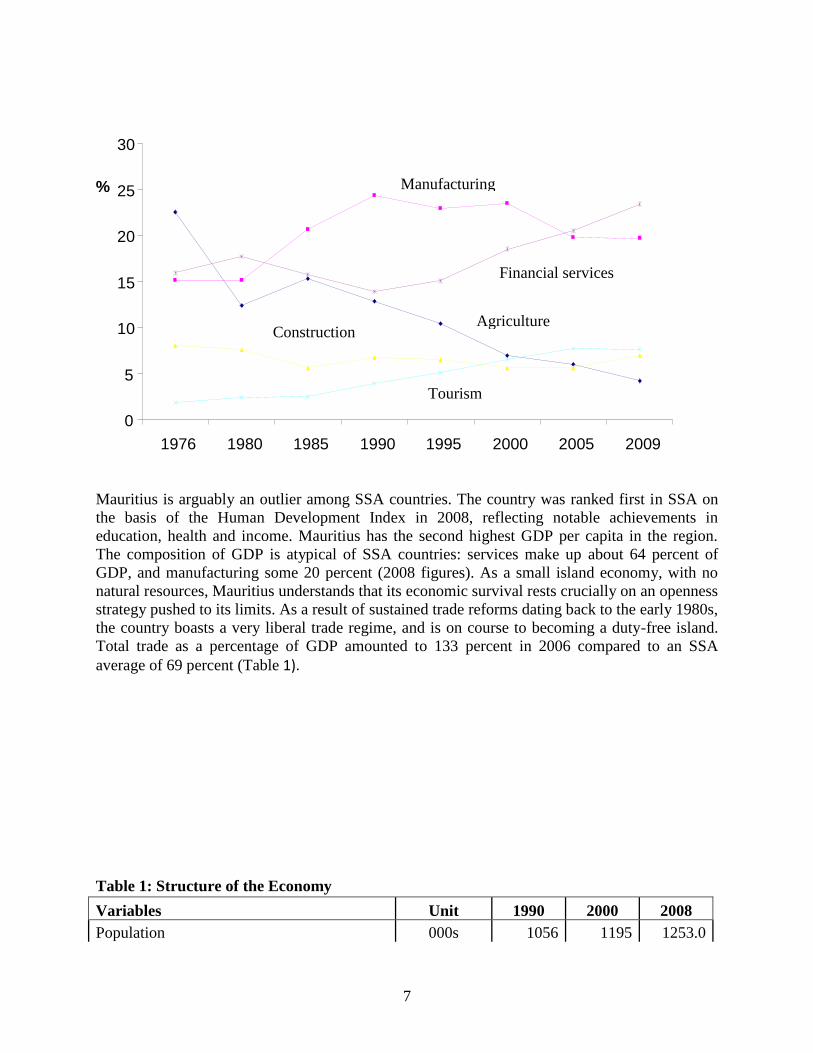
The contemporary Mauritian economy rests on three traditional pillars – sugar, textiles, and
tourism. Financial services are an emerging sector, with considerable potential to contribute to
economic growth. However, the relative significance of these sectors has changed over the years
(Figure 1). Sugar, once the backbone of the economy, has declined to a mere symbolic industry –
it contributed less than 3 percent to GDP in 2007 – even though one may argue that its
6
multifunctional role is much larger. The clothing industry, which thrived under EPZ incentives
and preferential market access, suffered a major setback in the run up to the fateful January 1,
2005, which signaled the end of apparel quotas and the inauguration of a new era of global
competition in clothing exports, featuring formidable players like China, India and others.
However, export data for recent years give an altogether different reading: the clothing industry
has bounced back, with exports in 2007 reaching an all-time peak before the financial crisis took
its toll.
Tourism is perhaps the only sector that has been left unscathed by the treacheries of
globalization. This sector has posted robust growth since 2000 and has contributed significantly
to jobs and foreign exchange earnings. Financial services accounted for some 10 percent of GDP
in 2007. Domestic banks have long dominated financial intermediation in Mauritius although
efforts have recently focused on promoting offshore banking activities by emphasizing the
country’s reputation as a safe financial haven. However, offshore banking has yet to prove its
potential as a driver of growth.
Current government strategy is to reorient the economy’s traditional sectors in light of preference
erosion while promoting new growth avenues. Thus, for example, emphasis is shifting away
from the sugar industry toward a sugar cane industry, which would produce a variety of by-
products – such as ethanol, spirits, and electricity from cane waste – as well as specialty sugars.
In the textiles sector, efforts are being directed to building a vertically integrated clothing
industry encompassing spinning, weaving and dyeing operations, which call for heavy
investments in machinery. Being a high-cost country, Mauritius’ survival strategy rests on
moving into the higher end of the market, where competition is less keen. In tourism, the
objective is to attract 2 million tourists by the year 2015, a more than two-fold increase over the
current figure of 800,000. In parallel, several schemes have been launched to attract high net-
worth individuals to Mauritius by offering them the possibility of owning luxury villas in a
sanctuary-type setting. In the services sector, IT-enabled services are emerging rapidly, fed by
the availability of a pool of computer-literate and bilingual labor, and by the country’s past
investments in telecommunications. Finally, new industries (for example, the seafood hub) are
actively being sought out and promoted to diversify the economy’s industrial and export
structures.
Figure 1: Sectoral Distribution of GDP
7
Mauritius is arguably an outlier among SSA countries. The country was ranked first in SSA on
the basis of the Human Development Index in 2008, reflecting notable achievements in
education, health and income. Mauritius has the second highest GDP per capita in the region.
The composition of GDP is atypical of SSA countries: services make up about 64 percent of
GDP, and manufacturing some 20 percent (2008 figures). As a small island economy, with no
natural resources, Mauritius understands that its economic survival rests crucially on an openness
strategy pushed to its limits. As a result of sustained trade reforms dating back to the early 1980s,
the country boasts a very liberal trade regime, and is on course to becoming a duty-free island.
Total trade as a percentage of GDP amounted to 133 percent in 2006 compared to an SSA
average of 69 percent (Table 1).
Table 1: Structure of the Economy
Variables Unit 1990 2000 2008
Population 000s 1056 1195 1253.0
0
5
10
15
20
25
30
1976 1980 1985 1990 1995 2000 2005 2009
%
Agriculture
Manufacturing
Construction
Tourism
Financial services

8
Source: CSO
GDP per capita US $ 2608 3610 5807.0
Annual real growth rate of GDP % 7.3 9.7 5.6
Inflation rate % 13.5 4.2 9.7
Budget deficit to GDP ratio % -4.1
Unemployment rate % 2.8 8.8 7.2
Investment rate % 30.6 22.9 24.6
GDP at market prices US$ 2382.9 4469.3 8651.1
GDP shares by industry group
Agriculture % 12.9 7.0 4.4
Of which: sugar % 8.0 3.6 1.9
Manufacturing % 24.4 23.5 20.1
Of which: EPZ % … 12.0 5.4
Services % 47.8 59.2 64.0
Of which: Financial and business services % 4.9 9.7 10.9
Government services % 15.0 17.5 18.1
Exports of goods and services
US$
(million) 1721.9 2622.4 4943.8
Share of GDP 64.0 63.0 62.0
Imports of goods and services
US$
(million) 1915.8 2706.9 6319.8
Share of GDP % 71.0 65.0 70.0
Current balance as % of GDP % -5.0 -1.0 -11.0
FDI as a % of GDP % 6.5 14.7 12

9
2.2 FDI Analysis
Mauritius boasts a fairly liberal investment climate, and recent reforms have further
enhanced the attractiveness of the investment regime by cutting red tape and fast-tracking
applications for an investment permit. Fiscal incentives, combined with macroeconomic
strength and political stability, have led to important flows of FDI in Mauritius. However,
these inflows have been neither steady nor evenly distributed across sectors of economic
activity.
2.2.1 Trends in FDI flows in Mauritius
The country became a significant FDI host in the mid-1980s when the EPZ attracted a
number of Hong Kong-based clothing firms seeking to relocate in the face of the political
uncertainty surrounding the handing over to China. This spurt of FDI inflow started in
1987 but did not last beyond 1990, after which FDI flows took a dip. These same firms
exited the EPZ between 2001 and 2005, leading to massive disinvestments, as they saw
preferential access to the US market wither away while the scepter of fiercer competition
loomed large with the expiry of the Multifiber Arrangement at the end of 2004. Net
inflows nevertheless remained positive largely thanks to the performance of services
(banking, tourism and property development), which have become a magnet of FDI
inflows in recent years
On the whole, FDI inflows have exhibited considerable fluctuations over the years. Until
2004, FDI flows were marginal, with sporadic spikes in 1997, 2000 and 2003 (Figure 2).
A clear upward trend in the flows has emerged only after 2004, driven by a structural
shift towards services.
Figure 3 shows the cumulative FDI inflows over the period 1970-2008. It appears that the
FDI stock has evolved in three distinct stages: it was relatively stagnant from 1970 to
1986; then increased rapidly from 1987 to 2000; and, increased even faster after 2000.
The total inward FDI stock in 2008 was estimated at $1.66 billion in 2008, up 147
percent from its 2000 level. The FDI stock is likely to increase further and the pace likely
to accelerate, as the country starts to receive spurts of Chinese FDI into the upcoming
economic cooperation zone.

10
Source: UNCTAD (2009)
Source: UNCTAD (2009)
2.2.2 FDI inflows by sector
Mauritius has failed to attract FDI into productive sectors such as agro-business and
manufacturing. Over the 10-year period under analysis, about one-third of FDI flows
have been absorbed by the banking and financial services sector, and another 30 percent
have gone to the tourism industry. Transport and communications come in third position
only because of the one-off purchase of a 49-percent stake in Mauritius Telecom by
France Telecom in 2000. The real estate sector has received a major boost in recent years
through the Integrated Resort Scheme, which seeks to attract financially endowed

11
individuals by offering them the alluring opportunity to acquire a luxury villa on the
tropical island of Mauritius. The Real Estate Scheme also works in the same direction.
The manufacturing and agricultural sectors together have attracted a little over 5 percent
of total FDI flows over the past decade. In manufacturing, foreign investment has flowed
mainly into the textile and clothing industry, with major, albeit erratic, investments in
capital-intensive spinning and weaving operations. In the agricultural sector, the
processed tuna industry has attracted spurts of FDI in 2004 and 2008. However, despite
government’s efforts to diversify the manufacturing base by emphasizing light
engineering, electronics, pharmaceuticals and agro-processing, among others, little
success has so far been registered in attracting the scale and type of FDI that would give a
boost to these industries.
It seems that Mauritius is not competitive enough in these sectors due to geographical and
systemic factors. The sharp rise in wages and shrinking labor supply as Mauritius
witnessed a protracted period of EPZ-led economic boom, starting in the mid-1980s and
continuing through much of the 1990s, has made the island economy a victim of its own
success. In light engineering and pharmaceuticals, additionally, Mauritius’ small size
precludes the availability of a critical mass of skilled labor vital to sustaining the
industry’s development. Also, since Mauritius lacks natural resources and needs to source
inputs and intermediates from remote markets, there is little scope to generate significant
added value, thus limiting these industries to mere assembly, where the high cost of labor
and stagnating productivity confer a further competitive disadvantage. This is true also of
the electronics industry in which Mauritius is struggling to make a dent, and now seems
to have given up altogether. In the fish processing industry, there are currently only two
large firms, one of which is wholly foreign-owned and the other is a joint venture with
majority foreign equity participation.
On the whole, it appears that Mauritius has managed to attract the largest amounts of FDI
in low-risk, high-return sectors like tourism and banking. In the tourism industry,
Mauritius boasts a natural advantage and has traditionally targeted its former colonies,
especially France, as tourist markets – a strategy that has paid, given the predominant
presence of the Franco-Mauritian community in this sector. Government’s policy is to
foster a controlled, environment-friendly expansion of the tourism industry and to attract
FDI only into large, high-end, high value-added, integrated resorts. Yet, this policy seems
to be in conflict with the goal of increasing tourist arrivals to 2 million by 2015.
In the banking sector, where a few large firms dominate and where the scope for excess
returns exists, aided by a regulatory framework that has failed to correct the inherent
market failures, new, foreign banks have been pouring in recent years, many of them in
the nascent offshore banking sector. This trend is likely to continue in the future as
Mauritius continues to liberalize trade in services. By virtue of Mauritius’ offensive
interests in banking and financial services, few, if any, barriers exist to GATS mode 3
delivery in this sector.

12
To conclude, while FDI inflows have increased over 12-fold between 2001 and 2008, it is
worth noting that much of the increase in recent years (especially since 2005) has been
driven by the remarkable performance of three service sectors, namely financial
intermediation, tourism and real estate business. The productive sectors have failed to
attract significant amounts of FDI, which casts doubt on the effectiveness of the national
investment strategy as well as raising questions about the country’s capability to attract
FDI in these sectors. On the one hand, FDI inflows seem to follow the long-term
structural shift in the economy towards services. On the other, it appears that
government’s entrepreneurship has resulted in a process of creative destruction. As new
sectors were aggressively promoted, resources have domestically shifted out of
traditional sectors into these emerging sectors, and FDI followed suit.1
Table 2: Mauritian FDI inflows by Sector, 2000 – 2009 (Rs. millions)
Sector 2000 2001 2002 2003 2004 2005 2006 2007 2008 2009
Agriculture, hunting and
forestry 14 484 19 26 12 447
Fishing 1 6
Manufacturing 37 5 65 127 387 263 181 271 149 12
Electricity, gas and water
supply 9 3 25 17
Construction 245 1 14 46 11 45 68 174
Wholesale and retail trade;
repair of motor vehicles,
motorcycles and personal and
household goods 1 14 386 288 123 510 198 38 103
Hotels and restaurants 10 99 103 121 536 2610 5979 3985 448
Transport, storage and
communications 7204 21 13 1 47 191 56 18 22
Financial Intermediation 600 316 1311 392 481 3593 4056 4564 239
Real estate, renting and
business activities 3 34 100 109 228 759 473 1030 1888 416
Education 2 55 30 74 49
Health and Social work 2 29 120
Total 7264 936 979 1966 1797 2807 7222 11514 11419 1338
Exchange rate (MRU/US$) 26.3 29.1 30.1 28.5 28.0 29.8 31.8 31.8 31. 8 31. 9
In US Dollar (million) 276.7 32.1 32.51 69.0 64.1 94.1 226.9 362.6 359.3 41.9
Note: Figures for 2009 is for January to March.
Source: Bank of Mauritius
1 For example, the Integrated Resort Scheme (IRS) has allowed the sugar industry, hit hard by EU’s sugar
regime reform, to shed large plots of land for property development targeted at wealthy foreigners who,
under the scheme, could become rightful owners of a luxury villa in Mauritius if they could commit
$500,000 or its equivalent in foreign currency to investment in Mauritius. While the IRS has brought in
foreign exchange and allowed the government to collect larger tax revenues, its real economic value in the
long run remains dubious.

13
2.2.3 FDI inflows by country
Mauritius has received most of its FDI from Europe, with UK and France occupying top
spots. UK has invested Rs. 9,812 million (about US$ 309 million at 2008 exchange rates)
over the period 2000-08. While FDI from France amounted to Rs 11,739 million over the
same period, more than half of this amount (Rs 7,214 million) represented the acquisition
of equity stake in Mauritius Telecom by the French counterpart. With investments of Rs.
4,357 million, much of which occurred in the last three years, the United States comes in
third position. It would be interesting to know which sectors of activity each of these
countries has favored or to determine whether such investor specificities exist in the first
place. Unfortunately, data by country and by sector are not available. While all three
countries are likely to have invested in the emerging services sector, the UK has also
made significant investments in the processed tuna industry, France in business process
outsourcing and the US in IT.
FDI inflows from less developed countries have been less sizeable but more diversified
than developed countries’ investments in Mauritius. For historical and cultural reasons,
India has been the largest investor among developing countries, with investments in a
broad range of sectors, including textiles and clothing, telecommunications, hotels and
banking. South Africans have invested mainly in the last two sectors, and, in recent years,
increasingly in large-scale IRS (property development) projects. The United Arab
Emirates, virtually absent on the investment scene until recently, has emerged as an
important investor, mainly in the tourism industry. Chinese investments have been small
and irregular but this is bound to change with the setting up of a $500 million industrial
zone in Mauritius, fragments of which have already started to flow in.
The above analysis suggests a high degree of concentration in a few FDI source countries
and in a few sectors of economic activity, reminiscent of Mauritius’ concentration in
export markets and products. Not surprisingly, there is a high correlation between
Mauritius’ trade partners and its FDI sources. The EU and the US are Mauritius’ main
export destinations, and they also are its biggest investors. Among the developing
countries, India and South Africa are the second and fourth most important sources of
imports; they are also significant sources of direct investment. China, which is Mauritius’
second largest supplier, is poised to assume an equally important role as an investor in
Mauritius in the coming years.
Table 3: Mauritian FDI by Countries 2000 – 2009(Rs. millions)
Region/Economy 2000 2001 2002 2003 2004 2005 2006 2007 2008 2009
Developed Countries 7221 318 468 406 1548 1807 5505 8316 5740 796
Europe 7219 315 440 369 1029 1732 5338 5936 4676 709
European Union 15 7219 313 440 369 1027 1729 5267 5884 4353 640
Belgium/Luxembourg 10 59 404 81 447 285 23
Luxembourg 29 369 34 69 209 15
France 7214 25 234 157 491 427 523 1176 1167 325
Germany 5 95 46 177 59 172 6
United Kingdom 158 172 143 579 3821 2802 2044 93
Other Developed Europe 5 278 2 42 148 586 1287 606 123

14
Switzerland 5 278 2 42 148 586 1287 606 123
North America 3 3 29 37 518 75 167 2380 1063 87
United States 3 3 29 37 518 75 163 2380 1063 86
Developing Economies 43 600 416 1498 218 987 1685 3196 5679 542
Africa 32 600 336 1197 32 162 296 1124 1929 160
Other Africa 32 600 336 1197 32 162 296 1124 1929 160
Reunion 30 174 5 130 127 577 49 3
South Africa 1 600 336 1022 19 27 38 498 1415 46
Latin America and the Caribbean 16 34 45 25 552 7
South and Central America 13 4 13 457 7
Asia and Oceania 11 80 301 170 791 1344 2047 3198 375
Asia 11 80 301 164 790 1322 1971 3180 373
West Asia 11 8 45 11 24 998 1285 937 153
United Arab Emirates 11 8 45 11 9 114 1285 847 153
South, East and South-East Asia 72 247 153 766 246 669 2126 220
China 18 33 38 6 78 171
Hong Kong, China 9 4 7 30 18 8
India 2 143 149 670 160 610 1921 49
Total World 7265 936 979 1966 1797 2807 7222 11514 11419 1138
Exchange Rate 26.25 29.13 30.11 28.48 28.021 29.83 31.829 31.75 31.785 31.89
In US Dollar (million) 276.72 32.13 32.51 69.02 64.14 94.11 226.9 362.59 359.26 41.96
Note: Figures for 2009 is for January to March
Source: Bank of Mauritius

2.2.4 Mauritius-China investment relations
Chinese investments in Mauritius
Figure 4 shows China FDI inflows to Mauritius from 2000 to 2009. There is a clear
pattern emerging: Chinese FDI is irregular and one-off. Prior to the period under
investigation, Chinese FDI to Mauritius was minimal. For example, no Chinese FDI was
recorded during 7 years in a row from 1995 to 2001. From 2002 to the first quarter of
2009, China invested some US $11 million in Mauritius, which is more than four times
the amount invested over the entire preceding decade. Chinese FDI from 2001 to 2004
was mainly in the construction industry while Chinese FDI in 2005 has flowed into the
textile industry, more precisely into spinning operations.
Figure 4: Chinese FDI in Mauritius (2000 – 2009)
0
1
2
3
4
5
6
1999 2001 2003 2005 2007 2009
Year
US
$ m
illio
n
Source: Bank of Mauritius
Figure 4 shows a hike in Chinese FDI for the last two years since 2007. This is the result
of the launch of the Jin Fei project, a major Chinese industrial zone in Mauritius. The
project, initially named Tianli, will attract Chinese investments from a consortium of
Chinese private firms and state-owned enterprises in emerging industries such as light
processing, pharmaceuticals, and the seafood hub. The SEZ in Mauritius is the second of
its kind to be set up across the African continent following the one established in the
Zambian mining town of Chambishi in February 2009.
China’s decision to set up the SEZs – of which it boasts over a hundred back home, and
which have proved effective clusters for fostering innovation and synergies in a particular
industry – reflects an appreciation by the Chinese government that most of Africa now
present a host of domestic conditions conducive to FDI. It appears that three objectives
16
underpin China’s SEZ strategy in Africa. First, China wishes to penetrate local African
markets with a view to exploiting fully the untapped potential, especially as the
purchasing power of African consumers is expected to continue to increase thanks to
sustained economic growth and rising per capita incomes. It is precisely for this reason
that China is strategically contemplating Nigeria and Egypt, two of Africa’s largest
markets, as potential hosts of the remaining SEZs. China exported close to US$50 billion
in goods to Africa in 2008. Some of these exports could better be produced closer to their
markets.
Second, Chinese investments are also largely resource-seeking. This is certainly the case
with FDI in oil-rich Angola and Nigeria and in copper-abundant Zambia. Less visible
though are Chinese investments in leather tanneries and shoe production in Ethiopia, and
in Ghana’s processed fish industry, capitalizing on these country’s long-standing
comparative advantages in the respective sectors. With the SEZs, China will be able to
better exploit Africa’s natural resources in the production of goods destined for both the
African market and beyond as well as opening up a more efficient conduit for routing
these resources to mainland China to sustain the growth momentum back home.
Third, China wishes to develop logistics in Africa. This strategy explains China’s
financing, and active engagement in the execution, of a number of infrastructure projects
across Africa. The SEZ in Zambia, for example, will develop a cluster of firms producing
bars, wires and cables from copper, nickel and other metals (Brautigam, 2009), part of
which will feed into Chinese industrial production elsewhere on the continent. In the
process, Chinese investments are allowing African countries and firms to travel further
down the supply chain – from mere extraction of resources to higher value-added
processing. The SEZs are also meant to provide a framework for smoothing the
uncertainty and risk associated with investing in Africa, thereby encouraging hesitant
investors to join the bandwagon.
Mauritius neither has natural resources nor a large local market to exploit. Moreover,
production costs in Mauritius are high, work ethics in the EPZ weak, labor generally
scarce and labor productivity stagnant in recent years. Most, if not all, of the African
countries earmarked to host the Chinese SEZs (Algeria, Egypt, Ethiopia, Nigeria and
Zambia) are more cost-competitive than Mauritius and boast several other alluring
advantages. Thus, the question remains as to why China chose Mauritius to host the very
first of its foreign SEZs. The answer lies in a careful analysis of Mauritius’ reputation as
an FDI host. Mauritius offers a permissive investment framework and the right set of
conditions, including strong macroeconomic fundamentals, political stability, rule of law,
and good, reliable and extensive infrastructure. These factors offer a counterweight to
Mauritius’ poor cost-competitiveness, which is further compensated for by the range of
alluring fiscal and other incentives that the country offers to foreign investors. In the case
of China’s Jin Fei project, these ‘perks’ arguably went beyond the official, with the
government making numerous concessions – many controversial – to its Chinese
counterpart.

17
Moreover, the location of Mauritius, situated in the Indian Ocean between Africa, Asia,
and Australia, offers a strategic business base for both regional and international trade.
Chinese companies can use Mauritius as a platform to tap regional markets through the
country’s membership of the Southern African Development Community (SADC) and
the Common Market for Eastern and Southern Africa (COMESA), which offers
preferential access to a market of 380 million consumers.
China’s choice may also be motivated by geopolitical considerations. Several of the
economic powers already have strategic partners in the Indian Ocean. For example,
France has Reunion Island as its département outremer and the UK and USA have
military bases on the island of Diego Garcia. The Indian Ocean has become a maritime
corridor of great importance with the economic emergence of China and India. Having
Mauritius as economic partner will allow China to access and exploit the maritime zone
of Mauritius and maintain a strategic presence in the region.
Chinese FDI inflows
In 2008, incoming FDI in China amounted to US$108.3 billion, about 30 percent higher
than in the previous year. Moreover, the latest figures suggest that FDI inflows have
proved fairly resistant to the financial crisis. While investment flows fell steadily in the
first half of 2009, they have recovered towards the end of the year, and China is now
poised to attract FDI flows higher than the pre-crisis levels. China is the world’s fifth
largest FDI destination after the United States, the United Kingdom, France, and the
Netherlands (UNCTAD, 2009).
Figure 5 shows the trends in China’s inward FDI flows over the period 1984-98. Three
distinct patterns can be discerned from the graph. FDI started to flow into China – mainly
from neighboring Hong Kong – following the launch of special economic zones in the
early 1980s. While FDI flows grew steadily during the 1980s, they remained low by
today’s standards. It was not until the government called for greater spurts of FDI to drive
China’s economic transformation and relaxed restrictions on equity participation –
allowing foreign companies to set up wholly-owned subsidiaries – that FDI really took
off. This is clear from Figure 4: FDI increased sharply after 1992 and continued on an
upward trend throughout the 1990s.
The third phase can be pinned to China’s accession to the WTO in December 2001. This
process signaled an unprecedented opening up of the Chinese economy, which coincided
with the government’s effort to promote private initiative. This positive turnaround led to
massive flows of FDI, which continued unabated until the onset of the financial crisis.
FDI flows fell sharply in the first half of 2009 but, according to reports (in the absence of
official data), the year nevertheless ended on a positive note.
China’s FDI originates mainly from the region itself. Hong Kong is, by far, the biggest
investor in China, followed by Taiwan and Japan. Outside of East Asia, major companies
from United States, UK, Germany and France also have a significant presence in China.
FDI through wholly-owned subsidiaries have emerged as the main channel of investment

18
in China in recent years; yet joint ventures outnumber other types of ownership, including
cooperatives. Most of the FDI has been Greenfield, has occurred in China’s
manufacturing sector and is primarily export-oriented. Indeed, FDI has played a crucial
role in China’s export development. It directly accounted for 55 percent of China’s
exports in 2003, a share that has steadily increased over the years, and is likely to have
exceeded the 60-percent mark at the end of 2009.
Source: UNCTAD (2009)
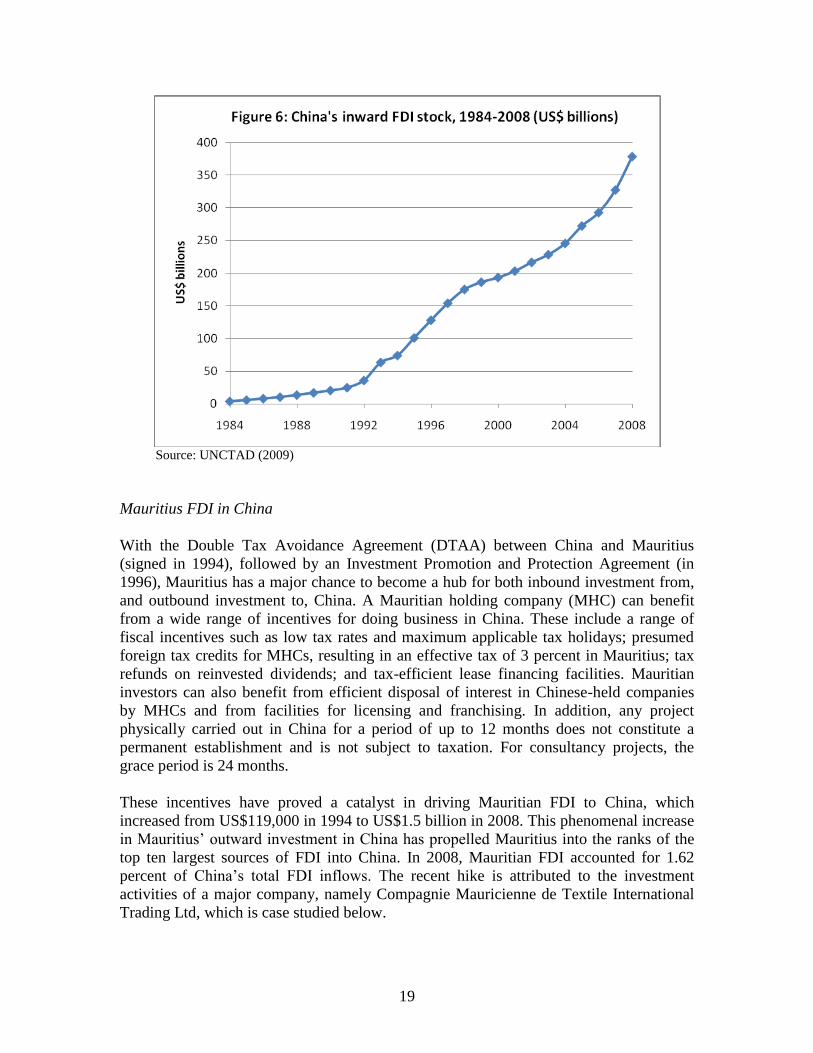
China’s inward FDI stock was estimated at US$ 378 billion as at end-2008. The upturn in
the trend and the further spaced-out scatter points in recent years (in particular, after
2004) show the increased dynamism of China as an FDI destination.
19
Source: UNCTAD (2009)
Mauritius FDI in China
With the Double Tax Avoidance Agreement (DTAA) between China and Mauritius
(signed in 1994), followed by an Investment Promotion and Protection Agreement (in
1996), Mauritius has a major chance to become a hub for both inbound investment from,
and outbound investment to, China. A Mauritian holding company (MHC) can benefit
from a wide range of incentives for doing business in China. These include a range of
fiscal incentives such as low tax rates and maximum applicable tax holidays; presumed
foreign tax credits for MHCs, resulting in an effective tax of 3 percent in Mauritius; tax
refunds on reinvested dividends; and tax-efficient lease financing facilities. Mauritian
investors can also benefit from efficient disposal of interest in Chinese-held companies
by MHCs and from facilities for licensing and franchising. In addition, any project
physically carried out in China for a period of up to 12 months does not constitute a
permanent establishment and is not subject to taxation. For consultancy projects, the
grace period is 24 months.
These incentives have proved a catalyst in driving Mauritian FDI to China, which
increased from US$119,000 in 1994 to US$1.5 billion in 2008. This phenomenal increase
in Mauritius’ outward investment in China has propelled Mauritius into the ranks of the
top ten largest sources of FDI into China. In 2008, Mauritian FDI accounted for 1.62
percent of China’s total FDI inflows. The recent hike is attributed to the investment
activities of a major company, namely Compagnie Mauricienne de Textile International
Trading Ltd, which is case studied below.

20
Box 1
Case Study: The Compagnie Mauricienne de Textile (CMT)
Established in 1986 by Francois Woo and Louis Lai Fat Fur, the Compagnie Mauricienne de
Textile (CMT) portrays an exceptional success story in the Mauritian textile sector. What
started as a small business employing 20 workers at its beginning, the CMT has grown into an
industrial giant, employing over 10,000 people. Furthermore, the company’s operations were
hardly affected by the 2009 financial crisis. With economic recovery in sight, CMT is likely to
grow further, especially thanks to recent plans for the setting up of a new spinning factory.
CMT’s success lies in the fact that the company broadened its horizon to emerge as an active
player in the global scene. CMT International Trading (CMTIT) Ltd was incorporated as a
Freeport Company in Mauritius in 1995 and started its Freeport activities in January 1996.
From its Head Office in Mauritius, CMTIT controls operations in its numerous regional
subsidiaries. Indeed, its branches in Zimbabwe (CMTI Zimbabwe (PVT) Ltd), Madagascar
(Madatrade Sarl, Madakem Sarl & Plasmad Sarl), China and Hong Kong allow distribution of
its wide variety of products over the region. This international network has always been one of
the key strengths of CMTIT Ltd as it helped to provide a better and quicker service to
customers.
When China emerged as a major competitor to the Mauritian textile and clothing industry,
instead of adopting defensive strategies, the CMT promptly invested US$ 65 million in the
construction of an integrated production unit in China in 2005 to exploit China’s large pool of
cheap and adaptable labor, which constitutes its rivals’ very competitive advantage. The China
office of CMTIT Ltd currently boasts a well diversified range of manufactured items – such as
lights and lighting, machinery, office supplies, tools and hardware, and toys – on top of a
variety of textile products. The business continues to grow as the unit today employs more
than 1000 workers.
Source: Company reports and interviews
21
2.3 Aid Analysis
Aid can easily be confused with FDI, especially when aid is directed to infrastructure
projects or to construction. This confusion often arises from China’s financing of
numerous infrastructure projects throughout Africa, and is aided by media reports that
talk of such financing as FDI. However, there should be no room for confusion if one
keeps to the definitions of FDI and aid. FDI results in an equity stake by the investor in
the project. This is clearly not the case in large infrastructure projects such as roads,
dams, stadiums and buildings where Chinese involvement is limited to financing.
Moreover, there is an ongoing debate on the bundling of Chinese aid with FDI in Africa.
This debate is fuelled by the lack of transparency surrounding Chinese aid – including
both aid figures and the real motivations behind specific aid projects. Brautigam (2009)
argues that Chinese aid has served both as a “tool of diplomacy” and “an instrument to
meet political, strategic, and economic goals”. It is conceivable that much of the Chinese
aid in Africa, especially in the earlier years of China’s involvement in Africa was driven
by its desire to win over African countries to its political side in the conflict with Taiwan.
Later, China preached cooperation for mutual benefit in its aid relations with Africa, and
this translated into several aid projects shifting to technical cooperation upon completion.
During the 1980s and early 1990s, the philosophy guiding Chinese aid to Africa was
‘cooperation for mutual benefit’ (Brautigam, 2009, p. 203), which some may interpret as
‘business as usual’. The bulk of aid during this period was tied to the purchase of Chinese
goods and services (equipment, materials and energy). More recently, China’s policy of
aid to Africa has been guided by its silent – and often denied – ambitions of a dominant
economic power on the global scene. And China has largely delivered on its aid promises
made at the Beijing Summit in 2006. These pledges, intertwined with promises of
investment through a dedicated fund and in the form of SEZs, among others, have further
exacerbated the confusion between Chinese aid and FDI.
China has considerably scaled up its aid to Africa. Much of this aid has been in the form
of technical assistance – with emphasis on advanced training in Chinese institutions –,
grants, interest-free loans, preferential loans and debt relief. It is estimated that China’s
financial assistance to Africa amounted to some $19 billion at the end of 2006. Most of
this assistance has been for major projects in energy, telecommunications and
transportation. Aid has also been channeled for infrastructure development and for the
social sector: China has helped build roads, houses, and hospitals. Invariably, the biggest
beneficiaries have been the oil-rich countries of Sub-Saharan Africa, namely Angola,
Equatorial Guinea, Gabon, Republic of Congo, and Nigeria.
Chinese aid2 to Mauritius has not followed the typical African pattern. Mauritius’ long-
standing cultural and diplomatic ties with China due to the presence of a Chinese
2 Chinese “aid” data should be interpreted with caution. The OECD’s DAC defines aid as loans, grants and
associated financing packages with a grant element in excess of 25 percent. The available data on Chinese
22
diaspora, the country’s lack of exploitable natural resources, its strong democratic
tradition, and its more advanced economy mean that aid could not be given on the same
terms as other African countries. Table A.1 in the appendix provides a comprehensive list
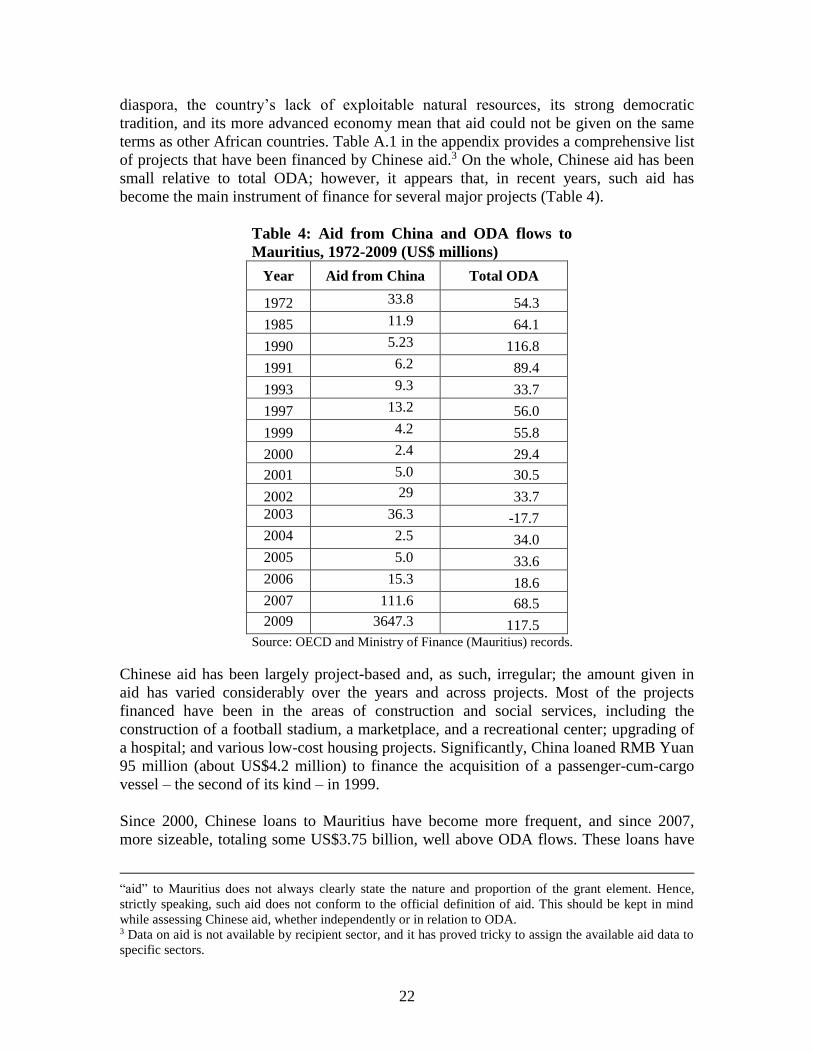
of projects that have been financed by Chinese aid.3 On the whole, Chinese aid has been
small relative to total ODA; however, it appears that, in recent years, such aid has
become the main instrument of finance for several major projects (Table 4).
Table 4: Aid from China and ODA flows to
Mauritius, 1972-2009 (US$ millions)
Year Aid from China Total ODA
1972 33.8 54.3
1985 11.9 64.1
1990 5.23 116.8
1991 6.2 89.4
1993 9.3 33.7
1997 13.2 56.0
1999 4.2 55.8
2000 2.4 29.4
2001 5.0 30.5
2002 29 33.7
2003 36.3 -17.7
2004 2.5 34.0
2005 5.0 33.6
2006 15.3 18.6
2007 111.6 68.5
2009 3647.3 117.5 Source: OECD and Ministry of Finance (Mauritius) records.
Chinese aid has been largely project-based and, as such, irregular; the amount given in
aid has varied considerably over the years and across projects. Most of the projects
financed have been in the areas of construction and social services, including the
construction of a football stadium, a marketplace, and a recreational center; upgrading of
a hospital; and various low-cost housing projects. Significantly, China loaned RMB Yuan
95 million (about US$4.2 million) to finance the acquisition of a passenger-cum-cargo
vessel – the second of its kind – in 1999.
Since 2000, Chinese loans to Mauritius have become more frequent, and since 2007,
more sizeable, totaling some US$3.75 billion, well above ODA flows. These loans have
“aid” to Mauritius does not always clearly state the nature and proportion of the grant element. Hence,
strictly speaking, such aid does not conform to the official definition of aid. This should be kept in mind
while assessing Chinese aid, whether independently or in relation to ODA. 3 Data on aid is not available by recipient sector, and it has proved tricky to assign the available aid data to
specific sectors.

23
financed large-scale projects, including the construction of the new headquarters of the
Mauritius Broadcasting Corporation, the national radio/TV station; expansion of
wastewater networks; modernization of the port; construction of dams; and development
of a new city. In 2009, Mauritius contracted two of the biggest loans yet to finance major
infrastructure works designed to ease traffic around the capital city (about US$830
million) and to build a modern airport terminal (US$260 million).
A key feature of Chinese aid to Mauritius is that most of the loans provided have been on
concessional terms, with generous grace periods and repayment schedules. Grants have
been few, generally limited to capacity building – both human and technical – and much
smaller in amounts. Virtually no conditions have been attached to Chinese aid to
Mauritius (as elsewhere). This lack of conditionality has often been criticized on the
grounds that it could delay reforms in the recipient countries (Zafar, 2007). Such
concerns, however, have little relevance for Mauritius given the country’s long-standing
tradition of democracy and the current government’s commitment to macroeconomic
reforms.
While the absence of conditionality can be a welcome relief, China-financed projects
have, on the downside, had smaller multiplier effects on the local economy because of
their excessive use of Chinese labor and inputs. A potentially more important problem
that has received little attention in discussions of the consequences of Chinese aid is the
risk of bid-rigging in China-financed project tenders. Lines of credit provided by the
Export-Import Bank of China often require that the tenders for the project be open
exclusively to Chinese contractors. Armed with this knowledge, these firms, in turn, bid
high, which often results in the project incurring a cost overrun. Mauritius fell prey to this
kind of collusive bidding when it called for tenders for the construction of a 22-kilometer
long road in 2007. The first phase of the project was estimated to cost Rs 1.2 billion
(about US$ 40 million), to be financed by a loan contracted by the government with
China’s EXIM Bank. However, a condition attached to the loan was that the project
should be undertaken by a Chinese firm. When tenders were opened in late 2008, it was
noted that the lowest bidder had bid Rs 2.8 billion, more than twice the original cost
estimate. Amid strong protests, mainly from the Opposition, the government agreed to re-
open discussions with its Chinese counterparts. However, failing to get a fair deal, the
government finally cancelled the Chinese loan and approached the French AFD for
financing.
The above story is rather atypical of Chinese firms, which are known for their
competitive bidding. In this case, however, their behavior was anti-competitive, and it
could have forced significant losses of taxpayer’s money in Mauritius if not averted in
extremis.
2.4 Investment Climate
Investment Climate in Mauritius

24
Mauritius espouses a permissive investment regime that has constantly evolved since the
EPZ Act of 1970. Before the advent of the Business Facilitation Act (BFA) in 2006, the
FDI regime was complex and burdensome. There was a wide array of sector-specific
incentives and administrative requirements imposed considerable hassle costs on
potential investors. Although the Board of Investment, established in 2001 to serve as a
dedicated investment promotion agency, has implemented a one-stop shop to facilitate
FDI, the laws and regulations governing investment by foreigners continued to delay the
process of obtaining an investment permit until the promulgation of the BFA.
The BFA brought about far-reaching reforms aimed at remedying macroeconomic
imbalances, opening up the economy, facilitating business, improving the investment
climate, and mobilizing foreign direct investment and expertise. The Act as well as the
accompanying Finance Act 2006 led to amendments in or repeal of numerous Acts as
layers of bureaucracy were eliminated. The BFA made it technically possible for a
business to start operations – within 3 working days of submitting an application for a
permit – on the basis of self-adherence to established guidelines and ex post control.
All incentive schemes established under the Investment Promotion Act 2000 (with the
exception of the Integrated Resort Scheme) were repealed in 2006 as incentives were
harmonized across sectors and between domestic and foreign investors. However,
specific incentives to promote and protect investment in spinning, knitting, weaving, and
dyeing are being retained until 2016. Such investments have been critical in building a
vertically integrated clothing industry, capable of satisfying rules of origin, especially for
exports to the US under AGOA, and generating high value addition.
The corporate tax rate has been progressively reduced from 25 percent to 15 percent
between 2005 and 2007. As of July 2008, 20 different schemes spanning all the major
sectors of activity were operational. Most of these schemes are aimed at attracting export-
oriented investment and promoting exports of manufactured goods. They offer a common
package of fiscal incentives, including, in addition to a flat 15 percent corporate tax rate,
duty and VAT exemption on raw materials, inputs and equipment. UNCTAD (2001), in
its review of Mauritius’ investment policy, concluded: “Mauritius presents an attractive
low tax regime for FDI in areas where it is welcomed.”4 The FDI regime has surely
become even more appealing after the sweeping tax and administrative reforms brought
about by the BFA and the Finance Act in 2006.
Mauritius has a strong record of public security and political stability in the democratic
tradition. In addition, the laws of Mauritius protect foreign investors against
expropriation and other risks. With the lifting of all forms of exchange controls in 1994,
investors are guaranteed free and unlimited repatriation of their capital upon cessation of
business. The World Bank Doing Business Survey 2010 ranked Mauritius 12th in
protecting investors, ahead of many industrialized countries. Mauritius has signed
double-taxation avoidance treaties with 33 countries and investment promotion and
4 UNCTAD (2001), p. 23.
25
protection agreements (IPPAs) with 16 countries.5 One of the latest countries to join this
club is the United States, with which Mauritius concluded a Trade and Investment
Framework Agreement in 2006. Negotiations are under way with several other countries.
When the Government announced the measures contained in the BFA during the 2006/07
Budget Speech, it stated that the aim was to place Mauritius among the top 10 on the
World Bank’s ‘Ease of Doing Business’ list. It appears that Mauritius is on course to
achieving the set objective. Mauritius moved up 7 spots on this list, ranking 17th in 2010
(and first among SSA economies) compared to 24th the preceding year. Significantly, the
country ranked 10th in the “Ease of Starting a Business” category, which confirms the
effectiveness of the reforms brought about by the BFA in 2006.
However, important challenges remain. Mauritius was sanctioned with a shameful 87th
spot on the “Ease of Getting Credit” indicator, tying with countries like Cambodia,
Malawi and Tanzania, with very low overall rankings. This result is not surprising since
available evidence confirms that small businesses face severe constraints in obtaining
credit through official channels, and that the various government schemes designed to
financially assist SMEs have not delivered because of the strict requirements they impose
on applicants (see Ancharaz, 2010). Mauritius also received poor scores for registering
property, enforcing contracts and closing a business down. Government efforts in the
future should be directed to improving these indicators.
Investment Climate in China
The World Bank’s Doing Business Report 2010 ranked China 89th in the world in the
ease of doing business. In its 2008 Statement of Investment Climate in China, the U.S.
Department of State noted: “Investors continued to face a lack of transparency,
inconsistently enforced laws and regulations, weak IPR protection, corruption, industrial
policies protecting local firms, and an unreliable legal system incapable of guaranteeing
the sanctity of contracts.”6 Despite these challenges, however, China remains an
attractive FDI destination for multinationals seeking to restructure their global value
chains for greater competitiveness. For example, the US Chamber of Commerce reports
that American firms' operations in China are more profitable than they are in the United
States.
China has implemented significant corporate tax reforms and has engaged in the process
of rationalizing its complex system of incentives with a view to complying with WTO
requirements for a unified trade regime. However, these reforms have fallen short of
addressing a number of weaknesses that foreign investors frequently complain about.
Starting a business is ridden with complex, and often inconsistent, bureaucratic
procedures that add to the hassle cost of doing business in China. Dealing with
construction permits, hiring workers and even paying taxes are particularly difficult.
5 These treaties and agreements are currently in force. Mauritius has signed IPPAs with 17 other countries
but these have not been ratified yet. 6 See http://www.state.gov/e/eeb/ifd/2008/103668.htm

26
China scores very low on each of these counts in the World Bank Doing Business
ranking. In 2007, China has adopted new laws and regulations to boost continuing inward
investment.
The Chinese government announces its FDI objectives, regulations and procedures
through its official medium, the Foreign Investment Catalogue. The catalogue lists all the
sectors in which FDI is encouraged, permitted, restricted or prohibited and spells out
sector-specific restrictions in terms of foreign ownership and permissible types of
investment. China emphasizes a “fundamental shift” from “quantity to quality” of FDI
flows by 2010, and actively seeks FDI in higher value-added sectors such as high-tech
research and development, advanced manufacturing, energy efficiency, and modern
agriculture and services, rather than in basic manufacturing. On the other hand, FDI is
prohibited in sectors like the media, basic education, mining and processing of certain
minerals, processing of green and ‘special’ tea using Chinese traditional crafts, and
preparation of Chinese traditional medicine. It transpires from the Catalogue that China
practices the same heavy-handed approach to FDI that it is often blamed for in the
domain of trade and industrial policy.
China offers various incentives to companies investing in its special economic zones,
provided that the foreign equity stake is no less than 25 percent. These include reduced
corporate taxes, better infrastructure, lower export and import duties, free ports and
bonded zones. FDI in priority sectors also benefit from fast-tracked processing and
special preferences (though these are not clearly stated). In 2008, the Chinese government
fixed corporate tax rates for both foreign and domestic firms at 25 percent, following a
transitional adjustment period. However, it maintains lower rates of 20 percent and 15
percent for eligible small enterprises and high-tech companies, respectively.
China has gradually relaxed foreign exchange regulations facing foreign-invested firms
and, in principle, allows liberal access to foreign exchange for current account
transactions. However, capital movements are strictly controlled, especially in recent
years, as China has tightened restrictions on capital inflows and eased capital outflows
with a view to rectifying the large and growing payments surplus. Chinese law prohibits
nationalization of foreign-invested enterprises. Significantly, no foreign-owned assets
been expropriated since reforms began in 1979. Nevertheless, the legal system is
complex, often contradictory, with several grey areas and poor enforcement, resulting in
an investment climate steeped in risk and uncertainty. Indeed, China scores very low in
terms of protecting investors, ranking 93rd in the World Bank’s Doing Business rankings.
Moreover, China remains a very challenging environment for IPR protection and
enforcement, with several industry associations, especially those representing software,
entertainment, and consumer goods, reporting high levels of piracy.
Bilateral investment agreements can offer foreign investors some re-assurance in the face
of the challenges presented by the Chinese FDI regime. China has signed BITs with 121
countries – more than any other developing economy – including most of its major
partners. These agreements cover expropriation, arbitration, most-favored-nation
treatment, and repatriation of investment proceeds. Negotiations on a BIT between China
27
and the United States started in 2006 but have made little progress so far. Nevertheless,
China has signed a Double Taxation Avoidance Treaty with the United States, and a
number of other countries.
To conclude, while China has adopted important reforms to bolster its FDI regime, major
weaknesses persist. Significantly, China slipped down 3 spots relative to the previous
year in the 2010 World Bank’s Doing Business survey, scoring very low in such areas as
starting a business, employing workers, protecting investors and paying taxes.
Conversely, China was credited with a commendable 18th position on the ‘enforcing
contracts’ indicator, this contrary to the common claim that the Chinese are “incapable of
guaranteeing the sanctity of contracts” (US Department of State, 2008).
Table 5 summarizes the key features of the FDI regimes of Mauritius and of China.

28
Table 5: Key features of the Mauritian and Chinese FDI regimes
FDI policy/ incentive Mauritius China
World Bank 2010 Doing
Business Rankings (select
indicators)
Doing Business
Dealing with construction
permits
Registering property
Getting credit
Protecting investors
Enforcing contracts
17
42
66
87
12
66
89
180
32
61
93
18
Foreign exchange policy Foreign exchange controls abolished in 1994.
Free, unlimited repatriation of profits, dividends
and capital gains.
Full convertibility on both current and capital
accounts
Gradual loosening of foreign exchange
regulations.
Easy access to foreign exchange for current
account transactions
Tight restrictions placed on capital
movements (especially outward)
Expropriation Legislative guarantees against nationalization Nationalization of foreign-invested
enterprises prohibited under Chinese law.
Compensation prescribed by law in case of
expropriation, but grey areas surround
calculation.
Generally poor enforcement of laws,
resulting in risky investment environment.
Protection of Property Rights Intellectual property rights protected by the
Copyrights Act of 1997 and the Patents,
industrial Design and Trade Marks Act of 2002.
Mauritius is a member of WIPO and party to the
Paris and Bern Conventions
The Chinese legal system mediates
acquisition and disposal of property rights
Two significant limits on the property
rights, namely on land and IPR.
China is a member of WIPO, Paris and
Berne convention, Geneva Phonograms, and
Universal Copyright Convention
Facilitating foreign
investment Simple and easy administrative procedures to
set up business in Mauritius following far-
reaching reforms brought about by the Business
Facilitation Act 2006
Complex, bureaucratic, nebulous, and often
inconsistent regulations and procedures,
governing FDI.
FDI incentives Mauritius offers a low tax jurisdiction:
Corporate and income tax of 15%;
Tax-free dividends and no capital gains tax;
Up to 100% foreign ownership and no
minimum foreign capital requirement;
Exemption from customs duty on raw materials
and equipment.
China offers incentives to FIEs investing in
SEZs:
Lower corporate tax rate of 25%; lower rates
for eligible small and high-tech companies;
Better infrastructure, free ports and bonded
zones;
Reduced export and import duties.
Bilateral Treaties Double taxation avoidance treaties signed with
33 countries
IPPAs with 16 countries, including the US
BITs signed with 121 countries.
Negotiations for a BIT with the US ongoing.

29
3. Literature Review
3.1 Theoretical Review
There exists no unified theory of FDI. Instead, the theoretical literature is choked with an
array of hypotheses drawing heavily on theories of imperfect competition and market
failure to explain the FDI phenomenon. These hypotheses find their roots in Hymer’s
(1960) seminal work, refined and publicized by Kindleberger (1969), but they emerged in
a more consistent manner from Dunning’s (1977, 1979) "eclectic approach." Essentially,
this approach seeks to explain the motives for international production, and thus FDI, in
terms of the ownership advantages of multinational firms, the desire to "internalize" these
advantages, and the locational advantages of the host country. Ownership advantages are
factors that enable the firm to overcome the handicaps of producing in an alien
environment, such as differences in language and culture, legal systems, tax regimes and
access to inputs. These "firm-specific" advantages include superior technology,
management and marketing skills, which help the multinational differentiate its product
successfully. This competitive advantage is usually created through substantial
investments in advertising and in research and development.
But ownership advantages do not, of and by themselves, justify foreign production. They
only suggest that the firm commands a competitive edge in a foreign market, which can
be exploited in several ways other than through the establishment of foreign subsidiaries.
For instance, the firm can simply sell part of its domestic output to the foreign market.
Indeed, exports would be a more attractive avenue to the extent that they avoid the
difficulties of operating a plant in an unfamiliar territory. Thus, a firm’s decision to set
up production facilities abroad can only be explained by the locational advantages offered
by the host country that significantly offset the usual handicaps of offshore production.
These advantages typically derive from lower costs of production, which reinforce the
multinational’s initial competitive advantage. The availability of a pool of cheap labor is
an important factor, especially for labor-intensive operations, but the generous tax
holidays and duty concessions typically offered by developing country governments as
part of an incentive package to attract FDI cannot be ignored. Locational advantages
may also result from trade barriers (including transport costs) that make it difficult to
export to the country.
An alternative – and perhaps more practical – classification of the host-country
determinants of FDI distinguishes between business facilitation measures, the policy
framework for FDI and economic determinants. Business facilitation measures include
investment incentives, measures directed at reducing the hassle costs related to corruption
and administrative inefficiency, and social amenities. Policy determinants of FDI
comprise policy and political stability, rules relating to FDI, international agreements on
FDI, and privatization, trade and tax policies. The economic determinants are further
categorized into market-seeking (market size and growth, market structure, access to
regional markets), resource-seeking (availability of raw materials, labor, physical
infrastructure) and efficiency-seeking (cost of resources, labor productivity).
30
3.2 Empirical Review
The increase in multinational activity since the 1990s has spawned renewed interest in
research into the drivers of FDI, both because of its sheer volume and its rather different
character. The world inward FDI stock has increased over 7-fold between 1990 and 2008,
growing at an accelerated pace in recent years. A significant part of these FDI flows is of
the vertical type, and has been driven by the need to strengthen the multinational firm’s
core competencies by allowing it to shift areas of declining comparative advantages to
offshore locations.
China figures prominently in the global FDI trends since “Chinese enterprises are at the
forefront of becoming major foreign direct investors in Asia and beyond”.7 The Chinese
FDI impetus is due to a combination of government support and openness along with
locational advantages such as cheap labor and raw materials. China is also an attractive
destination for market-seeking FDI due to its large and growing economy and rising
purchasing power. These determinants – featuring both push and pull factors – have been
investigated extensively. Here, we focus on the empirical evidence on drivers of Chinese
outward FDI. Our review of the literature identified three such studies, all of which are
recent and use panel data estimation. However, the results are rather mixed.
Using panel data on Chinese FDI to 41 countries over the period 1984-2001, Buckley et
al (2007) examine variables such as institutional quality, natural resource abundance,
market size, trade intensity, geographical distance and cultural proximity to China,
among others, as potential determinants of Chinese investment abroad. The results are
generally sensitive to the period under consideration. For example, poor institutions
(proxied by an index of political risk) and natural resources (measured by the share of
minerals in merchandise exports) are both statistically significant in the sub-sample
period 1992-2001 but not in the full sample. The authors conclude that the flow of
Chinese FDI to countries with poor institutions but abundant natural resources is a recent
phenomenon. The evidence also suggests that host countries with larger domestic markets
(measured by the size of GDP), higher inflation, greater openness and closer cultural ties
with China tend to attract more substantial flows from China. Fung and Garcia-Herrero
(2008) provide further evidence in support of the market-seeking motive. Additionally,
and controversially, they find that China’s investments tend to flow to destinations with
poor labor quality.
The finding that Chinese FDI has flowed to countries with high rates of inflation is rather
surprising since inflation – both because it signals macroeconomic instability and poor
cost competitiveness – is likely to deter, not attract, inward FDI. However, this particular
result could be the incidental outcome of Chinese FDI in some of the oil-rich countries of
Africa, such as Angola, which are notorious for high and persistent inflation. This
confirms that Chinese resource-seeking FDI conforms little to the behavior of FDI
generally – a hypothesis that is also supported by the finding that poor institutions have
mattered little in Chinese FDI decisions.
7 Karl Sauvant, Director of UNCTAD’s Investment Division. Quoted from Matt Pottinger and Owen
Brown, “Shares in Chinese Companies May Not Gain a Major Push”, Wall Street Journal, March 11, 2010.

31
The study by Habib and Zurawicki (2002) sheds some light on the perverse association
between Chinese FDI and host-country institutional quality. The authors claim that
greater absolute differences in corruption have a negative impact on bilateral FDI from
China, implying that China is more likely to invest in equally corrupt countries as itself.
A further implication is that the institutional setting in China may be an important
determinant of the sectors and countries it invests in. Several studies argue that the
organization of Chinese companies and the economic and political backing they receive
from the government have led them to take excessive risks, in utter disregard of the
quality of institutions in target countries (Yeung and Liu, 2008; Morck et al., 2008;
Buckley et al., 2007).
However, the study by Cheung and Qian (2008) rejects some of the above findings.
While they find that Chinese FDI has generally flowed to countries with abundant natural
resources and large domestic markets (measured by absolute GDP levels), there is no
evidence that countries with weaker institutions have attracted larger amounts of Chinese
investment. One rather unsettling result is that GDP per capita, a measure of effective
market size, seems to have repelled, rather than attracted, FDI. The authors provide no
explanation for this puzzling result. Our hypothesis is that Chinese FDI, especially in
Africa, is negatively correlated with the host country’s level of development, which GDP
per capita may actually be proxying for. This is evident in the fact that the Chinese have
invested more in countries like Angola, Sudan, and Zambia than in countries like
Botswana, Gabon, and Mauritius, Africa’s middle-income economies.
In a panel study on 90 host countries, Cheng and Ma (2008) investigate a rather different
set of determinants of Chinese outward FDI, focusing on such variables as cultural
proximity and various geographical characteristics of host economies, including domestic
market size. They exclude natural resources and institutions. Their panel regression
estimates suggest that large markets, cultural proximity to China and congruency (that is,
sharing a common border) tend to attract FDI whereas physical distance and
landlockedness deter Chinese investment.
To summarize, the above empirical studies do not provide a clear picture of host country
determinants of Chinese FDI. This ambiguity seems to have pervaded other, survey-
based studies, as well. For example, according to a poll of Chinese enterprises in 2000,
cheap labor in other developing countries was found to be the singular most important
determinant of Chinese foreign investment.8 However, the Asia Pacific Foundation of
Canada reports that, in a 2005 survey, Chinese enterprises assigned a relatively low score
to “access to low cost labor” as a driving factor in their FDI decisions.
4. Theoretical Framework and Methodology
Our prime objective is to assess the impact of Chinese investment on the Mauritian
economy. To our knowledge, no formal methodology exists to guide us in this exercise.
8 MOFTEC Offshore Plant Project (2000)
32
However, in keeping with the general spirit of the Jenkins-Edwards (2005) methodology,
one can argue that any assessment of the economic effects of FDI should at least consider
the impact on such variables of interest as employment, value-added, exports and growth.
These effects can be direct or indirect, complementary or competitive, and they may be
quantifiable to various degrees.
The most direct effects are likely to be on employment and income. Exports will also be
affected to the extent that FDI is destined to serve foreign markets, as in the case of
export-processing zones. Hamada (1974), in his pioneering analysis of the welfare effects
of EPZs on the host economy, concluded that FDI into a duty-free zone in an economy
with neoclassical features will lead to a loss of national welfare. However, this result rests
critically on the assumption of full employment, which is unrealistic of developing
countries.
In practice, most countries will benefit from FDI whether it flows into an EPZ or a non-
zone sector. The net effects of FDI (Chinese or otherwise) will depend on the size and
type of investment, the sector to which it is directed, the level of technological
sophistication of the investment project and its capacity to create linkages with the
domestic economy. Larger investment projects do not always have proportionately bigger
impacts in terms of job creation, contribution to GDP and exports. For example,
investment in the banking sector may create few jobs and may not bring much to an
economy that already boasts advanced financial development, such as is the case in
Mauritius. Similarly, investments in property development, which tend to come in rather
large spurts, contribute little to the economic uplifting of a country in the short term.
FDI is likely to be most beneficial when it is Greenfield and export-oriented. If it is
meant to serve the local market, then the investment should preferably be in sectors that
the country is actively seeking to promote and should avoid direct competition with local
producers. Moreover, FDI projects that generate knowledge spillovers and foster the
development of backward and forward linkages with the domestic economy are
particularly beneficial to the host country.
The indirect effects relate to long-term growth. Such effects are hard to detect, isolate and
measure since they occur with unknown lags, are spread over several years, are buffeted
by various other factors thereby reducing their significance in any given year, and are
generated by spillovers that are inherently difficult to capture. Similar effects occur when
FDI contributes to the emergence of industrial clusters, i.e., the agglomeration of certain
industrial activities in a given area. Clustering may improve the supply of key inputs to
firms in the cluster, entail better infrastructure and services, and strengthen external
linkages through networking and technology sharing. All of these effects may contribute
to economic growth over the long term.
FDI may also generate negative effects. Perhaps the one effect that has received the most
attention in the literature is the risk of a Dutch disease induced by massive spurts of FDI
in an otherwise foreign exchange-constrained economy. The resulting currency
appreciation can erode the country’s export competitiveness, leading to a loss of exports,

33
while stimulating import demand, on the other. This combination of declining exports
and rising imports can aggravate payments difficulties. Another adverse effect could arise
if switching modes of supplying a local market from directly exporting to the country to
setting up production units within its territory results in a greater competitive challenge to
indigenous firms.
With Chinese investment, additional concerns are likely to arise since Chinese
multinationals are known to use Chinese, rather than local, labor and inputs, which
reduces the multiplier effect of any FDI project on the local economy. Similarly, since the
Chinese favor wholly-owned enterprises and tend to be secretive about their processes
and ways of doing business, the potential for knowledge or technology spillovers is
greatly reduced. This hurts an important challenge through which FDI impacts on
domestic economic growth.
In this study, however, we are unable to present an in-depth analysis of Chinese FDI in
Mauritius both because investments from China have been historically small and
irregular, and because we could not obtain detailed, firm-level data to gauge the real
effects of Chinese investments in terms of job creation, value added and contribution to
exports.9 We managed to obtain some data on Chinese firms in operation in Mauritius
from the local Chinese Embassy but these were not up to date. Hence, in what follows,
we offer a rather descriptive analysis of data purged from various sources, and present a
couple of case studies featuring major Chinese investment projects.
5. Empirical Analysis
Chinese FDI to Mauritius is mainly Greenfield, thus leading to the creation of new
production capacities. Moreover, the Chinese subsidiaries are wholly foreign-owned and
spawn a variety of sectors. There were nine Chinese-owned enterprises in operation in
2004 in such sectors as textiles, services, and construction (Table 6). The Chinese have
invested in a small, inland hotel, in cotton spinning, garment-making and services,
including financial and building services. However, most of these companies were
defunct by 2008; only two firms are still in business, namely Hong Kong – Shanghai
(Mauritius) Co. Ltd. and Tianli Spinning (Mauritius) Co. Ltd.
Table 6: Chinese Firms in Mauritius (2004)
Name of Firm Sector
Yunnan International Economic and Technical Cooperation, Mauritius
Chang Cheng Esquares Co. Ltd Services
Beijing Zhuzong Group Co. Ltd, Mauritius Branch Services
9 It appears that the Board of Investment does not maintain a database of foreign investments in Mauritius,
being more focused on marketing Mauritius as an investment destination rather than interested in research
as such. Our attempts to elicit information on Chinese investments in Mauritius from the BOI were
unsuccessful.

34
Mandarin Hotel Mauritius Ltd MCFI-SFB Co. Ltd Tourism
Tianli Spinning (Mauritius) Co. Ltd Textile
Hong Kong – Shanghai Knitting Factory Ltd Textile
China National Overseas Engineering Cooperation Mauritius Office Construction
Shanghai Foreign Service & Economic Cooperation Co. Ltd Services
China International Water and Electric Cooperation Energy
Zhongjiang International 1,500 Housing Project Office Construction Source: Chinese Embassy in Mauritius
Impact of Chinese FDI in Mauritius
It is difficult to assess the impact of Chinese investments in Mauritius in the absence of
detailed data on the value of initial investment by each company, and subsequent
investments (if any), the number of workers employed, turnover, and exports (if any).
However, the Chinese firms of Hong Kong origin that relocated to Mauritius during the
period 1984-1990 made significant contributions to the economy. Their activities are
often credited for ushering in a period of sustained export-led growth in Mauritius, lasting
at least a decade. Employment in the textile-dominated EPZ increased sharply from
27,428 in 1984 to 87,358 in 1990. During this period, exports increased more than five-
fold and real GDP growth averaged about 7 percent annually. When the non-renewal of
the third-country fabric derogation under AGOA in September 2003 and the specter of
fiercer competition from China following the end of apparel quotas in December 2004
forced the firms to exit the Mauritian EPZ, massive job losses – over 25,000 between
2001 and 2005 – were recorded, along with a significant decline in exports. However,
exports rebounded in 2006, reaching a new peak in 2007 before financial crisis bore
down on the clothing industry. Figure 7 summarizes the evolution of the clothing industry
in the light of changes in the trade regimes governing it.
The above discussion illustrates the footloose nature of Chinese FDI, which was
premised on Mauritius’ preferential access to the US and EU markets and other trade
preferences, such as the derogation from AGOA’s yarn forward rule. While several other
local firms – and, indeed, the entire clothing industry – also confronted the same
problems, they restructured to stay in business and survived the onslaught of China. The
Hong Kong-based firms’ decision to leave should therefore be seen as an attempt by
multinationals to reorganize their global supply chains to maximize value. Significantly,
no new Chinese investment in the textile industry has occurred since 2005.

35
Figure 7: Evolution of clothing-related trade regimes
MFA AGO A 1 AGO A 2 AGO A 3 AGO A 4
3rd
country
Fabric
Companies
from Hong
Kong started
Delocalising
Hong Kong
Retrocession
to China
1974
1984
1990
1997
1998
1999
2000
2001
Tajima
Embroidery
& garments Lord Jym Ltd
Olympic
Knitting Ltd
2002
Afes
Textiles Ltd
International
Fashions Ltd
Winbright
(Pty) Ltd
2004
Summit
Industries
Ltd
Goodlands
Knitters Ltd
United
Knitters
Novel
Textiles Ltd
Summit
Textile Ltd
Novel
Garments
Ltd
2005
Grove
Industries
Kentex
Garments Sinotex Ltd
2006
2007
2008
2009
2010
2011
2012
2015
Closures of Enterprises from Hong Kong, China
2003
Leisure
Garments
Ltd
Hong Kong
Textile Ltd Maurihai Ltd
Stylish Knits
Ltd
Summit
Knitwear
Ltd
Source: Enterprise Mauritius; updated by authors.
The rest of our empirical analysis focuses on two case studies involving major Chinese
FDI.
Case Study 2: Tianli Spinning
Tianli Spinning (Mauritius) Ltd. is one of the rare significant and successful cases of
Chinese investment in Mauritius. Established in 2002 with an initial investment of US$
1.3 million, the firm has made sizeable additional investments, notably in 2003 and 2005
(Figure8). Cumulative investments to the end of 2008 amounted to US$28.2 million.
These investments have allowed Tianli to increase its spinning capacity to 2,200 tons of
cotton yarn annually.
The spinning sector in Mauritius comprises three categories of activity: (1) spinning of
woven fabrics for the manufacture of shirts, trousers and denim jeans; (2) spinning of
woolen products such as pullovers and cardigans; and (3) spinning for knitwear,
including T-shirts and Polo shirts. Most of the firms producing knitwear are vertically
integrated and generate their own yarn. Tianli is the only independent producer of cotton
yarn, which it supplies to local firms, including some of those that have in-house spinning
operations.
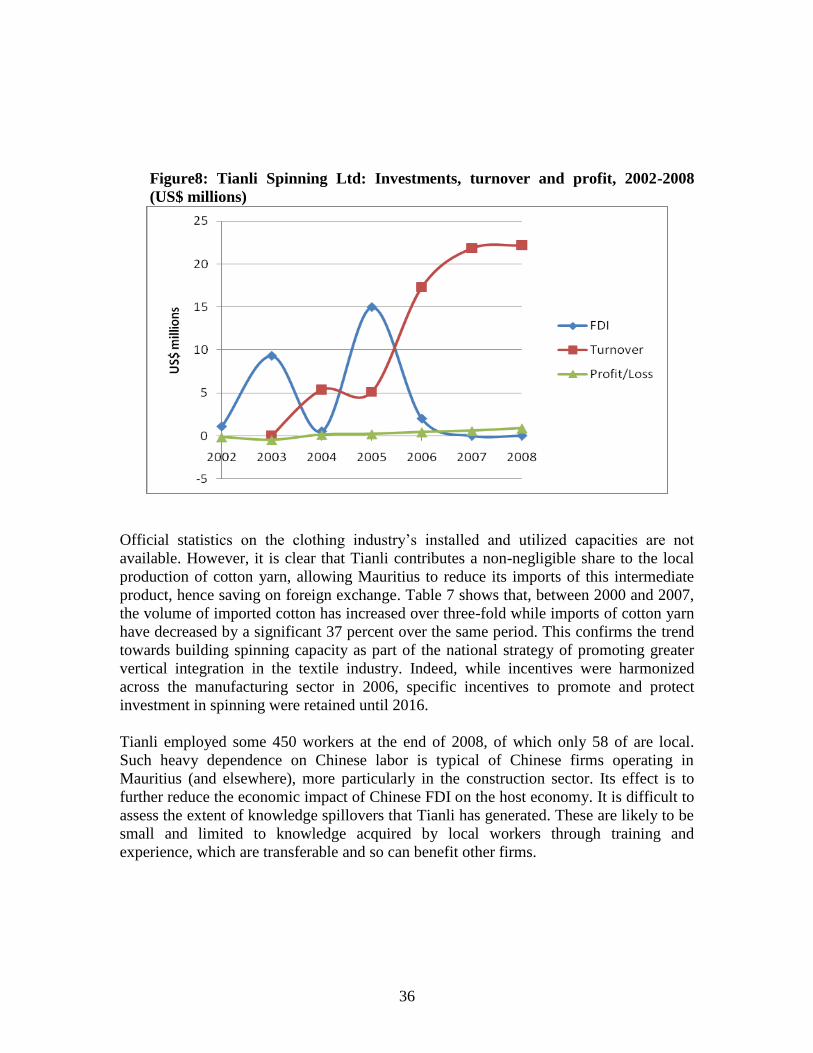
36
Figure8: Tianli Spinning Ltd: Investments, turnover and profit, 2002-2008
(US$ millions)
Official statistics on the clothing industry’s installed and utilized capacities are not
available. However, it is clear that Tianli contributes a non-negligible share to the local
production of cotton yarn, allowing Mauritius to reduce its imports of this intermediate
product, hence saving on foreign exchange. Table 7 shows that, between 2000 and 2007,
the volume of imported cotton has increased over three-fold while imports of cotton yarn
have decreased by a significant 37 percent over the same period. This confirms the trend
towards building spinning capacity as part of the national strategy of promoting greater
vertical integration in the textile industry. Indeed, while incentives were harmonized
across the manufacturing sector in 2006, specific incentives to promote and protect
investment in spinning were retained until 2016.
Tianli employed some 450 workers at the end of 2008, of which only 58 of are local.
Such heavy dependence on Chinese labor is typical of Chinese firms operating in
Mauritius (and elsewhere), more particularly in the construction sector. Its effect is to
further reduce the economic impact of Chinese FDI on the host economy. It is difficult to
assess the extent of knowledge spillovers that Tianli has generated. These are likely to be
small and limited to knowledge acquired by local workers through training and
experience, which are transferable and so can benefit other firms.

37
Table 7: Imports of raw material and intermediates (cotton and cotton yarn), 2000 and 2007
Commodity
Code Commodity Description
2000 2007
Value
(US$ mn)
Volume
(kg)
Value
(US$ mn)
Volume
(kg)
Cotton
S3-2634 Cotton, carded or combed 1.29 393,567 2.15 1,347,056
Cotton yarn
S3-65112 Yarn of carded wool 6.88 746,197 2.28 61,953
S3-65113 Yarn of combed wool 1.18 117,329 0.32 22,605
S3-65114
Yarn of fine animal hair
(carded or combed) 4.61 45,638 9.05 81,356
S3-65133/34 Cotton yarn 129.94 42,549,921 92.98 26,550,667 Source: UN COMTRADE
Tianli Spinning faces an uncertain future. On the one hand, Tianli has recorded small
profits, less than US$ 1 million in 2008, which leaves one wondering whether the firm is
obtaining a decent return on its investments. On the other hand, some recent
developments can have the effect of further reducing Tianli’s contribution in the textile
industry. First, after much diplomatic haggling, Mauritius was successful in obtaining, in
2008, renewal of the third-country fabric derogation that had lapsed in 2003, and this
until 2011. This derogation allows local firms to source their yarn and fabrics from
cheaper Asian suppliers. Moreover, with the coming into effect of the Economic
Partnership Agreement, Mauritius will ‘benefit’ from a softening of the rules of origin
governing its exports of wearing apparel to the EU. A shift from the current double-
transformation requirement to the proposed single-transformation rule under the EPA will
make it easier for Mauritian clothing firms to comply with the rules of origin by
importing yarn and fabrics, rather than sourcing them locally. However, Tianli Spinning
can bet on some key advantages, including reliability of supply, proximity to clients, and
hence lower transportation costs, shorter delivery times, and greater flexibility in
responding to clients’ needs, as well as continued government support to the spinning
sector, to stay in business – in the short term at least.
Case Study 3: The Jin Fei Project
The Jin Fei project has necessitated an initial investment of US$ 1 billion. It covers 362
hectares of land in the region of Riche Terre, close to the port. The project will be
implemented in two phases. The first phase, which started in September 2009, is expected
to be completed by 2012. This phase consists of physically setting up the industrial zone.
It concentrates on the development of infrastructure, water and electricity supply, and the
construction of residential and industrial buildings. The second phase (expected to finish
in 2015) will be devoted to the development of new industries such as light processing,
pharmaceuticals and stainless steel. Box 2 describes the various steps leading to the
realization of the Jin Fei project.

38
Information collected from the Board of Investment suggests that over one-half of the
activities of the Jin Fei zone will be in services, including education, logistics and
information technology. The idea is to position Mauritius as the headquarters for Chinese
Box 2: Chronology of the Jin Fei Project
October 2006: The Tianli Group proposes to set up an integrated industrial zone featuring
some 40 Chinese companies named the Mauritius Tianli Economic and Trade Corporation
Zone. The industrial zone will feature some 40 Chinese companies across a range of high-
end, value-added industries, including light engineering, agro-processing, manufacturing and
IT; a School of Technology, which will provide training and solutions to manpower
problems, is also proposed.
April 2007: The Tianli project is finalized. To make space for the project, it is proposed to
relocate some 103 farmers presently occupying the plot of land earmarked for the industrial
zone. However, the farmers strongly protest against relocation to the two sites identified by
the government.
June 2007: The government agrees to compensate farmers for relocation. Based on the value
of the land, the government offers compensation at the rate of Rs. 50,000 per hectare.
Moreover, the Development Bank of Mauritius re-adjusts the payment schedules of loans
made to the farmers; the Central Electricity Board writes off some Rs 1.5 million of
electricity bills owed by the farmers.
July 2007: During an official visit to China, the Prime Minister signs an accord with the
Tianli Group for the setting up of the ECZ in Mauritius.
January 2008: Launch of the project is postponed to the start of 2009. The government of
Mauritius asks for more details on some components of the project, in particular those
pertaining to the construction of two hotels on the coast of Tombeau Bay, close to the site of
the industrial zone. The government opposed the project because of its purported adverse
environmental effects.
May 2008: Differences between Mauritian and Chinese architects further delay the project.
January 2009: Two additional groups, namely the Taiyuan Iron and Steel Group and the
Shanxi Coking Coal Group, join the project. As a result, major modifications are made to the
initial project. The three Groups create a company incorporated in China under the name of
Jin Fei Investment Co. Ltd and as new partner the China-Africa Development Fund. The four
partners create another company registered in Mauritius under the name of JFET.
September 2009: The Jin Fei project officially starts.
Source: Board of Investment and various press articles

39
investments in Africa. For example, Chinese operators in Madagascar wish to have the
administrative offices in Mauritius because of the distinct advantages that Mauritius
provides as a regional business hub. It is for this reason that the Jin Fei project includes
important investments in property development, including apartments and hotels.
Potential impact of the Jin Fei Project
As opposed to a similar zone to be set up in Zambia, the terms of the Framework
Agreement for Jin Fei Project in Mauritius contain a clause of confidentiality, as required
by the Chinese investors. Consequently, little information is available on the specifics of
the project, which has fueled rumors and wild guesswork by the local press. The Minister
of Finance refused to give information on the project in reply to a question raised in the
Parliament by the Leader of the Opposition, citing the project’s confidentiality clause.
However, it appears that the Mauritian government is finding a convenient escape goat in
the confidentiality clause: it has little information on what the project will precisely entail
since the Chinese themselves do not know yet which companies will be set up. One
observer aptly remarks: ‘Chinese projects are not normally based on any feasibility
study. They have their own way of doing business. They invest money, take over space
and wait for enterprises to be set up.’
It is clear that the government has made a number of concessions to the Chinese to get
them to invest in Mauritius. Indeed, it comes as a surprise that the Chinese chose
Mauritius, a country with no natural resources, acute labor shortages and high wages, and
geographically far from mainland Africa and from its traditional export markets, as one
of the coveted locations to host a SEZ. The Mauritian government claims that the
Chinese wish to use Mauritius as a gateway to Africa and beyond. If this were truly the
main reason for the Chinese to invest in Mauritius, one wonders if they would not have
done better by choosing, say, Madagascar, which has become a privileged destination
even for Mauritian investors. Madagascar, like several other African countries, offers
what Mauritius claims to offer in terms of export market access plus important cost
advantages due to abundant labor, low wages and access to raw materials and inputs.
The main concession made by the government in the context of the Jin Fei project is its
obligations to provide offsite infrastructure. It is estimated that some US$ 25 million
needs to be invested to build roads and extend water, telephone, sewerage and electricity
networks to the site of the industrial zone. The authorities claim that the central
government itself would incur only US$ 3.2 million; Jin Fei would contribute US$ 3.3
million, the Central Electricity Board would invest US$ 8.3 million, and the Central
Water Authority and the Waste Water Authority would share the rest of the cost.
However, the last three corporations are agencies of the government, and their debt is part
of the national debt. Thus, by advertising its share of the cost as a meager US$ 3.2
million, the government has deliberately tried to play down the real value of the
concessions made to the Chinese.

40
In addition, the Jin Fei industrial zone will benefit from incentives generally available to
local firms. In addition to a flat 15% corporate tax rate, and duty exemptions on imports
of materials and capital equipment, the Chinese enterprises will not pay customs duty or
VAT on construction materials and their exports will not be subject to any VAT. Further,
for every US$ 500,000 of investment, the Mauritian government will grant the Chinese
investors one Mauritian passport. Another concession made to Jin Fei that has raised
some controversy is the lease conditions of the 362 hectares of land put to the disposal of
the SEZ. The land is leased at a token rate of US$ 3 per hectare, which, as per the terms
of the agreement, will increase by 50% after 10 years and by a further 50% after every 10
years subsequently.
Do the potential benefits of the SEZ justify the generous concessions made?
In presenting the Jin Fei project, the government claimed that it would lead to the
creation of some 43,000 jobs, of which 34,000 directly. However, pressed by the
opposition and the press, it finally conceded that only 10 to 15 percent of the jobs would
accrue to Mauritians. This means that the employment impact will be much smaller than
expected. Moreover, the construction of the industrial zone, currently under way, is
utilizing a large number of Chinese expatriate workers. Construction materials are mainly
being imported from China. This reduces the multiplier effect of the initial FDI while
accentuating the already heavy bilateral trade deficit vis-à-vis China. Finally, the SEZ
will produce primarily for the export market. Since the enterprises will be wholly
Chinese-owned, the bulk of the export proceeds will likely be remitted to the home
country. Consequently, the impact on foreign exchange earnings will be minimal.
Our analysis suggests that the Chinese industrial zone will have little impact, if any, on
the Mauritian economy through the traditional channels of jobs, contribution to GDP and
export earnings. There are two remaining ways in which the SEZ can benefit the local
economy: through knowledge spillovers and through the development of linkages with
the economy. In our case study of Tianli Spinning, we argued that technology spillovers
are very unlikely from Chinese investments because of the way the Chinese protect
propriety knowledge and other trade secrets. This scenario is likely to recur with the Jin
Fei project, more so since the majority of the companies will be Chinese-owned. This
will be really unfortunate since Mauritius hopes that the technological superiority of the
Chinese firms will ‘brush off’ on local firms and help the country gravitate to a higher
technological plane with innovative, high value-added products.
On the positive side, there does exist some potential for the SEZ to build linkages with
the local economy. However, just as with the EPZ, the linkages will be mainly forward,
involving logistics, forwarding, and insurance and financial services. Backward linkages
will be fostered to the extent that the Chinese firms contract out transportation and
catering services for their employees and subcontract with local firms. In any case, the
economic value of these linkages is likely to pale in comparison with the value of output
generated by the firms in the industrial zone.

41
To conclude, we believe that the economic benefits arising from the Chinese SEZ will be
too small relative to the costs incurred by government in terms of road infrastructure and
utility and telecommunication networks. Environmental concerns aside, there are also
fears that providing water to the industrial zone will deprive already-vulnerable areas of
the island of this precious commodity, especially in the dry season when water supply
runs low and cuts are more frequent. Moreover, the SEZ will consume a tremendous
amount of electricity, putting pressure on existing capacity, and inflating the imported oil
bill. Given these considerations, one wonders whether the government conducted a
proper feasibility study or an environmental impact assessment before it allowed the
project to go ahead. We are inclined to believe that the lure of a billion-dollar FDI project
was powerful enough to override any other concerns. The government has brandished the
potential economic benefits of the project, and has claimed credit for attracting FDI on
such a massive scale. However, our analysis suggests that the SEZ will bring little in
terms of jobs, incomes, export earnings or technology spillovers. On the other hand, the
government will certainly lose in terms of tax revenue foregone due to the many fiscal
concessions granted to the Chinese operators and face heavier debt service charges as a
result of borrowing to finance infrastructure and services. 6. Conclusion
This report sets out to examine the impact of Chinese investments on the Mauritian
economy. We do this by describing the nature, trends and sectoral composition of FDI
flows from China to Mauritius and vice versa; discuss the FDI-aid nexus; review the FDI
regimes in the two countries and then turn to an in-depth analysis of Chinese FDI in
Mauritius. Our empirical methodology is constrained by data availability and data
consistency. Consequently, we rely mainly on descriptive analysis, case studies and
primary information obtained from interviews.
6.1 Key Findings
The key findings of this study can be summarized as follows:
1. Mauritius offers an attractive investment climate. The Business Facilitation Act and
the Finance Acts of 2006 have brought about major reforms to the investment regime.
Incentives have been rationalized and harmonized and a reduced, uniform corporate
tax rate of 15 percent applies across economic sectors. These reforms have helped
place Mauritius 17th on the World Bank’s Doing Business rankings in 2010.
2. Until 2004, FDI flows to Mauritius were small, irregular and unevenly distributed
across sectors. A clear upward trend is noted in recent years. However, much of the
FDI flows have been directed to services, especially property development, tourism
and financial services.
3. FDI inflows are concentrated in a narrow range of sectors and originate in a few,
traditional partner countries – EU, USA, India and South Africa.
4. The real sectors – agriculture and manufacturing – have failed to attract significant
FDI on a sustainable basis. This may be due to the overall low cost competitiveness
42
of the Mauritian economy and systemic factors, including the lack of natural
resources and the policy emphasis on services.
5. Chinese investments have been small and erratic through the years. However, the
launch of the Jin Fei project in 2009 has resulted in a massive spurt of FDI from
China into the special economic zone. Such flows are likely to continue over the next
5 years or so.
6. China has implemented significant corporate tax reforms and rationalized incentives
so that its FDI regime complies increasingly with WTO rules. However, a number of
weaknesses persist. FDI procedures are complex, bureaucratic, often inconsistent, and
non-transparent. Investment is encouraged selectively in certain specific sectors, but
deterred in others. China ranked 89th on the World Bank (2010) list, and obtained
very poor scores on several indicators.
7. Agreements between Mauritius and China in the domain of double tax avoidance and
investment protection seem to have been a catalyst for Mauritius’ outward FDI to
China, which has broken new ground in recent years thanks to the activities of one
textile company, the Compagnie Mauricienne de Textile Ltee. Although, in absolute
terms, such investment has been small, accounting for a mere 1.6 percent of China’s
total inward FDI in 2008, Mauritius is nevertheless the biggest investor from the
African continent.
8. Contrary to the documented practice in much of Africa, there is no evidence that
Chinese FDI in Mauritius has been bundled with aid nor has such aid been given on
the same terms as to other African countries (where aid has often been exchanged for
rights to Chinese firms to exploit natural resources).
9. China has provided loans on concessional terms with generous grace periods, flexible
repayment schedules and with no conditionality attached. On the downside, however,
exclusive bidding by Chinese firms for some infrastructure projects financed by the
EXIM Bank has resulted in collusive practices to the detriment of the recipient
country, as was the case in Mauritius recently.
10. Our review of the determinants of Chinese outward investments yields a mixed bag of
evidence. While the evidence points quite conclusively that natural resources and
large markets have been significant pull factors, there is some controversy about the
role of institutions, with some studies suggesting that China favors investing in
countries with weak institutions and high levels of corruption.
11. None of the above factors is relevant in the case of Mauritius, which has no natural
resources, is small (in absolute terms) and boasts a solid democratic tradition, the rule
of law and strong institutions. Yet Mauritius has attracted large flows of FDI from
China in recent years into the special economic zone, one of the few that China is
setting up across the African continent.
12. The SEZ will house various high-value, cutting-edge technology industries that
Mauritius has actively sought to promote but had not been successful so far. Thus, the
SEZ could help Mauritius graduate to a higher technology plane.
13. However, our analysis suggests that the SEZ, even when it becomes fully operational,
will have little positive effects on the economy.
43
6.2 Policy implications
China’s engagement with Mauritius through the investment channel raises a number of
policy issues and implications. Before the launch of the Jin Fei project, Chinese FDI in
Mauritius has been small and irregular through the years. The wave of FDI from Hong
Kong-based companies into the nascent clothing industry in the mid-1980s helped
Mauritius create thousands of jobs and generate a high rate of export-led growth over a
long period, especially as local investors also joined in. However, the exodus of these
firms in the years preceding the expiry of the MFA, which signaled the end of Mauritius’
preferential access to the US market on which the foreign investors had concentrated
their exports, led to a drastic decline in employment and exports. But the fact that the
clothing industry recovered after 2005 means that Mauritius had not depended on the
foreign firms to the extent that it appeared. Therefore, their true contribution to the
Mauritian economy is likely to have been small.
Can this conclusion be generalized to Chinese investment in Mauritius? A clear answer
could emerge if we did a careful project-by-project analysis of Chinese FDI. We could
afford to do this since such investment has been small and concentrated in a few sectors.
Our case study of Tianli Spinning suggests that the firm has indeed contributed to filling
the fabric gap in Mauritius, thus helping to build a vertically integrated clothing industry
capable of meeting stringent rules of origin. However, its installed capacity is rather
small relative to the industry’s total requirement in cotton yarn and the firm has been
further marginalized by local investments in spinning and weaving operations. Moreover,
the softening of the rules of origin in the proposed Economic Partnership Agreement with
the EU as well as the renewal of the third-country fabric derogation under AGOA, both
of which will make it possible for local clothing exporters to source their yarn and fabrics
from cheaper Asian suppliers, means that independent spinners like Tianli will see their
role diminish.
Our analysis of the Jin Fei project further supports our claim that Chinese investments are
unlikely to have a significant impact on the local economy. The true motives for setting
up such a massive industrial zone in a resource-poor, geographically isolated and high-
cost country are unclear since the project is conveniently protected by a confidentiality
clause, atypical and unprecedented in Mauritius’ history of doing business with
foreigners. The thesis that the Chinese see in Mauritius a gateway to the African market
and beyond sounds dubious since any other African country can offer the same market
access privileges plus other attractions, such as the availability of local inputs and cheap
labor. Can Mauritius’ experience and maturity make a difference? Perhaps. But then why
would business-minded Chinese operators want to invest in Mauritius when local
investors themselves are fleeing to nearby Madagascar? Or do the generous concessions
offered by the Mauritian government to its Chinese counterpart override any other
considerations? While a definite answer to these questions is not possible in the absence
of further information on the Jin Fei project, our analysis puts together several
compelling arguments that suggest that the economic benefits to Mauritius will be small
relative to the start-up costs borne by the government and its agencies.

44
The SEZ will utilize predominantly Chinese labor and only a small fraction of the
40,000-plus jobs that will be created will actually go to Mauritians. Moreover, based on
casual evidence on staffing patterns in Chinese-owned enterprises, we can expect jobs at
the technical and management levels to be reserved for Chinese expatriates, with local
workers crammed into low-paying jobs. The construction of the industrial zone is under
way: the workers are predominantly Chinese, the contractor is Chinese and so also are
most of the inputs and materials being used. This suggests that the investment,
notwithstanding its scale, will have only a marginal multiplier effect on income in
Mauritius. We also argued that both because of the low potential for technology
spillovers from Chinese enterprises in the SEZ and for the development of linkages with
the local economy, the Jin Fei project will yield small benefits to Mauritius even over the
long term. While the government has justified the project citing the technological
sophistication of the enterprises that it would comprise, local firms, and the economy, are
unlikely to benefit from it if the zone operates as an enclave.
Several points emerge from the above discussion about what should be done to maximize
the benefits on the local economy from Mauritius’ investment relations with China or to
minimize any negative impacts. A priori, the following prescriptions merit consideration:
1. Balanced negotiations
The government should be aware that dealing with Chinese investors will not be business
as usual. China is a developing country notorious for its high level of corruption and poor
respect of human rights. Being Communist, the Chinese government is significantly
present in all investment projects and often negotiates directly with the government of the
country it wishes to invest in. The balance of power in such negotiations is skewed in
favor of the Chinese given their economic might, their authoritarian methods, and their
hunger for economic prosperity. The Chinese firms are thus able to impose their terms on
their weaker partners, who are often impotent in the face of the ever-present threat that
the Chinese investors might simply turn to other countries, in a global race to the bottom,
if they do not get a favorable deal. Mauritius, as a small economy, is particularly
vulnerable to China’s influence. But the government should ask whether compromising
the country’s democratic principles is a good price to pay for investment projects that
may bring little in terms of direct economic benefits to the country. While Mauritius is
small, it is also a mature economy and boasts a long tradition of industry and exports.
Moreover, Mauritius offers economic and political stability to prospective investors; a
permissive, hassle-free investment environment; a shrinking but skilled workforce; and
good and reliable logistics that can compensate for the country’s geographical isolation.
Few African countries can match these benefits. Hence, Mauritius should find strength in
the unique package of incentives that it can tender to potential investors, including China,
and use its diplomatic experience to negotiate for mutual benefits.
2. Seeking investment projects that are in tune with the country’s economic orientation
Mauritius, which is well set on the path of a services-oriented economy, should refrain
from seeking investments in sectors in which it does not have a comparative advantage.

45
This is particularly true of low-skill, labor-intensive activities, in which a combination of
high wages and low productivity has eroded Mauritius’ export competitiveness. Worker
motivation in these sectors is also generally low as could be evidenced by the prevailing
high rates of absenteeism. Even in the seafood industry, which the government is actively
seeking to promote, operators are being forced to seek expatriate labor since Mauritians
are reluctant to work odd hours and tend to be absent from work more frequently than
foreign workers. Even if the government could secure more jobs for the locals, it is
debatable whether Mauritians would want to work in an industry that does not offer better
working conditions than the traditional sectors – clothing and seafood. The expatriate
labor phenomenon, which has taken proportions atypical of a developing country like
Mauritius, is being driven not by local labor shortages but rather by a shift of workers
away from low-wage manufacturing towards the burgeoning services sector.
Consequently, the national FDI policy should be geared towards higher value-added
services in the ITES-BPO sector, and in education, health and tourism, consistent with
government’s policy of developing Mauritius as a hub in these sectors.
3. Requiring Chinese investment and construction projects to use more local labor and
inputs
Agreements on loans from the Chinese government to finance construction (including the
building of the SEZ) and infrastructure development often include clauses that require the
projects to be carried out by a Chinese contractor, using labor, materials and other inputs
from China. These agreements leave little room for Mauritian workers and building
companies to be involved in major construction projects, which minimize the multiplier
impact on the economy. Thus, while the government may gain through favorable terms of
credit, the country loses out on the opportunity to generate higher value added. In future
negotiations for funding with the Chinese, it is important that the Mauritian government
demand that a given proportion (say 10 to 20 percent). Such local content requirements
are common in FDI projects elsewhere, including in China. We are suggesting that the
use of local inputs be negotiated rather than be imposed.
4. Promoting joint ventures and sub-contracting
While Chinese investors may bring superior technology and knowhow to Mauritius, we
have argued above that the local economy is unlikely to benefit from spillovers due to the
mode of operation of Chinese firms. This would be a pity in the context of the Jin Fei
project, which proposes to set up firms in high-technology sectors such as light
engineering and pharmaceuticals, since Mauritius would miss a real opportunity for
technological leap-frogging. The fact that the project will utilize little local labor, which,
moreover will likely be limited to the factory level, and will be closed to Mauritian
investors, means that the industrial zone will be operating as an enclave, sealing off any
potential spillovers to Mauritius. If the government wishes to nurture any hope for the
country to reap the benefits of technology and knowledge transfers from the Chinese
companies to the benefit of local firms, it is imperative that the government negotiates
with its Chinese counterpart to allow some space for Mauritian companies in the SEZ. In
addition, or alternatively, the Mauritian side can push for joint ventures in select high-

46
technology industries. We believe that there is scope for such negotiations since the Jin
Fei project is not yet finalized.
5. Avoiding the prisoners’ dilemma trap
There is an important policy lesson for the whole of Africa in the way it deals with
Chinese investors. What gives the Chinese the power to impose their terms on the
countries they deal with is not so much their economic might than the absence of
collaboration, and in some cases, sheer dividedness, among African host countries. All of
Africa is engaged in a relentless race to the bottom to attract the biggest FDI projects.
This competition entails a kind of prisoners’ dilemma predicament where all countries
clamor to offer the most generous incentives to woo the Chinese and are ready to make
the most sacrificial concessions. If the same countries cooperated to adopt a common
stance in their engagements with China, and agreed to limit incentives and concessions,
on the one hand, while exacting more from the Chinese side, on the other, the entire
continent would gain. Such cooperation is not difficult to achieve. The various regional
economic communities already provide a forum for this kind of cooperation to emerge
and to be solidified into a common line of action with the blessing of a Pan-African
initiative such as the NEPAD.
47
References
Ancharaz, V.D. (2009), “David V. Goliath: Mauritius Facing Up to China”, European
Journal of Development Research, 21 (4): 622-643.
Ancharaz, V.D. (2009), Export Supply Capacity Response Constraints: The Case of
Mauritius”, Interim Report submitted to the African Economic Research Consortium,
October 2009.
Asiedu, E. (2006), “Foreign Direct Investment in Africa: The Role of Natural Resources,
Market Size, Government Policy, Institutions and Political Instability”, World Economy,
29, (1): 63-77
Besada, H., Y. Wang and J. Whalley (2008), “China’s Growing Economic Activity in
Africa”, NBER Working Paper No. 14024, Cambridge: NBER.
Blomstrom, M. and A. Kokko (2003), “The Economics of FDI Incentives”, NBER
Working Paper No. W9489, Cambridge: NBER
Brautigam, D. (2009), “China’s Foreign Aid in Africa: What Do We Know?” in R.
Rotberg (ed.), China into Africa: Trade, Aid, and Influence, Washington, DC: Brookings
Institution Press: 197-216.
Buckley, P. J., L.J. Clegg, A.R. Cross, X. Liu, H. Voss, and P. Zheng (2007), “The
determinants of Chinese outward foreign direct investment”, Journal of International
Business Studies, 38: 499-518.
Cheng, L. K. and Z. Ma (2008), “China’s Outward Foreign Direct Investment”, Paper
presented at the Indian Statistical Institute, Dec.2008.
Cheung, Y. W. and X.W. Qian (2008), “The Empirics of China’s Outward Direct
Investment”, Munich: CESifo GmbH
Dunning, J. H. (1973), “The Determinants of International Production”, Oxford
Economic Papers, 25: 289-336
Dunning, J. H. (1977), “Trade, location of economic activity and the multinational
enterprise: A search for an eclectic approach” in B. Ohlin, P. O. Hesselborn & P. M.
Nijkman (eds), The international allocation of economic activity. London: Macmillan.
Dunning, J.H. (1988), “The Eclectic Paradigm of International Production: A restatement
and some possible extensions”, Journal of International Business Studies, 19 (1): 1-31.
Fung, K.C., and A. Garcia-Herrero (2008), “Where Do Chinese and Indian Investors Go
and Why?” Mimeo, Bank for International Settlements, Hong Kong, China and
University of California, Santa Cruz.

48
Gani, A. (2007), “Governance and Foreign Direct Investment Links: Evidence from
Panel Data Estimations’, Applied Economics Letters, 14 (10): 753-756
Geda, A. (2006), “The Impact of China and India on Africa: Trade, FDI and the African
Manufacturing Sector: Issues and Challenges”, Framework Paper for AERC Project,
Addis Ababa University.
Globerman, S. and D. Shapiro (2002), “Global Foreign Direct Investment Flows: The
Role of Governance Infrastructure”, World Development, 30 (11): 1899-1919
Harms, P. and H.W. Ursprung (2002), “Do Civil and Political Repression really boost
Foreign Direct investment?” Economic Inquiry, 40(4): 651-663
Hymer, S.H. (1960), “The International Operations of National Firms: A Study of Direct
Foreign Investment”, PhD Dissertation, published posthumously, Cambridge, Mass.: The
MIT Press.
Jenkins, R. and C. Edwards (2005), ‘The Effect of China and India’s Growth and Trade
Liberalization on Poverty in Africa’, London: Institute for Development
Studies/Enterplan.
Kaplinsky, R. (2008), “What Does the Rise of China Do for Industrialization in Sub-
Saharan Africa?” Review of African Political Economy, 35(115).
Kaplinsky, R., D. McCormick, and M. Morris (2007), “The Impact of China on Sub-
Saharan Africa”, Working Paper 291, Institute of Development Studies, UK.
Kaplinsky, R. and M. Morris, M (2008), “Do The Asian Drivers Undermine Export-
Oriented Industrialization in SSA?” World Development, 36(2): 254-273.
O’Connell, S.A. and B.J. Ndulu (1999), “Governance and Growth in Sub-Saharan
Africa”, Journal of Economic Perspectives, 13 (3): 41-66.
Pottinger, M. and O. Brown (2010), “Shares in Chinese Companies May Not Gain a
Major Push”, Wall Street Journal, March 11, 2010.
UNCTAD (2009), World Investment Report 2009, United Nations: New York.
UNCTAD (2001), Mauritius: Investment Policy Review, United Nations: New York.
US Department of State (2008), “2008 Investment Climate Statement – China”.
Downloadable at http://www.state.gov/e/eeb/ifd/2008/103668.htm
Wang, J.-Y. and A. Bio-Tchané (2008), “Africa’s Burgeoning Ties with China”, Finance
and Development, 45 (1).

49
Wei, S. J. (2000), “How taxing is corruption on international investors”, Review of
Economics and Statistics, 82 (1): 1-1
Zafar, A. (2007), “The Growing Relationship between China and Sub-Saharan Africa:
Macroeconomic, Trade, Investment, and Aid Links”, World Bank Research Observer, 22
(1): 103-130.
Pinaud, N. (2007), “Nipping African Clothing in a Post-MFA BUB?” Standard Chartered
and the OECD Development Centre, Africa and China: Economic and Business
Perspective.
Geda, A. (2006), “The Impact of China and India on Africa: Trade, FDI and the African
Manufacturing Sector: Issues and Challenges”, Framework Paper for AERC Project,
Addis Ababa University.

50

51
Table A.1: Aid from China
Year
Type of
Assistance
Loan
amount
Terms of Assistance Project Details
09/08/1972
Loan GBP 13,540,961 Interest-free with repayment in 10 years
within 25 years grace period
Terminal Building at Plaisance Airport.
Technical Assistance for agricultural
projects.
01/07/1985
Loan RMB 35,000,000 Interest-free with repayment in 10 years and
10 years grace period
Sports complex - Anjalay Stadium.
Barkly Bridge (Moka)
Pointe Monier Bridge (Rodrigues)
Police Workshop
15/12/1990
Loan RMB 20,000,00
Plus: Commodity Loan of
RMB 5m dated 01/07/85
Converted into Project
Loan Total RMB 25m
Interest-free with repayment in 10 years and
10 years grace period
Upgrading of Flacq Hospital
20/07/1991
Loan RMB33,000,000
Interest-free withrepayment in 10 years and
10 years grace period
Beau-Vallon Housing Project
13/04/1993
Change in
repayment
terms
Interest-free with repayment in 20 years and
10 years grace period
On-lent to NHDC
14/06/1993
Loan
RMB 20,000,000
RMB 4.7m under loan of
RMB 33m will be used to
supplement the RMB 20m
loan
Interest Free with repayment in 10 years and
10 years grace period
Atlee Housing Project
Recreation Centre for Senior Citizens
03/05/1997
Loan
RMB Yuan 50m
Interest Rate 4%. Duration of credit12 years
with grace period to be determined by banks
on both sides
Efficient Joint-venture projects.

52
03/05/1997
25/02/1999
Loan
Loan
RMB Yuan 60m
RMB Yuan 35m
Interest rate 4% with repayment of 9 years
and grace period of 3 years
Ship for Mauritius Shipping Corporation
(Mauritius Trochetia) – a 3500-ton
Passenger-Cum -Cargo Vessel
30/11/2000 Loan RMB 20M 10G + 10P New Market at Quatre- Bornes.
05/07/2001
Loan RMB Yuan 20m Interest Free in 10 years with a moratorium of
10years
Construction Project
01/07/2002
Loan RMB Yuan 20m Interest free; Repayment in 10 years with a
moratorium of 10 years
Economic Assistance Loan
06/2002
Loan RMB Yuan 100 m Interest Rate of 4% with repayment of 8 years
and grace period of 4 years
Low-cost housing
07/2002
01/2003
20m Yuan
20m Yuan
Equipment for the Customs at the Port and
Airport Project completed and handed over to
the Customs in February 2006
X-ray scanning equipment and Pallet-
sized X-ray machine
16/01/2003 Loan
RMB Yuan 20m Interest free; Repayment in 10 years with a
moratorium of 10 years
Economic Assistance Loan
10/06/2003
RMB 260M Yuan (RMB
150m signed on 30 Nov.
2000 and RMB 110m signed
on 10 June 2003)
The framework agreements for the two loans
has been extended until December 2007.
Plaines-Wilhems Sewerage Project - lot
2 of P-Wilhems Reticulations Network
and House Connection.
01/2005
Grant RMB 3m
Yuan
Part of this has been used to finance TA in
Mauritius and a seminar on Textiles in China
(private sector participants)
Human Resource Training and Office
Equipment
12/07/2006
Grant RMB 5 Yuan To be utilised for project relating to human
resource development cooperation and for
other projects to be mutually agreed upon
Human Resources
Development

53
08/2006
07/2001
07/2004
01/2005
01/2006
Loans
RMB 100m Yuan
Loan of RMB20m
Loan of RMB20m
Loan of RMB40m
Loan of RMB20m
Surplus of RMB 16m to be
used to partially fund
procurement of radio and
TV broadcast equipment.
Interest-free loans
Chinese side responsible for design, provision
of construction, equipment and materials,
dispatch of engineering and technical
personnel
Construction of new MBC headquarters
07/2007 Loan RMB 800 million Line of credit at subsidized interest rate to be
spent over 3 years
Expansion of the waste water network,
construction of a water treatment plant,
modernization of the port, construction of
the Bagatelle Dam, conversion of
Highlands into an urban zone.
02/2009
Grant RMB 10 million Interest rate free
Subsidised rate of 2%
interest-free
Infrastructure development
Extension of the Airport Terminal
Building Loan RMB 30 million
Loan $260 million
Loan RMB 40 million
Grant RMB 30 Million
04/2009 Loan
Rs 25 billion East-West Corridor, the Ring Road at Port
Louis, a Bus Way and the Harbour
Bridge. Source: Ministry of Finance


