Impact of Capital Structure on Microfinance Institutions...
38
ROLE OF CAPITAL STRUCTURE ON PERFORMANCE OF MICROFINANCE INSTITUTIONS OF ASIA Rukhsana Bibi and Attiya Yasmin Javid
Transcript of Impact of Capital Structure on Microfinance Institutions...

ROLE OF CAPITAL STRUCTURE ON PERFORMANCE OF MICROFINANCE INSTITUTIONS OF ASIA
Rukhsana Bibi and Attiya Yasmin Javid

INTRODUCTION
Financing is rare for many poor people around the world who wish to improve their living standard. Microfinance is not a new concept, microfinance operations started in 1970s by Professor Muhammad Yunus founder of Grameen bank.
Micro financing is the provision of financial services to low income people with small business activities.
Sustainability is the ability to sustain or long-term continuation of the Microfinance programme after the project activities have been discontinued.
Unsustainable MFIs might help the poors , but they would not be able to help the poors in the future because the MFIs will be gone.

Introduction (cont’d)
For MFIs to become financially sustainable the capital structure composition is important.
This motivates to undertake study to determine the factors that affect the sustainability
and capital structure composition of MFIs in Asia where the level of poverty is wide and
deep and MFIs are fastest in growing.
This study focuses on the effect of capital structure on MFIs sustainability, efficiency, productivity
and outreach to identify the opportunities for increasing the sustainability and growth of lending
institutions.

Objective
To identify how capital structure composition (deposit to asset, debt to asset, share capital to asset, debt to equity and grants to assets) affects the performance of MFIs, by focusing on return on assets, return on equity, operational and financial self-sufficiency and outreach.
To examine the impact of MFI specific factors such as size of MFI, female borrowers, and legal status of MFIs in addition to capital structure variables.
To examine the role of economic conditions such as GDP growth and inflation along with capital structure variables affect the performance of MFI.
To examine the regional effect on MFI (using regional dummies) including capital structure variables, MFI specific and country specific variables.

SIGNIFICANCE OF THE STUDY
Lack of serious empirical work in Asia that exclusively focuses to understand the importance of microfinance capital structure and its (sustainability and outreach) therefore this study fills this gap.
This study allows to check effects of capital structure on microfinance performance measured by operational self-sufficiency, financial self-sufficiency, Return on asset, Return on equity, outreach and management efficiency.
This study contributes to the existing literature in several dimensions: It includes different variables to capture capital structure impact

LITERATURE REVIEW Researcher Year Research
Abor (2005)
The findings show a positive relationship between the short-term debt ratio and profitability. While a negative relationship between long-term debt ratio and profitability. Other studies supporting this positive association between debt level and firm’s performance are (Champion, 1999; Gill, Biger, & Mathur, 2011; Hadlock & James, 2002; Hutchinson, 1995; Roden & Lewellen, 1995; Taub, 1975).
Berger and Bonaccorsi di Patti
(2006) argues that capital structure and firm performance could be closely correlated with each other. And the findings are consistent with the agency theory that high leverage reduces the agency costs of outside equity and increases firm value by inspiring managers to act more in the interests of shareholders of the firm.
Silva (2008)
Found that microfinance institutions use long term debt financing for their operations that might have less pressure on the management of MFI. It also highlights that profitable microfinance institutions depend more on long term debt financing.
Literature review Researcher Year Research
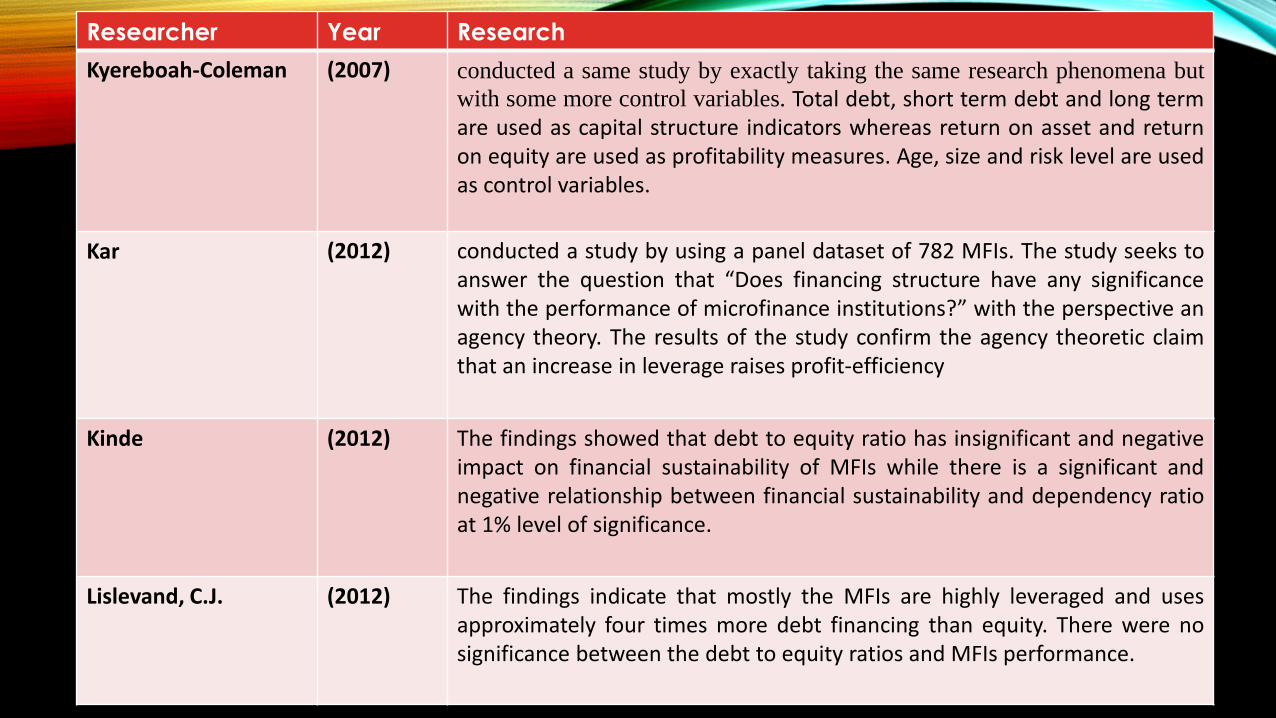
Kyereboah-Coleman (2007)
conducted a same study by exactly taking the same research phenomena but
with some more control variables. Total debt, short term debt and long term are used as capital structure indicators whereas return on asset and return on equity are used as profitability measures. Age, size and risk level are used as control variables.
Kar (2012)
conducted a study by using a panel dataset of 782 MFIs. The study seeks to answer the question that “Does financing structure have any significance with the performance of microfinance institutions?” with the perspective an agency theory. The results of the study confirm the agency theoretic claim that an increase in leverage raises profit-efficiency
Kinde
(2012)
The findings showed that debt to equity ratio has insignificant and negative impact on financial sustainability of MFIs while there is a significant and negative relationship between financial sustainability and dependency ratio at 1% level of significance.
Lislevand, C.J. (2012)
The findings indicate that mostly the MFIs are highly leveraged and uses approximately four times more debt financing than equity. There were no significance between the debt to equity ratios and MFIs performance.
Literature review Researcher Year Research
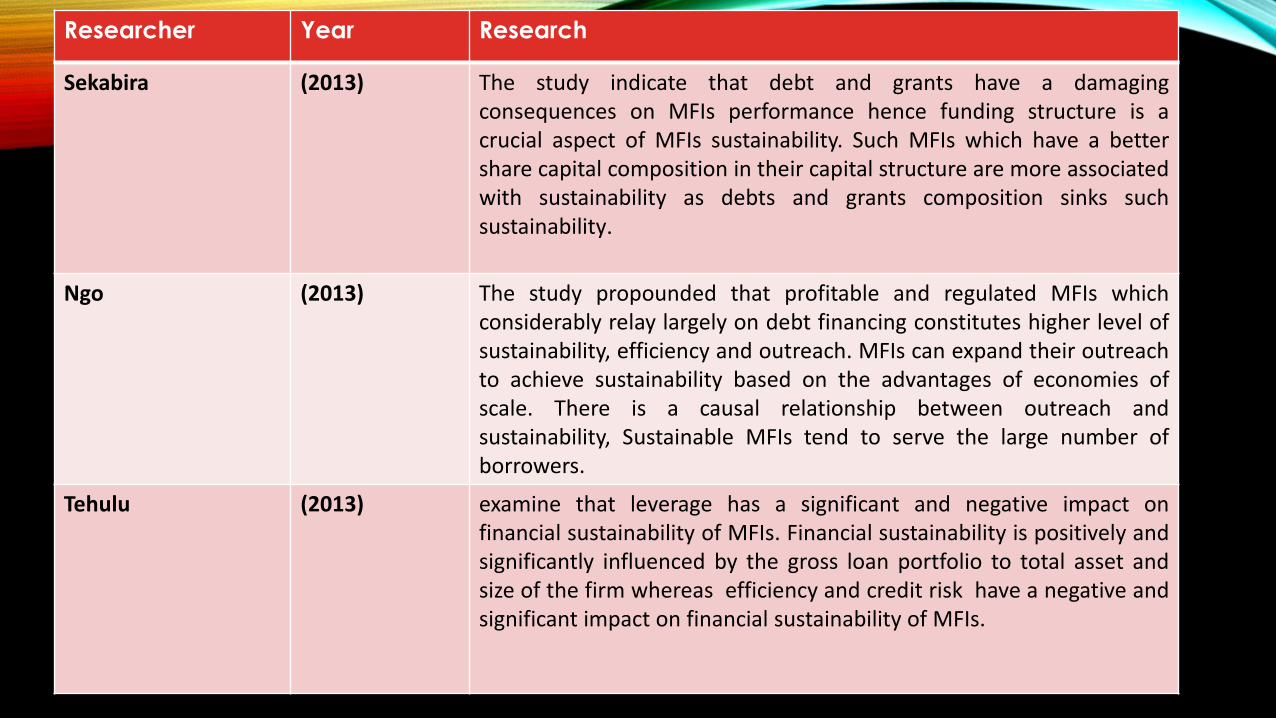
Sekabira (2013) The study indicate that debt and grants have a damaging consequences on MFIs performance hence funding structure is a crucial aspect of MFIs sustainability. Such MFIs which have a better share capital composition in their capital structure are more associated with sustainability as debts and grants composition sinks such sustainability.
Ngo (2013)
The study propounded that profitable and regulated MFIs which considerably relay largely on debt financing constitutes higher level of sustainability, efficiency and outreach. MFIs can expand their outreach to achieve sustainability based on the advantages of economies of scale. There is a causal relationship between outreach and sustainability, Sustainable MFIs tend to serve the large number of borrowers.
Tehulu
(2013) examine that leverage has a significant and negative impact on financial sustainability of MFIs. Financial sustainability is positively and significantly influenced by the gross loan portfolio to total asset and size of the firm whereas efficiency and credit risk have a negative and significant impact on financial sustainability of MFIs.

THEORETICAL FRAMEWORK
Capital structure theory: • The Modigliani Miller Theorem
• The trade-off theory
• Pecking Order Theory
• Agency cost theory

Hypothesis
The following hypothesis will test the relationships.
H1: Highly debt financed microfinance institutions has more sustainability
H2: Highly debt financed microfinance institutions has more financial performance
H3: Highly debt financed microfinance institutions has more social performance
H4: Large deposit to asset ratio, in microfinance institutions has more sustainability
H5: Large deposit to asset ratio, in microfinance institutions has more financial performance
H6: Large deposit to asset ratio, in microfinance institutions has more social performance
H7: Highly debt financed microfinance institutions are more efficient
H8: There exist a tradeoff between breadth of outreach and depth of outreach

The variables definition and their measurement are as follows:
DEPENDENT VARIABLE
Variables Abbreviations
Effect Definition Source
Operational-self sufficiency OSS Financial Revenue /(Financial Expense + Impairment Losses on Loans
+Operating Expense)
MIX Market
Financial-self sufficiency FSS Adjusted Financial Revenue / Adjusted (Financial Expense + Impairment
Losses on Loans +Operating Expense)
MIX Market
Return on assets ROA Net profit to total assets MIX Market
Return on equity ROE
Net profit to total equity MIX Market
Breadth of outreach LNAB Negative Log of active borrowers MIX Market
Depth of outreach ALS Average loan size per borrowers MIX Market
Management efficiency MEFF Operating expense to total asset costs MIX Market

Loan intensity LI Positive Gross loan portfolio as a percentage of total assets MIX Market
Portfolio at risk>30days PAR Negative The level of credit risk or inversely portfolio quality MIX Market
cost per borrower CB Negative Cost associated with borrowing MIX Market
Productivity PRO Positive MIX Market
female borrower FB Negative Female clients MIX Market
Loan loss rate LLR Negative Non receivables MIX Market
Young MFIs YNG Indeterminate Dummy MIX Market
Active borrowers LNAB Negative Number of borrowers with loan outstanding MIX Market
Mature MAT Positive Dummy MIX Market
Firm Size FS Positive Natural logarithm of total assets
MIX Market
Regulated REG Indeterminate Dummy MIX Market

Banks Bank Indeterminate Dummy MIX Market
Nongovernment organizations NGO Indeterminate Dummy MIX Market
Debt relative to assets (%) DTA Negative Total debt/ total assets MIX Market
Deposits relative to assets (%) DA Positive Number of deposits/ total assets MIX Market
Grants as a % of asset GA Negative Grants/ total assets MIX Market
Share capital as a % of assets
SA Negative Share capital/ total assets MIX Market
Debt on total equity (%) DTE Negative Total debt/ total equity MIX Market
Gross domestic product GDP Indeterminate Gross domestic product WDI
Inflation INF Negative Inflation WDI

Variables definition:
• OSS
• FSS
• ROA
• ROE
• LNAB
• ALS
𝐹𝑖𝑛𝑎𝑛𝑐𝑖𝑎𝑙 𝑅𝑒𝑣𝑒𝑛𝑢𝑒 (𝑇𝑜𝑡𝑎𝑙)
(𝐹𝑖𝑛𝑎𝑛𝑐𝑖𝑎𝑙 𝐸𝑥𝑝𝑒𝑛𝑠𝑒 + 𝐿𝑜𝑎𝑛𝐿𝑜𝑠𝑠 𝑃𝑟𝑜𝑣𝑖𝑠𝑖𝑜𝑛 𝐸𝑥𝑝𝑒𝑛𝑠𝑒 + 𝑂𝑝𝑒𝑟𝑎𝑡𝑖𝑛𝑔 𝐸𝑥𝑝𝑒𝑛𝑠𝑒)
𝐴𝑑𝑗𝑢𝑠𝑡𝑒𝑑( 𝐹𝑖𝑛𝑎𝑛𝑐𝑖𝑎𝑙 𝑅𝑒𝑣𝑒𝑛𝑢𝑒 (𝑇𝑜𝑡𝑎𝑙)
𝐴𝑑𝑗𝑢𝑠𝑡𝑒𝑑 (𝐹𝑖𝑛𝑎𝑛𝑐𝑖𝑎𝑙 𝐸𝑥𝑝𝑒𝑛𝑠𝑒 + 𝐿𝑜𝑎𝑛𝐿𝑜𝑠𝑠 𝑃𝑟𝑜𝑣𝑖𝑠𝑖𝑜𝑛 𝐸𝑥𝑝𝑒𝑛𝑠𝑒 + 𝑂𝑝𝑒𝑟𝑎𝑡𝑖𝑛𝑔 𝐸𝑥𝑝𝑒𝑛𝑠𝑒)
Net profit to total assets Net profit to shareholders equity Number of active borrowers Average loan balance per borrower (Hisakoo 2009)

DATA AND METHODOLOGY:
• Observations are from
2000-2013
• Panel data
• GGM
• Data is taken from the mix market and the audit reports

DATA AND METHODOLOGY: (cont’d)
The data collected for the microfinance institution from the microfinance information exchange.
The data is collected form four regions of Asia where MFIs are growing fast and poverty is relatively high such as Eastern Europe and Central Asia, the Middle East and North Africa, East Asia and Pacific and South Asia
The data of macroeconomic variables is collected from world development index.
The panel data estimation is done by applying Generalized method of moments to avoid endogenity. The lag explanatory variables are used as instrument and validity of the instruments is checked by Sargan J test
The Hausman support fixed effect models for 1, 2 and 3 whereas model 4 with regional dummies Generalized least square is used

PERFORMANCE MEASURES OF MICROFINANCE Sustainability: Operational self sufficiency
Financial self sufficiency
Financial performance: Return on assets
Return on equity
Social performance: Breadth of outreach
Depth of outreach
Management efficiency The study applies the following model suggested by Bogan (2009) and Ngo (2013). Hence the baseline model is specified as follows:
𝑃𝑒𝑟𝑓𝑖𝑗𝑡 = 𝛼0 𝛼𝑖𝑖
𝑋𝑖𝑗𝑡 + 𝛽𝑖𝑖
𝑌𝑖𝑗𝑡 + 𝛾𝑖𝑗
𝑍𝑖𝑗𝑡 + ∅𝑘𝑘
R + 𝜀𝑖𝑗𝑡

IMPACT OF CAPITAL STRUCTURE ON SUSTAINABILITY
Microfinance institutions attain sustainability when its operating income from loans is enough to cover up all the operating cost (Sharma, 1997)
In this study sustainability is measured by two proxies namely operational self-sufficiency (OSS) and financial self-sufficiency (FSS).
Model of sustainability:
𝑠𝑢𝑠𝑡𝑎𝑖𝑛𝑎𝑏𝑖𝑙𝑖𝑡𝑦𝑖𝑗𝑡 = ∝0 + ∝1 𝐷𝐴𝑖𝑗𝑡+∝2 𝐷𝑇𝐴𝑖𝑗𝑡+∝3 𝐺𝐴𝑖𝑗𝑡 ∝4 𝑆𝐴𝑖𝑗𝑡+∝5 𝐷𝑇𝐸𝑖𝑗𝑡+∝6 𝐿𝑁𝐴𝐵𝑖𝑗𝑡+∝7 𝑃𝑅𝑂𝑖𝑗𝑡+∝8 𝐶𝐵+ ∝9 𝐹𝐵𝑖𝑗𝑡+∝10 𝐿𝐿𝑖𝑗𝑡+∝11 𝐿𝐼𝑖𝑗𝑡+∝12 𝑃𝐴𝑅𝑖𝑗𝑡+∝13 𝐺𝐷𝑃𝑖𝑗𝑡+∝14 𝐼𝑁𝐹𝑖𝑗𝑡+𝜀𝑖𝑗𝑡
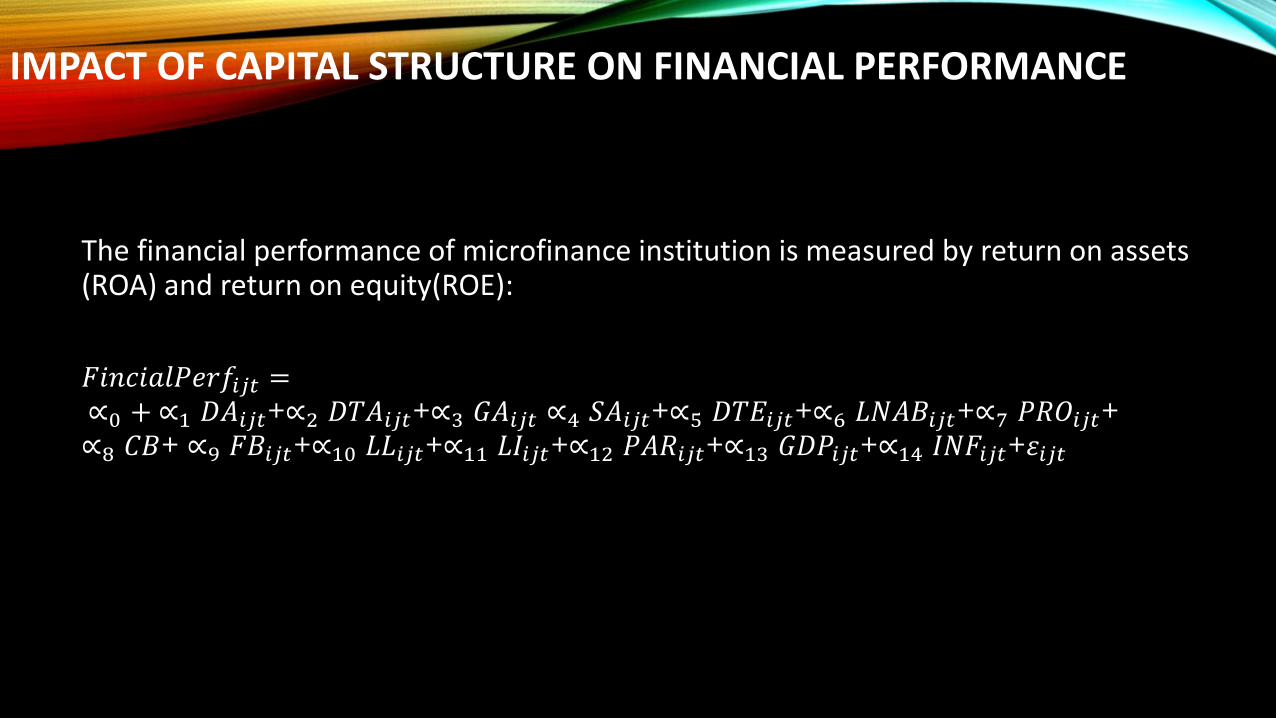
IMPACT OF CAPITAL STRUCTURE ON FINANCIAL PERFORMANCE
The financial performance of microfinance institution is measured by return on assets (ROA) and return on equity(ROE):
𝐹𝑖𝑛𝑐𝑖𝑎𝑙𝑃𝑒𝑟𝑓𝑖𝑗𝑡 = ∝0 + ∝1 𝐷𝐴𝑖𝑗𝑡+∝2 𝐷𝑇𝐴𝑖𝑗𝑡+∝3 𝐺𝐴𝑖𝑗𝑡 ∝4 𝑆𝐴𝑖𝑗𝑡+∝5 𝐷𝑇𝐸𝑖𝑗𝑡+∝6 𝐿𝑁𝐴𝐵𝑖𝑗𝑡+∝7 𝑃𝑅𝑂𝑖𝑗𝑡+∝8 𝐶𝐵+ ∝9 𝐹𝐵𝑖𝑗𝑡+∝10 𝐿𝐿𝑖𝑗𝑡+∝11 𝐿𝐼𝑖𝑗𝑡+∝12 𝑃𝐴𝑅𝑖𝑗𝑡+∝13 𝐺𝐷𝑃𝑖𝑗𝑡+∝14 𝐼𝑁𝐹𝑖𝑗𝑡+𝜀𝑖𝑗𝑡

IMPACT OF CAPITAL STRUCTURE ON SOCIAL PERFORMANCE
The social performance is measured by number of active borrowers to capture breadth of outreach and average loan size to measure depth of outreach.
𝑆𝑜𝑐𝑖𝑎𝑙𝑃𝑒𝑟𝑓𝑖𝑗𝑡 = ∝0 + ∝1 𝐷𝐴𝑖𝑗𝑡+∝2 𝐷𝑇𝐴𝑖𝑗𝑡+∝3 𝐺𝐴𝑖𝑗𝑡 ∝4 𝑆𝐴𝑖𝑗𝑡+∝5 𝐷𝑇𝐸𝑖𝑗𝑡+∝6 𝑅𝑂𝐴𝑖𝑗𝑡+∝7 𝑃𝑅𝑂𝑖𝑗𝑡+∝8 𝐶𝐵+ ∝9 𝐹𝐵𝑖𝑗𝑡+∝10 𝐿𝐿𝑖𝑗𝑡+∝11 𝐿𝐼𝑖𝑗𝑡+∝12 𝑃𝐴𝑅𝑖𝑗𝑡+∝13 𝐺𝐷𝑃𝑖𝑗𝑡+∝14 𝐼𝑁𝐹𝑖𝑗𝑡+𝜀𝑖𝑗𝑡

IMPACT OF CAPITAL STRUCTURE ON MANAGEMENT EFFICIENCY
The management efficiency is measured by operational expense to total asset ratio.
𝑀𝐸𝐹𝐹𝑖𝑗𝑡 = ∝0 + ∝1 𝐷𝐴𝑖𝑗𝑡+∝2 𝐷𝑇𝐴𝑖𝑗𝑡+∝3 𝐺𝐴𝑖𝑗𝑡 ∝4 𝑆𝐴𝑖𝑗𝑡+∝5 𝐷𝑇𝐸𝑖𝑗𝑡+∝6 𝑅𝑂𝐴𝑖𝑗𝑡+∝7 𝑃𝑅𝑂𝑖𝑗𝑡+∝8 𝐶𝐵+ ∝9 𝐹𝐵𝑖𝑗𝑡+∝10 𝐿𝐿𝑖𝑗𝑡+∝11 𝐿𝐼𝑖𝑗𝑡+∝12 𝑃𝐴𝑅𝑖𝑗𝑡+∝13 𝐺𝐷𝑃𝑖𝑗𝑡+∝14 𝐼𝑁𝐹𝑖𝑗𝑡+𝜀𝑖𝑗𝑡
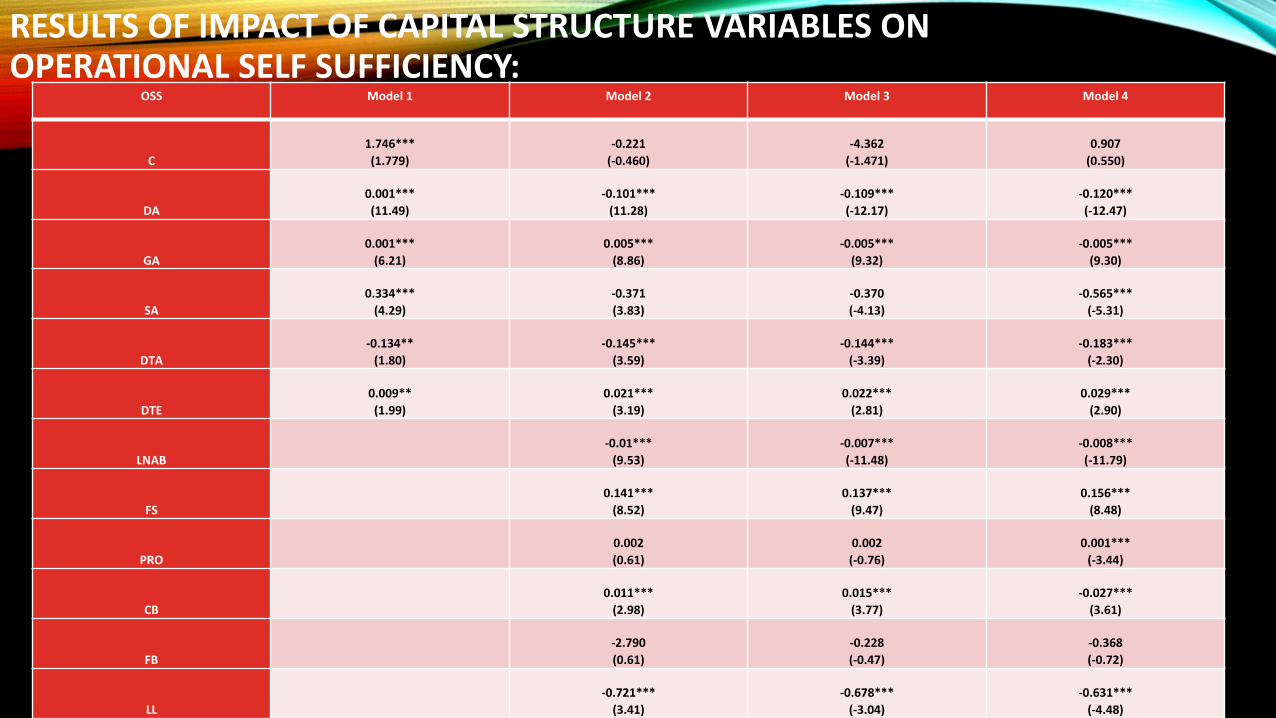
RESULTS OF IMPACT OF CAPITAL STRUCTURE VARIABLES ON OPERATIONAL SELF SUFFICIENCY: OSS Model 1 Model 2 Model 3 Model 4
C
1.746***
(1.779)
-0.221
(-0.460)
-4.362
(-1.471)
0.907
(0.550)
DA
0.001***
(11.49)
-0.101***
(11.28)
-0.109***
(-12.17)
-0.120***
(-12.47)
GA
0.001***
(6.21)
0.005***
(8.86)
-0.005***
(9.32)
-0.005***
(9.30)
SA
0.334***
(4.29)
-0.371
(3.83)
-0.370
(-4.13)
-0.565***
(-5.31)
DTA
-0.134**
(1.80)
-0.145***
(3.59)
-0.144***
(-3.39)
-0.183***
(-2.30)
DTE
0.009**
(1.99)
0.021***
(3.19)
0.022***
(2.81)
0.029***
(2.90)
LNAB
-0.01***
(9.53)
-0.007***
(-11.48)
-0.008***
(-11.79)
FS
0.141***
(8.52)
0.137***
(9.47)
0.156***
(8.48)
PRO
0.002
(0.61)
0.002
(-0.76)
0.001***
(-3.44)
CB
0.011***
(2.98)
0.015***
(3.77)
-0.027***
(3.61)
FB
-2.790
(0.61)
-0.228
(-0.47)
-0.368
(-0.72)
LL
-0.721***
(3.41)
-0.678***
(-3.04)
-0.631***
(-4.48)

LI
0.032
(1.50)
0.042***
(2.08)
0.056***
(3.25)
PAR
-0.329
(1.08)
-0.279
(-1.10)
-0.368
(-1.06)
YNG
6.88***
(2.20)
6.477***
(2.50)
9.285***
(2.89)
MAT
5.35**
(1.95)
5.276**
(1.83)
9.771**
(1.98)
NGO
7.25**
(2.53)
6.807**
(2.32)
8.791***
(3.30)
Bank
-4.70
(0.00)
-4.258
(0.00)
-0.002
(0.00)
REG
-4.39
(1.38)
0.001
(-1.26)
-5.666
(-1.16)
GDP
0.601***
(3.27)
0.003***
(3.61)
INF
0.603
(1.10)
-0.428
(1.05)
SA
-7.782***
(4.30)
EE
-6.393*
(-1.74)
EA
9.682
(1.21)
1Hausman(p value)
0.000 0.000
0.001
2Sargan J test (p-value
0.000 0.000 0.000
R2
0.355
0.377
0.398
0.401

RESULTS OF IMPACT OF CAPITAL STRUCTURE VARIABLES ON FINANCIAL SELF SUFFICIENCY:
FSS Model 1 Model 2 Model 3 Model 4
C
0.129
(1.475)
-0.103
(-0.209)
-4.447
(-1.461)
-0.038
(-0.024)
DA
-0.011***
(-7.35)
-0.796***
(-8.06)
-0.779***
(-8.56)
-0.950***
(-8.67)
GA
-0.005***
(-5.17)
-0.004***
(-6.68)
0.004***
(6.98)
-0.004***
(-7.03)
SA
0.293***
(14.09)
-0.220**
(-2.20)
-0.219***
(-2.33)
-0.381***
(-3.39)
DTA
-0.128***
(-2.24)
-0.113***
(2.32)
-0.109***
(-2.16)
-0.149***
(-1.83)
DTE
0.011***
(2.36)
0.022***
(3.02)
0.023***
(2.74)
-0.029***
(2.85)
LNAB
-0.006***
(6.83)
-0.005***
(-8.21)
-0.006***
(-8.53)
FS
0.112***
(6.54)
0.108***
(7.17)
0.126***
(6.38)
PRO
0.002
(0.46)
0.003
(-0.65)
0.001***
(-2.97)
CB
0.003
(0.66)
0.005
(0.96)
-0.015***
(2.23)
FB
-0.508
(1.05)
-0.452
(-0.91)
0.593
(-1.13)

LL
-0.153
(6.57)
-0.148
(-6.13)
-1.276***
(-7.85)
LI
0.037
(1.96)
0.047
(2.56)
0.055***
(3.27)
PAR
-0.542
(1.38)
-0.490
(-1.45)
-0.606
(-1.39)
YNG
9.876***
(3.11)
9.431***
(3.47)
11.154***
(3.29)
MAT
7.670***
(2.47)
7.593***
(2.31)
11.838***
(2.29)
NGO
5.341***
(2.06)
4.872***
(1.85)
6.284***
(2.43)
Bank -7.729
(0.00)
-7.250
(0.00)
-9.193
(0.00)
REG -7.668***
(2.38)
0.002***
(-2.26)
-9.193***
(-1.88)
GDP 0.627***
(3.43)
0.472***
(3.55)
INF 0.626
(1.12)
-0.665
(1.12)
SA
-5.998***
(-3.35)
EE
8.619*
(-1.74)
EA
8.619
(1.16)
1Hausman(p- value)
0.001 0.000 0.002
2Sargan J test (p-value
0.001 0.001
0.001
R2
0.680 0.390 0.411
0.430

IMPACT OF CAPITAL STRUCTURE ON FINANCIAL PERFORMANCE (ROA):
ROA Model 1 Model 2 Model 3 Model 4
C
0.001
(1.049)
0.001
(-0.441)
)
0.001
(0.770)
0.002
(0.969)
DA
0.001***
(7.50)
-0.031**
(1.99)
-0.031**
(-1.99)
-0.039**
(-1.97)
GA
0.001**
(1.83)
0.002***
(2.33)
0.001***
(2.35)
0.001***
(2.62)
SA
0.039***
(4.14)
0.004
(0.15)
0.003
(0.11)
0.043***
(2.44)
DTA
0.022***
(7.13)
0.042***
(4.06)
0.042***
(4.12)
0.043***
(1.76)
DTE
0.001
(0.98)
0.001
(0.53)
0.002
(0.52)
-0.001***
(4.23)
LNAB
0.003***
(2.30)
0.002***
(-2.42)
0.001***
(-2.63)
FS
0.002*
(1.77)
0.002*
(1.81)
0.002***
(3.05)
PRO
0.001
(0.44)
0.000
(0.45)
0.002
(0.72)
CB
0.001
(4.91)
0.003
(-5.02)
0.001***
(-2.34)
FB
-0.003
(0.42)
-0.002
(-0.30)
-0.001
(-4.95)

LL
-0.004
(4.12)
-0.004
(-4.10)
-0.004
(-0.17)
LI
0.002
(0.80)
0.002
(0.84)
0.001
(-4.39)
PAR
-0.062**
(1.88)
-0.062**
(-1.88)
-0.064**
(-1.72)
YNG
0.043***
(3.05)
0.043***
(2.98)
0.041***
(3.02)
MAT
0.040***
(3.53)
0.040***
(3.49)
0.040***
(3.84)
NGO
-0.0138***
(2.28)
-0.013***
(-2.33)
-0.011***
(-1.94)
Bank
-0.010
(0.00)
-0.010
(0.00)
-0.010
(0.00)
REG
-0.010
(1.45)
0.000
(-1.41)
0.001
(-1.52)
GDP
0.003***
(2.90)
0.001***
(2.91)
INF
-0.001*
(-1.78)
-0.002*
(-1.73)
SA
-0.002
(0.38)
EE
0.041
(0.63)
EA
-0.041**
(-2.27)
1Hausman(p value)
0.001 0.000 0.001
2Sargan J test (p-value)
0.001 0.001 0.001
R2
0.377
0.394 0.400
0.423

IMPACT OF CAPITAL STRUCTURE ON FINANCIAL PERFORMANCE (ROE):
ROE Model 1 Model 2 Model 3 Model 4
C
0.201
(1.333)
0.004
(0.058)
0.038
(0.895)
0.066
(0.817)
DA
0.002***
(3.14)
0.145***
(1.27)
1.439
(1.27)
0.914
(1.38)
GA
0.001
(0.88)
0.002
(1.54)
0.002
(-1.54)
-0.001
(-1.63)
SA
-0.855
(1.03)
-0.254
(1.12)
-2.553
(-1.12)
-0.314
(-1.05)
DTA
0.341***
(2.91)
-0.175
(1.02)
-1.697
(-1.02)
-0.186
(-1.06)
DTE
-0.001
(0.64)
-0.003**
(1.73)
-0.003**
(-1.73)
-0.003
(-1.77)
LNAB
0.001
(0.32)
0.001
(0.24)
0.001*
(-1.78)
FS
0.098
(0.85)
0.099
(0.86)
0.137
(-0.96)
PRO
0.002
(0.82)
0.002
(0.82)
0.001
(0.02)
CB
0.003
(0.59)
0.001
(0.58)
0.001
(0.59)
FB
-0.634
(1.10)
-0.623
(-1.09)
-0.587
(-1.13)

LL
0.072
(0.75)
0.072
(0.75)
0.072**
(-1.72)
LI
-0.001
(0.81)
-0.001
(-0.86)
-0.002
(-1.37)
PAR
0.141
(0.83)
1.411
(0.83)
-1.400
(0.79)
YNG
-0.035
(0.23)
-0.043
(-0.27)
-0.085
(-0.51)
MAT
-0.287**
(-1.93)
-0.288**
(-1.93)
-0.038
(-0.25)
NGO
0.403
(1.54)
0.404
(1.54)
0.250**
(-1.11)
Bank
0.088
(0.00)
0.090
(0.00)
0.110*
(0.001)
REG
0.001
(0.53)
0.001
(0.55)
0.001
(1.03)
GDP
-0.006
(0.83)
0.005
(0.97)
INF
-0.006
(-1.10)
-0.004
(-0.72)
SA
-0.109
(-0.89)
EE
-0.018
(-0.54)
EE
0.677
(0.895)
1Hausman(p value)
0.003 0.001 0.001
2Sargan J test (p-value
0.001 0.000 0.005
R2
0.399 0.421 0.433
0.450

IMPACT OF CAPITAL STRUCTURE ON MFI SOCIAL PERFORMANCE:
• There is heterogeneity between financial structure and MFIs characteristics. This tells us that some MFIs may take on more debt to increase outreach.
• From the empirical results, there is possible trade-off between breadth of outreach and the depth of outreach.
• This may be due funding limitations.
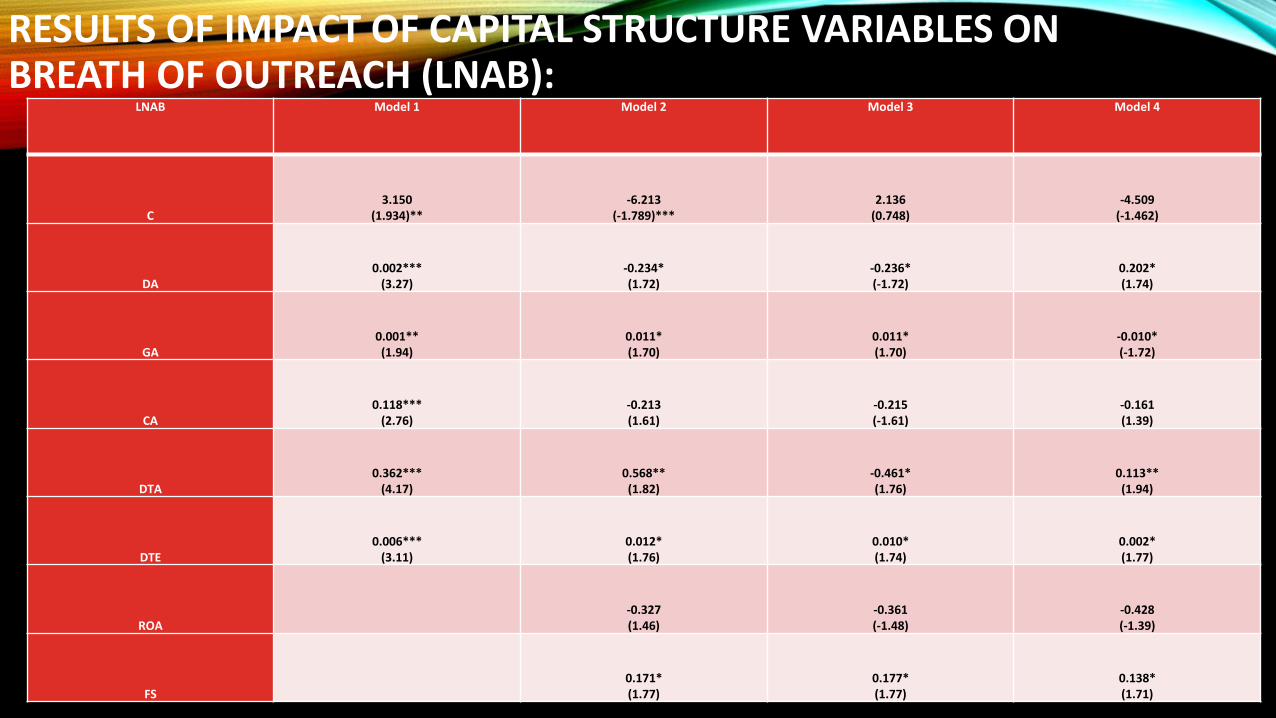
RESULTS OF IMPACT OF CAPITAL STRUCTURE VARIABLES ON BREATH OF OUTREACH (LNAB):
LNAB Model 1 Model 2 Model 3 Model 4
C 3.150
(1.934)** -6.213
(-1.789)*** 2.136
(0.748) -4.509
(-1.462)
DA 0.002***
(3.27) -0.234* (1.72)
-0.236* (-1.72)
0.202* (1.74)
GA 0.001** (1.94)
0.011* (1.70)
0.011* (1.70)
-0.010* (-1.72)
CA 0.118***
(2.76) -0.213 (1.61)
-0.215 (-1.61)
-0.161 (1.39)
DTA 0.362***
(4.17) 0.568** (1.82)
-0.461* (1.76)
0.113** (1.94)
DTE 0.006***
(3.11) 0.012* (1.76)
0.010* (1.74)
0.002* (1.77)
ROA -0.327 (1.46)
-0.361 (-1.48)
-0.428 (-1.39)
FS 0.171* (1.77)
0.177* (1.77)
0.138* (1.71)
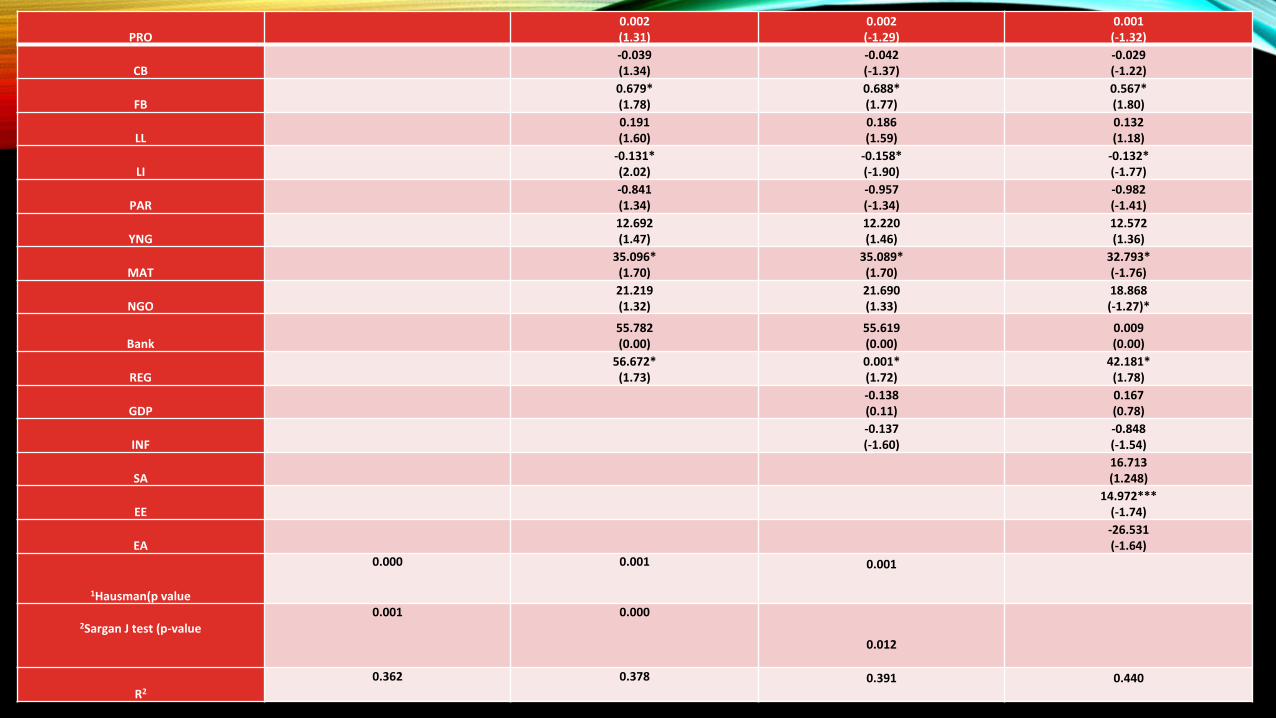
PRO 0.002 (1.31)
0.002 (-1.29)
0.001 (-1.32)
CB -0.039 (1.34)
-0.042 (-1.37)
-0.029 (-1.22)
FB 0.679* (1.78)
0.688* (1.77)
0.567* (1.80)
LL 0.191 (1.60)
0.186 (1.59)
0.132 (1.18)
LI -0.131* (2.02)
-0.158* (-1.90)
-0.132* (-1.77)
PAR -0.841 (1.34)
-0.957 (-1.34)
-0.982 (-1.41)
YNG 12.692 (1.47)
12.220 (1.46)
12.572 (1.36)
MAT 35.096* (1.70)
35.089* (1.70)
32.793* (-1.76)
NGO
21.219 (1.32)
21.690 (1.33)
18.868 (-1.27)*
Bank
55.782 (0.00)
55.619 (0.00)
0.009 (0.00)
REG
56.672* (1.73)
0.001* (1.72)
42.181* (1.78)
GDP
-0.138 (0.11)
0.167 (0.78)
INF
-0.137 (-1.60)
-0.848 (-1.54)
SA
16.713 (1.248)
EE
14.972***
(-1.74)
EA
-26.531 (-1.64)
1Hausman(p value
0.000 0.001 0.001
2Sargan J test (p-value
0.001 0.000
0.012
R2
0.362 0.378 0.391
0.440
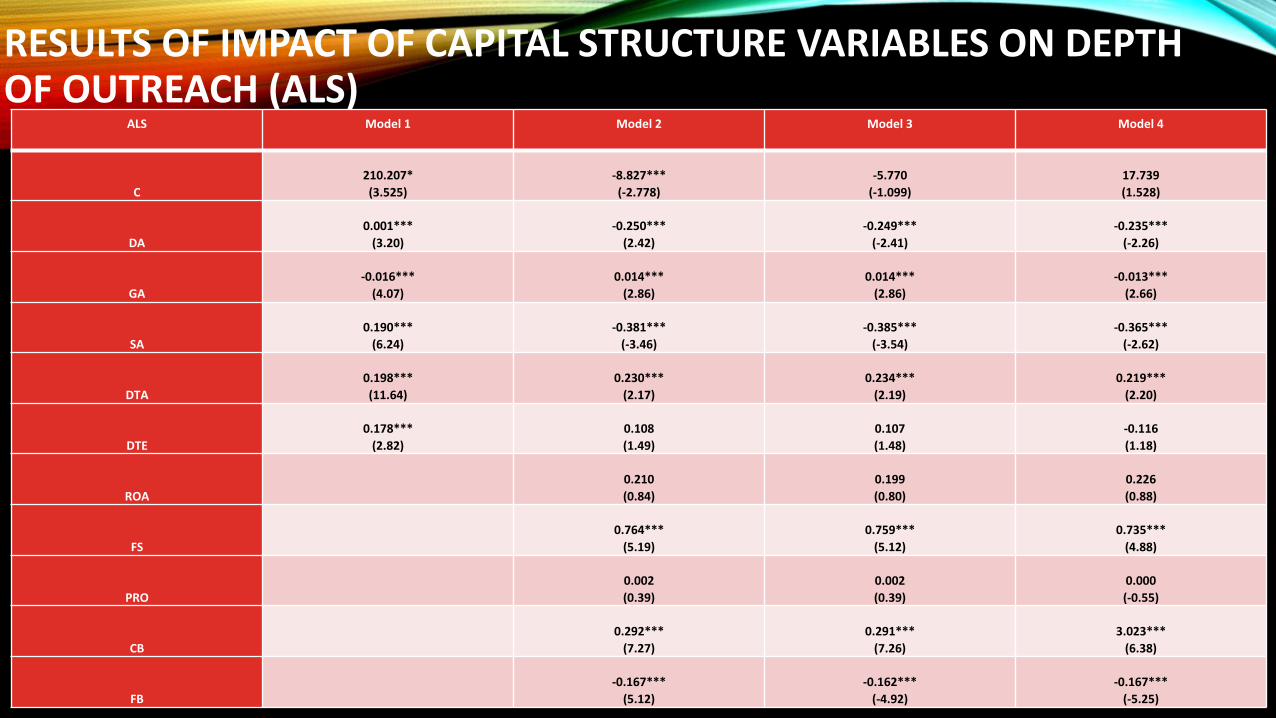
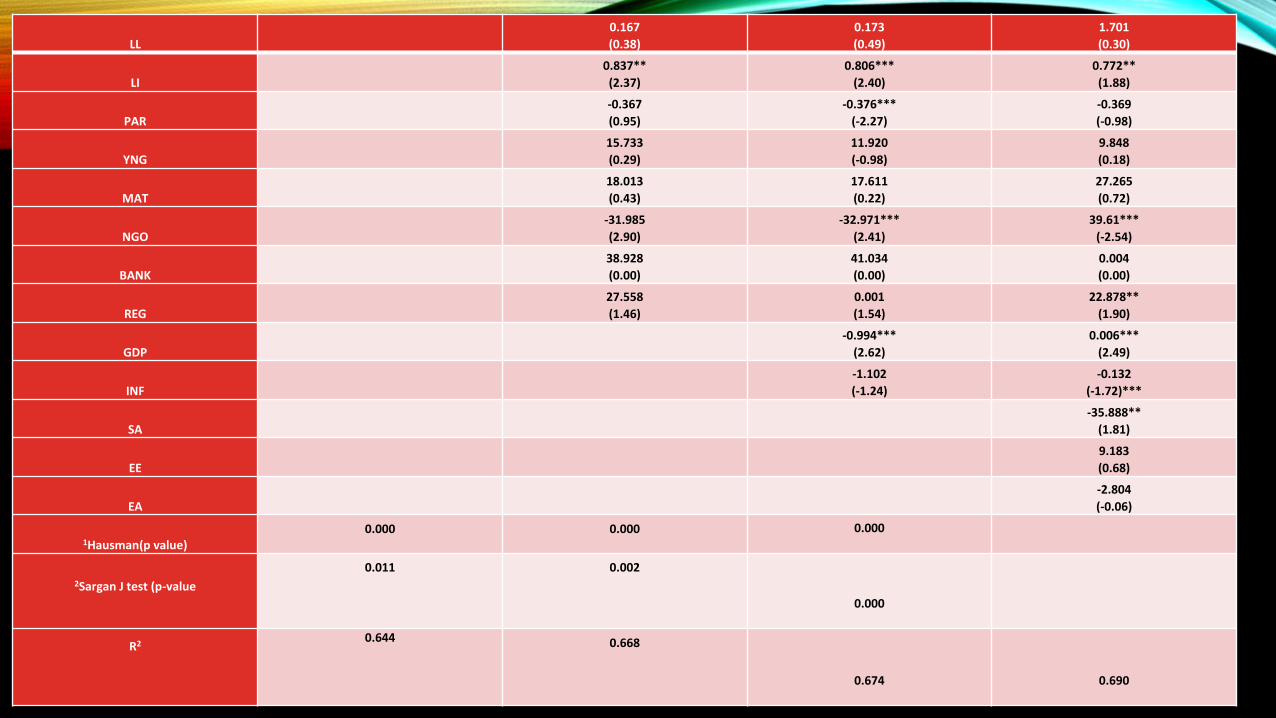
RESULTS OF IMPACT OF CAPITAL STRUCTURE VARIABLES ON DEPTH OF OUTREACH (ALS)
ALS Model 1 Model 2 Model 3 Model 4
C
210.207*
(3.525)
-8.827***
(-2.778)
-5.770
(-1.099)
17.739
(1.528)
DA
0.001***
(3.20)
-0.250***
(2.42)
-0.249***
(-2.41)
-0.235***
(-2.26)
GA
-0.016***
(4.07)
0.014***
(2.86)
0.014***
(2.86)
-0.013***
(2.66)
SA
0.190***
(6.24)
-0.381***
(-3.46)
-0.385***
(-3.54)
-0.365***
(-2.62)
DTA
0.198***
(11.64)
0.230***
(2.17)
0.234***
(2.19)
0.219***
(2.20)
DTE
0.178***
(2.82)
0.108
(1.49)
0.107
(1.48)
-0.116
(1.18)
ROA
0.210
(0.84)
0.199
(0.80)
0.226
(0.88)
FS
0.764***
(5.19)
0.759***
(5.12)
0.735***
(4.88)
PRO
0.002
(0.39)
0.002
(0.39)
0.000
(-0.55)
CB
0.292***
(7.27)
0.291***
(7.26)
3.023***
(6.38)
FB
-0.167***
(5.12)
-0.162***
(-4.92)
-0.167***
(-5.25)
LL
0.167
(0.38)
0.173
(0.49)
1.701
(0.30)
LI
0.837**
(2.37)
0.806***
(2.40)
0.772**
(1.88)
PAR
-0.367
(0.95)
-0.376***
(-2.27)
-0.369
(-0.98)
YNG
15.733
(0.29)
11.920
(-0.98)
9.848
(0.18)
MAT
18.013
(0.43)
17.611
(0.22)
27.265
(0.72)
NGO -31.985
(2.90)
-32.971***
(2.41)
39.61***
(-2.54)
BANK 38.928
(0.00)
41.034
(0.00)
0.004
(0.00)
REG 27.558
(1.46)
0.001
(1.54)
22.878**
(1.90)
GDP -0.994***
(2.62)
0.006***
(2.49)
INF -1.102
(-1.24)
-0.132
(-1.72)***
SA
-35.888**
(1.81)
EE
9.183
(0.68)
EA
-2.804
(-0.06)
1Hausman(p value) 0.000 0.000 0.000
2Sargan J test (p-value
0.011 0.002
0.000
R2
0.644 0.668
0.674
0.690
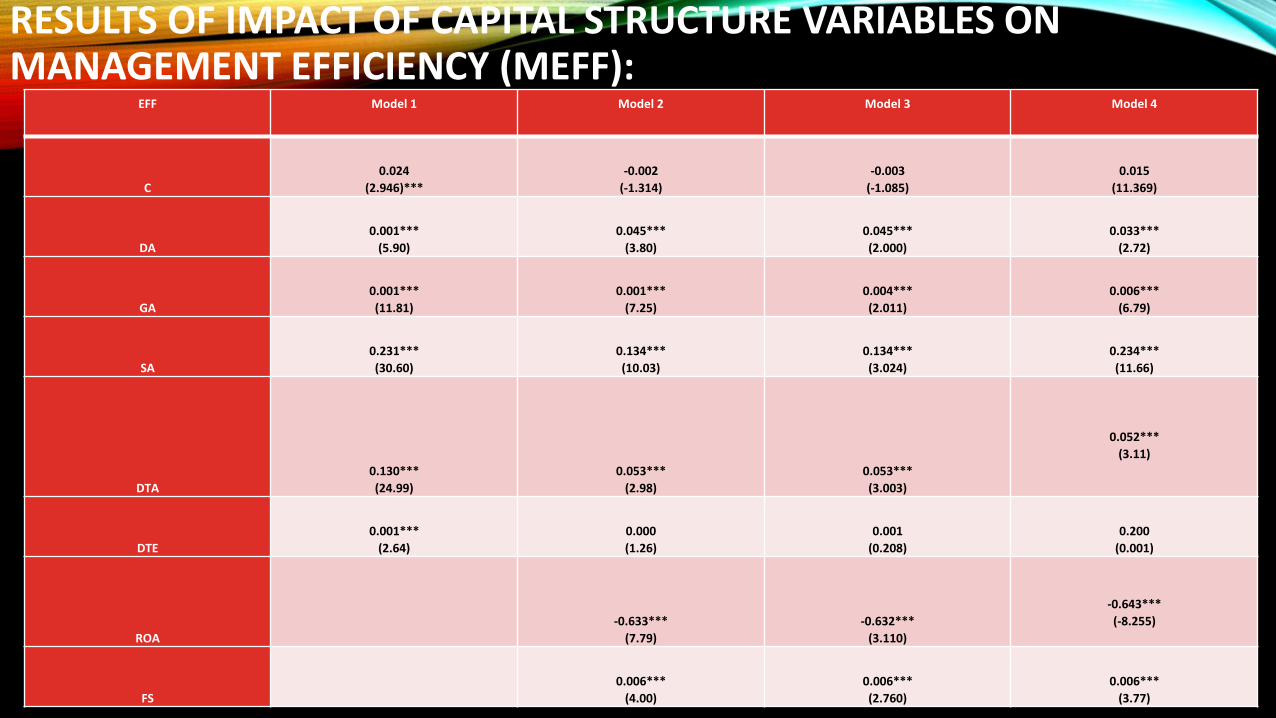
RESULTS OF IMPACT OF CAPITAL STRUCTURE VARIABLES ON MANAGEMENT EFFICIENCY (MEFF): EFF Model 1 Model 2 Model 3 Model 4
C
0.024
(2.946)***
-0.002
(-1.314)
-0.003
(-1.085)
0.015
(11.369)
DA
0.001***
(5.90)
0.045***
(3.80)
0.045***
(2.000)
0.033***
(2.72)
GA
0.001***
(11.81)
0.001***
(7.25)
0.004***
(2.011)
0.006***
(6.79)
SA
0.231***
(30.60)
0.134***
(10.03)
0.134***
(3.024)
0.234***
(11.66)
DTA
0.130***
(24.99)
0.053***
(2.98)
0.053***
(3.003)
0.052***
(3.11)
DTE
0.001***
(2.64)
0.000
(1.26)
0.001
(0.208)
0.200
(0.001)
ROA
-0.633***
(7.79)
-0.632***
(3.110)
-0.643***
(-8.255)
FS
0.006***
(4.00)
0.006***
(2.760)
0.006***
(3.77)
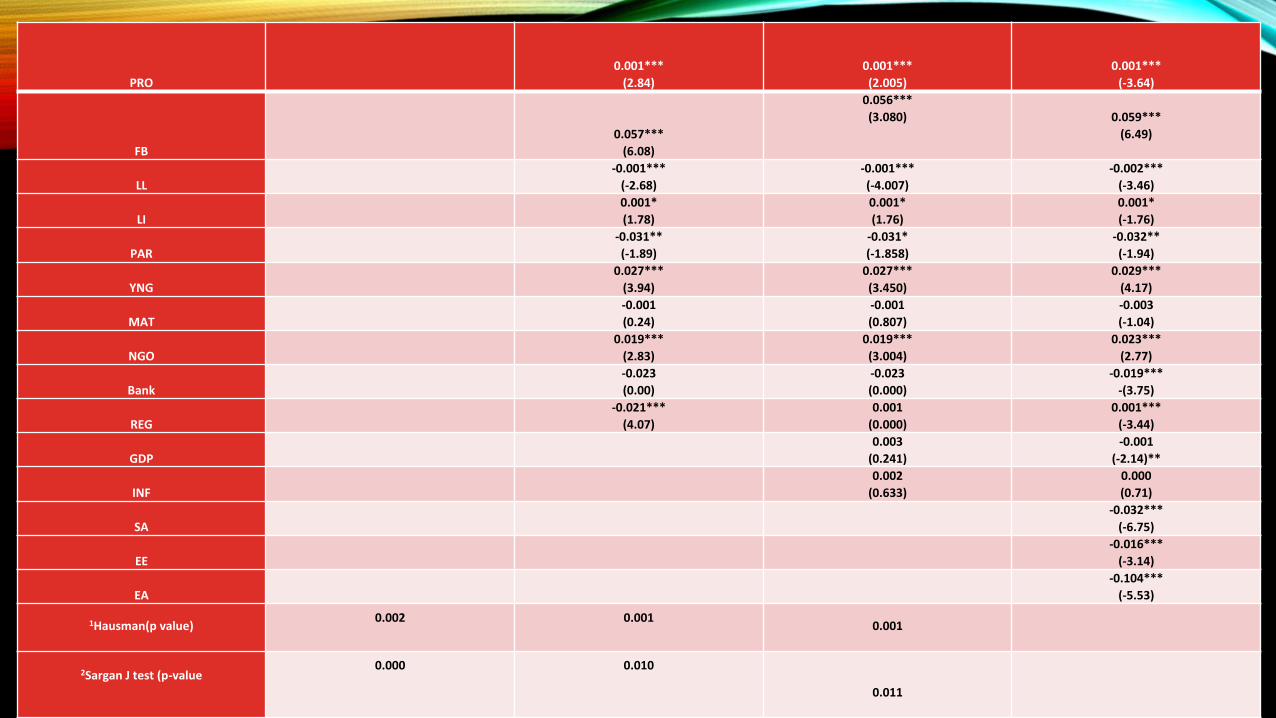
PRO
0.001***
(2.84)
0.001***
(2.005)
0.001***
(-3.64)
FB
0.057***
(6.08)
0.056***
(3.080)
0.059***
(6.49)
LL
-0.001***
(-2.68)
-0.001***
(-4.007)
-0.002***
(-3.46)
LI
0.001*
(1.78)
0.001*
(1.76)
0.001*
(-1.76)
PAR
-0.031**
(-1.89)
-0.031*
(-1.858)
-0.032**
(-1.94)
YNG
0.027***
(3.94)
0.027***
(3.450)
0.029***
(4.17)
MAT
-0.001
(0.24)
-0.001
(0.807)
-0.003
(-1.04)
NGO
0.019***
(2.83)
0.019***
(3.004)
0.023***
(2.77)
Bank -0.023
(0.00)
-0.023
(0.000)
-0.019***
-(3.75)
REG -0.021***
(4.07)
0.001
(0.000)
0.001***
(-3.44)
GDP 0.003
(0.241)
-0.001
(-2.14)**
INF 0.002
(0.633)
0.000
(0.71)
SA
-0.032***
(-6.75)
EE
-0.016***
(-3.14)
EA
-0.104***
(-5.53)
1Hausman(p value)
0.002 0.001 0.001
2Sargan J test (p-value
0.000 0.010
0.011
R2
0.762 0.779 0.781
0.788

CONCLUSION The estimated results of the study highlighted significant effect of different
financing sources on performance of MFIs considering the capital structure theories.
High leverage makes MFIs less efficient and unproductive in case of sustainability while opposite in case of outreach and efficiency.
NGOs, regulated and mature MFIs significantly contribute efficiently in performance of MFIs.
There is trade-off between breadth of outreach and the depth of outreach and this trade-off it may be due to financing limitations
Funding increases inefficiency of MFIs, Capital structure theories also explains that large borrowings lead to less efficient MFIs.

IMPLICATIONS
There is need to utilize commercial sources of financing properly to generate more cash and financial revenue.
The portfolio at risk and the related loan loss provision for the bank type MFIs has to be carefully observed by their particular executives.
MFIs should go for immense scaling up policies as female borrowers has a clear impact on profitability and sustainability of MFIs.
The MFIs increase average loan size in order to reduce cost per borrower in the proportion to the amount they advance.
These results leads to implication that MFIs should properly use the financial funds like debt and share capital to attain sustainability and profitability.