Impact Evaluation of Burkina Faso's BRIGHT Program · Impact Evaluation of Burkina Faso's BRIGHT...
106
Impact Evaluation of Burkina Faso's BRIGHT Program Final Report June 12, 2009 Dan Levy Matt Sloan Leigh Linden Harounan Kazianga
Transcript of Impact Evaluation of Burkina Faso's BRIGHT Program · Impact Evaluation of Burkina Faso's BRIGHT...

Impact Evaluation of Burkina Faso's
BRIGHT Program
Final Report
June 12, 2009
Dan Levy
Matt Sloan
Leigh Linden
Harounan Kazianga

Impact Evaluation of Burkina Faso's
BRIGHT Program
Final Report
June 12, 2009
Dan Levy
Matt Sloan
Leigh Linden
Harounan Kazianga
Contract Number:
MCC-05-0192-CFO TO01
MPR Reference Number:
6275-003
Submitted to:
Millennium Challenge Corporation
875 Fifteenth Street, NW
Washington, DC 20005-2221
Project Officer: Sophia van der Bijl
Submitted by:
Mathematica Policy Research, Inc.
600 Maryland Avenue, S.W., Suite 550
Washington, DC 20024-2512
Telephone: (202) 484-9220
Facsimile: (202) 863-1763
Project Director: Dan Levy

CONTENTS
Chapter Page
EVALUATION OF THE BRIGHT PROGRAM: EXECUTIVE SUMMARY .......................... IX
A. Overview of the Evaluation........................................................................... x
1. Evaluation Design ................................................................................. x 2. Data Collection ................................................................................... xi
B. Implementation .......................................................................................... xi
C. Impacts ......................................................................................................xii
D. Policy Implications ..................................................................................... xiii
I INTRODUCTION ................................................................................................. 1
A. Context of Primary Schooling in Burkina Faso .............................................. 1
B. The BRIGHT Program ................................................................................... 4
C. Overview of Evaluation Design ..................................................................... 6
1. Method to Estimate Impacts ................................................................. 6 2. Data Collection Strategy ....................................................................... 7 3. Description of the Sample .................................................................... 7
II DATA COLLECTION .......................................................................................... 10
A. Sample Design .......................................................................................... 10
B. Questionnaire Design ................................................................................ 10
C. Data Collection .......................................................................................... 13
D. Data Editing .............................................................................................. 14
E. Response Rates ......................................................................................... 14
III IMPACT EVALUATION DESIGN ........................................................................... 15
A. Evaluation Questions ................................................................................. 15
B. Process Used to Select Beneficiary Villages ................................................. 15
C. Evaluation Design Selected ........................................................................ 16
D. Assessing the Evaluation Design ................................................................ 19

iv
CONTENTS (continued)
Chapter Page
IV IMPACTS OF BRIGHT......................................................................................... 20
A. Presence of a School in the Village ............................................................. 20
B. Interpretation of Impact Estimates ............................................................. 21
C. Impacts on School Enrollment ..................................................................... 22
D. Impacts on Test Scores .............................................................................. 26
E. Impacts by Gender and Age ......................................................................... 29
F. Other Impact-related Questions ................................................................. 30
1. Which of the interventions’ components were most responsible for
the observed impacts? ........................................................................ 30 2. Did parental attitudes toward education change as a result of
BRIGHT? ............................................................................................. 31 3. Would the same impacts have been observed had the program built
schools of lower quality infrastructure (like the ones typically
available in Burkina Faso)? .................................................................. 32
V CONCLUSIONS ................................................................................................. 33
REFERENCES..................................................................................................... 34
APPENDICES
1 COPY OF APPLICATION FORM
2 RULES TO CALCULATE ELIGIBILITY SCORE
3 LIST OF COMMUNITIES WITH ELIGIBILITY SCORES
4 SCHOOL AND HOUSEHOLD QUESTIONNAIRES
5 REQUEST FOR PROPOSAL FOR DATA COLLECTION
6 TRAINING MANUAL USED FOR DATA COLLECTION
7 STATISTICAL ANALYSES TO VERIFY APPROPRIATENESS OF REGRESSION
DISCONTINUITY DESIGN
8 STATISTICAL ANALYSES TO VERIFY ROBUSTNESS OF IMPACT ESTIMATES
9 ACCESS VS QUALITY
v
TABLES
Table Page
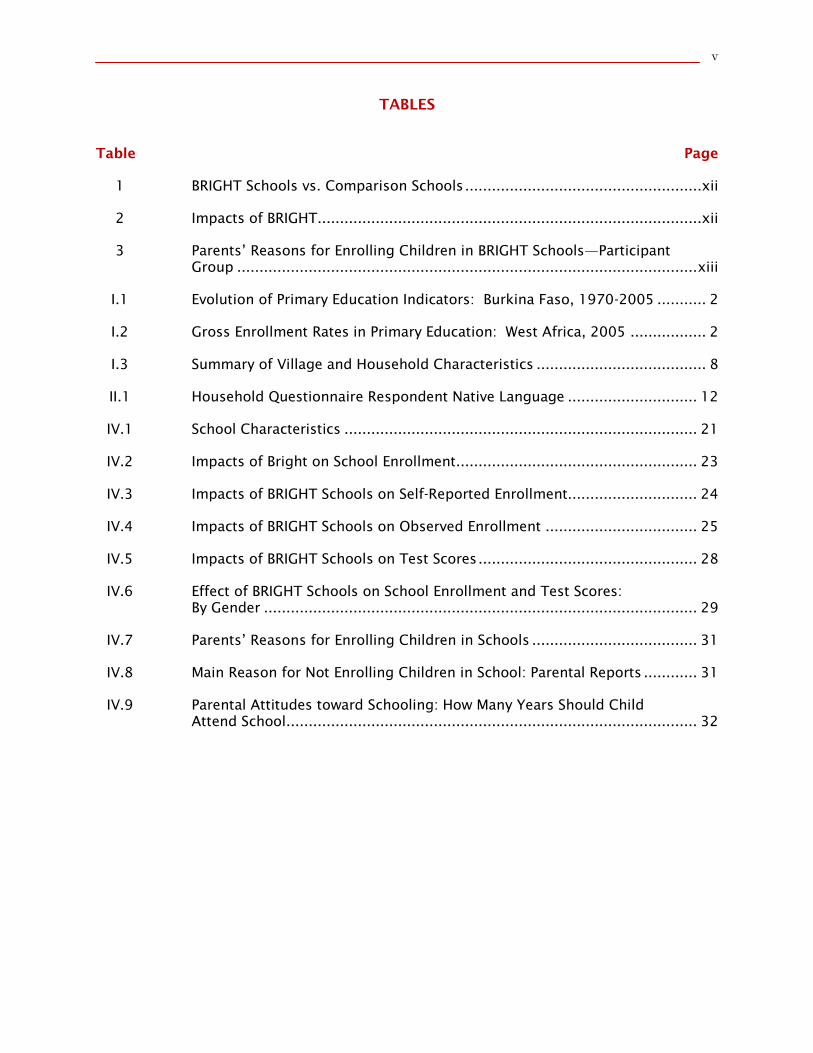
1 BRIGHT Schools vs. Comparison Schools .....................................................xii
2 Impacts of BRIGHT......................................................................................xii
3 Parents’ Reasons for Enrolling Children in BRIGHT Schools—Participant
Group ....................................................................................................... xiii
I.1 Evolution of Primary Education Indicators: Burkina Faso, 1970-2005 ........... 2
I.2 Gross Enrollment Rates in Primary Education: West Africa, 2005 ................. 2
I.3 Summary of Village and Household Characteristics ...................................... 8
II.1 Household Questionnaire Respondent Native Language ............................. 12
IV.1 School Characteristics ............................................................................... 21
IV.2 Impacts of Bright on School Enrollment...................................................... 23
IV.3 Impacts of BRIGHT Schools on Self-Reported Enrollment............................. 24
IV.4 Impacts of BRIGHT Schools on Observed Enrollment .................................. 25
IV.5 Impacts of BRIGHT Schools on Test Scores ................................................. 28
IV.6 Effect of BRIGHT Schools on School Enrollment and Test Scores:
By Gender ................................................................................................. 29
IV.7 Parents’ Reasons for Enrolling Children in Schools ..................................... 31
IV.8 Main Reason for Not Enrolling Children in School: Parental Reports ............ 31
IV.9 Parental Attitudes toward Schooling: How Many Years Should Child
Attend School ............................................................................................ 32

vi
FIGURES
Figure Page
I.1 Average Number of Schools: BRIGHT and non-BRIGHT Provinces ................... 3
I.2 Implementation of the BRIGHT Program ....................................................... 4
III.1 Hypothetical Illustration of Impact Estimation Using the Regression
Discontinuity Design ................................................................................. 17
III.2 Presence of a Bright School as a Function of Relative Score ........................ 19
IV.1 Presence of Any School as a Function of Relative Score .............................. 20
IV.2 Impacts of BRIGHT on Self-reported Enrollment .......................................... 22
IV.3 Impacts of BRIGHT on Observed Enrollment ............................................... 23
IV.4 Impact of BRIGHT on Math Test Scores ...................................................... 26
IV.5 Impact of BRIGHT on French Test Scores .................................................... 27
IV.6 Treatment Effects by Age of Child .............................................................. 30

vii
ACRONYMS AND DEFINITIONS
Bisongo: Child Care Center
BRIGHT: Burkinabe Response to Improve Girl’s Chances to Succeed
CERFODES: Centre d’Etudes, de Recherches et de Formation pour le
Développement Economique et Social
CRS: Catholic Relief Services
FAWE: Forum for Africa Women Educationalists
MCC: Millennium Challenge Corporation
MEBA: Ministère de l'Enseignement de Base et de l'Alphabétisation du
Burkina Faso (Ministry of Basic Education)
PDDEB: Plan Décennal de Développement de l’Education de Base
RD: Regression Discontinuity
TCP: Threshold Country Program
UNICEF: The United Nations Children's Fund
USAID: United States Agency for International Development

ACKNOWLEDGMENTS
This report would not have been possible without the cooperation of several officials. We are particularly grateful to Sophia van der Bijl at the Millennium Challenge Corporation (MCC) for her commitment and guidance throughout the evaluation. We also thank Malik Chaka and Sophia Sahaf at MCC for their help throughout the project, and Franck Wiebe for his insightful comments on the draft reports and presentations.
We are also grateful to the many people in Burkina Faso who were instrumental in making this evaluation feasible. We are particularly grateful to Michel Kabore (USAID) for his invaluable help in organizing many meetings and field trips with key decisionmakers and for his strong commitment to the evaluation. We are thankful to Ministry of Education officials who allowed us to interview them and gave us access to the application data, a key source of data in our study. We also thank staff members at the four implementing agencies (Plan International, CRS, TinTua and FAWE) for the information they provided to us, in particular to Fritz Foster (Plan International) and Makasa Kabongo (Chief of Party, BRIGHT Project), and Debra Shomberg (CRS Country Director).
We would like to thank USAID staff in both Washington DC and Accra (including Felix Awantang, Peter Delp, and Taisha Jones). We would also like to thank participants from MCC and USAID in several presentations we conducted in December of 2008 at MCC where we discussed a preliminary version of these results.
This evaluation would not have been possible without the work and commitment of the many people who collected data in the evaluation. Collecting school and household data in almost 300 rural villages in Burkina Faso was an important and challenging task in this evaluation. We are particularly grateful to Jean Pierre Sawadogo, Robert Ouedraogo, and Pam Zahonogo at the University of Ouagadougou for their commitment, hard work, advice, and leadership in the data collection process.
Several colleagues at Mathematica have contributed to this report. Peter Schochet provided insightful technical quality assurance throughout the evaluation and played an instrumental role on our first trip to Burkina Faso. Anu Rangarajan provided helpful suggestions at various points in the evaluation. Joel Smith and Ama Takyi provided helpful research assistance throughout the project. Jesse Antilla-Hughes provided exceptional research assistant in the final stages of the project.
The views expressed are those of the authors and do not reflect the official policy or position of the Millennium Challenge Corporation, USAID or the implementing agencies.

ix
EVALUATION OF THE BRIGHT PROGRAM: EXECUTIVE SUMMARY
The BRIGHT program was designed to improve the educational outcomes of children in Burkina Faso.1 It focused on girls in particular and was implemented in 132 rural villages throughout the 10 provinces of the country in which girls’ enrollment rates were lowest. It consisted of constructing primary schools with three classrooms and implementing a set of complementary interventions. These included inputs such as separate latrines for boys and girls; canteens; take-home rations and textbooks; and ―soft‖ components, such as a mobilization campaign, literacy training, and capacity building among local partners (see Box 1 for details). The program was implemented during 2005 to 2008.
BOX 1
COMPONENTS OF THE BRIGHT PROGRAM
The BRIGHT program consisted of the construction of 132 primary schools and developing a set of
complementary interventions designed to increase girls’ enrollment rates. The schools were based on a
prototype that included three classrooms, housing for three teachers, and separate latrines for boys
and girls. In addition, schools were deliberately located near a water source, and a water pump was
installed close by. The complementary interventions included the following:
School canteens (daily meals for all). Daily meals were offered to all boys and girls.
Take-home rations. Girls who had a 90 percent attendance rate received 8 kilograms of dry
cereal each month to take home.
School kits and textbooks. Textbooks and school supplies were to be provided to all
students. This was not fully realized until 2008.
Mobilization campaign. The purpose of the mobilization campaign was to bring together
communities and those with a stake in the education system to discuss the issues involved in,
and barriers to, girls’ education. The campaign included informational meetings; door-to-door
canvassing; providing gender-sensitivity training to ministry officials, pedagogical inspectors,
teachers, and community members; instituting girls’ education day; radio broadcasts; posters;
and providing awards for female teachers.
Literacy. The literacy program had two components: adult literacy training and mentoring for
girls. For each of the two project years, Tin Tua organized adult literacy training and training
for student mothers/female role models.
Local partner capacity building. Training encompassed local officials in the Ministry of
Education, Child Care Center (i.e. bisongo monitors, and teachers. Specific training included
the completion of school attendance sheets.
The $12.9 million grant was financed by the Millennium Challenge Corporation (MCC) through a two-year Threshold Program). It was implemented by a consortium of NGOs—Plan International, Catholic Relief
1 The official name of the BRIGHT program is ―Burkinabe Response to Improve Girl’s Chances to Succeed‖.
2 ―BRIGHT Project Final Evaluation Report‖ (CERFODES 2008) and ―Threshold Country Program Final

x
Services (CRS), Tin Tua, and the Forum for African Women Educationalists (FAWE)—under the supervision of USAID.
This report documents the main findings from the impact evaluation of the BRIGHT program. In general, the main conclusions are that BRIGHT had about a 20 percentage point positive impact on girls’ primary school enrollment, and had positive impacts on Math and French test scores for both girls and boys.
The evaluation was conducted by an independent research contractor, Mathematica Policy Research, Inc. (MPR), and two consultants, Leigh Linden (Columbia University) and Harounan Kazianga (Oklahoma State University). Data for the evaluation were collected by a team of researchers at the University of Ouagadougou, led by Jean Pierre Sawadogo.
A. Overview of the Evaluation
The impact evaluation sought to answer three key questions: (1) What was the impact of the program on school enrollment? (2) What was the impact of the program on test scores? (3) Were the impacts different for girls than for boys? While two other reports have documented that the program was implemented as intended, by and large,2 this evaluation focuses on assessing its impacts.
An impact evaluation estimates program impacts by seeking to compare what happened to the beneficiaries of the program relative to what would have happened to them in the absence of the program. In this particular case, to estimate the program’s impacts, we assessed how children in BRIGHT villages fared relative to how they would have fared had BRIGHT not been implemented. This assessment is important because even in the absence of BRIGHT, it is likely that enrollment would have increased in the 132 villages in which it was implemented. School construction and enrollment both were increasing in the period prior to the implementation of BRIGHT, and the government of Burkina Faso launched a program, Plan Decennal de Developpement de l’Education de Base (PDDEB) for the period 2002-2011 PDDEB’s goals include increased access to schooling and the promotion of girls’ education. Moreover, during 2007–2008, the total number of children enrolled in school rose in the 10 provinces in which BRIGHT was implemented—in the 132 BRIGHT villages and the remaining villages as well.
Hence, our ability to assess the program’s success turns on the issue of whether, and the extent to which, we can ascertain what part of the improvement in educational outcomes in the 132 BRIGHT villages was due to the program itself and what part would have happened even if the program had not been implemented.
1. Evaluation Design
The evaluation design involved comparing children in the 132 BRIGHT villages (participant group) with children in 161 similar villages that had applied to participate in BRIGHT but were not chosen (comparison group). The statistical technique used to estimate program impacts is called regression discontinuity, which takes advantage of the fact that all 293 villages that applied to the program were given an eligibility score by the Burkina Faso Ministry of Education based on their potential to improve girls’ educational outcomes.
Short-term impacts of BRIGHT were assessed about two years after the program began its implementation. From the standpoint of the evaluation, the program began in October 2005 with the construction of provisional classrooms in a subset of the villages that were selected to receive the BRIGHT program. Construction of BRIGHT schools and some of the complementary interventions began around
2 ―BRIGHT Project Final Evaluation Report‖ (CERFODES 2008) and ―Threshold Country Program Final
Report‖ (USAID 2009).
xi
October of 2006. Most schools were constructed by April 2007. Outcome data were collected from January through April 2008.
2. Data Collection
Evaluation data on the participant and comparison groups were collected by a team from the University of Ouagadougou, with oversight from MPR, from the following sources:
A household survey administered about a year after the program was implemented. The survey included questions on households’ demographics, children’s educational outcomes (such as enrollment and attendance), and parents’ perceptions of education. The target sample for the survey was a random sample of 30 households with school-age children in each of the 293 villages that applied to the BRIGHT program. The response rate was about 97 percent.
Tests on math and French administered to all children ages 5 to 12 who lived in those households interviewed in the household survey, regardless of whether they were enrolled in school. These tests were administered immediately after the household survey. A total of 21,730 children took the tests.
A school survey administered in two waves. In the first wave, information on the schools’ characteristics was collected from school officials. In the second wave, attendance and enrollment data were collected for children who were enrolled in school, based on parents’ reports from the household survey. The target sample for the survey was the three closest primary schools within 10 kilometers of the villages that applied to the BRIGHT program that children from that village attended regularly. This yielded 360 schools.
Application data from the form collected in early 2005 by Ministry of Education officials from representatives of each of the 293 villages. This information was used to compute the eligibility score, which in turn determined which villages were eligible to participate in the BRIGHT program.
B. Implementation
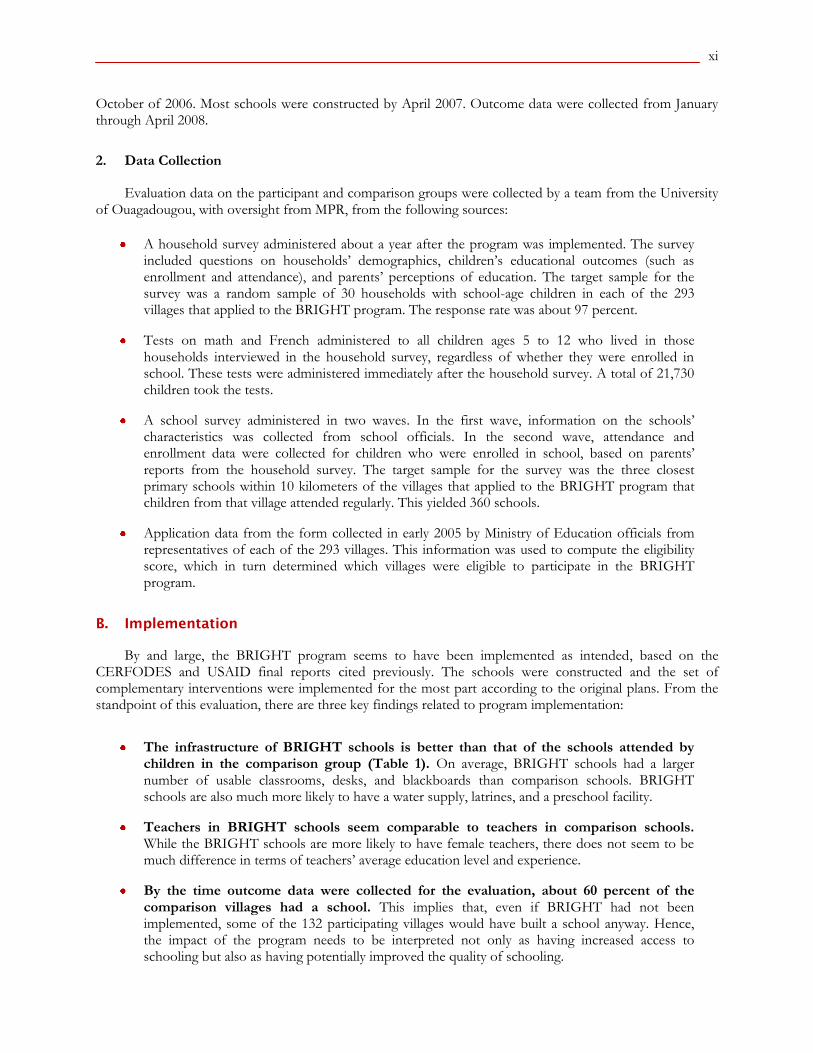
By and large, the BRIGHT program seems to have been implemented as intended, based on the CERFODES and USAID final reports cited previously. The schools were constructed and the set of complementary interventions were implemented for the most part according to the original plans. From the standpoint of this evaluation, there are three key findings related to program implementation:
The infrastructure of BRIGHT schools is better than that of the schools attended by children in the comparison group (Table 1). On average, BRIGHT schools had a larger number of usable classrooms, desks, and blackboards than comparison schools. BRIGHT schools are also much more likely to have a water supply, latrines, and a preschool facility.
Teachers in BRIGHT schools seem comparable to teachers in comparison schools. While the BRIGHT schools are more likely to have female teachers, there does not seem to be much difference in terms of teachers’ average education level and experience.
By the time outcome data were collected for the evaluation, about 60 percent of the comparison villages had a school. This implies that, even if BRIGHT had not been implemented, some of the 132 participating villages would have built a school anyway. Hence, the impact of the program needs to be interpreted not only as having increased access to schooling but also as having potentially improved the quality of schooling.

xii
Table 1. BRIGHT Schools vs. Comparison Schools
BRIGHT Schools Comparison Schools
Infrastructure
Number of:
Classrooms 3.10 2.87
Usable classrooms 2.98 2.71**
Legible blackboards 2.91 2.53**
Percent with:
Enough Desks 87 44***
Water supply 86 40***
Latrines 97 54***
Separate latrines 89 36***
Preschool facility 9 2***
Teachers (in numbers)
Total 2.54 2.77
Female 1.10 0.61***
With secondary education 0.10 0.12
With 0 to 5 years of experience 1.94 1.81
Sample Size (Schools) 132 228
*/**/***Difference statistically significant at the 10%/5%/1% significance level.
Source: School surveys (MPR 2007 and 2008).
C. Impacts
BRIGHT had a positive impact on school enrollment. The impact of BRIGHT on enrollment was an improvement of about 20 percent, based on household survey data. The impact on whether a child was present on the day we visited the school, however, was about 16 percentage points (Table 2). These effects are larger than those of other educational interventions in developing countries, particularly given that 60 percent of the comparison group villages had a school by the time the outcome data were collected. The effects imply that BRIGHT was responsible for increasing enrollment rates from about 35 percent to 55 percent (household-reported outcome) or from about 31 percent to 47 percent (school-based outcome).
Table 2. Impacts of BRIGHT
Outcomes Estimated Impact
Enrollment (percentage points)
Enrolled in schoola
20***
Present in school on day of visitb
16***
Test Scores (standard deviations)
Math 0.40***
French 0.37***
Sample Size (Children) 17,984
a
Based on household survey. b
Based on our visit to the classroom on the day of the school survey.
*/**/*** Statistically significant at the 10%/5%/1% significance level.
Source: Household survey (MPR 2008), school surveys (MPR 2007 and MPR 2008), and application data
(Burkina Faso Ministry of Education 2005-2006).

xiii
BRIGHT had positive impacts on math and French test scores. The impacts on both outcomes were approximately 0.4 standard deviations (Table 2). This increase in test scores is larger than many other successful education interventions in the developing world, which have effect sizes typically between 0.1 and 0.3 standard deviations (although as noted below, BRIGHT is a more costly intervention, since it involves building schools). In this context, an impact of this size implies that, for a student who started at the 50th percentile of our sample, attending a BRIGHT school is predicted to increase his or her test score to approximately the 80th percentile.
The impacts of BRIGHT were positive for both boys and girls. In terms of enrollment, the impacts for girls were about 5 percentage points higher than the impacts for boys. In terms of test scores, the impacts for girls and boys were statistically indistinguishable.
We were unable to estimate separately the impact of each of the intervention’s components (schools, dry rations, textbooks, etc.). To do this, some of the BRIGHT schools would have had to implement some components but not others. While this was theoretically possible, it was not logistically feasible to implement the program in this way, given the project’s timeline.
Descriptive evidence based on the parents’ responses to the household survey suggests that the presence of a school near a household seems to be a crucial feature of the program. According to our estimates, schoolchildren in BRIGHT villages do not travel as far or as long from home to school as those in the comparison village (1 km vs. 1.5 km; 18 vs. 24 minutes of travel time). Moreover, the household survey also indicated that, for 72 percent of the children in BRIGHT villages, the distance from home to school is one of the two most important reasons to enroll in school (Table 3). Similarly, the most common reason reported by parents in the comparison villages for not sending their child to school was that there was no school in the village or that the nearest school was too far away (about a third of parents reported one of these two reasons). Parents also reported that the availability of textbooks and canteens were important reasons for enrolling their children in school. Dry rations and separate latrines were seen as much less important.
Table 3. Parents’ Reasons for Enrolling Children in BRIGHT Schools—Participant Group
Reason Most Important (%)
Among Two
Most Important (%)
Distance 54 72
Textbooks 12 43
Canteens 6 33
Dry rations 1 3
Separate latrines 0 0
Other 26 38
Sample Size 3,940 3,940
Source: Household survey (MPR 2008).
D. Policy Implications
The evaluation revealed that BRIGHT increased both enrollment and test scores of children in Burkina Faso. The estimated impacts are larger than those of other recently evaluated education interventions in developing countries. As such, the program may serve as a model for policymakers interested in improving these outcomes in similar contexts.
To assess whether a program like BRIGHT should be implemented in other contexts, we need to consider the alternative policy interventions available in these contexts. In thinking about comparing

xiv
BRIGHT with other recently evaluated education interventions in the developing world, it is important to remember that many of those were launched in areas in which schools already existed. Examples include providing textbooks to schools in Kenya and hiring extra teacher aides in India. Most BRIGHT villages, however, had no school before the program was implemented. Therefore, these other interventions may not be feasible policy instruments with which to increase the educational outcomes of children in contexts similar to that of BRIGHT’s.
Although the magnitude of BRIGHT’s estimated impacts is larger than that observed in typical education interventions in developing countries, a cost-effectiveness analysis would be needed to assess whether the effects are large on a per-dollar basis. In particular, it would be useful to know whether building a less expensive school of the sort typically built in Burkina Faso would have generated similar impacts. While this evaluation cannot answer this question definitively, we found suggestive evidence indicating that part of the impact of BRIGHT came from having built a school in villages in which no school would have been available, and part from having built a school with a better infrastructure and add-on components than the typical school that would have been available without BRIGHT.
In the end, the question that remains is: will the observed effects persist over time? Policymakers in Burkina Faso consistently voiced concern about whether children in BRIGHT villages would continue to go to school after the third year (there are only three classrooms). A new project now underway—BRIGHT II—is providing three additional classrooms in the same 132 villages. This initiative may provide a good opportunity to assess the long-term effects of this type of intervention.

1
I. INTRODUCTION
The Millennium Challenge Corporation (MCC) funded a two-year Threshold Country Program (TCP) to increase girls’ educational attainment in Burkina Faso via the construction of schools and complementary interventions. The program, locally known as BRIGHT,3 was implemented in 132 rural villages located in the 10 provinces in Burkina Faso with the lowest girls’ enrollment rates. USAID was responsible for overseeing implementation of the program, and engaged international and local nongovernmental organizations (NGOs) to implement it.
Mathematica Policy Research, Inc. (MPR) was contracted to conduct a rigorous impact evaluation of the program. The evaluation assessed whether, and the extent to which, the program affected the school enrollment and performance of children in the 132 villages where BRIGHT was implemented.
We present the findings from the impact evaluation in this report. In this introductory chapter, we describe the context of education in Burkina Faso (Section A), the implementation of the BRIGHT program (Section B), and an overview of the evaluation design (Section C).
A. Context of Primary Schooling in Burkina Faso
In this section, we briefly describe some basic information about primary education in Burkina Faso and the context of primary schooling prior to BRIGHT. The evidence presented here suggests that, even if BRIGHT had not been implemented, access to primary schooling would have continued to improve in Burkina Faso. Hence, a key challenge for the impact evaluation was to assess the extent to which any improvement in education outcomes observed in participating villages were due to BRIGHT and which would have occurred even in its absence.
Households in Burkina Faso can enroll their children in primary school free of charge, although in practice they often are asked to support some school-related direct expenditures in addition to the opportunity costs of their children’s time. Officially, children are supposed to attend primary school between the ages of 6 and 12, although late entries and grade repetitions suggest that many children complete primary school after they turn 12. Students attend primary school for six years, and a national exam at the end of the sixth year determines advancement to the secondary level. By law, schooling is compulsory until age 16. Due to various factors, including an inadequate number of schools, this law has not been enforced, especially in the rural areas.
Primary school enrollment rates in Burkina Faso remain some the lowest in the world, despite sustained efforts by the government. Some remarkable progress has been made, however. Gross enrollment grew from 12 percent in 1970 to 56 percent in 2005 (Table I.1). During the same period, the primary school completion rate grew from 7 percent to 30 percent. Nevertheless, Burkina Faso’s primary school enrollment rate is one of the lowest in the West Africa region (Table I.2). These national figures also do not show the enormous large disparities that exist between rural and urban areas.
3 BRIGHT’s official name is ―Burkinabe Response to Improve Girl’s Chances to Succeed.‖

2
Table I.1. Evolution of Primary Education Indicators: Burkina Faso, 1970-2005
Gross Enrollment Rate (%) Completion of Primary Education (%)
Primary
Gross Intake Ratio to the
Last Grade of Primary
Academic Year All Males Females All Males Females
2005 56 62 50 30 34 26
2000 44 51 36 25 29 21
1995 39 47 31 19 22 15
1990 32 39 25 19 24 14
1985 24 30 18 13 16 9
1980 17 21 12 9 12 7
1975 14 17 10 8 10 6
1970 12 15 9 7
10
5
Source: UNESCO Institute for Statistics 2009.
Table I.2. Gross Enrollment Rates in Primary Education: West Africa, 2005
Country Enrollment Rate (%)
Togo 99
Benin 96
Ghana 87
Mali 77
Cote d'Ivoire 71
Burkina Faso 56
Niger 50
Source: UNESCO Institute for Statistics 2009.
School construction was widespread in Burkina Faso prior to the implementation of BRIGHT. Moreover, the average number of schools in BRIGHT provinces more than doubled in the 1998–2004 period, and the gap between BRIGHT and non-BRIGHT provinces in the average number of schools narrowed during this period (Figure I.1)

3
Figure I.1. Average Number of Schools: BRIGHT and non-BRIGHT Provinces
Source: Burkina Faso Ministry of Basic Education (MEBA) and UNESCO.
Prior to BRIGHT, the government of Burkina Faso began several initiatives aimed at improving access to schooling and promoting girls’ education. One is a 10-year plan (2002–2011) for the development of basic education. This program is commonly known by its French acronym PDDEB (Plan Decennal de Developpement de l’Education de Base).
PDDEB structured its activities around increasing access to education, improving education quality, and capacity building. Its activities to increase access included the construction and restoration of schools, and several initiatives to promote girls’ education. PDDEB covers the 20 provinces (usually referred to as ―provinces prioritaires‖) with the lowest educational achievement in Burkina Faso. The costs for the first phase are estimated at 252.2 million Euros (French Development Agency). The program is funded by both multilateral and bilateral donors so as to coordinate their actions in the education sector. A permanent secretariat under the Ministry of Basic Education (MEBA) runs the programs. PDDEB is relevant to the evaluation of the BRIGHT program, since the 10 provinces where BRIGHT operated are a subset of the 20 provinces that form part of PDDEB.
The trends in enrollment rates (Table I.1) and school construction (Figure I.1), along with the existence of PDDEB, are of particular importance for interpreting the results of this evaluation, since they suggest that even if BRIGHT had not been implemented, schools would have been constructed and enrollment rates increased in the BRIGHT provinces. In fact, it is likely that some villages that applied to BRIGHT but did not receive a BRIGHT school still would have received a school through the PDDEB program. This impact evaluation was designed to take into account (or control for) for these improvements in the general environment for education in Burkina Faso, and so any impacts described in this report reflect the net change in communities compared to what would have happened without the BRIGHT program.

4
B. The BRIGHT Program
The BRIGHT program was implemented in 49 departments in the 10 provinces that have the lowest girls’ primary completion rates in the country (Banwa, Gnagana, Komandjari, Namentenga, Oudalan, Sanmentenga, Seno, Soum, Tapoa, and Yagha; see Figure I.2). Within these provinces, 132 villages received a variety of BRIGHT interventions for promoting girls’ education.
Figure I.2. Implementation of the BRIGHT Program
Source: Plan Burkina Faso.
The program consisted of constructing 132 primary schools and implementing a set of complementary interventions designed to increase girls’ enrollment rates. The schools were based on a prototype that included three classrooms, housing for three teachers, and separate latrines for boys and girls. In addition, schools were deliberately located near a water source and a water pump was installed close by. The complementary close interventions included:
School canteens (daily meals for all). Daily meals were offered to all students at the schools, both boys and girls.
Take-home rations. Girls who had a 90 percent attendance rate received 8 kilograms of dry cereal each month to take home.
School kits and textbooks. Textbooks and school supplies were to be provided to all students. This was not fully realized until 2008.
Mobilization campaign. The purpose of the mobilization campaign was to bring together communities and those with a stake in the education system to discuss the issues involved in, and barriers to, girls’ education. The campaign included informational meetings; door-to-door canvassing; providing gender-sensitivity training to ministry officials, pedagogical inspectors,

5
teachers, and community members; sponsoring a girls’ education day; radio broadcasts; posters; and providing awards for female teachers.
Literacy. The literacy program had two components: adult literacy training and mentoring for girls. For each of the two project years, Tin Tua organized adult literacy training and training for student mothers/female role models.
Local partner capacity building. Training included local officials in the Ministry of Education, Bisongo monitors, and teachers. Specific training included completing school registers.
By and large, the BRIGHT program seems to have been implemented as intended. Two reports document the implementation: one was produced by the Centre d’Etudes, de Recherches et de Formation pour le Développement Economique et Social (CERFODES) for Plan International and the other by USAID for the Millennium Challenge Corporation (MCC). Both reports indicate that the schools were constructed and the set of complementary interventions mostly implemented according to the original plan.
As planned, Plan International and Catholic Relief Services (CRS) completed the construction of the 132 school infrastructures in the 10 targeted provinces. Construction ended in October 2007, ahead of schedule, taking 16 months versus the planned two years. (Provisional schools were created during construction.) Each school consisted of three classrooms, two multipurpose halls, one office, and one storage room. Construction also included teachers’ lodgings situated close to the school, with two bedrooms, one living room, one kitchen, and one bathroom (latrine). BRIGHT provided each school with a borehole, equipped with a manual pump easy to use by children. Separate latrine blocks were built for girls and boys to ensure privacy and security. Schools also received equipment, including student desks; teacher desks; chairs; metal bookshelves; and playground equipment, consisting of volleyball sets, soccer balls, and handballs. Bisongos—child care centers which were constructed in 10 of the 132 school complexes—and each of these included a slide and a swing set.
In all BRIGHT schools, daily meals were offered to children (boys and girls) via a canteen. For both the schools and the Bisongos, the monthly ration consisted of 5 kilograms of rice and 0.5 liter of oil per child. In most of the 132 schools, community members constructed canteen kitchens and selected cooks to prepare the daily meals from among the mothers of the students. In addition, girls who achieved a 90-percent rate of school attendance received a monthly ration of 8 kilograms of dry rice to take home.
For the 2006–2007 school year, the project purchased and distributed school kits for first and second grade classes. That year, however, textbooks were not widely available. As a result, only 2,500 second grade textbooks were distributed. In 2007–2008, the government provided all schools, including BRIGHT schools, with kits and textbooks.
Over the life of the project, FAWE implemented a wide range of activities that sought to change sociocultural behaviors presenting obstacles to girls’ school enrollment, retention, and achievement. The purpose of the mobilization campaign was to bring together communities and those with a stake in the education system to discuss the issues involved in, and barriers to, girls’ education. The campaign included informational meetings; door-to-door canvassing; gender-sensitivity training for ministry officials, pedagogical inspectors, teachers, and community members; girls’ education day; radio broadcasts; posters; and awards for female teachers. In the first year (school year 2006–2007), 33 selected communities benefited from the campaign. During the second project year (school year 2007–2008), the same activities were carried out in the remaining 99 communities and new activities were initiated for all 132 communities.
The literacy program has two components: adult literacy training and mentoring for girl students. The rationale behind the literacy training was to provide uneducated mothers with nonformal education (literacy and micro-project management training) to help them prioritize their girls’ education. Mentoring was meant to help girls and their families envision a productive future by providing them with female role models who could set examples of the benefits of education and encourage and support them during their school careers.

6
In the first project year, 254 literacy centers were opened and recruited trainees. Ten centers did not open, or were closed shortly after opening, due to lack of interest.
The program also included capacity building, which encompassed training local officials in the Ministry of Education, Bisongo monitors, and teachers. Specific training included completing school attendance sheets.
C. Overview of Evaluation Design
This impact evaluation sought to answer three key questions:
1. What was the impact of the program on school enrollment?
2. What was the impact of the program on test scores?
3. Were the impacts different for girls?
The two reports, produced by USAID and CERFODES, respectively,4 documented the extent to which the program was implemented as intended. These reports also assessed the extent to which the program’s objectives were met. For example, USAID’s report indicated that girls’ enrollment rates in the 10 provinces where BRIGHT was implemented increased by 13 percentage points, far above the 3 percentage point increase specified as one of the program’s objectives.
Although assessing program implementation and monitoring the evolution of performance indicators provide very helpful information about the program, these activities cannot provide reliable estimates of program impacts. In particular, at least part of the 13 percentage point increase could have occurred even if BRIGHT had not been implemented. As described in Section A, MEBA has been implementing several initiatives aimed at improving girls’ education (including the construction of schools), and primary school enrollment rates in Burkina Faso had been increasing prior to the implementation of BRIGHT.
To estimate the program’s impacts, we assessed how children in BRIGHT villages fared relative to how they would have fared had BRIGHT not been implemented. Since we could not directly observe the latter scenario (known as the counterfactual), we selected a group of children in a set of villages where BRIGHT was not implemented to mimic this counterfactual. This group of children constituted the comparison group. The selection of this comparison group and the application of statistical techniques aimed at ensuring that the group of children in BRIGHT villages (participant group) and the group of children in the comparison group were comparable constituted the basis of the evaluation design.
1. Method to Estimate Impacts
The process by which MEBA selected the 132 villages for BRIGHT implementation played a crucial role in our choice of the evaluation design. MEBA received applications for a BRIGHT school from 293 villages located in 49 departments. Because of the process employed to select villages that would receive the BRIGHT program, MPR selected a regression discontinuity (RD) design to estimate the impact of the package of interventions, using the 293 communities (―study‖ villages) that applied for BRIGHT schools. The application form collected information such as the number of 7- to 12-year-old girls in the village, the number of such girls enrolled in school in the village, the distance to the nearest school, the number of students in the nearest school, and the number of classrooms in that school. MEBA staff scored each of
4 ―BRIGHT Project Final Evaluation Report‖ (CERFODES 2008) and ―Threshold Country Program Final Report‖ (USAID 2009).

7
these communities based on preset criteria to identify those communities that could benefit most from the schools.5
The RD design compared the 132 villages selected to receive schools via the BRIGHT program (participant villages) to the 161 villages not selected for BRIGHT (comparison villages), accounting statistically for the application score. Technically, the impact estimates that arise from this evaluation design can be generalized to villages at the margin of participation, i.e., villages whose eligibility scores were just above or just below the eligibility cutoff. We refer to these villages as ―marginal villages.‖
2. Data Collection Strategy
MPR oversaw data collection from rural households and schools in Burkina Faso. A team of researchers from the University of Ouagadougou was selected to carry out the data collection activities. We attempted to collect data from all 293 villages that applied to the program. These included all of the villages in the participant and comparison groups for this study. In the end, we collected data for 287, for reasons indicated in Chapters II and III. In each village, 30 households with school-age girls (5 to 12 years old) were randomly selected to be interviewed. In addition, the three schools in which village children were enrolled that were closest to the village center (within 10 kilometers) were selected to be surveyed.
Two questionnaires were developed: a household questionnaire and a school questionnaire. The household questionnaire included questions on households’ demographics, children’s educational outcomes (such as enrollment and attendance), and parents’ perceptions of education. The school survey included questions about schools’ characteristics and children’s attendance and enrollment. Following a small pilot study in 10 villages conducted in spring 2007, MPR refined the survey instruments and data collection procedures. The actual school surveys occurred in fall 2007, with a follow-up survey in spring 2008. The follow-up school survey was coupled with a household survey. The response rate for the household survey was 97.3 percent; for the school survey, it was 99.2 percent
3. Description of the Sample
Table I.3 provides an overview of the characteristics of the 287 villages in the sample used for the subsequent analysis. Panel A contains the characteristics of the households in our sample, while Panel B displays the characteristics of the children between the ages of 6 and 12. The first column contains the overall average characteristics of all of the villages. On average, the heads of the households were 46 years of age and almost always men (only 5.6 percent are not). Almost all of the households had floors made from basic material (usually dirt) and half of them had basic roofing material as well (thatch). Turning to asset ownership, the average household owned two-sixths of a radio, rarely owned a phone, had three-quarters of a watch, had a bicycle, and owned 4.8 cows. Sixty percent of the households in our sample were Muslim (as opposed to animists and a very small number of Christians). Of the children in our sample, the average age was 8.8 years. Just over half of the children were male (52.5 percent).
5 Appendix 1 includes a copy of the form used to collect information in each village, Appendix 2 provides the scoring rules used to rank villages, and Appendix 3 contains the full list of villages selected for BRIGHT.

8
Table I.3. Summary of Village and Household Characteristics
Characteristic
Overall
Average
(1)
Non-Marginal
Villages
(2)
Marginal
Villages
(3)
Difference
(4)
Panel A: Household
Age of Head 46.284 46.406 45.793 -0.613
(12.895) (13.047) (12.260) (0.596)
Head is Male 0.944 0.939 0.962 0.022*
(0.231) (0.239) (0.192) (0.013)
Basic Floor Material 0.909 0.901 0.942 0.041**
(0.288) (0.299) (0.234) (0.018)
Basic Roof Material 0.553 0.547 0.578 0.031
(0.497) (0.498) (0.494) (0.048)
Number of Radios 0.663 0.676 0.614 -0.062
(0.713) (0.728) (0.650) (0.039)
Number of Phones 0.153 0.16 0.128 -0.032
(0.411) (0.421) (0.370) (0.022)
Number of Watches 0.728 0.734 0.703 -0.031
(0.814) (0.829) (0.751) (0.043)
Number of Bicycles 1.291 1.32 1.174 -0.147**
(1.081) (1.103) (0.977) (0.073)
Number of Cows 4.775 4.695 5.095 0.4
(8.913) (8.981) (8.629) (0.522)
Religion Muslim (%) 0.596 0.595 0.602 0.006
(0.491) (0.491) (0.490) (0.049)
Panel B: Children
Age 8.763 8.764 8.76 -0.004
(1.969) (1.979) (1.927) (0.056)
Male 0.525 0.523 0.537 0.014
(0.499) (0.499) (0.499) (0.011)
Head's Child 0.869 0.865 0.884 0.018
(0.337) (0.341) (0.321) (0.015)
Panel C: Sample Sizes
Number of Villages 287 230 57
Number of Households 8,765 7,049 1,716
Number of Children 18,332 14,756 3,576
Source: Household survey (MPR 2008), school surveys (MPR 2007 and MPR 2008), application data
(Burkina Faso Ministry of Education 2005-2006).
*/**/***Coefficient statistically significant at the 10%/5%/1% significance level.
Standard errors clustered at the village level.
As described earlier, the regression discontinuity design relies on villages that are close to the cut-off score (i.e., marginal villages) to identify the impacts of the BRIGHT program. If these villages are very different from villages that are farther away (non-marginal villages), however, the resulting estimates may not be applicable to the other villages. To assess the generalizability of our results to non-marginal villages, we compared the characteristics of these villages (defined as those that have a relative score of less than -10 and greater than 10; see column 2) with those of marginal villages (defined as those that have a relative score that falls between -10 and 10; see column 3). The difference between these two groups of villages is presented in column 4.
Generally, the marginal and non-marginal villages are very similar—suggesting that, in this study, the criterion of being near the cutoff is not very restrictive and that our estimates should readily generalize to other villages. Two of the differences (basic floor material and number of bicycles) are statistically significant at the 5 percent level, and one of them (whether the household head is male) is statistically significant at the 1

9
percent level. However, despite the precision with which these differences are estimated, the differences practically are very small. The difference in whether the head is male is only 2.2 percentage points. The difference in basic floor material is only 4.1 percentage points, and the difference in the number of bicycles is only fifteen-hundredths of a bicycle. That these differences are small suggests that the estimates based on the marginal villages may generalize to the other villages.

10
II. DATA COLLECTION
As part of the Burkina Faso Girls’ Education Impact Evaluation, MPR oversaw data collection from rural households and schools in that country. This chapter provides information about the sample design, questionnaire design, data collection, data editing, and response rates for that data collection.
A. Sample Design
The sample frame comprised all households within the 293 villages that applied to the program, including all of the villages in the participant and comparison groups for this study. Data collectors, however, were unable to locate two villages. This is likely due to villages whose names differed either because of the dialect or an incorrect spelling recorded on the application form. As a result, 291 villages were included in the surveys.
Once located, 30 households with school-age girls (5 to 12 years old) were randomly selected to be surveyed in each village. Households in this study are defined as a group of persons, living together (in a common physical space), working together under the authority of a person called ―head of household,‖ and taking their meals together, or from the same supply of food. The members of household must have lived together in this fashion during at least 9 of the previous 12 months.
To develop the village-level household sampling frame, data collectors first conducted a complete census of households in each village. In that census, they identified households with school-age girls and collected information about the household’s access to beasts of burden. Once the sampling frame at the village level was complete, it was stratified by access to beasts of burden, which served as a proxy for wealth. Three strata were identified—those who owned at least one beast of burden, those who did not own but had access to one, and those who neither owned nor had access to one. This method of stratification was suggested by the University of Ouagadougou in order to ensure a representative household sample, under hypothesis that the means of production is positively correlated with income. From each of these strata, 10 households were chosen to be surveyed. For each stratum, the selection was done by writing the names of each head of an eligible household on a piece of paper, placing those pieces of paper in a hat, and then drawing 10 names. The selection process was carried out in a public manner in each village.
To develop the village-level school sampling frame, up to three schools for each village were chosen. By speaking with the village elders, data collectors first determined the total number schools, if any, that children from that village attended regularly. The three schools closest to the village center within 10 kilometers then were selected to be surveyed. This process yielded 360 schools. No further sampling was conducted.
B. Questionnaire Design
Two questionnaires were developed: a household questionnaire and a school questionnaire. The household questionnaire included questions on households’ demographics, children’s educational outcomes (enrollment and attendance), and parents’ perceptions of education. The school survey included questions about schools’ characteristics and children’s attendance and enrollment.
The household questionnaire drew heavily from several existing questionnaires widely used in developing countries. These included the Demographic and Health Survey (USAID), the Multiple Indicator Cluster Survey (UNICEF), and the Living Standards Measurement Study (World Bank). Relying on these existing questionnaires provided two important benefits. First, because they have been widely and successfully used in developing countries, including Burkina Faso, they contributed added confidence in the validity and reliability of their questions. Second, it allowed researchers to compare our results with results from these surveys, both in Burkina Faso and in other countries. Survey questions were adapted or added, where

11
necessary, to provide more detailed information to answer the research questions. The household survey included the following modules:
Household characteristics. This section included information about the head of household, such as religion, ethnicity, and education; information about the household itself, including GPS coordinates, construction materials, and water source; and intervention-specific information, such as whether any children were attending preschool (Bisongo) or whether any women were participating in literacy training.
Household listing form. Interviewers than asked the respondent to provide a complete listing of all children between the ages of 5 and 12 residing in the household. Basic information was collected about these children, including relationship to the head of household, sex, age, and whether the child had attended school at any time during the 2007–2008 school year.
Education. This module was administered for all children ages 5 to 12 who attended school at any time during the 2007–2008 school year. Questions in this module covered access to textbooks, information about the school attended, including specific interventions such as separate latrines, participation in feeding programs, attendance, and the reasons why parent sent the child to school.
Child labor. This module was administered for all children ages 5 to 12. Respondents were asked whether the children were engaged in work for persons outside the household (for pay or in kind) and whether they performed various chores.
Math assessment. This module was administered to all children ages 5 to 12. Children were shown preprinted cards and asked to identify numbers, count items, indicate which number is the greater of a pair of numbers, and do simple addition and simple subtraction.
French assessment. This module was administered to all children ages 5 to 12. Children were shown preprinted cards and asked to identify letters, read one- and two- syllable words, and identify the correct noun and verb from a list to fill in a blank in a simple sentence. Examples were taken from first- and second-grade Burkina Faso primary education reading texts.
The school questionnaire was based largely on the World Bank’s Living Standards Measurement Study School Questionnaire, with modifications to address the specific educational context in Burkina Faso and answer the specific research questions of this evaluation. Additionally, the school survey was administered in two waves. In the first wave, information was collected on the schools’ characteristics. In the second wave, attendance and enrollment data were collected for children who were interviewed in the household survey. As a result, two school questionnaire forms were created. The first included detailed characteristics about the school and a roster to collect attendance data. The second included only an attendance roster. Together, the school survey included the following modules:
School information. This module included general information about the school, such as name, province, department, and the type of respondent.
School characteristics. This module asked the respondent to provide detailed information about the school, including enrollment, type of school (public or private), textbook availability, and whether the school offered health and feeding programs.
School personnel characteristics. Respondents were asked to provide information about teachers at the school, including number and gender of teachers, teacher training levels, and whether they had received gender sensitivity training.
12
School physical structure. This module included questions about the school’s physical structure, such as the number of classrooms, availability of desks and chairs, school construction materials, water supply, separate latrines, and the presence of a preschool (Bisongo).
Student attendance roster. Two versions of this module were created. The first was administered during the first visit to the school, in conjunction with the modules above. The second was administered by itself during the second visit to the school. The first roster collected information about all students enrolled in the school, whether they were in attendance on that day, had been in attendance for the previous three days, and in general. For the second roster, information was collected only about those students identified in the household survey as being enrolled in school. In addition to the information collected on the first roster, the second roster collected GPS coordinates, the number of days the school was open during the four previous months, and the number of days the student was absent during the four previous months.
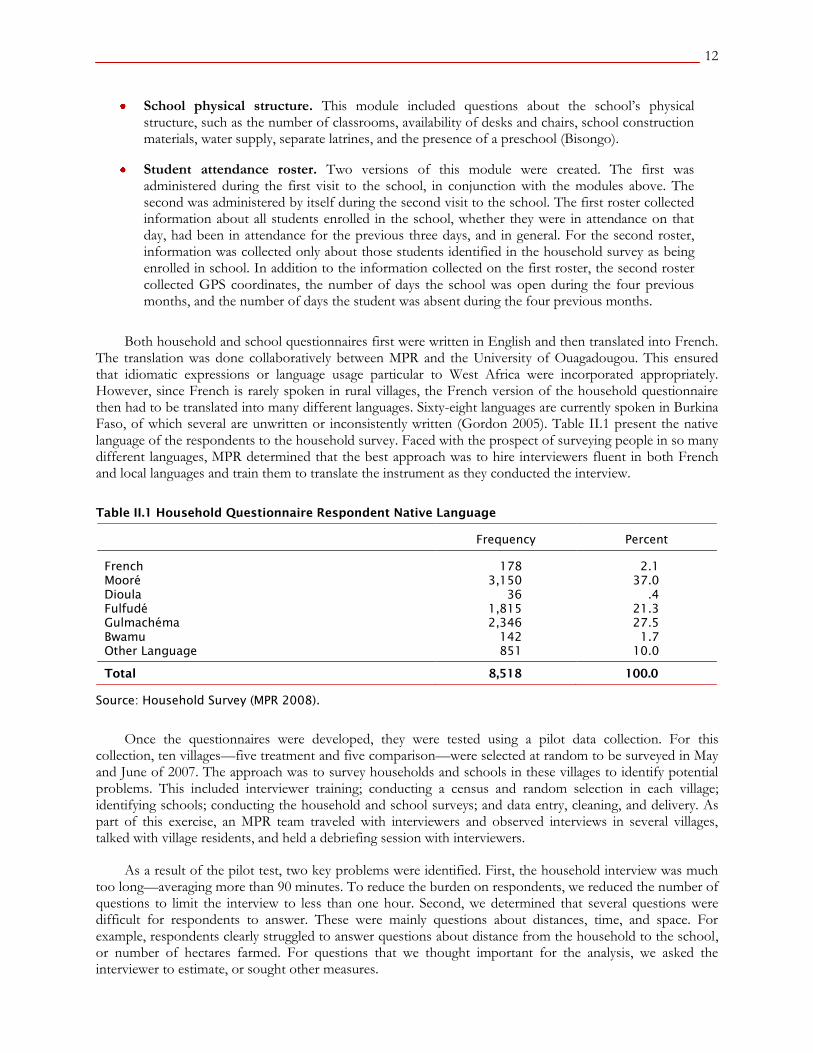
Both household and school questionnaires first were written in English and then translated into French. The translation was done collaboratively between MPR and the University of Ouagadougou. This ensured that idiomatic expressions or language usage particular to West Africa were incorporated appropriately. However, since French is rarely spoken in rural villages, the French version of the household questionnaire then had to be translated into many different languages. Sixty-eight languages are currently spoken in Burkina Faso, of which several are unwritten or inconsistently written (Gordon 2005). Table II.1 present the native language of the respondents to the household survey. Faced with the prospect of surveying people in so many different languages, MPR determined that the best approach was to hire interviewers fluent in both French and local languages and train them to translate the instrument as they conducted the interview.
Table II.1 Household Questionnaire Respondent Native Language
Frequency Percent
French 178 2.1
Mooré 3,150 37.0
Dioula 36 .4
Fulfudé 1,815 21.3
Gulmachéma 2,346 27.5
Bwamu 142 1.7
Other Language 851 10.0
Total 8,518 100.0
Source: Household Survey (MPR 2008).
Once the questionnaires were developed, they were tested using a pilot data collection. For this collection, ten villages—five treatment and five comparison—were selected at random to be surveyed in May and June of 2007. The approach was to survey households and schools in these villages to identify potential problems. This included interviewer training; conducting a census and random selection in each village; identifying schools; conducting the household and school surveys; and data entry, cleaning, and delivery. As part of this exercise, an MPR team traveled with interviewers and observed interviews in several villages, talked with village residents, and held a debriefing session with interviewers.
As a result of the pilot test, two key problems were identified. First, the household interview was much too long—averaging more than 90 minutes. To reduce the burden on respondents, we reduced the number of questions to limit the interview to less than one hour. Second, we determined that several questions were difficult for respondents to answer. These were mainly questions about distances, time, and space. For example, respondents clearly struggled to answer questions about distance from the household to the school, or number of hectares farmed. For questions that we thought important for the analysis, we asked the interviewer to estimate, or sought other measures.

13
For the school survey, we determined that it was nearly impossible to link the students on the roster with children reported to be enrolled in school during analysis. This is due to a lack of a unique identifier such as a government issued identification number, coupled with the fact that many children shared both the same first and last name. This matching procedure was important, since key measures for the evaluation were school enrollment and attendance. There was great concern that measuring these factors with the household survey might lead to misleading results, due to social desirability or other biases. As a result, a procedure was developed in which the matching would be done while interviewers were in each village. For this procedure, interviewers first completed the household surveys. They then compiled and populated the school attendance roster with the names of all children identified in the household surveys as being enrolled in a local school. They included the child’s household ID and household listing number on the roster. These identifiers were used later to link the school data to the household data. Once in the school, interviewers used the roster to collect attendance and enrollment information only for those children on that roster.
Full versions of the final household and school questionnaires appear in Appendix 4.6
C. Data Collection
To carry out the data collection activities, MPR drafted and released an RFP to solicit proposals from local data collection firms. (The RFP is attached as Appendix 5.) Seven proposals were received; MPR interviewed three firms, ultimately selecting a team of researchers from the University of Ouagadougou, led by Jean Pierre Sawadogo, Robert Ouedraogo, and Pam Zahonogo. The data collection firm was responsible for the following:
4. Translating and pretesting the questionnaire
5. Writing Terms of Reference and contracts for the field enumerators and controllers
6. Hiring and training field enumerators and controllers
7. Ensuring proper dispatch of the field enumerators and controllers to the survey sites
8. Undertaking field supervision during the data collection to identify and correct problems
9. Maintaining constant communication with the MPR team by sending biweekly reports on response rates and rapidly communicating any problems encountered
Prior to the start of each round of data collection, the University team conducted interviewer training. (The training manual is attached as Appendix 6.) The training covered identifying schools, conducting a village census and selecting eligible households at random, basic interviewing procedures, and a review of each question to ensure that interviewers understood its intent. Interviewers then were organized by linguistic group and worked together to determine how best to translate questions into the local languages. MPR participated in interviewer training.
The data collection plan consisted of a school survey conducted in fall 2007 and a follow-up school survey in spring 2008. These occurred about a year after the program was implemented. The follow-up school survey was coupled with a household survey. The pilot test, described above, was conducted in late spring 2007. All versions of the interview were conducted using paper questionnaire forms.
6 Because both the household and school surveys were substantially modified following the pilot data collection,
the pilot data was not used for analysis. During subsequent data collection, however, all ten villages that were included in the pilot data collection were revisited and included in the household and school survey.

14
The school survey was conducted with the school director, when possible. The interviewer also was asked to gather attendance information, particularly on the day of the visit. For that module, the interviewer called the roll and personally noted absences. In all, 360 schools were surveyed.
In all, the University team hired 56 interviewers to collect household and school data. For the full household data collection, the interviewers were organized into 18 teams by linguistic group. Each team consisted of three to four interviewers and was led by an experienced field supervisor. The teams were then assigned to a cluster of villages. Villages throughout the country were surveyed simultaneously by these teams.
The household survey was conducted with the head of household or another member of the household who was knowledgeable. The interviewee most often was the male head of household. Ninety-eight percent of the interviews were conducted with men and 80 percent with the head of the household.
D. Data Editing
Following data collection, the data were entered and edited by the University of Ouagadougou team using SPSS statistical analysis software. Preliminary data sets were provided to MPR for extensive data checking. The MPR team reviewed the data for completeness, internal consistency, and to determine if the match between household and school data was done correctly. In particular, because of its importance to the central research question, we focused on reconciling data for children identified as being enrolled in school during the household interview but not found on the school attendance roster, and children found on the school attendance roster but not on any household survey. These errors occurred for a variety of reasons, including interviewers not following the procedure and illegible writing.
E. Response Rates
The response rate for the household survey was 97.3 percent. This was calculated by dividing the total number of households who responded (8,491) by the number of households sampled for the located villages (8,730). Two unlocated villages were not included in this calculation.7
The response rate for the school survey is 99.2 percent. This was calculated by dividing the total number of schools who responded (367) by the total number of schools identified in the household survey as having children enrolled (370).
7 The analysis file excluded four additional villages. Two were excluded because they were the only villages that
applied for the program from their department and so were not eligible for this type of analysis. An additional two villages were excluded because no data were reported for them.

15
III. IMPACT EVALUATION DESIGN
To assess the impacts of the BRIGHT program, we selected an evaluation design that was rigorous yet adaptable to the way in which the program was implemented. In this chapter, we describe the evaluation questions and key outcome indicators used (Section A), the process used by the Ministry of Basic Education (MEBA) to select the 132 beneficiary villages (Section B), the impact estimation method that we chose, given this selection process (Section C), and the statistical analyses we conducted to verify the appropriateness of the method chosen (Section D).
A. Evaluation Questions
This impact evaluation sought to answer three key questions:
1. What was the impact of the program on school enrollment?
2. What was the impact of the program on test scores?
3. Were the impacts different for girls?
We collected two measures of school enrollment. For the first measure, a child was defined as enrolled if parents reported in the household survey that the child was attending school (any school) in the 2007–2008 academic year. For the second measure of enrollment, a child was defined as enrolled if the student was physically present on the day the surveyors showed up at the school. As a result, this second measure is slightly different conceptually from the first, since even enrolled children can be absent from school on a given day. We present impact estimates of BRIGHT on each of these two measures in Section IV.C.
As described in Chapter II, we sought to administer math and French tests to all children ages 5–12 who lived in the households we interviewed during our household survey. Test scores were normalized by taking the raw score for each age group, subtracting the mean for that age group, and then dividing by the standard deviation for the group. Hence, the test score impact estimates we present in this report are measured in standard deviations. To account for the fact that children may do better in these tests as they age, we included age dummy variables as control variables in our regressions.
B. Process Used to Select Beneficiary Villages
Faced with the challenge of selecting individual villages to receive new schools, MEBA instituted a process designed to ensure that the schools would be allocated in an objective manner according to predetermined criteria. This process was administered in a consistent manner, with all records retained to ensure transparency. We were, in fact, able to observe the actual records associated with the process and compare the actual process of allocating schools to villages with the strategy envisioned by the Ministry. With a small number of exceptions, the process was followed to the letter.
In the process, individual departments were allowed to nominate the villages to be considered for a school. The goal was to identify villages that could benefit from a school because of current low female enrollment rates and an interest in sending more girls to school. In total, 293 villages were nominated. This included nominations from 10 provinces and 49 departments.
The allocation procedure consisted of four steps:
1. Each village was visited by a staff member of the Ministry of Education. That person assisted representatives of the village in completing the application form presented in Appendix 1. The

16
form focuses on collecting information on the number of girls that would be served if a school was placed in that village. This includes the number of girls below the age of 12, the number of primary school-age girls in school, the distances to the nearest villages and schools, and other information.
2. The information on the application form then was processed so that each village received a numerical score. The score comprised the sum of all children that could be served by the school. This total was then adjusted by providing additional points if there were nearby villages or girls in the village who attended school and deducting points for remoteness of the village. The greatest weight was given to the number of girls in the village and the presence of nearby villages, as well as the number of girls in school within the applicant village. The scoring criteria are presented in Appendix 2.
3. Within each department, the villages then were ranked based on this score; the villages ranked in the top half received a BRIGHT school. In the event of an odd number of villages, the median village did not receive a school. Appendix 3 presents the list of 293 villages along with their score and ranking within each department.
4. If a department nominated only one village, that village was selected to receive a school. Two departments that nominated only one village.
This process generated a set of 138 villages that should have received a BRIGHT school. However, not all villages selected to receive a school could receive one because the program had funding for only 132 villages and because, in some cases, the location of the village proved inappropriate (for example, if there was a lack of a suitable water source). Only 127 villages initially selected to receive a school did receive one and five villages not initially selected received one. While we were unable to determine how such schools were reallocated, four of the five villages that received a school in contravention of the process were the next highest in the ranking. This is consistent with a strategy of reallocating schools to the next highest ranked school based on the survey.
C. Evaluation Design Selected
The selection process used to allocate the BRIGHT schools to villages allowed us to use a regression discontinuity (RD) design to assess the impacts of the BRIGHT program on child outcomes. The RD design takes advantage of situations in which there is a variable, such as the score given to villages, as described in the previous section, in which villages with a value above or below (in this case above) a certain cutoff are allocated to receive the intervention and those on the other side of the cutoff (in this case below) are not offered the intervention. The general idea is that, mathematically, the probability that a village would receive the treatment is discontinuous at this cut-off point.
Understanding the logic behind this strategy requires imagining that the allocation rules were different than they actually were, that all villages were ranked, regardless of department or province, and that the top 50 percent of the villages received the BRIGHT schools. Since there were 287 villages and the median village (the 144th village) would not receive a school, a village would have to be ranked 145 or higher to receive a school. The 145th village (Tanyoko-Mossi) received a score of 335. Effectively, the result is that the number 335 becomes the de-facto cut-off score for these villages. Had a village scored above 335, it would have scored higher than Tanyoko-Mossi and received the treatment, and if it scored less, it would not have received the treatment.
Because higher scoring villages tend to have more girls, these villages may, on average, have children with different characteristics than low-scoring villages. However, villages with very similar scores will, by the same logic, be more similar to each other than to villages with very different scores. As a result, if we look at villages just around the 335 cutoff, villages scoring 333 or 334 probably are not very different than those scoring 335 or 336. The RD design exploits this similarity at the point of discontinuity. At this point, villages

17
with very similar scores will be similar in their average characteristics, but because those with a score at or above 335 will receive the treatment and those with a score below 335 will not, the only major difference between those right around 335 will be that some receive the treatment and others do not. Given that these villages are similar in all respects, except for their receipt of the treatment, and that we can statistically account for any relevant differences by controlling for the score variable in our regression analyses, any differences in the outcomes of the children after the implementation of the program can be reliably attributed to participation in the BRIGHT program.
Figure III.1 provides an example of what this looks like graphically. In this hypothetical example, we have created a graph in which the average test scores of children in villages are graphed against their village’s application scores. We do this separately for children in villages scoring 335 or above and those scoring less than 335. As just described, those children in villages just below 335 are similar in all respects to those just above 335, except that they do not receive the program. If the end result is that there is a large difference in test scores for those villages just below 335 and those just above 335, as depicted, that difference must be the result of the program. Specifically, the distance between the two solid lines at the cut-off point represents the impact of the BRIGHT program on enrollment. Graphs similar to Figure III.1 were used to present the impact estimates of BRIGHT (Chapter IV).
It is important to note that, in this example, there is nothing special about the number 335 except that it is the cut-off score at which villages receive the BRIGHT schools. We could, for example, take each village’s score and assign each a new score that is the original minus 335. Because the order of the schools is preserved by this new score, the only thing that changes is that the new cut-off value is 0 rather than 335. We could do an example using the same analysis described above by using the new score and looking at villages that have score close to 0. Graphically, everything would look just as it does in Figure III.1 except that the break in the graph would occur at 0 and not 335.
Figure III.1. Hypothetical Illustration of Impact Estimation Using the Regression Discontinuity Design
Moving away from this hypothetical example to our data set, we have not one, but 49 individual rankings and cut-off values because the treatment assignment was done based on the ranking within the

18
individual departments rather than from an overall list of villages. This makes it difficult to compare villages just above and below the cut-off score because there is a different score for each village. However, if we use the procedure just described to modify the score, we can create a new score for each village, such that the cut-off value for each village is set to zero. To do this, we take the score of each individual village and create a new score by subtracting the cut-off value for that village’s department from the original score. Just as in our previous example, this new score will preserve the order of the villages within each department, but the new cut-off value will be zero. We refer to this new score as the relative score because mathematically, it is the difference between the original score and the cut-off value; that is, the relative value of the original score to the cut-off value. Once we create this new relative score, we can proceed as in our hypothetical example and compare villages with a relative score just below zero to those with a relative score just above zero.
BOX III.1
MATHEMATICAL REPRESENTATION OF IMPACT ESTIMATION METHOD
Mathematically, we estimate the value of the discontinuity caused by the assignment of the
treatment. In our example of Figure III.1, this is distance between the test score of those children
just below 335 and those just above 335. To do this, we estimate a regression equation that
relates the outcome of interest to the relative score variable. Specifically, we estimate the following
equation:
0 1
(Re )ihj j j ihj ihjY BRIGHT f lScore X (1)
In this equation, i indicates the individual child in household h in village j. The variable ihjY
represents the outcome of interest (test scores, enrollment, attendance, etc.) and the variable ihjX
is a vector of child and household characteristics. The variable j
BRIGHT is an indicator variable
for whether or not a village was at or above the cut-off score in its department. It takes the value
of 1 for the 138 villages that should have been assigned to receive a BRIGHT school according to
the score and selection criteria, and a value of 0 otherwise. The term (Re )j
f lScore is a function
of the relative score in the form of a polynomial (i.e. linear, quadratic, cubic, etc.). As we show
below, the results are robust to a wide variety of specifications for this polynomial, but we use a
quadratic specification as our preferred specification.
In this model, the coefficient 1 represents the impact of the program, or the discontinuity in the
function resulting from the intervention. We cluster the standard errors at the village level using
the standard Huber-White estimator to account for correlations in children’s characteristics within
villages. In some regression specifications used to assess the robustness of the results, we
interacted (Re )j
f lScore and j
BRIGHT to relax the assumption that the only discontinuity
generated by the assignment rule was in the intercept of the polynomial in relative score.
Finally, we had to narrow the data in our sample to make use of this estimation procedure. As described above, we were unable to survey four of the 293 applicant villages in our household survey. In addition, two villages were the only villages in their department, making it impossible to create the relative score variable needed for the RD design. As a result, we dropped these six villages from consideration in our analysis and focused on the 287 villages for which we had meaningful applicant and household survey data.

19
D. Assessing the Evaluation Design
While the regression discontinuity design selected is, in principle, well suited to be applied to the particular context in which BRIGHT was implemented, we performed some statistical analyses to verify that the design was indeed appropriate. The main conclusions of these analyses are the following:
1. Placebo tests supported the choice of the regression discontinuity design. These tests revealed that the participant and comparison groups were similar to each other in terms of their baseline characteristics once we made the statistical adjustments implied by the RD design. These tests also revealed that the results were robust to the functional form used to statistically control for the score , and suggested the quadratic as a reasonable functional form to use as our preferred specification.
2. The villages above the cut-off score (participant villages) were about 87 percentage points more likely to receive a BRIGHT school than the villages below the cut-off score (comparison villages). This confirms that the eligibility rules were indeed used to decide which villages would receive a BRIGHT school. (See Figure III.2.)
3. The participant villages were not significantly more likely than comparison villages to have a school prior to 2005, the year when some villages began constructing temporary schools in anticipation of BRIGHT. This confirms the notion that the participant and comparison villages were comparable across this key dimension prior to the program’s existence.
Figure III.2. Presence of a Bright School as a Function of Relative Score
Source: School Survey (MPR 2007).
Appendix 7 presents in detail the analyses performed to reach the above conclusions, which collectively imply that the empirical evidence is supportive of the choice of regression discontinuity as the method to estimate the impacts of BRIGHT.

20
IV. IMPACTS OF BRIGHT
In this chapter, we present our estimates of the impacts of the BRIGHT program. We begin by showing that, while the BRIGHT villages indeed constructed schools, so did about 60 percent of the comparison villages (Section A). We then show that the BRIGHT schools had better infrastructure than the schools located in the comparison villages (Section B). We then report our impact estimates of BRIGHT on the key outcomes of interest. The program had positive and statistically significant positive impacts on enrollment (Section C) and test scores (Section D). The impacts of BRIGHT were positive for both boys and girls (Section E). Finally, we present findings related to other impact-related questions (Section F).
A. Presence of a School in the Village
As indicated in Chapter I, given the trends in school construction and the existence of the PDDEB program, it is likely that schools would have been built in the BRIGHT villages even if the BRIGHT program had not been implemented. Indeed, our analysis suggests that, while participant villages had a school, so did 60 percent of the comparison villages. Using the same statistical methods specified in the previous chapter, we found that the participant villages were about 33 percentage points more likely to receive a school (of any kind) than the comparison villages (Figure IV.1).
Since, in the absence of BRIGHT, some BRIGHT villages would have received a school, our impact estimates are the result of comparing children who received a BRIGHT school to children who had a non-BRIGHT school and children who had no school at all. Hence, to better understand how to interpret the impacts of BRIGHT, we explored the differences between BRIGHT schools and non-BRIGHT schools, a topic we discuss in the next section.
Figure IV.1. Presence of Any School as a Function of Relative Score
Source: School Survey (MPR 2007); Application Data (MEBA, 2005-2006).

21
B. Interpretation of Impact Estimates
In this section, we compare the characteristics of BRIGHT and non-BRIGHT schools. The main two findings are:
The infrastructure of BRIGHT schools is better than that of those attended by children in the comparison group (Table IV.1). On average, BRIGHT schools have a larger number of usable classrooms, desks, and blackboards than comparison schools. BRIGHT schools are also much more likely to have a water supply, latrines, canteen, dry rations, and a preschool facility. The BRIGHT schools also are open for about 3.6 weeks longer per year than the non-BRIGHT schools, perhaps because they are more likely to remain open during adverse weather conditions. In sum, the infrastructure of the BRIGHT schools is of better quality and likely to be more conducive to learning that that of other schools.
Teachers in BRIGHT schools seem to be comparable to teachers in comparison schools. While the BRIGHT schools are more likely to have female teachers, there does not seem to be much difference in terms of average education level and experience.
While Table IV.1 presents a simple comparison of averages between the BRIGHT and non-BRIGHT schools, we conducted a more formal analysis in which we estimated the differences between the two types of schools for each of the characteristics on the table, using the RD method we used to estimate program impacts on the key outcomes of interest. The findings from this more formal analysis are very consistent with the findings reported above.
Table IV.1. School Characteristics
BRIGHT
Schools
(1)
Other
Schools
(2)
Difference
(3)
Sample
(4)
A – School Infrastructure
Number of Usable Classrooms 2.976 2.710 0.266** 270
Number of Rainproof Classrooms 2.896 2.083 0.813*** 270
Number of Legible Boards 2.912 2.530 0.382** 259
School has Enough Desks 0.874 0.444 0.430*** 278
Water Supply 0.858 0.404 0.454*** 278
Toilets 0.968 0.543 0.425*** 278
Separate Toilets (for boys and girls) 0.890 0.364 0.248*** 205
Canteen 0.905 0.776 0.129*** 273
Offers Dry Rations 0.492 0.192 0.300*** 277
Has Preschool 0.095 0.02 0.075*** 278
Weeks Open 31.448 27.800 3.648*** 270
B – Teacher Characteristics
Number 2.544 2.772 -0.228 270
Number of Females 1.104 0.607 0.497*** 270
Females with Merit 0.064 0 0.064*** 270
Number Postsecondary Degree 0.096 0.117 -0.021 270
Number w/ 0–5 Yrs Exp 1.944 1.807 0.137 270
Number w/ 5–10 Yrs Exp 0.488 0.745 -0.257*** 270
Number w/ 11+ Yrs Exp 0.112 0.221 -0.109** 270
Had Gender Training 0.768 0.124 0.644*** 270
*/**/***Coefficient statistically significant at the 10%/5%/1% significance level.
Source: School surveys (MPR 2007 and 2008).

22
The results in this section suggest that the net effect of the BRIGHT program was to provide participant villages with a consistent set of well-constructed, well-resourced, girl-friendly schools. Without the BRIGHT program, villages would have experienced the typical mix of low infrastructure quality, poorly resourced schools, or no school at all. Thus, the evaluation provides an assessment of the effects of quality girl-friendly schools. It is important to note, however, that the treatment operates through two distinct channels. In a third of villages, the treatment caused a school to exist in villages that otherwise would not have had schools. However, in two-thirds of the villages, the program simply caused a higher quality school to exist than would have existed without BRIGHT. These villages would have had schools if the BRIGHT school had not been constructed—but one of much lower quality. Hence, the impact of the program needs to be interpreted in light of providing not only increased access to schooling but also having potentially improved the quality of schooling.
C. Impacts on School Enrollment
BRIGHT had positive impacts on school enrollment. Based on household survey data, the impact of BRIGHT on school enrollment was about 20 percentage points, as seen in an increase in enrollment (Figure IV.2),8 whereas the impact based on school survey data was about 16 percentage points (Figure IV.3). Both of these are statistically significant at the 1 percent significance level.
Figure IV.2. Impacts of BRIGHT on Self-reported Enrollment
8 As with the graphs presented in the previous chapter, the x-axis is the relative score, the y-axis is the probability
that a child is enrolled, and the solid lines represent estimates of the relationship between the score and the probability of enrollment to the left and to the right of the cutoff. These estimates are derived from using our preferred quadratic specification. The lines appear as straight lines because the coefficients on the relative score and relative score squared variables are extremely small. The distance between the two solid lines at the cut-off point represents the impact of the BRIGHT program on enrollment.

23
Figure IV.3. Impacts of BRIGHT on Observed Enrollment
These effects are greater than those found for other recently evaluated education interventions, particularly given that 60 percent of the comparison group villages had a school by the time the outcome data were collected. The effects imply that BRIGHT was responsible for increasing enrollment rates from about 35 percent to 55 percent (household-reported outcome) or from about 31 percent to 47 percent (school-based outcome). (See Table IV.2.)
Table IV.2. Impacts of Bright on School Enrollment
Participant
Group
Comparison
Group
Impact
Estimate
Child enrolled in school (as reported by household) 54.9% 35.2% 19.7 pp***
Child found in school (on day of school visit) 47.4% 31.3% 16.1 pp***
*/**/***Coefficient statistically significant at the 10%/5%/1% significance level.
pp = percentage points
Comparison group numbers represent the average enrollment rates for the marginal comparison group
villages, i.e., the points at which the left part of the Figure IV.2 and Figure IV.3 intercept with the cut-off
line. Mathematically, it represents the coefficient on the constant in regression (1) in Tables IV.3 and IV.4.
Impact estimates represent the coefficient on the BRIGHT indicator variable using our preferred
specification (column #3) of Tables IV.3 and IV.4.
Source: Household survey (MPR 2008), school surveys (MPR 2007 and MPR 2008), and application data
(Burkina Faso Ministry of Education 2005–2006).
The impact estimates presented on Table IV.2 and Figures IV.2 and IV.3 are the ones that arise from our preferred regression specifications. They also are very robust to an extensive set of alternative specifications. Tables IV.3 and Tables IV.4 provide impact estimates based on some of the key regression specifications used to assess the robustness of the results. The first row for each of these tables provides estimates of the impact of BRIGHT and the subsequent rows provide the coefficients on the polynomial in

24
the relative score. Each of the columns presents a different regression specification. As can be seen from the coefficients reported in the first row in each of the tables, the impacts of BRIGHT are not very sensitive to which regression specification is used (they hover around 0.2 for the first measure of enrollment and 0.15 for the second measure), strengthening the confidence in the estimates presented earlier.
We now explain in more detail the regression specifications used in Table IV.3.9 The nontechnical reader may wish to skip ahead to the next section. Column (1) estimates equation (1) without control variables using the quadratic polynomial specification. The coefficient on ―BRIGHT‖ is 0.201 and significant at the one percent level, suggesting that the receipt of BRIGHT school increased children’s enrollment by 20 percentage points over villages without BRIGHT schools. Column (2) estimates the same regression but includes control variables. The resulting estimate of the discontinuity is almost exactly the same—20.9 percentage points rather than 20.1 percentage points. The similarity of these estimates suggests that the children just below the cutoff are similar to the children just above the cutoff on a host of background characteristics. Had the children been significantly different along characteristics correlated with enrollment, the point estimate on ―BRIGHT‖ would have changed significantly once the sociodemographic explanatory variables were added to the regression.
Table IV.3. Impacts of BRIGHT Schools on Self-Reported Enrollment
Dependent Variable Enrollment Enrollment Enrollment Enrollment Enrollment Enrollment
Independent Variables (1) (2) (3) (4) (5) (6)
BRIGHT 0.210*** 0.209*** 0.197*** 0.212*** 0.200*** 0.224***
(0.029) (0.026) (0.023) (0.022) (0.023) (0.077)
Relative Score 0 0.0000422 9.99e-05* 0.0000426 9.18e-05*
0.000 (0.000) (0.000) (0.000) (0.000)
Relative Score^2 0 -2.69e-08* -2.68e-08* 5.14E-08
0.000 (0.000) (0.000) (0.000)
Relative Score^3 0
0.000
Constant 0.352*** 1.096*** 0.55 0.461 0.426 0.307***
(0.024) (0.311) (0.400) (0.394) (0.407) (0.073)
Sociodemographic Controls No Yes Yes Yes Yes Yes
Department Fixed Effects No No Yes Yes Yes Yes
Specification Quadratic Quadratic Quadratic Linear Cubic Local
Sample Size 18,332 17,984 17,984 17,984 17,984 3,576
R-squared 0.06 15.5% 19.8% 19.7% 19.9% 1.0%
*/**/***Coefficient statistically significant at the 10%/5%/1% significance level.
Sociodemographic Controls include: Child's sex, age and relationship to the head of household, the head of
household's sex, age, and education, the relationship of the respondent to the head of household, the
household flooring and roofing material, household assets, and religion as well as village-level averages of
head of household's sex, age, and education, the relationship of the respondent to the head of household, the
household flooring and roofing material, household assets, and religion.
Source: Household survey (MPR 2008), school surveys (MPR 2007 and MPR 2008), and application data
(Burkina Faso Ministry of Education 2005–2006).
9 The specifications for Table IV.4 are analogous to those in Table IV.3 except that the dependent variable is the
school-based measure of enrollment.

25
Column (3)—which corresponds to our preferred regression specification and the one used in Table IV.2 and Figures IV.2 and IV.3—goes one step further, and includes department-level fixed effects as well as the socio demographic control variables. The addition of the fixed effects restricts the regression to estimate the discontinuity using only within-district variation in enrollment. Had the distribution of children around the discontinuity varied significantly by department, the addition of these indicator variables would have caused a significant change in the estimate of the magnitude of the discontinuity.
Column (4) presents the results of an estimation of a linear function in the relative score, while column (5) presents the results of a cubic polynomial in relative score. In both cases, the point estimate is still very close to the estimates in Columns (1) and (2)—21.2 and 20.0 percentage points, respectively. This underscores that the results are not sensitive to the specification of the underlying functional form in the relative score variable. In addition, the coefficients on the polynomial all are very close to zero. This suggests that, like the relationship of the probability of a village receiving a school, the children’s propensity to enroll in school is unrelated to the mechanism by which the treatment was assigned. This forms the basis for our identification strategy in Section IV.D.
Column (6) provides an estimate of a much less restrictive specification check. Because the RD design requires a precise estimate of the change in enrollment levels right at the relative score of zero, we trim the sample significantly and regress children’s enrollment only on the indicator variable for whether or not the child’s village was selected, using only villages with a relative score between 10 and -10. This procedure estimates the discontinuity using only 18 percent of the observations but it frees the estimate difference from the constraints placed on it by the observations farther than 10 and -10 from the discontinuity. As with the other specification checks, the point estimates are remarkably close to the original estimates—22.4 percentage points.
Table IV.4. Impacts of BRIGHT Schools on Observed Enrollment
Dependent Variable Enrollment Enrollment Enrollment Enrollment Enrollment Enrollment
Independent Variables (1) (2) (3) (4) (5) (6)
BRIGHT 0.138*** 0.150*** 0.160*** 0.173*** 0.159*** 0.115
(0.029) (0.027) (0.024) (0.021) (0.024) (0.096)
Relative Score 0.000*** 0 0 0 0
0.000 0.000 0.000 0.000 0.000
Relative Score^2 -0.000*** -0.000** 0 0
0.000 0.000 0.000 0.000
Relative Score^3 0
Constant 0.313*** -0.216 0.305 0.23 0.351 0.320***
(0.021) (0.389) (0.530) (0.512) (0.556) (0.091)
Sociodemographic Controls No Yes Yes Yes Yes Yes
Department Fixed Effects No No Yes Yes Yes Yes
Specification Quadratic Quadratic Quadratic Linear Cubic Local
Sample Size 18,332 17,984 17,984 17,984 17,984 3,576
R-squared 4.0% 13.0% 18.0% 18.0% 18.0% 0.0%
*/**/***Coefficient statistically significant at the 10%/5%/1% significance level.
Sociodemographic Controls include: Child's sex, age and relationship to the head of household, the head of
household's sex, age, and education, the relationship of the respondent to the head of household, the
household flooring and roofing material, household assets, and religion as well as village-level averages of
head of household's sex, age, and education, the relationship of the respondent to the head of household, the
household flooring and roofing material, household assets, and religion.
Source: Household survey (MPR 2008), school surveys (MPR 2007 and MPR 2008), and application data
(Burkina Faso Ministry of Education 2005–2006).
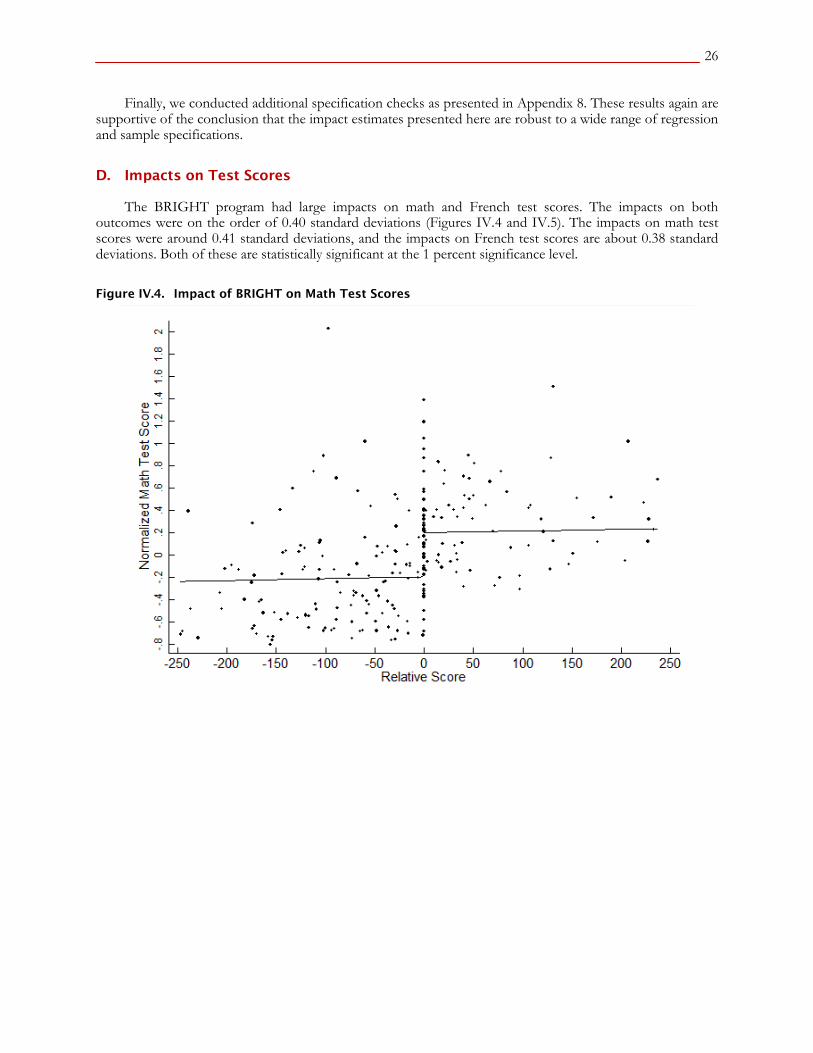
26
Finally, we conducted additional specification checks as presented in Appendix 8. These results again are supportive of the conclusion that the impact estimates presented here are robust to a wide range of regression and sample specifications.
D. Impacts on Test Scores
The BRIGHT program had large impacts on math and French test scores. The impacts on both outcomes were on the order of 0.40 standard deviations (Figures IV.4 and IV.5). The impacts on math test scores were around 0.41 standard deviations, and the impacts on French test scores are about 0.38 standard deviations. Both of these are statistically significant at the 1 percent significance level.
Figure IV.4. Impact of BRIGHT on Math Test Scores

27
Figure IV.5. Impact of BRIGHT on French Test Scores
The magnitude of these effects is larger than that of many other successful education interventions in the developing world; these effect sizes typically are between 0.1 and 0.3 standard deviations (although, as noted below, BRIGHT is a more costly intervention since it involves building schools). In this context, an impact of this size implies that, for a student who started at the 50th percentile of our sample, attending a BRIGHT school is predicted to increase his or her test score to approximately the 80th percentile.
Given that there were no apparent differences between BRIGHT teachers and non-BRIGHT teachers, it is natural to speculate what could have produced the impacts of BRIGHT on test scores. We believe that part of this impact is driven by the impacts on enrollment, as children enrolled in school are likely to do better on a test that children not enrolled in school. But we also think that part of the impact was driven by BRIGHT schools having a better learning environment than the one present in a typical school in Burkina Faso. As reported in Section IV.B, BRIGHT schools are more likely to have legible boards, desks, rainproof classrooms, among other features. They are also open for a larger number of weeks in the year.
The impacts on test scores also are very robust to various specifications, strengthening confidence in the estimates presented above. We next used the same estimation techniques as for enrollment to estimate BRIGHT’s impacts. These results are presented in Table IV.5. Panel A contains the results for the normalized math score and Panel B contains the results for the normalized French score. Each panel is laid out in exactly in the same way as Tables IV.3 and IV.4. Column (1) provides the estimated impact, assuming a quadratic form for the polynomial in relative score and no controls. The resulting estimate is a change in math scores of 0.41 standard deviations and 0.38 in language scores. In column (2), we estimate the same equation but add the sociodemographic controls. As with the enrollment estimates, both estimated treatment effects change very little, emphasizing the similarity of children around the cut-off score. Finally, in column (3), we add the department-level fixed effects. This reduces the estimates of both treatment effects, but only slightly. The discontinuity is still estimated to be 0.40 and 0.37 for math and language, respectively.

28
Table IV.5. Impacts of BRIGHT Schools on Test Scores
Dependent Variable
Normalized
Score
Normalized
Score
Normalized
Score
Normalized
Score
Normalized
Score
Normalized
Score
Independent Variables (1) (2) (3) (4) (5) (6)
Panel A: Math
BRIGHT 0.412*** 0.434*** 0.395*** 0.424*** 0.400*** 0.344**
-0.057 -0.0552 -0.049 -0.047 -0.0494 -0.155
Relative Score 0.000128 0.0000795 0.000157** 0.0000468 0.000145*
-0.0000962 -0.0000894 -0.0000776 -0.0000617 -0.0000801
Relative Score^2 -6.85e-08*** -6.08e-08** -5.16e-08** 6.75E-08
-2.59E-08 -2.54E-08 -2.17E-08 -8.15E-08
Relative Score^3 -0*
0
Constant -0.194*** -0.298 0.605 0.433 0.416 -0.205
-0.043 -1.072 -0.938 -0.904 -0.903 -0.145
Sociodemographic
Controls No Yes Yes Yes Yes Yes
Department Fixed Effects No No Yes Yes Yes Yes
Specification Quadratic Quadratic Quadratic Linear Cubic Local
Sample Size 18,034 17,984 17,984 17,984 4,821 3,554
R-squared 5.1% 7.4% 13.1% 13.1% 16.0% 1.0%
Panel B: French
BRIGHT 0.377*** 0.399*** 0.366*** 0.394*** 0.372*** 0.355***
-0.0534 -0.0496 -0.0429 -0.0421 -0.0426 -0.129
Relative Score 0.000105 0.0000595 0.000137* 0.0000288 0.000123*
-0.0000828 -0.0000815 -0.0000734 -0.0000591 -0.0000694
Relative Score^2 -6.23e-08*** -5.75e-08** -5.06e-08** 8.64E-08
-2.31E-08 -2.3E-08 -2.02E-08 -9.1E-08
Relative Score^3 0
0
Constant -0.178*** -1.155 -0.182 -0.35 -0.399 -0.200*
-0.037 -0.856 -0.775 -0.751 -0.74 -0.116
Sociodemographic
Controls No Yes Yes Yes Yes Yes
Department Fixed Effects No No Yes Yes Yes Yes
Specification Quadratic Quadratic Quadratic Linear Cubic Local
Sample Size 18,034 17,984 17,984 17,984 17,984 3,554
R-squared 4.2% 6.4% 11.8% 11.7% 11.9% 1.0%
*/**/***Coefficient statistically significant at the 10%/5%/1% significance level.
Sociodemographic Controls include: Child's sex, age and relationship to the head of household, the head of household's
sex, age, and education, the relationship of the respondent to the head of household, the household flooring and roofing
material, household assets, and religion.
Source: Household survey (MPR 2008), school surveys (MPR 2007 and MPR 2008), application data (Burkina Faso Ministry
of Education 2005–2006).
Columns (4) through (6) provide evidence of the robustness of the result to changes in the specification of the polynomial in relative score. Column (4) shows an estimate assuming a linear specification of relative score, and column (5) provides an estimate of a cubic specification of relative score. In both cases, the estimate of the treatment effect on math and language scores are still very close to the preferred estimates in column (3). Finally, in column (6), we estimate the difference in test scores around the discontinuity, using only the sample of students with a relative score between 10 and -10. These estimates display a bit more variation but are also consistent with the preferred estimate in column (3). They are also statistically significant at the 5 percent level, despite the much smaller sample used to estimate them.

29
E. Impacts by Gender and Age
While overall the BRIGHT program seems to have had a significant impact on children’s school enrollment rates, as well as their test scores, the schools themselves were designed to correct the biases inherent in the typical school. Given the social constraints and household obligations faced by girls in this area, traditional schools (with no preschool, predominantly male teachers, and teachers without training in how to make education equally accessible to boys and girls) tend to serve the needs of boys better than girls, resulting in higher levels of enrollment among boys. The BRIGHT schools were designed to provide these missing amenities to make school equally accessible to students of both genders. Similarly, these schools were targeted at primary school-age children, so it is important to assess which students in this age ranges are served by the schools, and how they benefit.
The BRIGHT program succeeded in increasing the enrollment rates of boys and girls and, in fact, the impact on girls was slightly larger than the effect on boys (Table IV.6). Boys’ enrollment increased by 17.6 percentage points, while girls’ enrollment increased by 22.2 percentage points. This difference of 4.6 percentage points is statistically significant at the 5 percent level.
The impacts of BRIGHT on test scores are similar for boys and girls, with both groups showing gains similar to the overall average impact presented in Table IV.5. The slightly higher enrollment rates for girls did not translate into higher test scores—girls on average benefited at the same level as boys. This documents the fact that the schools did in fact succeed in serving girls at the same level as boys.
Assessing the success of the program in improving girls’ educational outcomes depends on one’s prior assumptions. On one hand, it may be argued that, since the program had several components targeted directly to attract girls to school (such as separate latrines, dry rations, and the mobilization campaign), it could be expected that the impacts for girls would be larger than those for boys. On the other hand, given the social constraints and household obligations faced by girls in this area and the fact that these schools also were available for boys, achieving similar impacts for boys and girls could be considered a sign of success.
Table IV.6. Effect of BRIGHT Schools on School Enrollment and Test Scores: By Gender
Comparison Group Impact
Impact for Girls –
Impact for Boys
Enrollment rate for girls (%) 33.90 22.2*** 4.6 **
Enrollment rate for boys (%) 36.30 17.6***
Math test scores for girls -0.19 0.40*** 0.01
Math test scores for boys -0.20 0.39***
French test scores for girls -0.18 0.37***
0.01 French test scores for boys -0.17 0.36***
*/**/***Coefficient statistically significant at the 10%/5%/1% significance level.
Comparison group numbers represent averages for the children in the marginal comparison group
villages.
Impact coefficients arise from regression specifications in which the BRIGHT indicator is interacted with
the girl indicator variable, using our preferred specification that includes a quadratic polynomial in the
relative score, department-level fixed effects, and socio-demographic controls.
We also estimate the impacts of the program by age (Figure IV.6). This figure is a compilation of three graphs, each of which contains the estimated discontinuity for children of the age specified on the x-axis. The first graph displays the probability of enrollment, the second graph displays the effect on normalized math scores, and the third shows the effect on normalized language scores. The error bars around each point estimate represent the five percent confidence interval. Overall the BRIGHT school succeeded in increasing enrollment rates among the targeted students—children between the ages of 6 and 12. The point estimates for the impact on enrollment and test scores for each of these ages are positive and statistically significant. The only age group that does not seem to benefit from the program is the group of 5-year-olds who should

30
not have been attending the schools. The lack of impact for the 5-year-olds may be expected given that the official school entry age in Burkina Faso is 6. Additionally, there is a close relationship between the probability of enrollment for each age and the effects on test scores, suggesting that the change in test scores is resulting from higher rates of school enrollment.
Figure IV.6. Treatment Effects by Age of Child
F. Other Impact-related Questions
While the previous sections provided answers to the evaluation’s three key questions, in this section we explore other questions that may be of interest to policymakers. Since the evaluation was not explicitly set up to answer these questions, the answers are less definitive than those to the three key evaluation questions. The questions are: (1) Which of the interventions’ components were most responsible for the observed impacts?, (2) Did parental attitudes toward education change as a result of BRIGHT?, and (3) Would the same impacts have been observed had the program built schools of lower quality infrastructure (like the ones typically available in Burkina Faso)?
1. Which of the interventions’ components were most responsible for the observed impacts?
We were unable to estimate separately the impact of each of the intervention’s components (schools, dry rations, textbooks, etc.). In order to do this, some of the BRIGHT schools would have had to implement some components but not others. While this was theoretically feasible and our evaluation team proposed such an approach, the implementing agencies decided that this approach was neither politically nor logistically possible given the project’s timeline and resources.
Nevertheless, the parents’ responses to the household survey suggest that the presence of a school near a household seems to be a crucial feature of the program. According to our estimates, children in BRIGHT villages do not travel as far or as long from home to school as children in the comparison villages do (1 km

31
vs. 1.5 km; 18 minutes vs. 24 minutes). Moreover, the household survey also indicated that, for 72 percent of the children in BRIGHT villages, the distance from home to school is one of the two most important reasons to enroll in school (Table IV.7). Similarly, the most common reason reported by parents in the comparison villages for not sending their child to school was that there was no school in the village or that the nearest school was too far (about a third of parents reported one of these two reasons; Table IV.8). Parents also reported that the availability of textbooks and canteens were important reasons for enrolling their children in school. Dry rations and separate latrines were seen as much less important.
Table IV.7. Parents’ Reasons for Enrolling Children in Schools
Participant Group (BRIGHT) Comparison Group (non-BRIGHT)
Reason
Most
Important (%)
Among Two
Most
Important (%)
Most
Important (%)
Among Two
Most
Important (%)
Distance 54 72 51 71
Textbooks 12 43 14 56
Canteens 6 33 5 25
Dry rations 1 3 0 2
Separate latrines 0 0 0 0
Other 26 38 30 40
Sample Size 3,940 3,940 4,254 4,254
Source: Household Survey (MPR 2008)
Table IV.8. Main Reason for Not Enrolling Children in School: Parental Reports
Participant Group Comparison Group
Care of siblings 1% 0%
No school in the village or school is too far 5% 34%
Other 13% 6%
School fees 17% 9%
Child is too young 36% 20%
Domestic work 27% 14%
Work outside the home 1% 0%
Source: Household Survey (2008)
2. Did parental attitudes toward education change as a result of BRIGHT?
Through a series of soft interventions, including a mobilization campaign, BRIGHT also sought to influence the attitudes of parents toward education, particularly girls’ education. While this evaluation did not seek to measure the effect of BRIGHT on parental attitudes toward children’s education and the extent to which these attitudes may have contributed to the positive impacts of BRIGHT on school enrollment and test scores, we found some suggestive evidence that parental attitudes may have changed as a result of BRIGHT. In response to the question ―How many years should a child attend school?‖, BRIGHT parents were less likely than non-BRIGHT parents to answer ―zero,‖ and they were more likely to say there should be no limit (Table IV.9). Moreover, these differences were slightly more pronounced for girls than for boys, suggesting that the program may have changed attitudes toward girls’ education slightly more than attitudes toward education in general. To estimate these impacts we used the same techniques used in the previous section of this chapter. The evidence is presented as suggestive rather than definitive because it is difficult to know for sure whether the answer to the question ―When should a child stop attending school?‖ provides a reliable assessment of the long-term parental attitudes toward education.

32
Table IV.9. Parental Attitudes toward Schooling: How Many Years Should Child Attend School
Participant Group (%) Comparison Group (%)
Impact Estimate
(percentage points)
Girls
Zero 6.2 13.8 -7.6***
No limit 82.4 68.8 13.6***
Boys
Zero 7.1 11.4 -4.3***
No limit 83.8 75.2 8.6***
*/**/*** Impact Estimate statistically significant at the 10%/5%/1% significance level.
Comparison group numbers represent averages for the children in the marginal comparison group
villages.
Impact estimates correspond to the regression coefficient on the BRIGHT indicator using our preferred
specification that includes a quadratic polynomial in the relative score, department-level fixed effects, and
socio-demographic controls.
Source: Household survey (MPR 2008), application data (Burkina Faso Ministry of Education 2005-2006)
3. Would the same impacts have been observed had the program built schools of lower quality infrastructure (like the ones typically available in Burkina Faso)?
Although the magnitude of BRIGHT’s estimated impacts is larger than other education interventions in developing countries, a cost-effectiveness analysis would be needed to assess whether the effects are large on a per-dollar basis. In particular, it would be useful to know whether building a less expensive school of the sort typically built in Burkina Faso would have generated similar impacts.
While this evaluation cannot answer this question definitively, we found suggestive evidence indicating that part of the impact of BRIGHT came from having built a school in villages in which no school would have been available, and part of it came from having built a school with better infrastructure and add-on components than the typical school that would have been available if BRIGHT had not been implemented.
Descriptive analysis suggests that children in villages with a BRIGHT school have higher enrollment rates and test scores than children in comparison villages that have a school. More formal analyses (described in Appendix 9) point in the same direction, suggesting that part of the impact of BRIGHT was due to an increase in the quality of the school (beyond the increase in the access to school).
33
V. CONCLUSIONS
The evaluation revealed that BRIGHT increased both enrollment and test scores of children in targeted areas of Burkina Faso. The estimated impacts are larger than those of typical education interventions in developing countries, on the order of 15-20 percentage points for enrollment, and 0.4 standard deviations for test scores. The impacts are positive for both boys and girls, and they are present for children of all ages in the range of 6-12. As such, the program may serve as a model for policymakers who are interested in improving these outcomes in similar contexts.
To assess whether a program like BRIGHT should be implemented in other contexts, we need to consider alternative policy interventions available in these contexts. In thinking about comparing BRIGHT with other education interventions in the developing world that have been recently evaluated, it is important to remember that many of those interventions were launched in areas in which schools already existed. Examples include providing textbooks to schools in Kenya and hiring extra teacher aides in India. But most BRIGHT villages had no school before the program was implemented. So these other interventions may not be a feasible policy instrument with which to increase the educational outcomes of children in contexts similar to the one where BRIGHT was implemented.
Although the magnitude of BRIGHT’s estimated impacts is larger than that observed in typical education interventions in developing countries, a cost-effectiveness analysis would be needed to assess whether the effects are large on a per-dollar basis. In particular, it would be useful to know whether building a less expensive school of the sort typically built in Burkina Faso would have generated similar impacts. While this evaluation cannot answer this question definitively, we found suggestive evidence indicating that part of the impact of BRIGHT came from having built a school in villages in which no school would have been available, and part of it came from having built a school with better infrastructure and add-on components than the typical school that would have been available if BRIGHT had not been implemented.
In the end, a key question that remains is whether the observed effects will continue. Policymakers in Burkina Faso consistently voiced concern about whether children in BRIGHT villages would continue to go to school after the third year (there are only three classrooms). A new project now underway, BRIGHT II, is providing three additional classrooms in the same 132 villages where BRIGHT was implemented. This initiative may provide a good opportunity to assess the long-term effects of this type of intervention.

34
REFERENCES
BRIGHT Project Final Evaluation Report (CERFODES 2008)
Threshold Country Program Final Report (USAID 2009).
Gordon, Raymond G., Jr. (ed.), 2005. Ethnologue: Languages of the World, Fifteenth edition. Dallas, Tex.: SIL International. Online version: http://www.ethnologue.com/.
Hansen, Bruce E., ―Sample Splitting and Threshold Estimation,‖ Econometrica, 68 (May 2000), 575–603.
Burkina Faso National Institute of Statistics, Census Data 2006
UNESCO Institute for Statistics, http://stats.uis.unesco.org/unesco/ReportFolders/ ReportFolders.aspx.
French Development Agency: http://www.afd.fr/jahia/Jahia/lang/en/home/Portail-Projets/ Education/pid/1484;jsessionid=5776380FF4DA868C9221550F5DC974C5

APPENDIX 1
COPY OF APPLICATION FORM
(FICHE TECHNIQUE POUR LA COMMUNAUTE)
SITE SELECTION FOR THE MCA PROGRAM
1. Number of 7-year-old girls in your village .................................................................
2. Number of girls between 7 and 12 years old in your village ...................................
3. Number of girls between 7 and 12 years old in your village that are in school ....................................................................................................................
4. Distance to travel to the nearest school .....................................................................
5. Number of students at the nearest school .................................................................
6. Number of classrooms at the nearest school .............................................................
7. Number of villages nearby (nearby villages include all villages
within a 3km radius of your village). ...........................................................................
8. Number of schools for all nearby villages ..................................................................
9. Distance to the closest school in these villages
(listed in question 7)
Nearby Village 1 .............................................................................................................
Nearby Village 2 .............................................................................................................
Nearby Village 3 .............................................................................................................

A-2
Nearby Village 4 .............................................................................................................
Nearby Village 5 .............................................................................................................
10. Number of girls between 7 and 12 years old in the nearby villages
Nearby Village 1 .............................................................................................................
Nearby Village 2 .............................................................................................................
Nearby Village 3 .............................................................................................................
Nearby Village 4 .............................................................................................................
Nearby Village 5 .............................................................................................................
11. Distance from your village to a high school ..............................................................
12. Number of students at the high school ......................................................................
13. Name of town where the high school is located

A-3
SITE SELECTION FOR THE MCA PROGRAM (continued) 1. What is your plan for assuring that all girls will be in school?
2. What is your plan for helping with the unskilled labor needed to build the school?
3. What is your plan for teaching the student‟s parents to read and write?
4. How do you propose to participate in the management of the school?

A-4
APPENDIX 2
RULES TO CALCULATE ELIGIBILITY SCORE
(Applied to application forms submitted by each of the 293 villages)
QUESTION SCORING
N°1 ................................................. 1 point per girl N°2 ................................................. 1 point per girl N°3 ................................................. 1 point per girl N°4 ................................................. +1 point if between 0 and 5 km and
- 1 point for 6 km or more N°5 ................................................. 1 point per student N°6 ................................................. +1 if there are no rooms and
-1 if there are N°7 ................................................. +1 for each village between 0 and 5 km and
-1 for each village of 6km or more N°8 ................................................. -1 for each existing school and
+1 if there are none N°9 .................................................
+1 if between 0 and 5 km -1 if 6 km or more
N°10 ............................................... 1 point per girl N°11 ............................................... +1 if between 0 and 20 km and
-1 if 21 km or more N°12 ............................................... + 1 per student N°13 ............................................... Not included in scoring
COMMENTARY N°1 ................................................. +1 for each relevant action or plan suggested N°2 ................................................. +1 for each relevant action or plan suggested N°3 ................................................. +1 for each relevant action or plan suggested N°4 ................................................. +1 for each relevant action or plan suggested

A-5
APPENDIX 3
LIST OF 293 COMMUNITIES WITH ELIGIBILITY SCORES
Region Province Department
Eligible
Communities
Total
Points
Selected
for 2006
BOUCLE
DU
MOUHOUN
BANWA
SANABA 1. Bolibana
2. Founa
488
372
Bolibana
TANSILA 1. Bokuy
2. Kira
169
151
Bokuy
SOLENZO 1. Solenzo
2. Sig-nooghin
3. Daboura
4. Bema
2453
537
533
1067
Bema
Sig-nooghin
KOUKA 1. Koura c
2. Sama
3. Diontala b
4. Kouroumani
5. Kouroumani
Kodala
1914
1849
1603
1269
1236
Diontala b
Kouroumani
Kouroumani
Kodala
EST GNAGNA
MANNI 1. Tambidi
2. Dayendé
3. Dassari
4. Pougdiari
811
787
733
724
Dayendé
Dassari
PIELA 1.Marmiga
2.Tougoudadou
3.Bonskomi
4.Souroungou
1952
1555
1416
1359
Marmiga
Tougoudadou
THION 1.Tamyèla
2.Dimkoura
3.Nawèga
761
507
376
BILANGA 1.Kogodou
2.Kibaré
3.Tiguili
4.Benhourgou
5.Tomonga
976
470
460
339
339
Benhourgou
Tomonga
BOGANDE 1.Komboassin
2.Domaré
3.Ouaboadi
4.Namounterga
669
571
498
465
Komboassin
Domaré
LIPTOUGOU 1.Tantiaka
2.Safé
379
376
Safé

A-6
Region Province Department
Eligible
Communities
Total
Points
Selected
for 2006
EST
GNAGNA
COALLA 1.Dielkou
2.Bani
3.Kontiandi
4.Mossadeni
5.Santiari
372
358
335
334
327
Dielkou
Mossadeni
Santiari
KOMANDJARI
BARTIEBOUGOU 1.Nianfambougou
2.Moaligou
3.Bargabè
419
399
386
Nianfambougou
FOUTOURI 1.Ichaguel
2.CFA/Zougou
3.Kariégou
4.Kiri Kiri
365
344
326
323
Kariégou
Kiri Kiri
GAYERI 1.Boulkiana
2.Souadigou
583
261
Boulkiana
TAPOA
DIAPAGA 1.Koumalgou 226 Koumalgou
KANTCHARI 1.Garbouogou
2.Moadagou
779
732
PARTIAGA 1. Boungou 313 Boungou
TAMBAGA 1.Thioula
2.Bontana
302
252
Thioula
TANSARGA 1.Kpentoboula
2.Nadjiringa
485
462
Nadjiringa
SAHEL
OUDALAN
DEOU 1.Tountéri Poli 502 Tountéri Poli
GOROM-GOROM 1.Essakane
2.Bossey Etage
483
307
Essakane
MARKOYE 1.Tollel-Kaya
2.Kouna
3.Bom
4.Inawass
5.Ichagani
246
243
238
230
228
Tollel-Kaya
Kouna
SENO
BANI 1.Gorouolkadje
2.Bindéré
3.Dalinga
4.Tchélel
5.Terbiel
361
300
278
235
233
Dalinga
DORI 1.Katchari
2.Kouri
415
317
Katchari

A-7
Region Province Department
Eligible
Communities
Total
Points
Selected
for 2006
SAHEL
SENO
GORGUAGUI 1.Bangataka léné 168 Bangataka léné
FALAGOUNTOU 1.Gassel Biankou
2.Belgou
347
173
Gassel Biankou
SAMPELGA 1.Mira (Niagassi) 172 Mira (Niagassi)
SOUM
ARIBINDA 1.Aladjou
2.Djionkolga
1641
1384
Aladjou
BARABOULE 1.Windboki 549
DJIBO 1.Silgueye
2.Bani
410
395
Bani
COMMUNE DE
DJIBO
1.Secteur 8 Djibo 139
KELBO 1.Tahadi 206 Tahadi
POBE-MENGAO 1.Ouré 590 Ouré
TONGOMAYEL 1.Woba-Tila
2.Arbilo
168
156
Arbilo
YAGHA
MANSILA 1.Penkatougou
2.Sakuiri
236
165
Sakuiri
SEBBA 1.Tiékoy
2.Fanta Fawta
3.Idoré
1621
1468
1394
Tiékoy
Fanta Fawta
CENTRE
NORD SANMATENGA
BARSALOGHO I 1.Toekedogo
2.Soudougou
3.Bagmiougou
1063
802
612
Bagmiougou
BARSALOGHO II 1.Daké
2.Zambila
3.Guelkoto
4.Perko
5.Kougpela
4250
1872
1710
1061
534
Zambila
Perko
Kougpela
BOUSSOUMA 1.Gofila
2.Nasséré
872
290
Nasséré
ZIGA-KORSIMORO 1.Koura
2.Tansablogo
3.Kiribaka
654
544
503
Koura
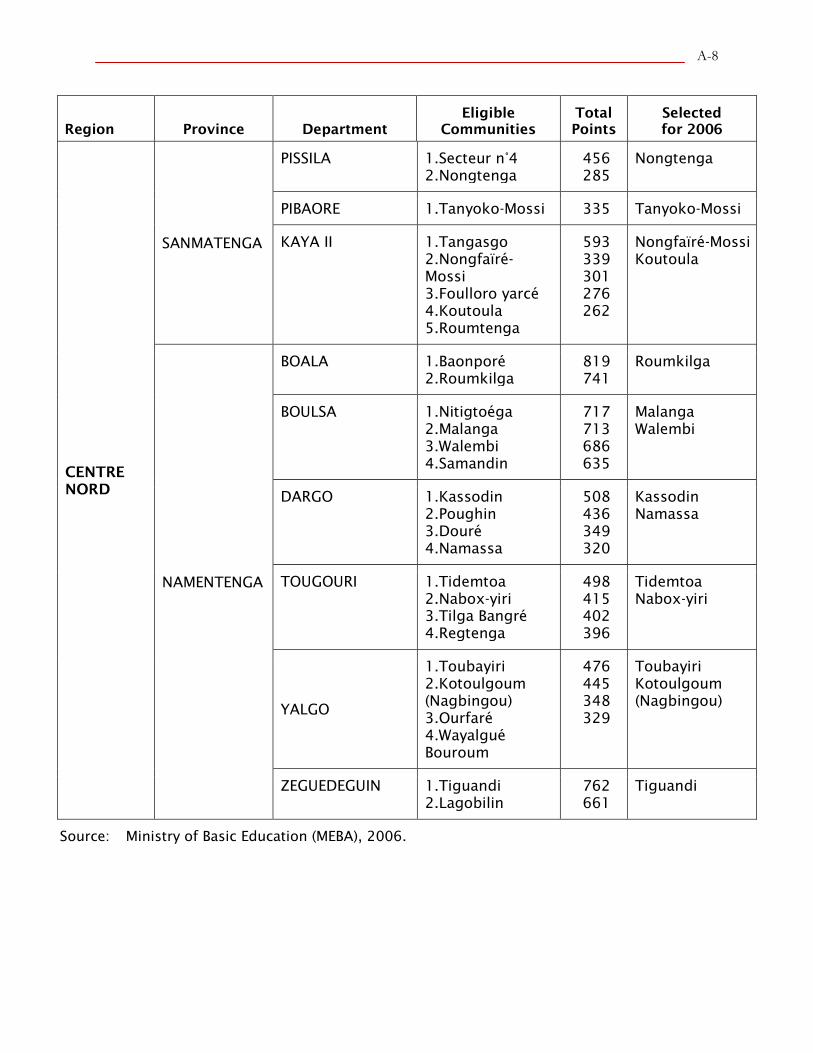
A-8
Region Province Department
Eligible
Communities
Total
Points
Selected
for 2006
CENTRE
NORD
SANMATENGA
PISSILA 1.Secteur n°4
2.Nongtenga
456
285
Nongtenga
PIBAORE 1.Tanyoko-Mossi 335 Tanyoko-Mossi
KAYA II 1.Tangasgo
2.Nongfaïré-
Mossi
3.Foulloro yarcé
4.Koutoula
5.Roumtenga
593
339
301
276
262
Nongfaïré-Mossi
Koutoula
NAMENTENGA
BOALA 1.Baonporé
2.Roumkilga
819
741
Roumkilga
BOULSA 1.Nitigtoéga
2.Malanga
3.Walembi
4.Samandin
717
713
686
635
Malanga
Walembi
DARGO 1.Kassodin
2.Poughin
3.Douré
4.Namassa
508
436
349
320
Kassodin
Namassa
TOUGOURI 1.Tidemtoa
2.Nabox-yiri
3.Tilga Bangré
4.Regtenga
498
415
402
396
Tidemtoa
Nabox-yiri
YALGO
1.Toubayiri
2.Kotoulgoum
(Nagbingou)
3.Ourfaré
4.Wayalgué
Bouroum
476
445
348
329
Toubayiri
Kotoulgoum
(Nagbingou)
ZEGUEDEGUIN 1.Tiguandi
2.Lagobilin
762
661
Tiguandi
Source: Ministry of Basic Education (MEBA), 2006.

A-9
APPENDIX 4
SCHOOL AND HOUSEHOLD QUESTIONNAIRES
BURKINA FASO HOUSEHOLD QUESTIONNAIRE
HELLO. MY NAME IS _______________________________________ AND I AM WORKING WITH THE
UNIVERSITY OF OUAGADOUGOU. WE ARE WORKING ON A PROJECT CONCERNED WITH FAMILY HEALTH AND
EDUCATION. I WOULD LIKE TO TALK TO YOU ABOUT YOUR HOUSEHOLD. THE INTERVIEW WILL TAKE ABOUT 40
MINUTES. ALL THE INFORMATION WE OBTAIN WILL REMAIN STRICTLY CONFIDENTIAL AND YOUR ANSWERS WILL
NEVER BE IDENTIFIED. DURING THIS TIME I WOULD LIKE TO SPEAK WITH THE HOUSEHOLD HEAD AND ALL MOTHERS
OR OTHERS WHO TAKE CARE OF CHILDREN IN THE HOUSEHOLD.
HOUSEHOLD CHARACTERISTICS HC
HC1. VILLAGE ID: ___ ___ ___ HC2. HOUSEHOLD NUMBER: ___ ___ ___
HC3. INTERVIEWER NAME AND NUMBER: NAME ___ ___
HC4. SUPERVISOR NAME AND NUMBER: NAME ___ ___
HC5. DAY/MONTH/YEAR OF INTERVIEW: ___ ___ / ___ ___ / ___ ___ ___ ___
HC6. PROVINCE: HC7. DEPARTMENT:
HC8. NAME OF HEAD OF HOUSEHOLD:
_____________________________________________________
HC9. RESPONDENT RELATIONSHIP TO HEAD OF HOUSEHOLD: _____
01 = HEAD 02 = WIFE OR HUSBAND 03 = SON OR DAUGHTER 04 = GRANDCHILD
05 = PARENT 06 = BROTHER OR SISTER 07 = UNCLE/AUNT 08 = NIECE/NEPHEW
09 = OTHER RELATIVE 10 = ADOPTED/FOSTER/STEPCHILD 11 = NOT RELATED 98 = DON'T KNOW
HC10. SEX OF HEAD OF HOUSEHOLD: 1. MALE 2. FEMALE
HC11. AGE OF HEAD OF HOUSEHOLD AGE: ___ ___
HC12. HIGHEST LEVEL OF EDUCATION AND GRADE OF HEAD OF HOUSEHOLD (CIRCLE ONE): 0 NONE 4 HIGHER GRADE: ___ ___ 1 PRE-SCHOOL 5 NON-STANDARD CURRICULUM 2 PRIMARY 8 DK 3 SECONDARY
HC13. HOUSEHOLD GEO-REFERENCE: LONGITUDE: LATITUDE:
HC14. TOTAL NUMBER OF HOUSEHOLD MEMBERS: _____
HC15. TOTAL NUMBER OF CHILDREN UNDER 18 YEARS
OLD IN HOUSEHOLD: _____

A-10
HC16A. WHAT IS THE RELIGION OF THE HEAD OF
THIS HOUSEHOLD?
MUSLIM ....................................................... 1 CHRISTIAN ................................................... 2 ANIMISM ...................................................... 3 OTHER RELIGION (SPECIFY) .......................... 6 NO RELIGION………………………………….7
HC16B. WHAT IS THE MOTHER TONGUE/NATIVE
LANGUAGE OF THE HEAD OF THIS HOUSEHOLD? FRENCH ........................................................ 1 MOORE ......................................................... 2 DIOULA ......................................................... 3 FULFUDE ...................................................... 4 GULMACHEMA ............................................... 5 BWAMU ......................................................... 6 OTHER LANGUAGE (SPECIFY)………………… 7
HC16C. TO WHAT ETHNIC GROUP DOES THE HEAD
OF THIS HOUSEHOLD BELONG? MOSSI………………………………………….1 DIOULA…………………………………………2 PEUL….………………………………………..3 GOURMANCHE…………………………………4 BWABA…………………………………………5 OTHER ETHNICITY (SPECIFY)…………………6
HC17A. MAIN MATERIAL OF THE DWELLING FLOOR: NATURAL MATERIAL (EARTH, SAND, DUNG) .................................... 1 RUDIMENTARY MATERIAL (WOOD PLANKS, PALM, BAMBOO) .................... 2 FINISHED MATERIAL (POLISHED WOOD, VINYL, ASPHALT, CERAMIC, CEMENT, CARPET) ........... 3 OTHER (SPECIFY) ....................................... 96
HC17B. MAIN MATERIAL OF THE ROOF. NATURAL MATERIAL (NO ROOF, STUBBLE) ..................................... 1 RUDIMENTARY MATERIAL (RUSTIC MAT, PALM, BAMBOO, WOOD PLANKS) ............................... 2 FINISHED MATERIAL (METAL, WOOD, CEMENT, SHINGLES) ..................................... 3 OTHER (SPECIFY) ....................................... 96

A-11
HC18. HOW MANY OF THE FOLLOWING GOODS DO
ANY MEMBERS OF YOUR HOUSEHOLD OWN: A RADIO?
A MOBILE TELEPHONE?
A WATCH?
A BICYCLE?
A MOTORCYCLE OR SCOOTER?
AN ANIMAL-DRAWN CART?
CATTLE
RADIO ...................................... ………[____]
MOBILE TELEPHONE .................. ………[____]
WATCH ..................................... ………[____]
BICYCLE ................................... ………[____]
MOTORCYCLE/SCOOTER .......... ………[____]
ANIMAL DRAWN-CART ................ ………[____]
CATTLE..................................... ………[____]
HC19. WHAT IS THE MAIN SOURCE OF DRINKING
WATER FOR MEMBERS OF YOUR HOUSEHOLD
DURING THE RAINY SEASON?
PIPED WATER ............................................... 1 TUBE WELL OR BOREHOLE ............................ 2 DUG WELL .................................................... 3 WATER FROM SPRING ................................... 4 RAINWATER .................................................. 5 TANKER TRUCK ............................................. 6 CART WITH SMALL TANK ................................ 7 SURFACE WATER .......................................... 8 BOTTLED WATER .......................................... 9 OTHER (SPECIFY) ....................................... 10
HC20. WHO USUALLY GOES TO THIS SOURCE TO
FETCH WATER FOR YOUR HOUSEHOLD? ADULT WOMAN ............................................. 1 ADULT MAN .................................................. 2 GIRL (UNDER 15) .......................................... 3 BOY (UNDER 15) ........................................... 4 OTHER (SPECIFY)……………………………...5
HC21. HOW LONG HAVE YOU BEEN LIVING
CONTINUOUSLY IN (NAME OF CURRENT PLACE OF
RESIDENCE.
YEARS ................................................... __ __ ALWAYS/PERMANENT .................................. 95 TEMPORARY/PERIODICALLY ......................... 96
HC22. AT WHAT AGE SHOULD GIRLS STOP
ATTENDING SCHOOL? If “girls should not attend school at all”, enter 0
If no limitation, write 99. _____
HC23. AT WHAT AGE SHOULD BOYS STOP ATTENDING
SCHOOL? If “boys should not attend school at all”, enter 0
If no limitation, write 99.
_____
HC24. ARE THERE ANY CHILDREN IN THIS
HOUSEHOLD WHO CURRENTLY ATTEND
PRESCHOOL (BISONGO)?
YES .............................................................. 1 NO ............................................................... 2
HC25A. DO ANY WOMEN IN THIS HOUSEHOLD
PARTICIPATE IN MOTHER’S LITERACY TRAINING? YES .............................................................. 1 NO ............................................................... 2
HC25B. DO ANY WOMEN IN THIS HOUSEHOLD
PARTICIPATE IN LITERACY TRAINING OF ANY KIND? YES……………………………………………..1 NO………………………………………………2
HC26. HAVE YOU HEARD ANYTHING RECENTLY
ABOUT THE SCHOOLING BENEFITS FOR GIRLS? YES .............................................................. 1 NO ............................................................... 2

A-12
AFTER THE QUESTIONNAIRE HAS BEEN COMPLETED, FILL IN THE FOLLOWING INFORMATION:
HC27. RESULT OF HH INTERVIEW: _____
COMPLETED……………………………………..1
EFFORT ENDED………………………………….2
REFUSED ............................................................. 3
OTHER (SPECIFY) ....................................... ……….4
HC28. INTERVIEWER/SUPERVISOR NOTES: USE THIS SPACE TO RECORD NOTES ABOUT THE INTERVIEW WITH
THIS HOUSEHOLD.
HC29. DATA ENTRY CLERK: _____

A-1
3
H
OU
SE
HO
LD
LIS
TIN
G F
OR
M
V
illa
ge
ID:
___ _
__ _
__ H
ou
seh
old
Nu
mb
er _
__ _
__ _
__
H
L
FIR
ST,
PLE
AS
E T
ELL M
E T
HE
NA
ME
OF
EA
CH
CH
ILD
WH
O U
SU
ALLY
LIV
ES
HE
RE
BE
TW
EE
N T
HE
AG
ES
OF
5 A
ND
12
. L
ist
all
ho
use
ho
ld m
emb
ers
bet
ween
5 a
nd 1
2 y
ears
old
in
HL
2,
thei
r
rela
tio
nsh
ip t
o t
he
ho
use
ho
ld h
ead
(H
L3
), t
hei
r se
x (H
L4
), a
nd
th
eir
ag
e (H
L5
). T
hen
ask
: A
RE
TH
ER
E A
NY
OT
HE
R C
HIL
DR
EN
BE
TW
EE
N T
HE
AG
E O
F 5
AN
D 1
2 W
HO
LIV
E H
ER
E,
EV
EN
IF
TH
EY
AR
E N
OT
ME
MB
ER
S O
F Y
OU
R F
AM
ILY,
DO
NO
T H
AV
E P
AR
EN
TS
LIV
ING
IN
TH
IS H
OU
SE
HO
LD
, O
R A
RE
NO
T A
T H
OM
E N
OW
? (
INC
LU
DIN
G C
HIL
DR
EN
IN
SC
HO
OL O
R A
T W
OR
K).
If
yes,
co
mp
lete
lis
tin
g.
Ad
d a
co
nti
nua
tio
n s
hee
t if
th
ere
are
mo
re t
ha
n 1
0 c
hil
dre
n b
etw
een
5 a
nd
12.
Tic
k h
ere
if c
on
tin
ua
tio
n s
hee
t u
sed
HL
1.
Lin
e
no
.
HL2
. C
HIL
D’S
NA
ME
HL2
A.
NA
ME
OF
CH
ILD’S
FA
TH
ER
HL2
B.
NA
ME
OF
CH
ILD’S
MO
TH
ER
HL3
. W
HA
T IS
TH
E
RE
LA
TIO
N-S
HIP
OF
(na
me
) T
O T
HE
HE
AD
OF
TH
E
HO
US
EH
OL
D?
Inte
rvie
wer
: F
or
this
qu
esti
on
, u
se
cod
es f
rom
HC
9
HL4
. IS
(n
am
e)
MA
LE
OR
FE
MA
LE?
1 M
ALE
2 F
EM
ALE
HL5
. H
OW
OLD
IS
(n
am
e)?
H
OW
OLD
WA
S
(na
me
) O
N
HIS
/HE
R L
AS
T
BIR
TH
DA
Y?
Rec
ord
in
com
ple
ted
yea
rs
98
=D
K
HL
7.
WH
AT
IS
TH
E H
IGH
ES
T
LE
VE
L O
F S
CH
OO
L (n
am
e)
AT
TE
ND
ED
?
WH
AT
IS
TH
E H
IGH
ES
T
GR
AD
E (n
am
e)
CO
MP
LE
TE
D
AT
TH
IS L
EV
EL?
L
EV
EL:
0 N
O S
CH
OO
L
1 P
RE-S
CH
OO
L
2 P
RIM
AR
Y
3 I
NF
OR
MA
L C
UR
RIC
ULU
M
8 D
K
GR
AD
E:
1 CP1…
…6CM2
If l
evel
= 0
or
pre
sch
oo
l,
wri
te g
rad
e =
0
HL
8.
DU
RIN
G T
HE
(20
07
-20
08
) S
CH
OO
L Y
EA
R,
HA
S (n
am
e)
AT
TE
ND
ED
SC
HO
OL
OR
PR
ES
CH
OO
L A
T
AN
Y T
IME?
1 Y
ES
E
D1
2
NO
H
L9
8
IF
N/A
HL
9.
If n
o:
WH
Y IS
(n
am
e) N
OT
EN
RO
LLE
D IN
SC
HO
OL?
0
NO
SC
HO
OL I
N
VIL
LA
GE
1 S
CH
OO
L F
EE
S
2 C
HIL
D T
OO
YO
UN
G
3 S
CH
OO
L T
OO
FA
R
4 W
OR
K F
OR
IN
CO
ME
5 H
OU
SE
HO
LD
WO
RK
6 T
AK
ING
CA
RE
OF
SIB
LIN
GS
7 O
TH
ER
(S
PE
CIF
Y)
CL
1
LIN
E
CH
ILD’S
NA
ME
FA
TH
ER’S
NA
ME
MO
TH
ER’S
NA
ME
RE
L.
M
F
AG
E
LE
VE
L
GR
AD
E
Y
N
DK
01
__
_
__
_
1
2
__
_
__
_
_
__
__
_
1
2
8
02
__
_
__
_
1
2
__
_
__
_
_
__
__
_
1
2
8
03
__
_
__
_
1
2
__
_
__
_
_
__
__
_
1
2
8
04
__
_
__
_
1
2
__
_
__
_
_
__
__
_
1
2
8
05
__
_
__
_
1
2
__
_
__
_
_
__
__
_
1
2
8
06
__
_
__
_
1
2
__
_
__
_
_
__
__
_
1
2
8
07
__
_
__
_
1
2
__
_
__
_
_
__
__
_
1
2
8
08
__
_
__
_
1
2
__
_
__
_
_
__
__
_
1
2
8
09
__
_
__
_
1
2
__
_
__
_
_
__
__
_
1
2
8
10
__
_
__
_
1
2
__
_
__
_
_
__
__
_
1
2
8

A-1
4
ED
UC
AT
ION
MO
DU
LE
V
illa
ge
ID:
___ _
__ _
__ H
ou
seh
old
Nu
mb
er
___ _
__ _
__
E
D
To
be
ad
min
iste
red
fo
r ev
ery
chil
d i
n t
he
ho
use
ho
ld a
ge
5 t
hro
ug
h 1
2 y
ears
wh
o a
tten
ded
Sch
oo
l a
t a
ny
tim
e du
rin
g 2
00
7-2
008
Sch
oo
l Y
ear
ED 1.
Lin
e
no
.
ED
1A
. N
am
e E
D2.
DU
RIN
G T
HE
CU
RR
EN
T
SC
HO
OL
YE
AR
, W
HIC
H
LE
VE
L A
ND
GR
AD
E IS
(na
me)
AT
TE
ND
ING
?
LE
VE
L:
0 P
RE
SC
HO
OL
1 P
RIM
AR
Y
2 S
EC
ON
DA
RY
3 H
IGH
ER
6
NO
N-S
TA
ND
AR
D
CU
RR
ICU
LU
M
8 D
K
GR
AD
E:
1 CP1…
6CM2
9
8 D
K
ED
3.
DO
ES
(n
am
e)
HA
VE
AC
CE
SS
TO
A C
OM
PLE
TE
SE
T O
F
TE
XT
BO
OK
S
FO
R H
IS O
R
HE
R U
SE?
1
YE
S
2 N
O
ED
5
ED
4.
If y
es:
HO
W D
ID (n
am
e)
OB
TA
IN T
HE
TE
XT
BO
OK
S
TH
AT
HE/S
HE
HA
S?
1 P
RO
VID
ED
BY
SC
HO
OL,
CA
N T
AK
E
HO
ME.
2 P
RO
VID
ED
BY
SC
HO
OL,
CA
N’T
TA
KE
HO
ME.
3 N
EW
LY
BO
UG
HT
FR
OM
SC
HO
OL
4 N
EW
LY
BO
UG
HT
FR
OM
PR
IVA
TE
MA
RK
ET.
5 G
IFT
6 F
RO
M S
IBL
ING
7
BO
UG
HT
US
ED
8
OT
HE
R (
SP
EC
IFY)
ED
5.
IS T
HE
SC
HO
OL
TH
AT
(n
am
e)
AT
TE
ND
S P
UB
LIC
OR
PR
IVA
TE
1 P
UB
LIC
2
PR
IVA
TE,
SE
CU
LA
R
3 P
RIV
AT
E,
RE
LIG
IOU
S
4 K
OR
AN
IC
SC
HO
OL
5 N
ON
FO
RM
AL
SC
HO
OL
6 O
TH
ER
(SP
EC
IFY)
ED
6.
WH
AT
IS
TH
E N
AM
E O
F T
HE
SC
HO
OL T
HA
T
(na
me
) IS
CU
RR
EN
TL
Y A
TT
EN
DIN
G A
ND
IN
WH
ICH
VIL
LA
GE
IS
IT
LO
CA
TE
D?
W
RIT
E T
HE
AP
PR
OP
RIA
TE
CO
DE
ED
7.
HO
W F
AR
AW
AY
FR
OM
YO
UR
HO
ME
IS
TH
E S
CH
OO
L
(na
me
) H
AS
BE
EN
AT
TE
ND
ING
DU
RIN
G T
HE
CU
RR
EN
T
SC
HO
OL
YE
AR
?
(In
terv
iew
er
reco
rd
ob
serv
ati
on
)
ED
8.
HO
W
LO
NG
DO
ES
IT
TA
KE
(na
me
)
TO
TR
AV
EL
TO
HIS
/HE
R
SC
HO
OL?
ED
9.
DID
(n
am
e)
AT
TE
ND
SC
HO
OL
ON
TH
E M
OS
T
RE
CE
NT
DA
Y
TH
E S
CH
OO
L
WA
S O
PE
N,
(DA
Y)?
1
YE
S
ED
11
2
NO
LIN
E
LE
VE
L
GR
AD
E
YE
S
NO
TY
PE
OF
SC
HO
OL
SC
HO
OL
NA
ME
VIL
LA
GE
NA
ME
DIS
TA
NC
E I
N
KM
ON
E W
AY
YE
S
NO
M
INU
TE
S
01
1
2
1
2
02
1
2
1
2
03
1
2
1
2
04
1
2
1
2
05
1
2
1
2
06
1
2
1
2
07
1
2
1
2
08
1
2
1
2
09
1
2
1
2
10
1
2
1
2
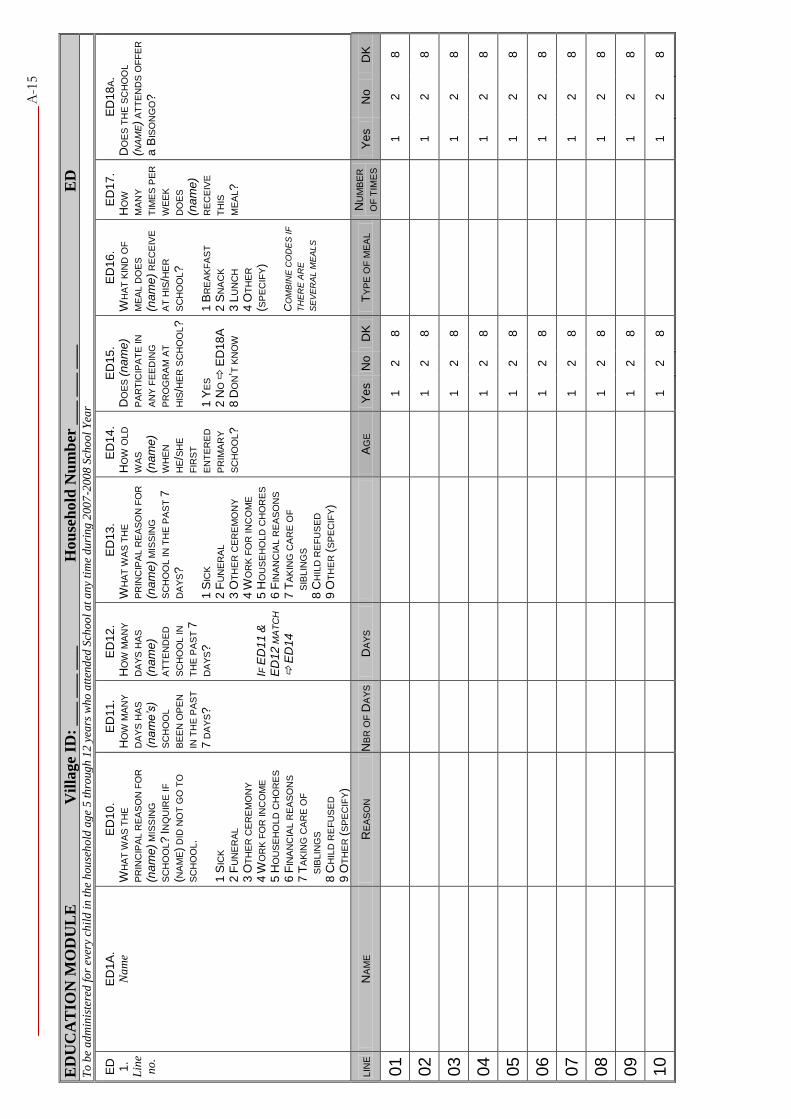
A-1
5
ED
UC
AT
ION
MO
DU
LE
V
illa
ge
ID:
___ _
__ _
__
H
ou
seh
old
Nu
mb
er _
__ _
__ _
__
E
D
To
be
ad
min
iste
red
fo
r ev
ery
chil
d i
n t
he
hou
seh
old
ag
e 5
th
roug
h 1
2 y
ears
who
att
end
ed S
choo
l a
t a
ny
tim
e d
uri
ng
200
7-2
00
8 S
cho
ol
Yea
r
ED 1.
Lin
e
no
.
ED
1A
. N
am
e
ED
10
. W
HA
T W
AS
TH
E
PR
INC
IPA
L R
EA
SO
N F
OR
(na
me
) M
ISS
ING
SC
HO
OL?
IN
QU
IRE
IF
(NA
ME)
DID
NO
T G
O T
O
SC
HO
OL.
1
SIC
K
2 F
UN
ER
AL
3 O
TH
ER
CE
RE
MO
NY
4 W
OR
K F
OR
IN
CO
ME
5 H
OU
SE
HO
LD
CH
OR
ES
6 F
INA
NC
IAL R
EA
SO
NS
7 T
AK
ING
CA
RE
OF
SIB
LIN
GS
8 C
HIL
D R
EF
US
ED
9
OT
HE
R (
SP
EC
IFY)
ED
11
. H
OW
MA
NY
DA
YS
HA
S
(name’s)
SC
HO
OL
BE
EN
OP
EN
IN T
HE
PA
ST
7 D
AY
S?
ED
12
. H
OW
MA
NY
DA
YS
HA
S
(na
me
) A
TT
EN
DE
D
SC
HO
OL
IN
TH
E P
AS
T 7
DA
YS?
IF
ED
11
&
ED
12
MA
TC
H
E
D14
ED
13
. W
HA
T W
AS
TH
E
PR
INC
IPA
L R
EA
SO
N F
OR
(na
me
) M
ISS
ING
SC
HO
OL
IN
TH
E P
AS
T 7
DA
YS?
1 S
ICK
2 F
UN
ER
AL
3 O
TH
ER
CE
RE
MO
NY
4 W
OR
K F
OR
IN
CO
ME
5 H
OU
SE
HO
LD
CH
OR
ES
6 F
INA
NC
IAL R
EA
SO
NS
7 T
AK
ING
CA
RE
OF
SIB
LIN
GS
8 C
HIL
D R
EF
US
ED
9
OT
HE
R (
SP
EC
IFY)
ED
14
. H
OW
OLD
WA
S
(na
me
) W
HE
N
HE/S
HE
FIR
ST
EN
TE
RE
D
PR
IMA
RY
SC
HO
OL?
ED
15
. D
OE
S (n
am
e)
PA
RT
ICIP
AT
E IN
AN
Y F
EE
DIN
G
PR
OG
RA
M A
T
HIS
/HE
R S
CH
OO
L?
1
YE
S
2 N
O
ED
18
A
8 D
ON’T
KN
OW
ED
16
. W
HA
T K
IND
OF
ME
AL D
OE
S
(na
me
) R
EC
EIV
E
AT
HIS
/HE
R
SC
HO
OL?
1
BR
EA
KF
AS
T
2 S
NA
CK
3 L
UN
CH
4
OT
HE
R
(SP
EC
IFY)
CO
MB
INE
CO
DE
S IF
TH
ER
E A
RE
SE
VE
RA
L M
EA
LS
ED
17
. H
OW
MA
NY
TIM
ES
PE
R
WE
EK
DO
ES
(na
me
) R
EC
EIV
E
TH
IS
ME
AL?
ED
18
A.
DO
ES
TH
E S
CH
OO
L
(NA
ME)
AT
TE
ND
S O
FF
ER
a
BIS
ON
GO
?
LIN
E
NA
ME
RE
AS
ON
N
BR
OF
DA
YS
DA
YS
A
GE
Ye
s
No
D
K
TY
PE
OF
ME
AL
NU
MB
ER
OF
TIM
ES
Ye
s
No
D
K
01
1
2
8
1
2
8
02
1
2
8
1
2
8
03
1
2
8
1
2
8
04
1
2
8
1
2
8
05
1
2
8
1
2
8
06
1
2
8
1
2
8
07
1
2
8
1
2
8
08
1
2
8
1
2
8
09
1
2
8
1
2
8
10
1
2
8
1
2
8

A-1
6
ED
UC
AT
ION
MO
DU
LE
V
illa
ge
ID:
___ _
__ _
__ H
ou
seh
old
Nu
mb
er
___ _
__ _
__
E
D
To
be
ad
min
iste
red
fo
r ev
ery
chil
d i
n t
he
hou
seh
old
ag
e 5
th
roug
h 1
2 y
ears
who
att
end
ed S
choo
l a
t a
ny
tim
e d
uri
ng
200
7-2
00
8 S
cho
ol
Yea
r
ED
1.
Lin
e
no
.
ED
1A
. N
am
e
ED
18
B.
DO
ES
TH
E S
CH
OO
L
(NA
ME)
AT
TE
ND
S
OF
FE
R S
EP
AR
AT
E
BA
TH
RO
OM
S F
OR
BO
YS
AN
D G
IRLS ?
ED
18
C.
DO
ES
TH
E S
CH
OO
L
(NA
ME)
AT
TE
ND
S
OF
FE
R S
CH
OO
L
CA
NT
EE
N ?
ED
18
D.
DO
ES
TH
E S
CH
OO
L
(NA
ME)
AT
TE
ND
S
OF
FE
R D
RY
RA
TIO
NS
FO
R G
IRLS
ON
LY?
ED
18
E.
DO
ES
TH
E S
CH
OO
L
(NA
ME)
AT
TE
ND
S
OF
FE
R D
RY
RA
TIO
NS
FO
R G
IRLS
AN
D B
OY
S?
ED
18
F.
DO
ES
TH
E S
CH
OO
L
(NA
ME)
AT
TE
ND
S O
FF
ER
TE
XT
BO
OK
S?
ED
19
. W
HA
T IS
TH
E M
OS
T
IMP
OR
TA
NT
RE
AS
ON
TO
YO
U
FO
R S
EN
DIN
G (
NA
ME)
TO
SC
HO
OL?
1
DIS
TA
NC
E T
O S
CH
OO
L
2 B
ISO
NG
O
3 T
EX
TB
OO
KS
4 S
CH
OO
L C
AN
TE
EN
5
DR
Y R
AT
ION
S
6 S
EP
AR
AT
E B
AT
HR
OO
MS
FO
R
BO
YS
AN
D G
IRLS
7 O
TH
ER
(S
PE
CIF
Y)
ED
20
. W
HA
T IS
TH
E S
EC
ON
D M
OS
T
IMP
OR
TA
NT
RE
AS
ON
TO
YO
U
FO
R S
EN
DIN
G (
NA
ME)
TO
SC
HO
OL?
1
DIS
TA
NC
E T
O S
CH
OO
L
2 B
ISO
NG
O
3 T
EX
TB
OO
KS
4 S
CH
OO
L C
AN
TE
EN
5
DR
Y R
AT
ION
S
6 S
EP
AR
AT
E B
AT
HR
OO
MS
FO
R
BO
YS
AN
D G
IRLS
7 O
TH
ER
(S
PE
CIF
Y)
LIN
E
NA
ME
Ye
s
No
D
K
Ye
s
No
D
K
Ye
s
No
D
K
Ye
s
No
D
K
Ye
s
No
D
K
MA
IN R
EA
SO
N
SE
CO
ND
AR
Y R
EA
SO
N
01
1
2
8
1
2
8
1
2
8
1
2
8
1
2
8
02
1
2
8
1
2
8
1
2
8
1
2
8
1
2
8
03
1
2
8
1
2
8
1
2
8
1
2
8
1
2
8
04
1
2
8
1
2
8
1
2
8
1
2
8
1
2
8
05
1
2
8
1
2
8
1
2
8
1
2
8
1
2
8
06
1
2
8
1
2
8
1
2
8
1
2
8
1
2
8
07
1
2
8
1
2
8
1
2
8
1
2
8
1
2
8
08
1
2
8
1
2
8
1
2
8
1
2
8
1
2
8
09
1
2
8
1
2
8
1
2
8
1
2
8
1
2
8
10
1
2
8
1
2
8
1
2
8
1
2
8
1
2
8

A-1
7
CH
ILD
LA
BO
UR
MO
DU
LE
Vil
lage
ID:
___ _
__ _
__ H
ou
seh
old
Nu
mb
er
___ _
__ _
__
CL
T
o b
e a
dm
inis
tere
d f
or
ever
y ch
ild
in
th
e h
ou
seh
old
ag
e 5
th
rou
gh
12
yea
rs.
NO
W I
WO
ULD
LIK
E T
O A
SK
AB
OU
T A
NY
WO
RK
CH
ILD
RE
N IN
TH
IS H
OU
SE
HO
LD
MA
Y D
O.
CL1
. L
ine
no
.
CL2
. N
am
e
CL3
. D
UR
ING
TH
E P
AS
T W
EE
K,
DID
(n
am
e) D
O A
NY
KIN
D O
F
WO
RK
FO
R
SO
ME
ON
E W
HO
IS
NO
T A
ME
MB
ER
OF
TH
IS
HO
US
EH
OL
D?
If
yes
: F
OR
PA
Y IN
CA
SH
OR
KIN
D?
1
YE
S,
FO
R P
AY
(
CA
SH
OR
KIN
D)
2 Y
ES,
UN
PA
ID
3 N
O
TO
CL5
CL4
. If
yes
:
SIN
CE
LA
ST
(da
y of
the
wee
k),
AB
OU
T H
OW
MA
NY
HO
UR
S D
ID H
E/S
HE
D
O
TH
IS W
OR
K F
OR
SO
ME
ON
E W
HO
IS
NO
T
A M
EM
BE
R O
F T
HIS
HO
US
EH
OL
D?
If
mo
re t
ha
n o
ne
job
,
incl
ud
e a
ll h
ou
rs a
t a
ll
job
s.
CL5
. A
T A
NY
TIM
E D
UR
ING
TH
E P
AS
T
YE
AR
, D
ID (
na
me)
DO
AN
Y K
IND
OF
WO
RK
FO
R S
OM
EO
NE
WH
O IS
NO
T
A M
EM
BE
R O
F T
HIS
HO
US
EH
OLD
?
If y
es:
FO
R P
AY
IN
CA
SH
OR
KIN
D?
1 Y
ES,
FO
R P
AY
(
CA
SH
OR
KIN
D)
2 Y
ES,
UN
PA
ID
3 N
O
CL
6.
DU
RIN
G T
HE
PA
ST
WE
EK,
DID
(n
am
e)
HE
LP
WIT
H
CO
LLE
CT
ING
FIR
EW
OO
D?
CL
7.
DU
RIN
G T
HE
PA
ST
WE
EK,
DID
(n
am
e)
HE
LP
WIT
H
CLE
AN
ING
?
CL
8.
DU
RIN
G T
HE
PA
ST
WE
EK,
DID
(n
am
e)
HE
LP
WIT
H
FE
TC
HIN
G W
AT
ER
?
LIN
E
YE
S
YE
S
NO
. N
AM
E
PA
ID
UN
PA
ID
NO
N
O.
HO
UR
S
PA
ID
UN
PA
ID
NO
Y
ES
NO
Y
ES
NO
Y
ES
NO
01
1
2
3
__
__
_
___
1
2
3
1
2
1
2
1
2
02
1
2
3
__
__
_
___
1
2
3
1
2
1
2
1
2
03
1
2
3
__
__
_
___
1
2
3
1
2
1
2
1
2
04
1
2
3
__
__
_
___
1
2
3
1
2
1
2
1
2
05
1
2
3
__
__
_
___
1
2
3
1
2
1
2
1
2
06
1
2
3
__
__
_
___
1
2
3
1
2
1
2
1
2
07
1
2
3
__
__
_
___
1
2
3
1
2
1
2
1
2
08
1
2
3
__
__
_
___
1
2
3
1
2
1
2
1
2
09
1
2
3
__
__
_
___
1
2
3
1
2
1
2
1
2
10
1
2
3
__
__
_
___
1
2
3
1
2
1
2
1
2
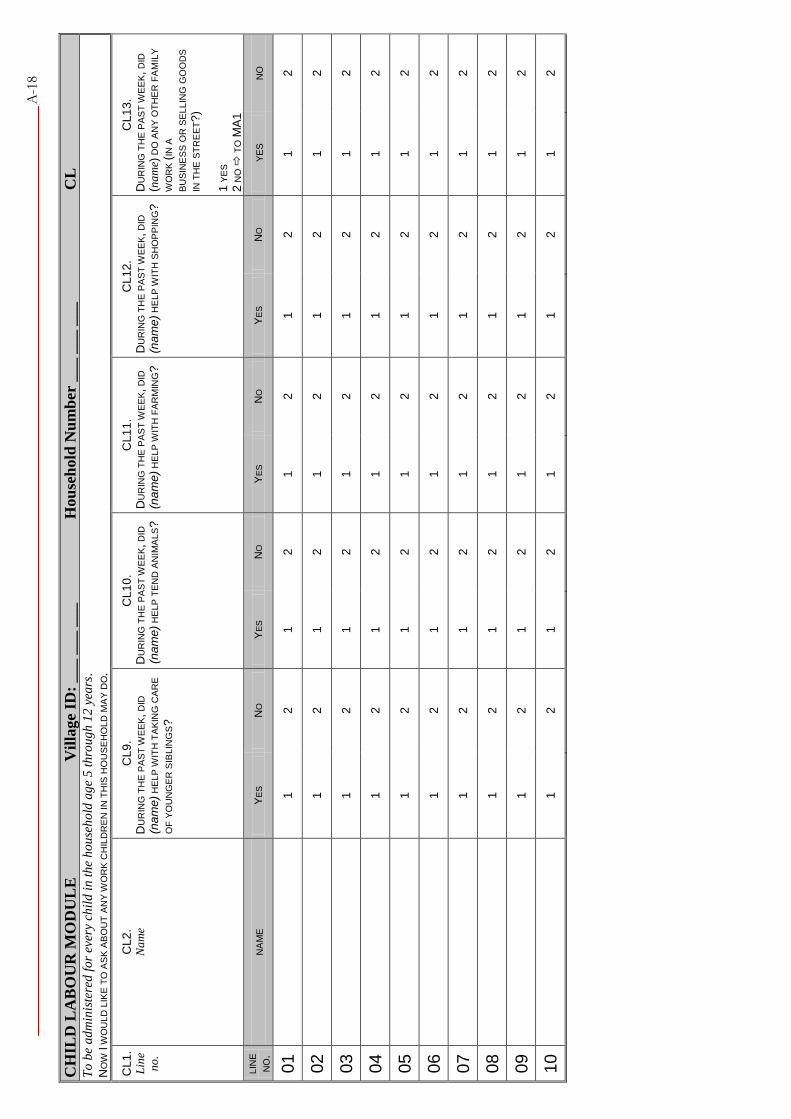
A-1
8
CH
ILD
LA
BO
UR
MO
DU
LE
V
illa
ge
ID:
___ _
__ _
__ H
ou
seh
old
Nu
mb
er
___ _
__ _
__
CL
T
o b
e a
dm
inis
tere
d f
or
ever
y ch
ild
in
th
e h
ou
seh
old
ag
e 5
th
rou
gh
12
yea
rs.
NO
W I
WO
ULD
LIK
E T
O A
SK
AB
OU
T A
NY
WO
RK
CH
ILD
RE
N I
N T
HIS
HO
US
EH
OLD
MA
Y D
O.
CL1
. L
ine
no
.
CL2
. N
am
e
CL9
. D
UR
ING
TH
E P
AS
T W
EE
K,
DID
(na
me
) H
ELP
WIT
H T
AK
ING
CA
RE
OF
YO
UN
GE
R S
IBL
ING
S?
CL1
0.
DU
RIN
G T
HE
PA
ST
WE
EK,
DID
(na
me
) H
ELP
TE
ND
AN
IMA
LS?
CL1
1.
DU
RIN
G T
HE
PA
ST
WE
EK,
DID
(na
me
) H
ELP
WIT
H F
AR
MIN
G?
CL
12
. D
UR
ING
TH
E P
AS
T W
EE
K,
DID
(na
me
) H
ELP
WIT
H S
HO
PP
ING
?
CL
13
. D
UR
ING
TH
E P
AS
T W
EE
K,
DID
(na
me)
DO
AN
Y O
TH
ER
FA
MIL
Y
WO
RK
(IN
A
BU
SIN
ES
S O
R S
EL
LIN
G G
OO
DS
IN T
HE
ST
RE
ET?
) 1
YE
S
2 N
O
TO
MA
1
LIN
E
NO
. N
AM
E
YE
S
NO
Y
ES
NO
Y
ES
NO
Y
ES
NO
Y
ES
N
O
01
1
2
1
2
1
2
1
2
1
2
02
1
2
1
2
1
2
1
2
1
2
03
1
2
1
2
1
2
1
2
1
2
04
1
2
1
2
1
2
1
2
1
2
05
1
2
1
2
1
2
1
2
1
2
06
1
2
1
2
1
2
1
2
1
2
07
1
2
1
2
1
2
1
2
1
2
08
1
2
1
2
1
2
1
2
1
2
09
1
2
1
2
1
2
1
2
1
2
10
1
2
1
2
1
2
1
2
1
2

A-1
9
MA
TH
AS
SE
SS
ME
NT
V
illa
ge
ID:
___ _
__ _
__
H
ou
seh
old
Nu
mb
er _
__ _
__ _
__
MA
T
o b
e a
dm
inis
tere
d t
o e
very
ch
ild
in
th
e h
ou
seh
old
ag
e 5
th
rou
gh
12
yea
rs.
I
AM
[N
AM
E].
I
WO
RK
WIT
H P
AR
EN
TS
AN
D C
HIL
DR
EN
. I
AM
TR
YIN
G T
O L
EA
RN
MO
RE
AB
OU
T T
HE
DA
ILY
LIF
E O
F C
HIL
DR
EN
LIK
E Y
OU
. I
WO
ULD
LIK
E T
O G
IVE
YO
U A
SH
OR
T T
ES
T IN
MA
TH
AN
D F
RE
NC
H. I
AM
GO
ING
TO
RE
AD
YO
U A
SE
T O
F Q
UE
ST
ION
S. Y
OU
SH
OU
LD
GIV
E T
HE
AN
SW
ER
TH
AT
FIT
S B
ES
T.
IF
YO
U D
ON’T
UN
DE
RS
TA
ND
TH
E Q
UE
ST
ION
, I
WIL
L R
EA
D T
HE
QU
ES
TIO
N A
GA
IN. Y
OU
CA
N A
SK
ME
AN
YT
IME
TO
EX
PLA
IN A
QU
ES
TIO
N.
YO
U C
AN
CH
OO
SE
NO
T T
O A
NS
WE
R,
OR
YO
U C
AN
TE
LL M
E I
F A
QU
ES
TIO
N IS
HA
RD
FO
R Y
OU
AN
D W
E W
ILL S
KIP
TH
AT
QU
ES
TIO
N. IF
YO
U L
IKE,
YO
U C
AN
EN
D T
HE
IN
TE
RV
IEW
AT
AN
Y T
IME. D
O Y
OU
UN
DE
RS
TA
ND
?
If t
he
chil
d u
nd
erst
an
ds,
con
tin
ue.
If
th
e ch
ild
do
es n
ot
un
der
sta
nd
, a
sk w
ha
t th
e ch
ild
does
no
t u
nd
erst
an
d a
nd
cla
rify
th
e i
ssu
e fo
r th
e ch
ild
. If
MA
2=
2 a
nd
MA
3=
2,
end
th
e te
st. A
lso
tes
t
chil
dre
n b
etw
een
th
e ag
es o
f 5 a
nd
12
wh
o a
re n
ot
att
end
ing s
cho
ol.
W
E’L
L S
TA
RT
WIT
H T
HE
MA
TH
TE
ST.
MA
1.
Lin
e
no
.
MA
1A.
Na
me
MA
2.
AR
E Y
OU
AB
LE
TO
ID
EN
TIF
Y
TH
E F
OL
LO
WIN
G N
UM
BE
RS?
Sh
ow
Ca
rd
MA
3.
AR
E Y
OU
AB
LE
TO
CO
UN
T
TH
E F
OL
LO
WIN
G IT
EM
S?
A
. F
OU
R D
OG
S
B. S
EV
EN
FIS
H
Sh
ow
Ca
rd
MA
4.
OF
TH
E N
UM
BE
RS
BE
LO
W,
AR
E Y
OU
AB
LE
TO
IDE
NT
IFY
TH
E G
RE
AT
ER
NU
MB
ER
?
A.
7
8
B.
4
5
C.
9
2
Sh
ow
Ca
rd
MA
5.
AR
E Y
OU
AB
LE
TO
CO
MP
LE
TE
TH
E F
OL
LO
WIN
G A
DD
ITIO
N?
A
. 4
+2
=
B. 7
+1
=
Sh
ow
Ca
rd
MA
6.
AR
E Y
OU
AB
LE
TO
CO
MP
LE
TE
TH
E
FO
LLO
WIN
G S
UB
TR
AC
TIO
N?
A. 3
-1=
B
. 8
-5=
S
ho
w C
ard
LIN
E
NO
. N
AM
E
3
9
FO
UR
DO
GS
SE
VE
N F
ISH
7
& 8
4
& 5
9
& 2
4
+2
7+
1
3-1
8
-5
Y
N
Y
N
Y
N
Y
N
Y
N
Y
N
Y
N
Y
N
Y
N
Y
N
Y
N
01
1
2
1
2
1
2
1
2
1
2
1
2
1
2
1
2
1
2
1
2
1
2
02
1
2
1
2
1
2
1
2
1
2
1
2
1
2
1
2
1
2
1
2
1
2
03
1
2
1
2
1
2
1
2
1
2
1
2
1
2
1
2
1
2
1
2
1
2
04
1
2
1
2
1
2
1
2
1
2
1
2
1
2
1
2
1
2
1
2
1
2
05
1
2
1
2
1
2
1
2
1
2
1
2
1
2
1
2
1
2
1
2
1
2
06
1
2
1
2
1
2
1
2
1
2
1
2
1
2
1
2
1
2
1
2
1
2
07
1
2
1
2
1
2
1
2
1
2
1
2
1
2
1
2
1
2
1
2
1
2
08
1
2
1
2
1
2
1
2
1
2
1
2
1
2
1
2
1
2
1
2
1
2
09
1
2
1
2
1
2
1
2
1
2
1
2
1
2
1
2
1
2
1
2
1
2
10
1
2
1
2
1
2
1
2
1
2
1
2
1
2
1
2
1
2
1
2
1
2
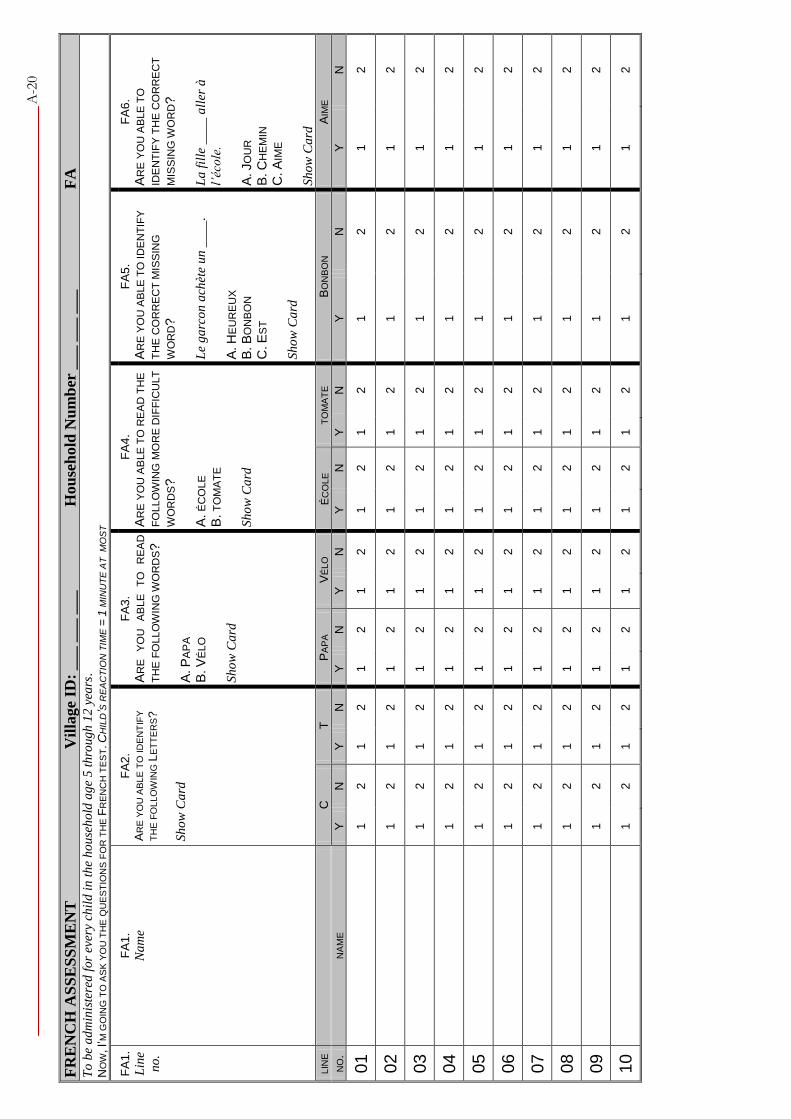
A-2
0
FR
EN
CH
AS
SE
SS
ME
NT
Vil
lage
ID:
___ _
__ _
__ H
ou
seh
old
Nu
mb
er _
__ _
__ _
__
FA
T
o b
e a
dm
inis
tere
d f
or
ever
y ch
ild
in
th
e h
ou
seh
old
ag
e 5
th
rou
gh
12
yea
rs.
NO
W, I’
M G
OIN
G T
O A
SK
YO
U T
HE
QU
ES
TIO
NS
FO
R T
HE
FR
EN
CH
TE
ST. C
HIL
D’S
RE
AC
TIO
N T
IME
= 1
MIN
UT
E A
T
MO
ST
FA
1.
Lin
e
no
.
FA
1.
Na
me
FA
2.
AR
E Y
OU
AB
LE
TO
ID
EN
TIF
Y
TH
E F
OL
LO
WIN
G L
ET
TE
RS?
Sh
ow
Ca
rd
FA
3.
AR
E
YO
U
AB
LE
T
O
RE
AD
TH
E F
OLLO
WIN
G W
OR
DS?
A. P
AP
A
B. V
ÉLO
S
ho
w C
ard
FA
4.
AR
E Y
OU
AB
LE
TO
RE
AD
TH
E
FO
LLO
WIN
G M
OR
E D
IFF
ICU
LT
WO
RD
S?
A.
ÉC
OLE
B
. T
OM
AT
E
S
ho
w C
ard
FA
5.
AR
E Y
OU
AB
LE
TO
ID
EN
TIF
Y
TH
E C
OR
RE
CT
MIS
SIN
G
WO
RD
?
Le
ga
rco
n a
chèt
e u
n _
___
.
A. H
EU
RE
UX
B. B
ON
BO
N
C. E
ST
Sh
ow
Ca
rd
FA
6.
AR
E Y
OU
AB
LE
TO
IDE
NT
IFY
TH
E C
OR
RE
CT
MIS
SIN
G W
OR
D?
L
a f
ille
__
__
all
er à
l’éc
ole
.
A. J
OU
R
B. C
HE
MIN
C
. A
IME
Sh
ow
Ca
rd
LIN
E
C
T
P
AP
A
VÉ
LO
É
CO
LE
TO
MA
TE
BO
NB
ON
A
IME
NO
. N
AM
E
Y
N
Y
N
Y
N
Y
N
Y
N
Y
N
Y
N
Y
N
01
1
2
1
2
1
2
1
2
1
2
1
2
1
2
1
2
02
1
2
1
2
1
2
1
2
1
2
1
2
1
2
1
2
03
1
2
1
2
1
2
1
2
1
2
1
2
1
2
1
2
04
1
2
1
2
1
2
1
2
1
2
1
2
1
2
1
2
05
1
2
1
2
1
2
1
2
1
2
1
2
1
2
1
2
06
1
2
1
2
1
2
1
2
1
2
1
2
1
2
1
2
07
1
2
1
2
1
2
1
2
1
2
1
2
1
2
1
2
08
1
2
1
2
1
2
1
2
1
2
1
2
1
2
1
2
09
1
2
1
2
1
2
1
2
1
2
1
2
1
2
1
2
10
1
2
1
2
1
2
1
2
1
2
1
2
1
2
1
2

A-21
BURKINA FASO SCHOOL QUESTIONNAIRE
SCHOOL INFORMATION PANEL SCH VISITS SHOULD BE MADE IN THE MORNING WHEN SCHOOL IS OPEN AND STUDENTS ARE IN CLASS. COLLECT
INFORMATION FROM MODULES A, B, AND C ON THE FIRST VISIT. THEN, TO FILL OUT THE STUDENT ATTENDANCE
ROSTER, REQUEST THE OFFICIAL ROSTER OF STUDENTS ENROLLED IN THE SCHOOL. ON SUBSEQUENT VISITS, ONLY
COLLECT THE INFORMATION ON THE STUDENT ROSTER.
SCH1. VILLAGE ID: SCH2. SCHOOL ID:
___ ___ ___ ___ ___ ___
SCH3. INTERVIEWER NAME AND NUMBER: SCH4. SUPERVISOR NAME AND NUMBER: NAME ___ ___
NAME ___ ___
SCH5. DAY/MONTH/YEAR OF INTERVIEW: ___ ___ / ___ ___ / ___ ___ ___ ___
SCH6. Province:
PROVINCE:
SCH7. Department:
DEPARTMENT:
SCH8. NAME OF SCHOOL:
______________________________________________________
SCH9. NAME OF RESPONDENT:
______________________________________________________
SCH10. POSITION OF RESPONDENT (CIRCLE ONE): 1 HEAD MASTER 3 TEACHER 2 OTHER ADMINISTRATOR 4 OTHER (SPECIFY______________)
AFTER THE QUESTIONNAIRE FOR THE SCHOOL HAS BEEN COMPLETED, FILL IN THE FOLLOWING INFORMATION:
SCH11. RESULT OF SCHOOL INTERVIEW:
COMPLETED .............................................. 1
EFFORT ENDED ......................................... 2 REFUSED .................................................. 3 SCHOOL NOT FOUND/DESTROYED ............... 4
OTHER (SPECIFY)________________________
INTERVIEWER/SUPERVISOR NOTES: USE THIS SPACE TO RECORD NOTES ABOUT THE INTERVIEW WITH THIS SCHOOL, SUCH AS CALL-BACK TIMES, INCOMPLETE INDIVIDUAL INTERVIEW FORMS, NUMBER OF ATTEMPTS TO RE-VISIT, ETC.
SCH12. DATA ENTRY CLERK:
___ ___

A-22
A: SCHOOL CHARACTERISTICS SC SC1. IS THIS SCHOOL LOCATED IN [VILLAGE NAME]?
YES ................................................................. 1 NO .................................................................. 2
SC2. IS THIS A PUBLIC SCHOOL OR A PRIVATE SCHOOL?
PUBLIC ............................................................ 1 PRIVATE SECULAR ............................................ 2 PRIVATE RELIGIOUS .......................................... 3 OTHER (SPECIFY) .......................................... 96
SC3. IN WHICH YEAR DID THIS SCHOOL FIRST OPEN?
YEAR .................................................... ___ ___
SC4. How many male and female students are enrolled in each grade? How many of these students are repeaters?
Grade Male Students Female Students Male Repeaters Female Repeaters
CP1
CP2
CE1
CE2
CM1
CM2
SC5. HOW MANY WEEKS WAS THIS SCHOOL ACTUALLY
OPEN DURING THE LAST ACADEMIC YEAR?
WEEKS OPEN LAST ACADEMIC YEAR ............................................................ ___ ___ Record 00 if no school was present in previous year.
SC6. WHAT LANGUAGE IS USED FOR ….
MATHEMATICS INSTRUCTION ................... ___ ___ READING INSTRUCTION .......................... ___ ___ GENERAL CONVERSATION ...................... ___ ___
SC7. DURING THIS SCHOOL YEAR, WERE ALL STUDENTS
WHO WANTED TO ENROLL IN THIS SCHOOL ADMITTED?
YES ................................................................. 1 NO .................................................................. 2
SC8. DOES THIS SCHOOL HAVE A FEEDING PROGRAM?
YES ................................................................. 1 NO .................................................................. 2
2SC11
SC9. WHAT KIND OF MEAL OR SNACK DOES THE
SCHOOL OFFER?
BREAKFAST ......................................................1 SNACK .............................................................2 LUNCH .............................................................3 OTHER (SPECIFY .............................................. 4
SC10. WHAT TYPE OF FEEDING PROGRAM IS OFFERED
BY THE SCHOOL?
CANTEEN………………………………………….1 DRY RATIONS……………………………………..2 CANTEEN AND DRY RATIONS…………………….. 3
Other (specify) …………………………….4

A-23
SC11. DOES THE SCHOOL PROVIDE ANY HEALTH
INTERVENTIONS?
YES ................................................................. 1 NO .................................................................. 2
SC12. DOES EACH STUDENT HAVE A COMPLETE SET OF
TEXTBOOKS FOR HIS OR HER USE?
YES, SOLE USE ................................................. 1 YES, SHARED USE ............................................. 2 NO .................................................................. 3
B: SCHOOL PERSONNEL CHARACTERISTICS MODULE SP SP1. HOW MANY TEACHERS ARE CURRENTLY TEACHING
IN THIS SCHOOL, INCLUDING TRAINEES?
TEACHERS ............................................ ___ ___
SP2. HOW MANY OF THESE TEACHERS ARE FEMALE?
FEMALE TEACHERS ................................ ___ ___
0SP4
SP3. HOW MANY FEMALE TEACHERS HAVE RECEIVED A
MERIT-BASED AWARD?
FEMALE TEACHERS WITH MERIT AWARDS ___ ___
SP4. HOW MANY TEACHERS HAVE A POST-SECONDARY
DEGREE?
TEACHERS WITH A POST SECONDARY DEGREE ................................ __ ___
SP5. HOW MANY TEACHERS ARE THERE IN EACH
CATEGORY:
NUMBER OF TITULAIRES ........................ ___ ___ NUMBER OF SUBSTITUTES ...................... ___ ___ NUMBER OF TRAINEES ........................... ___ ___ NUMBER OF ASSISTANT TEACHERS . …….___ ___ NUMBER OF CERTIFIED ASSISTANT TEACHERS___ ___ NUMBER OF PRINCIPAL TEACHERS .......... ___ ___
SP6. Now, I would like some information on the teaching experience of these teachers. How many of these teachers have…
LESS THAN 5 YEARS ............................... ___ ___ 5 YEARS BUT LESS THEN 10 YEARS .......... ___ ___ 10 OR MORE YEARS ............................... ___ ___
SP7. How often is a typical teacher absent?
ONCE PER WEEK ............................................... 1 2-3 TIMES PER MONTH ....................................... 2 ONCE PER MONTH ............................................. 3 LESS THAN ONCE PER MONTH ............................. 4
SP8. How many teachers have received training on treating boys and girls equally in the classroom?
TEACHERS ............................................ ___ ___
C: SCHOOL PHYSICAL STRUCTURE SS SS1. HOW MANY CLASSROOMS DOES THIS SCHOOL
HAVE?
CLASSROOMS ....................................... ___ ___
0 SS8
SS2. HOW MANY CLASSROOMS ARE USEABLE?
USEABLE CLASSROOMS ......................... ___ ___
0 SS8

A-24
SS3. HOW MANY OF THESE USEABLE CLASSROOMS
HAVE A BLACKBOARD?
CLASSROOMS WITH BLACKBOARD ............ ___ ___
0 SS5
SS4. HOW MANY OF THESE USEABLE CLASSROOMS
HAVE A BLACKBOARD THAT IS LEGIBLE TO ALL
STUDENTS?
CLASSROOMS WITH LEGIBLE BLACKBOARD ___ ___
SS5. HOW MANY CLASSROOMS CAN BE USED WHEN IT
RAINS?
CLASSROOMS ....................................... ___ ___
SS6. ARE THERE ENOUGH DESKS AND/OR CHAIRS FOR
ALL STUDENTS IN THIS SCHOOL?
YES ................................................................. 1 NO .................................................................. 2
1SS8
SS7. WHAT PERCENTAGE OF STUDENTS DO NOT HAVE
DESKS OR CHAIRS?
PERCENTAGE WITHOUT DESK/CHAIR ........ ___ ___
SS8. DO ANY CLASSES MEET OUTSIDE BECAUSE OF
LACK OF CLASSROOMS?
YES ................................................................. 1 NO .................................................................. 2
2SS10
SS9. HOW MANY CLASSES MEET OUTSIDE?
CLASSES .............................................. ___ ___
SS10. DOES THIS SCHOOL HAVE A WATER SUPPLY?
YES ................................................................. 1 NO .................................................................. 2
SS11. DOES THIS SCHOOL HAVE TOILET FACILITIES FOR
STUDENTS?
YES ................................................................. 1 NO .................................................................. 2
2SS13
SS12. DO GIRLS AND BOYS HAVE SEPARATE TOILET
FACILITIES?
YES ................................................................. 1 NO .................................................................. 2
SS13. DOES THIS SCHOOL OPERATE A PRESCHOOL
(BISONGOS)?
YES ................................................................. 1 NO .................................................................. 2

A-25
SS14. MAIN MATERIAL OF THE SCHOOL FLOOR:
NATURAL MATERIAL EARTH/SAND ................................................... 11 DUNG ............................................................. 12 RUDIMENTARY MATERIAL WOOD PLANKS ................................................ 21 PALM/BAMBOO ................................................ 22 FINISHED MATERIAL PARQUET OR POLISHED WOOD .......................... 31 VINYL OR ASPHALT STRIPS ................................ 32 CERAMIC TILES................................................ 33 CEMENT ......................................................... 34 CARPET.......................................................... 35 OTHER (SPECIFY) _______________________ 96
SS15. MAIN MATERIAL OF THE SCHOOL ROOF.
NATURAL MATERIAL NO ROOF ....................................................... 11 THATCH/PALM LEAF ......................................... 12 SOD ............................................................... 13 RUDIMENTARY MATERIAL RUSTIC MAT .................................................... 21 PALM/BAMBOO ................................................ 22 WOOD PLANKS ................................................ 23 FINISHED MATERIAL METAL ........................................................... 31 WOOD ............................................................ 32 CALAMINE/CEMENT FIBER ................................. 33 CERAMIC TILES................................................ 34 CEMENT ......................................................... 35 ROOFING SHINGLES ......................................... 36 OTHER (SPECIFY) _______________________ 96
SS16. MAIN MATERIAL OF THE WALLS.
NATURAL MATERIAL NO WALLS ...................................................... 11 CANE/PALM/TRUNKS ........................................ 12 DIRT .............................................................. 13 ADOBE ........................................................... 14 STRAW ........................................................... 15 RUDIMENTARY MATERIAL BAMBOO WITH MUD .......................................... 21 STONE WITH MUD ............................................ 22 PLYWOOD ....................................................... 24 CARTON ......................................................... 25 REUSED WOOD................................................ 26 FINISHED MATERIAL CEMENT ......................................................... 31 STONE WITH LIME/CEMENT ............................... 32 BRICKS........................................................... 33 CEMENT BLOCKS ............................................. 34 WOOD PLANKS/SHINGLES ................................. 36 OTHER (SPECIFY) _______________________ 96

A-26
ST
UD
EN
T A
TT
EN
DA
NC
E R
OS
TE
R
S
CH
C
OM
PLE
TE
TH
IS R
OS
TE
R B
Y R
EC
OR
DIN
G E
AC
H S
TU
DE
NT
EN
RO
LLE
D I
N T
HE
SC
HO
OL.
BE
SU
RE
TO
IN
CLU
DE
S
TU
DE
NT
S IN
A
LL S
HIF
TS.
ON
LY
C
OL
LE
CT
D
AT
A F
OR
P
RIM
AR
Y S
CH
OO
LS.
US
E
AD
DIT
ION
AL S
HE
ET
S A
S N
EC
ES
SA
RY.
DA
TE
OF
VIS
IT
__
_ _
__
/ _
__
___
/ _
__
__
_ _
__
__
_
SC
HO
OL
ID
:
__
_ _
__
__
_
N
AM
E O
F S
CH
OO
L:
_
__
___
___
__
__
___
__
__
___
__
__
__
LIN
E
NO
. S
TU
DE
NT
NA
ME
HO
US
EH
OLD
NU
MB
ER
G
RA
DE
SE
X
AG
E
VIL
LA
GE
NA
ME
N
AM
E O
F
ST
UD
EN
T’S
FA
TH
ER
NA
ME
OF
ST
UD
EN
T’S
MO
TH
ER
IS
TH
E
ST
UD
EN
T IN
SC
HO
OL
TO
DA
Y ?
OF
TH
E L
AS
T 3
DA
YS
TH
E
SC
HO
OL W
AS
OP
EN
, H
OW
MA
NY
DID
TH
E
ST
UD
EN
T
AT
TE
ND
?
HO
W O
FT
EN
DO
ES
TH
E
ST
UD
EN
T U
SU
AL
LY
AT
TE
ND
SC
HO
OL ?
1 A
LW
AY
S
2 O
FT
EN
3
SO
ME
TIM
ES
4
RA
RE
LY
5 N
EV
ER
M F
Y
N
0
1
2
3
1
2
3
4
5
01
1
2
1
2
0
1
2
3
1
2
3
4
5
02
1
2
1
2
0
1
2
3
1
2
3
4
5
03
1
2
1
2
0
1
2
3
1
2
3
4
5
04
1
2
1
2
0
1
2
3
1
2
3
4
5
05
1
2
1
2
0
1
2
3
1
2
3
4
5
06
1
2
1
2
0
1
2
3
1
2
3
4
5
07
1
2
1
2
0
1
2
3
1
2
3
4
5
08
1
2
1
2
0
1
2
3
1
2
3
4
5
09
1
2
1
2
0
1
2
3
1
2
3
4
5
10
1
2
1
2
0
1
2
3
1
2
3
4
5
11
1
2
1
2
0
1
2
3
1
2
3
4
5
12
1
2
1
2
0
1
2
3
1
2
3
4
5
13
1
2
1
2
0
1
2
3
1
2
3
4
5
14
1
2
1
2
0
1
2
3
1
2
3
4
5
15
1
2
1
2
0
1
2
3
1
2
3
4
5

A-27
ST
UD
EN
T A
TT
EN
DA
NC
E R
OS
TE
R
S
CH
CO
MP
LE
TE
T
HIS
R
OS
TE
R
BY
R
EC
OR
DIN
G
EA
CH
S
TU
DE
NT
E
NR
OLLE
D
IN
TH
E
SC
HO
OL
AS
IDE
NT
IFIE
D I
N T
HE
HO
US
EH
OLD
S.
BE
SU
RE
TH
AT
TH
E D
AT
E O
N T
HIS
RO
ST
ER
CO
RR
ES
PO
ND
S T
O
TH
E D
AT
E O
F T
HE
S
CH
OO
L V
ISIT
. O
NL
Y C
OLLE
CT
D
AT
A F
OR
P
RIM
AR
Y S
CH
OO
LS,
BU
T IN
CLU
DE
EA
CH
G
RA
DE.
TH
E
LIN
E
NO
. C
OR
RE
SP
ON
DS
T
O
TH
E
FIR
ST
W
AV
E
OF
T
HE
S
CH
OO
L
SU
RV
EY
RO
ST
ER
, U
NLE
SS
TH
E S
TU
DE
NT
WA
S R
EG
IST
ER
ED
AF
TE
R T
HE
FIR
ST
WA
VE. IF
TH
AT
IS
TH
E C
AS
E,
AS
SIG
N T
HE
S
TU
DE
NT
A
N
EW
N
UM
BE
R.
TH
E F
IRS
T 8
C
OLU
MN
S M
US
T B
E F
ILL
ED
O
UT
B
EF
OR
E
GO
ING
TO
TH
E S
CH
OO
L. U
SE
AD
DIT
ION
AL S
HE
ET
S A
S N
EC
ES
SA
RY.
DA
TE
OF
VIS
IT
__
_ _
__
/ _
__
___
/ _
__
__
_ _
__
__
_
GE
O-R
EF
ER
EN
CE :
LO
NG
ITU
DE :
_
__
___
___
__
__
___
__
__
___
__
__
__
LA
TIT
UD
E :
_
__
___
___
__
__
___
__
__
___
__
__
__
N
UM
BE
R O
F D
AY
S S
CH
OO
L W
AS
OP
EN
IN
:
OC
T :
_
__
___
__
NO
V :
__
____
__
DE
C :
_
__
__
___
JA
N :
_
___
__
__
SC
HO
OL
ID
:
__
_ _
__
__
_
NA
ME
OF
SC
HO
OL:
_
__
___
___
__
__
___
__
__
___
__
__
__
LIN
E
NO
. S
TU
DE
NT
NA
ME
ST
UD
EN
T
HO
US
EH
OL
D
NU
MB
ER
NU
MB
ER
OF
ST
UD
EN
T IN
TH
E
HO
US
EH
OL
D
SE
X
VIL
LA
GE
NA
ME
NA
ME
OF
ST
UD
EN
T’S
FA
TH
ER
NA
ME
OF
ST
UD
EN
T’
S M
OT
HE
R
ST
UD
EN
T
GR
AD
E
IS
ST
UD
EN
T
IN
SC
HO
OL
TO
DA
Y?
OF
TH
E L
AS
T
TH
RE
E D
AY
S
TH
E S
CH
OO
L
WA
S O
PE
N,
HO
W M
AN
Y
DID
TH
E
ST
UD
EN
T
AT
TE
ND
?
HO
W O
FT
EN
DO
ES
TH
E
ST
UD
EN
T
US
UA
LL
Y
AT
TE
ND
SC
HO
OL ?
1 A
LW
AY
S
2 O
FT
EN
3
SO
ME
TIM
ES
4
RA
RE
LY
5 N
EV
ER
NU
MB
ER
OF
DA
YS
TH
E
ST
UD
EN
T W
AS
AB
SE
NT,
PE
R
MO
NT
H,
SIN
CE
TH
E S
TA
RT
OF
TH
E 2
007-2
008
SC
HO
OL
YE
AR
. W
RIT
E Z
ER
O IF
TH
E S
TU
DE
NT
WA
SN
’T A
BS
EN
T D
UR
ING
TH
E
MO
NT
H C
ON
SID
ER
ED
.
WA
S T
HE
ST
UD
EN
T
PR
ES
EN
T A
T
SC
HO
OL O
N
TH
IS D
AY
7
DA
YS
AG
O (
IF
TH
E S
CH
OO
L
WA
SN
’T O
PE
N
ON
TH
AT
DA
Y,
AS
K A
BO
UT
TH
E
PA
ST
6
OR
8
DA
YS)
M F
Y
N
0
1
2
3
1
2
3
4
5
O
CT
NO
V
DE
C
JA
N
Y
N
1 2
1
2
0 1
2
3
1
2
3
4
5
1
2
1 2
1
2
0 1
2
3
1
2
3
4
5
1
2
1 2
1
2
0 1
2
3
1
2
3
4
5
1
2
1 2
1
2
0 1
2
3
1
2
3
4
5
1
2
1 2
1
2
0 1
2
3
1
2
3
4
5
1
2
1 2
1
2
0 1
2
3
1
2
3
4
5
1
2
1 2
1
2
0 1
2
3
1
2
3
4
5
1
2
1 2
1
2
0 1
2
3
1
2
3
4
5
1
2
1 2
1
2
0 1
2
3
1
2
3
4
5
1
2
1 2
1
2
0 1
2
3
1
2
3
4
5
1
2
1 2
1
2
0 1
2
3
1
2
3
4
5
1
2
1 2
1
2
0 1
2
3
1
2
3
4
5
1
2
1 2
1
2
0
1
2
3
1
2
3
4
5
1
2
1 2
1
2
0
1
2
3
1
2
3
4
5
1
2
1 2
1
2
0
1
2
3
1
2
3
4
5
1
2

A-28
APPENDIX 5
REQUEST FOR PROPOSAL FOR DATA COLLECTION
REQUEST FOR PROPOSALS (RFP) TO COLLECT DATA FOR THE EVALUATION OF
BURKINA FASO’S TCP PROGRAM TO INCREASE GIRLS SCHOOL ENROLLMENT
A. Background Information
1. Introduction
The Millennium Challenge Corporation (MCC) has funded a two-year Threshold Country Plan to increase girls‟ educational attainment in Burkina Faso via the construction of schools and complementary interventions. USAID is overseeing implementation of the plan for MCC and has engaged international and local non-governmental agencies to implement the girls‟ educational program.
Mathematica Policy Research (MPR) has been contracted as the independent evaluator of the program
and is conducting a rigorous evaluation of the overall impact of the program. As part of the evaluation, MPR is seeking an organization that can work under strict deadlines to collect reliable, high-quality data from villages affected by the intervention and comparison villages selected by MPR as part of the research design.
2. Description of the Intervention
As part of Burkina Faso‟s Threshold Country Program (TCP), a pilot program has been established in 49 departments in 10 provinces that have the lowest girls‟ primary school attendance rates in the country (Banwa, Gnagana, Komandjari, Namentenga, Oudalan, Sanmentenga, Seno, Soum, Tapoa, and Yagha). Within these provinces, 132 villages have received (or will be receiving) a variety of interventions promoting girls‟ primary school completion rates. These interventions include the construction of „girl-friendly‟ schools (BRIGHT schools), the construction of childcare facilities, a societal awareness campaign, training to increase the literacy of mothers, a girls mentoring program, the provision of textbooks, and take-home dry rations for girls.
3. Research Strategy and Data Collection Options
MPR has proposed the use of a regression discontinuity (RD) design to estimate the impact of the package of interventions using the sample of 293 communities (“study” villages) who applied for BRIGHT schools. Ministry of Education staff scored each of these communities based on pre-set criteria to target communities who could benefit most from the schools. The RD design would compare the 132 “treatment” communities with the highest scores to the 161 communities that were not selected for school construction, statistically accounting for the application score.
B. Description of Expected Activities
The objective of this RFP is to identify a contractor to implement the household and school level surveys for the impact evaluation of the BRIGHT school project. The data collection firm will take charge of all aspects of implementing the survey, as well as entering and cleaning the data. MPR is seeking proposals to carry out three data collection tasks:
Task 1 - Household survey in 10 villages (February-April 2007). The selected data collection firm will conduct household surveys in 10 villages out of the 293 villages that form part of the study (5 treatment and 5 control). The firm will do a quick census of the village to identify which

A-29
households have school-age girls. It will then conduct a 20-minute survey on a sample of households that have school-age girls.
Task 2 - School surveys in 293 communities (October 2007-April 2008). For each of the 293 villages that form part of the study, the data collection firm will conduct several visits to all schools in the village and within 10 kilometers of the village. We estimate this will amount to an average of three schools per village. During the first visit, the data collection firm will collect information about the school and on the students who attended school on the day of the visit. During subsequent visits, the firm will only collect information on who attended school on the day of the visit. One of the subsequent visits will occur at the same time as the household survey in Task 3.
Task 3 - Household survey in 293 villages (January-April 2008). The data collection firm will use a similar procedure as in Task 1, but for the 293 villages that form part of the study. It will conduct a quick census on every village and then interview a sample of households with school-age girls. The questionnaire will be an expanded version of the one used in Task 1. We anticipate it will take approximately 40 minutes to complete the survey (and certainly no longer than 60 minutes).
The surveys will include the following modules:
A. For the household survey 1. Summary and interview characteristics 2. Household location 3. Household members (roster) 4. Education, school attendance 5. Household assets, income
B. For the school survey
1. General information on the school 2. Characteristics of the school including:
a. Human resources (number and qualification of the teachers) b. School performance (student progression from one grade to the next)
3. Student academic records (if available) 4. Student attendance records kept by the school 5. Names and basic identifying information of the students in attendance on the day of the visit
Responsibilities 1. MPR will:
(a) Provide the data collection firm with a questionnaire in English for each of the surveys (b) Provide the data collection firm with the list of the 293 villages that will form part of the study
(Task 3) and the list of 10 villages for Task 1
2. The tasks of the data collection firm are the following: (a) Translate and pretest the questionnaire (The questionnaire must be translated into the most
commonly spoken languages in the villages that are part of the study) (b) Write the Terms of Reference, the contracts for the field enumerators and controllers (c) Hire and train the field enumerators and controllers (d) Assure the proper dispatching of the field enumerators and controllers on the survey sites (e) Undertake field supervision during the data collection to identify and correct eventual problems (f) Maintain constant communication with the MPR team by sending biweekly reports on response rates
and rapidly communicating any problems encountered

A-30
3. The contractors shall deliver the following for each of the surveys (see schedule below): (a) A completed survey manual (b) A training manual just before the training starts (c) A cleaned dataset (in an electronic support), with a code book (d) Basic tables summarizing for each table, the mean, the variance and response rate (e) A report documenting the survey process (f) A packet containing the physical surveys
C. Schedule of Deliverables
Task Due Date Deliverable
1 March 20, 2007 Survey manual (3a)
1 March 28, 2007 Training manual (3b)
1 May 15, 2007 Cleaned data set, Summary Tables,
Documentation, Surveys (3c, 3d, 3e, 3f)
2 October 15, 2007 Survey and training manuals (3a and 3b)
2 December 15, 2007 Clean file containing attendance data from first
visit
3 January 4, 2008 Survey manual (3a)
3 January 4, 2008 Training manual (3b)
3 June 1, 2008 Cleaned data set, Summary Tables,
Documentation, Surveys (3c, 3d, 3e, 3f)
D. Proposal Submission
We request a technical and a financial proposal. The technical proposal (no more than 15 single-spaced pages) should specify how the contractor plans to conduct the work. In particular, the contractor should specify how it plans to collect the household data (specifying proposed procedures for identifying households with school-age girls, selecting samples of households with school-age girls to be interviewed, interviewing households, etc.), and how it plans to collect school-level data (specifying proposed procedures for gaining access to school information, collecting school attendance records, etc.). The financial proposal should specify the budget for each of the tasks described above, under one of the following two scenarios:
Task Scenario 1 Scenario 2
Task 1 30 households per village 50 households per village
Task 2 3 visits to each school 5 visits to each school
Task 3 30 households per village 50 households per village
a
Keeping in mind the fact that the first phase of the investigation covers 10 villages, and the second and
third phases cover 293 villages.
The two proposals (technical and financial) should be submitted electronically to Ankur Sarin ([email protected]) before February 20, 2007. Questions should also be submitted to this same address before February 15, 2007.

A-31
E. Selection Criteria
The technical proposal will be evaluated in terms of the following criteria:
Organizational experience conducting similar work: 40 points
Qualifications of key staff that will participate in the study: 20 points
Technical quality of proposed work plan (expected response rates, procedures to ensure accuracy of the data, procedures to ensure timely delivery of output, etc): 40 points

A-32
APPENDIX 6
TRAINING MANUAL USED FOR DATA COLLECTION
MCC HOUSEHOLD SURVEY MANUAL INTERVIEWER TRAINING DOCUMENT
HOUSEHOLD CHARACTERISTICS MODULE
FORM HC
Objectives The objectives for this form are as follows:
Locate the household: village, province, department (community);
Identify the head of household;
Collect baseline demographic information such as head of household’s education age and sex, size of household;
Identify the interviewer and the field supervisor;
Describe the household dwelling;
Obtain estimates of the desirable amount of education for girls and boys;
Do a general assessment of how the overall questionnaire will be administered.
Person to Interview The person used most frequently is the head of household, but another person that is well informed can also serve as the respondent. The person interviewed must always be a member of the household.
Definition of a Household In this study, the household is defined as a group of people, living together (in a shared physical space), working together under the direction of a person called the head of the household and taking their meals together or from the same food supply. The members of the household must have lived together for at least 9 months out of the past 12 months. We will avoid counting transient people as members of the household. Here are some examples of households:
(i) A household made up of a man and his wife (his wives) along with their children, the husband’s father/mother, a brother or other people linked either by family ties or not ;
(ii) A household composed of only one person; (iii) A household comprised of several couples, with or without their children.

A-33
All the people that are listed but absent from the household during at least 3 consecutive months in the year are not considered to be members of the household, except in the following cases: a. The person is designated as the head of household, even if he (or she) was absent more than 3 months. b. Students, pupils and seasonal workers provided that they are not incorporated into another household
elsewhere.
Instructions for Administering the Module Particular attention should be paid to filling out this form, as it forms the base upon which the rest of the survey is built. Honor the assigned numbers. After finishing the household questionnaire, complete the information for HC27 and HC28.
Questions HC1 Note the village identification number. HC2 Note the Household number. HC3 Information about the interviewer. Note the name and the number of the Interviewer. HC4 Information on the field supervisor. Note the name and the number of the Field Supervisor. HC5 Date of the interview. Note the Day, the Month and the Year of the interview. HC6 Province. Note the province in which the village is located. HC7 DEPARTMENT. Note the department in which the village is situated. . HC 8 Name of the head of household. Write the name of the person interviewed. HC9 Link between respondent and the head of household. Choose the correct link between the
respondent and the head of household from the provided list. Do not create a new code. HC10 The head of household’s sex. Circle the appropriate code. HC11 Head of household’s age. Ask for supporting documents if they exist and record the age in full
years. HC12 Education of head of household. Ask for the highest level of education that the head of
household has completed, circle the appropriate code and write the level reached. He could have attended (preschool, primary school, secondary school, high school, informal school).
HC13 Geographic reference point of household. With the help of a GPS, locate the household by
writing its longitude and latitude coordinates. The school attended by the household children should also be positioned.
HC14 Total number of household members. Write the total number of people that make up the
household. See the definition of household on page 2. HC15 Total number of children under 18 years old in the household. Write the number of members of
the household that are less than 18 years old. HC16A What is the head of household’s religion? Circle the appropriate code.

A-34
HC16B What is the head of household’s native language ? Circle the appropriate code. HC16C What ethnic group does the head of household identify with ? Circle the appropriate code. HC17A Principal material of the dwelling floor. Identify the principal material of the household’s
principal dwelling’s floor (the head of household’s home) and circle the appropriate code. HC17B Principal material of the dwelling roof. Identify the principal material of the household’s
principal dwelling’s roof (the head of household’s home) and circle the appropriate code. HC18 How many of these goods do the members of your household possess ? Write the number of
each good owned by the collective household members. Asking the number of goods listed is sufficient.
HC19 What is the principal source of drinking water for members of your household during the rainy
season ? Circle the appropriate code. HC20 Who usually goes to get the water for your household? Circle the code corresponding to the
person who is usually responsible for going to get the water for the household. HC21 How long have you lived continually in this village (this sector if it’s in an administrative center
of a department) ? The question pertains to the collective household. Write the number of years and circle the code specifying whether or not the household is established in a permanent manner (Always) or impermanent (Periodic).
HC22 At what age should girls stop going to school ? If the head of household thinks that girls in his
household (or even girls in general) should stop going to school at a given age, write this age. If the girls in the household do not go to school at all, write zero. If there is no age limitation for girls, write 99.
HC23 At what age should boys stop going to school ? If the head of household thinks that the boys in
his household (or even boys in general) should stop going to school at a given age, write this age. If the boys in the household do not go to school at all, write zero. If there is no age limitation for boys, write 99.
HC24 Are there children in this household who go to a preschool (BISONGO). Circle the appropriate
response (Yes or No). HC25 Are there women in this household who participate in a mother’s literacy program. Circle the
appropriate response (Yes or No). HC26 Have you recently heard about the advantages of education for girls. Circle the appropriate
response (Yes or No). HC27 Result of the household interview. Circle the code corresponding to the interview result. HC28 Interviewer/field supervisor notes. Space to use for entering information about the household
interview. Note observations about the interview with this household, such as time of reminder calls, incomplete components, Number of attempted rescheduled visits, etc.
HC29 Data entry person. Write the code when the form is collected.

A-35
LIST OF HOUSEHOLD CHILDREN FROM 5 TO 12 YEARS OLD MODULE
FORM HL
Objectives This form provides information on children from 5 to 12 years old living in the household. It collects data relevant to the children’s sociodemographic characteristics (sex, age, education, familial link, health).
Instructions for Administering the Module Particular attention should be paid to filling out this form, as it is the base upon which the rest of the survey is built. Honor the assigned numbers in HL1 and HL2. This pertains to children between the ages of 5 and 12 years old exclusively. The respondent for these questions should be the most well informed person with regards to the household composition. To administer this form efficiently, it is recommended that you start by filling out columns HL1 and HL2 completely with the names numbers and names of children in the household between 5 and 12 years old. Find out if there are other people at least 5 to 12 years old living in the household, even if they are not part of the family, don’t have relatives in the household or are absent at the moment. This form includes children who are absent from the household for reasons involving school or travel outside the village Once the list of children is finished, complete the columns pertaining to links with the head of household (HL3), sex (HL4), and age (HL5) for all the children listed. After filling out these columns, proceed next to columns (HL7), (HL8) and (HL9) pertaining to the child’s level of schooling, their attendance at school and preschool in the 2007-2008 school year, and to the reason the child eventually stopped attending.
Questions HL1 Line no. Number of the line. Assign a number for each child. This number is important and
must be used for the remainder of the questionnaire. HL2 Name. Write the child’s name. It must be used for the remainder of the survey in relation with
the assigned number. HL3 Link. This pertains to the link between the child and the head of household. Write the code
(bottom of questionnaire HL) for the link between the head of household and the child. HL4 Sex of the child. Circle the appropriate code. HL5 Age of the child. Note the age of the child in full years past. Refer to the date of their last
birthday is necessary. HL6 Level of education. Write the corresponding codes for the child’s level of education and the
highest grade he reached. Choose the appropriate code for the grade, from 1 to 6 for CP1 to CM2, and also from 1 to 6 for the first through the sixth year of informal education or for preschool.
HL7 School attendance 2007-2008. With this question we are trying to find out if the child attended
during the 2007-2008 school year (current school year) even if they stopped attending subsequently. If the answer is Yes, proceed to question ED1. If the answer is No, continue with question HL9, then with question CL1 since questions ED1 through ED20 are not relevant to this type of child.
HL8 Reason for non-schooling. Note the principal reason that the child did not go to school in this
school year, 2007-2008. Write the appropriate code.

A-36
EDUCATION FOR CHILDREN FROM 5 TO 12 YEARS MODULE
FORM ED10-ED18A: EDUCATION OF CHILDREN FROM 5 TO 12 YEARS OLD
Objectives The purpose of this form is to collect information on
The type of education and the level of education for household members from 5 to 12 years old who are going to school or went to school in 2007-2008 (both traditional and informal school) (ED2).
The cost of attending school in the current school year (ED3-ED5).
Funds allocated, school attendance and reasons for absenteeism (ED6-ED8).
Instructions for Administering the Module In columns ED1 and ED1A, faithfully report first the identification numbers and the names of children enrolled at the school as assigned in form HL (HL1 and HL2). Next, proceed to the administration of the form. This form must be completed for the group of household members between the ages of 5 and 12 years old who are attending school or have attended school in 2007-2008, including those taught to read and write in 2007-2008. The person who answers these questions should be the most well-informed about the student’s education and how it is funded.
Questions ED1 and ED1A Diligently report the identification numbers and names of the children attending the school as
assigned in form HL (HL1 and HL2). ED2 Note the type of school that the child attended in the current school year. He could have
attended (preschool, primary school, secondary school, high school, informal school). Write in the appropriate code. Next, write the grade that the child reached. For the grade code, write 1 to 6 for CP1 to CM2.
ED3 Does he or she have a full set of textbooks for his or her own use? Note if the child has full sets
of textbooks (that is, they have the minimum required). If not, move on to ED5. If the answer is yes continue with ED4. Circle the appropriate code.
ED4 How were the textbooks obtained ? Note how these textbooks were acquired. This could mean
they were a school loan (access on site, bring home), new purchase (at school, at the market), gift, passed down from relatives, used textbooks. Write the appropriate code.
ED5 Type of school. Write the code corresponding to the type of school the student attends. Write
the appropriate code. ED6 Name of the school. Write the code corresponding to the school the child attends and the code
corresponding to the name of the village in which the school is located. Refer to the School codes in the School questionnaire.

A-37
ED7 Distance to the school. Write the distance that separates the child’s home from the school that he attends in Kilometers. Use decimals when necessary, especially when the distance is less than 1 km (in .2km; .6km; .4 km; 2.5 km).
ED8 Time to get to school. Note the time it takes for the child to cover the distance separating his
home from school, one way. Write the time in minutes. ED9 Presence at school the previous day. This pertains to whether or not the child was at school on
the last day that the school was open. For example, if the interview takes place on a Friday, and school was open Wednesday and closed Thursday, the question refers to Wednesday. Write the appropriate code. If the answer is Yes, go to question ED11. If the answer is no, continue to question ED10.
EDUCATION OF CHILDREN FROM 5 TO 12 YEARS OLD SUB-MODULE
FORM ED10-ED18A
Objective The purpose of this form is to collect information about:
The reasons that children from 5 to 12 years of age are absent from school (traditional school and informal school).
The number of days they are absent
The number of days school is open
The school’s feeding programs.
Instructions for Administering the Module Faithfully record the names and identification numbers assigned in columns ED1 and ED1A before completing the form. This form must be filled out for all children in the household between 5 and 12 years old. The respondent for these questions should be the most well informed with regards to the student’s education and how it is funded.
Questions ED1 and ED1A Should match HL1 and HL2. ED10 and ED13 These two questions pertain to the reasons that the child missed school. Keeping the time period
in mind, note the principal reason for the child’s absence (illness, funeral, other ceremony, work, financial reason, etc.)
ED11 Note the number of days out of the last seven that the school was open. ED12 Note the number of days that the child attended classes in the last 7 days. If your answers are
similar to ED11, go to ED14. ED14 Note the child’s age when they began attending primary school.

A-38
ED15 Note whether the child participates in any kind of feeding program at school. If the answer is “no” go directly to CL1. If it’s yes, continue to ED16.
ED16 Note the type of meal or snack (Breakfast, Snack, Lunch) that the child receives at school. ED17 Note the number of times that he (she) receives these meals each week. ED18A Report if the school that the child attends offers a Bisongo (daycare).
SCHOOL FEEDING PROGRAM SUB-MODULE
FORM ED18B-ED20: SCHOOL FEEDING PROGRAM
Objective This form gathers information about the school’s feeding program
Instructions for Administering the Module Faithfully report the names and identification numbers assigned in form HL (HL1 and HL2), in particular questions ED1 and ED1A and proceed with administering the form. This form must be completed for all children in the household between the ages of 5 and 12 years old. The respondent for these questions should be the most well informed with regards to the school’s feeding programs.
Questions ED1 and ED1A Should match HL1 and HL2. ED18B State if the school attended provides separate bathrooms for boys and girls. ED18C Note if the school attended provides a school cafeteria. ED18D State if the school attended provides dry rations for girls exclusively. ED18E Note if the school attended provides dry rations for girls and boys. ED18F State if the school attended provides textbooks. ED19 Note the most important reason for sending the child to school. Note the appropriate code. ED20 Note the second most important reason for sending the child to school. Note the appropriate
code.

A-39
CHILDREN’S SCHOOL PERFORMANCE SUB-MODULE
FORM MA: MATH TEST
Objective The purpose of this form is to test the child’s aptitudes and abilities in math. The questions are for all children in the household between the ages of 5 and 12 years old who are attending school.
Instructions for Administering the Module It is recommended that you isolate the child, if you do not need an interpreter. The interpreter must only translate the question asked, and should not guide the child’s answer. The surrounding environment at the time of this test could have either a positive or negative influence on the child’s answer or on the amount of time it takes. The child should give his name and you will explain the purpose of the meeting to him. Explain what you expect of him (to give him a simple math test which he will answer). Record his answer exactly.
Questions MA1 Reserved for the identification number of the child being tested. MA1.A Write the child’s name. MA2 This question shows if the child is capable of identifying certain numbers. Show the child the
card with numbers written on it and note the child’s response. MA3 This is to determine if the child can count. Show the card with different items on it and note the
child’s answer. MA4 This is to determine if the child is capable of rank ordering numbers. Show the child the card
and note the child’s answer. MA5 and MA7 These two questions determine if the child is capable of doing simple calculations (addition and
subtraction). After showing the child the card, note his or her response.
FORM FA: FRENCH TEST
The purpose of this form is to test the child’s aptitudes and abilities in French. The questions are for all children in the household between the ages of 5 and 12 years old who are attending school.
Instructions for Administering the Module It is recommended that you isolate the child, if you do not need an interpreter. The interpreter must only translate the question asked, and should not guide the child to a given answer. The surrounding environment at the time of this test could have either a positive or negative influence on the child’s answer or on the amount of time it takes. The child should give his name and you will explain the purpose of the meeting to him. Explain what you expect of him (to give him a simple French test which he will answer). Record his answer exactly.

A-40
Questions FA1 Reserved for the identification number of the child being tested. FA1.A Write the child’s name. FA2 This question determines if the child is capable of identifying letters. Show the card with letters
written on it and note the child’s answer. FA3 and FA4 This determines if the child knows how to read. Show the card with different words on it and
note the child’s response. FA3 and FA4 This determines if the child is capable of identifying the missing word in a sentence. Read the
incomplete sentence, show the child the list of words including the missing word, and note the child’s response.
CHILDREN’S WORK SUB-MODULE: FORM – CL3-CL8 (CHILDREN’S WORK)
Objective The main objective of the form is to evaluate the types of work that children can do (agricultural activities, non agricultural, domestic, paid or unpaid) and the time children in the household spend working.
Instructions for Administering the Module This form is for all the children in each household (both in school and not in school) between the ages of 5 and 12 years old. For children younger than 5 years old or older than 12 years old, leave the lines blank. There are two time periods to account for, last week and last year.
Questions CL1 Reserved for the identification number of the child in question. CL2 Write the child’s name. CL3 This is to determine if the child has worked for someone outside of the household during the
past week. If the answer is affirmative, find out if the work is paid (in cash or in kind) or not. If not go to CL5.
CL4 This is to determine how much time the child spent doing this work in the last week (for
someone who is not a member of the household). If the child had more than one job, include the hours worked for all jobs.
CL5 This is to determine if the child did any work for someone outside of the household over the
past year. If the answer is yes, find out if the work was paid (in cash or in kind) or not. CL6-CL8 These questions return to the child’s participation (help), in the past week, in completing
household jobs such as, respectively, collecting firewood, cleaning, and collecting water.

A-41
CHILDREN’S WORK SUB-MODULE
FORM CL9-CL14: CHILDREN’S WORK
Objectives The principal objective of this form is to learn about the types of work and errands that children did in the past year.
Instructions for Administering the Module This form is intended for all the household children (both those enrolled in school and not enrolled in school) between the ages of 5 and 12 years old. For children less than 5 years old or more than 12 years old, leave the lines blank. The time period in question is the past week.
Questions CL 1-CL2 Reserved for the child’s identification number and name. CL9-CL12 This is to determine if the child has, in the past week, helped with the activities specified in each
column. CL13 This is to determine if the child has performed any other family work (in the field, in business, or
selling goods on the side of the road). If the answer is negative, go to MA1. CL14 Here you must evaluate the time it takes to carry out the types of work described in CL13.
SCHOOL IDENTIFICATION MODULE
GENERAL SCHOOL INFORMATION SUB-MODULE
FORM SCH: TABLE OF SCHOOL INFORMATION
The visits should be done in the morning once school is open and students are in class. Collect information for modules A, B, and C. Then, to complete the table of student registration information, use the school’s official records of enrolled children.
Objective This form is intended for the head of the school. The objectives for this form are as follows:
Locate the school (village, province, department, name and id of school);
Identify the head of the school;
Identify the people that are responsible for completing the form (interviewer and supervisor)
Identify the respondent and their role within the school.
Provide a general assessment of how the form was administered.

A-42
Instructions for Administering the Form The person to interview is the head of the school, meaning the person that directs the school.
Questionnaire SCH1 Note the village identification number. SCH2 Put the school identification number. SCH3 Interviewer information. Note the name and the number of the interviewer responsible for
completing the form. SCH4 Information on the field supervisor. Note the name and number of the Field Supervisor in this
zone. SCH5 Date of the interview. Note the Day, the Month and the Year of the interview. SCH6 Province. Note the province in which the village is located. SCH7 Department. Note the department in which the village is situated. SCH 8. Name of the school. Write the name of the school being investigated. SCH9 Name of respondent. This means the name of the person being interviewed. SCH10 Respondent’s position. This involves circling the position (title, role) of the respondent using the
codes cited on the research form. SCH11 Assessment of the interview relative to form SCH. This pertains to the relevance of the
questions asked. This must be filled out after questions SCH1-SCH10 with respect to the codes. Make notes on your general assessment of the interview on form SCH relative to the codes chosen on the form.
SCH12 You must use this space (Interviewer, field supervisor) record any notes (comments) from the
interview on the first questions (SCH1-SCH11). These notes pertain to the time of callbacks, any incomplete information, the number of failed attempts at setting up an interview, etc.
SCHOOL CHARACTERISTICS MODULE
FORM SC
Objective The purpose of this form is to collect the following information:
The school’s location.
The school’s governing rules and status.
School operations
Funds and scholarships.

A-43
Instructions for Administering the Module This firm must be completed with the head of the school or, if the school head is absent, with a teacher that is well informed about the school.
Questions SC1 Location of the school. After noting the name of the village, say whether or not the school is
located in that village. SC2 School status. Ask for the school status, that is to say whether it is a public, private, secular or
religious school. Choose the corresponding code for this status. If the school in question is not identified on this list, clearly describe the type of school.
SC3 School opening. The date that this school opened. Write the year that the school opened for the
first time. SC4 Number of students. The purpose of this question of to take a census of all students in the
school. You must note the grade (CP1 to CM2), the number of students by sex, as well as the number of students held back by sex and class.
School status Ask the school status, that is whether this is a public, private, secular or religious school. Choose
the corresponding code for this status. If the school in question is not identified on this list, clearly describe the type of school.
SC5 Note the number of weeks during which the school was open in the past year. Put 00 if no
school was open in the past year. SC6 Language used. This pertains to the language used by the teachers in different classes. Ask the
language used to teach the different subjects. The language may differ depending on the subject. Note the language used to teach math, reading, and the language used in a general manner.
SC7 Capacity. Note if all the students who wanted to wanted to register for this school over the
course of the current school year were able to find a space at the school. SC8 Feeding program. This aim here is to find out if the school has a feeding program for students.
That is to say, does the school provide meals for students? If the answer is no proceed to question SC11. If yes continue to SC9.
SC9 Type of meal. Note the type of meal or snack (breakfast, snack, lunch) that the child receives at
school. SC10 This pertains to the type of feeding program offered at the school. There may be several. Note
the corresponding type (cafeteria, dry rations, cafeteria and dry rations, other). SC11 Health interventions. These interventions might include vaccinations, distributing medicine, etc.
Choose the appropriate code. SC12 Textbooks for usage. Write the appropriate code for the rules concerning textbook usage.

A-44
SCHOOL PERSONNEL CHARACTERISTICS SUB-MODULE S
FORM SP
Objective The purpose of this form is to collect information on the school’s teachers, particularly their number and their professional experience.
Instructions for Administering the Module This form must be completed for all teachers in the school. This should be done whether they are permanent, substitutes, or absent. The respondent (preferably the head of the establishment) for these questions must be the most well informed person with regard to the different teachers.
Questions SP1 Number of teachers. Note the number of teachers in the school (permanent, substitutes, student
teachers, etc.) SP2 Gender. Note the number of female teachers in the school. If the number of teachers is zero,
skip to SP4. SP3 Awards. Write the number of teachers who have received a merit-based award. SP4 Diploma. The subject of this question is to see the teachers’ education level. Note the number of
teachers who have a high level of education. SP 5 Category. Note the number of teachers in each category as described on the form. SP 6 This question is to determine the numbers of years of experience teachers have. There are three
levels (less than five years, from 5 years to less than 10 years and 10 years and more). Note the number of teachers in each level.
SP7 Teacher attendance. Note the number of times that a teacher is typically absent by period (see
codes). SP8 Write the number of teachers who have received training on equal treatment for boys and girls.
PHYSICAL STRUCTURE OF THE SCHOOL SUB-MODULE
FORM SS
Objective This form lists information about the capacity and structure of the school. It should be completed with the head of the school. It collects information about the number and the type of classes, the existence of latrines, and school construction materials.
Instructions To complete this form, you are advised to interview a person that is well informed on the subject, particularly the head of the school.

A-45
Questions SS1 Note the number of classrooms in the school (what state the classroom is in and whether it is
used or not). SS2 Note the number of classes that are usable. SS3 Note the number of classrooms that have a usable blackboard (this pertains to all the classrooms
in the school). SS4 Note the number of usable classrooms that have a blackboard that is visible to all students. SS5 Note the number of classrooms that can be used when it is raining. SS6 Note if all the students have desks. If yes skip to question SS8 and if no continue to SS7. SS7 Note the percentage of students that do not have desks. SS8 Are any classes held outside due to lack of rooms. If not go to question SS10. If yes, continue
with SS9. SS9 Note the number of classes that are held outside. SS10 Note if the school has access to a source of drinking water. SS11 Note if the school has bathrooms for students. If not, go to SS13 and if yes continue with SS12. SS12 Note if there are separate bathrooms for boys and girls. SS13 Say whether or not the school has a preschool (Bisongo). SS14 For this question you must note (by code) the principal material used for the classroom floors,
without taking into account the walls and the roof. If a material you encounter is not listed, state what it is clearly.
SS15 Here, you should note (by code) the principal material used for the classroom roof without
taking into account the state of the floor and walls. If a material you encounter is not listed, state what it is clearly.
SS16 Here, you should note (by code) the principal material used for the classroom walls without
accounting for the state of the floor and roof. If a material you encounter is not reported, state what it is clearly.
SCHOOL REGISTRATION SUB-MODULE
FORM SCH
Objective The purpose of this form is to collect general information about the students and their attendance at school.

A-46
Instructions for Administering the Module Complete the attendance table for each visit to the school. The visits should be made each morning when school is open. In the table, you should write down each student in the school. If there are not enough lines, use an extra SCH sheet. You should fill in all information about the students. Preferably, you will ask each student if possible; if this is not possible the respondent for these questions should be the most well informed person with regards to the students. This sheet should be completed for all students in the school.
Questions The information to gather includes:
The date of the visit, the number of the school (assigned in SCH2) and the name of the school.
The number and name of the student, their class, their sex, their age, their village, their father’s name
Whether the child attended class the day of your visit
Note the number of times that the student was present in the last three days that the school was open
Note if the child attends regularly or not (using the codes)

A-47
APPENDIX 7
STATISTICAL ANALYSES TO VERIFY APPROPRIATENESS OF
REGRESSION DISCONTINUITY DESIGN
As indicated in Chapter III, we conducted some statistical analyses to verify that the regression
discontinuity design was indeed appropriate for this particular evaluation. We present here the results of these analyses. A. Placebo Tests
The regression discontinuity design‟s ability to identify the causal relationship between the treatment and outcomes rests upon the assumption that the discrete change in the probability of treatment occurring at the discontinuity is exogenous with respect to other characteristics of students that might be correlated with the child‟s propensity for academic participation and test scores. The technical requirement is the assumption that the relationship between these confounding characteristics and the treatment assignment variable is continuous at the point that determines treatment assignment. It is obviously impossible to check this assumption with respect to all possible variables, since most of the variables of interest are necessarily unobserved. It is, however, possible to use those characteristics that are observable and confirm that they do in fact vary continuously.
In the data available to us, we can observe several child-level and household-level variables. The estimated relationship between these variables and the relative score of the village is presented in Table A7.1. In each case, we allow for a discontinuity at a relative score of zero and estimate the relationship using equation (1) with no control variables. Because of the large sample, we can estimate most of the differences at the discontinuity with a high level of precision. As a result, most of the estimates are statistically significant. However, practically they are all very small – suggesting that the assignment rule did, in fact, succeed in creating exogenous variation in treatment assignment.
Panel A contains the estimates of the difference at the discontinuity of the household-level variables. This includes characteristics of the head of the household (age and gender), proxy measures of financial wellbeing (house characteristics and numbers of assets and livestock), and the religion of the household. None of the estimated differences are large enough to confound our estimates of the treatment effect. The largest difference, for example, is in the number of bikes, with families just above the cut-off for the treatment owning a tenth less of a bike than those just below the cut-off.
The difference is precisely estimated, being statistically significant at the one percent level. But in practical terms, this difference is inconsequential.
The pattern is the same when we turn to the child characteristics. These are presented in Panel B and include the child‟s age, gender, and relationship to the head of the household. Again, most of these differences are precisely estimated–being significant at the five percent and one percent levels. But the magnitudes are very small. The difference in gender is that treatment villages on the margin are 2.6 percentage points less likely to be male and 1.7 percentage points less likely to be the child of the head of the household.

A-48
Tab
le A
7.1
. Placeb
o T
ests
Panel A
: H
ousehold-level
Varia
ble
s
A
ge of
Head is
Basic
Flo
or
Basic
Roof
Num
ber
Num
ber
Num
ber
Num
ber
Num
ber
Religion
Dependent varia
ble
H
ead
Male
M
ateria
l M
ateria
l Radio
s
Phones
Watches
Bikes
Cow
s
Muslim
Independent varia
ble
s
(1)
(2)
(3)
(4)
(5)
(6)
(7)
(8)
(9)
(10)
Sele
cted
-0.124
0.0
30
***
0.0
11
0.0
1
-0.042
**
-0.012
-0.005
-0.117
***
-0.116
0.0
1
(0
.345)
(0
.006)
(0
.008)
(0
.013)
(0
.019)
(0
.011)
(0
.022)
(0
.029)
(0
.239)
(0
.013)
Constant
46.321
***
0.9
29
***
0.9
03
***
0.5
51
***
0.6
90
***
0.1
61
***
0.7
32
***
1.3
56
***
4.8
27
***
0.5
87
***
(0
.231)
(0
.004)
(0
.005)
(0
.009)
(0
.013)
(0
.007)
(0
.015)
(0
.019)
(0
.160)
(0
.009)
Model
Quadratic
Quadratic
Quadratic
Quadratic
Quadratic
Quadratic
Quadratic
Quadratic
Quadratic
Quadratic
Sam
ple
size
8,4
55
8
,7
65
8
,7
65
8
,7
65
8
,4
66
8
,4
66
8
,4
66
8
,4
66
8
,4
63
8
,4
60
R-squared
0
0
0
0
0.0
1
0.0
1
0
0.0
1
0
0
Prob > F
0.7
0
0.0
7
0
0
0
0
0
0.2
4
0
Panel B: C
hild-level
Varia
ble
s
H
ead's
H
ead's
H
ead's
Dependent varia
ble
A
ge
Male
C
hild
G
randchild
N
ephew
Independent varia
ble
s
(11)
(12)
(13)
(14)
(15)
Sele
cted
-0.002
-0.009
0.0
13
**
-0.014
***
0.0
14
***
(0
.036)
(0
.009)
(0
.006)
(0
.004)
(0
.003)
Constant
8.7
71
***
0.5
30
***
0.8
61
***
0.0
60
***
0.0
27
***
(0
.024)
(0
.006)
(0
.004)
(0
.003)
(0
.002)
Model
Quadratic
Quadratic
Quadratic
Quadratic
Quadratic
Sam
ple
size
18
,034
18
,332
18
,332
18
,332
18
,332
R-squared
0
0
0
0
0
Prob > F
0.1
3
0.7
6
0
0
0
Source: H
ousehold survey (M
PR 2
008), school surveys (M
PR 2
007 and M
PR 2008), applicatio
n data (Burkin
a Faso M
inistry of Educatio
n 2005
-2006)

A-49
B. Treatment Assignment
As described in Chapter III, the regression discontinuity design hinges on the assumption that the probability that a village receives the treatment varies sharply at the point of treatment assignment. The requirement in our study is that the probability that a village receives a BRIGHT school must vary discontinuously. In practice, almost all villages set to receive a BRIGHT school received one. But in some cases, a school could not be built for various reasons (lack of a suitable location, no viable well, etc.), and in some cases a school was built in a few villages that were not originally selected to receive a BRIGHT school. However these instances are rare and the assignment rule was generally followed.
To check this assumption, we estimate the relationship between an indicator variable set to one if a
village received a BRIGHT school and the village‟s relative score. Figure A7.1 estimates this with a locally linear non-parametric estimate of the probability that a village has a BRIGHT school in 2007 on the village‟s relative score. The solid line presents an estimate that assumes a discontinuity at zero, and estimated discontinuity is very large. At the margin, only a very small percentage of villages received a BRIGHT school to the left of the discontinuity while to the right, over 80 percent of villages received a school. The dashed line presents the same regression without assuming a discontinuity, and even in this plot, the sharp change in the probability that a village had a BRIGHT school at zero is clearly evident.
Figure A7.1. Presence of BRIGHT School as a Function of Relative Score
The dotted line shows the results of the specification check proposed by Hansen (2000). Each point
represents the R-squared statistic from a linear regression assuming a discontinuity at that point. The graph reaches a maximum at zero. This means that the model that assumes a discontinuity at zero has the greatest explanatory power and confirms the existence of a discontinuity at that point.
Columns (1), (2), and (3) of Table A7.2 present the results of parametric OLS regressions of the same
relationship using equation (1) and clustering the standard errors at the village level. To check the robustness

A-50
of the results, we estimate our preferred specification that allows for a quadratic relationship between the probability of having a BRIGHT school and the relative score in column one, and then confirm the estimates by also estimating a linear and cubic specification as well in columns two and three, respectively. The results are all consistent in their estimates with an estimated discontinuity of about 87 percentage points. All of the estimates are statistically significant at the one percent level, demonstrating that villages just above the cut-off were substantially more likely to receive BRIGHT schools that those just below the cut-off.
The next question is whether receiving a BRIGHT school changed the fraction of villages with schools.
By 2007, many villages had schools even if they were not BRIGHT schools. As a result, it is possible that villages not receiving BRIGHT schools received another type of school. Figure A7.2 provides a similar estimate as the one presented in Figure A7.1, but measures the relationship between the probability that a village received a school and the relative score. In this case, the difference is smaller, but there is still a noticeable discontinuity. The probability that villages selected to receive BRIGHT schools have a school is over 90 percent, but about 65 percent of the villages not assigned to receive a BRIGHT school also had schools. In this case, the R^2 statistic does not reach its maximum at exactly zero, but it is close enough that it still supports the existence of a discontinuity at that point.
Figure A7.2. Presence of a School as a Function of Relative Score
Columns (4) through (6) of Table A7.2 provide the parametric estimates of the discontinuity. The results
are consistent with the non-parametric estimates and suggest that the program did change the probability that a village received a school. For each specification, the estimate is about 33 percentage points. This is large change, but since the difference in the receipt of a BRIGHT school is 87 percentage points, the estimates show that the net effect of the program operated through two channels. For most of the villages, the program simply led to the construction of a different type of school (a higher quality school as we described in Section IV.B), and for 33 percent of the villages, the program ensured both the existence of a school and the existence of a BRIGHT school in particular.

A-51
Table A7.2. Discontinuity of Treatment Assignment
Bright Bright Bright Any Any Any
Dependent variable School School School School School School
Independent variables (1) (2) (3) (4) (5) (6)
Selected 0.878*** 0.871*** 0.871*** 0.340*** 0.332*** 0.332***
(0.030) (0.032) (0.032) (0.051) (0.055) (0.055)
Relative score 4.34E-05 7.31E-05 7.27E-05 4.38E-05 7.35E-05 7.79E-05
(0.000) (0.000) (0.000) (0.000) (0.000) (0.000)
Relative score^2 -1.41E-08 -2.08E-08 -1.41E-08 5.63E-08
(0.000) (0.000) (0.000) (0.000)
Relative score^3 0 0
0.000 0.000
Constant 0.0336* 0.0394* 0.0398* 0.616*** 0.622*** 0.618***
(0.019) (0.022) (0.022) (0.033) (0.037) (0.037)
Model Linear Quadratic Cubic Linear Quadratic Cubic
Sample size 287 287 287 287 287 287
R-squared 80.4% 80.4% 80.4% 18.1% 18.2% 18.3%
Prob > F 0.00 0.00 0.00 0.00 0.00 0.00
Source: Household survey (MPR 2008), school surveys (MPR 2007 and MPR 2008), application data
(Burkina Faso Ministry of Education 2005-2006)
Another important fact to note about these regressions is that the coefficients on the relative score variables are extremely small. The implication of this is that while the assignment rule was followed and the schools were allocated based on the relative score, the statistic used in the assignment process is not correlated with a village‟s propensity to receive a school. In fact, the correlation is so low that the simple average difference in a village‟s propensity to receive a school between those villages selected to receive a BRIGHT school and those not selected is 35 percent, which is very close to the estimates of the discontinuities. This is consistent with the fact that the estimates used to construct the score variable are very noisy and that the schools were allocated in a particularly random manner. This is a consistent result in every specification and one that we make use of in Appendix 9 to estimate the differential effect of school construction versus school improvement.
Table A7.3 shows how the discontinuity in receipt of a BRIGHT school changed over time. In our
survey of schools in the villages in our sample, we asked respondents for the year in which a school first opened in their village. In 17 villages, the respondent did not answer this question (usually because they did not know), leaving us with 270 villages that either did not have a school as of our survey in 2007 or that provided us with a date on which a school was opened in their village. Each column in Table A7.3 then re-estimates the same regression estimated in column (4) of Table A7.2, but with an indicator variable for whether or not the village had a school in the indicated year. The difference at the discontinuity is very small and statistically insignificant in 2003 and 2004. Starting in 2005, some of the villages just above the cut-off for receiving a BRIGHT school are more likely to report the opening of schools, which is consistent with the provisional schools starting to open in the 2005-06 academic year in anticipation of the construction of the new school buildings. Starting in 2005, the estimated discontinuity is 34 percentage points. This grows to 57 percentage points in 2006, and by this measure, 43 percentage points in 2007. This is consistent with but different from the estimate of 33.2 percentage points from column (4) of Table A7.2 because of the missing 17 villages. Finally, Figure A7.3 provides the graphical representation of the probability that villages had a school in 2003. Consistent with the regression estimates, the observed discontinuity is very small. And, as one

A-52
would expect, the R-squared statistic does not reach its maximum value at a point anywhere close to the relative score of zero, confirming that there is no discontinuity in the presence of a school in 2003.1
Table A7.3. Discontinuity of Treatment Assignment Over Time
Dependent variable
Had School
in 2003
Had School
in 2004
Had School
in 2005
Had School
in 2006
Had School
in 2007
Independent variables (1) (2) (3) (4) (5)
Selected -0.0166 -0.0461 0.341*** 0.571*** 0.432***
(0.035) (0.042) (0.068) (0.058) (0.060)
Relative score 0.000 0.000 0.000 0.000 0.000
(0.000) (0.000) (0.000) (0.000) (0.000)
Relative score^2 -7.71E-09 -2.73E-08 -5.31E-08 -8.65E-09 -2.76E-08
(0.000) (0.000) (0.000) (0.000) (0.000)
Constant 0.0648*** 0.111*** 0.216*** 0.351*** 0.491***
(0.023) (0.028) (0.046) (0.039) (0.040)
Model Quadratic Quadratic Quadratic Quadratic Quadratic
Sample size 270 270 270 270 270
R-squared 0.2% 0.6% 14.0% 37.7% 26.6%
Prob > F 0.93 0.65 0.00 0.00 0.00
Source: Household survey (MPR 2008), school surveys (MPR 2007 and MPR 2008), application data
(Burkina Faso Ministry of Education 2005-2006)
FIGURE A7.3. PRESENCE OF A SCHOOL IN 2003 AS A FUNCTION OF RELATIVE SCORE
1 The graph for 2004 is similar.

A-53
APPENDIX 8
STATISTICAL ANALYSES TO VERIFY ROBUSTNESS OF
IMPACT ESTIMATES
As described in Chapter IV, the impact estimates of BRIGHT are robust to various regression
specifications. This appendix describes additional robustness checks (Table A8.1) we conducted to verify that the impact estimates were not sensitive to the regression specification chosen. Column (1) for reference contains our preferred specification with the quadratic polynomial, department-level fixed effects, and socio-demographic controls. Column (2) provides the same estimate as presented in column (1), but it takes into account the fact that at the discontinuity, 10 percent of the selected villages do not receive a BRIGHT school and 3 percent of the non-selected villages receive a BRIGHT school. To do this, we estimate equation (1), but instead of using the variable for having been selected for a BRIGHT school as the key explanatory variable, we use a variable for whether a village actually received a BRIGHT school. We then instrument this variable with whether the village was selected to receive a BRIGHT school. Effectively, this is an estimate of the effect on children‟s enrollment on just those villages that actually received a BRIGHT school, the treatment on the treated, due to the discontinuity. Consistent with the fact the assignment rule was very closely followed, the resulting estimate is 22.8 percentage points, which is very close to the preferred estimate of 19.7 percentage points.
Table A8.1. IMPACTS of Bright PROGRAM on Self-Reported Attendance, Robustness Checks
Dependent variable Attendance Attendance Attendance Attendance
Independent variables (1) (2) (3) (4)
BRIGHT 0.197*** 0.228*** 0.195*** 0.197***
-0.023 -0.0276 -0.0309 -0.026
Relative score 9.99e-05* 0.0000741 0.00012 9.99e-05*
-0.0000551 -0.0000556 -0.000265 -0.000057
Relative score^2 -2.68e-08* -2.48e-08* 8.58E-08 -2.68e-08*
-1.52E-08 -1.48E-08 -3.44E-07 -1.58E-08
Constant 0.55 0.238 0.0797 0.55
-0.4 -0.426 -0.475 -0.433
Socio-demographic controls Yes Yes Yes Yes
Specification Quadratic Quadratic Quadratic Quadratic
Department fixed-effects Yes Yes Yes Yes
Model ITT TOT-BRIGHT ITT ITT
Sample size 17,984 17,984 17,984 17,984
R-squared 19.8% 19.9% 19.8% 19.8%
Prob > F
Source: Household survey (MPR 2008), school surveys (MPR 2007 and MPR 2008), application data
(Burkina Faso Ministry of Education 2005-2006)
In all of the preceding regressions, we have generally assumed that the only discontinuity generated by the assignment rule was in the intercept of the polynomial in relative score. We relax this assumption in Column (3) by interacting the indicator variable for whether a village has a relative score above zero with both the linear and the quadratic term in the polynomial. Effectively, this allows for a discontinuity in the intercept and both the first and second derivatives of the function. Despite the additional flexibility, the coefficient is still identical to the preferred estimated (19.5 percentage points) and still significant at the one percent level.

A-54
In Column (4), we take into account the fact that the assignment process takes place at the village level, causing all children in the same village to have the same relative score. If the data were too coarsely grouped, this would cause us to overestimate the precision with which we had estimated the discontinuity and (just as not taking into account the correlated child-level outcomes) cause us to over-reject the null hypothesis of no discontinuity. To check for this we cluster the standard errors, not at the village level, but by the relative score. The result is to slightly increase the standard error on the estimate of the discontinuity (from 0.023 to 0.026), but the change is so small that the coefficient is still significant at the one percent level.
In sum, the results from this appendix further confirm that the impact estimates presented in Chapter
IV are very robust to a wide range of specifications.

A-55
APPENDIX 9
ACCESS VERSUS QUALITY
As indicated earlier, the estimated treatment effect is a combination of the effect of providing schools in the 33 percent of villages that would not have otherwise had school and providing a higher quality school in the 54 percent of villages that would have had a non-BRIGHT school. Disentangling the magnitude of these individual effects would be possible given information on where schools would have been built in the absence of the BRIGHT program. With knowledge of the counterfactual building schedule in both treatment and control schools, we could separately estimate the treatment effect in the subsample of villages scheduled to have schools by 2007 and those in which schools would not be built by 2007.
Lacking this information, we adopt two alternative strategies for estimating these individual effects and
find that they yield comparable results. First, we directly estimate the average differences in student outcomes between villages with BRIGHT schools, non-BRIGHT schools, and no schools. The concern with this approach is the endogeneity of the assignment of schools to villages. However, the relationship between the academic outcomes of children in a village and the village‟s relative score in the assignment process is negligible. As shown in Figures IV.2, IV.3, IV.4, and IV.5, except for the discontinuity, the relationship between the relative score a village receives and children‟s attendance and test scores is relatively constant, suggesting that BRIGHT schools were allocated based on criteria that are statistically independent of the outcomes of interest. This is borne out in the actual regressions in Tables IV.3, IV.4 and IV.5 where the coefficients on relative score in the quadratic specification (Column 3 in these 3 tables) are very small. All of these coefficients are so small that at the extremes of treatment assignment variable, the implied change in enrollment and test scores that is due to the difference in scores is very small. For the village at the fifth percentile in relative score (relative score is -360), the difference in enrollment (compared to the cut-off of zero) due to the score is only -3.9 percentage points and the difference in test scores is only -0.063 standard deviations. For villages at the ninety-fifth percentile, the difference in enrollment is only 4.2 percentage points and the difference in test scores is only 0.063 standard deviations.
The second strategy leverages our knowledge of the location of schools in 2004 before the BRIGHT
schools were assigned to villages. By focusing on villages that had schools at that time, we can estimate the treatment effect using a sample of villages in which we know that the BRIGHT schools replaced pre-existing institutions. Knowing the treatment effect of school improvement, one can then use ratio of non-selected villages with schools and the overall treatment effect to solve algebraically for treatment effect in villages without existing schools. Conveniently, the lack of a relationship between student outcomes and assignment of a BRIGHT school means that the average differences estimated above are disaggregated along these proportions. So, to compare the results of the two estimation procedures, one can directly compare the estimated treatment effect in villages that have schools in 2004 to the average difference in outcomes between villages with BRIGHT schools and villages with non-BRIGHT schools. The main danger of this strategy is representativeness of the estimated results – villages that received schools by 2004 may respond differently to the improvement of a school than villages that received schools later. As a check on the correlation between the treatment effect and the timing of a village‟s original receipt of a school, we separately estimate the effects on villages that receive schools by 2003 and find similar point estimates to those that have a school by 2004.
The point estimates for these regressions are presented in Table A9.1. First, we estimate the impacts on
enrollment. Column (1) presents the results for the simple regression on whether a village has any school and then specifically a BRIGHT school with no controls. In this specification, the coefficient on “Any Village School” provides the estimated effect of a receiving a non-BRIGHT school and the coefficient on “BRIGHT School” provides the estimated additional effect of receiving a BRIGHT school over a non-BRIGHT school. Column (2) presents the same regression with controls and fixed effects. As expected, the point estimates are very similar, lending support to the argument that the two types of villages are indeed similar in observable characteristics. Based on these estimates, the effect on children‟s enrollment of receiving a non-BRIGHT

A-56
school is to increase enrollment among primary school-age children by 26.3 percentage points over a base of about 14.5 percentage points in villages without schools. Adding a BRIGHT school rather than a non-BRIGHT school further increases enrollment by 13 percentage points to 39.3 percentage points. In other words, the effect of building a BRIGHT school in a village that has no school at all is 39.3 percentage points while the effect of improving an existing school to make it a BRIGHT school increases enrollment in the village by 13 percentage points. Compared to the effects of just adding a non-BRIGHT school, the improved quality of the school increases enrollment by 50 percent.
To check these estimates, we compare the effect of improving an existing school into a BRIGHT school
in Column (1) and (2) to the estimates obtained through the regression discontinuity design using only villages that had a school in 2004 (column (3)) and 2003 (column (4)). The estimated discontinuity for villages with schools in 2004 is 13.9 percentage points while the estimate for villages with schools in 2003 is 15.7 percentage points, statistically significant at the one percent and five percent levels, respectively. While these estimates are slightly higher than the estimates in columns (1) and (2), they are very close and confirm the validity of those estimates.
Columns (5) through (8) contain the estimates of the relative effect on children‟s test scores. To save
space we only report the estimates for the OLS strategy using all of the controls (columns (5) and (7)) and the regression discontinuity design for villages that had a school in 2004. (The other estimates are consistent and available upon request.) The effect of receiving a non-BRIGHT school is to increase test scores by 0.27 and 0.30 standard deviations in math and language, respectively. Both of these estimates are statistically significant at the one percent level. Improving the school to be a BRIGHT school about doubles the improvement in test scores for an additional increase of 0.34 and 0.29 standard deviations, respectively. These estimates are consistent with the estimates for villages that had a school in 2004 using the regression discontinuity design. The ultimate result is that providing a BRIGHT school to a village without a school should improve students test scores by 0.61 and 0.59 standard deviations in math and French, respectively.
Finally, we use the OLS specification to disaggregate the effects by gender. Column (9) presents the
results for enrollment. Column (10) contains the results for normalized math scores and Column (11) contains the results for normalized language scores. The results are generally consistent with the estimates presented in Table IV.5. Providing a non-BRIGHT school to a village increases children‟s enrollment by about 26 percentage points and has the same effect for girls and boys. Improving the school to a BRIGHT school increases boys‟ enrollment by another 10 percentage points, but the improvements have an additional effect of increasing girls‟ enrollment by 16 percentage points, which is consistent with the fact that many of the differences between BRIGHT and non-BRIGHT schools are designed to make the schools more attractive to girls. In terms of test scores, however, there is no difference in the effects of either the non-BRIGHT schools or the BRIGHT schools in their effect on children by gender. Overall, this suggests that the girl-friendly elements of the school may have boosted the enrollment of girls by 6 percentage points, but the bulk of the girls‟ enrollment (36 percentage points) occurred because of the more traditional improvements in educational infrastructure.

A
-57
TABLE A9.1. Relative Effect of School Improvement versus School Access
Enrollment Math Scores Language Scores Effects by Gender
All All
Had
School
Had
School All
Had
School All
Had
School Enrolled Math French
Villages Villages 2004 2003 Villages 2004 Villages 2004 Score Score
Variables (1) (2) (3) (4) (5) (6) (7) (8) (9) (10) (11)
BRIGHT school 0.146*** 0.130*** 0.139*** 0.157** 0.339*** 0.316*** 0.290*** 0.329*** 0.100*** 0.325*** 0.272***
(0.027) (0.020) (0.037) (0.073) (0.043) (0.096) (0.042) (0.096) (0.021) (0.045) (0.046)
Any village school 0.258*** 0.263*** 0.274*** 0.304*** 0.256*** 0.253*** 0.288***
(0.034) (0.030) (0.072) (0.056) (0.031) (0.070) (0.060)
BRIGHT school * girl 0.064*** 0.03 0.037
(0.020) (0.038) (0.039)
Any village school * girl 0.018 0.048 0.036
(0.021) (0.042) (0.040)
Constant 0.181*** -0.073 0.175*** 0.130** -0.251 1.383*** -1.029 1.415*** -0.052 -0.228 -1.008
(0.026) (0.415) (0.040) (0.045) (0.949) (0.153) (0.780) (0.212) (0.415) (0.949) (0.780)
Order of control function None None Quadratic Quadratic None Quadratic None Quadratic None None None
Socio-demographic controls No Yes Yes Yes Yes Yes Yes Yes Yes Yes Yes
Fixed effects No Yes Yes Yes Yes Yes Yes Yes Yes Yes Yes
Observations 18332 17984 1588 1014 17,984 1,573 17,984 1,573 17,984 17,984 17,984
R-squared 0.09 0.23 0.19 0.16 0.14 0.19 0.13 0.19 0.23 0.14 0.13
Note: This tables estimate the separate effects of receiving a BRIGHT school in villages that have lower quality schools and in villages without any schools.
Columns 1, 2, 5, and 7 include a simple OLS specification that estimates attendance rates in villages with schools and with BRIGHT schools separately.
Columns 3, 4, 6, and 8 estimate the regression discontinuity design using only villages that were known to have schools in the specified year and thus,
in the treatment villages, were upgraded to BRIGHT Schools.
*, **, and *** indicate significance at the 10, 5, and 1 percent significance levels, and standard errors clustered at the village level are provided in
parentheses below each point estimate.
Source: Household survey (MPR 2008), school surveys (MPR 2007 and MPR 2008), application data (Burkina Faso Ministry of Education 2005-2006)

www.mathematica-mpr.com
Improving public well-being by conducting high-quality, objective research and surveys
Princeton, NJ ■ Ann Arbor, MI ■ Cambridge, MA ■ Chicago, IL ■ Oakland, CA ■ Washington, DC