Impact Evaluation Guidebook for Climate Change Adaptation ...
68
Impact Evaluation Guidebook for Climate Change Adaptation Projects In cooperation with
Transcript of Impact Evaluation Guidebook for Climate Change Adaptation ...

Impact Evaluation Guidebook for Climate Change Adaptation Projects
In cooperation with
Impa
ct E
valu
atio
n G
uide
book
for C
limat
e Ch
ange
Ada
ptat
ion
Proj
ects
1
List of tables 2List of figures 2List of abbreviations 3Glossary 4
Executive Summary 6
1 Introduction 10
11 How to use the Guidebook 1112 How to plan and implement an RIE for CCA projects 11
2 Evaluating climate change adaptation projects 16
21 Types and key features of climate change adaptation projects 16 211 Adaptation projects addressing the individual level 16 212 Adaptation projects addressing the institutional level 17 213 Adaptation projects addressing the systemic level 18
22 Key challenges of climate change adaptation projects 1923 Review of current methods to evaluate the results of CCA projects 20
3 Rigorous evaluation designs and examples of applicability in climate change adaptation projects 22
31 Overview of evaluation designs ndash potentials and limitations for climate change adaptation projects 22 311 Experimental and quasi-experimental designs 23 312 Matching techniques 25 313 Pipeline approach 26 314 Regression discontinuity design 28 315 Time-series designs 29 316 Structural equation modelling 30 317 Summary 32
32 Providing reliable large-scale data 34
4 Case study Urban Management of Internal Migration due to Climate Change 39
41 Background and project objectives 4042 Practical implementation 42
5 Annex 48
51 Overview of current CCA related-project evaluations 4852 Calculation of net average treatment effect with double-difference approach 5253 Propensity score matching (PSM) 5254 Fixed-effects random-effects models and time-series cross-section analysis 5655 Structural equation modelling 5756 Calculating sample sizes for probability sampling 5857 Literature 60
Content
Impa
ct E
valu
atio
n G
uide
book
for C
limat
e Ch
ange
Ada
ptat
ion
Proj
ects
2
List of tablesTable 1 Exemplary data collection plan 13Table 2 Example table for matching on observables 25Table 3 Required project characteristics and data 35Table 4 Example of question types 36Table 5 Exemplary to-do list for preparing a survey 37Table 6 Applicability of evaluation designs 42Table 7 Draft (simplified) data collection plan 44Table 8 Decisive aspects for choosing co-variance 58
List of figuresFigure 1 Flow chart for implementing an RIE 14Figure 2 Illustration of the pipeline approach 27Figure 3 Selection of individuals for comparison 28Figure 4 Outcome scores before and after intervention 28Figure 5 Generic layout of a structural equation model 31Figure 6 Decision tree for selecting an evaluation design for measuring impacts at individual level 33Figure 7 Decision tree for selecting an evaluation design for measuring impacts at institutional and system level 34Figure 8 Distribution of sample mean values in relation to the true population mean value 38Figure 9 Simplified SEM for the GIZ project 45Figure 10 Draft schedule for impact monitoring and evaluation framework 47Figure 11 Calculation of the net treatment effect in an experimental or quasi-experimental design 52Figure 12 PSM sequence 53
3
List of abbreviations
AAP Africa Adaptation ProgrammeADB Asian Development BankBGR Federal Institute for Geosciences and Natural ResourcesBMZ German Federal Ministry for Economic Cooperation and DevelopmentBMUB German Federal Ministry for the Environment
Nature Conservation Building and Nuclear SafetyCCA Climate change adaptationCIDA Canadian International Development AgencyCO2 Carbon dioxide DAC Development Assistance CommitteeDfID Department for International DevelopmentEU European UnionGCF Green Climate Fund GHG Greenhouse gases GIZ Deutsche Gesellschaft fuumlr Internationale Zusammenarbeit GmbH IFAD International Fund for Agricultural DevelopmentKfW Kreditanstalt fuumlr WiederaufbauLDC Least developed countyLDCF Least Developed Countries FundMampE Monitoring and EvaluationNAMAs Nationally Appropriate Mitigation ActionsNAP National Adaptation PlanNC National CommunicationNGO Non-governmental organisation OECD Organisation for Economic Co-operation and DevelopmentPSM Propensity score matchingRDD Regression discontinuity designRCT Randomised controlled trialREDD Reducing Emissions from Deforestation and Forest DegradationSEM Structural equation model(ling)SIDA Swedish International Development AgencyToC Theory of changeUNDP United Nations Development ProgrammeUNEP United Nations Environment ProgrammeUNFCCC United Nations Framework Convention on Climate ChangeUNICEF United Nations Childrenrsquos FundUNIDO United Nations Industrial Development Organization USAID United States Agency for International Development WFP World Food Programme
Impa
ct E
valu
atio
n G
uide
book
for C
limat
e Ch
ange
Ada
ptat
ion
Proj
ects
4
Glossary
Accountability Obligation to demonstrate that work has been conducted in compliance with agreed rules and stand-ards or to report fairly and accurately on performance results vis-agrave-vis mandated roles andor plans This may require a careful demonstration that the work is consistent with the contract terms
Adaptation Adjustment in natural or human systems in response to actual or expected climatic stimuli or their effects which moderates harm or exploits beneficial opportunities Various types of adaptation can be distinguished including anticipatory autonomous and planned adaptation Anticipatory adaptation ndash Adaptation that takes place before impacts of climate change are observed Also referred to as proactive adaptation Autonomous adaptation ndash Adaptation that does not constitute a conscious response to climatic stimuli but is triggered by ecological changes in natural systems and by market or welfare changes in human systems Also referred to as spontaneous adaptation Planned adaptation ndash Adaptation that is the result of a deliberate policy decision based on an aware-ness that conditions have changed or are about to change and that action is required to return to maintain or achieve a desired state
Adaptive capacity
The ability of a system to adjust to climate change (including climate variability and extremes) to moderate potential damages to take advantage of opportunities or to cope with the consequences
Attribution Ascribing the cause of an effect (change) to a specific intervention An approach to () rigorous impact evaluation that concerns clear cause-effect relationships ie establishing causal links and drawing explanatory conclusions about observed changes (whether anticipated or not) and the con-cerned intervention Focusing on clear causation implies considering the () counterfactual to assess the () net impact of an intervention by a comparison of what has occurred with the intervention implemented (the factual) with the situation without the intervention (the counterfactual)
Climate change
Climate change refers to any change in climate over time whether due to natural variability or as a result of human activity This usage differs from that in the United Nations Framework Convention on Climate Change (UNFCCC) which defines lsquoclimate changersquo as lsquoa change of climate which is attrib-uted directly or indirectly to human activity that alters the composition of the global atmosphere and which is in addition to natural climate variability observed over comparable time periodsrsquo
Counterfactual The situation that would have happened if the intervention had not taken place (lsquowithoutrsquo situation) As the counterfactual is not directly observable the unobservable potential outcome of the counter-factual situation is estimated via the situation of an equivalent control comparison group that is not affected by the intervention This is done using () randomised controlled trials (RCT) or () quasi-experimental designs
Evaluability Extent to which an activity or a programme can be evaluated in a reliable and credible fashion
Experimental design
A study in which individuals (or groups of individuals) are randomly allocated (by chance alone) to an intervention group (treatment) or a control group (not being part of the intervention) Experimental studies ( RCTs) seek to measure an interventionrsquos () net impact by comparing the two groupsrsquo situations before and after the intervention ( attribution)
Exposure The nature and degree to which a system is exposed to significant climatic variations
Factual The observed outcome of an intervention (lsquowithrsquo situation) ( counterfactual)
Impact 1 Positive and negative primary and secondary long-term effects produced by an intervention directly or indirectly intended or unintended ( net impact)
Impact evaluation
An evaluation that looks beyond the immediate results of an intervention project programme or policy Impact evaluations may focus (i) on higher outcomes rather than intervention outputs (ii) on longer-term results (iii) on a group of interventions within a given sector or geographical area or (iv) explicitly on the impacts produced by an intervention ie attributing impacts to an intervention ( Rigorous impact evaluation)
Monitoring A continuing function that uses systematic collection of data on specified indicators to provide management and the main stakeholders of an ongoing development intervention with indications of the extent of progress and achievement of objectives and progress in the use of allocated funds
1 For GIZ colleagues a brief explanation of how this impact definition fits into GIZrsquos results model (GIZ 2013) The results model is an ex-pression of GIZrsquos Managing for Development Results approach The results model forms the detailed basis for GIZrsquos subsequent operation-al planning and for establishing the results-based monitoring system at the start of implementation Within this model GIZ understands results as the lsquointended or unintended positive or negative changes in a situation or behaviour as the direct or indirect consequence of an interventionrsquo Results include impacts outcomes and outputs Impacts are defined as lsquothe long-term overarching development results They are usually located at the level of the development cooperation programme objectiversquo This definition largely corresponds to the one used in this document However at some points in this publication the authors use the term lsquoimpactrsquo synonymously with the term lsquooutcomersquo when applied to GIZrsquos results model Within GIZ outcomes are defined as the lsquoexpected or actually achieved direct short-term and medium-term results of a measurersquos outputsrsquo
5
Net impact Effects exclusively produced by an intervention (without effects caused by other possible external causes) effects that can be () attributed to a specific intervention by clear () causation The net impact (b-c) is the difference between what has occurred with the intervention implemented (b-a) the () factual and the situation without the intervention (c-a) the () counterfactual
after intervention
beforeintervention
netimpact
bb
cc
aagrossimpact
change with intervention
change without intervention
impa
ct in
dica
tor
time
Technically speaking the net impact is defined as fol-lows an effect caused by a treatment (intervention) is the difference between the outcome under a treat-ment (T=1) minus the alternative outcome that would have happened without the treatment (T=0)
Partial least squares analysis
A multivariate statistical approach for the estimation of causal relationships It is a variance-based non-linear (ie no assumptions regarding the value distribution of a variable required) iterative method based on a linear regression model It allows the estimation of concrete values for latent (ie non-observablemeasurable) constructs with the help of manifest (ie observablemeasurable) indi-cators
Quality (rigorous) impact evaluations
As there is (i) a mistaken belief that () rigorous impact evaluations have to use () randomised con-trolled trials (RCTs) on the one side and (ii) the fact that most rigorous impact evaluations are being carried out by economists and econometricians (not evaluators) resulting in technically competent studies but not automatically very good evaluations on the other side more and more the term lsquoqual-ityrsquo impact evaluation is used to avoid misunderstanding and to focus on quality
Quasi-experimental designs
An attempt to uncover a causal () attribution even though a random pre-selection processes is not possible A quasi-experimental design is a type of experimental design ( RCT) where a randomised control group could not be established for either ethical or practical reasons and therefore the inter-vention grouprsquos situation is compared with those of a similar group of individuals not receiving inter-vention activities (comparison group)
Randomised controlled trial (RCT)
An () experimental study in which individuals (or groups of individuals) are randomly allocated (by chance alone) to an intervention group (treatment) or a control group (not being part of the interven-tion) RCTs seek to measure an interventionrsquos () net impact by comparing the two groupsrsquo situations before and after the intervention ( attribution)
Resilience The ability of a social or ecological system to absorb disturbances while retaining the same basic structure and ways of functioning the capacity for self-organisation and the capacity to adapt to stress and change
Rigorous impact evaluation
An () impact evaluation with strong emphasis on lsquoproduced byrsquo focusing on clear causationcausal attribution by establishing the counterfactual Assessing the effects produced by an intervention the () net impact requires a comparison of what has occurred with the intervention implemented ndash ie the () factual ndash with the situation without the intervention ndash ie the () counterfactual The term lsquorigorousrsquo is added to differentiate this approach from many ndash more traditional ndash () impact evalua-tion approaches
lsquoRigorisedrsquo impact evaluation
A () rigorous impact evaluation conducted in a real-life situation where necessary conditions are not (fully) given and which is therefore conducted as rigorously as is feasible
Sensitivity Sensitivity is the degree to which a system is affected either adversely or beneficially by climate vari-ability or change The effect may be direct (eg a change in crop yield in response to a change in the mean range or variability of temperature) or indirect (eg damages caused by an increase in the fre-quency of coastal flooding due to a rise in sea level)
Vulnerability Vulnerability is the degree to which a system is susceptible to and unable to cope with adverse effects of climate change including climate variability and extremes Vulnerability is a function of the char-acter magnitude and rate of climate change and variation to which a system is exposed its sensitiv-ity and its adaptive capacity
Glossary
Impa
ct E
valu
atio
n G
uide
book
for C
limat
e Ch
ange
Ada
ptat
ion
Proj
ects
6
Executive Summary
Phot
o copy
GIZ
Gue
nay
Ulu
tunc
ok
Monitoring and evaluating impacts is usually both costly and laborious Often it is also a challenging process particularly when complex causal linkages or uncertain framework conditions are involved All of this applies to climate change adaptation (CCA) projects which present further methodological and practical challenges that complicate the assessment of concrete adaptation results However provid-ing evidence about the impact of an intervention is often indispensable when it comes to generating knowledge about what works and what doesnrsquot ini-tiating organisational learning processes monitoring the progress made or simply being accountable for the use of resources This Guidebook seeks to sup-port project managers by providing an overview of different impact evaluation methods and how they can be applied to climate change adaptation projects The application of the Guidebook is further illustrated by a case study of an adaptation project in Bangladesh
Evaluations and rigorous impact evaluations ndash Whatrsquos the difference
While many evaluation approaches claim to pro-vide some kind of indication about project impacts (eg most significant change approach participatory rapid assessment) robust evidence can only be pro-vided by sophisticated evaluation designs that com-ply with scientific standards and are based on valid empirical data Evaluations that use such sophisti-cated designs and involve the collection of a consid-erable amount of empirical data are also called rig-orous impact evaluations (RIEs) The advantage of RIEs in contrast to lsquosofterrsquo designs is that they make it possible to clearly attribute observed changes to a particular intervention or at least make it possible to quantify the contribution an intervention has made
to these changes This Guidebook provides practi-tioners in the field of CCA with a selection of such RIE designs differentiated according to the type of impact (ie micro meso or macro-level impacts) they are able to measure
Rigorous impact evaluations (RIEs) make it possible to attribute observed changes to a particular intervention or at least quantify the contribution an intervention has made to these changes
The difficulties involved in measuring the impacts of CCA projects are widely recognised by practition-ers and the adaptation community (eg Bours et al 2014) The latter acknowledges the limited evidence on global adaptation progress and the gaps in the evolving adaptation science (FordBerrang-Ford 2015) For climate change mitigation progress can be tracked with reference to the global concentration of greenhouse gases (GHGs) For climate change adap-tation though there is no such single metric This explains the need to equip practitioners with the right methods to assess adaptation results and dem-onstrate the added value of their projects
Establishing causality on different levels
According to the OECDrsquos Development Assistance Committee (DAC) impact evaluations take into account intended and unintended positive and neg-ative as well as expected and unexpected changes They are supposed to not only provide information on all possible changes that have occurred during the implementation of an intervention but also to link these observed changes to their causes There-fore the establishment of causality (causeeffect relationship) is crucial in order to understand why particular incidents occurred during and after a pro-ject or programme In particular the question lsquoWhat would have happened without the project or pro-
7
grammersquo needs to be investigated in detail At this point a so-called counterfactual assessment (ie the comparison between what actually happened and what would have happened in the absence of the intervention) must be considered Since it is impos-sible to collect data on what would have happened if the intervention had not been implemented many RIEs are based on designs that include comparison data ie on individuals in a similar situation who were not exposed to the intervention
The RIE designs presented in this Impact Evaluation Guidebook are differentiated according to the type of impact they are able to measure ie
y micro (individual) y meso (institutional) or y macro (systemic)-level impacts
The aim of the Guidebook is to address the challenge of producing more and better impact evaluations giving practitioners the necessary know-how in order to plan implement and steer an RIE It enables practitioners to identify which of the RIE designs are suitable for successfully evaluating their par-ticular project or programme and also reveals the respective potentials and limitations of the differ-ent designs when it comes to their application in the field of CCA
The benefit of implementing RIEs for CCA projects
Why are RIEs increasingly being considered as an option for evaluating a CCA project The Paris Dec-laration on Aid Effectiveness which calls for more and better impact evaluations has created a cer-tain amount of pressure and consequently a rising demand to use RIEs This also explains why more funding is becoming available and the literature is growing in this area During the research for this Guidebook one crucial step was to understand how CCA projects were evaluated in the past and how they are currently evaluated So far RIEs have rarely been undertaken for CCA projects Addition-ally respected independent evaluation departments have seldom implemented RIEs with counterfactu-als for CCA projects up to now Since there is limited evidence on global adaptation progress to date RIEs have the capacity to redress the situation and gen-erate learning This is because they are conducted according to scientific quality standards that
i ensure the correctness of measurement findings (reliability)
ii exclude as far as possible alternative causes for an observed finding (internal validity) and
iii shift findings from an observed sample to a larger population (external validity)
No lsquoone size fits allrsquo RIE design
The numerous (methodological) challenges faced by CCA projects have led to intensive discussion among experts on how to adequately monitor and evaluate them The main challenges are
1 the lack of a conceptual agreement on definitions including what actually constitutes successful adaptation and therefore
2 the non-existence of a universal indicator (unlike for mitigation)
3 changes in the climatic context during a projectrsquos lifetime and the related problem of shifting base-lines
4 uncertainty about actual climate change patterns and their effects and
5 the long-time horizon of potential climate change impacts (see 22 for more details)
Individually none of these challenges are unique to CCA they also exist in projects in other sectors Together though they represent a fundamental difficulty for practitioners in terms of monitoring and evaluating project impacts Since adaptation projects vary widely in their scope and in the sec-tors they cover there is no such thing as a lsquoone size fits allrsquo evaluation design Whether and which RIE design(s) are to be used depends on various factors such as the level (micro meso or macro) at which the project generates an impact the availability of data and the time and resources available to the project For example at the systemic (macro) level a climate policy that is still at an early stage of implementation and project activities that have so far mainly focused on consultations and capacity building exercises may not be appropriate for a counterfactual assessment Nonetheless most CCA projects follow a multi-level approach which implies that a combination of two or more evaluation approaches may be required to measure the total impact of a project or programme
The selection of evaluation designs presented in this Guidebook is based on two considerations Firstly the design needs to comply with scientific standards in order to produce robust findings Secondly the selected designs should cover a wide range of differ-ent project approaches and all possible impact levels In particular six types of designs are discussed in detail
y experimental and quasi-experimental designs y matching techniques
Executive Summ
ary
8
y pipeline approach y regression discontinuity design (RDD) y time-series designs and y structural equation modelling (SEM)
Which evaluation design to choose ndash creating evidence at the individual level
At the individual level if a baseline is available (ex-ante and ex-post data from both the treatment and control group) three evaluation designs can be con-sidered for evaluating the CCA project an experi-mental quasi-experimental or regression disconti-nuity design
In an experimental design also known as a ran-domised controlled trial (RCT) a treatment and control group are compared with each other at two points in time ndash before and after the intervention ndash in order to estimate the counterfactual (what would have happened in the absence of the intervention) To be classified as an lsquoexperimentalrsquo design the ben-eficiaries need to be randomly selected during the planning phase of a project ie each person has the same chance of being a member of either the control or the treatment group If a random selection cannot be realised (eg due to self-selection bias or conscious selection) then such a design is called quasi-experi-mental In that case the group without treatment is called a lsquocomparison grouprsquo This means that some kind of matching technique needs to be applied dur-ing data analysis in order to control for selection bias
Thus both experimental and quasi-experimental designs are applicable to CCA projects as long as pro-ject activities aim at creating a direct impact at indi-vidual (micro) level The use of an experimental or quasi-experimental design calls for technical logis-tical and financial resources that mainly depend on the size and accessibility of the target group The data
selection process is often quite costly since a large team of enumerators is required Moreover there are two potential biases that may emerge and ham-per the process of attributing the observed change to project activities spill-over and contagion effects The former implies that the controlcomparison group indirectly receives a benefit from the project or programme and the latter occurs when differ-ent factors (eg projects operated by different agen-cies) affect the situation of the target population Nonetheless in terms of study design RCTs show the highest internal validity 2 and enable the clear attribution of interventions to impacts (the latter is also true of the quasi-experimental and pipeline approach) Regression discontinuity design (RDD) is a quasi-experimental evaluation method that can be applied if beneficiaries of the project are selected based on a special characteristic (eg income) of rel-evance to the desired impact that distinguishes them from the non-beneficiaries At the same time ben-eficiaries are compared with the comparison group in a number of other respects (eg location) Being a quasi-experimental design RDD does not require randomisation
If no baseline data have been collected beforehand two further evaluation designs can be considered at the individual level the pipeline approach and the panel design
The application of a pipeline approach is possible if a project is implemented sequentially (eg in dif-ferent regions) Thereby the selection of the target population that is not yet affected can serve as a quasi-comparison group for the group that is already affected It is important though that the treated groups of each phase are comparable Each data col-lection phase is just as labour-intensive and time-consuming as a quasi-experimental approach Panel designs a type of time-series design are in principle applicable for measuring impacts on all levels but require comparably larger sample sizes in order to be able to perform the necessary statistical calculations The special characteristic that differentiates the panel design from all the others mentioned above is that it requires data to be collected from identical units (eg persons households) at each point in time This makes it prone to attrition effects (ie decreasing sample sizes) over time It should also be mentioned that a panel design only makes it possible to estimate the contribution made by an intervention to observed changes but not to attribute these changes unambiguously
2 Internal validity is defined as the extent to which the variation of a dependent variable can be explained by the variation of a specific independent variable ie the extent to which alternative explana-tions for the variation of the dependent variable can be excluded
Impa
ct E
valu
atio
n G
uide
book
for C
limat
e Ch
ange
Ada
ptat
ion
Proj
ects
Phot
o copy
GIZ
Ste
inbe
rg
9
Creating evidence at institutional and system level
If an intervention aims to generate an impact at the institutional and system levels two further evalua-tion designs can be taken into account time-series designs and structural equation modelling
Time-series designs can be of particular use when it is necessary to cover longer periods than those set by a project or programme This makes them highly suitable for CCA projects where changes or results may unfold at later stages If data were collected repeatedly over a longer time period during the pro-ject time-series designs might be the best option It should be borne in mind though that these designs require a large number of repeated observations (at least about 10) in order to be able to perform the necessary statistical analyses for providing robust findings Finally if none of the designs fit structural equation modelling (SEM) could be an option for providing meaningful evidence about the impact of a project or programme It may be applied to meas-ure large-scale policy-based programmes that aim to affect an entire sector country or region SEM makes it possible to measure the statistical relation-ship between several influencing factors (eg public investments project funding disaster resilience of a population) This can be used to estimate the contri-bution of each of these factors one of which may be an intervention It should be pointed out that SEM and time-series designs only serve to estimate the contribution made by an intervention to observed changes
Conclusion and reading recommendation
The overview of available evaluation designs shows that there are several options for measuring impacts each with different potentials and limitations as well as methodological and data requirements This Impact Evaluation Guidebook provides practitioners with guidance on selecting the appropriate approach for a particular CCA project based on its characteris-tics and the available resources It also contains refer-ences to
y definitions and conclusions (blue framed boxes) y CCA project characteristics (green framed boxes) y practical tools and instruments (purple framed
boxes) y further reading material (orange framed boxes)
and y checklists summarising key issues (red framed
boxes)
Depending on the readerrsquos objective the different sections of the Guidebook may be of more or less interest However in order to obtain a comprehen-sive understanding of the subject matter we strongly recommended that you go through the lsquomust readsrsquo Section 12 which provides practical guidance for the planning and implementation of an RIE the summary at the end of Section 3 that contains an overview of the pros and cons of the different evalu-ation designs and leads you through the process of deciding which design to choose and Section 32 that focuses on the requirements for collecting large-scale quantitative data Once a particular evaluation design has been chosen the reader may consult the respective section that describes the chosen design in more detail (Sections 311 to 316) and as the case may be the further explanations in the annex If any of the technical terms or concepts are unclear the reader can consult the glossary MampE specialists who are not so familiar with the characteristics of CCA projects are advised to consult Section 2 in particu-lar Section 21 which discusses the key challenges of CCA projects with regard to their evaluation Finally the case study of an adaptation project in Bangladesh illustrates the application of this Guidebook
Phot
o copy
GIZ
Ran
ak M
artin
Executive Summ
ary
Impa
ct E
valu
atio
n G
uide
book
for C
limat
e Ch
ange
Ada
ptat
ion
Proj
ects
10
Are you planning to provide meaningful evidence of the impact of your climate change adaptation (CCA) project based on a sound empirical foundation Do you want to find out what difference it makes what changes can be observed in the field of inter-vention and how these changes are related to the project activities Or do you aim to gain knowledge about the inherent cause-and-effect relationships of a project learn from the past for the future fur-ther develop the project design or be accountable for the use of funds The decision about how to evalu-ate a project depends on a number of aspects such as the objectives of the evaluation its target groups and stakeholders or the available financial tech-nical human and time resources So the question lsquohowrsquo is closely related to several further aspects eg which design to implement which data collection instruments to apply or which analytical methods to choose
In this Guidebook we assume that you have decided to implement a rigorous impact evaluation (RIE) As the name says the focus of an RIE lies on the measurement and assessment of the impacts of a programme or project According to the OECDDAC evaluation criteria impact means any positive and negative primary and secondary long-term effect produced by an intervention directly or indirectly intended or unintended (OECDDAC 2006 6) Thus basically any observable change occurring in ndash and potentially beyond ndash a field of intervention presum-ably related to the evaluated programme or project may be subject to an RIE Another main characteris-tic of an RIE is that it aims to clearly attribute these observable changes to the intervention being exam-ined or at least to provide sufficient evidence to esti-mate the contribution the intervention has made to these changes Finally the term lsquorigorousrsquo implies that the measurement and attribution or contri-bution analysis is conducted in line with scientific quality standards This means that the findings of an RIE must meet the methodological demands that
apply to scientific research projects (ie that they should be reliable internally and externally valid and objective 3 These requirements ndash the rigorous measurement of impacts and attributioncontribu-tion analysis ndash determine the options for choosing a specific design or specific instruments and methods
As in every scientific research project the selection of the design further depends on the characteristics of the research subject With regard to impact evalu-ation the main characteristic to be considered is lsquowhat kind of impactrsquo needs to be evaluated While impact can be differentiated according to various category schemes (eg social political environmen-tal impacts) the most decisive aspect in terms of evaluation design is the lsquoaggregation levelrsquo at which it occurs This applies to climate change adaptation just as to any other field of intervention A distinction is usually made between three aggregation levels
y Individual (micro-level) impacts ie benefits or drawbacks for particular target groups (eg improving the resilience of a population to cli-mate change effects)
y Institutional (meso-level) impacts ie chang-ing the resources capacities performance etc of organisations such as enterprises governmental or non-governmental institutions (eg strength-ening the capacities of local authorities to deal with the socio-economic consequences of cli-mate change)
y Systemic (macro-level) impacts ie sectoral or regional developments (eg increasing the efforts of a government to reduce climate change-related causes of poverty or ill health)
The different accessibility of data at these levels implies that there is no lsquoone size fits allrsquo design For example while comparative analysis such as is applied in a quasi-experimental design (cf Sec-tion 311) may be suitable for measuring and assess-ing the livelihoods of climate migrants in a specified intervention area the influence on the capacities of basic urban service providers may call for the use of a structural equation modelling approach (cf Section 316) In the latter case there are many competing influences which makes it impossible to establish a comparison group (see Section 4 for an in-depth
3 Reliability internal and external validity and objectivity are count-ed among the most essential scientific quality criteria In empirical studies reliability indicates the correctness of measurement findings Internal validity means that the study design excludes alternative causes for an observed effect as far as possible while external validity means that the findings are in principle transfer-able from an observed sample to a greater population ie can be generalised Finally objectivity describes the independence of the measurement findings from their framework conditions (ie who collects the data who analyses them and under which conditions the findings are interpreted)
1 Introduction
11
discussion of this example) Given the complexity of climate change adaptation needs many CCA projects follow a multi-level approach Thus in an evalua-tion it may be necessary to combine several designs in order to assess the total effectiveness of such a project The Guidebook therefore aims to provide an operationally viable framework for evaluating CCA projects
According to this objective the structure of the Guidebook reflects the points to be considered when planning an RIE starting with a general overview of how to plan such an exercise (Section 12) This is fol-lowed by a discussion of the types and key features of CCA projects the typical challenges in the field of CCA and the way they are currently evaluated (Section 2) Section 3 presents the different options for rigorously evaluating CCA projects including references to the CCA-specific requirements and challenges outlined above The methodological pre-requisites for generating reliable empirical data on a large scale are also discussed Finally two exemplary evaluation designs are outlined on the basis of a GIZ case study (Section 4) including a brief presentation of their practical implementation The Guidebook closes with an annex containing further introduc-tions to some methodological aspects that need to be considered when designing an RIE a glossary of technical terms and further literature references
11 How to use the Guidebook
As the Guidebook aims to provide lsquohands-onrsquo infor-mation it contains a number of hints definitions practical examples links to further reading material and checklists which are highlighted as follows
Definitions and conclusions are presented in blue boxes followed by an exclamation mark
References to CCA projects are presented in green text boxes marked with a magnifying glass
Practical tools and exemplary instruments are presented in purple boxes flanked by two cogwheels
References and links to further reading material are presented in orange boxes highlighted with an open book
Checklists summarising key practical issues and recommendations for providing high- quality evaluation findings are presented in red boxes marked with a tick
Depending on the readerrsquos objective the different sections of the Guidebook may be of more or less interest However in order to obtain a comprehen-sive understanding of the subject matter we strongly recommend you to go through the lsquomust readsrsquo Section 12 which provides practical guidance for the planning and implementation of an RIE the summary at the end of Section 3 that contains an overview of the pros and cons of the different evalu-ation designs and leads you through the process of deciding which design to choose and Section 32 that focuses on the requirements for collecting large-scale quantitative data Once a particular evaluation design has been chosen the reader may consult the respective section that describes the chosen design in more detail (Sections 311 to 316) Some methodo-logical concepts discussed in these sections require some more methodological background and are therefore further explained in Annexes 52 to 56 If any of the technical terms or concepts are unclear the reader can consult the glossary MampE or evalua-tion specialists who are not so familiar with the char-acteristics of CCA projects are advised to consult Sec-tion 2 in particular Section 21 which discusses the key challenges of CCA projects with regard to their evaluation Finally the case study of an adaptation project in Bangladesh illustrates the application of this Guidebook
12 How to plan and implement an RIE for CCA projects
Letrsquos say you have decided to rigorously evaluate a CCA project How can this be done
First of all when planning such an endeavour you must realise that on the one hand an RIE needs to comply with scientific standards in order to produce valid and reliable empirical evidence of the impact of an intervention On the other hand you may face a number of obstacles such as time data and budget constraints (cf Bamberger 2004) which often make it difficult to adhere to such standards Planning any evaluation is therefore always a balancing act between fulfilling methodological demands as far as possible and keeping the evaluation feasible in practical terms To find the right lsquomiddle coursersquo it makes sense to begin the planning of an evaluation by answering a set of questions that determine its general framework
1 Introduction
Impa
ct E
valu
atio
n G
uide
book
for C
limat
e Ch
ange
Ada
ptat
ion
Proj
ects
12
Questions for determining the evaluation framework
` What is the object of the evaluation What is the scope of the evaluation in terms of observed period regions activities etc
` What are the objectives of the evaluation and which criteria will it use to assess the object of the evalua-tion
` Who are the recipients and who are the stakeholders of the evaluation ` What is the time frame of the evaluation When are the evaluation findings needed by ` Which human financial and organisational resources are available for the evaluation ` Who will implement the evaluation What qualifications and experience do the responsible persons have ` How will the evaluation be implemented What is the intended evaluation design Is it feasible with the
available resources ` Which data collection instruments and analysis methods will be applied Are the people in charge of data
collection and analysis familiar with these instruments and methods ` What tasks need to be performed during the evaluation and who will be in charge
As all of these aspects are interrelated it is crucial to answer these questions before actually start-ing to implement the evaluation For instance the scope and objectives depend on the stakeholders and recipients of an evaluation The design which determines the choice of instruments and meth-ods again depends on the available resources and qualifications and so on In view of these manifold interdependencies it makes a lot of sense to clarify document and communicate these issues among all involved stakeholders right from the outset Usu-ally when external consultants are commissioned to carry out an evaluation this is what should be out-lined in the terms of reference and agreed upon in the inception report if not before
When it comes to evaluating CCA projects some of these questions might be more difficult to answer than in other evaluations for instance the second question on the evaluation criteria Due to the lack of consensus about successful CCA (cf Section 22) it needs to be clarified right from the start what is understood by that concept in the specific context of
the project ideally in line with the project objectives Another important aspect which is not unique to the field of CCA however is the question of the sectoral expertise needed by the evaluation team Given the complexity of climate change-related issues a thor-ough understanding of the projectrsquos theory of change is a crucial prerequisite not only for data collection and analysis but also for integrating the findings into a larger (environmentaldevelopment-policy) framework particularly with regard to the projectrsquos contribution to overarching development goals (eg MDGs SDGs country development goals) Therefore it might be recommended to include a sector expert in the evaluation team who provides technical advice on assessing and interpreting the evaluation findings Finally to decide which evaluation design to choose the project characteristics need to be con-sidered (such as the uncertainty of the framework conditions in which it operates or the time frame within which its impacts can be observed) Section 3 of this Guidebook therefore provides several sugges-tions that take these and further characteristics into account
Phot
o copy
GIZ
Flo
rian
Kopp
13
Once these questions have been answered the first step of any evaluation is to develop a data collection plan (also called an evaluation matrix) structured according to the previously defined evaluation cri-teria A data collection plan is the reference docu-ment that guides the evaluation from instrument development to data analysis It provides a tabular
overview of the evaluation questions and hypotheses to be answeredtested the required indicators data sources and availability data collection instruments sampling procedures timing of the data collection data analysis methods responsibilities and required resources The following table gives an example of how such a data collection plan is usually structured
Table 1 Exemplary data collection plan
Analysis dimension
Hypothesis to be testedQuestion to be answered
Indicator Data source
Sample Data type Data collection instrument
Timing of data collection
Data analysis method
Respon-sible
Required resources
Direct outcomes
The livelihoods of climate migrants have improved
Proportion of climate migrants who have a job
Target group (climate migrants)
5 random sample of treat-ment and comparison group
Quantita-tive
Question-naire
Start of project end of project 3 years after end of project
t-test for inde-pendent samples
Evaluator no 1
1 working day (wd) for development of question-naire 2 wds for pre-testing 3 wds for implementing survey X euro for technical implementation
Income of respondent
Proportion of climate migrants who live in formal set-tlements
hellip hellip hellip hellip hellip hellip hellip hellip hellip
Working opportunities have been generated
No of working opportuni-ties
City corpo-rations
na Quantita-tive
Official statistics
Continuous monitoring
Time series analysis
Project officer
na
Types of working opportuni-ties
2 repre-sentatives of each involved city corpo-ration
Qualitative Interview with corporation representa-tives
Start of project then each 6 months update
Qualitative summary
Evaluator no 2
3 wds for conduct-ing interviews in each intervention area
Use of working oppor-tunities by target group
Target group
5 random sample of treatment group
Quantita-tive
Question-naire
End of project
Descriptive statistical analysis
Evaluator no 1
See above
Reasons for acceptance or non-acceptance of working opportuni-ties
Target group
3 groups of 6 to 10 persons in each interven-tion area
Qualitative Focus group discussion
End of project
Qualita-tive data analysis
Evaluator no 2
1 wd for conduct-ing FGD in each intervention area
hellip hellip hellip hellip hellip hellip hellip hellip
Access to health services has been improved
hellip hellip hellip hellip hellip hellip hellip hellip
hellip hellip hellip hellip hellip hellip hellip hellip hellip
hellip hellip hellip hellip hellip hellip hellip hellip hellip
Besides the construction of the indicators another important issue during the development of a data collection plan is the identification of the data sources If data is already available the question of whether they are sufficient for answering an evalu-ation question or whether additional data need to be gathered must be resolved If the available data are insufficient it needs to be decided which further data sources can be tapped and which instruments are applicable There are a number of factors to be
taken into account when deciding for or against a certain instrument including the costs incurred and the human resources and time required to complete the data collection For this it is necessary to draw up a plan of staff time and a finance which also shows who will be carrying out the respective tasks at what times and what costs will be involved The following flow chart summarises the typical sequence of an evaluation
1 Introduction
Impa
ct E
valu
atio
n G
uide
book
for C
limat
e Ch
ange
Ada
ptat
ion
Proj
ects
14
Figure 1 Flow chart for implementing an RIE
Clarication of objectives stakeholders and recipient(s) of the evaluation
Development of a data collection plan Formulation of evaluation questions
and hypotheses Development of indicators Identication of necessary data
sources
Development of survey design and data collection instruments
Data collection and quality check
Data complete
Data aggregation and analysis
Reporting Interpretation of ndings Development of conclusions
and recommendations
Data available
Yes
No
Yes
No
stakeholders need to be clarified A good starting point for considerations of this nature is provided by the feasibility standards established by the American Evaluation Association (AEA) which are intended to ensure lsquothat an evaluation is planned and conducted in a realistic prudent diplomatic and frugal wayrsquo 4
4 Cf httpwwwevalorgpcmldfid=103
During any evaluation a number of precautions need to be taken to ensure that the evaluation find-ings are not only valid and reliable but also well-understood and widely accepted Therefore all involved stakeholders should be informed that an evaluation is being conducted and why Further-more the roles and responsibilities of the different
Feasibility standards of the American Evaluation Association (AEA)
` F2 ndash Practical Procedures Evaluation procedures should be practical and responsive to the way the pro-gram operates Refers to the problem of the feasibility of scientifically ideal collection procedures with regard to the costs they incur and to ethical implications
` F3 ndash Contextual Viability Evaluations should recognize monitor and balance the cultural and political interests and needs of individuals and groups Points out the significance of taking into account the interests of all the stakeholders in a balanced way This is important since the use of the evaluation findings depends to a high degree on acceptance by the various stakeholders and because access to the relevant information often depends on peoplersquos willingness to cooperate
` F3 ndash Resource Use Evaluations should use resources effectively and efficiently Points to the necessity of taking into account the cost-benefit ratio in the implementation of evalua-tions In calculating the costs it is important to consider not only the consumption of tangible (financial) resources but also the intangible outlay (eg the use of time and deployment of human resources) though this can mostly be converted back into financial costs More difficult by far is the quantification of the ben-efit since it is not possible to provide any specific information about the expected findings in advance
15
When evaluating CCA projects it is especially impor-tant to consider the question of contextual viability as interventions may not always generate directly tangible benefits for the target groups All the more important then is to highlight the long-term objec-tives of a project when approaching the target groups for data collection Furthermore due to the usually large number of different stakeholder groups in CCA projects it may be necessary to start by iden-tifying the different needs capacities objectives and strategies of the different groups as well as their interrelations before collecting data For instance when a project focuses on adaptation to diminish-ing natural resources it is necessary to include not only the project beneficiaries but all groups who in principle depend on these resources or have a right to use them Ignoring the often complex actor con-stellations could lead not only to considerably biased evaluation findings (eg overestimation of impact) but also to the refusal of stakeholders to provide important information
Besides these formal aspects a number of further organisational issues need to be taken into account during the evaluation process such as the confi-dentiality of data Given the need to maintain the anonymity of those who provide the information certain rules must be adhered to when providing feedback on the evaluation findings Apart from the fact that there is a moral obligation to the lsquoinform-antsrsquo (ie interviewees participants in written sur-veys etc) not to abuse their willingness to cooperate a number of statutory provisions also exist
Regardless of how well an evaluation is planned and organised unforeseeable events can have nega-tive effects on its scheduling and findings The most common obstacles that must be anticipated when conducting the evaluation include the refusal of the informants to cooperate (refusal to be interviewed etc) and the occurrence of negative unintended effects in data collection (eg a rapidly deteriorat-ing work climate due to the respondents not having been given sufficient information about the evalu-ation) It is advisable in all cases to seek an oppor-tunity to talk to those concerned and if appropriate to arrange a meeting at which everyone is given the opportunity to present their point of view and work together to find solutions for instance through alter-native survey instruments or questionnaires In this situation it is of key importance that the evaluators are able to give a credible impression of their inde-pendence and neutrality
A potentially controversial question is whether or not recommendations should be included in the report and if so how they should be presented If it is decided when clarifying the assignment that recom-mendations will be made it is necessary to point out that they are intended as aids to orientation In other words it must be made clear what the evaluation can achieve and what it cannot in order to avoid unrea-sonable expectations This is even more true of the evaluation of CCA projects as due to the uncertainty of future climate developments a recommendation given at one point in time can prove to be wrong a few years later Therefore it is even more important to develop such recommendations together with the stakeholders and probably further climate experts in a participatory manner eg in the context of a work-shop Furthermore it may also be necessary to clarify the spatial and temporal validity of these recommen-dations and the assumptions under which they were made as regards the development of the framework conditions In any case it is necessary to differentiate between the evaluation findings and the conclusions and recommendations drawn from them
We recommend the following books and articles for further reading about practical evaluation requirements
Bamberger M Rugh J Church M Fort L Shoestring Evaluation Designing Impact Evaluations under Budget Time and Data Constraints American Journal of Evaluation 25(1) 2004 pp 5 ndash 37
Silvestrini S Organizational Aspects of Evalu-ations in Stockmann R (ed) A Practitioner Handbook on Evaluation Edward Elgar Cheltenham 2010
Stockmann R (ed) A Practitioner Handbook on Evaluation Edward Elgar Cheltenham 2010
1 Introduction
Impa
ct E
valu
atio
n G
uide
book
for C
limat
e Ch
ange
Ada
ptat
ion
Proj
ects
16
Phot
o copy
GIZ
Guy
2 Evaluating climate change adaptation projects
The first section of this chapter (21) provides an overview of the types and key features of CCA pro-ject interventions with regard to each level (micro meso macro) The second section (22) describes the challenges when it comes to evaluating CCA projects given their complexity Finally the third section (23) summarises currently used designs and data collec-tion methods to evaluate the results of CCA projects and shows their main shortcomings with regard to the quality of the evaluation findings
21 Types and key features of climate change adaptation projects
While most CCA projects follow a multi-level approach specific interventions (measures activi-ties) of such projects usually focus on a singular impact level be it on a particular target group such as climate migrants (individual level) local authori-ties (institutional level) or the legal and policy frame-work (system level) It is also important to under-stand that all three impact levels are interconnected For instance legal or policy changes (system level)
will necessarily have effects on the institutional level (eg local authorities companies) and the individual level (eg residents of a country or region) The indi-vidual benefits perceived by a specific target group (eg households in an intervention area) may even-tually be scaled up to the institutional and system level (eg through spill-over or other dissemination effects) The reason why it is important to make this distinction though is that the choice of the appro-priate evaluation design depends on the targeted impact level
211 Adaptation projects addressing the individual level
A particular type of adaptation intervention pri-marily affecting the individual level is the so-called community-based adaptation (CBA) approach which is often facilitated by a local organisation and can be implemented like a small-scale development project The primary objective of such an interven-tion is to improve the capacity of local communities to adapt to climate change applying an integrated approach that often combines traditional knowl-edge with innovative strategies Capacity building and awareness-raising are essential elements of such interventions In fact UNDP has found that com-munities and even policy-makers in target countries have limited knowledge of climate change issues especially of adaptation (UNDP 2009) Thus in order to be able to participate effectively locals must be supported to develop a good understanding of these issues which is why a lot of investments are being made in capacity building However working with communities can be a process that requires consider-able time financial resources and energy But it pays off because community engagement generates own-ership (at best) and enables empowerment giving communities a voice and the chance to participate Although CBA projects are situated at local level development cooperation aims to promote action at all levels to achieve systemic and sustainable change Relevant sectors for adaptation include rural devel-
17
Phot
o copy
GIZ
And
reas
K
opment agriculture water resources management coastal management disaster risk management and public health Typical practices address adjust-ments in the behaviour of individual groups as well as in the use and development of technologies (eg construction of large reservoirs adjustments to tra-ditional farming practices and risk reduction for the rural population)
The Community-Based Wetland Management Project (BIRAM) (UNDP 2015a) implemented by Boudhi Investigate and Research Assembly of Men supported by UNDP with funding from the Least Developed Country Fund the Government of Bang-ladesh and the UK Department for International Development is an example of a project that focuses on the micro level in five villages in Bangladesh (community level) The indigenous peoples living in the project areas are confronted with declining rain-fall rising temperatures and decreased water levels due to climate change A nearby stream is the main source of irrigation and fish farming Climate change forecasts predict that temperatures will continue to rise generating aridity in the target regions which will have negative consequences on ecosystems and livelihoods The project focuses on promoting sus-tainable crop varieties improved agricultural prac-tices and improved water collection Moreover it will train community members in alternative income-generating activities to reduce pressure on natural resources and diversify income sources 5
The Sustainable Agricultural Programme (PROAGRO I amp II) (GIZ 2015a) ndash a trilateral cooperation arrange-ment between Bolivia Germany and Sweden ndash is an example of a project that focuses on the individual level Its objectives are the following (1) to increase the resilience of smallholders in arid and semi-arid regions of Bolivia to climate change risks (2) to conserve and distribute scarce water resources as part of integrated watershed management and (3) to increase income from agricultural production A fourth component ndash ie adaptation to climate change ndash was integrated into PROAGRO II implemented by GIZ on behalf of BMZ A vulnerability assessment was conducted in 2013 following the approach of GIZrsquos lsquoVulnerability Sourcebookrsquo (Cordero 2014) The main climate risk is water scar-city which will probably increase in future and will have a negative impact on agricultural production The findings of the vulnerability assessment show that PROAGRO reduced the vulnerability of small-holder farmers by adjusting crop types and sowing dates and replacing old irrigation technologies with
5 More UNDP community-based adaptation projects can be found under the following link httpwwwundp-almorgprojectsspa-community-based-adaptation-project
more appropriate ones which enhanced water effi-ciency in the parcels (id) A mid-term evaluation was also conducted in 2013 using a mainly qualitative evaluation design (analysis of primary and secondary data semi-structured interviews and surveys with national counterparts strategic partners and target groups direct observation focus group discussions) (Kronik 2013)
212 Adaptation projects addressing the institutional level
Effective institutions are a major factor when it comes to the ability to respond to growing climate risks since they are designed to perform a set of functions related to decision-making and imple-mentation (Dixit et al 2011) They play a critical role in increasing societyrsquos capacity to adjust as condi-tions shift and as new climate change knowledge appears In a constantly changing climate the pro-cess of institutional change represents an impor-tant aspect of building adaptive capacities ie the ability of a national government and other entities and individuals to design and implement effective adaptation strategies or to react to negative climate stresses (Dixit et al 2011) Since national policy-makers international negotiators and funders assist in developing methods and guidelines for adapta-tion planning it is essential that they include a focus on building institutional capacity to adapt to cli-mate change impacts One of several ways in which climate-related challenges may require institutions to make significant adjustments involves meeting the needs of the most vulnerable people who tend to be poor or marginalised They usually have few resources with which to adapt and little say in public decision-making processes
Various CCA projects comprise interventions that aim at making an impact at institutional level One example is the National Adaptive Capacity (NAC) framework launched by the World Resources Insti-tute which assists governmental agencies in includ-
2 Evaluating clim
ate change adaptation projects
Impa
ct E
valu
atio
n G
uide
book
for C
limat
e Ch
ange
Ada
ptat
ion
Proj
ects
18
ing institutional capacity development in their adaptation planning processes It enables its users to systematically assess institutional strengths and weaknesses that may help or hinder adapta-tion National adaptation plans may then be better designed to make best use of strengths or remedy weaknesses (Dixit et al 2011) Another example is the Public Investment and Climate Change Adapta-tion (IPACC) project (GIZ 2015b) conducted by GIZ on behalf of BMUB in Peru The aim of the project is to raise awareness ndash among national and regional policy-makers and relevant technicians ndash of the potential environmental social and economic costs of climate change and to encourage decision-makers to consider climate-relevant criteria when formulat-ing and approving public investments Hence meth-ods were designed to integrate disaster risk man-agement and CCA considerations into a countryrsquos national investment planning to increase the adap-tive capacity and reduce climate-related risks (GIZ 2012) Next to initiatives in the policy field there are also CCA projects carried out by non-governmental organisations The DANIDA-funded project Capac-ity Strengthening in Least Developed Countries (LDCs) for Adaptation to Climate Change (CLACC) (IIED 2015) which is operated under the auspices of the International Institute for Environment and Development (IIED) strives to strengthen the capac-ity of civil society organisations in LDCs to adapt to climate change and foster adaptive capacity among the most vulnerable people This implies integrating adaptation to climate change into the work of NGOs and simultaneously setting up a system to share knowledge and experience among the adaptation community In this context IIED helped to establish the International Centre for Climate Change and Development (ICCCAD) in Bangladesh which pro-vides training on CCA and development for NGOs donors media government staff and the private sec-tor
213 Adaptation projects addressing the systemic level
CCA projects aiming to generate system-wide impacts often follow a top-down approach and com-prise interventions at global regional or national level Such interventions target policy changes (eg sectordevelopment strategies) changes in public opinion on a particular topic (eg climate change adaptation requirements) or changes in economic framework conditions (eg introduction of climate
change- adapted value chains 6) With regard to CCA projects two potential intervention types fall under this category country level and global or regional initiatives At the country level CCA projects provide policy advice to support the elaboration of national climate change strategies and action plans or to cre-ate awareness and facilitate consultation among (government) stakeholders The aim is to give con-sideration to climate change risks in laws planning policies and negotiations Such interventions also support the design of targeted policy strategies eg to climate-proof 7 the agricultural sector and intro-duce new crops cropping methods or efficient irri-gation technologies
An example of a CCA project that comprises such interventions at the federal level is the Climate Sup-port Programme (CSP) (GIZ 2015c) launched by GIZ on behalf of BMUB in South Africa in 2009 The projectrsquos aim is to assist the Department of Envi-ronmental Affairs (DEA) in reducing South Africarsquos carbon footprint mitigating climate change impacts and strengthening the countryrsquos resilience to climate change (GIZ 2013) The project supported the devel-opment and implementation of the Governmentrsquos white paper on the national climate policy 8 by pro-viding expertise contributing also to consensus-building among important stakeholders Section 12 of the white paper clearly mandates the develop-ment of an adaptation MampE system Moreover sector departments have started the process of reviewing their policies to align them with the white paper Additionally together with the BMZ-funded project lsquoEffective adaptation finance (MampE Adapt)rsquo GIZ is supporting the development and implementation of a monitoring and evaluation (MampE) system for adap-tation
6 See for instance the project lsquoPromoting a Value Chain Approach to Climate Change Adaptation in Agriculture in Ghanarsquo which aims to help reduce climate-induced risks and thereby contrib-ute to the achievement of food security and income-generating objectives for rural communities by focusing on the improvement and adaptation of the cassava value chain wwwthegeforggefsitesthegeforgfilesgef_prj_docsGEFProjectDocumentsCli-mate20ChangeGhana20-202843682920-20Promot-ing20Value20Chain20Approach20to20Adaptation20in20Ag1-17-20122020ID436820202020Ghana20SCCF20Full20Project20Document20for20Re-submis-sion2020Jan20201220cleanpdf
7 lsquoClimate-proofingrsquo is a methodological approach applied by GIZ that integrates climate change aspects into development plan-ning The reason for climate-proofing projects or programmes is the following even if GHG emissions are drastically re-duced climatic changes will still occur which will be fatal for some pop-ulations and ecosystems and will have negative con-sequences on the countryrsquos economy These climatic changes will gradually become more visible Consequently when de-signing a project it is of the utmost importance to consider climate change aspects especially if the project is supposed to run for a longer period of time (Hahn M 20102-6)
8 See White Paper of the National Climate Change Response Policy (published in 2011) httpravaqsensnetthemestheme_emissions111012nccr-whitepaperpdf
19
CCA projects with a global dimension include vari-ous international players who work together to achieve a common goal They mainly focus on con-ceptual work capacity building and knowledge exchange The institutions involved are responsible for the development of methods and tools for novel topics such as national adaptation plans (NAPs) and also for piloting these tools and methods in partner countries thereby cooperating with existing pro-jects within these countries In a best-case scenario the results and experiences of the CCA projects are shared with the CCA community to enable an exchange of knowledge and good practices through webinars workshops or online platforms 9 One example is the National Adaptation Plan Global Support Programme (NAP-GSP) (UNDP 2015b) for Least Developed Countries which is a UNDP-UNEP programme financed by the Least Developed Coun-try Fund (LDCF) and the Special Climate Change Fund managed by the Global Environment Facility (GEF) It helps LDCs 10 and developing economies to advance with their NAP 11 process through technical assistance provides tools and training to support the NAP process within the country and facilitates an exchange of lessons and knowledge through South-South and North-South cooperation The formula-tion and implementation of NAPs helps to identify the medium- and long-term adaptation needs of a technical institutional and financial nature and simultaneously develop and implement strategies and programmes to address these needs 12
22 Key challenges of climate change adaptation projects
CCA projects (including those with a partial focus on adaptation) pose specific methodological chal-lenges 13 which need to be taken into account throughout the whole project cycle These chal-
9 Examples of online platforms of this kind are wwwadaptation-communitynet wwwundp-almorg wwwadaptationlearning-mechanismcom wwwclimate-evalorg and wwwmediation-pro-jecteuplatform Europe-wide wwwclimate-adapteeaeuropaeu
10 26 LDCs have requested help with their NAP process11 The NAP process was initiated under the Cancun Adaptation
Framework (CAF)12 This paragraph is based on the information obtained on the
homepage (wwwundp-almorg)13 It must be mentioned however that the methodological chal-
lenges described below are by no means unique to CCA projects For instance most SWAPs have long time horizons (eg when re-forming a TVET system it may take several decades for benefits to become visible) uncertainty and shifting baselines are a problem in most fragile contexts and universal indicators (except maybe for education and economic development) are still lacking in most fields of intervention
lenges make it necessary to fine-tune development agenciesrsquo current MampE frameworks especially with regard to the development of indicators baselines milestones targets and the timing of MampE activities which need to be adjusted to the longer time horizon of the majority of adaptation initiatives These chal-lenges are outlined below
First of all the remaining ambiguity of the concepts used may impede the development of appropriate verifiable and measurable indicators There is no clear and commonly accepted definition of adapta-tion adaptive capacity and climate-resilient liveli-hoods which makes it difficult to define objective indicators There is also a lack of consensus about what actually constitutes successful adaptation Consequently there are no universal indicators for CCA projects since they depend not only on the individual project but also on the context scale sec-tor and location Unlike mitigation for which the amount of GHG emissions in the atmosphere serves as a universal MampE indicator the success of an adap-tation intervention cannot be measured by a single indicator Qualitative assessments are as important as quantitative ones since many aspects of adapta-tion are lsquosoftrsquo (eg institutional capacity behaviour change etc)
The establishment of a baseline is considered another major challenge for evaluating climate change adaptation projects A baseline is crucial to measure the projectrsquos impact as it provides a refer-ence point against which a change can actually be measured In climate change adaptation projects future climate change effects also need to be taken into account (ie a baseline projection of how the climate is going to evolve during the project term and beyond) Since climate change is most likely to unfold differently than assumed in the projection experts speak of a lsquoshifted baselinersquo Shifting baselines are considered to be problematic in terms of plan-ning since they change the context of the adaptation intervention
Thus uncertainty about actual climate change pat-terns and their effects is another aspect that needs to be addressed It may be impossible to anticipate when for example the next flood will occur in order to analyse to what extent adaptation took place in situ compared to the situation before the interven-tion Moreover adaptation strategies marked as suc-cessful in the short term may have negative impacts on vulnerability in the long term
2 Evaluating clim
ate change adaptation projects
Impa
ct E
valu
atio
n G
uide
book
for C
limat
e Ch
ange
Ada
ptat
ion
Proj
ects
20
Finally the long time horizon of potential climate change impacts poses an additional challenge that needs to be considered when designing the MampE framework for CCA projects Long-term impacts are unlikely to result from the project alone Instead they are rather generated by a series of factors or other interventions in the specific area Complexity increases when trying to identify the short-term and long-term outcomes that can be attributed to a par-ticular intervention For example the choice of farm-ing practices in a sustainable agriculture project also reflects the thought given to current or future cli-mate change However it remains difficult to isolate and assess the individual adaptation components reflected by these choices
23 Review of current methods to evaluate the results of CCA projects
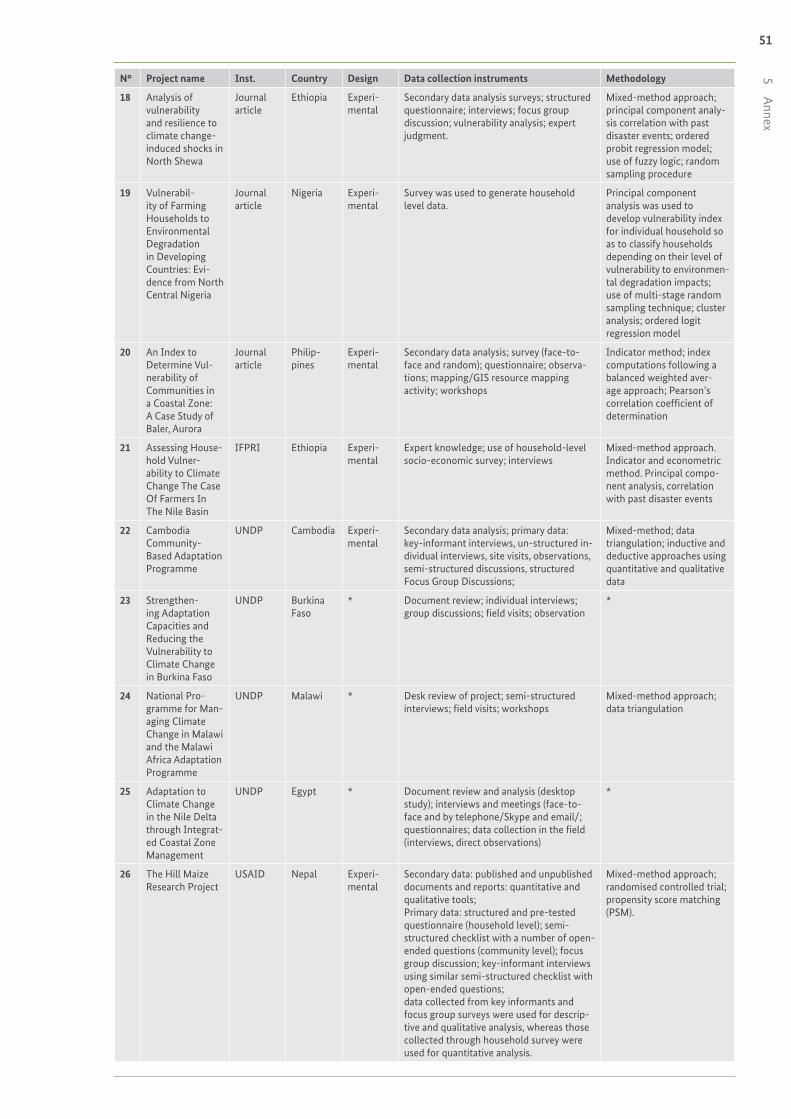
The projects reviewed are conducted in developing countries and emerging economies 14 For the pur-pose of this guidebook emphasis was placed on the methodology ie the analysis of currently used eval-uation designs (experimental quasi-experimental ex-post etc) the presentation of the main data col-lection methods used (focus group discussions inter-views surveys direct observation etc) and lastly whether a quantitative qualitative or mixed-method approach was used The findings are summarised in Annex 51
During the research process two problems became visible first little use is made of RIEs in CCA projects which relates to the second finding namely the diffi-culty of ascertaining which evaluation methodology was applied Often it was difficult to identify which design was used since there was no reference to it in the methodology section of the evaluation Due to this difficulty we checked for keywords in the evalu-ation papers (eg randomisation randomised con-trolled trials (RCTs) control or comparison group quasi- and experimental design counterfactual and so forth) Very often none of these keywords were found in the whole document which is why there is no reference to the evaluation design in the table in Annex 51
14 Three different research approaches were used for this study (a) a simple google search using the following keywords lsquoclimate change adaptation impact evaluation vulnerability vulnerability assessments monitoring and evaluation of climate change adaptation adaptive capacity and resiliencersquo (b) a review of the reference lists of the journal articles found in (a) and (c) the scan-ning of relevant evaluations carried out by development agencies international organisations or independent evaluation institutions
Prowse and Snilstveit came to a similar conclusion in their study Impact Evaluation and Interventions to Address Climate Change A Scoping Study 15 pub-lished in 2010 saying that just a few RIEs were con-ducted (using mainly a quasi-experimental design) Although Prowse and Snilstveit recognised the chal-lenging nature of CCA projects this does not impede the use of RIEs Especially with regard to the increas-ing financial resources made available for climate change mitigation and adaptation projects it is important to make use of RIEs because evidence of the effectiveness of spending is required
Challenges inherent to evaluations of CCA projects involve the poor quality of the baseline (if there is one at all) randomisation and the development of a sample size which is often not representative The possible spreading of benefits from target to non-target groups is another limitation often referred to (see example below) In general data triangulation ie using a combination of qualitative and quantita-tive indicators (mixed-method approach) is visible in almost all CCA projects 16 which can be seen as a sign of progress in this field Just to name one example the evaluation of the project lsquoChronic Vulnerability to Food Insecurityrsquo implemented by the World Food Programme triangulates data from qualitative and quantitative sources It uses qualitative data from focus group discussions with community mem-bers and key-informant interviews with commu-nity opinion leaders and quantitative data involv-ing about 3000 randomly sampled households (cf Annex 51)
Another interesting finding concerns the way inter-national organisations conduct evaluations These evaluations are aligned with the Paris Declaration on Aid Effectiveness basing the evaluation mainly on the assessment of effectiveness efficiency relevance impact and sustainability (the DAC criteria) There is often no reference to the applied methodology
To name an example consider the Pacific Integrated Water Resource Management (IWRM) project (UNDP 2015c) established in 2009 which aimed to improve water resource and wastewater management and increase water use efficiency in Pacific island coun-tries in order to balance overuse and conflicting uses of scarce freshwater resources The evaluation is based on the DAC criteria for evaluating develop-ment assistance but it does not explain which design
15 Impact Evaluation and Interventions to Address Climate Change A Scoping Study httpwwwtandfonlinecomdoipdf10108019439341003786729
16 Although CCA evaluations are sometimes based on desk reviews and qualitative indicators (eg stakeholder interviews focus group discussions direct observations etc) and often lack robust quantitative data (see for example project Ndeg 31 in the table in Annex 51)
21
was applied In the methodological part only the data collection instruments are outlined (ie desk review and analysis interviews site visits) The same is true of many other evaluations within the Evalu-ation Resource Centre 17 of UNDPrsquos Independent Evaluation Office 18
In general when screening evaluations conducted by international organisations (see for instance the database of IFAD and the Global Environment Facil-ity (GEF) it becomes obvious that they have not conducted many rigorous impact evaluations so far hence there is not much experience in this field Take the Independent Evaluation Office of IFAD for instance narrowing down the search to look only at impact evaluations there is just one evaluation that was conducted in Sri Lanka in 2013 (Dry Zone Livelihood Support and Partnership Programme (DZLISPP)) 19 Although it is the only impact evalua-tion there is a clear methodology behind it For the first time IFAD undertook extensive data collection and analysis including a qualitative survey (30 key-informant interviews with project staff and relevant government officials) 41 focus group discussions with beneficiaries and a quantitative survey of over 2560 households Due to an absence of baseline data (which is often the case in CCA projects) two strate-gies were applied (1) an attempt to reconstruct the baseline through recall methods and (2) the use of a quasi-experimental design that does not strictly require baseline data Further challenges experienced were sample selection bias due to targeting and the potential spreading of benefits from target to non-target groups
The Independent Evaluation Office of the GEF offers more than one impact evaluation but the overall number is modest Furthermore the few impact evaluations that have been conducted only concern climate change mitigation projects (there are none for CCA projects yet) However although the GEF has not yet implemented many impact evaluations it
17 Evaluation Resource Centre httpercundporgindexhtml18 Independent Evaluation Office httpwebundporgevaluation19 Dry Zone Livelihood Support and Partnership Programme
(DZLISPP) httpwwwifadorgevaluationpublic_htmleksystdocimpact2013srilankaindexhtm
is clear that they deal with this topic since there are many publications that emphasise the impact evalu-ation of climate change projects It will surely be only a matter of time until there is a spillover to CCA pro-jects too In 2014 the GEF Independent Evaluation Office together with a number of multilateral and bilateral organisations including GIZ hosted the Sec-ond International Conference on Evaluating Climate Change and Development which aimed to promote and develop methods and good practices for MampE of adaptation and mitigation 20 A book of conference proceedings will be published by Springer in 2016
To be fair it has to be stressed that many CCA pro-jects focused on policy development and capacity building exercises at institutional level for which RIEs may not be an adequate evaluation design The National Adaptation Plan Global Support Pro-gramme or the Climate Finance Readiness Pro-gramme are examples where RIEs might be compli-cated These are global CCA projects that focus on policy development capacity building at institu-tional level and making sure that the target country is ready (institution-wise) to receive the financial resources earmarked for CCA projects
It should also be mentioned that lsquolearningrsquo is in many cases not the focus of the evaluation Frequently evaluations focus rather on the question lsquoHave we done what we said we wouldrsquo (accountability) than on lsquoWhat happened and whyrsquo (learning) This is especially true of development organisations (exam-ples are outlined in the table in the annex) Addi-tionally while screening CCA projects carried out by development organisations it became clear that many projects are still ongoing This means that an evaluation still has to be completed At best this pub-lication may raise awareness among practitioners to consider RIEs for CCA projects in order to increase the use of this evaluation design gain relevant expe-rience and simultaneously obtain valuable findings that can be shared with the adaptation community
20 Presentations and videos from the conference can be accessed at httpswwwclimate-evalorgevents2014-conference
Phot
o copy
GIZ
Ran
ak M
artin
2 Evaluating clim
ate change adaptation projects
Impa
ct E
valu
atio
n G
uide
book
for C
limat
e Ch
ange
Ada
ptat
ion
Proj
ects
22
3 Rigorous evaluation designs and examples of applicability in climate change adaptation projects
Having discussed the types and key features of CCA projects and the way they are currently evaluated this section will now provide an overview of the strategies and prerequisites for evaluating the impact of such projects bearing in mind their characteris-tics The first section thus deals with the potentials and limitations of different research designs used for impact evaluations when it comes to their applica-tion in the field of climate change adaptation (31) Section 32 discusses the methodological require-ments for providing reliable data on a large scale with a particular focus on adequate survey sampling techniques
31 Overview of evaluation designs ndash potentials and limitations for climate change adaptation projects
Before going further into the topic as such the term lsquodesignrsquo should be briefly explained as it is occasion-ally used with different meanings and confused with other terms such as lsquomethodrsquo or lsquoinstrumentrsquo
Generally speaking a research design describes how a research question is intended to be answered Evaluation designs usually differ with regard to the points in time when data is collected the data sources and the way the data is analysed (eg by com-paring target group with comparison group data) Most common evaluation designs are ex-post facto designs and single-difference designs (ie before-and-after comparisons or group comparisons) How-ever as these designs are not suitable for evaluating impact ndash at least when used as the only means during an evaluation ndash they are not discussed further in this Guidebook Instead we shall go on to present alter-native and more sophisticated evaluation designs that can provide sufficient empirical evidence
about the attribution or at least contribution of an intervention to observed changes We will explain the types of projects to which they can be applied which time budget and data resources they require and how informative their findings are We will also assess how valid and reliable the evaluation findings are provided the design has been implemented cor-rectly
A research design describes how a research question is answered
The descriptions start with experimental and quasi-experimental designs (311) which are favoured by a number of evaluation experts (eg DufloGlen-nersterKremer 2008 see also literature list at the end of this section) and considered by some as the lsquogold standardrsquo for impact evaluation In 312 an alternative approach for estimating the impact of an intervention is discussed so-called propensity score matching which may be suitable when poten-tial beneficiaries cannot be randomly assigned to a treatment and comparison group The next sec-tion deals with the so-called pipeline approach (313) This approach is of particular use if a project is implemented sequentially but aims to support target groups that feature comparable characteris-tics Another approach that is useful when the treat-ment decision depends on the beneficiary present-ing a threshold level of a specific characteristic (eg income or age) called the regression discontinu-ity approach is discussed in Section 314 In Sec-tion 315 the potentials of time-series evaluation designs are discussed by means of the so-called panel analysis Time-series designs are of particular value for long-term projects and observation periods and when complementary statistical data is acces-sible The last design discussed in detail is suitable for projects that aim to make a difference at policy level (type I and II projects) as it can provide empiri-cal evidence about their contribution to changes in a complex environment taking external influences into account (316) The design is called structural equation modelling and comes from the field of econometric research where it is commonly used to identify causal linkages between social and eco-nomic phenomena such as education and health The section closes (317) with a tabular overview of the applicability of the evaluation designs discussed above their methodological and practical require-ments and the validity of their findings (if applied correctly) The purpose of this overview is to enable the reader to choose a particular design bearing in mind the adaptation-specific project characteris-tics and given the financial technical and logistical framework conditions
311 Experimental and quasi- experimental designs
The following section outlines the main characteris-tics potentials and limitations and methodological prerequisites for applying an experimental or quasi-experimental design during an evaluation We will also discuss the kind of CCA-related interventions to which such designs can be applied and which meth-odological skills and (financial human and time) resources are required
Generally speaking experimental and quasi-exper-imental designs (in the field of applied empirical social sciences) consist of a comparison of two groups at two points in time One group receives a certain treatment (intervention measure activity etc in the following named lsquotreatment grouprsquo) and the other does not A design is called experimental or more precisely a randomised controlled trial (RCT) if the members of each group are selected at random This means that (ex-ante) the probability of each indi-vidual being a member of the treatment group is the same 21 The group that has not received any treatment is then called a lsquocontrol grouprsquo If such a random selec-tion cannot be ensured (eg due to self-selection bias or conscious selection) then such a design is called quasi-experimental In that case the group without treatment is called a lsquocomparison grouprsquo 22 However in order to simplify matters we will consistently use the term lsquocomparison grouprsquo in the remainder of this document
Experimental designs require a randomised selection of participants for an intervention
The purpose of employing such a design is to allow for attributing observable changes in a given popu-lation to an intervention This is done by estimating the so-called counterfactual ie the hypothetical situation of that population without having received the treatment In other words we do so by answer-ing the question lsquoWhat would have happened if no intervention had taken placersquo While estimating the counterfactual is also the foundation for calculating the treatment effect in pre- and post-test analyses and
21 It has to be highlighted that the equal probability that individuals of a given basic population will receive a treatment needs to be considered at the project planning stage That means that an RCT can only be applied if the project design allows for a random selec-tion of the treatment group
22 The rationale behind this distinction is that a lsquonon-interventionrsquo group that has not been selected at random cannot by definition act as a lsquocontrolrsquo for any time-variant or invariant variables There-fore particularly in the social sciences the term lsquocomparison grouprsquo is frequently used in settings where the groups were not selected at random
comparative analyses these designs have consider-able weaknesses regarding their underlying assump-tions These weaknesses compromise the validity of their findings in many cases In a simple pre- and post-test design the measurement prior to the inter-vention is taken as the counterfactual assuming that the situation of the target group would have remained stable without the intervention However because there is usually a considerable time span between the measurements this assumption is not valid as it cannot be assured that no other external factor would have influenced the situation of the treatment group Comparative designs estimate the counterfactual by collecting ex-post data from both the treatment group and a group that has not taken part in or benefited from the intervention ie a com-parison group In this case one assumes that the situ-ations of the treatment group and the comparison group were identical before the intervention How-ever this assumption cannot be held true either due to the potential selection bias The selection bias may be based on the intervention design (eg focusing on the most needy persons) the individual characteris-tics of the participants (eg self-selection by voluntari-ness) or on practical issues such as a limited budget the accessibility of the treatment group or other logis-tical constraints
Experimental and quasi-experimental designs tackle the issue of intervening time factors and potential differences between target and comparison groups by combining both a pre- and post-test and a compara-tive design This means that data is collected from both the target group and the comparison group before and after the intervention The net effect of an intervention (ie net average treatment effect) is then calculated on the basis of the average difference in the observable changes between the treatment and the comparison group (also called double-difference or difference-in-difference approach see Annex 52 for a further introduction to the calculation of the net average treatment effect using this approach)
Phot
o copy
GIZ
Har
ald
Fran
zen
3 Rigorous evaluation designs and exam
ples of applicability in climate change adaptation projects
Impa
ct E
valu
atio
n G
uide
book
for C
limat
e Ch
ange
Ada
ptat
ion
Proj
ects
24
CCA-specific requirements and challenges
Experimental and quasi-experimental designs are applicable to CCA projects whenever project measures aim at generating a direct impact at individual level ie if a distinguishable target group (eg inhabitants of a particular disaster-prone area farmers in arid regions) receive a specific benefit (eg knowledge of how to seek shelter in case of emergency technical assistance to install drip-irrigation systems) In order to apply such a design it must also be possible to establish a treatment and control or comparison group While in some cases the division of a population into a treatment and controlcomparison group may not be appro-priate for ethical reasons (ie if the denial of support would lead to an immediate deadly peril eg medi-cation in an epidemic) in many other cases financial logistical or technical constraints inevitably lead to selecting a sub-group of a larger population that in principle shares the same needs
A further requirement for applying an experimental or quasi-experimental design is that it must be pos-sible to detect an impact within a manageable time frame While it holds true that it may take a long time for CCA project impacts to become visible ndash which is also the case for impacts in other fields such as edu-cation financial systems or private sector development ndash there may also be some ways to work around the relevant constraints Referring to the first example mentioned above for instance one would not have to wait until another disaster happens to see if the project participants are able to seek shelter faster than those who did not participate A simple observation with a stopwatch during a test alarm would probably do the trick as well Concerning the second example it may not be necessary to wait until the environmental framework conditions have deteriorated in another 20 years to see if the drip-irrigation systems lead to the desired impact Even without any (further) climate change one can measure the reduced water consump-tion and increased yield in comparison to conventional farming methods However in the latter case too a time-series design (cf Section 315) may be a viable alternative for identifying the long-term impact of the project particularly if a comparison group can be established
It must be mentioned though that experimental and quasi-experimental designs also feature a number of challenges which limit their applicability to some extent First of all such designs require considerable tech-nical logistical and thus financial resources As one can imagine the collection of data from a large num-ber of people (cf Section 32 for further considerations about required sample sizes) particularly if they are located in difficult-to-reach areas is costly and time-consuming Furthermore the necessity to collect this data also from people who did not receive any benefit may be difficult as they may be not as willing to con-tribute to such an analysis as those who did For example a farmer who did not receive any technical assis-tance may not be as willing to provide information about his yields In such cases a suitable project design (possibly a pipeline approach see Section 313) may increase the willingness to participate
Finally the findings of such designs are prone to a certain degree of bias such as spill-over and conta-gion effects A spill-over effect means that the controlcomparison group indirectly receives a benefit eg through copying or learning from the treatment group (eg if the trained habitants in the disaster-prone area tell others who were not trained how to behave or if farmers who did not receive any assistance adopt irrigation schemes because they recognise their comparative advantage) Contagion effects may occur if the project under investigation is not the only one to provide support in the target area ie if other DC agencies are active in the same field In that case it may be difficult to attribute the observable impact to the particu-lar intervention (eg if the farmer was able to increase his yield because of the technical support provided by GIZ or because of the micro-credit he received from the ADB) While spill-over effects usually lead to an underestimation of the treatment effect (ie as the controlcomparison group receives a benefit as well) contagion effects can lead to both the over- and underestimation of the treatment effect depending which group has been (more) contaminated by other support measures Thus in multi-donor settings contribution analyses such as those conducted as part of a structural equation modelling approach (cf Section 316) may be more promising
25
312 Matching techniques
In an experimental design comparing the differ-ences in the outcomes of the treatment and control group would be sufficient for calculating the net effect of an intervention However as treatment groups are rarely selected randomly often such a design cannot be implemented in practice To obtain valid evaluation findings all the same the induced selection bias described above needs to be compen-sated for Various approaches are available for this purpose among these matching techniques appear to be especially suitable in evaluation studies The basic idea of matching techniques is to establish for each member of a treatment group a sub-set of pos-sibly similar comparison group members in order to estimate the treatment effect by calculating mean group differences That means that the counterfac-tual situation of the treated person (ie what would have happened if this person had not participated in the project) is approximated through the assignment of similar persons who have not participated
Matching techniques aim to approximate the counterfactual by comparing the outcomes of individuals from the treatment and the compari-son group that have identical or at least similar characteristics
A common matching approach is to identify statisti-cal twins by comparing individual characteristics (ie dimensions) that are supposed to have an influence on the outcomes of an intervention For example if one suspects that the effectiveness of a training measure (eg teaching farmers how to grow drought-resistant crops) also depends on the age and gender of the beneficiary the treatment and comparison group can be clustered accordingly and the outcomes can be individually compared for each sub-sample The following table illustrates the principle of the matching approach using the mentioned example
For further reading about impact evaluation in general and the above-discussed methodological aspects the potentials and limitations of experimental and quasi-experimental designs and particularly their practical implementation the following books articles and papers are recommended
General methodological introduction
Bertrand M Duflo E Mullainathan S How Much Should We Trust Differences-in-Differ-ences Estimates Working Paper 01 ndash 34 MIT Cambridge 2001
Stern E Stame N Mayne J Forss K Davies R Befani B Broadening the range of designs and methods for impact evaluations Working Paper 38 DFID London 2012
White H Some Reflections on Current Debates in Impact Evaluation International Initiative for Impact Evaluation New Delhi 2009
Practical guidelines and examples
Chambers R Karlan D Ravallion M Rogers P Designing impact evaluation different per-spectives International Initiative for Impact Evaluation New Delhi 2009
Khandker SR Koolwal GB Samad HA Handbook on Impact Evaluation Quantita-tive Methods and Practices The World Bank Washington DC 2010
Leeuw F Vaessen J Impact Evaluations and Development NONIE Guidance on Impact Evaluation NONIE Washington DC 2009
Vaessen J Todd D Methodological challenges of evaluating the impact of the Global Envi-ronment Facilitys biodiversity program Evalu-ation and Program Planning 31 2008 pp 231 ndash 240
3 Rigorous evaluation designs and exam
ples of applicability in climate change adaptation projects
Impa
ct E
valu
atio
n G
uide
book
for C
limat
e Ch
ange
Ada
ptat
ion
Proj
ects
26
Table 2 Example table for matching on observables
Group Treatment group Comparison group
Gender Male Female Male Female
lt 40 years old
ge 40 years old
Annotation Each cellarrow colour indicates an individual comparison
As the table shows each sub-sample of the treatment group (eg men of the age of 40 and above) is com-pared with a sub-sample of the comparison group that has the same characteristics The problem with this so-called matching on observables approach is that the size of comparable sub-samples decreases as the number of relevant dimensions grows This again limits the possibility of conducting statistical tests (eg t-test for comparing mean values of independ-ent samples) that require a minimum cell count of approximately 30 cases in order to reach valid find-ings
Another matching technique that has gained atten-tion in the last years is called propensity score matching (PSM cf RosenbaumRubin 1985) The advantage of this technique is that in contrast to matching on observables it provides a one-dimen-sional score for comparison (the so-called propensity score) that indicates the probability of any individual being a member of the treatment group Since this approach is methodologically quite demanding and thus requires a strong theoretical background its application will not be discussed here in detail Instead a short introduction into PSM and further reading material can be found in Annex 53
CCA-specific requirements and challenges
When we look at how these matching techniques can be applied to CCA projects the same characteristics apply as mentioned in the preceding section because they are primarily used on an individual level While institutional or even spatial (regional city-wise) matching can also be found in evaluation practice the meth-odological foundations and practical experiences concerning the validity of the findings provided by such matching approaches are still rather limited Therefore it is not recommended to pursue such an approach lsquoaboversquo the individual level Regarding the variables that are used for matching in the context of CCA projects it may be possible to work with characteristics such as proximity to hazardous areas degree to which individuals are affected by climate change effects or affiliation to specific ethnic social or religious groups etc
The challenges presented by matching approaches include two issues in particular The necessity of a rela-tively larger sample in order to find sufficient matching partners and the question of which characteristics to choose for the matching While the first issue constitutes a technical problem that can be solved by allocat-ing sufficient resources the second is a theoretical one which requires comprehensive sectoral and regional expertise The analysis of matched data can lead to significantly different findings compared with unmatched data depending on which characteristics are considered relevant Therefore it is of the utmost importance to substantiate the selection of the matching variables based on sound theory The most important questions to be answered in that regard are
` Could the characteristic influence the effectivenessoutcome of the intervention for the individual ` Does the basic population comprise sufficient individuals with different characteristics ` Will it be possible to identify sufficient individuals in the target group with identical characteristics
We should also point out that matching may not prevent potential bias as described in 311 However it may be possible to perform matching using aspects such as lsquodegree to which individuals are affected by other inter-ventionsrsquo in order to at least reduce the risk of contagion effects
27
For further reading on the methodological aspects potentials and limitations of PSM as well as its practical implementation the following books articles and papers are recommended
General methodological literature about PSM
Becker S Ichino A (2002) Estimation of average treatment effects based on propensity scores The Stata Journal 2(4)358 ndash 377
Luellen JK Shadish WR amp Clark MH (2005) Propensity scores An introduction and experimental test Evaluation Review 29(6)530 ndash 558
Morgan SL amp Winship C (2007) Counterfactu-als and causal inference methods and prin-ciples for social research Cambridge NY Cambridge University Press
Guo S amp Fraser MW (2010) Propensity score analysis Statistical methods and applications Thousand Oaks Sage
Steiner PM Cook TD Shadish WR amp Clark MH (2010) The importance of covariate selection in controlling for selection bias in observational studies Psychological Methods 15(3)250 ndash 267
Practical guidelines and case-studies
Caliendo M amp Kopeinig S (2008) Some practical guidance for the implementation of propen-sity score matching Journal of Economic Sur-veys 22(1)31 ndash 72
Cook TD amp Steiner PM (2010) Case match-ing and the reduction of selection bias in quasi-experiments The relative importance of pretest measures of outcome of unreliable measurement and of mode of data analysis Psychological Methods 15(1)56 ndash 68
Diaz JJ amp Handa S (2006) An assessment of propensity score matching as a nonexperi-mental impact estimator Evidence from Mex-icorsquos PROGRESA program Journal of Human Resources 41(2)319 ndash 345
Gaus H Muumlller C E (2012) Evaluating free-choice climate education interventions apply-ing Propensity Score Matching Evaluation Review 35(6)673 ndash 722
313 Pipeline approach
Often projects are not implemented on a broad scale right from the beginning targeting the entire poten-tially relevant target group but sequentially This may be because of logistical or budgetary reasons In these cases a so-called pipeline approach can be of particular use The idea behind the approach is that the section of the target group that receives a treat-ment (ie benefits from or takes part in a project) at a later stage can be used to approximate the counter-factual situation of those who did receive the treat-ment at the time of data collection In other words the part of the target group that is not yet affected
serves as a quasi-comparison group for the already affected part of the group In principle the approach can be applied repeatedly during an intervention depending on the number of phases in which the treatment (ie measures activities etc) is provided
In a pipeline approach the part of the treatment group that has not yet received any treatment is used for comparison
Figure 2 illustrates the basic concept of the approach using a three-phase intervention design
3 Rigorous evaluation designs and exam
ples of applicability in climate change adaptation projects
Impa
ct E
valu
atio
n G
uide
book
for C
limat
e Ch
ange
Ada
ptat
ion
Proj
ects
28
Figure 2 Illustration of the pipeline approach
( )t0 t1 t2 t3Timeline
Project phase IIIGroup C
Project phase IIGroup B
Project phase IGroup A
Ex-antebaseline data collection Final data collection Ex-postfollow-up data collection
( )
( )
As the figure shows in a three-phase project a total of four data collections (t0 ndash t3) are necessary of which at least during two (t1 amp t2) data sets have to be collected from two groups (group A amp B t1 respectively group B amp C t2) The treatment effects would then be estimated as in an ordinary single-difference design whereby group B would represent the comparison group to group A and group C to group B Provided the total project duration suffices ex-postfollow-up data from groups A amp B could also be collected at t3 which would probably allow further conclusions to be drawn about the sustain-
ability of the achieved results Further data collec-tions are conceivable such as from group C at t0 and t1 in order to estimate spill-over effects from groups A and B or to control for external influences on outcome variables (eg contagion effects from other projects) In any case the approach is quite flex-ible as it can be modified according to the informa-tion needs It can even compensate for a lsquoforgottenrsquo baseline study to some extent provided the group characteristics are comparable and remain relatively stable over time ie when the influence of external factors is negligible
CCA-specific requirements and challenges
With regard to evaluating CCA projects the pipeline approach is applicable for interventions that are planned to be implemented in phases for instance in different areas andor institutions (eg development and implementation of environmental information systems for local authorities in different provinces) and that aim to generate impact at individual or institutional level Provided that this is the case as outlined above it is still possible to start collecting data after the project has started ie it is not necessary to have baseline data for the first project phase This may be a considerable benefit for all projects that follow a replication or scaling-up design with a preceding pilot phase in which the (technical logistical etc) feasi-bility of the measures is tested before they are rolled out in other areas
The pipeline approach might also be of particular value for CCA projects which are confronted with the problem of shifting baselines (cf 22) The pipeline approach makes it possible to trace developments by comparing the baselines for each group (provided the group characteristics are in principle comparable) It may also be an option for projects that aim at generating long-term impacts that might not be observable directly at the end of their implementation
When applying a pipeline design however it should be borne in mind that each data collection phase is just as labour-intensive and time-consuming as a quasi-experimental design given that data needs to be collected for both the treatment and a comparison (ie future treatment) group except for the first and last round The same quality criteria therefore apply
The references to literature on experimental and quasi-experimental designs at the end of Section
311 are also suitable for further reading on the pipe-line approach
29
314 Regression discontinuity design
The approach discussed in this section is of par-ticular use when project participantsbeneficiaries are consciously selected on the basis of one specific characteristic that distinguishes them from non-participantsbeneficiaries (eg income) though they are similar in a number of other respects (eg loca-tion income sources education) If the participationeligibility of an individual depends on the value of a particular indicator that is relevant to the outcome of an intervention the treatment effect can be esti-mated by the so-called regression discontinuity design (RDD) The basic idea behind the approach is to estimate the treatment effect by comparing the
pre- and post-treatment indicator values (scores) of only those individuals from the treatment and com-parison group that are most similar with regard to their pre-treatment outcome score ie that lie within a comparison range close to the threshold level Fig-ure 3 shows the sample selection for assessing the treatment effect
The regression discontinuity design can be applied if project participantsbeneficiaries are selected based on a special characteristic that distinguishes them from non-participantsben-eficiaries
Figure 3 Selection of individuals for comparison
Individuals
Pre-intervention outcome score
Threshold levelComparison range
Untreated individuals
Compared untreated individuals
Compared treated individuals
Treated individuals
It is mandatory to adhere to the threshold level throughout the selection process as otherwise the regression analysis would lead to less valid findings Furthermore it must be assured that the individu-als cannot influence the pre-intervention outcome score (eg by temporarily lowering their income in order to receive support) as this would also bias the findings
Once the sample has been identified the pre- and post-treatment outcome scores are used to cal-culate regression functions for each group If the
intervention had an effect on the treatment group the functions should show different values at the threshold level This difference can be interpreted as the local average treatment effect for individuals that are most similar ie whose outcome values lie very close to the threshold line The discontinuity of the regression functions of the treatment and com-parison group can also be visualised by a Cartesian coordinate system in which the X-axis represents the pre-treatment and the Y-axis the post-treatment outcome score Figure 4 shows how such a disconti-nuity may look
Figure 4 Outcome scores before and after intervention
Pre intervention outcome score
Post intervention
outcomescore
Threshold level
Comparison range
Non treated individuals
Compared non treated individuals
Compared treated individuals
Treated individuals
3 Rigorous evaluation designs and exam
ples of applicability in climate change adaptation projects
Impa
ct E
valu
atio
n G
uide
book
for C
limat
e Ch
ange
Ada
ptat
ion
Proj
ects
30
As the treatment effect estimated with the RDD is based on a comparison of most similar individuals it can be considered to be widely unbiased How-ever a disadvantage of the approach is that the effect may not be generalisable for the entire population because individuals become less comparable the further they are from the threshold level Another disadvantage is the fact that in comparison to other designs RDD only uses a small fraction of the entire population to estimate the treatment effect
Due to its relatively ambitious requirements and methodological reservations RDD has only played a minor role in impact evaluation studies so far Never-
theless it may be applicable particularly for policy-field evaluations with large and clearly defined treatment groups provided the above-mentioned methodological requirements can be met In some publications (KhanderKoolwalSamad 2010) the use of a regression discontinuity approach is also recommended in scenarios where a threshold level is spatially defined (ie a geographical national or administrative border) However such an applica-tion needs to be carefully reviewed as populations in different regions present unobserved covariates (eg cultural or religious background) that may limit their comparability
CCA-specific requirements and challenges
RDD can be of particular use for evaluating CCA projects that focus on creating an impact at individual level and are implemented under framework conditions that involve a high degree of uncertainty provided the projects comply with the methodological requirements outlined above The benefit lies in the compara-tively simple data collection setup and clear interpretability of the evaluation findings which are quite robust against bias at least for those individuals who are very similar
On the other hand it has to be added that the findings are only of limited external validity Furthermore as only very similar individuals are compared (at least with regard to the outcome variable that is of interest) the sample selection can be less efficient because only a smaller number of individuals (ie those who are very similar) can be used for comparison Another challenge which is not restricted to CCA projects though is that it requires the project to adhere to a defined threshold level not to lsquoshiftrsquo it or make exceptions which in practice often proves to be a problem It is also only suitable for interventions where the impact becomes vis-ible in a manageable time frame which is not often the case for CCA projects
Finally it should be added that besides the outlined basic RDD there are several further more sophisti-cated variations of the approach These include ran-dom assignment at the threshold level or with more than one threshold level (eg if the treatment group is split further in sub-groups that receive different kinds of support depending on their pre-treatment outcome score) which cannot be discussed here
Therefore the following books articles and papers are recommended for further reading about methodological and practical require-ments as well as further applications of the approach
Imbens GW amp Lemieux T Regression discontinuity designs A guide to practice Journal of Econometrics 142(2) 2007 pp 615 ndash 635
Khandker SR Koolwal GB Samad HA Handbook on Impact Evaluation Quantita-tive Methods and Practices The World Bank Washington DC 2010
315 Time-series designs
While most evaluations focus on a limited time frame defined by the duration of an intervention sometimes it may be necessary to cover a longer period eg when the effectiveness of a series of past support activities or the development of (politi-cal economic etc) framework conditions are to be reviewed In those cases time-series designs can be of particular use We should add that there is no sin-gle time-series design this is rather an umbrella term for a number of different approaches What they have in common is that they are based on repeat-edly collected data over a longer period Time-series designs can be distinguished by whether they make use of only descriptive or also inferential statistics if data from the same analytical units (eg individuals households organisations cities countries) is used or not and if the data is quantitatively or qualitatively analysed
Time-series designs are based on frequently repeated data collections and are of use for measuring long-term impacts and the develop-ment of framework conditions
31
While it is simple to analyse the development of individual indicators descriptively by means of a trend analysis the identification of causal relation-ships calls for more sophisticated approaches Such approaches are often based on regression analyses that make it possible to estimate the influence of sev-eral independent variables (eg resources contextual factors) on dependent variables (eg attitudes behav-iour well-being) We shall go on to discuss an exem-plary design that has been successfully applied in a number of impact evaluation studies the so-called panel analysis
A panel analysis is based on repeated data collec-tions from identical analytical units The data needs to be comparable with regard to their informa-tion content ie the data collection instruments of each survey have to contain identical question and answer categories Furthermore the data sets must
be assignable to each respondent throughout the observation period Panel analyses usually require datasets with a large number of analytical units in order to be able to draw conclusions from the panel sample that apply to a larger basic population (cf 331) If these requirements are met panel analyses make it possible to trace developments not only on average but also on an individual basis and thus to identify variations caused by individual differences (ie unobserved heterogeneity) In addition given a sufficient observation period panel analysis makes it easier to identify the chronological sequence of changes and thus develop hypotheses about causali-ties The treatment effect can be estimated on the basis of various models The two most common of these the so-called fixed-effects model (FEM) and the random-effects model (REM) are briefly out-lined in Annex 54
CCA-specific requirements and challenges
Time-series designs appear to be most suitable for CCA projects as they are in principle applicable at each impact level and are of particular benefit when it comes to measuring long-term impacts As they make it possible to control time-variant confounding factors they are likewise useful for dealing with uncertain framework conditions as well as with shifting baselines given a sufficiently large sample size andor number of repeated data collections Due to their flexibility they can be applied in projects that focus on the adapta-tion of particular target groups to changing (climate environmental) framework conditions on the improve-ment of institutional capacities to deal with climate change-rooted environmental social or economic prob-lems or on national regional or global developments such as adaptation strategies in response to particular climate challenges Thus time-series designs are in fact more common in policy studies than in project evalu-ations
The challenges associated with time-series designs lie not so much in their practical implementation or the required financial resources as in the expert knowledge needed to do the lsquomathsrsquo They also call for a strong sectoral background in order to develop the right cause-and-effect hypotheses and draw the right conclu-sions from the analysis findings Very few evaluation experts have the know-how to adequately draft and implement such a design The high theoretical and methodological demands are reflected in a multitude of disputes among experts concerning the credibility of research which is of course not helpful for clearly com-municating evaluation findings
For further reading on panel data analysis the following literature is recommended
Berrington A Smith WF Sturgis P An Overview of Methods for the Analysis of Panel Data NCRM Methods Review Papers NCRM007 ESRC National Centre for Research Methods Southampton 2006
Hsiao C Analysis of Panel Data Cambridge University Press Cambridge 2014
316 Structural equation modelling
While the approaches discussed in the sections before are suitable for project types that differenti-ate between a treatment and a comparison group we will now go on to present an approach that may be applied for evaluating large-scale policy-based programmes that aim to affect an entire (national regional or global) population or sector (eg envi-ronmental or education sector labour market) With the so-called structural equation modelling (SEM) approach it is therefore not possible to attribute an observed effect to a specific intervention but to esti-mate the statistical relationship between several fac-tors over time one of which may be an intervention
3 Rigorous evaluation designs and exam
ples of applicability in climate change adaptation projects
Impa
ct E
valu
atio
n G
uide
book
for C
limat
e Ch
ange
Ada
ptat
ion
Proj
ects
32
Structural equation models make it possible to estimate statistical relations between con-structs which are defined by empirical measur-able indicators
Basically SEM is a multivariate statistical approach for testing hypotheses (deductive approach) about causal relationships between two or more latent constructs Its special feature is that it makes it pos-sible to test multiple statistical relationships (which are assumed to be causal) at the same time and can thus be used in complex environments In this con-
text latent construct means that the causes and effects (eg health employability) cannot be meas-ured directly but only by a number of manifest (ie empirically measurable) indicators (for health eg blood counts weight for employability education level qualifications) In principle a structural equa-tion model consists of two model types measure-ment models and structural models Measurement models describe the relationship between a latent construct and its indicators structural models describe the connection between latent constructs The following figure illustrates the differentiation between the model types according to the graphical representation of the system model described above
Figure 5 Generic layout of a structural equation model
It is important to note that the indicators that opera-tionalise the constructs and the causal relationships between the constructs have to be specified and theoretically substantiated by the researcher That means that it needs to be defined in advance which is the independent (ie exogenous) and which is the dependent (ie endogenous) variable In other words
the direction of the dependency has to be defined by the researcher In the figure above constructs 1 and 2 are exogenous variables (ie causes) while construct 3 is an endogenous variable (ie effects) A practical example on how to implement a SEM is given in sec-tion 42
CCA-specific requirements and challenges
With regard to the application of SEM for evaluating CCA projects the requirements and challenges sum-marised in the previous section on time-series designs are widely transferable with the difference that SEM is mainly suitable for projects that aim to create an impact at institutional and system level (eg political strategies) The practical requirements relating to SEM are not so difficult though it does take comprehensive theoretical know-how to develop the model As mentioned above the validity of the models relies on the expert knowledge of the people who create them Thus the findings of SEM analysis are as right or wrong as the model they are based upon Here the particular danger lies in omitting a system-relevant construct (ie influential factor) or indicators that define such a construct which would cause substantially biased findings What aggravates the problem is that in contrast to the designs discussed above unfortunately no quality criteria are available for assessing the validity of an SEM model Nevertheless given sufficient expert knowl-edge SEM can be of great benefit for providing the lsquobigger picturersquo and thereby revealing the manifold causal linkages between social political economic and environmental developments in the long run
33
For further reading on the methodological aspects potentials and limitations of SEM as well as its practical implementation we recommend the following books articles and papers
Cassel C Hackl P Anders HW (2010) Robust-ness of partial least-squares method for estimat-ing latent variable quality structures Journal of Applied Statistics 26(4)435 ndash 446
Chin W Newsted PR (1999) Structural Equation Modeling Analysis with small Samples Using Partial Least Squares In Hoyle R (ed) Statistical Strategies for Small Sample Research Thousand Oaks Sage
Diamantopoulos A Riefler P Roth KP (2008) Advancing formative measurement models Jour-nal of Business Research 61(2008)1203 ndash 1218
Garthwite PH (1994) An Interpretation of Partial Least Squares Journal of the American Statistical Association 89(425)122 ndash 127
Haenlein M Kaplan AM (2004) A Beginnerrsquos Guide to Partial Least Squares Analysis Understanding Statistics 3(4)283 ndash 297
Temme D Kreis H Hildebrandt L (2006) PLS Path Modeling ndash A Software Review SFB 649 Discussion Paper 2006-084 Berlin Humbold-University
Tenenhaus M Vinzi VE Chatelin Y-M Lauro C (2004) PLS path modeling Computational Statistics amp Data Analysis 48(2005)159 ndash 205
317 Summary
The prior descriptions show that a number of evalu-ation designs of sufficient methodological rigour are available that can provide reliable empirical evidence about the impact of CCA projects This sec-tion gives advice on which design(s) to choose based on the respective project characteristics Here it is again important to note that the applicability of a design primarily depends on the aggregation level at which an impact is generated (cf Section 1) Accord-ingly since many CCA projects operate on more than one level a combination of two or more evalu-ation designs might be necessary in order to assess the total impact balance of a project This complies with the need to combine qualitative and quantita-tive methods and triangulate data methods and researcher perspectives
At the individual level the decision which design to choose depends firstly on the existence of baseline data As explained in the previous sections three designs namely experimental quasi-experimental and regression discontinuity designs require such data This necessarily means that these designs can only be applied if they were drafted during the planning of the project If this is the case the next question is whether or not the beneficiaries were selected at random If this condition is also fulfilled in principle an experimental design can be applied provided sufficient resources are available to do so As described in 311 RCTs are quite costly due to the laborious data collection process which usually calls for the assignment of a large team to collect data It should also be said though that an RCT provides the highest internal validity and allows for clear impact attribution
If the project design does not allow for a random assignment of the treatment group a regression discontinuity design may also be feasible How-ever such a design requires the treatment group to be selected based on a specific outcome variable of interest (eg proximity to a disaster-prone area) If this is not the case a quasi-experimental design may be a feasible alternative The time and budget requirements of these two designs are compara-ble with those of an experimental design with the constraint that RDD might require a larger sample in order to identify sufficient cases that are close enough to the lsquothreshold levelrsquo to be compared With regard to the validity of the findings and their informative value we should add that while RDD-based evaluation findings are restricted to groups that are quite similar findings obtained using a quasi-experimental design can almost approxi-mate those of an RCT if the samples are adequately matched (eg with propensity score matching)
In case no baseline data has been collected before-hand two further rigorous evaluation designs may be used the pipeline approach and the panel design Both designs have further requirements the pipeline approach requires that the project be implemented sequentially (eg in different regions with differ-ent target groups) and the panel design that a larger sample size be available to enable reliable estima-tion of the impact It should also be considered that while a pipeline approach enables the attribution of impacts to an intervention a Panel Design lsquoonlyrsquo allows the contribution of an intervention to an observed change
If none of the above prerequisites can be satisfied most likely only a so-called ex-post facto design
3 Rigorous evaluation designs and exam
ples of applicability in climate change adaptation projects
Impa
ct E
valu
atio
n G
uide
book
for C
limat
e Ch
ange
Ada
ptat
ion
Proj
ects
34
with or without (single) comparison with a non-intervention group or with reconstructed baseline data may be possible However such a design is not regarded as lsquorigorousrsquo as it cannot provide for an attribution or contribution analysis
Based on these selection criteria the following deci-sion tree can be used to identify the lsquorightrsquo evaluation design for interventions that aim to generate impact at individual level
Figure 6 Decision tree for selecting an evaluation design for measuring impacts at individual level
Baseline data available
Random assignment of treatment group
Sequential implementation of project
yes no
yes
RCTQuasi-
experimental design
yes no
Pipeline approach
Regression discontinuity
design
Treatment group assignment according to specic criterion
Ex-post facto design (no RIE)
yes no
Panel design
yes
Large sample size possible
no (matter)
no
If an intervention aims to generate an impact at institutional level four rigorous evaluation designs are suitable Three of them have been previously introduced pipeline approach panel design and structural equation modelling (SEM) A potentially suitable design not discussed before is a time-series cross-sectional approach (TSCS) As already dis-cussed the pipeline approach requires a sequential implementation of the project in order to be appli-cable leaving three for those that are not As also discussed a panel design can only be applied if the sample (here of institutions eg governmental or non-governmental organisations enterprises) is large enough for statistical calculations (approx 30) If the intervention only focuses on a few institu-tions but at least about 10 repeated observations are possible then a TSCS might be the design of choice (see annex 54) Finally if none of these conditions can be fulfilled SEM is the only lsquorigorousrsquo option to
provide meaningful evidence about the impact of an intervention operating at the institutional level although it should be added that SEM like panel and TSCS designs can only provide for the estimation of its contribution On the positive side we should note that the latter three designs can be implemented with considerably less resources provided that sta-tistical data of sufficient quality are available for quantitative analysis
With regard to interventions geared to the system level (eg SWAPs government advice) the same selection of designs is basically available except the pipeline approach (due to the lacking comparabil-ity of sectors or countries for instance) Therefore in the following figure a joint decision tree for both intervention levels summarises the available choices of RIE approaches for institutional and system-level interventions
Phot
o copy
GIZ
Ran
ak M
artin
35
Figure 7 Decision tree for selecting an evaluation design for measuring impacts at institutional and system level
Sequential implementation of project
yes
Time-series cross-sectional approach
(see annex 54)
Structural equation modeling
yes no (matter)
Pipeline approach
Large number of repeated data collections possible
Panel design
yes
Large sample size possible
no (matter)
no
Decision tree for measuring system-level outcomes
Finally in table 3 on the next page all suggested RIE designs are listed with brief summaries of the impact level they are suitable for the project characteris-tics that must be in place the data time and budget requirements the validity of the analysis findings and their informative value (ie if they enable attri-bution or contribution analysis)
32 Providing reliable large-scale data
As outlined above empirical data is the founda-tion of any evaluation ndash and more or less of applied social sciences in general whether they are collected during the research process (ie lsquoprimary datarsquo) or reanalysed on the basis of statistical or documentary data (ie lsquosecondary datarsquo) Moreover impact evalu-ations mostly require data collections on a large scale in order to provide empirical evidence about the changes that have occurred in an interventionrsquos sphere of activity Such data is usually collected by means of a survey Surveys are used when mostly quantitative data from a considerable number of people eg all or a significant share of the projectrsquos beneficiaries non-beneficiaries or more generally residents of a certain area or particular social strata needs to be analysed During the data analysis sta-tistical parameters such as average means shares or distribution measures (eg standard deviation quan-tiles) of a given population (ie descriptive statistics) are calculated Provided that the data is collected from a random sample of sufficient size (see further elaborations below) probabilities regarding the val-ues and distribution of certain parameters in a larger
population can also be estimated (ie inferential sta-tistics) In the following the methodological aspects to be considered when collecting quantitative data by means of a survey are discussed with particular focus on an appropriate sampling strategy
Surveys often deal with knowledge opinions atti-tudes beliefs behaviours plans backgrounds devel-opments or assessments of the respondents The primary survey tool for data collection is the ques-tionnaire With a questionnaire (in contrast to an interview guideline) all respondents are asked the same questions in the same order The information gathered by a survey is often used to identify varia-tions of these parameters between different points in time (ie in order to identify developments) or dif-ferences between groups (eg in order to attribute the outcomes to a certain intervention or to reveal sys-tematic differences due to group characteristics such as gender age etc) or both With a survey infor-mation is collected in a systematic structured and mostly standardised way Structuring the subject of a survey means that not all potentially available infor-mation is relevant but only data that help to describe andor assess a certain measure development or framework characteristic Standardisation means that the respondents can choose from a number of answer options and that these options are grouped according to a predefined categorical system This means that the data is statistically calculable and consequently survey findings are comparable Such a categorical system can be dichotomous nominal ordinal or metric Table 4 contains an example of each single-choice question
3 Rigorous evaluation designs and exam
ples of applicability in climate change adaptation projects
Impa
ct E
valu
atio
n G
uide
book
for C
limat
e Ch
ange
Ada
ptat
ion
Proj
ects
36
Table 3 Required project characteristics and data
Evaluation design
Impact level Required project characteristics
Data requirements Time and budget requirements
Validity of findings Explanatory power
Experimental (RCT)quasi-experimental
Micro (individual) level
z Distinguishable treatment group
z RCT requires random assignment to treatment and comparison group
z Ex-ante (baseline) and ex-post data from treatment and controlcomparison group
z Depending on the size and accessibility of the target group
z Data collection process often quite costly as a large team of enumerators is needed
z RCT has highest internal validity
z Internal validity of quasi-experimental design depends on selection bias
z External validitytransferability depends on comparability of framework conditions
z Enables impact attribution at target group level given a sufficient sample size
Propensity score matching
Micro level z Discriminable treatment group
z Individual characteristics relevant for the treatment effect (covariates) must be observable
z Ex-ante and ex-post data from treatment and comparison group
z Data collection must include covariates
z Increases the costs of quasi-experimental designs as usually larger samples are necessary in order to identify sufficient matches
z Comparison group sample must be considerably larger
z Internal validity depends on completeness of covariates
z External validitytransferability depends on comparability of framework conditions
z Same as above
z Application in quasi-experimental designs can contribute to improved quality of findings
Pipeline approach
Micro and meso (institutional level)
z Project needs to be implemented in phases
z Treatment groups of each phase must be comparable
z Ex-ante and ex-post data from each group
z In principle comparable to quasi-experimental designs whereby costs increase with every round of data collection
z Internal validity of quasi-experimental design depends on comparability of groups
z External validity depends on comparability of framework conditions
z Same as above
z Allows for identifying time-variant effects if applied according to quasi-experimental design
Regression Discontinuity Design
Micro level z Treatment group must be selected according to a specified criterion
z Sufficient number of comparable cases
z Larger sample size than for experimentalquasi-experimental
z Comparable with quasi-experimental design mostly depending on sample size
z Internal validity restricted to comparable cases
z Enables impact measurement for individuals who have similar characteristics
Time series All levels z Panel focusing on individuals households organisations
z TSCS focusing on sectors countries regions
z Panel large sample size few repeated data collections
z TSCS sample size irrelevant large number of repeated data collections
z Depending on data availability individual data collections can be implemented quite cost-efficient
z Costs increase with length of panel and sample size
z Panel validity depends on compliance of sample size with statistical requirements (cf 331)
z TSCS validity is restricted to sample
z Provides reliable assessments of the contribution of an intervention to an observed change
z Makes it possible to control time-variant influences
Structural Equation Modelling
Meso and macro (system) level
z Focusing on entire sectors countries regions
z Statistical andor empirical data for each model- relevant construct
z Depending on data availability can be implemented cost-efficiently if combined with statistical data
z Validity depends on model fit (ie to what extent the endogenous construct is explained by the model)
z Enables contribution assessment and time-variant and invariant influences
37
Table 4 Example of question types
Question type Question Answer options
Dichotomous question What is your gender male female
hellip with nominal scaled answer options Where do you come from area 1 area 2 area 3 other area ________________
hellip with ordinal scaled answer options How do you assess the development of your livelihood situation in the last year
Deteriorated considerably Deteriorated slightly Did not change at all Improved slightly Improved significantly
hellip with a metric scaled answer option What is your monthly income _____ euromonth
It has to be added that for ordinal-scaled answer options that reflect a rating (eg satisfaction quality) it is important to lsquobalancersquo the answer options mean-ing that an equal number of positive as negative answer options must be provided in order to avoid biased findings
Besides single-choice questions there are also multi-ple-choice questions for example
What are your income sources (multiple answers possible)
Farming Livestock Fishery Temporary work Other hellip None
When analysing multiple-choice question data it has to be taken into account that it might be necessary (eg for calculating average means) to transform the data into separate lsquodummy variablesrsquo with dichoto-mous scales for each answer option (ie yesno for farming hellip for livestock etc)
When a survey is conducted its objectives and the information required to meet these objectives need to be considered first For this it makes sense to ask the following questions
Questions for identifying the survey objectives
` Which indicators need to be measured ` Who will use the information and how
Which decisions are depending on the survey findings
` Are there any particular expectations about the survey findings When are the findings of the survey considered positive or negative Or what would be a good or a bad finding
` Which information can the respondents pro-vide How does this match the information needs
` Which factors could have a negative impact on data collection Do the respondents have and remember the necessary information Might they be reluctant to answer Do they have the (verbal cognitive) capacities to answer correctly
Selecting a survey approach
After having defined the surveyrsquos objectives and information needs the survey approach can be specified giving consideration to the available and required resources The required financial human and time resources mainly depend on the size of the population that has been defined (as the target or comparison group) its spatial distribution and the logistical framework conditions in the area where the survey is implemented Furthermore the length and complexity of the questionnaire considerably influences your resource demands In order to get a better idea of how much time is needed it may be helpful to prepare a list of the individual tasks and estimated time needed for each task such as clarify-ing the survey objectives and sampling approach designing and testing the questionnaire collecting managing and analysing the data and reportingcommunicating the survey findings The following table shows what such a to-do list might look like
Phot
o copy
GIZ
Ala
n W
alsc
h
3 Rigorous evaluation designs and exam
ples of applicability in climate change adaptation projects
Impa
ct E
valu
atio
n G
uide
book
for C
limat
e Ch
ange
Ada
ptat
ion
Proj
ects
38
Table 5 Exemplary to-do list for preparing a survey
Task When Who Requirements
Clarification of survey objective First two weeks in January Project staff Results framework sample selection
Development of draft question-naire
By 31 January Evaluator in coordination with project staff
Clarification of information needs development of survey items
Pre-test of questionnaire 1 to 10 February Evaluator together with enu-merator team
Logistical preparation informa-tion of target groups accessibil-ity of target groups
Finalisation of questionnaire By 15 February Evaluator Consolidated feedback from the pre-test
Implementation of survey 16 to 31 February Enumerators coordinated by evaluator
Logistical support by partner staff etc
Data entry 1 to 5 April Enumerators coordinated by evaluator
Availability of technical infra-structure (notebooks software etc)
Data quality check 6 April Evaluator Full data set
Data analysis 7 to 15 April Evaluator Quality-assured data set
Integration of survey findings into evaluation report
16 to 30 April Evaluator Data analysis findings
Presentation of findings 1 May Evaluator and project staff Technical infrastructure for presentation (notebook projec-tor etc)
On the basis of such a timetable the costs of the sur-vey can be estimated These usually comprise logisti-cal costs (eg for traveltransportation accommoda-tion per diems) expenses for survey materials and the remuneration of the survey team
Surveys are usually carried out face-to-face or elec-tronically mediated (eg by telephone email or a web-based application) Both face-to-face and elec-tronically mediated surveys can be self-administered (ie the respondent fills out the questionnaire) or assisted (ie the surveyor fills out the questionnaire or at least supports the respondent in doing so) As all options have their advantages and disadvantages aspects such as the complexity and comprehensibil-ity of the survey topics the skills and accessibility of the potential respondents and the available time budget and human resources need to be considered Particular attention has to be paid to the aspect of the confidentiality of the information and the ano-nymity of the respondent when personal data (eg age income health status) are collected Ensuring anonymity is often an issue when it is necessary to be able to trace responses to individuals such as in panel surveys (cf 315) or when third parties (eg project staff beneficiaries) are tasked with data collection In those cases it might be necessary to separate the personal data from the survey data and link the data sets using a list of identification codes which can only be accessed by the people who are tasked with analysing the data
Selecting a sample
Due to time and budget constraints it is often not feasible to conduct a full population survey ie col-lect data from every potentially relevant respondent (eg beneficiary project participant) In such a case it is necessary to collect a sample ie to select respond-ents from the population However the findings of a sample population might be different to those from a survey of the entire population These disparate findings are induced by the so-called selection bias (see also 311) which can be reduced by various sam-pling techniques The common objective of these techniques is to approximate the sample characteris-tics to the characteristics of the full population rele-vant for the survey (eg the share of male and female respondents or the share of respondents from rural and urban areas) Doing so is necessary in order to draw conclusions from the survey findings with ref-erence to that population bearing in mind certain statistical quality criteria as further outlined below
In order to draw such conclusions the size and dis-tribution of the population for which the sample should provide representative findings needs to be identified For instance if the survey is to be used to identify the impact of a certain intervention (eg nationwide information campaign) on the behaviour of target groups (eg farmers adopting a new farm-ing method) in different provinces then it needs to be determined who constitutes the basic population (ie all farmers of the country) and how it is distrib-uted among the provinces (eg number of farmers in each province)
39
Once the basic population has been identified two sampling strategies are available probability (ie randomised) and non-probability (ie non-ran-domised) sampling Probability sampling means that each individual of a given population has the same known non-zero probability of being included in the sample ie it is randomly selected Non-probabil-ity sampling means that the chance of being selected for the survey differs among the population (eg due to accessibility or ability to participate) In the latter case findings based on the sample may not be gen-eralised without giving further thought to how to establish representativeness 23 otherwise (see below)
Only probability sampling (ie random sam-pling) makes it possible to calculate statistical parameters that inform use of the true value of a parameter in a basic population
Probability sampling
If probability sampling is applied it is possible to draw statistically valid conclusions from the survey findings for a population bearing in mind three sta-tistical parameters the aspired margin of error the level of confidence and the degree of variability These criteria are briefly explained below
The margin of error (also called lsquosampling errorrsquo or lsquolevel of precisionrsquo) indicates the maximum differ-ence of the value of a certain characteristic between the sample and the population ie the range in which the true value of the population is estimated This difference or range is usually defined in per-centage points (eg 1 5 10) For instance if a 5 margin of error is defined and your sample shows that 50 of the respondents adopted a new farming method the actual proportion of the basic popula-tion who did so is somewhere between 45 and 55 This is subject to a certain level of confidence see next paragraph
The level of confidence expresses the probability with which the actual sample value lies within the before- mentioned margin of error It is based on the assumption that if a sample is repeatedly (ran-domly) drawn from a given population the average value of an observed characteristic in this sample approximates to the true value of this characteristic in this population Furthermore the sample values are distributed lsquonormallyrsquo around this true value (ie
23 It has to be added that lsquorepresentativenessrsquo is not a defined statistical term but rather colloquially used to signify that a sample has been composed according to the prevalence of particular characteristics of the basic population
their frequency distribution follows a specific so-called lsquoGaussianrsquo function see the following figure) In practice confidence levels of between 90 and 999 are usually chosen A confidence level of 95 for instance means that in 95 out of a 100 samples the sample value would lie within the margin of error as specified before In other words there is a 5 chance that the sample value will deviate from the true population value by more than the defined mar-gin of error
Figure 8 Distribution of sample mean values in relation to the true population mean value
True value of a certain characteristic of the basic population
Range of mean values in eg 95 of all samples
Finally the degree of variability refers to the het-erogeneity of the population with regard to an observed characteristic ie how this characteristic is distributed in the given population The more het-erogeneous the population the larger the sample size necessary to reach a certain level of precision In this context 50 is the highest degree of variability because it indicates that half of the population has a certain characteristic (eg has adopted a new farm-ing technique) while the other half does not Annex 56 contains an introduction on how to calculate the appropriate sample size bearing in mind the above- mentioned statistical parameters
Non-probability sampling
As probability sampling requires all respondents to be within reach during data collection regardless of the required resources it may not always be feasible to apply such a strategy In that case non-probability sampling may be applied which requires the iden-tification of characteristics of the basic population that are relevant for analysis in order to establish representativeness For instance if the survey is intended to enable conclusions about the extent to which the impact depends on age gender ethnic affiliation etc information needs to be gathered about the composition of these characteristics in the population We should mentioned that while with non-probability sampling it may be possible to
3 Rigorous evaluation designs and exam
ples of applicability in climate change adaptation projects
Impa
ct E
valu
atio
n G
uide
book
for C
limat
e Ch
ange
Ada
ptat
ion
Proj
ects
40
develop plausible assumptions about a population the quality of these assumptions cannot be tested statistically and thus rely solely on the expertise of the researcher For non-probability sampling three common techniques may help to approximate the sample composition to the composition of the basic population systematisation stratification and clus-tering
Non-probability sampling does not make it possible to calculate statistical parameters
The representativeness of a sample relies on the knowledge about the basic population
Systematisation is an option when sufficient data about the basic population is available so that in principle each potential respondent can be identi-fied Ideally a comprehensive list is available that is used to draw the sample according to a particular selection scheme based on the individual data Such a scheme can for instance be oriented towards a tar-geted sample size (eg every 10th person) on logis-tical considerations (eg one household from each street village etc) or a certain threshold level (eg only families with more than three children or below a certain income) Which scheme is applied basically depends on the intervention logic (eg activities aim-ing at the poor) and the intended type of representa-tiveness (eg equal spatial representation)
A particular way to receive more specific findings is to stratify a sample Stratification means that a predefined number of individuals from each ana-lytically relevant sub-group of a population (eg age groups residence areas gender) is included in the sample Here too data about the composition of the basic population is necessary at least on a global level The intention is usually to match the sample composition with the composition of the popula-tion ie ensure that the proportions of each sub-group in the sample and in the population are equal in order to achieve representativeness (ie propor-tional sampling) However it may also be necessary to draw a disproportional sample eg due to logisti-
cal or budget constraints (eg 100 households per region) If that is the case then the cases for each sub-group need to be weighted reciprocally during data analysis So if for example a certain group represents 20 of a basic population but has only a share of 10 in the sample its cases need to be weighted by the factor two during the analysis
Clustering a sample may be helpful if it can be assumed that the sub-groups of a population show a sufficient degree of intra-group homogeneity ie that the individuals in each sub-group are similar with regard to a certain research question and inter-group heterogeneity ie that the individuals of dif-ferent sub-groups differ considerably in that regard If for example a project focuses on both several urban and rural areas and differences of its effec-tiveness in these areas are to be analysed it might be sufficient to conduct a full-population survey in one urban and rural area instead of taking samples in each area provided the residents in the respective areas show some commonalities that are relevant for the analysis (eg high incomes in urban areas low income in rural areas)
Finally we should note that other techniques exist for non-probability sampling in addition to those outlined above However other techniques such as convenience sampling (ie selecting individuals who are easiest to reach) or theoretical sampling (mainly used in explorative qualitative research) may not be applicable in rigorous evaluation designs as it is unlikely that they provide representative data Hence these techniques are not further discussed here
We recommend the following books articles and working papers for further reading on methodological requirements to collect quanti-tative data by means of surveys
Fink A (2003) How to Sample in Surveys The Survey Kit 2 Edition Thousand Oaks Sage Publications
Israel GD (2012) Determining Sample Size Gainesville University of Florida
Phot
o copy
GIZ
Har
ald
Fran
zen
41
In this last chapter the outlined methodological options and requirements are discussed by means of a practical case study The case study is based on a GIZ project entitled lsquoUrban Management of Inter-nal Migration due to Climate Changersquo that began in January 2015 and is being implemented on behalf of BMZ in two cities in Bangladesh The objective of the case study is to illustrate the possibilities for pro-viding empirical evidence about project impacts by applying an elaborated evaluation design that satis-fies scientific standards It will also be investigated which organisational and logistical precautions need to be taken to enable efficient data collection and analysis After a brief description of the project (41) two exemplary designs for measuring its impact are presented (42) followed by a draft of their practical implementation (43)
41 Background and project objectives
In Bangladesh climate change is considered to be one of the most important challenges Climate-related internal migration is jeopardising the over-all social stability of the country Climatic changes induce extreme weather events such as floods extreme precipitation and droughts In Bangladesh 40 out of 64 districts are affected by the impacts of climate change According to estimations six mil-lion people have already migrated due to weather and climate stresses of whom the majority lives in urban slums Especially in Khulna and Rajshahi the proportion of migrants is very high (70 of slum dwellers are migrants) For poor and vulnerable households migration is a crucial diversification and adaptation strategy However this can lead to acute vulnerability and have conflict-exacerbating effects if migrants who live in urban slums with inadequate infrastructure no access to basic services or income opportunities receive hardly public support from local government and administrative structures It is true that the decision to migrate is multi-causal that means that it is due to political social economic
demographic and environmental factors However in the two preselected cities experts believe that cli-mate and weather-related stress factors play a domi-nant role in migrantsrsquo decision to leave their homes In Rajshahi rising temperatures and drought declin-ing groundwater levels and river flooding threaten the population whereas in Khulna the population faces storms and storm surges extreme precipita-tion water logging and groundwater salinisation According to estimates the urban population (today 34) will exceed the rural population (today 66) by 2040 if economic opportunities do not reach the countryside
The core problem in the current situation is that so far there are no needs-oriented measures to improve the living conditions of climate migrants 24 in Khulna and Rajshahi City master plans do not address the influx of migrants This problem is caused by a lack of capacity of local governments and municipalities to deal with the challenges of climate-related inter-nal migration Public investment in the development and expansion of a basic infrastructure to mitigate the pressure on resources such as water energy food and housing is insufficient There is a lack of poli-cies and measures to manage settlement develop-ment Nor is there any data or information base on the movement of climate migrants to cities and their (urgent) needs This situation leads to an explosion of the population in these urban areas increasing pov-erty congested infrastructure and basic social ser-vices shortages of resources increasing distribution and opportunity conflicts and eventually reduced economic development opportunities for the entire population As urban development is a priority of the 6th Five-Year-Plan 2011ndash2015 (ie infrastruc-ture development promotion of economic activi-ties) national policies indicate that there is potential for change However there is a considerable gap between strategy and implementation
According to this situation the objective of the pro-ject is to improve the living conditions of climate migrants in preselected settlements in the divisional capitals Khulna and Rajshahi through needs-ori-ented measures 25
24 The International Organization for Migration (IOM) produced a definition of climate migrants as lsquopersons or groups of persons who for compelling reasons of sudden or progressive changes in the environment that adversely affect their lives or living con-ditions are obliged to leave their habitual homes or choose to do so either temporarily or permanently and who move either within their country or abroadrsquo
25 Since it is an integrative approach other inhabitants of the set-tlements will also benefit from improved basic urban services vocational training and temporary employment opportunities
4 Case study Urban Management of Internal Migration due to Climate Change
Impa
ct E
valu
atio
n G
uide
book
for C
limat
e Ch
ange
Ada
ptat
ion
Proj
ects
42
Four indicators were defined to achieve the project (module) objective
y In Khulna and Rajshahi X inhabitants of Y lsquohot-spotsrsquo with a high concentration of climate migrants have improved access to basic urban services (eg water energy or sewage systems through well drilling solar home systems or the construction of drainage ditches)
y In Khulna and Rajshahi X inhabitants of Y hot-spots with a high concentration of climate migrants have participated in labour-intensive measures for the expansion and building of a cli-mate-resilient basic infrastructure of whom Z are women
y In Khulna and Rajshahi in Y hotspots with a high concentration of climate migrants participants in needs-based general education and vocational training courses increased their income by X
y In each city the city corporations developed and tendered X project proposals for needs-based and labour-intensive measures for the expansion and building of climate-resilient basic urban ser-vices (eg health education water energy supply waste waterrefuse) as well as for the promotion of local economic development with the support of the Ministry of Social Welfare
In order to achieve this objective the project focuses on three intervention areas for which particular measures are currently being planned
1 Providing access to social services to the target groups by improving and extending existing services and adapting them to the needs of the migrants (eg finding social housing providing health and sanitation services) and raising the awareness of social workers for the needs of cli-mate migrants
2 Providing short-term income opportunities through labour-intensive work in and outside slum areas and providing access to basic infra-structure by its improvement together with city corporations and civil society
3 Providing long-term income opportunities by developing and implementing skills develop-ment measures in cooperation with training cen-tres and formal and informal SMEs in different sectors
Various Capacity Development measures will be implemented by long-term and short-term experts and financial support will be provided to upgrade slums and enhance resilience Particularly in the third intervention area cooperation is also planned with the local economy and training providers
It should be highlighted that the project is the first of its kind in German development cooperation to deal with the issue of climate-induced (internal)
migration The project therefore has an innovative and pilot character and aims to showcase a variety of measures to deal with climate-induced internal migration The integration of climate change adapta-tion into urban development planning and the con-tinuation of successful measures will be strengthend by other projects implemented by GIZ KfW and BGR
Selection of an impact evaluation design
In order to decide which evaluation design(s) could be suitable for measuring the impact of the project it makes sense to revisit the table at the end of Sec-tion 31 that summarises the characteristics and requirements of the discussed designs Looking first at the required project characteristics we should consider where the project aims to generate tangi-ble results that can be empirically verified Accord-ing to the project description the measures target climate migrants who constitute a distinguishable target treatment group as they are a sub-population of the entirety of residents in the intervention areas This treatment group however is not randomised but rather selected based on predefined criteria such as the settlements (lsquohotspotsrsquo) and their socio-eco-nomic status (lsquoclimate migrantsrsquo) Hence an experi-mental design does not come into consideration As the project description does not indicate a sequen-tial implementation of the measures a pipeline approach is also out of the question However if the project is scaled up at a later stage such an approach would still be feasible based on the data gathered by the design proposed below
Another feature of the treatment group is that it has individual characteristics that are likewise relevant for their selection and the treatment effect As these characteristics are in principle observable (eg eco-nomic situation migration background family sta-tus) both propensity score matching and a regression discontinuity design are in principle feasible With regard to the long-term measurement of treatment effects and their sustainability beyond the project implementation period a household panel appears to be suitable However according to the description of the framework conditions the migrant population fluctuates considerably Such a fluctuation will prob-ably result in a very high panel mortality ie par-ticipants dropping out from the sample that would undermine the significance and reliability of the findings Another feature of the project is that it does not focus solely on directly supporting individual climate migrants but also aims at improving social services and basic infrastructure which again should contribute indirectly to the improvement of the liv-ing conditions of these migrants and the population in the intervention areas at large Such a lsquosystemicrsquo approach calls for the use of structural equation
43
models which make it possible to measure the influ-ence of changed framework conditions on a popula-tionrsquos livelihood
Coming next to the data requirements the selec-tion of particular settlement areas makes it possible to create comparison groups ie migrants who are not supported by the project Furthermore as the evaluation is planned before the project activities start it should be possible to collect baseline data from both the treatment and comparison groups Since the project description does not provide any indication that measures in the selected settlements will be restricted to a certain sub-population of the potential target groups (ie there is no threshold level according to which the beneficiaries are selected) comparison groups need to be selected in spatially
remote areas This again makes it impossible to apply an RDD approach Nor would an RDD be recom-mended if such a restriction were made because the design of the measures facilitates spill-over effects which will likely bias the comparison findings With regard to the system-oriented measures the development of SEMs should be feasible provided that statistical or empirical data can be made avail-able for the required models throughout the project implementation (ie by the continuous results-based monitoring system) This is required to describe the relevant elements that constitute the framework conditions of the migrant population The following table summarises the applicability of the different evaluation designs based on the project characteris-tics
Table 6 Applicability of evaluation designs
Evaluation design Required project characteristics
Full-filled
Data requirements Full-filled
Experimental (RCT)
Distinguishable treatment group Ex-ante (baseline) and ex-post data available from treatment and control group
Random assignment to treatment and comparison group
ndash
Quasi- experimental with PSM
Distinguishable treatment group Observable individual characteristics relevant for the treatment effect
Pipeline approach
Sequenced project implementation ndash Ex-ante and ex-post data available each group na
Comparable treatment groups in each phase
na
RDD Selection of treatment group according to a specified criterion Sufficient number of comparable cases
(close to a threshold level)ndash
Time-series Panel focusing on individuals households organisations Panel large sample size few repeated data
collectionsndash
TSCS focusing on sectors countries regions
ndash TSCS sample size irrelevant large number of repeated data collections
na
SEM Focusing on entire sectors countries regions Statistical andor empirical data for each
model-relevant construct Unlikely to be achieved due to foreseeable panel mortality
Since PSMs and SEMs appear to be the most promis-ing approaches to measure the impact of the project we will go on to outline how the data collection pro-cess could be organised and what the related meth-odological and practical requirements are
42 Practical implementation
Starting with PSMs it first has to be clarified who constitutes the treatment and comparison group and how appropriate samples can be selected In the second step the hypotheses to be tested and the necessary indicators have to be developed Then we
need to consider which covariates have to be col-lected in order to enable the matching of cases (eg age gender place of origin duration of stay in target area education level ethnic affiliation marital sta-tus) Finally the data collection plan and instruments have to be developed
Based on the project description it is easy to iden-tify who should belong to the treatment climate and floating migrants in selected settlements as well as other poorest people in Khulna and Rajshahi Equally easy to identify is who should belong to the compari-son group climate migrants in settlements in these cities where no project activities are implemented If such settlements cannot be identified it would also
4 Case study U
rban Managem
ent of Internal Migration due to Clim
ate Change
Impa
ct E
valu
atio
n G
uide
book
for C
limat
e Ch
ange
Ada
ptat
ion
Proj
ects
44
be acceptable to choose climate migrants in other cities who face the same problem provided these cities are comparable in terms of the characteris-tics that were decisive for the selection of the pro-ject location As it can be assumed that the targeted population is rather large and the actual proportion presenting the characteristic of interest (improved living conditions) is not known beforehand the sample size should be calculated according to the first formula outlined in Section 56 (annex) The for-mula approximates a sample size of 400 for infinitely large populations with a level of confidence of 95 and an aspired margin of error of 5 26 Consider-ing the conceivable attrition loss during the data collection process a target gross sample size of 600 for the treatment group and at least 800 to 1000 for the comparison group (in order to receive sufficient matches) should be aimed at Depending how the dissimilarity of the socio-economic framework con-ditions in Khulna and Rajshahi is assessed it further has to be decided whether it is sufficient to split one sample across both cities ndash ie if they are generally comparable ndash or if the sample size needs to be dou-bled ndash ie if the framework conditions differ consid-erably with regard to the characteristics of interest
Next it has to be decided which hypotheses are to be tested and which data needs to be collected So far the project objective has been operationalised by four indicators of which three directly refer to the living conditions of climate migrants (1) access to lsquourban basic servicesrsquo (2) participation lsquoin labour-intensive measuresrsquo and (3) having an lsquoincreased incomersquo Leaving aside the question whether these indicators cover the entirety of factors that define the quality of lsquoliving conditionsrsquo ndash which however needs to be revisited during the development of the data collection instruments ndash it has to be clarified what information is needed to verify or disprove their achievement With regard to the first indicator such information would comprise for instance data on the types of existing services their general acces-sibility and finally the actual use of these services by the target group Of course such data would have to be collected for both the treatment and comparison group before and directly after the project imple-mentation and ideally again another three to five years later in order to assess the sustainability of the project measures
26 It should be noted that the proposed level of confidence and margin of error represent the lowest common accepted param-eters for inferential statistics It is up to the evaluation team to decide on stricter values which however will result in a need to collect considerably larger samples
Concerning the second indicator it may seem easy to provide empirical evidence about its achievement ie by comparing the factual number of participants with the targeted number It is however question-able whether the indicator actually makes it pos-sible to measure an impact since participation in a labour-intensive measure does not say anything about the living conditions of the migrants Since the outcome of their participation (eg the generated income and created infrastructure) can rather be considered to influence their living conditions it is recommended to revise this indicator
While the relevance of the third indicator for the impact to be measured is again clear it must be borne in mind that the findings are likely to be biased by contagion effects ie that income has been increased by sources other than the ones created by the project Therefore further qualitative data needs to be collected on the income sources and how and why they were obtained Furthermore it has to be remembered that providing information about onersquos own income may be a sensitive issue Hence data on proxy indicators such as private properties number of meals per day or school attendance of children (etc) has to be collected
In order to obtain a comprehensive picture about the net impact of the project it is further necessary to also gather information about its unintended positive and negative impacts Therefore it must be considered who else apart from the migrants might be affected by the project activities which secondary effects could be caused or how the project objectives interfere with partner strategies andor the activities of other donors For assessing the effectiveness of the particular project measures and helping to attribute the observed effects it is also necessary to collect data on the participation of the target group (eg in labour-intensive or training measures)
Finally to enable matching of the treatment and comparison group data covariates need to be col-lected that have to comply with the lsquostability cri-terionrsquo outlined in Section 53 This could be for instance the origin of the migrant his or her ethic and religious affiliation age gender and family sta-tus etc However we also have to bear in mind not to use variables such as profession socio-economic sta-tus type of migrant and so on as the project meas-ures (eg further training income generation) may influence these characteristics
The following table summarises the indicators data requirements data collection instruments and anal-ysis methods discussed above that would be part of the data collection plan for the migrant survey
45
Table 7 Draft (simplified) data collection plan
Indicator Required data Data collection instrument
Data analysis method
Improved access to basic urban services
Types of services provided Document analysis observation (for empirical verification)
Qualitative comparative analysis
General accessibility of service A B C hellip further operationalized eg by number and distribution of access points costs per service use capacities of service in terms of no of customers per day service can be provided to
Document analysis observation migrant survey
Qualitative and quantitative (double-difference) comparative analysis
Actual use of services by migrants disaggregated by eg types used frequency of use by type costs of use in relation to income
Migrant survey focus group discussion
Quantitative comparative analysis
Increased income Current income and income sources of migrants (operationalized by proxy indicators)
Migrant survey Quantitative comparative analysis
Further indicators for measuring the living conditions of the migrants
Further indicators for measuring the unintended effects of the projects
Further indicators about participation in project measures
Covariates eg origin ethnic and religious affiliation age gender family status
Migrant survey Used for calculating the propensity score
The draft shows that there are a number of blank spots that need to be looked into further regarding the operationalisation of impacts the project activi-ties and the covariates required for matching
Coming now to the structural equation model-ling (SEM) the first step is to identify the constructs that are relevant for the model Without further knowledge about the framework conditions and project measures such a model can only be roughly sketched However based on the project design its outputs in the three intervention areas (in terms of the capacities created for basic urban services train-ing as well as short-term and long-term income opportunities) can be considered as exogenous con-structs that aim to influence the living conditions of the migrants A further exogenous factor would be the general framework conditions as determined by
political strategies (eg government budget alloca-tion to infrastructure development) or economic societal and environmental developments (eg regional economic power number of small and medium enterprises migrant influx annual precipi-tation) Here we should consider whether it makes sense to further split up this construct due to its heterogeneity The living conditions of the migrants would represent the endogenous construct whereby the constitution of basic service infrastructure in the settlements could serve as another mediating construct This is on the one hand influenced by the framework conditions and the project activities and on the other hand has an influence on the living con-ditions of the migrants The following figure shows a (highly) simplified illustration of the SEM based on this outline with a few exemplary indicators for each construct
Phot
o copy
GIZ
Elm
ar F
oellm
i
4 Case study U
rban Managem
ent of Internal Migration due to Clim
ate Change
Impa
ct E
valu
atio
n G
uide
book
for C
limat
e Ch
ange
Ada
ptat
ion
Proj
ects
46
Figure 9 Simplified SEM for the GIZ project 33
Budget allocated to IF2
No of migrants in labour
No of basic services
No of customers served
School attendance of children
Self-assessed living conditions
Budget allocated to IF3
No of migrants trained
Budget allocated to IF1
No of migrants with access to
Budget for infrastructure
Migrant influx
No of SME
Total project budget
Partner contribution
Socio-econ FC
PO in IF2 (labour)
Project resources
PO in IF1 (access)
PO in IF3 (training)
Consti-tution of
infrastruc-ture
Living con-ditions of migrants
The figure shows that some of the measurement models are formative (project resources socio-economic framework conditions) while others are reflective (constitution of infrastructure achieve-ment of project outputs in the fields of intervention and living conditions of the migrants) Of course further constructs measurement models and struc-tural elements and relationships are conceivable There is however a need to define which elements the model requires in order to adequately reflect the lsquorealrsquo project situation and to enable measurement of the changes in its fields of intervention The appli-cation of the SEM requires the regular collection of the respective data ndash at least on an annual basis ndash to be able to calculate the parameters for assessing the project contributions Accordingly the indica-tors have to be included in the project monitoring system which should be developed in the course of the baseline study The latter is the first step of the impact evaluation
According to the outlined design the practical implementation of the impact evaluation should start with an in- depth document analysis and the elaboration of a detailed work plan specifying the
27 The figure was drawn using SmartPLSreg a software for developing variance-based SEMs
individual steps of data collection and analysis and the respective responsibilities Ideally before starting with the baseline study an exploratory preliminary mission should be conducted in order to gain further information for complementing the data collection plan (ie on the availability of data sources further needs of the target groups and other active actors in the intervention area) Furthermore the avail-ability of secondary data and the accessibility of the migrants for data collection the logistical require-ments and general feasibility of the evaluation design should be investigated
Once the data collection plan is finalised the data collection instruments (ie interview guidelines guidelines for focus group discussions question-naires) can be developed and tested In so doing par-ticular focus has to be placed on the socio-cultural adequacy of the instruments (eg appropriate and easy-to-understand language clear commonly understood categories in closed questions) and ndash as the survey will most likely be administered ndash the required qualifications of the interviewers (eg use of questionnaire particularly following the filtering procedure coding of answers ability to explain ques-tions if not understood by interviewees social skills)
FC framework conditions PO project outputs IF intervention field
47
After successful testing and finalisation of the instru-ments and interviewer training a sampling proce-dure should be identified that allows for randomi-sation eg by random walks through the selected settlements or by randomly selected spots (if reliable maps are available) Data collection should then start ideally simultaneously with the treatment and com-parison group in order to minimise time-induced bias Provided that the data has been collected according to the previously defined methodologi-cal standards the analysis will provide a picture of the migrantsrsquo current living conditions This will be based not only on the assessment of a few represent-atives andor experts but on a sound statistical foun-dation that makes it possible to transfer the sample findings to the entire target population This baseline data will also serve as the comparison base at a later stage for calculating the project impact
At the end of the baseline study a framework for the continuous results-based monitoring system should be developed As the monitoring system will not only be used for continuous reporting on project progress but also for the SEM analysis after project comple-tion the indicators used must satisfy the informa-tion needs of the model and thus not only focus on the project outcomes and impacts but also include data about the framework conditions The data col-lection instruments have to be adapted to suit these requirements Furthermore the timing of the con-tinuous data collection and the responsibilities have to be coordinated Given the three-year project term it may make sense to agree on a six-monthly or even quarterly collection in order to gather sufficient data (about eight to 10 cycles) for robust model calcula-tion If the measures need to be adapted during pro-ject implementation the indicators and maybe even the model need to be revised likewise
At the end of the project a second migrant survey has to be implemented according to the same meth-odological standards as for the baseline study In
combination with the baseline data the findings of that survey will be used for impact measurement and attribution as described in Section 311 Provided that the evaluation team has managed to gather the required data in line with the discussed require-ments the findings should enable valid and reliable attribution of the observed changes in the living conditions of the migrants to the project measures Due to the broad analytical perspective of the evalu-ation it should also be possible to document possible unintended effects as well as the influence of exter-nal (confounding) factors
However the project measures are not solely designed to improve living conditions in the short term Long-term effects and sustainability of the project impacts (eg climate resilience of built infra-structure) are also of interest In order to assess such long-term impacts another evaluation needs to be conducted It is recommended to conduct such an ex-post evaluation about three to five years after the project has been completed
As such an ex-post evaluation poses particular prac-tical challenges particularly regarding the retrieval of the former beneficiaries access to public authori-ties or logistical support on site (in case the imple-menting agencies are not active there anymore) it is of utmost importance to announce such an investi-gation during the project implementation phase in order to get sufficient support at a later stage There-fore all partners and further stakeholders should be made aware of its importance and supported in establishing adequate structures for future data col-lections Ideally a Memorandum of Understanding (MoU) could be agreed upon in which the responsi-bilities are clarified In return the partners could be supported in developing their own monitoring sys-tem which again might contribute to their owner-ship and understanding of the usefulness of collect-ing such data
Phot
o copy
GIZ
Ran
ak M
artin
4 Case study U
rban Managem
ent of Internal Migration due to Clim
ate Change
Impa
ct E
valu
atio
n G
uide
book
for C
limat
e Ch
ange
Ada
ptat
ion
Proj
ects
48
We will go on to present the individual tasks accord-ing to the proposed practical implementation of the impact evaluation in chronological order including
a rough estimation of the required time resources for each step
Figure 10 Draft schedule for impact monitoring and evaluation framework
` Document analysis selection of evaluation design development of a work plan (about 5 ndash 8 working days (WDs) depending on the amount of available documents)
` Exploratory preliminary mission gathering qualitative data for accomplishing the data collection plan checking the availabilityaccessibility of data sources and the feasibility of data collection (about 3 WDsrsquo preparation 3 days of travel 10 ndash 12 WDs on site 5 WDs for writing an inception report)
Preparatory tasks
` Adaptation of data collection instruments development of a resource plan and assignment of responsibilities (roughly 3 WDs)
` Implementation of monitoring system regular data collection according to data collection plan revision of data collection instruments as required (eg changing of project measures) (roughly 1-2 WDs per month depending on the monitoring data to be collected)
` Regular data analysis and reporting (about 3 ndash 4 WDs per report cycle)
` Finalisation of the data collection plan development and pre-testing of the data collection instruments (about 8 ndash 10 WDs depending on the selection of instruments and accessibility of target groups)
` Collection of baseline data data analysis and reporting (about 20 ndash 30 WDs for data collection depending on the number of available enumerators and logistical support on site about 10 WDs for data analysis 10 ndash 15 WDs for reporting incl results presentation and finalisation of ex-ante evaluation report)
` Preparation of a framework for continuous results-based monitoring system specification of indicators and data collection plan (about 5 WDs in collaboration with project team)
Baseline study
(ex-ante evaluation)
2015
` Adaptation of data collection plan and instruments review of monitoring data further document analysis (official statistics project documents etc) (about 5 ndash 8 WDs)
` Collection of final evaluation data data analysis and reporting (about 20 ndash 30 WDs for data col-lection depending on the number of available enumerators and logistical support on site about 15 WDs for data analysis 10 ndash 15 WDs for reporting incl results presentation and finalisation of ex-ante evaluation report)
Final evaluation
2018
` Adaptation of data collection plan and instruments further document analysis (approx 5 ndash 8 WDs) ` Collection of ex-post evaluation data data analysis and reporting (approx 20 ndash 30 WDs for data collection depending on the number of available enumerators and logistical support on site about 15 WDs for data analysis 10 ndash 15 WDs for reporting incl results presentation and finalisa-tion of ex-ante evaluation report)
Ex-post evaluation
20212223
Continuous results- based
monitoring2015 ndash 2018
Winding up we should point out that the above design and suggestions for its practical implementa-tion can only serve as a rough sketch which of course needs to be further elaborated during the inception phase of the research For the sake of convenience gender-related aspects or further aspects related to the living conditions of the migrants such as access to health services or education have not been dis-cussed Also the factually available resources for the evaluation and the logistical and practical feasibil-
ity of the data collection cannot be assessed without further information about the project concept and the framework conditions All the more important then to start the evaluation with an in-depth scop-ing phase to ensure appropriate data collection and analysis throughout the evaluation Valid and reli-able evaluation findings can only be produced with high-quality data In other words If the data is poor no design will save the day
49
Ndeg Project name Inst Country Design Data collection instruments Methodology
1 Noakhali Rural Development Project
Danida Bangla-desh
Ex-post facto
Quantitative analysis of project monitoring and contextual data Qualitative analysis documentary study archival work questionnaire surveys stakeholder and informant interviews rep-resentative surveys of project components assessment of buildings roads and irriga-tion canals village surveys and interviews observation focus group discussion case studies
Mixed-method approach
2 Climate Finance Readiness Pro-gramme
BMZ
GIZ
KfW
Global
3 National Ad-aptation Plan Global Support Programme
UNDP UNEP GEF
Global
4 Africa Adaptation Programme
UNDP WFP UNIDO UNICEF
Africa-wide
5 Strategic Ini-tiative to Address Climate Change in LDCs
UNDP Global
6 Climate Support Programme (CSP)
GIZ
BMU DEA
South Africa
NA ndash still ongoing
7 Public Invest-ment and Climate Change Adapta-tion (IPACC)
BMUB
GIZ APCI Ministries regional govern-ments of Cusco amp Piura
Peru (Cusco and Piura)
NA ndash still ongoing
8 Climate Change Adaptation in Rural Areas of India (CCA RAI)
GIZ BMZ
ministries Govern-ment of India govern-ments of federal states
India (Madhya Pradesh Rajasthan Tamil Nadu and West Bengal)
9 Sustainable agri-cultural develop-ment (PROAGRO I and II)
BMZ GIZ
SIDA ministries VIPFE
Bolivia (Chaco Northern Potosi Southern Cocha-bamba Valles)
Mid-Term Evalua-tion
Mainly qualitative evaluation design analysis of primary and secondary data semi-structured interviews and surveys with national counterparts strategic partners and target groups direct observation focus group discussions
Mainly qualitative evalua-tion design
5 Annex51 Overview of current CCA related-project evaluations
Impa
ct E
valu
atio
n G
uide
book
for C
limat
e Ch
ange
Ada
ptat
ion
Proj
ects
50
Ndeg Project name Inst Country Design Data collection instruments Methodology
10 Transboundary water manage-ment with the Mekong River Commission
BMZ GIZ
BMUB
Mekong River Commis-sion
Cambo-dia Laos Thailand Vietnam
NA ndash still ongoing
11
Rural Finance and Community Initiatives Project
IFAD The Gambia
Quasi-experi-mental
Field-level questionnaires focus group discussions interviews with key informants and case studies of the various community-based organisations and their members
For impact assessment the mission relied on a quanti-tative survey and participa-tory rural appraisal (PRA) exercise
12 Ghana Water Programme
CIDA Ghana Before-after
Document review key-informant inter-views internal benchmarking data from project reviews used for before vs after limited resources did not enable ex-post surveys
13 Chronic vulner-ability to food insecurity
WFP Kenya Experi-mental
Literature reviewsecondary data analysis Key Informant Discussions Participatory Vulnerability Profiles Field visits Focus Group Discussions
Study triangulates data from qualitative and quantitative sources It uses qualita-tive data from focus group discussions with community members and key-inform-ant interviews with com-munity opinion leaders and quantitative data involving about 3000 randomly sam-pled households
14 Food and Cash for Assets (FCFA) on Livelihood Resilience in Bangladesh
WFP Bangla-desh
Before-after approach
Document review On the quantitative front a household survey was conducted that covered 1500 households of participants non-participants and the comparison group Qualitative data were collected through focus group discus-sions asset assessments key-informant interviews semi-structured interviews
Mixed-method approach was adopted Participatory rural appraisal (PRA)
15 Impact of Food for Assets on Livelihood Resilience in Guatemala
WFP Guate-mala
Quasi-Experi-mental
Document review secondary data analysis and institutional Analysis community pro-file asset assessment institutional analysis household survey focus group discussion semi-structured interviews
Mixed-method approach Quantitative survey at the household level qualitative assessment of impacts at household and community levels assessment of tech-nical and biophysical assets in each community social and institutional analysis of networks and linkages at different levels especially communities
16 Impact of Food for Assets on Livelihood Resilience in Senegal
WFP Senegal Quasi-experi-mental
Document review household survey obser-vation village profiles gender-disaggregat-ed focus group discussions semi-structured interviews with major stakeholders asset assessments
Mixed-method Approach data triangulation
17 Effects of Climate Variability and Change on Household Food Sufficiency among Small-Scale Farmers of Yatta District
Journal article
Kenya Experi-mental
Desk research use of questionnaires inter-views focus group discussions observa-tions participatory vulnerability profiles development of indigenous knowledge systems
Mixed-method approach
Crop production data using Krejcie amp Morgan formula commonly used to calculate a sample size (random sampling procedure) coefficients of variation were computed for annual precipitation and then cor-related to crop production using Pearson correlation coefficient
51
Ndeg Project name Inst Country Design Data collection instruments Methodology
18 Analysis of vulnerability and resilience to climate change-induced shocks in North Shewa
Journal article
Ethiopia Experi-mental
Secondary data analysis surveys structured questionnaire interviews focus group discussion vulnerability analysis expert judgment
Mixed-method approach principal component analy-sis correlation with past disaster events ordered probit regression model use of fuzzy logic random sampling procedure
19 Vulnerabil-ity of Farming Households to Environmental Degradation in Developing Countries Evi-dence from North Central Nigeria
Journal article
Nigeria Experi-mental
Survey was used to generate household level data
Principal component analysis was used to develop vulnerability index for individual household so as to classify households depending on their level of vulnerability to environmen-tal degradation impacts use of multi-stage random sampling technique cluster analysis ordered logit regression model
20 An Index to Determine Vul-nerability of Communities in a Coastal Zone A Case Study of Baler Aurora
Journal article
Philip-pines
Experi-mental
Secondary data analysis survey (face-to-face and random) questionnaire observa-tions mappingGIS resource mapping activity workshops
Indicator method index computations following a balanced weighted aver-age approach Pearsonrsquos correlation coefficient of determination
21 Assessing House-hold Vulner-ability to Climate Change The Case Of Farmers In The Nile Basin
IFPRI Ethiopia Experi-mental
Expert knowledge use of household-level socio-economic survey interviews
Mixed-method approach Indicator and econometric method Principal compo-nent analysis correlation with past disaster events
22 Cambodia Community-Based Adaptation Programme
UNDP Cambodia Experi-mental
Secondary data analysis primary data key-informant interviews un-structured in-dividual interviews site visits observations semi-structured discussions structured Focus Group Discussions
Mixed-method data triangulation inductive and deductive approaches using quantitative and qualitative data
23 Strengthen-ing Adaptation Capacities and Reducing the Vulnerability to Climate Change in Burkina Faso
UNDP Burkina Faso
Document review individual interviews group discussions field visits observation
24 National Pro-gramme for Man-aging Climate Change in Malawi and the Malawi Africa Adaptation Programme
UNDP Malawi Desk review of project semi-structured interviews field visits workshops
Mixed-method approach data triangulation
25 Adaptation to Climate Change in the Nile Delta through Integrat-ed Coastal Zone Management
UNDP Egypt Document review and analysis (desktop study) interviews and meetings (face-to-face and by telephoneSkype and email questionnaires data collection in the field (interviews direct observations)
26 The Hill Maize Research Project
USAID Nepal Experi-mental
Secondary data published and unpublished documents and reports quantitative and qualitative tools Primary data structured and pre-tested questionnaire (household level) semi-structured checklist with a number of open-ended questions (community level) focus group discussion key-informant interviews using similar semi-structured checklist with open-ended questions data collected from key informants and focus group surveys were used for descrip-tive and qualitative analysis whereas those collected through household survey were used for quantitative analysis
Mixed-method approach randomised controlled trial propensity score matching (PSM)
5 A
nnex
Impa
ct E
valu
atio
n G
uide
book
for C
limat
e Ch
ange
Ada
ptat
ion
Proj
ects
52
Ndeg Project name Inst Country Design Data collection instruments Methodology
27 Small-Scale Irri-gation Manage-ment Project
JICA Indonesia Experi-mental
Household surveys direct interviews Focus Groups Discussions
Mixed-method approach propensity score match-ing regression disconti-nuity design estimation strategy T-test estimation of average treatment effect balancing test
28 Vulnerability to tropical storm impacts in coastal areas of the Red River Delta in Viet Nam and the adjacent region
Journal article
Vietnam Quantitative and qualitative surveys inter-views with key informants semi-structured interviews discussions mangrove utilisa-tion survey (quantitative model) focused interviews visualisation of storm track for various typhoon seasons
Mixed-method approach participatory rural appraisal
29 Sustainable Soil Management Program
Helvetas Swiss Inter-Co-operation amp SDC
Nepal Desk review of relevant documents field visits semi-structured interviews Focus group discussions observations separate focus group discussions for discussing is-sues related to labour migration apprecia-tive inquiry approach using open-ended questions storytelling about successes and challenges as well as visioning
30 Dry Zone Liveli-hood Support and Partnership Programme (DZLISPP)
IFAD Sri Lanka Quasi-experi-mental
Qualitative survey (key informant interviews with project staff and government officials focus group discussions with beneficiaries) and quantitative survey of 2560 households (both treatment and non-treatment group)
Mixed-method approach
31 Implement-ing sustainable water resources and wastewater management in Pacific island countries
UNDP Pa-cific island countries
Evaluation involved an orientation meeting in Nadi Fiji with Projectrsquos Regional Steering Committee two missions to visit six of the PICs and Skype and phone interviews with representatives of the remaining PICs and the implementing agencies construction of theory of change to evaluate the pathway of projectrsquos success
Mostly qualitative in nature
32 Supporting Integrated and Comprehensive Approaches to Climate Change Adaptation in Africa - Main-streaming CCA in the National Sectoral Policies of Tanzania
UNDP Tanzania Primary and secondary data were collected and analysed use of semi-structured indi-vidual and group interviews
No specific reference but seems to be highly qualita-tive
33 Climate Change Adaptation Action and Mainstreaming in Mozambique
UNDO Mozam-bique
Primary and secondary data were collected and analysed use of semi-structured indi-vidual and group interviews
No specific reference but seems to be highly qualita-tive
34 Integrating Disaster Risk Reduction and Climate Change Adaptation (DRRCCA) in Local Development Planning and Decision-making Processes
UNDP Philip-pines
Desk review key-informant interview (KII) using a questionnaire guide that focuses on particular agenciesinstitutions vis-agrave-vis outcomeoutput focus group discussion using a questionnaire guide and study or field visits where observation and interview methods are utilised for more insights
Mid-term review relies on qualitative information gen-erated through primary data gathering Opportunities for triangulation were sought However not all datainformation can be treated in this manner especially as certain key players have not been interviewed despite several attempts
35 Africa Adaptation Project Namibia Building the Foundation for a National Ap-proach to Climate Change Adapta-tion in Namibia
UNDP Namibia Interviews group interviews and document reviews Open-ended questionnaires were employed to facilitate interviews Literature and documents were reviewed to acquire relevant and appropriate information required to answer key evaluation questions and objectives Observations and case study approaches were used during field visits
Evaluation applied a mixed methodology of quantita-tive and qualitative research approaches
= No reference | NA = Not applicable
53
52 Calculation of net average treatment effect with double-difference approach
Figure 11 Calculation of the net treatment effect in an experimental or quasi-experimental design
Indicator lsquoIrsquo Intervention = Treatment
t0 t1 t2point in time
Difference of I between treatment and comparison group after treatment (t2)
Difference of I between treatment and comparison group before treatment (t0)
Average value of I for treatment group
Average value of I for comparison group
net average treatment effect
Estimated average counterfactual value of I for treatment group
The figure shows that the counterfactual value of the indicator for the treatment group is estimated on the basis of its (observed) value for the comparison group and the difference of its values between the groups before the treatment In other words it is assumed that without the treatment the treatment group would have developed in the same way as the com-parison group Accordingly the net average treat-ment effect ( ) can be calculated very easily by using the following formula
Whereby represents the value for the indicator of interest for the treatment (exponent = 1) and com-parison (exponent = 0) group at the points in time ( 0 = before and 2 = after treatment) when data is being collected ie before and after the treatment Sim-ply speaking the difference in the indicator mean value between the treatment and comparison group before the treatment is subtracted from its differ-ence between the treatment and comparison group after the treatment Therefore this approach is also called lsquodifference-in-differencersquo or lsquodouble-differ-encersquo approach
53 Propensity score matching (PSM)
The propensity score is an index that indicates the conditional probability of an individualrsquos being part of the treatment group This probability is calcu-lated based on a set of variables that are relevant for both selection for the treatment and the observed treatment effect The advantage of PSM is that in
contrast to other matching techniques it provides a one-dimensional score for the matching procedure and does not require any distribution assumptions regarding the basic population (cf 331) It does however require a set of assumptions to be fulfilled which limit its applicability to some extent These are
y Conditional independence assumption (CIA) The treatment effect (ie outcome differences between the treatment and the comparison group) has to be independent from the selection ie the effects may only be explained by the treat-ment confounding factors have to be excluded Example If an intervention aims at increasing the income of a group of people project benefi-ciaries need to be subject to the same external economic framework conditions that influence their income as non-beneficiaries The assump-tion would be violated for instance if a certain occupational group were selected (eg only farm-ers) and compared with a basic population that consists of various occupational groups
y Stable unit treatment value assumption (SUTVA) The treatment effect of an intervention on one person may not be influenced by the participa-tion of another person in the same intervention Example If an intervention aims at providing financial support to a group of people eg by micro-credits the potentially available amount for each beneficiary must be equal regardless of the amounts already spent In other words the project budget needs to be at least as big as the maximum budget needed if all beneficiaries were to request the maximum individual amount
5 A
nnex
Impa
ct E
valu
atio
n G
uide
book
for C
limat
e Ch
ange
Ada
ptat
ion
Proj
ects
54
y Stability of covariates against the treatment The covariates that are used to calculate the propen-sity score must not be influenced by the treat-ment Example If an intervention aims at increasing the income of a group of people then the income of the potential beneficiaries must not be used as a covariate (as it is an intended outcome of the project)
y Common support condition In order to be suit-able for matching both the treatment and com-parison group need to contain individuals with the same or at least a similar propensity score
y Balancing property Individuals who have the same propensity score need to be comparable regarding the particular characteristics that were chosen as covariates
If the project characteristics meet the above require-ments PSM can be applied according to the follow-ing sequence 28
Figure 12 PSM sequence
Estimating the
propensity score
Testing the common support
assumption
Selecting a matching algorithm
Testing the matching
quality and treatment
effects
Sensitivity analysis
Estimating the propensity score
The estimation of the propensity score is based on the selection of the covariates and the estimation procedure The estimation procedure again depends on the number of groups that need to be included in the analysis As in evaluations usually only two groups ndash the treatment and comparison group ndash are compared and only discrete choice models usu-ally logit or probit regressions 29 are used While the type of regression only plays a minor role as both provide very similar findings the variables that are used to calculate the propensity score are by far more important as they need to fulfil the conditional inde-pendence assumption (CIA) in order to provide valid findings Furthermore as the propensity score indi-
28 The following descriptions are based on a CEval working paper (no 19) written by Muumlller Christoph 2012
29 Regressions are used in statistics for identifying the relation-ships between one dependent and several independent varia-bles (eg income depending on education gender and age) Logit and probit regressions are usually used when a variable can only have two values (eg yes and no participant and non-participant)
cates the conditional probability that an individual will receive a treatment only those variables must be used that reflect this probability Therefore it is not correct to generally refer to lsquosocio-economic covari-atesrsquo as is still sometimes found in the literature (cf eg OECD 2014) While socio-economic variables may be appropriate for interventions that focus on the poor (ie the poorer a person the more likely he or she is to participate) they may not make any sense for an intervention that focuses on vulnerability (ie the more vulnerable a person is the more likely he or she is to participate) Accordingly in the latter case variables that reflect the vulnerability of a per-son (eg proximity to a disaster-prone area) need to be taken as covariates In any case the selection of covariates needs to be theoretically substantiated
Once the covariates are selected the propensity score is calculated by a simple (logit or probit) regression Here it is important to note that only metric (ie continuous eg income age) and dichotomous vari-ables (ie variables that can have two values eg yesno 10) can be included Nominal (ie variables that can only have discrete valuescategories without ranking eg religion marital status) and ordinal (ie variables with discrete ranked values eg educational level) variables need to be recoded in dichotomous variables for each category before the analysis
Testing the common support assumption
After the propensity score has been calculated for each case (ie person individual) of the treatment and control group the so-called area of common support (ACS) has to be identified The ACS com-prises the range in which the treatment and com-parison group show a similar density of propensity scores Only cases that lie within this area can be used for the subsequent matching procedure The ACS can either be defined by cutting off the range at the low-est and highest propensity scores available for both groups or by trimming ie setting a certain density threshold level beneath which cases are discarded In order to decide how to define the ACS it makes sense to visualise the distribution of the propensity scores as the following figure illustrates
55
Figure 13 Exemplary illustrations of propensity scores densities
0
02
04
06
08
1
01 02 03 04 05 06 07 08 09 10
02
04
06
08
1
01 02 03 04 05 06 07 08 09 1
Treatment group
Comparison group
Treatment group
Comparison group
As the illustration in the example on the left shows it would be appropriate to cut the ACS below 03 as there are no cases in the treatment group below this value and above 08 as there are no cases in the com-parison group above that value On the right both groups feature values in the entire range between 0 and 1 However the treatment group contains no cases with propensity scores between 07 and 08 which would make it impossible to create matches in that area Accordingly it would make sense to set a threshold level say at about 015 beneath which cases are excluded In that case the ACS would lie between 03 and 06 and between 09 and 1 Note If no ACS can be identified PSM cannot be applied
Selecting a matching algorithm
Once the ACS has been defined matching then starts with the selection of the matching algorithm As there are a number of matching algorithms that dif-fer depending on how cases from the comparison group are assigned to cases of the treatment group and the type of weighting several algorithms are usually applied in order to select the one that is most sensitive for identifying the treatment effect Three popular matching algorithms are briefly outlined below
A very popular and fairly simple matching algorithm is the so-called nearest neighbour matching (NNM) With NNM the case from the comparison group that features the most similar propensity score to each case or group of cases of the treatment group is assigned ie the one with the most similar prob-ability of being a member of the treatment group The approach prevents so-called bad matches ie that cases which are very different ndash in terms of their characteristics as represented by the covariates ndash to each other are compared Cases from the compari-son group can then usually be used repeatedly as a matching partner for cases from the treatment group It is also recommended to match several cases from the comparison group with each case from the treatment group in order to receive more robust findings (ie with less variance) Thus the com-parison group should be considerably larger than the treatment group (cf 331) It should be noted though that the decision to use cases more than once in order to minimise the variance has the trade-off of a potentially higher bias as inferior matches may also be used Figure 14 provides a simplified illustration of how the matches can be identified graphically
Figure 14 Graphical illustration of nearest neighbour matching
Treatment group cases
Comparison group cases
0 025 05 075 1
Propensity score
Treatment group cases
Comparison group cases
0 025 05
Propensity score075 1
1Weighting factor of cases
Treatment group cases
Comparison group cases
0 025 05
Propensity score075 1
Range (caliper)
5 A
nnex
Impa
ct E
valu
atio
n G
uide
book
for C
limat
e Ch
ange
Ada
ptat
ion
Proj
ects
56
As figure 14 shows in this example both treatment group and comparison group cases are used repeat-edly for matching and cases that are not the nearest neighbour to any of the cases of the respective other group are discarded
Another matching algorithm that is frequently used is so-called kernel matching The algorithm uses the weighted means of preferably all individuals of the
comparison group to estimate the counterfactual sit-uation of an individual from the treatment group To apply this matching algorithm it has to be decided in advance how to weight the individual cases dur-ing the matching ie define the probability density function (eg a Gaussian function) and how steep the function should be (ie the slew rate) Again here is a graphic to illustrate the matching process
Figure 15 Graphical illustration of kernel matching
Treatment group cases
Comparison group cases
0 025 05 075 1
Propensity score
Treatment group cases
Comparison group cases
0 025 05
Propensity score075 1
1Weighting factor of cases
Treatment group cases
Comparison group cases
0 025 05
Propensity score075 1
Range (caliper)
Figure 15 shows that comparison group cases are weighted according to the proximity of their propen-sity score to the score of the treatment group case they should be matched with
A matching algorithm that offers a kind of compro-mise is the so-called radius matching for which only those cases of the comparison group are used for the
matching that are within a certain predefined range (also called lsquocaliperrsquo) to the treatment group case The advantage of this algorithm is that the range can be adjusted according to the number of available cases in the comparison group so that it can provide more robust findings provided sufficient cases are avail-able
Figure 16 Graphical illustration of radius matching
Treatment group cases
Comparison group cases
0 025 05 075 1
Propensity score
Treatment group cases
Comparison group cases
0 025 05
Propensity score075 1
1Weighting factor of cases
Treatment group cases
Comparison group cases
0 025 05
Propensity score075 1
Range (caliper)
Figure 16 shows that cases that lie outside a prede-fined range are discarded Since there are no gen-eral rules about how to define this range we should note that a wider range leads on the one hand to a reduced variance of the findings (ie increased robustness) on the other it also introduces more bias as lsquonot so goodrsquo matches are also used Conversely a narrower range reduces the bias but increases the variance Thus there is always a trade-off between the robustness and bias of the findings
Testing the quality of matching and calculating the treatment effects
When the matching procedures have been com-pleted it needs to be verified once again whether the above-mentioned balancing property is fulfilled A common method for doing this is to check if the dif-ference in the covariates between the treatment and comparison group has been substantially reduced which can be (amongst others) done by calculating lsquoCohens drsquo an index for comparing differences in mean values before and after matching However further methods are available for verifying the bal-ancing property that cannot be discussed in detail
57
here but can be found in the recommended litera-ture at the end of this section
After all these steps have been taken finally the treatment effects can be assessed in different ways First of all of course the sign and the magnitude of the mean differences in the outcome variables after matching provide information about the direction and size of the relevant effect Furthermore one-sided T-tests can be performed for checking if the treatment effects are significant
Sensitivity analysis
The last step to provide for a distinct attribution of the observed effects to an intervention is to assess the robustness of the findings against unobserved confounding factors To do this a sensitivity analy-sis needs to be conducted eg based on the so-called Rosenbaum Bounds (RBs) that make it possible to estimate how strongly a confounding factor would need to bias the selection process in order to com-promise the robustness of the estimated treatment effect RBs represent the limits within which treat-ment effects are considered significant Estimation of the RBs is based on the assumption that with an increasing positive or negative selection treatment effects are respectively over- or underrated This also means that the probability of a positive treatment effect decreases with positive selection and increases with a negative selection There are further indexes such as the Hodges-Lehmann estimator (ie for esti-mating the minimum treatment effect to be consid-ered as significant) that can be used to further hedge the findings of the sensitivity analysis
Unfortunately since the calculation of these estima-tors requires a substantial statistical background they cannot be discussed here in detail However sta-tistical programs such as SPSSreg or STATAreg provide particular modules for these estimators which make it possible also for laypeople to perform the required calculations (provided they have understood the sense and benefit of such an analysis)
54 Fixed-effects random-effects models and time-series cross-section analysis
Fixed-effects models (FEM) are used to estimate the impact of a particular independent variable (eg treatment framework condition) that varies over time on individual outcomes (eg income health status) It is based on the assumption that these outcomes correlate with that independent vari-able Thus FEM can reveal the relationship between
predictor and outcome variables within an analyti-cal entity giving consideration to time-invariant individual characteristics that potentially affect the impact of these predictor variables (eg profession on income or gender on nutrition) These characteristics are considered to be time-invariant unique to the analytical entity and not to be correlated with other individual characteristics In that case the treatment effect on the outcome variable of interest can be esti-mated by regressing the individual outcomes as cal-culated with the following formula
Whereby stands for the dependent outcome variable of interest with representing its analytical entity and the point in time when the data is col-lected is the value of the independent variable for this entity at that time the coefficient for the inde-pendent variable the invariant individual char-acteristic that affects the outcome and the error term for other unobserved factors that vary over time With that model all time- invariant differences between the analytical entities are controlled so that it can be used to identify the causes of observed changes of an analytical entity over time
In contrast to FEM the random-effects model (REM) is based on the assumption that variations in the individual outcomes of the entities are random and uncorrelated with the predictor variables Accord-ingly the REM should be used if it is assumed that differences across entities influence the depend-ent outcome variable Thus the formula has to be amended by adding a second error term that expresses this difference
As the application of REM requires that the second error term does not correlate with the predictor vari-able individual characteristics that potentially have an influence on the predictor variables need to be specified Accordingly omitting relevant variables in the model may lead to biased findings
A number of tests are available for deciding which model to use in a panel analysis such as the so-called Hausman test which tests whether correlates with the regressors the Pasaran cross-sectional dependence test or serial correlation tests As the test procedures cannot be discussed in detail in this Guidebook further references are provided in the literature list at the end of this section Furthermore it has to be added that for both STATAreg and SPSSreg do-file respectively syntax templates are available that can perform such tests on suitable data sets
5 A
nnex
Impa
ct E
valu
atio
n G
uide
book
for C
limat
e Ch
ange
Ada
ptat
ion
Proj
ects
58
Another lsquopanel-likersquo approach for long-term impact assessment is the so-called time-series cross-section (TSCS) analysis Similar to the panel analysis the TSCS analysis is based on data being collected over time from the same analytical units However in contrast to the former approach conclusions made with TSCS analysis are limited to the sample ie are not transferable to another population without fur-ther ado Another difference is that while the panel analysis requires a large sample but also works with a few observations (at least three) TSCS Analysis works with a small number of analytical entities but requires more observations (at least about 10) in order to provide robust findings Due to these fea-tures TSCS analysis is mainly used for policy studies with macro data and analytical entities such as sec-tors countries or regions As one the one hand the statistical fundamentals of TSCS analysis are quite complex and on the other hand the approach is not (yet) very popular for project evaluations it will not be discussed here in detail
However the following literature reference list gives some recommendations for further reading on this subject too
Beck N (2006) Time-SeriesndashCross-Section Methods New York New York University
Beck N (2001) Time-SeriesndashCross-Section Data What Have We Learned in the Last Few Years San Diego University of Califor-nia
Beck N Katz JN (1995) What to do (and not to do) with Time-Series Cross-Section Data The American Political Science Review 89(3)634 ndash 647
Girosi F King G (2001) Time Series Cross-Sec-tional Analyses with Different Explanatory Variables in Each Cross-Section Cambridge Harvard University
Wooldridge JM (2010) Econometric Analysis of Cross Section and Panel Data Cambridge The MIT Press
55 Structural equation modelling
As outlined in Section 316 structural equation models consist of latent constructs and empirically measurable indicators With regard to the operation-alisation of the constructsvariables two types of measurement models can be distinguished models based on reflective indicators and those based on formative indicators While reflective indicators are defined by their construct (eg construct sportiness
rarr indicator time needed to run 100 metres) forma-tive indicators define the construct (eg indicator number of training modules per month rarr construct sportiness) Accordingly reflective indicators have to correlate with each other while formative ones do not necessarily have to do so (eg time needed to run 100 500 1000 metres vs number of running mod-ules number of swimming modules etc) Another difference between reflective and formative con-structs is that reflective indicators are replaceable (eg time taken to run 100 metres time taken to cycle 1 km) while an exchange of formative indicators would result in a modification of the construct (eg number of maths lessons instead of training mod-ules)
Before the causal relationship between the con-structs can be analysed the validity of the measure-ment models ie how well the indicators opera-tionalise a construct needs to be checked Due to the above-mentioned differences the analysis of reflective and formative indicators differs As reflec-tive measurement models correspond to an explora-tive factor analysis (main component analysis) their validity is assessed on the basis of the factor loadings (should be ge0707) their significance its reliability (composite reliability r should be gt07) and the aver-age explained variance of the construct (should be gt05) Furthermore a reflective measurement model is considered valid if the explained variance of a construct is higher than each squared correla-tion between this and any other construct (lsquoFornell-Larker-Criterionrsquo ie discriminatory validity) Forma-tive measurement models correspond to a multiple regression Accordingly their quality is assessed on the basis of the factor weights their significance and the co-linearity of the indicators (ie the so-called variance inflation factor should be lt10)
Concerning the number of indicators required to describe a construct it has to be considered that there is a trade-off between the reliability of the measurement and the danger of creating artefacts which biases the construct (eg overrepresentation of physical indicators when measuring the health sta-tus) Furthermore the sample size should be consid-erably larger than the number of indicators
While the measurement model specifies the rela-tionship between the latent constructs and their indicators the structural model describes the influ-ence of the constructs on each other These influ-ences are graphically marked by arrows which rep-resent assumed causal relationships The direction of the arrow indicates the direction of causality ie defines what is the cause and what is the effect In principle both the number of constructs and the number of (estimated) causal relations are unlimited This also means that a construct can be both affected
59
by one or more constructs and affect another one or more others
The relationship between two constructs is expressed by the so-called path coefficient which ranges from -1 (perfect negative relationship) to 1 (perfect positive relationship) A value of 0 may indi-cate that there is no statistical relationship between two constructs While a high value of is preferable in practice values higher than 04 (respectively lt-04) can be considered as very high It has to be added that SEM makes it possible to calculate not only direct effects but also indirect and total effects
The path coefficient can be calculated in two dif-ferent ways ie by means of co-variance analysis or variance analysis each having some advantages and disadvantages Although the theoretical founda-tions of the two methods cannot be discussed here in detail the main aspects that help decide which one to choose are summarised in the following table
Table 8 Decisive aspects for choosing co-variance or variance analysis 30
Co-variance analysis Variance analysis
Preferred method for analysing established theories and testing hypotheses
Preferred method in explorative studies ie if the causal relations between the constructs are not yet substantiated
Works best with large sample sizes (n gt100)
Also works with smaller sample size (n gt30)
Method of choice if statistical quality criteria1 are preferred for assessing the validity of the model
Method of choice if the model is validated nomologically
Available software eg AMOSreg LISRELreg
Available software eg SmartPLSreg
As the table shows variance analysis might be the preferred choice for evaluations since they are usu-ally explorative in nature and constructs that char-acterise the objectives of an intervention are more likely to be based on formative measurement mod-els The smaller required sample size also speaks for the use of variance analysis However the fact that no statistical indexes are available to assess the validity of variance analysis-based structural mod-els means that the researcher applying this method needs to have comprehensive knowledge about the system conditions and the causal linkages between its elements
Nevertheless variance analysis also provides indi-ces for assessing the contribution of an intervention
30 Adapted from Jahn 200716
to an observed effect such as the above-mentioned path coefficient (should be gt02) its significance and the effect strength (fsup2 weak gt002 average gt015 strong gt035) Furthermore the model fit (Rsup2 small gt02 average gt033 substantial gt067) indicates the informative value of the model (ie how far the inde-pendent constructs explain the variance of the indi-vidual constructs)
As also shown in the table meanwhile a number of user-friendly computer programs are available for calculating structural equation models at least on the basis of variance analysis While in principle even people with a limited methodological background can operate such software (at least it provides plausi-ble findings) it is not recommended to do so because incorrect theoretical assumptions or setting wrong parameters for calculating the quality criteria can lead to biased or even completely false findings
56 Calculating sample sizes for probability sampling
This section outlines three different ways to cal-culate the sample size depending on the available information about the basic population In the first example the size of the basic population is known but the true value of a certain dichotomous charac-teristic (ie can have two values eg whether or not a beneficiary applied an improved farming technique) is not In this case the required sample size can be calculated simply according to the formula
Whereby is the required sample size is the size of the basic population and is the desired margin of error So assuming the basic population amounts to 1000 persons and the desired margin of error is 005 then the minimum sample size would be
10001000 ∙ 005
1000
This means data from a minimum of 286 randomly selected respondents would be needed for the survey
5 A
nnex
Impa
ct E
valu
atio
n G
uide
book
for C
limat
e Ch
ange
Ada
ptat
ion
Proj
ects
60
An alternative way to calculate the minimum sam-ple size for large populations ndash even if the exact size of the basic population is not known ndash is illustrated next In this case it is advantageous to have a good estimate of the true value of an observed characteris-tic of interest (eg gender distribution)
Thereby is the area under the normal curve corre-sponding to the defined level of confidence and is the true share of the population that displays a cer-tain characteristic (eg is female)
For most common levels of confidence equals as follows
90 = 164595 = 196099 = 2575999 = 3290
eg for a population in which 48 are female and the desired margin of error is 005 the minimum sample size would be
196 ∙ 048 ∙005
0958900025
However if the actual share of the basic population that features a certain characteristic of interest (eg percentage of beneficiaries who have adopted a new farming technique or not) is not known it is always safe to assume a 50 share as then the term bull (1 - ) and accordingly the entire formula reaches its maximum
If the size of the basic population is known and if it is smaller than approximately 50000 one can still use the latter formula in a first step but reduce the sam-ple size in a second step by applying the following correction term
Whereby is the required sample size as calculated above Assuming that the basic population only com-prises 1000 persons then the minimum sample size would be
384
1000
3841383
So according to this correction term it is acceptable to reduce the sample size by 106 respondents which equals a reduction of more than a quarter
It must however be kept in mind that the sample sizes provided in these formulas corresponds to the actual number of necessary completed question-naires Accordingly when planning a survey the non-response rate has to be considered as well The rate indicates the share of those who do not par-ticipate in the survey despite being selected for the sample This needs to be compensated to assure that the sample remains large enough to achieve the desired level of confidence and margin of error So if for example a sample size of 500 is required and it is assumed that only 80 might answer the number of respondents needs to be increased to at least 625
Furthermore it has to be considered that if the sur-vey is part of an experimental or quasi-experimental design data need to be collected not only for the treatment group but also for a comparison group Therefore when applying PSM the comparison group sample needs to be considerably bigger than the treatment group sample ndash ideally about two to three times the size ndash in order to assure that suf-ficient cases are available for matching during data analysis (cf 312)
61
57 Literature
Bours D et al (2014) Guidance Note 1 Twelve Rea-sons why Climate Change Adaptation MampE Is Challenging httpwwwseachangecoporgsitesdefaultfilesdocuments2014200120SEA20Change20UKCIP20GN1201220Reasons20why20CCA20MandE20is20challengingpdf
Bours D et al (2014) Guidance Note 2 Selecting Indicators for Climate Change Adaptation Pro-gramming httpwwwseachangecoporgsitesdefaultfilesdocuments2014200120SEA20Change20UKCIP20GN220Selecting20indi-cators20for20CCA_0pdf
Bours D et al (2014) Guidance Note 3 Theory of Change Approach to Climate Change Adaptation Programming httpwwwseachangecoporgsitesdefaultfilesdocuments2014200220SEA20Change20UKCIP20GN320ToC20approach20to20CCA20programmingpdf
Bours D et al (2014) Monitoring and Evaluation for Climate Change Adaptation and Resilience A Syn-thesis of Tools Frameworks and Approaches Sec-ond Edition httpwwwseachangecoporgsitesdefaultfilesdocuments20142005201520SEA20Change20UKCIP20Synthesis20Report202nd20editionpdf
Bours D et al (2014) Design Monitoring and Evalu-ation in a Changing Climate Lessons Learned from Agriculture and Food Security Programme Evaluations in Asia httpwwwseachangecoporgsitesdefaultfilesdocuments2014200520SEA20Change20UKCIP20ER120Agriculture20and20food20security_0pdf
Bours D et al (2014) International and donor agency portfolio evaluations trends in monitor-ing and evaluation of climate change adapta-tion programs httpwwwseachangecoporgsitesdefaultfilesdocuments2014200620SEA20Change20UKCIP20ER220CCA20MandE20trends20from20porfolio20evalu-ations_0pdf
Conway D amp Mustelin J (2014) Strategies for improving adaptation practice in developing countries Nature Climate Change 4339-342
Cordero C (2014) Case Study Working with the Vulnerability Sourcebook in Chullcu Mayu Bolivia News GIZ httpwwwgizdeexpertisehtml15486html
Dinshaw A et al (2014) Monitoring and Evaluation of Climate Change Adaptation Methodological Approaches OECD Environment Working Paper No 74 OECD Publishing
Ford JD et al (2013) How to track Adaptation to Climate Change A typology of Approaches for National-Level Application Ecology and Society 18(3)40
Ford J D amp Berrang-Ford L (2015) The 4Cs of adap-tation tracking consistency comparability com-prehensiveness coherency Mitigation and Adap-tation Strategies for Global Change 1-21
Fischerova G (no date) Strategic Initiatives to Address Climate Change in LDCs (Boots on the Ground) Integrating Climate Change Risks into Development Planning and Programming UNDP Bratislava Regional Centre (PowerPoint Presenta-tion)
Foumlrch W et al (2014) Back to Baselines Measuring Change and Sharing Data Agriculture and Food Security 2014 313 httpwwwagricultureand-foodsecuritycomcontentpdf2048-7010-3-13pdf
Garcia JR amp Zazueta A (2015) Going Beyond Mixed Methods A Systems Perspective for Ask-ing the Right Questions Institute of Develop-ment Studies httponlinelibrarywileycomdoi1011111759-543612119epdf
German Federal Ministry for Economic Cooperation and Development (BMZ) (2013) Climate Finance Readiness Programme Early Action for Ambitious Goals httpwwwgizdeexpertisedownloadsgiz2013-en-climate-finance-readiness-flyerpdf
GIZ (2012) Disaster Risk Management and adapta-tion to climate change Experience from German Development Cooperation Deutsche Gesellschaft fuumlr Internationale Zusammenarbeit (GIZ) GmbH httpwwwipaccpedocen-disaster-risk-man-agement-climate-changepdf
GIZ (2013) GIZrsquos global GCF Readiness Programme Competence Centre for Climate Change Environ-ment and Climate Change Division httpwwwgizdeexpertisedownloadsgiz2013-en-climate-finance-gcfitpdf
5 A
nnex
Impa
ct E
valu
atio
n G
uide
book
for C
limat
e Ch
ange
Ada
ptat
ion
Proj
ects
62
GIZ (2013) GIZ in South Africa Programs and Pro-jects Deutsche Gesellschaft fuumlr Internationale Zusammenarbeit (GIZ) GmbH httpswwwgizdededownloadsgiz2013-en-giz-programs-pro-jects-south-africapdf
GIZ (2013) Guidelines on designing and using a results-based monitoring system (RBM system) httpswwwgiz2013-0110en-results-based-moni-toring-systempdf
GIZ (2014) Transboundary Water Management Sup-port to Cooperation on Shared Waters Deutsche Gesellschaft fuumlr Internationale Zusammenarbeit (GIZ) GmbH httpwwwgizdeexpertisedown-loadsgiz2014-en-mappe-transboundary-water-managementpdf
GIZ (2015a) The Sustainable Agricultural Programme (PROAGRO I amp II) httpproagro-boliviaorg (accessed on 22102015)
GIZ (2015b) Public Investment and Climate Change Adaptation (IPACC) project httpwwwgizdeenworldwide13314html (accessed on 22102015)
GIZ (2015c) Climate Support Programme (CSP) httpwwwgizdeenworldwide17807html (accessed on 22102015)
Hammill A et al (2013) Comparative Analysis of climate change vulnerability assessments Les-sons from Tunisia and Indonesia Competence Centre for Climate Change Deutsche Gesellschaft fuumlr Internationale Zusammenarbeit httpsgc21gizdeibtvarappwp342deP1443wp-contentuploadsfilebasevavulnerability-guides-man-uals-reportsComperative-analysis-of-climate-change-vulnerability-assessmentspdf
Hedger MM (2008) Desk Review Evaluation of Adaptation to Climate Change from a Develop-ment Perspective Institute of Development Stud-ies httpswwwclimate-evalorgsitesdefaultfileseventsalexandriaIDS_Report_on_Evaluat-ing_Adaptation_for_GE_publication_versionpdf
IIED (2015) Capacity Strengthening in Least Deve-loped Countries (LDCs) for Adaptation to Climate Change (CLACC) httpwwwiiedorgcapacity-strengthening-least-developed-countries-for-adaptation-climate-change-clacc (accessed on 22102015)
Karkoschka O et al (2013) Guidance for Integrat-ing Monitoring and Evaluation of Climate Change Adaptation into Strategies in Mongolia Deutsche Gesellschaft fuumlr Internationale Zusammenarbeit httpwwwseachangecoporgsitesdefaultfilesdocuments2013200720GIZ20-20Guid-ance20for20Integrating20M26E20of20CCA20into20Strategiespdf
Lamhauge N et al (2012) Monitoring and Evaluation for Adaptation Lessons from Development Coop-eration Agencies OECD Environment Working Paper No 38 OECD Publishing httpwwwoecd-ilibraryorg docserverdownload5kg20mj6c2bwpdfexpires=1425238023ampid=idampaccname=guestampchecksum=77BA5587F2D7AD9EF6C22B614A36C4D4
Leighton M et al (2011) Climate Change and Migra-tion Rethinking Policies for Adaptation and Disaster Risk Reduction No 152011 United National University - Institute for Environment and Human Security httpswwwehsunuedufileget8468
Leiter T (2015) Linking Monitoring and Evaluation of Adaptation to Climate Change across Scales Avenues and Practical Approaches In D Bours P Pringle amp C McGinn (Eds) Monitoring and Evalu-ation of Climate Change Adaptation A review of the landscape New Directions for Evaluation 147 117-127
OECD (2011) Handbook on the OECD-DAC Cli-mate Markers httpwwwoecdorgdacstats48785310pdf
OECD (2014) OECD DAC Statistics Aid to Climate Change Adaptation March 2014 Version 2 httpwwwoecdorgdacenvironment-developmentAdaptation-related20Aid20Flyer20-20March20201420v2pdf
Olivier J et al (2013) Adaptation made to measure A Guidebook to the Design and result-based moni-toring of climate change adaptation projects 2nd Edition Deutsche Gesellschaft fuumlr Internationale Zusammenarbeit (GIZ) GmbH httpsgc21gizdeibtvarappwp342deP1443wp-contentuploadsfilebasememe-guides-manuals-reportsGIZ-2013_Adaptation_made_to_measure_second_editionpdf
63
Prowse M et al (2010) Impact Evaluation and Intervention to address Climate Change A Scop-ing Study International Initiative for Impact Evaluation Working Paper 7 httpswwwclimate-evalorgsitesdefaultfilesevalua-tions53020Impact20Evaluation20and20Interventions20to20Address20Climate20Change20-20A20Scoping20Studypdf
Sanahuja H E (2011) A Framework for Monitoring and Evaluating Adaptation to Climate Change Community of Practice Global Environment Facility httpswwwclimate-evalorgsitesdefaultfilesstudiesClimate-Eval20Frame-work20for20Monitoring20and20Evalua-tion20of20Adaptation20to20Climate20Changepdf
Sara Orleans Reed et al (2014) Resilience projects as experiments implementing climate change resil-ience in Asian cities climate and development Published by Taylor amp Francis httpwwwtand-fonlinecomdoifull101080175655292014989190VPZRBvmG-NM
Scholze M (2013) Country Experiences with Main-streaming Adaptation ndash from Programme to National Level Webinar httpsgc21gizdeibtvarappwp342deP1443wp-contentuploadsfilebasems mainstreaming_webinareCoun-try_experiences_with_mainstreaming_adapta-tion_national_levelpdf
Schwartzendruber F (2014) Evaluation of NRM interventions linked to climate change A scoping study Draft version httpswwwclimate-evalorgsitesdefaultfilesstudiesNRM-Study-Draftpdf
Smit B amp Pilifosova O (2010) Adaptation to Climate Change in the Context of Sustainable Develop-ment and Equity httpswwwvieunuedufileget9995pdf
Smith JB Vogel J M and Cromwell J E (2009) An architecture for government action on adaptation to climate change An editorial comment Climatic Change 9553-61
UNDP (2009) Thematic Area Scaling up local and community-based actions UNDP Community Based Adaptation httpsunfcccintfilesadapta-tionapplicationpdfundp_ap_update_sep_09_cba_1_sppdf
UNDP (2011) Achievements in 2011 Strategic Initia-tive to Address Climate Change in Least Devel-oped Countries Boots on the Ground Report httpwwwundporgcontentdamundplibraryEnvironment20and20EnergyCli-mate20Change2011-Boots-on-the-Ground-Reportpdf
UNDP (2011) Brochure on Strategic Initiative to Address Climate Change in LDCs httpwwwundporgcontentdamundplibraryEnviron-ment20and20EnergyClimate20ChangeCapacity20DevelopmentFlyer20for20Boots20on20the20Ground_Final_rev20rcpdf
UNDP (2013) UNDP support to LDCs to Access Finance for Adaptation Basic Facts and Figures httpundp-almorgsitesdefaultfilesdown-loadsoverview_of_undp_ support_to_ldcs_to_access_finance_for_adaptation_-_nov_2013pdf
UNDP (2015a) Community-Based Wetland Manage-ment Project (BIRAM) httpwwwundp-almorgprojectsspa-cba-bangladesh-community-based-wetland-management-project-biram (accessed on 22102015)
UNDP (2015b) National Adaptation Plan Global Support Programme (NAP-GSP) httpwwwundp-almorgprojectsnaps-ldcs (accessed on 22102015)
UNDP (2015c) Pacific Integrated Water Resource Management (IWRM) project httpwwwtand-fonlinecomdoipdf10108019439341003786729 (accessed on 22102015)
Villanueva P S (2011) Learning to Adapt Monitor-ing and Evaluation Approaches in Climate Change Adaptation and Disaster Risk Reduction ndash Chal-lenges Gaps and Ways Forward httpr4ddfidgovukPDFOutputsClimateChangeSCR-Dis-cussionPaper9--Learning-to-ADAPTpdf
Wuumlrtenberger L (2013) GCFit GIZrsquos Global GCF Readiness Programme Deutsche Gesellschaft fuumlr Internationale Zusammenarbeit (GIZ) GmbH httpwwwcaribankorguploads201305GIZC2B4s-Global-GCF-Readiness-Programmpdf
5 A
nnex
Impa
ct E
valu
atio
n G
uide
book
for C
limat
e Ch
ange
Ada
ptat
ion
Proj
ects
64
Notes
65
Published by Deutsche Gesellschaft fuumlr Internationale Zusammenarbeit (GIZ) GmbH
Registered offices Bonn and Eschborn Germany
Global Project Effective Adaptation Finance (MampE Adapt)
BMZ Bonn Dahlmannstraszlige 4 53113 Bonn Germany Tel +49 (0) 228 99 535 - 0 Fax +49 (0) 228 99 535 - 3500
BMZ Berlin Stresemannstraszlige 94 10963 Berlin Germany Tel +49 (0) 30 18 535 - 0 Fax +49 (0) 30 18 535 - 2501
poststellebmzbundde wwwbmzde
Friedrich-Ebert-Allee 36 + 40 53113 Bonn Germany Tel +49 (0) 228 44 60 - 0 Fax +49 (0) 228 44 60 - 1766
Dag-Hammarskjoumlld-Weg 1-5 65760 Eschborn Germany Tel +49 (0) 6196 79 - 0 Fax +49 (0) 61 96 79 - 1115
climategizde wwwgizdeclimate
In cooperation with UNDP Center for Evaluation CEVAL
Autors Stefan Silvestrini Ines Bellino Susanne Vaumlth
Design and layout Ira Olaleye Eschborn Germany
Photo credits Title page copy Ranak Martin
As at September 2015
GIZ is responsible for the content of this publication
On behalf of Federal Ministry for Economic Cooperation and Development (BMZ) Special Unit lsquoClimatersquo
Addresses of the BMZ offices
- Impact Evaluation Guidebook for Climate Change Adaptation Projects
-
- Content
-
- List of figures
-
- Figure 1Flow chart for implementing an RIE
- Figure 2Illustration of the pipeline approach
- Figure 3Selection of individuals for comparison
- Figure 4Outcome scores before and after intervention
- Figure 5Generic layout of a structural equation model
- Figure 6Decision tree for selecting an evaluation design for measuring impacts at individual level
- Figure 7Decision tree for selecting an evaluation design for measuring impacts at institutional and system level
- Figure 8Distribution of sample mean values in relation to the true population mean value
- Figure 9Simplified SEM for the GIZ projectthinspthinsp33
- Figure 10Draft schedule for impact monitoring and evaluation framework
- Figure 11Calculation of the net treatment effect in an experimental or quasi-experimental design
- Figure 12PSM sequence
-
- List of tables
-
- Table 1Exemplary data collection plan
- Table 2Example table for matching on observables
- Table 3Required project characteristics and data
- Table 4Example of question types
- Table 5Exemplary to-do list for preparing a survey
- Table 6Applicability of evaluation designs
- Table 7Draft (simplified) data collection plan
- Table 8Decisive aspects for choosing co-variance or variance analysisthinsp
-
- List of abbreviations
- Glossary
-
- Executive Summary
- 1Introduction
-
- 11How to use the Guidebook
- 12How to plan and implement an RIE for CCA projects
-
- 2Evaluating climate change adaptation projects
-
- 21Types and key features of climate change adaptation projects
-
- 211Adaptation projects addressing the individual level
- 212Adaptation projects addressing the institutional level
- 213Adaptation projects addressing the systemic level
-
- 22Key challenges of climate change adaptation projects
- 23Review of current methods to evaluate the results of CCA projects
-
- 3Rigorous evaluation designs and examples of applicability in climate change adaptation projects
-
- 31Overview of evaluation designs ndash potentials and limitations for climate change adaptation projects
-
- 311Experimental and quasi-experimental designs
- 312Matching techniques
- 313Pipeline approach
- 314Regression discontinuity design
- 315Time-series designs
- 316Structural equation modelling
- 317Summary
-
- 32Providing reliable large-scale data
-
- 4Case study Urban Management of Internal Migration due to Climate Change
-
- 41Background and project objectives
- 42Practical implementation
-
- 5Annex
-
- 51Overview of current CCA related-project evaluations
- 52Calculation of net average treatment effect with double-difference approach
- 53Propensity score matching (PSM)
- 54Fixed-effects random-effects models and time-series cross-section analysis
- 55Structural equation modelling
- 56Calculating sample sizes for probability sampling
- 57Literature
-
- Publishing information
-

Impa
ct E
valu
atio
n G
uide
book
for C
limat
e Ch
ange
Ada
ptat
ion
Proj
ects
1
List of tables 2List of figures 2List of abbreviations 3Glossary 4
Executive Summary 6
1 Introduction 10
11 How to use the Guidebook 1112 How to plan and implement an RIE for CCA projects 11
2 Evaluating climate change adaptation projects 16
21 Types and key features of climate change adaptation projects 16 211 Adaptation projects addressing the individual level 16 212 Adaptation projects addressing the institutional level 17 213 Adaptation projects addressing the systemic level 18
22 Key challenges of climate change adaptation projects 1923 Review of current methods to evaluate the results of CCA projects 20
3 Rigorous evaluation designs and examples of applicability in climate change adaptation projects 22
31 Overview of evaluation designs ndash potentials and limitations for climate change adaptation projects 22 311 Experimental and quasi-experimental designs 23 312 Matching techniques 25 313 Pipeline approach 26 314 Regression discontinuity design 28 315 Time-series designs 29 316 Structural equation modelling 30 317 Summary 32
32 Providing reliable large-scale data 34
4 Case study Urban Management of Internal Migration due to Climate Change 39
41 Background and project objectives 4042 Practical implementation 42
5 Annex 48
51 Overview of current CCA related-project evaluations 4852 Calculation of net average treatment effect with double-difference approach 5253 Propensity score matching (PSM) 5254 Fixed-effects random-effects models and time-series cross-section analysis 5655 Structural equation modelling 5756 Calculating sample sizes for probability sampling 5857 Literature 60
Content
Impa
ct E
valu
atio
n G
uide
book
for C
limat
e Ch
ange
Ada
ptat
ion
Proj
ects
2
List of tablesTable 1 Exemplary data collection plan 13Table 2 Example table for matching on observables 25Table 3 Required project characteristics and data 35Table 4 Example of question types 36Table 5 Exemplary to-do list for preparing a survey 37Table 6 Applicability of evaluation designs 42Table 7 Draft (simplified) data collection plan 44Table 8 Decisive aspects for choosing co-variance 58
List of figuresFigure 1 Flow chart for implementing an RIE 14Figure 2 Illustration of the pipeline approach 27Figure 3 Selection of individuals for comparison 28Figure 4 Outcome scores before and after intervention 28Figure 5 Generic layout of a structural equation model 31Figure 6 Decision tree for selecting an evaluation design for measuring impacts at individual level 33Figure 7 Decision tree for selecting an evaluation design for measuring impacts at institutional and system level 34Figure 8 Distribution of sample mean values in relation to the true population mean value 38Figure 9 Simplified SEM for the GIZ project 45Figure 10 Draft schedule for impact monitoring and evaluation framework 47Figure 11 Calculation of the net treatment effect in an experimental or quasi-experimental design 52Figure 12 PSM sequence 53
3
List of abbreviations
AAP Africa Adaptation ProgrammeADB Asian Development BankBGR Federal Institute for Geosciences and Natural ResourcesBMZ German Federal Ministry for Economic Cooperation and DevelopmentBMUB German Federal Ministry for the Environment
Nature Conservation Building and Nuclear SafetyCCA Climate change adaptationCIDA Canadian International Development AgencyCO2 Carbon dioxide DAC Development Assistance CommitteeDfID Department for International DevelopmentEU European UnionGCF Green Climate Fund GHG Greenhouse gases GIZ Deutsche Gesellschaft fuumlr Internationale Zusammenarbeit GmbH IFAD International Fund for Agricultural DevelopmentKfW Kreditanstalt fuumlr WiederaufbauLDC Least developed countyLDCF Least Developed Countries FundMampE Monitoring and EvaluationNAMAs Nationally Appropriate Mitigation ActionsNAP National Adaptation PlanNC National CommunicationNGO Non-governmental organisation OECD Organisation for Economic Co-operation and DevelopmentPSM Propensity score matchingRDD Regression discontinuity designRCT Randomised controlled trialREDD Reducing Emissions from Deforestation and Forest DegradationSEM Structural equation model(ling)SIDA Swedish International Development AgencyToC Theory of changeUNDP United Nations Development ProgrammeUNEP United Nations Environment ProgrammeUNFCCC United Nations Framework Convention on Climate ChangeUNICEF United Nations Childrenrsquos FundUNIDO United Nations Industrial Development Organization USAID United States Agency for International Development WFP World Food Programme
Impa
ct E
valu
atio
n G
uide
book
for C
limat
e Ch
ange
Ada
ptat
ion
Proj
ects
4
Glossary
Accountability Obligation to demonstrate that work has been conducted in compliance with agreed rules and stand-ards or to report fairly and accurately on performance results vis-agrave-vis mandated roles andor plans This may require a careful demonstration that the work is consistent with the contract terms
Adaptation Adjustment in natural or human systems in response to actual or expected climatic stimuli or their effects which moderates harm or exploits beneficial opportunities Various types of adaptation can be distinguished including anticipatory autonomous and planned adaptation Anticipatory adaptation ndash Adaptation that takes place before impacts of climate change are observed Also referred to as proactive adaptation Autonomous adaptation ndash Adaptation that does not constitute a conscious response to climatic stimuli but is triggered by ecological changes in natural systems and by market or welfare changes in human systems Also referred to as spontaneous adaptation Planned adaptation ndash Adaptation that is the result of a deliberate policy decision based on an aware-ness that conditions have changed or are about to change and that action is required to return to maintain or achieve a desired state
Adaptive capacity
The ability of a system to adjust to climate change (including climate variability and extremes) to moderate potential damages to take advantage of opportunities or to cope with the consequences
Attribution Ascribing the cause of an effect (change) to a specific intervention An approach to () rigorous impact evaluation that concerns clear cause-effect relationships ie establishing causal links and drawing explanatory conclusions about observed changes (whether anticipated or not) and the con-cerned intervention Focusing on clear causation implies considering the () counterfactual to assess the () net impact of an intervention by a comparison of what has occurred with the intervention implemented (the factual) with the situation without the intervention (the counterfactual)
Climate change
Climate change refers to any change in climate over time whether due to natural variability or as a result of human activity This usage differs from that in the United Nations Framework Convention on Climate Change (UNFCCC) which defines lsquoclimate changersquo as lsquoa change of climate which is attrib-uted directly or indirectly to human activity that alters the composition of the global atmosphere and which is in addition to natural climate variability observed over comparable time periodsrsquo
Counterfactual The situation that would have happened if the intervention had not taken place (lsquowithoutrsquo situation) As the counterfactual is not directly observable the unobservable potential outcome of the counter-factual situation is estimated via the situation of an equivalent control comparison group that is not affected by the intervention This is done using () randomised controlled trials (RCT) or () quasi-experimental designs
Evaluability Extent to which an activity or a programme can be evaluated in a reliable and credible fashion
Experimental design
A study in which individuals (or groups of individuals) are randomly allocated (by chance alone) to an intervention group (treatment) or a control group (not being part of the intervention) Experimental studies ( RCTs) seek to measure an interventionrsquos () net impact by comparing the two groupsrsquo situations before and after the intervention ( attribution)
Exposure The nature and degree to which a system is exposed to significant climatic variations
Factual The observed outcome of an intervention (lsquowithrsquo situation) ( counterfactual)
Impact 1 Positive and negative primary and secondary long-term effects produced by an intervention directly or indirectly intended or unintended ( net impact)
Impact evaluation
An evaluation that looks beyond the immediate results of an intervention project programme or policy Impact evaluations may focus (i) on higher outcomes rather than intervention outputs (ii) on longer-term results (iii) on a group of interventions within a given sector or geographical area or (iv) explicitly on the impacts produced by an intervention ie attributing impacts to an intervention ( Rigorous impact evaluation)
Monitoring A continuing function that uses systematic collection of data on specified indicators to provide management and the main stakeholders of an ongoing development intervention with indications of the extent of progress and achievement of objectives and progress in the use of allocated funds
1 For GIZ colleagues a brief explanation of how this impact definition fits into GIZrsquos results model (GIZ 2013) The results model is an ex-pression of GIZrsquos Managing for Development Results approach The results model forms the detailed basis for GIZrsquos subsequent operation-al planning and for establishing the results-based monitoring system at the start of implementation Within this model GIZ understands results as the lsquointended or unintended positive or negative changes in a situation or behaviour as the direct or indirect consequence of an interventionrsquo Results include impacts outcomes and outputs Impacts are defined as lsquothe long-term overarching development results They are usually located at the level of the development cooperation programme objectiversquo This definition largely corresponds to the one used in this document However at some points in this publication the authors use the term lsquoimpactrsquo synonymously with the term lsquooutcomersquo when applied to GIZrsquos results model Within GIZ outcomes are defined as the lsquoexpected or actually achieved direct short-term and medium-term results of a measurersquos outputsrsquo
5
Net impact Effects exclusively produced by an intervention (without effects caused by other possible external causes) effects that can be () attributed to a specific intervention by clear () causation The net impact (b-c) is the difference between what has occurred with the intervention implemented (b-a) the () factual and the situation without the intervention (c-a) the () counterfactual
after intervention
beforeintervention
netimpact
bb
cc
aagrossimpact
change with intervention
change without intervention
impa
ct in
dica
tor
time
Technically speaking the net impact is defined as fol-lows an effect caused by a treatment (intervention) is the difference between the outcome under a treat-ment (T=1) minus the alternative outcome that would have happened without the treatment (T=0)
Partial least squares analysis
A multivariate statistical approach for the estimation of causal relationships It is a variance-based non-linear (ie no assumptions regarding the value distribution of a variable required) iterative method based on a linear regression model It allows the estimation of concrete values for latent (ie non-observablemeasurable) constructs with the help of manifest (ie observablemeasurable) indi-cators
Quality (rigorous) impact evaluations
As there is (i) a mistaken belief that () rigorous impact evaluations have to use () randomised con-trolled trials (RCTs) on the one side and (ii) the fact that most rigorous impact evaluations are being carried out by economists and econometricians (not evaluators) resulting in technically competent studies but not automatically very good evaluations on the other side more and more the term lsquoqual-ityrsquo impact evaluation is used to avoid misunderstanding and to focus on quality
Quasi-experimental designs
An attempt to uncover a causal () attribution even though a random pre-selection processes is not possible A quasi-experimental design is a type of experimental design ( RCT) where a randomised control group could not be established for either ethical or practical reasons and therefore the inter-vention grouprsquos situation is compared with those of a similar group of individuals not receiving inter-vention activities (comparison group)
Randomised controlled trial (RCT)
An () experimental study in which individuals (or groups of individuals) are randomly allocated (by chance alone) to an intervention group (treatment) or a control group (not being part of the interven-tion) RCTs seek to measure an interventionrsquos () net impact by comparing the two groupsrsquo situations before and after the intervention ( attribution)
Resilience The ability of a social or ecological system to absorb disturbances while retaining the same basic structure and ways of functioning the capacity for self-organisation and the capacity to adapt to stress and change
Rigorous impact evaluation
An () impact evaluation with strong emphasis on lsquoproduced byrsquo focusing on clear causationcausal attribution by establishing the counterfactual Assessing the effects produced by an intervention the () net impact requires a comparison of what has occurred with the intervention implemented ndash ie the () factual ndash with the situation without the intervention ndash ie the () counterfactual The term lsquorigorousrsquo is added to differentiate this approach from many ndash more traditional ndash () impact evalua-tion approaches
lsquoRigorisedrsquo impact evaluation
A () rigorous impact evaluation conducted in a real-life situation where necessary conditions are not (fully) given and which is therefore conducted as rigorously as is feasible
Sensitivity Sensitivity is the degree to which a system is affected either adversely or beneficially by climate vari-ability or change The effect may be direct (eg a change in crop yield in response to a change in the mean range or variability of temperature) or indirect (eg damages caused by an increase in the fre-quency of coastal flooding due to a rise in sea level)
Vulnerability Vulnerability is the degree to which a system is susceptible to and unable to cope with adverse effects of climate change including climate variability and extremes Vulnerability is a function of the char-acter magnitude and rate of climate change and variation to which a system is exposed its sensitiv-ity and its adaptive capacity
Glossary
Impa
ct E
valu
atio
n G
uide
book
for C
limat
e Ch
ange
Ada
ptat
ion
Proj
ects
6
Executive Summary
Phot
o copy
GIZ
Gue
nay
Ulu
tunc
ok
Monitoring and evaluating impacts is usually both costly and laborious Often it is also a challenging process particularly when complex causal linkages or uncertain framework conditions are involved All of this applies to climate change adaptation (CCA) projects which present further methodological and practical challenges that complicate the assessment of concrete adaptation results However provid-ing evidence about the impact of an intervention is often indispensable when it comes to generating knowledge about what works and what doesnrsquot ini-tiating organisational learning processes monitoring the progress made or simply being accountable for the use of resources This Guidebook seeks to sup-port project managers by providing an overview of different impact evaluation methods and how they can be applied to climate change adaptation projects The application of the Guidebook is further illustrated by a case study of an adaptation project in Bangladesh
Evaluations and rigorous impact evaluations ndash Whatrsquos the difference
While many evaluation approaches claim to pro-vide some kind of indication about project impacts (eg most significant change approach participatory rapid assessment) robust evidence can only be pro-vided by sophisticated evaluation designs that com-ply with scientific standards and are based on valid empirical data Evaluations that use such sophisti-cated designs and involve the collection of a consid-erable amount of empirical data are also called rig-orous impact evaluations (RIEs) The advantage of RIEs in contrast to lsquosofterrsquo designs is that they make it possible to clearly attribute observed changes to a particular intervention or at least make it possible to quantify the contribution an intervention has made
to these changes This Guidebook provides practi-tioners in the field of CCA with a selection of such RIE designs differentiated according to the type of impact (ie micro meso or macro-level impacts) they are able to measure
Rigorous impact evaluations (RIEs) make it possible to attribute observed changes to a particular intervention or at least quantify the contribution an intervention has made to these changes
The difficulties involved in measuring the impacts of CCA projects are widely recognised by practition-ers and the adaptation community (eg Bours et al 2014) The latter acknowledges the limited evidence on global adaptation progress and the gaps in the evolving adaptation science (FordBerrang-Ford 2015) For climate change mitigation progress can be tracked with reference to the global concentration of greenhouse gases (GHGs) For climate change adap-tation though there is no such single metric This explains the need to equip practitioners with the right methods to assess adaptation results and dem-onstrate the added value of their projects
Establishing causality on different levels
According to the OECDrsquos Development Assistance Committee (DAC) impact evaluations take into account intended and unintended positive and neg-ative as well as expected and unexpected changes They are supposed to not only provide information on all possible changes that have occurred during the implementation of an intervention but also to link these observed changes to their causes There-fore the establishment of causality (causeeffect relationship) is crucial in order to understand why particular incidents occurred during and after a pro-ject or programme In particular the question lsquoWhat would have happened without the project or pro-
7
grammersquo needs to be investigated in detail At this point a so-called counterfactual assessment (ie the comparison between what actually happened and what would have happened in the absence of the intervention) must be considered Since it is impos-sible to collect data on what would have happened if the intervention had not been implemented many RIEs are based on designs that include comparison data ie on individuals in a similar situation who were not exposed to the intervention
The RIE designs presented in this Impact Evaluation Guidebook are differentiated according to the type of impact they are able to measure ie
y micro (individual) y meso (institutional) or y macro (systemic)-level impacts
The aim of the Guidebook is to address the challenge of producing more and better impact evaluations giving practitioners the necessary know-how in order to plan implement and steer an RIE It enables practitioners to identify which of the RIE designs are suitable for successfully evaluating their par-ticular project or programme and also reveals the respective potentials and limitations of the differ-ent designs when it comes to their application in the field of CCA
The benefit of implementing RIEs for CCA projects
Why are RIEs increasingly being considered as an option for evaluating a CCA project The Paris Dec-laration on Aid Effectiveness which calls for more and better impact evaluations has created a cer-tain amount of pressure and consequently a rising demand to use RIEs This also explains why more funding is becoming available and the literature is growing in this area During the research for this Guidebook one crucial step was to understand how CCA projects were evaluated in the past and how they are currently evaluated So far RIEs have rarely been undertaken for CCA projects Addition-ally respected independent evaluation departments have seldom implemented RIEs with counterfactu-als for CCA projects up to now Since there is limited evidence on global adaptation progress to date RIEs have the capacity to redress the situation and gen-erate learning This is because they are conducted according to scientific quality standards that
i ensure the correctness of measurement findings (reliability)
ii exclude as far as possible alternative causes for an observed finding (internal validity) and
iii shift findings from an observed sample to a larger population (external validity)
No lsquoone size fits allrsquo RIE design
The numerous (methodological) challenges faced by CCA projects have led to intensive discussion among experts on how to adequately monitor and evaluate them The main challenges are
1 the lack of a conceptual agreement on definitions including what actually constitutes successful adaptation and therefore
2 the non-existence of a universal indicator (unlike for mitigation)
3 changes in the climatic context during a projectrsquos lifetime and the related problem of shifting base-lines
4 uncertainty about actual climate change patterns and their effects and
5 the long-time horizon of potential climate change impacts (see 22 for more details)
Individually none of these challenges are unique to CCA they also exist in projects in other sectors Together though they represent a fundamental difficulty for practitioners in terms of monitoring and evaluating project impacts Since adaptation projects vary widely in their scope and in the sec-tors they cover there is no such thing as a lsquoone size fits allrsquo evaluation design Whether and which RIE design(s) are to be used depends on various factors such as the level (micro meso or macro) at which the project generates an impact the availability of data and the time and resources available to the project For example at the systemic (macro) level a climate policy that is still at an early stage of implementation and project activities that have so far mainly focused on consultations and capacity building exercises may not be appropriate for a counterfactual assessment Nonetheless most CCA projects follow a multi-level approach which implies that a combination of two or more evaluation approaches may be required to measure the total impact of a project or programme
The selection of evaluation designs presented in this Guidebook is based on two considerations Firstly the design needs to comply with scientific standards in order to produce robust findings Secondly the selected designs should cover a wide range of differ-ent project approaches and all possible impact levels In particular six types of designs are discussed in detail
y experimental and quasi-experimental designs y matching techniques
Executive Summ
ary
8
y pipeline approach y regression discontinuity design (RDD) y time-series designs and y structural equation modelling (SEM)
Which evaluation design to choose ndash creating evidence at the individual level
At the individual level if a baseline is available (ex-ante and ex-post data from both the treatment and control group) three evaluation designs can be con-sidered for evaluating the CCA project an experi-mental quasi-experimental or regression disconti-nuity design
In an experimental design also known as a ran-domised controlled trial (RCT) a treatment and control group are compared with each other at two points in time ndash before and after the intervention ndash in order to estimate the counterfactual (what would have happened in the absence of the intervention) To be classified as an lsquoexperimentalrsquo design the ben-eficiaries need to be randomly selected during the planning phase of a project ie each person has the same chance of being a member of either the control or the treatment group If a random selection cannot be realised (eg due to self-selection bias or conscious selection) then such a design is called quasi-experi-mental In that case the group without treatment is called a lsquocomparison grouprsquo This means that some kind of matching technique needs to be applied dur-ing data analysis in order to control for selection bias
Thus both experimental and quasi-experimental designs are applicable to CCA projects as long as pro-ject activities aim at creating a direct impact at indi-vidual (micro) level The use of an experimental or quasi-experimental design calls for technical logis-tical and financial resources that mainly depend on the size and accessibility of the target group The data
selection process is often quite costly since a large team of enumerators is required Moreover there are two potential biases that may emerge and ham-per the process of attributing the observed change to project activities spill-over and contagion effects The former implies that the controlcomparison group indirectly receives a benefit from the project or programme and the latter occurs when differ-ent factors (eg projects operated by different agen-cies) affect the situation of the target population Nonetheless in terms of study design RCTs show the highest internal validity 2 and enable the clear attribution of interventions to impacts (the latter is also true of the quasi-experimental and pipeline approach) Regression discontinuity design (RDD) is a quasi-experimental evaluation method that can be applied if beneficiaries of the project are selected based on a special characteristic (eg income) of rel-evance to the desired impact that distinguishes them from the non-beneficiaries At the same time ben-eficiaries are compared with the comparison group in a number of other respects (eg location) Being a quasi-experimental design RDD does not require randomisation
If no baseline data have been collected beforehand two further evaluation designs can be considered at the individual level the pipeline approach and the panel design
The application of a pipeline approach is possible if a project is implemented sequentially (eg in dif-ferent regions) Thereby the selection of the target population that is not yet affected can serve as a quasi-comparison group for the group that is already affected It is important though that the treated groups of each phase are comparable Each data col-lection phase is just as labour-intensive and time-consuming as a quasi-experimental approach Panel designs a type of time-series design are in principle applicable for measuring impacts on all levels but require comparably larger sample sizes in order to be able to perform the necessary statistical calculations The special characteristic that differentiates the panel design from all the others mentioned above is that it requires data to be collected from identical units (eg persons households) at each point in time This makes it prone to attrition effects (ie decreasing sample sizes) over time It should also be mentioned that a panel design only makes it possible to estimate the contribution made by an intervention to observed changes but not to attribute these changes unambiguously
2 Internal validity is defined as the extent to which the variation of a dependent variable can be explained by the variation of a specific independent variable ie the extent to which alternative explana-tions for the variation of the dependent variable can be excluded
Impa
ct E
valu
atio
n G
uide
book
for C
limat
e Ch
ange
Ada
ptat
ion
Proj
ects
Phot
o copy
GIZ
Ste
inbe
rg
9
Creating evidence at institutional and system level
If an intervention aims to generate an impact at the institutional and system levels two further evalua-tion designs can be taken into account time-series designs and structural equation modelling
Time-series designs can be of particular use when it is necessary to cover longer periods than those set by a project or programme This makes them highly suitable for CCA projects where changes or results may unfold at later stages If data were collected repeatedly over a longer time period during the pro-ject time-series designs might be the best option It should be borne in mind though that these designs require a large number of repeated observations (at least about 10) in order to be able to perform the necessary statistical analyses for providing robust findings Finally if none of the designs fit structural equation modelling (SEM) could be an option for providing meaningful evidence about the impact of a project or programme It may be applied to meas-ure large-scale policy-based programmes that aim to affect an entire sector country or region SEM makes it possible to measure the statistical relation-ship between several influencing factors (eg public investments project funding disaster resilience of a population) This can be used to estimate the contri-bution of each of these factors one of which may be an intervention It should be pointed out that SEM and time-series designs only serve to estimate the contribution made by an intervention to observed changes
Conclusion and reading recommendation
The overview of available evaluation designs shows that there are several options for measuring impacts each with different potentials and limitations as well as methodological and data requirements This Impact Evaluation Guidebook provides practitioners with guidance on selecting the appropriate approach for a particular CCA project based on its characteris-tics and the available resources It also contains refer-ences to
y definitions and conclusions (blue framed boxes) y CCA project characteristics (green framed boxes) y practical tools and instruments (purple framed
boxes) y further reading material (orange framed boxes)
and y checklists summarising key issues (red framed
boxes)
Depending on the readerrsquos objective the different sections of the Guidebook may be of more or less interest However in order to obtain a comprehen-sive understanding of the subject matter we strongly recommended that you go through the lsquomust readsrsquo Section 12 which provides practical guidance for the planning and implementation of an RIE the summary at the end of Section 3 that contains an overview of the pros and cons of the different evalu-ation designs and leads you through the process of deciding which design to choose and Section 32 that focuses on the requirements for collecting large-scale quantitative data Once a particular evaluation design has been chosen the reader may consult the respective section that describes the chosen design in more detail (Sections 311 to 316) and as the case may be the further explanations in the annex If any of the technical terms or concepts are unclear the reader can consult the glossary MampE specialists who are not so familiar with the characteristics of CCA projects are advised to consult Section 2 in particu-lar Section 21 which discusses the key challenges of CCA projects with regard to their evaluation Finally the case study of an adaptation project in Bangladesh illustrates the application of this Guidebook
Phot
o copy
GIZ
Ran
ak M
artin
Executive Summ
ary
Impa
ct E
valu
atio
n G
uide
book
for C
limat
e Ch
ange
Ada
ptat
ion
Proj
ects
10
Are you planning to provide meaningful evidence of the impact of your climate change adaptation (CCA) project based on a sound empirical foundation Do you want to find out what difference it makes what changes can be observed in the field of inter-vention and how these changes are related to the project activities Or do you aim to gain knowledge about the inherent cause-and-effect relationships of a project learn from the past for the future fur-ther develop the project design or be accountable for the use of funds The decision about how to evalu-ate a project depends on a number of aspects such as the objectives of the evaluation its target groups and stakeholders or the available financial tech-nical human and time resources So the question lsquohowrsquo is closely related to several further aspects eg which design to implement which data collection instruments to apply or which analytical methods to choose
In this Guidebook we assume that you have decided to implement a rigorous impact evaluation (RIE) As the name says the focus of an RIE lies on the measurement and assessment of the impacts of a programme or project According to the OECDDAC evaluation criteria impact means any positive and negative primary and secondary long-term effect produced by an intervention directly or indirectly intended or unintended (OECDDAC 2006 6) Thus basically any observable change occurring in ndash and potentially beyond ndash a field of intervention presum-ably related to the evaluated programme or project may be subject to an RIE Another main characteris-tic of an RIE is that it aims to clearly attribute these observable changes to the intervention being exam-ined or at least to provide sufficient evidence to esti-mate the contribution the intervention has made to these changes Finally the term lsquorigorousrsquo implies that the measurement and attribution or contri-bution analysis is conducted in line with scientific quality standards This means that the findings of an RIE must meet the methodological demands that
apply to scientific research projects (ie that they should be reliable internally and externally valid and objective 3 These requirements ndash the rigorous measurement of impacts and attributioncontribu-tion analysis ndash determine the options for choosing a specific design or specific instruments and methods
As in every scientific research project the selection of the design further depends on the characteristics of the research subject With regard to impact evalu-ation the main characteristic to be considered is lsquowhat kind of impactrsquo needs to be evaluated While impact can be differentiated according to various category schemes (eg social political environmen-tal impacts) the most decisive aspect in terms of evaluation design is the lsquoaggregation levelrsquo at which it occurs This applies to climate change adaptation just as to any other field of intervention A distinction is usually made between three aggregation levels
y Individual (micro-level) impacts ie benefits or drawbacks for particular target groups (eg improving the resilience of a population to cli-mate change effects)
y Institutional (meso-level) impacts ie chang-ing the resources capacities performance etc of organisations such as enterprises governmental or non-governmental institutions (eg strength-ening the capacities of local authorities to deal with the socio-economic consequences of cli-mate change)
y Systemic (macro-level) impacts ie sectoral or regional developments (eg increasing the efforts of a government to reduce climate change-related causes of poverty or ill health)
The different accessibility of data at these levels implies that there is no lsquoone size fits allrsquo design For example while comparative analysis such as is applied in a quasi-experimental design (cf Sec-tion 311) may be suitable for measuring and assess-ing the livelihoods of climate migrants in a specified intervention area the influence on the capacities of basic urban service providers may call for the use of a structural equation modelling approach (cf Section 316) In the latter case there are many competing influences which makes it impossible to establish a comparison group (see Section 4 for an in-depth
3 Reliability internal and external validity and objectivity are count-ed among the most essential scientific quality criteria In empirical studies reliability indicates the correctness of measurement findings Internal validity means that the study design excludes alternative causes for an observed effect as far as possible while external validity means that the findings are in principle transfer-able from an observed sample to a greater population ie can be generalised Finally objectivity describes the independence of the measurement findings from their framework conditions (ie who collects the data who analyses them and under which conditions the findings are interpreted)
1 Introduction
11
discussion of this example) Given the complexity of climate change adaptation needs many CCA projects follow a multi-level approach Thus in an evalua-tion it may be necessary to combine several designs in order to assess the total effectiveness of such a project The Guidebook therefore aims to provide an operationally viable framework for evaluating CCA projects
According to this objective the structure of the Guidebook reflects the points to be considered when planning an RIE starting with a general overview of how to plan such an exercise (Section 12) This is fol-lowed by a discussion of the types and key features of CCA projects the typical challenges in the field of CCA and the way they are currently evaluated (Section 2) Section 3 presents the different options for rigorously evaluating CCA projects including references to the CCA-specific requirements and challenges outlined above The methodological pre-requisites for generating reliable empirical data on a large scale are also discussed Finally two exemplary evaluation designs are outlined on the basis of a GIZ case study (Section 4) including a brief presentation of their practical implementation The Guidebook closes with an annex containing further introduc-tions to some methodological aspects that need to be considered when designing an RIE a glossary of technical terms and further literature references
11 How to use the Guidebook
As the Guidebook aims to provide lsquohands-onrsquo infor-mation it contains a number of hints definitions practical examples links to further reading material and checklists which are highlighted as follows
Definitions and conclusions are presented in blue boxes followed by an exclamation mark
References to CCA projects are presented in green text boxes marked with a magnifying glass
Practical tools and exemplary instruments are presented in purple boxes flanked by two cogwheels
References and links to further reading material are presented in orange boxes highlighted with an open book
Checklists summarising key practical issues and recommendations for providing high- quality evaluation findings are presented in red boxes marked with a tick
Depending on the readerrsquos objective the different sections of the Guidebook may be of more or less interest However in order to obtain a comprehen-sive understanding of the subject matter we strongly recommend you to go through the lsquomust readsrsquo Section 12 which provides practical guidance for the planning and implementation of an RIE the summary at the end of Section 3 that contains an overview of the pros and cons of the different evalu-ation designs and leads you through the process of deciding which design to choose and Section 32 that focuses on the requirements for collecting large-scale quantitative data Once a particular evaluation design has been chosen the reader may consult the respective section that describes the chosen design in more detail (Sections 311 to 316) Some methodo-logical concepts discussed in these sections require some more methodological background and are therefore further explained in Annexes 52 to 56 If any of the technical terms or concepts are unclear the reader can consult the glossary MampE or evalua-tion specialists who are not so familiar with the char-acteristics of CCA projects are advised to consult Sec-tion 2 in particular Section 21 which discusses the key challenges of CCA projects with regard to their evaluation Finally the case study of an adaptation project in Bangladesh illustrates the application of this Guidebook
12 How to plan and implement an RIE for CCA projects
Letrsquos say you have decided to rigorously evaluate a CCA project How can this be done
First of all when planning such an endeavour you must realise that on the one hand an RIE needs to comply with scientific standards in order to produce valid and reliable empirical evidence of the impact of an intervention On the other hand you may face a number of obstacles such as time data and budget constraints (cf Bamberger 2004) which often make it difficult to adhere to such standards Planning any evaluation is therefore always a balancing act between fulfilling methodological demands as far as possible and keeping the evaluation feasible in practical terms To find the right lsquomiddle coursersquo it makes sense to begin the planning of an evaluation by answering a set of questions that determine its general framework
1 Introduction
Impa
ct E
valu
atio
n G
uide
book
for C
limat
e Ch
ange
Ada
ptat
ion
Proj
ects
12
Questions for determining the evaluation framework
` What is the object of the evaluation What is the scope of the evaluation in terms of observed period regions activities etc
` What are the objectives of the evaluation and which criteria will it use to assess the object of the evalua-tion
` Who are the recipients and who are the stakeholders of the evaluation ` What is the time frame of the evaluation When are the evaluation findings needed by ` Which human financial and organisational resources are available for the evaluation ` Who will implement the evaluation What qualifications and experience do the responsible persons have ` How will the evaluation be implemented What is the intended evaluation design Is it feasible with the
available resources ` Which data collection instruments and analysis methods will be applied Are the people in charge of data
collection and analysis familiar with these instruments and methods ` What tasks need to be performed during the evaluation and who will be in charge
As all of these aspects are interrelated it is crucial to answer these questions before actually start-ing to implement the evaluation For instance the scope and objectives depend on the stakeholders and recipients of an evaluation The design which determines the choice of instruments and meth-ods again depends on the available resources and qualifications and so on In view of these manifold interdependencies it makes a lot of sense to clarify document and communicate these issues among all involved stakeholders right from the outset Usu-ally when external consultants are commissioned to carry out an evaluation this is what should be out-lined in the terms of reference and agreed upon in the inception report if not before
When it comes to evaluating CCA projects some of these questions might be more difficult to answer than in other evaluations for instance the second question on the evaluation criteria Due to the lack of consensus about successful CCA (cf Section 22) it needs to be clarified right from the start what is understood by that concept in the specific context of
the project ideally in line with the project objectives Another important aspect which is not unique to the field of CCA however is the question of the sectoral expertise needed by the evaluation team Given the complexity of climate change-related issues a thor-ough understanding of the projectrsquos theory of change is a crucial prerequisite not only for data collection and analysis but also for integrating the findings into a larger (environmentaldevelopment-policy) framework particularly with regard to the projectrsquos contribution to overarching development goals (eg MDGs SDGs country development goals) Therefore it might be recommended to include a sector expert in the evaluation team who provides technical advice on assessing and interpreting the evaluation findings Finally to decide which evaluation design to choose the project characteristics need to be con-sidered (such as the uncertainty of the framework conditions in which it operates or the time frame within which its impacts can be observed) Section 3 of this Guidebook therefore provides several sugges-tions that take these and further characteristics into account
Phot
o copy
GIZ
Flo
rian
Kopp
13
Once these questions have been answered the first step of any evaluation is to develop a data collection plan (also called an evaluation matrix) structured according to the previously defined evaluation cri-teria A data collection plan is the reference docu-ment that guides the evaluation from instrument development to data analysis It provides a tabular
overview of the evaluation questions and hypotheses to be answeredtested the required indicators data sources and availability data collection instruments sampling procedures timing of the data collection data analysis methods responsibilities and required resources The following table gives an example of how such a data collection plan is usually structured
Table 1 Exemplary data collection plan
Analysis dimension
Hypothesis to be testedQuestion to be answered
Indicator Data source
Sample Data type Data collection instrument
Timing of data collection
Data analysis method
Respon-sible
Required resources
Direct outcomes
The livelihoods of climate migrants have improved
Proportion of climate migrants who have a job
Target group (climate migrants)
5 random sample of treat-ment and comparison group
Quantita-tive
Question-naire
Start of project end of project 3 years after end of project
t-test for inde-pendent samples
Evaluator no 1
1 working day (wd) for development of question-naire 2 wds for pre-testing 3 wds for implementing survey X euro for technical implementation
Income of respondent
Proportion of climate migrants who live in formal set-tlements
hellip hellip hellip hellip hellip hellip hellip hellip hellip
Working opportunities have been generated
No of working opportuni-ties
City corpo-rations
na Quantita-tive
Official statistics
Continuous monitoring
Time series analysis
Project officer
na
Types of working opportuni-ties
2 repre-sentatives of each involved city corpo-ration
Qualitative Interview with corporation representa-tives
Start of project then each 6 months update
Qualitative summary
Evaluator no 2
3 wds for conduct-ing interviews in each intervention area
Use of working oppor-tunities by target group
Target group
5 random sample of treatment group
Quantita-tive
Question-naire
End of project
Descriptive statistical analysis
Evaluator no 1
See above
Reasons for acceptance or non-acceptance of working opportuni-ties
Target group
3 groups of 6 to 10 persons in each interven-tion area
Qualitative Focus group discussion
End of project
Qualita-tive data analysis
Evaluator no 2
1 wd for conduct-ing FGD in each intervention area
hellip hellip hellip hellip hellip hellip hellip hellip
Access to health services has been improved
hellip hellip hellip hellip hellip hellip hellip hellip
hellip hellip hellip hellip hellip hellip hellip hellip hellip
hellip hellip hellip hellip hellip hellip hellip hellip hellip
Besides the construction of the indicators another important issue during the development of a data collection plan is the identification of the data sources If data is already available the question of whether they are sufficient for answering an evalu-ation question or whether additional data need to be gathered must be resolved If the available data are insufficient it needs to be decided which further data sources can be tapped and which instruments are applicable There are a number of factors to be
taken into account when deciding for or against a certain instrument including the costs incurred and the human resources and time required to complete the data collection For this it is necessary to draw up a plan of staff time and a finance which also shows who will be carrying out the respective tasks at what times and what costs will be involved The following flow chart summarises the typical sequence of an evaluation
1 Introduction
Impa
ct E
valu
atio
n G
uide
book
for C
limat
e Ch
ange
Ada
ptat
ion
Proj
ects
14
Figure 1 Flow chart for implementing an RIE
Clarication of objectives stakeholders and recipient(s) of the evaluation
Development of a data collection plan Formulation of evaluation questions
and hypotheses Development of indicators Identication of necessary data
sources
Development of survey design and data collection instruments
Data collection and quality check
Data complete
Data aggregation and analysis
Reporting Interpretation of ndings Development of conclusions
and recommendations
Data available
Yes
No
Yes
No
stakeholders need to be clarified A good starting point for considerations of this nature is provided by the feasibility standards established by the American Evaluation Association (AEA) which are intended to ensure lsquothat an evaluation is planned and conducted in a realistic prudent diplomatic and frugal wayrsquo 4
4 Cf httpwwwevalorgpcmldfid=103
During any evaluation a number of precautions need to be taken to ensure that the evaluation find-ings are not only valid and reliable but also well-understood and widely accepted Therefore all involved stakeholders should be informed that an evaluation is being conducted and why Further-more the roles and responsibilities of the different
Feasibility standards of the American Evaluation Association (AEA)
` F2 ndash Practical Procedures Evaluation procedures should be practical and responsive to the way the pro-gram operates Refers to the problem of the feasibility of scientifically ideal collection procedures with regard to the costs they incur and to ethical implications
` F3 ndash Contextual Viability Evaluations should recognize monitor and balance the cultural and political interests and needs of individuals and groups Points out the significance of taking into account the interests of all the stakeholders in a balanced way This is important since the use of the evaluation findings depends to a high degree on acceptance by the various stakeholders and because access to the relevant information often depends on peoplersquos willingness to cooperate
` F3 ndash Resource Use Evaluations should use resources effectively and efficiently Points to the necessity of taking into account the cost-benefit ratio in the implementation of evalua-tions In calculating the costs it is important to consider not only the consumption of tangible (financial) resources but also the intangible outlay (eg the use of time and deployment of human resources) though this can mostly be converted back into financial costs More difficult by far is the quantification of the ben-efit since it is not possible to provide any specific information about the expected findings in advance
15
When evaluating CCA projects it is especially impor-tant to consider the question of contextual viability as interventions may not always generate directly tangible benefits for the target groups All the more important then is to highlight the long-term objec-tives of a project when approaching the target groups for data collection Furthermore due to the usually large number of different stakeholder groups in CCA projects it may be necessary to start by iden-tifying the different needs capacities objectives and strategies of the different groups as well as their interrelations before collecting data For instance when a project focuses on adaptation to diminish-ing natural resources it is necessary to include not only the project beneficiaries but all groups who in principle depend on these resources or have a right to use them Ignoring the often complex actor con-stellations could lead not only to considerably biased evaluation findings (eg overestimation of impact) but also to the refusal of stakeholders to provide important information
Besides these formal aspects a number of further organisational issues need to be taken into account during the evaluation process such as the confi-dentiality of data Given the need to maintain the anonymity of those who provide the information certain rules must be adhered to when providing feedback on the evaluation findings Apart from the fact that there is a moral obligation to the lsquoinform-antsrsquo (ie interviewees participants in written sur-veys etc) not to abuse their willingness to cooperate a number of statutory provisions also exist
Regardless of how well an evaluation is planned and organised unforeseeable events can have nega-tive effects on its scheduling and findings The most common obstacles that must be anticipated when conducting the evaluation include the refusal of the informants to cooperate (refusal to be interviewed etc) and the occurrence of negative unintended effects in data collection (eg a rapidly deteriorat-ing work climate due to the respondents not having been given sufficient information about the evalu-ation) It is advisable in all cases to seek an oppor-tunity to talk to those concerned and if appropriate to arrange a meeting at which everyone is given the opportunity to present their point of view and work together to find solutions for instance through alter-native survey instruments or questionnaires In this situation it is of key importance that the evaluators are able to give a credible impression of their inde-pendence and neutrality
A potentially controversial question is whether or not recommendations should be included in the report and if so how they should be presented If it is decided when clarifying the assignment that recom-mendations will be made it is necessary to point out that they are intended as aids to orientation In other words it must be made clear what the evaluation can achieve and what it cannot in order to avoid unrea-sonable expectations This is even more true of the evaluation of CCA projects as due to the uncertainty of future climate developments a recommendation given at one point in time can prove to be wrong a few years later Therefore it is even more important to develop such recommendations together with the stakeholders and probably further climate experts in a participatory manner eg in the context of a work-shop Furthermore it may also be necessary to clarify the spatial and temporal validity of these recommen-dations and the assumptions under which they were made as regards the development of the framework conditions In any case it is necessary to differentiate between the evaluation findings and the conclusions and recommendations drawn from them
We recommend the following books and articles for further reading about practical evaluation requirements
Bamberger M Rugh J Church M Fort L Shoestring Evaluation Designing Impact Evaluations under Budget Time and Data Constraints American Journal of Evaluation 25(1) 2004 pp 5 ndash 37
Silvestrini S Organizational Aspects of Evalu-ations in Stockmann R (ed) A Practitioner Handbook on Evaluation Edward Elgar Cheltenham 2010
Stockmann R (ed) A Practitioner Handbook on Evaluation Edward Elgar Cheltenham 2010
1 Introduction
Impa
ct E
valu
atio
n G
uide
book
for C
limat
e Ch
ange
Ada
ptat
ion
Proj
ects
16
Phot
o copy
GIZ
Guy
2 Evaluating climate change adaptation projects
The first section of this chapter (21) provides an overview of the types and key features of CCA pro-ject interventions with regard to each level (micro meso macro) The second section (22) describes the challenges when it comes to evaluating CCA projects given their complexity Finally the third section (23) summarises currently used designs and data collec-tion methods to evaluate the results of CCA projects and shows their main shortcomings with regard to the quality of the evaluation findings
21 Types and key features of climate change adaptation projects
While most CCA projects follow a multi-level approach specific interventions (measures activi-ties) of such projects usually focus on a singular impact level be it on a particular target group such as climate migrants (individual level) local authori-ties (institutional level) or the legal and policy frame-work (system level) It is also important to under-stand that all three impact levels are interconnected For instance legal or policy changes (system level)
will necessarily have effects on the institutional level (eg local authorities companies) and the individual level (eg residents of a country or region) The indi-vidual benefits perceived by a specific target group (eg households in an intervention area) may even-tually be scaled up to the institutional and system level (eg through spill-over or other dissemination effects) The reason why it is important to make this distinction though is that the choice of the appro-priate evaluation design depends on the targeted impact level
211 Adaptation projects addressing the individual level
A particular type of adaptation intervention pri-marily affecting the individual level is the so-called community-based adaptation (CBA) approach which is often facilitated by a local organisation and can be implemented like a small-scale development project The primary objective of such an interven-tion is to improve the capacity of local communities to adapt to climate change applying an integrated approach that often combines traditional knowl-edge with innovative strategies Capacity building and awareness-raising are essential elements of such interventions In fact UNDP has found that com-munities and even policy-makers in target countries have limited knowledge of climate change issues especially of adaptation (UNDP 2009) Thus in order to be able to participate effectively locals must be supported to develop a good understanding of these issues which is why a lot of investments are being made in capacity building However working with communities can be a process that requires consider-able time financial resources and energy But it pays off because community engagement generates own-ership (at best) and enables empowerment giving communities a voice and the chance to participate Although CBA projects are situated at local level development cooperation aims to promote action at all levels to achieve systemic and sustainable change Relevant sectors for adaptation include rural devel-
17
Phot
o copy
GIZ
And
reas
K
opment agriculture water resources management coastal management disaster risk management and public health Typical practices address adjust-ments in the behaviour of individual groups as well as in the use and development of technologies (eg construction of large reservoirs adjustments to tra-ditional farming practices and risk reduction for the rural population)
The Community-Based Wetland Management Project (BIRAM) (UNDP 2015a) implemented by Boudhi Investigate and Research Assembly of Men supported by UNDP with funding from the Least Developed Country Fund the Government of Bang-ladesh and the UK Department for International Development is an example of a project that focuses on the micro level in five villages in Bangladesh (community level) The indigenous peoples living in the project areas are confronted with declining rain-fall rising temperatures and decreased water levels due to climate change A nearby stream is the main source of irrigation and fish farming Climate change forecasts predict that temperatures will continue to rise generating aridity in the target regions which will have negative consequences on ecosystems and livelihoods The project focuses on promoting sus-tainable crop varieties improved agricultural prac-tices and improved water collection Moreover it will train community members in alternative income-generating activities to reduce pressure on natural resources and diversify income sources 5
The Sustainable Agricultural Programme (PROAGRO I amp II) (GIZ 2015a) ndash a trilateral cooperation arrange-ment between Bolivia Germany and Sweden ndash is an example of a project that focuses on the individual level Its objectives are the following (1) to increase the resilience of smallholders in arid and semi-arid regions of Bolivia to climate change risks (2) to conserve and distribute scarce water resources as part of integrated watershed management and (3) to increase income from agricultural production A fourth component ndash ie adaptation to climate change ndash was integrated into PROAGRO II implemented by GIZ on behalf of BMZ A vulnerability assessment was conducted in 2013 following the approach of GIZrsquos lsquoVulnerability Sourcebookrsquo (Cordero 2014) The main climate risk is water scar-city which will probably increase in future and will have a negative impact on agricultural production The findings of the vulnerability assessment show that PROAGRO reduced the vulnerability of small-holder farmers by adjusting crop types and sowing dates and replacing old irrigation technologies with
5 More UNDP community-based adaptation projects can be found under the following link httpwwwundp-almorgprojectsspa-community-based-adaptation-project
more appropriate ones which enhanced water effi-ciency in the parcels (id) A mid-term evaluation was also conducted in 2013 using a mainly qualitative evaluation design (analysis of primary and secondary data semi-structured interviews and surveys with national counterparts strategic partners and target groups direct observation focus group discussions) (Kronik 2013)
212 Adaptation projects addressing the institutional level
Effective institutions are a major factor when it comes to the ability to respond to growing climate risks since they are designed to perform a set of functions related to decision-making and imple-mentation (Dixit et al 2011) They play a critical role in increasing societyrsquos capacity to adjust as condi-tions shift and as new climate change knowledge appears In a constantly changing climate the pro-cess of institutional change represents an impor-tant aspect of building adaptive capacities ie the ability of a national government and other entities and individuals to design and implement effective adaptation strategies or to react to negative climate stresses (Dixit et al 2011) Since national policy-makers international negotiators and funders assist in developing methods and guidelines for adapta-tion planning it is essential that they include a focus on building institutional capacity to adapt to cli-mate change impacts One of several ways in which climate-related challenges may require institutions to make significant adjustments involves meeting the needs of the most vulnerable people who tend to be poor or marginalised They usually have few resources with which to adapt and little say in public decision-making processes
Various CCA projects comprise interventions that aim at making an impact at institutional level One example is the National Adaptive Capacity (NAC) framework launched by the World Resources Insti-tute which assists governmental agencies in includ-
2 Evaluating clim
ate change adaptation projects
Impa
ct E
valu
atio
n G
uide
book
for C
limat
e Ch
ange
Ada
ptat
ion
Proj
ects
18
ing institutional capacity development in their adaptation planning processes It enables its users to systematically assess institutional strengths and weaknesses that may help or hinder adapta-tion National adaptation plans may then be better designed to make best use of strengths or remedy weaknesses (Dixit et al 2011) Another example is the Public Investment and Climate Change Adapta-tion (IPACC) project (GIZ 2015b) conducted by GIZ on behalf of BMUB in Peru The aim of the project is to raise awareness ndash among national and regional policy-makers and relevant technicians ndash of the potential environmental social and economic costs of climate change and to encourage decision-makers to consider climate-relevant criteria when formulat-ing and approving public investments Hence meth-ods were designed to integrate disaster risk man-agement and CCA considerations into a countryrsquos national investment planning to increase the adap-tive capacity and reduce climate-related risks (GIZ 2012) Next to initiatives in the policy field there are also CCA projects carried out by non-governmental organisations The DANIDA-funded project Capac-ity Strengthening in Least Developed Countries (LDCs) for Adaptation to Climate Change (CLACC) (IIED 2015) which is operated under the auspices of the International Institute for Environment and Development (IIED) strives to strengthen the capac-ity of civil society organisations in LDCs to adapt to climate change and foster adaptive capacity among the most vulnerable people This implies integrating adaptation to climate change into the work of NGOs and simultaneously setting up a system to share knowledge and experience among the adaptation community In this context IIED helped to establish the International Centre for Climate Change and Development (ICCCAD) in Bangladesh which pro-vides training on CCA and development for NGOs donors media government staff and the private sec-tor
213 Adaptation projects addressing the systemic level
CCA projects aiming to generate system-wide impacts often follow a top-down approach and com-prise interventions at global regional or national level Such interventions target policy changes (eg sectordevelopment strategies) changes in public opinion on a particular topic (eg climate change adaptation requirements) or changes in economic framework conditions (eg introduction of climate
change- adapted value chains 6) With regard to CCA projects two potential intervention types fall under this category country level and global or regional initiatives At the country level CCA projects provide policy advice to support the elaboration of national climate change strategies and action plans or to cre-ate awareness and facilitate consultation among (government) stakeholders The aim is to give con-sideration to climate change risks in laws planning policies and negotiations Such interventions also support the design of targeted policy strategies eg to climate-proof 7 the agricultural sector and intro-duce new crops cropping methods or efficient irri-gation technologies
An example of a CCA project that comprises such interventions at the federal level is the Climate Sup-port Programme (CSP) (GIZ 2015c) launched by GIZ on behalf of BMUB in South Africa in 2009 The projectrsquos aim is to assist the Department of Envi-ronmental Affairs (DEA) in reducing South Africarsquos carbon footprint mitigating climate change impacts and strengthening the countryrsquos resilience to climate change (GIZ 2013) The project supported the devel-opment and implementation of the Governmentrsquos white paper on the national climate policy 8 by pro-viding expertise contributing also to consensus-building among important stakeholders Section 12 of the white paper clearly mandates the develop-ment of an adaptation MampE system Moreover sector departments have started the process of reviewing their policies to align them with the white paper Additionally together with the BMZ-funded project lsquoEffective adaptation finance (MampE Adapt)rsquo GIZ is supporting the development and implementation of a monitoring and evaluation (MampE) system for adap-tation
6 See for instance the project lsquoPromoting a Value Chain Approach to Climate Change Adaptation in Agriculture in Ghanarsquo which aims to help reduce climate-induced risks and thereby contrib-ute to the achievement of food security and income-generating objectives for rural communities by focusing on the improvement and adaptation of the cassava value chain wwwthegeforggefsitesthegeforgfilesgef_prj_docsGEFProjectDocumentsCli-mate20ChangeGhana20-202843682920-20Promot-ing20Value20Chain20Approach20to20Adaptation20in20Ag1-17-20122020ID436820202020Ghana20SCCF20Full20Project20Document20for20Re-submis-sion2020Jan20201220cleanpdf
7 lsquoClimate-proofingrsquo is a methodological approach applied by GIZ that integrates climate change aspects into development plan-ning The reason for climate-proofing projects or programmes is the following even if GHG emissions are drastically re-duced climatic changes will still occur which will be fatal for some pop-ulations and ecosystems and will have negative con-sequences on the countryrsquos economy These climatic changes will gradually become more visible Consequently when de-signing a project it is of the utmost importance to consider climate change aspects especially if the project is supposed to run for a longer period of time (Hahn M 20102-6)
8 See White Paper of the National Climate Change Response Policy (published in 2011) httpravaqsensnetthemestheme_emissions111012nccr-whitepaperpdf
19
CCA projects with a global dimension include vari-ous international players who work together to achieve a common goal They mainly focus on con-ceptual work capacity building and knowledge exchange The institutions involved are responsible for the development of methods and tools for novel topics such as national adaptation plans (NAPs) and also for piloting these tools and methods in partner countries thereby cooperating with existing pro-jects within these countries In a best-case scenario the results and experiences of the CCA projects are shared with the CCA community to enable an exchange of knowledge and good practices through webinars workshops or online platforms 9 One example is the National Adaptation Plan Global Support Programme (NAP-GSP) (UNDP 2015b) for Least Developed Countries which is a UNDP-UNEP programme financed by the Least Developed Coun-try Fund (LDCF) and the Special Climate Change Fund managed by the Global Environment Facility (GEF) It helps LDCs 10 and developing economies to advance with their NAP 11 process through technical assistance provides tools and training to support the NAP process within the country and facilitates an exchange of lessons and knowledge through South-South and North-South cooperation The formula-tion and implementation of NAPs helps to identify the medium- and long-term adaptation needs of a technical institutional and financial nature and simultaneously develop and implement strategies and programmes to address these needs 12
22 Key challenges of climate change adaptation projects
CCA projects (including those with a partial focus on adaptation) pose specific methodological chal-lenges 13 which need to be taken into account throughout the whole project cycle These chal-
9 Examples of online platforms of this kind are wwwadaptation-communitynet wwwundp-almorg wwwadaptationlearning-mechanismcom wwwclimate-evalorg and wwwmediation-pro-jecteuplatform Europe-wide wwwclimate-adapteeaeuropaeu
10 26 LDCs have requested help with their NAP process11 The NAP process was initiated under the Cancun Adaptation
Framework (CAF)12 This paragraph is based on the information obtained on the
homepage (wwwundp-almorg)13 It must be mentioned however that the methodological chal-
lenges described below are by no means unique to CCA projects For instance most SWAPs have long time horizons (eg when re-forming a TVET system it may take several decades for benefits to become visible) uncertainty and shifting baselines are a problem in most fragile contexts and universal indicators (except maybe for education and economic development) are still lacking in most fields of intervention
lenges make it necessary to fine-tune development agenciesrsquo current MampE frameworks especially with regard to the development of indicators baselines milestones targets and the timing of MampE activities which need to be adjusted to the longer time horizon of the majority of adaptation initiatives These chal-lenges are outlined below
First of all the remaining ambiguity of the concepts used may impede the development of appropriate verifiable and measurable indicators There is no clear and commonly accepted definition of adapta-tion adaptive capacity and climate-resilient liveli-hoods which makes it difficult to define objective indicators There is also a lack of consensus about what actually constitutes successful adaptation Consequently there are no universal indicators for CCA projects since they depend not only on the individual project but also on the context scale sec-tor and location Unlike mitigation for which the amount of GHG emissions in the atmosphere serves as a universal MampE indicator the success of an adap-tation intervention cannot be measured by a single indicator Qualitative assessments are as important as quantitative ones since many aspects of adapta-tion are lsquosoftrsquo (eg institutional capacity behaviour change etc)
The establishment of a baseline is considered another major challenge for evaluating climate change adaptation projects A baseline is crucial to measure the projectrsquos impact as it provides a refer-ence point against which a change can actually be measured In climate change adaptation projects future climate change effects also need to be taken into account (ie a baseline projection of how the climate is going to evolve during the project term and beyond) Since climate change is most likely to unfold differently than assumed in the projection experts speak of a lsquoshifted baselinersquo Shifting baselines are considered to be problematic in terms of plan-ning since they change the context of the adaptation intervention
Thus uncertainty about actual climate change pat-terns and their effects is another aspect that needs to be addressed It may be impossible to anticipate when for example the next flood will occur in order to analyse to what extent adaptation took place in situ compared to the situation before the interven-tion Moreover adaptation strategies marked as suc-cessful in the short term may have negative impacts on vulnerability in the long term
2 Evaluating clim
ate change adaptation projects
Impa
ct E
valu
atio
n G
uide
book
for C
limat
e Ch
ange
Ada
ptat
ion
Proj
ects
20
Finally the long time horizon of potential climate change impacts poses an additional challenge that needs to be considered when designing the MampE framework for CCA projects Long-term impacts are unlikely to result from the project alone Instead they are rather generated by a series of factors or other interventions in the specific area Complexity increases when trying to identify the short-term and long-term outcomes that can be attributed to a par-ticular intervention For example the choice of farm-ing practices in a sustainable agriculture project also reflects the thought given to current or future cli-mate change However it remains difficult to isolate and assess the individual adaptation components reflected by these choices
23 Review of current methods to evaluate the results of CCA projects
The projects reviewed are conducted in developing countries and emerging economies 14 For the pur-pose of this guidebook emphasis was placed on the methodology ie the analysis of currently used eval-uation designs (experimental quasi-experimental ex-post etc) the presentation of the main data col-lection methods used (focus group discussions inter-views surveys direct observation etc) and lastly whether a quantitative qualitative or mixed-method approach was used The findings are summarised in Annex 51
During the research process two problems became visible first little use is made of RIEs in CCA projects which relates to the second finding namely the diffi-culty of ascertaining which evaluation methodology was applied Often it was difficult to identify which design was used since there was no reference to it in the methodology section of the evaluation Due to this difficulty we checked for keywords in the evalu-ation papers (eg randomisation randomised con-trolled trials (RCTs) control or comparison group quasi- and experimental design counterfactual and so forth) Very often none of these keywords were found in the whole document which is why there is no reference to the evaluation design in the table in Annex 51
14 Three different research approaches were used for this study (a) a simple google search using the following keywords lsquoclimate change adaptation impact evaluation vulnerability vulnerability assessments monitoring and evaluation of climate change adaptation adaptive capacity and resiliencersquo (b) a review of the reference lists of the journal articles found in (a) and (c) the scan-ning of relevant evaluations carried out by development agencies international organisations or independent evaluation institutions
Prowse and Snilstveit came to a similar conclusion in their study Impact Evaluation and Interventions to Address Climate Change A Scoping Study 15 pub-lished in 2010 saying that just a few RIEs were con-ducted (using mainly a quasi-experimental design) Although Prowse and Snilstveit recognised the chal-lenging nature of CCA projects this does not impede the use of RIEs Especially with regard to the increas-ing financial resources made available for climate change mitigation and adaptation projects it is important to make use of RIEs because evidence of the effectiveness of spending is required
Challenges inherent to evaluations of CCA projects involve the poor quality of the baseline (if there is one at all) randomisation and the development of a sample size which is often not representative The possible spreading of benefits from target to non-target groups is another limitation often referred to (see example below) In general data triangulation ie using a combination of qualitative and quantita-tive indicators (mixed-method approach) is visible in almost all CCA projects 16 which can be seen as a sign of progress in this field Just to name one example the evaluation of the project lsquoChronic Vulnerability to Food Insecurityrsquo implemented by the World Food Programme triangulates data from qualitative and quantitative sources It uses qualitative data from focus group discussions with community mem-bers and key-informant interviews with commu-nity opinion leaders and quantitative data involv-ing about 3000 randomly sampled households (cf Annex 51)
Another interesting finding concerns the way inter-national organisations conduct evaluations These evaluations are aligned with the Paris Declaration on Aid Effectiveness basing the evaluation mainly on the assessment of effectiveness efficiency relevance impact and sustainability (the DAC criteria) There is often no reference to the applied methodology
To name an example consider the Pacific Integrated Water Resource Management (IWRM) project (UNDP 2015c) established in 2009 which aimed to improve water resource and wastewater management and increase water use efficiency in Pacific island coun-tries in order to balance overuse and conflicting uses of scarce freshwater resources The evaluation is based on the DAC criteria for evaluating develop-ment assistance but it does not explain which design
15 Impact Evaluation and Interventions to Address Climate Change A Scoping Study httpwwwtandfonlinecomdoipdf10108019439341003786729
16 Although CCA evaluations are sometimes based on desk reviews and qualitative indicators (eg stakeholder interviews focus group discussions direct observations etc) and often lack robust quantitative data (see for example project Ndeg 31 in the table in Annex 51)
21
was applied In the methodological part only the data collection instruments are outlined (ie desk review and analysis interviews site visits) The same is true of many other evaluations within the Evalu-ation Resource Centre 17 of UNDPrsquos Independent Evaluation Office 18
In general when screening evaluations conducted by international organisations (see for instance the database of IFAD and the Global Environment Facil-ity (GEF) it becomes obvious that they have not conducted many rigorous impact evaluations so far hence there is not much experience in this field Take the Independent Evaluation Office of IFAD for instance narrowing down the search to look only at impact evaluations there is just one evaluation that was conducted in Sri Lanka in 2013 (Dry Zone Livelihood Support and Partnership Programme (DZLISPP)) 19 Although it is the only impact evalua-tion there is a clear methodology behind it For the first time IFAD undertook extensive data collection and analysis including a qualitative survey (30 key-informant interviews with project staff and relevant government officials) 41 focus group discussions with beneficiaries and a quantitative survey of over 2560 households Due to an absence of baseline data (which is often the case in CCA projects) two strate-gies were applied (1) an attempt to reconstruct the baseline through recall methods and (2) the use of a quasi-experimental design that does not strictly require baseline data Further challenges experienced were sample selection bias due to targeting and the potential spreading of benefits from target to non-target groups
The Independent Evaluation Office of the GEF offers more than one impact evaluation but the overall number is modest Furthermore the few impact evaluations that have been conducted only concern climate change mitigation projects (there are none for CCA projects yet) However although the GEF has not yet implemented many impact evaluations it
17 Evaluation Resource Centre httpercundporgindexhtml18 Independent Evaluation Office httpwebundporgevaluation19 Dry Zone Livelihood Support and Partnership Programme
(DZLISPP) httpwwwifadorgevaluationpublic_htmleksystdocimpact2013srilankaindexhtm
is clear that they deal with this topic since there are many publications that emphasise the impact evalu-ation of climate change projects It will surely be only a matter of time until there is a spillover to CCA pro-jects too In 2014 the GEF Independent Evaluation Office together with a number of multilateral and bilateral organisations including GIZ hosted the Sec-ond International Conference on Evaluating Climate Change and Development which aimed to promote and develop methods and good practices for MampE of adaptation and mitigation 20 A book of conference proceedings will be published by Springer in 2016
To be fair it has to be stressed that many CCA pro-jects focused on policy development and capacity building exercises at institutional level for which RIEs may not be an adequate evaluation design The National Adaptation Plan Global Support Pro-gramme or the Climate Finance Readiness Pro-gramme are examples where RIEs might be compli-cated These are global CCA projects that focus on policy development capacity building at institu-tional level and making sure that the target country is ready (institution-wise) to receive the financial resources earmarked for CCA projects
It should also be mentioned that lsquolearningrsquo is in many cases not the focus of the evaluation Frequently evaluations focus rather on the question lsquoHave we done what we said we wouldrsquo (accountability) than on lsquoWhat happened and whyrsquo (learning) This is especially true of development organisations (exam-ples are outlined in the table in the annex) Addi-tionally while screening CCA projects carried out by development organisations it became clear that many projects are still ongoing This means that an evaluation still has to be completed At best this pub-lication may raise awareness among practitioners to consider RIEs for CCA projects in order to increase the use of this evaluation design gain relevant expe-rience and simultaneously obtain valuable findings that can be shared with the adaptation community
20 Presentations and videos from the conference can be accessed at httpswwwclimate-evalorgevents2014-conference
Phot
o copy
GIZ
Ran
ak M
artin
2 Evaluating clim
ate change adaptation projects
Impa
ct E
valu
atio
n G
uide
book
for C
limat
e Ch
ange
Ada
ptat
ion
Proj
ects
22
3 Rigorous evaluation designs and examples of applicability in climate change adaptation projects
Having discussed the types and key features of CCA projects and the way they are currently evaluated this section will now provide an overview of the strategies and prerequisites for evaluating the impact of such projects bearing in mind their characteris-tics The first section thus deals with the potentials and limitations of different research designs used for impact evaluations when it comes to their applica-tion in the field of climate change adaptation (31) Section 32 discusses the methodological require-ments for providing reliable data on a large scale with a particular focus on adequate survey sampling techniques
31 Overview of evaluation designs ndash potentials and limitations for climate change adaptation projects
Before going further into the topic as such the term lsquodesignrsquo should be briefly explained as it is occasion-ally used with different meanings and confused with other terms such as lsquomethodrsquo or lsquoinstrumentrsquo
Generally speaking a research design describes how a research question is intended to be answered Evaluation designs usually differ with regard to the points in time when data is collected the data sources and the way the data is analysed (eg by com-paring target group with comparison group data) Most common evaluation designs are ex-post facto designs and single-difference designs (ie before-and-after comparisons or group comparisons) How-ever as these designs are not suitable for evaluating impact ndash at least when used as the only means during an evaluation ndash they are not discussed further in this Guidebook Instead we shall go on to present alter-native and more sophisticated evaluation designs that can provide sufficient empirical evidence
about the attribution or at least contribution of an intervention to observed changes We will explain the types of projects to which they can be applied which time budget and data resources they require and how informative their findings are We will also assess how valid and reliable the evaluation findings are provided the design has been implemented cor-rectly
A research design describes how a research question is answered
The descriptions start with experimental and quasi-experimental designs (311) which are favoured by a number of evaluation experts (eg DufloGlen-nersterKremer 2008 see also literature list at the end of this section) and considered by some as the lsquogold standardrsquo for impact evaluation In 312 an alternative approach for estimating the impact of an intervention is discussed so-called propensity score matching which may be suitable when poten-tial beneficiaries cannot be randomly assigned to a treatment and comparison group The next sec-tion deals with the so-called pipeline approach (313) This approach is of particular use if a project is implemented sequentially but aims to support target groups that feature comparable characteris-tics Another approach that is useful when the treat-ment decision depends on the beneficiary present-ing a threshold level of a specific characteristic (eg income or age) called the regression discontinu-ity approach is discussed in Section 314 In Sec-tion 315 the potentials of time-series evaluation designs are discussed by means of the so-called panel analysis Time-series designs are of particular value for long-term projects and observation periods and when complementary statistical data is acces-sible The last design discussed in detail is suitable for projects that aim to make a difference at policy level (type I and II projects) as it can provide empiri-cal evidence about their contribution to changes in a complex environment taking external influences into account (316) The design is called structural equation modelling and comes from the field of econometric research where it is commonly used to identify causal linkages between social and eco-nomic phenomena such as education and health The section closes (317) with a tabular overview of the applicability of the evaluation designs discussed above their methodological and practical require-ments and the validity of their findings (if applied correctly) The purpose of this overview is to enable the reader to choose a particular design bearing in mind the adaptation-specific project characteris-tics and given the financial technical and logistical framework conditions
311 Experimental and quasi- experimental designs
The following section outlines the main characteris-tics potentials and limitations and methodological prerequisites for applying an experimental or quasi-experimental design during an evaluation We will also discuss the kind of CCA-related interventions to which such designs can be applied and which meth-odological skills and (financial human and time) resources are required
Generally speaking experimental and quasi-exper-imental designs (in the field of applied empirical social sciences) consist of a comparison of two groups at two points in time One group receives a certain treatment (intervention measure activity etc in the following named lsquotreatment grouprsquo) and the other does not A design is called experimental or more precisely a randomised controlled trial (RCT) if the members of each group are selected at random This means that (ex-ante) the probability of each indi-vidual being a member of the treatment group is the same 21 The group that has not received any treatment is then called a lsquocontrol grouprsquo If such a random selec-tion cannot be ensured (eg due to self-selection bias or conscious selection) then such a design is called quasi-experimental In that case the group without treatment is called a lsquocomparison grouprsquo 22 However in order to simplify matters we will consistently use the term lsquocomparison grouprsquo in the remainder of this document
Experimental designs require a randomised selection of participants for an intervention
The purpose of employing such a design is to allow for attributing observable changes in a given popu-lation to an intervention This is done by estimating the so-called counterfactual ie the hypothetical situation of that population without having received the treatment In other words we do so by answer-ing the question lsquoWhat would have happened if no intervention had taken placersquo While estimating the counterfactual is also the foundation for calculating the treatment effect in pre- and post-test analyses and
21 It has to be highlighted that the equal probability that individuals of a given basic population will receive a treatment needs to be considered at the project planning stage That means that an RCT can only be applied if the project design allows for a random selec-tion of the treatment group
22 The rationale behind this distinction is that a lsquonon-interventionrsquo group that has not been selected at random cannot by definition act as a lsquocontrolrsquo for any time-variant or invariant variables There-fore particularly in the social sciences the term lsquocomparison grouprsquo is frequently used in settings where the groups were not selected at random
comparative analyses these designs have consider-able weaknesses regarding their underlying assump-tions These weaknesses compromise the validity of their findings in many cases In a simple pre- and post-test design the measurement prior to the inter-vention is taken as the counterfactual assuming that the situation of the target group would have remained stable without the intervention However because there is usually a considerable time span between the measurements this assumption is not valid as it cannot be assured that no other external factor would have influenced the situation of the treatment group Comparative designs estimate the counterfactual by collecting ex-post data from both the treatment group and a group that has not taken part in or benefited from the intervention ie a com-parison group In this case one assumes that the situ-ations of the treatment group and the comparison group were identical before the intervention How-ever this assumption cannot be held true either due to the potential selection bias The selection bias may be based on the intervention design (eg focusing on the most needy persons) the individual characteris-tics of the participants (eg self-selection by voluntari-ness) or on practical issues such as a limited budget the accessibility of the treatment group or other logis-tical constraints
Experimental and quasi-experimental designs tackle the issue of intervening time factors and potential differences between target and comparison groups by combining both a pre- and post-test and a compara-tive design This means that data is collected from both the target group and the comparison group before and after the intervention The net effect of an intervention (ie net average treatment effect) is then calculated on the basis of the average difference in the observable changes between the treatment and the comparison group (also called double-difference or difference-in-difference approach see Annex 52 for a further introduction to the calculation of the net average treatment effect using this approach)
Phot
o copy
GIZ
Har
ald
Fran
zen
3 Rigorous evaluation designs and exam
ples of applicability in climate change adaptation projects
Impa
ct E
valu
atio
n G
uide
book
for C
limat
e Ch
ange
Ada
ptat
ion
Proj
ects
24
CCA-specific requirements and challenges
Experimental and quasi-experimental designs are applicable to CCA projects whenever project measures aim at generating a direct impact at individual level ie if a distinguishable target group (eg inhabitants of a particular disaster-prone area farmers in arid regions) receive a specific benefit (eg knowledge of how to seek shelter in case of emergency technical assistance to install drip-irrigation systems) In order to apply such a design it must also be possible to establish a treatment and control or comparison group While in some cases the division of a population into a treatment and controlcomparison group may not be appro-priate for ethical reasons (ie if the denial of support would lead to an immediate deadly peril eg medi-cation in an epidemic) in many other cases financial logistical or technical constraints inevitably lead to selecting a sub-group of a larger population that in principle shares the same needs
A further requirement for applying an experimental or quasi-experimental design is that it must be pos-sible to detect an impact within a manageable time frame While it holds true that it may take a long time for CCA project impacts to become visible ndash which is also the case for impacts in other fields such as edu-cation financial systems or private sector development ndash there may also be some ways to work around the relevant constraints Referring to the first example mentioned above for instance one would not have to wait until another disaster happens to see if the project participants are able to seek shelter faster than those who did not participate A simple observation with a stopwatch during a test alarm would probably do the trick as well Concerning the second example it may not be necessary to wait until the environmental framework conditions have deteriorated in another 20 years to see if the drip-irrigation systems lead to the desired impact Even without any (further) climate change one can measure the reduced water consump-tion and increased yield in comparison to conventional farming methods However in the latter case too a time-series design (cf Section 315) may be a viable alternative for identifying the long-term impact of the project particularly if a comparison group can be established
It must be mentioned though that experimental and quasi-experimental designs also feature a number of challenges which limit their applicability to some extent First of all such designs require considerable tech-nical logistical and thus financial resources As one can imagine the collection of data from a large num-ber of people (cf Section 32 for further considerations about required sample sizes) particularly if they are located in difficult-to-reach areas is costly and time-consuming Furthermore the necessity to collect this data also from people who did not receive any benefit may be difficult as they may be not as willing to con-tribute to such an analysis as those who did For example a farmer who did not receive any technical assis-tance may not be as willing to provide information about his yields In such cases a suitable project design (possibly a pipeline approach see Section 313) may increase the willingness to participate
Finally the findings of such designs are prone to a certain degree of bias such as spill-over and conta-gion effects A spill-over effect means that the controlcomparison group indirectly receives a benefit eg through copying or learning from the treatment group (eg if the trained habitants in the disaster-prone area tell others who were not trained how to behave or if farmers who did not receive any assistance adopt irrigation schemes because they recognise their comparative advantage) Contagion effects may occur if the project under investigation is not the only one to provide support in the target area ie if other DC agencies are active in the same field In that case it may be difficult to attribute the observable impact to the particu-lar intervention (eg if the farmer was able to increase his yield because of the technical support provided by GIZ or because of the micro-credit he received from the ADB) While spill-over effects usually lead to an underestimation of the treatment effect (ie as the controlcomparison group receives a benefit as well) contagion effects can lead to both the over- and underestimation of the treatment effect depending which group has been (more) contaminated by other support measures Thus in multi-donor settings contribution analyses such as those conducted as part of a structural equation modelling approach (cf Section 316) may be more promising
25
312 Matching techniques
In an experimental design comparing the differ-ences in the outcomes of the treatment and control group would be sufficient for calculating the net effect of an intervention However as treatment groups are rarely selected randomly often such a design cannot be implemented in practice To obtain valid evaluation findings all the same the induced selection bias described above needs to be compen-sated for Various approaches are available for this purpose among these matching techniques appear to be especially suitable in evaluation studies The basic idea of matching techniques is to establish for each member of a treatment group a sub-set of pos-sibly similar comparison group members in order to estimate the treatment effect by calculating mean group differences That means that the counterfac-tual situation of the treated person (ie what would have happened if this person had not participated in the project) is approximated through the assignment of similar persons who have not participated
Matching techniques aim to approximate the counterfactual by comparing the outcomes of individuals from the treatment and the compari-son group that have identical or at least similar characteristics
A common matching approach is to identify statisti-cal twins by comparing individual characteristics (ie dimensions) that are supposed to have an influence on the outcomes of an intervention For example if one suspects that the effectiveness of a training measure (eg teaching farmers how to grow drought-resistant crops) also depends on the age and gender of the beneficiary the treatment and comparison group can be clustered accordingly and the outcomes can be individually compared for each sub-sample The following table illustrates the principle of the matching approach using the mentioned example
For further reading about impact evaluation in general and the above-discussed methodological aspects the potentials and limitations of experimental and quasi-experimental designs and particularly their practical implementation the following books articles and papers are recommended
General methodological introduction
Bertrand M Duflo E Mullainathan S How Much Should We Trust Differences-in-Differ-ences Estimates Working Paper 01 ndash 34 MIT Cambridge 2001
Stern E Stame N Mayne J Forss K Davies R Befani B Broadening the range of designs and methods for impact evaluations Working Paper 38 DFID London 2012
White H Some Reflections on Current Debates in Impact Evaluation International Initiative for Impact Evaluation New Delhi 2009
Practical guidelines and examples
Chambers R Karlan D Ravallion M Rogers P Designing impact evaluation different per-spectives International Initiative for Impact Evaluation New Delhi 2009
Khandker SR Koolwal GB Samad HA Handbook on Impact Evaluation Quantita-tive Methods and Practices The World Bank Washington DC 2010
Leeuw F Vaessen J Impact Evaluations and Development NONIE Guidance on Impact Evaluation NONIE Washington DC 2009
Vaessen J Todd D Methodological challenges of evaluating the impact of the Global Envi-ronment Facilitys biodiversity program Evalu-ation and Program Planning 31 2008 pp 231 ndash 240
3 Rigorous evaluation designs and exam
ples of applicability in climate change adaptation projects
Impa
ct E
valu
atio
n G
uide
book
for C
limat
e Ch
ange
Ada
ptat
ion
Proj
ects
26
Table 2 Example table for matching on observables
Group Treatment group Comparison group
Gender Male Female Male Female
lt 40 years old
ge 40 years old
Annotation Each cellarrow colour indicates an individual comparison
As the table shows each sub-sample of the treatment group (eg men of the age of 40 and above) is com-pared with a sub-sample of the comparison group that has the same characteristics The problem with this so-called matching on observables approach is that the size of comparable sub-samples decreases as the number of relevant dimensions grows This again limits the possibility of conducting statistical tests (eg t-test for comparing mean values of independ-ent samples) that require a minimum cell count of approximately 30 cases in order to reach valid find-ings
Another matching technique that has gained atten-tion in the last years is called propensity score matching (PSM cf RosenbaumRubin 1985) The advantage of this technique is that in contrast to matching on observables it provides a one-dimen-sional score for comparison (the so-called propensity score) that indicates the probability of any individual being a member of the treatment group Since this approach is methodologically quite demanding and thus requires a strong theoretical background its application will not be discussed here in detail Instead a short introduction into PSM and further reading material can be found in Annex 53
CCA-specific requirements and challenges
When we look at how these matching techniques can be applied to CCA projects the same characteristics apply as mentioned in the preceding section because they are primarily used on an individual level While institutional or even spatial (regional city-wise) matching can also be found in evaluation practice the meth-odological foundations and practical experiences concerning the validity of the findings provided by such matching approaches are still rather limited Therefore it is not recommended to pursue such an approach lsquoaboversquo the individual level Regarding the variables that are used for matching in the context of CCA projects it may be possible to work with characteristics such as proximity to hazardous areas degree to which individuals are affected by climate change effects or affiliation to specific ethnic social or religious groups etc
The challenges presented by matching approaches include two issues in particular The necessity of a rela-tively larger sample in order to find sufficient matching partners and the question of which characteristics to choose for the matching While the first issue constitutes a technical problem that can be solved by allocat-ing sufficient resources the second is a theoretical one which requires comprehensive sectoral and regional expertise The analysis of matched data can lead to significantly different findings compared with unmatched data depending on which characteristics are considered relevant Therefore it is of the utmost importance to substantiate the selection of the matching variables based on sound theory The most important questions to be answered in that regard are
` Could the characteristic influence the effectivenessoutcome of the intervention for the individual ` Does the basic population comprise sufficient individuals with different characteristics ` Will it be possible to identify sufficient individuals in the target group with identical characteristics
We should also point out that matching may not prevent potential bias as described in 311 However it may be possible to perform matching using aspects such as lsquodegree to which individuals are affected by other inter-ventionsrsquo in order to at least reduce the risk of contagion effects
27
For further reading on the methodological aspects potentials and limitations of PSM as well as its practical implementation the following books articles and papers are recommended
General methodological literature about PSM
Becker S Ichino A (2002) Estimation of average treatment effects based on propensity scores The Stata Journal 2(4)358 ndash 377
Luellen JK Shadish WR amp Clark MH (2005) Propensity scores An introduction and experimental test Evaluation Review 29(6)530 ndash 558
Morgan SL amp Winship C (2007) Counterfactu-als and causal inference methods and prin-ciples for social research Cambridge NY Cambridge University Press
Guo S amp Fraser MW (2010) Propensity score analysis Statistical methods and applications Thousand Oaks Sage
Steiner PM Cook TD Shadish WR amp Clark MH (2010) The importance of covariate selection in controlling for selection bias in observational studies Psychological Methods 15(3)250 ndash 267
Practical guidelines and case-studies
Caliendo M amp Kopeinig S (2008) Some practical guidance for the implementation of propen-sity score matching Journal of Economic Sur-veys 22(1)31 ndash 72
Cook TD amp Steiner PM (2010) Case match-ing and the reduction of selection bias in quasi-experiments The relative importance of pretest measures of outcome of unreliable measurement and of mode of data analysis Psychological Methods 15(1)56 ndash 68
Diaz JJ amp Handa S (2006) An assessment of propensity score matching as a nonexperi-mental impact estimator Evidence from Mex-icorsquos PROGRESA program Journal of Human Resources 41(2)319 ndash 345
Gaus H Muumlller C E (2012) Evaluating free-choice climate education interventions apply-ing Propensity Score Matching Evaluation Review 35(6)673 ndash 722
313 Pipeline approach
Often projects are not implemented on a broad scale right from the beginning targeting the entire poten-tially relevant target group but sequentially This may be because of logistical or budgetary reasons In these cases a so-called pipeline approach can be of particular use The idea behind the approach is that the section of the target group that receives a treat-ment (ie benefits from or takes part in a project) at a later stage can be used to approximate the counter-factual situation of those who did receive the treat-ment at the time of data collection In other words the part of the target group that is not yet affected
serves as a quasi-comparison group for the already affected part of the group In principle the approach can be applied repeatedly during an intervention depending on the number of phases in which the treatment (ie measures activities etc) is provided
In a pipeline approach the part of the treatment group that has not yet received any treatment is used for comparison
Figure 2 illustrates the basic concept of the approach using a three-phase intervention design
3 Rigorous evaluation designs and exam
ples of applicability in climate change adaptation projects
Impa
ct E
valu
atio
n G
uide
book
for C
limat
e Ch
ange
Ada
ptat
ion
Proj
ects
28
Figure 2 Illustration of the pipeline approach
( )t0 t1 t2 t3Timeline
Project phase IIIGroup C
Project phase IIGroup B
Project phase IGroup A
Ex-antebaseline data collection Final data collection Ex-postfollow-up data collection
( )
( )
As the figure shows in a three-phase project a total of four data collections (t0 ndash t3) are necessary of which at least during two (t1 amp t2) data sets have to be collected from two groups (group A amp B t1 respectively group B amp C t2) The treatment effects would then be estimated as in an ordinary single-difference design whereby group B would represent the comparison group to group A and group C to group B Provided the total project duration suffices ex-postfollow-up data from groups A amp B could also be collected at t3 which would probably allow further conclusions to be drawn about the sustain-
ability of the achieved results Further data collec-tions are conceivable such as from group C at t0 and t1 in order to estimate spill-over effects from groups A and B or to control for external influences on outcome variables (eg contagion effects from other projects) In any case the approach is quite flex-ible as it can be modified according to the informa-tion needs It can even compensate for a lsquoforgottenrsquo baseline study to some extent provided the group characteristics are comparable and remain relatively stable over time ie when the influence of external factors is negligible
CCA-specific requirements and challenges
With regard to evaluating CCA projects the pipeline approach is applicable for interventions that are planned to be implemented in phases for instance in different areas andor institutions (eg development and implementation of environmental information systems for local authorities in different provinces) and that aim to generate impact at individual or institutional level Provided that this is the case as outlined above it is still possible to start collecting data after the project has started ie it is not necessary to have baseline data for the first project phase This may be a considerable benefit for all projects that follow a replication or scaling-up design with a preceding pilot phase in which the (technical logistical etc) feasi-bility of the measures is tested before they are rolled out in other areas
The pipeline approach might also be of particular value for CCA projects which are confronted with the problem of shifting baselines (cf 22) The pipeline approach makes it possible to trace developments by comparing the baselines for each group (provided the group characteristics are in principle comparable) It may also be an option for projects that aim at generating long-term impacts that might not be observable directly at the end of their implementation
When applying a pipeline design however it should be borne in mind that each data collection phase is just as labour-intensive and time-consuming as a quasi-experimental design given that data needs to be collected for both the treatment and a comparison (ie future treatment) group except for the first and last round The same quality criteria therefore apply
The references to literature on experimental and quasi-experimental designs at the end of Section
311 are also suitable for further reading on the pipe-line approach
29
314 Regression discontinuity design
The approach discussed in this section is of par-ticular use when project participantsbeneficiaries are consciously selected on the basis of one specific characteristic that distinguishes them from non-participantsbeneficiaries (eg income) though they are similar in a number of other respects (eg loca-tion income sources education) If the participationeligibility of an individual depends on the value of a particular indicator that is relevant to the outcome of an intervention the treatment effect can be esti-mated by the so-called regression discontinuity design (RDD) The basic idea behind the approach is to estimate the treatment effect by comparing the
pre- and post-treatment indicator values (scores) of only those individuals from the treatment and com-parison group that are most similar with regard to their pre-treatment outcome score ie that lie within a comparison range close to the threshold level Fig-ure 3 shows the sample selection for assessing the treatment effect
The regression discontinuity design can be applied if project participantsbeneficiaries are selected based on a special characteristic that distinguishes them from non-participantsben-eficiaries
Figure 3 Selection of individuals for comparison
Individuals
Pre-intervention outcome score
Threshold levelComparison range
Untreated individuals
Compared untreated individuals
Compared treated individuals
Treated individuals
It is mandatory to adhere to the threshold level throughout the selection process as otherwise the regression analysis would lead to less valid findings Furthermore it must be assured that the individu-als cannot influence the pre-intervention outcome score (eg by temporarily lowering their income in order to receive support) as this would also bias the findings
Once the sample has been identified the pre- and post-treatment outcome scores are used to cal-culate regression functions for each group If the
intervention had an effect on the treatment group the functions should show different values at the threshold level This difference can be interpreted as the local average treatment effect for individuals that are most similar ie whose outcome values lie very close to the threshold line The discontinuity of the regression functions of the treatment and com-parison group can also be visualised by a Cartesian coordinate system in which the X-axis represents the pre-treatment and the Y-axis the post-treatment outcome score Figure 4 shows how such a disconti-nuity may look
Figure 4 Outcome scores before and after intervention
Pre intervention outcome score
Post intervention
outcomescore
Threshold level
Comparison range
Non treated individuals
Compared non treated individuals
Compared treated individuals
Treated individuals
3 Rigorous evaluation designs and exam
ples of applicability in climate change adaptation projects
Impa
ct E
valu
atio
n G
uide
book
for C
limat
e Ch
ange
Ada
ptat
ion
Proj
ects
30
As the treatment effect estimated with the RDD is based on a comparison of most similar individuals it can be considered to be widely unbiased How-ever a disadvantage of the approach is that the effect may not be generalisable for the entire population because individuals become less comparable the further they are from the threshold level Another disadvantage is the fact that in comparison to other designs RDD only uses a small fraction of the entire population to estimate the treatment effect
Due to its relatively ambitious requirements and methodological reservations RDD has only played a minor role in impact evaluation studies so far Never-
theless it may be applicable particularly for policy-field evaluations with large and clearly defined treatment groups provided the above-mentioned methodological requirements can be met In some publications (KhanderKoolwalSamad 2010) the use of a regression discontinuity approach is also recommended in scenarios where a threshold level is spatially defined (ie a geographical national or administrative border) However such an applica-tion needs to be carefully reviewed as populations in different regions present unobserved covariates (eg cultural or religious background) that may limit their comparability
CCA-specific requirements and challenges
RDD can be of particular use for evaluating CCA projects that focus on creating an impact at individual level and are implemented under framework conditions that involve a high degree of uncertainty provided the projects comply with the methodological requirements outlined above The benefit lies in the compara-tively simple data collection setup and clear interpretability of the evaluation findings which are quite robust against bias at least for those individuals who are very similar
On the other hand it has to be added that the findings are only of limited external validity Furthermore as only very similar individuals are compared (at least with regard to the outcome variable that is of interest) the sample selection can be less efficient because only a smaller number of individuals (ie those who are very similar) can be used for comparison Another challenge which is not restricted to CCA projects though is that it requires the project to adhere to a defined threshold level not to lsquoshiftrsquo it or make exceptions which in practice often proves to be a problem It is also only suitable for interventions where the impact becomes vis-ible in a manageable time frame which is not often the case for CCA projects
Finally it should be added that besides the outlined basic RDD there are several further more sophisti-cated variations of the approach These include ran-dom assignment at the threshold level or with more than one threshold level (eg if the treatment group is split further in sub-groups that receive different kinds of support depending on their pre-treatment outcome score) which cannot be discussed here
Therefore the following books articles and papers are recommended for further reading about methodological and practical require-ments as well as further applications of the approach
Imbens GW amp Lemieux T Regression discontinuity designs A guide to practice Journal of Econometrics 142(2) 2007 pp 615 ndash 635
Khandker SR Koolwal GB Samad HA Handbook on Impact Evaluation Quantita-tive Methods and Practices The World Bank Washington DC 2010
315 Time-series designs
While most evaluations focus on a limited time frame defined by the duration of an intervention sometimes it may be necessary to cover a longer period eg when the effectiveness of a series of past support activities or the development of (politi-cal economic etc) framework conditions are to be reviewed In those cases time-series designs can be of particular use We should add that there is no sin-gle time-series design this is rather an umbrella term for a number of different approaches What they have in common is that they are based on repeat-edly collected data over a longer period Time-series designs can be distinguished by whether they make use of only descriptive or also inferential statistics if data from the same analytical units (eg individuals households organisations cities countries) is used or not and if the data is quantitatively or qualitatively analysed
Time-series designs are based on frequently repeated data collections and are of use for measuring long-term impacts and the develop-ment of framework conditions
31
While it is simple to analyse the development of individual indicators descriptively by means of a trend analysis the identification of causal relation-ships calls for more sophisticated approaches Such approaches are often based on regression analyses that make it possible to estimate the influence of sev-eral independent variables (eg resources contextual factors) on dependent variables (eg attitudes behav-iour well-being) We shall go on to discuss an exem-plary design that has been successfully applied in a number of impact evaluation studies the so-called panel analysis
A panel analysis is based on repeated data collec-tions from identical analytical units The data needs to be comparable with regard to their informa-tion content ie the data collection instruments of each survey have to contain identical question and answer categories Furthermore the data sets must
be assignable to each respondent throughout the observation period Panel analyses usually require datasets with a large number of analytical units in order to be able to draw conclusions from the panel sample that apply to a larger basic population (cf 331) If these requirements are met panel analyses make it possible to trace developments not only on average but also on an individual basis and thus to identify variations caused by individual differences (ie unobserved heterogeneity) In addition given a sufficient observation period panel analysis makes it easier to identify the chronological sequence of changes and thus develop hypotheses about causali-ties The treatment effect can be estimated on the basis of various models The two most common of these the so-called fixed-effects model (FEM) and the random-effects model (REM) are briefly out-lined in Annex 54
CCA-specific requirements and challenges
Time-series designs appear to be most suitable for CCA projects as they are in principle applicable at each impact level and are of particular benefit when it comes to measuring long-term impacts As they make it possible to control time-variant confounding factors they are likewise useful for dealing with uncertain framework conditions as well as with shifting baselines given a sufficiently large sample size andor number of repeated data collections Due to their flexibility they can be applied in projects that focus on the adapta-tion of particular target groups to changing (climate environmental) framework conditions on the improve-ment of institutional capacities to deal with climate change-rooted environmental social or economic prob-lems or on national regional or global developments such as adaptation strategies in response to particular climate challenges Thus time-series designs are in fact more common in policy studies than in project evalu-ations
The challenges associated with time-series designs lie not so much in their practical implementation or the required financial resources as in the expert knowledge needed to do the lsquomathsrsquo They also call for a strong sectoral background in order to develop the right cause-and-effect hypotheses and draw the right conclu-sions from the analysis findings Very few evaluation experts have the know-how to adequately draft and implement such a design The high theoretical and methodological demands are reflected in a multitude of disputes among experts concerning the credibility of research which is of course not helpful for clearly com-municating evaluation findings
For further reading on panel data analysis the following literature is recommended
Berrington A Smith WF Sturgis P An Overview of Methods for the Analysis of Panel Data NCRM Methods Review Papers NCRM007 ESRC National Centre for Research Methods Southampton 2006
Hsiao C Analysis of Panel Data Cambridge University Press Cambridge 2014
316 Structural equation modelling
While the approaches discussed in the sections before are suitable for project types that differenti-ate between a treatment and a comparison group we will now go on to present an approach that may be applied for evaluating large-scale policy-based programmes that aim to affect an entire (national regional or global) population or sector (eg envi-ronmental or education sector labour market) With the so-called structural equation modelling (SEM) approach it is therefore not possible to attribute an observed effect to a specific intervention but to esti-mate the statistical relationship between several fac-tors over time one of which may be an intervention
3 Rigorous evaluation designs and exam
ples of applicability in climate change adaptation projects
Impa
ct E
valu
atio
n G
uide
book
for C
limat
e Ch
ange
Ada
ptat
ion
Proj
ects
32
Structural equation models make it possible to estimate statistical relations between con-structs which are defined by empirical measur-able indicators
Basically SEM is a multivariate statistical approach for testing hypotheses (deductive approach) about causal relationships between two or more latent constructs Its special feature is that it makes it pos-sible to test multiple statistical relationships (which are assumed to be causal) at the same time and can thus be used in complex environments In this con-
text latent construct means that the causes and effects (eg health employability) cannot be meas-ured directly but only by a number of manifest (ie empirically measurable) indicators (for health eg blood counts weight for employability education level qualifications) In principle a structural equa-tion model consists of two model types measure-ment models and structural models Measurement models describe the relationship between a latent construct and its indicators structural models describe the connection between latent constructs The following figure illustrates the differentiation between the model types according to the graphical representation of the system model described above
Figure 5 Generic layout of a structural equation model
It is important to note that the indicators that opera-tionalise the constructs and the causal relationships between the constructs have to be specified and theoretically substantiated by the researcher That means that it needs to be defined in advance which is the independent (ie exogenous) and which is the dependent (ie endogenous) variable In other words
the direction of the dependency has to be defined by the researcher In the figure above constructs 1 and 2 are exogenous variables (ie causes) while construct 3 is an endogenous variable (ie effects) A practical example on how to implement a SEM is given in sec-tion 42
CCA-specific requirements and challenges
With regard to the application of SEM for evaluating CCA projects the requirements and challenges sum-marised in the previous section on time-series designs are widely transferable with the difference that SEM is mainly suitable for projects that aim to create an impact at institutional and system level (eg political strategies) The practical requirements relating to SEM are not so difficult though it does take comprehensive theoretical know-how to develop the model As mentioned above the validity of the models relies on the expert knowledge of the people who create them Thus the findings of SEM analysis are as right or wrong as the model they are based upon Here the particular danger lies in omitting a system-relevant construct (ie influential factor) or indicators that define such a construct which would cause substantially biased findings What aggravates the problem is that in contrast to the designs discussed above unfortunately no quality criteria are available for assessing the validity of an SEM model Nevertheless given sufficient expert knowl-edge SEM can be of great benefit for providing the lsquobigger picturersquo and thereby revealing the manifold causal linkages between social political economic and environmental developments in the long run
33
For further reading on the methodological aspects potentials and limitations of SEM as well as its practical implementation we recommend the following books articles and papers
Cassel C Hackl P Anders HW (2010) Robust-ness of partial least-squares method for estimat-ing latent variable quality structures Journal of Applied Statistics 26(4)435 ndash 446
Chin W Newsted PR (1999) Structural Equation Modeling Analysis with small Samples Using Partial Least Squares In Hoyle R (ed) Statistical Strategies for Small Sample Research Thousand Oaks Sage
Diamantopoulos A Riefler P Roth KP (2008) Advancing formative measurement models Jour-nal of Business Research 61(2008)1203 ndash 1218
Garthwite PH (1994) An Interpretation of Partial Least Squares Journal of the American Statistical Association 89(425)122 ndash 127
Haenlein M Kaplan AM (2004) A Beginnerrsquos Guide to Partial Least Squares Analysis Understanding Statistics 3(4)283 ndash 297
Temme D Kreis H Hildebrandt L (2006) PLS Path Modeling ndash A Software Review SFB 649 Discussion Paper 2006-084 Berlin Humbold-University
Tenenhaus M Vinzi VE Chatelin Y-M Lauro C (2004) PLS path modeling Computational Statistics amp Data Analysis 48(2005)159 ndash 205
317 Summary
The prior descriptions show that a number of evalu-ation designs of sufficient methodological rigour are available that can provide reliable empirical evidence about the impact of CCA projects This sec-tion gives advice on which design(s) to choose based on the respective project characteristics Here it is again important to note that the applicability of a design primarily depends on the aggregation level at which an impact is generated (cf Section 1) Accord-ingly since many CCA projects operate on more than one level a combination of two or more evalu-ation designs might be necessary in order to assess the total impact balance of a project This complies with the need to combine qualitative and quantita-tive methods and triangulate data methods and researcher perspectives
At the individual level the decision which design to choose depends firstly on the existence of baseline data As explained in the previous sections three designs namely experimental quasi-experimental and regression discontinuity designs require such data This necessarily means that these designs can only be applied if they were drafted during the planning of the project If this is the case the next question is whether or not the beneficiaries were selected at random If this condition is also fulfilled in principle an experimental design can be applied provided sufficient resources are available to do so As described in 311 RCTs are quite costly due to the laborious data collection process which usually calls for the assignment of a large team to collect data It should also be said though that an RCT provides the highest internal validity and allows for clear impact attribution
If the project design does not allow for a random assignment of the treatment group a regression discontinuity design may also be feasible How-ever such a design requires the treatment group to be selected based on a specific outcome variable of interest (eg proximity to a disaster-prone area) If this is not the case a quasi-experimental design may be a feasible alternative The time and budget requirements of these two designs are compara-ble with those of an experimental design with the constraint that RDD might require a larger sample in order to identify sufficient cases that are close enough to the lsquothreshold levelrsquo to be compared With regard to the validity of the findings and their informative value we should add that while RDD-based evaluation findings are restricted to groups that are quite similar findings obtained using a quasi-experimental design can almost approxi-mate those of an RCT if the samples are adequately matched (eg with propensity score matching)
In case no baseline data has been collected before-hand two further rigorous evaluation designs may be used the pipeline approach and the panel design Both designs have further requirements the pipeline approach requires that the project be implemented sequentially (eg in different regions with differ-ent target groups) and the panel design that a larger sample size be available to enable reliable estima-tion of the impact It should also be considered that while a pipeline approach enables the attribution of impacts to an intervention a Panel Design lsquoonlyrsquo allows the contribution of an intervention to an observed change
If none of the above prerequisites can be satisfied most likely only a so-called ex-post facto design
3 Rigorous evaluation designs and exam
ples of applicability in climate change adaptation projects
Impa
ct E
valu
atio
n G
uide
book
for C
limat
e Ch
ange
Ada
ptat
ion
Proj
ects
34
with or without (single) comparison with a non-intervention group or with reconstructed baseline data may be possible However such a design is not regarded as lsquorigorousrsquo as it cannot provide for an attribution or contribution analysis
Based on these selection criteria the following deci-sion tree can be used to identify the lsquorightrsquo evaluation design for interventions that aim to generate impact at individual level
Figure 6 Decision tree for selecting an evaluation design for measuring impacts at individual level
Baseline data available
Random assignment of treatment group
Sequential implementation of project
yes no
yes
RCTQuasi-
experimental design
yes no
Pipeline approach
Regression discontinuity
design
Treatment group assignment according to specic criterion
Ex-post facto design (no RIE)
yes no
Panel design
yes
Large sample size possible
no (matter)
no
If an intervention aims to generate an impact at institutional level four rigorous evaluation designs are suitable Three of them have been previously introduced pipeline approach panel design and structural equation modelling (SEM) A potentially suitable design not discussed before is a time-series cross-sectional approach (TSCS) As already dis-cussed the pipeline approach requires a sequential implementation of the project in order to be appli-cable leaving three for those that are not As also discussed a panel design can only be applied if the sample (here of institutions eg governmental or non-governmental organisations enterprises) is large enough for statistical calculations (approx 30) If the intervention only focuses on a few institu-tions but at least about 10 repeated observations are possible then a TSCS might be the design of choice (see annex 54) Finally if none of these conditions can be fulfilled SEM is the only lsquorigorousrsquo option to
provide meaningful evidence about the impact of an intervention operating at the institutional level although it should be added that SEM like panel and TSCS designs can only provide for the estimation of its contribution On the positive side we should note that the latter three designs can be implemented with considerably less resources provided that sta-tistical data of sufficient quality are available for quantitative analysis
With regard to interventions geared to the system level (eg SWAPs government advice) the same selection of designs is basically available except the pipeline approach (due to the lacking comparabil-ity of sectors or countries for instance) Therefore in the following figure a joint decision tree for both intervention levels summarises the available choices of RIE approaches for institutional and system-level interventions
Phot
o copy
GIZ
Ran
ak M
artin
35
Figure 7 Decision tree for selecting an evaluation design for measuring impacts at institutional and system level
Sequential implementation of project
yes
Time-series cross-sectional approach
(see annex 54)
Structural equation modeling
yes no (matter)
Pipeline approach
Large number of repeated data collections possible
Panel design
yes
Large sample size possible
no (matter)
no
Decision tree for measuring system-level outcomes
Finally in table 3 on the next page all suggested RIE designs are listed with brief summaries of the impact level they are suitable for the project characteris-tics that must be in place the data time and budget requirements the validity of the analysis findings and their informative value (ie if they enable attri-bution or contribution analysis)
32 Providing reliable large-scale data
As outlined above empirical data is the founda-tion of any evaluation ndash and more or less of applied social sciences in general whether they are collected during the research process (ie lsquoprimary datarsquo) or reanalysed on the basis of statistical or documentary data (ie lsquosecondary datarsquo) Moreover impact evalu-ations mostly require data collections on a large scale in order to provide empirical evidence about the changes that have occurred in an interventionrsquos sphere of activity Such data is usually collected by means of a survey Surveys are used when mostly quantitative data from a considerable number of people eg all or a significant share of the projectrsquos beneficiaries non-beneficiaries or more generally residents of a certain area or particular social strata needs to be analysed During the data analysis sta-tistical parameters such as average means shares or distribution measures (eg standard deviation quan-tiles) of a given population (ie descriptive statistics) are calculated Provided that the data is collected from a random sample of sufficient size (see further elaborations below) probabilities regarding the val-ues and distribution of certain parameters in a larger
population can also be estimated (ie inferential sta-tistics) In the following the methodological aspects to be considered when collecting quantitative data by means of a survey are discussed with particular focus on an appropriate sampling strategy
Surveys often deal with knowledge opinions atti-tudes beliefs behaviours plans backgrounds devel-opments or assessments of the respondents The primary survey tool for data collection is the ques-tionnaire With a questionnaire (in contrast to an interview guideline) all respondents are asked the same questions in the same order The information gathered by a survey is often used to identify varia-tions of these parameters between different points in time (ie in order to identify developments) or dif-ferences between groups (eg in order to attribute the outcomes to a certain intervention or to reveal sys-tematic differences due to group characteristics such as gender age etc) or both With a survey infor-mation is collected in a systematic structured and mostly standardised way Structuring the subject of a survey means that not all potentially available infor-mation is relevant but only data that help to describe andor assess a certain measure development or framework characteristic Standardisation means that the respondents can choose from a number of answer options and that these options are grouped according to a predefined categorical system This means that the data is statistically calculable and consequently survey findings are comparable Such a categorical system can be dichotomous nominal ordinal or metric Table 4 contains an example of each single-choice question
3 Rigorous evaluation designs and exam
ples of applicability in climate change adaptation projects
Impa
ct E
valu
atio
n G
uide
book
for C
limat
e Ch
ange
Ada
ptat
ion
Proj
ects
36
Table 3 Required project characteristics and data
Evaluation design
Impact level Required project characteristics
Data requirements Time and budget requirements
Validity of findings Explanatory power
Experimental (RCT)quasi-experimental
Micro (individual) level
z Distinguishable treatment group
z RCT requires random assignment to treatment and comparison group
z Ex-ante (baseline) and ex-post data from treatment and controlcomparison group
z Depending on the size and accessibility of the target group
z Data collection process often quite costly as a large team of enumerators is needed
z RCT has highest internal validity
z Internal validity of quasi-experimental design depends on selection bias
z External validitytransferability depends on comparability of framework conditions
z Enables impact attribution at target group level given a sufficient sample size
Propensity score matching
Micro level z Discriminable treatment group
z Individual characteristics relevant for the treatment effect (covariates) must be observable
z Ex-ante and ex-post data from treatment and comparison group
z Data collection must include covariates
z Increases the costs of quasi-experimental designs as usually larger samples are necessary in order to identify sufficient matches
z Comparison group sample must be considerably larger
z Internal validity depends on completeness of covariates
z External validitytransferability depends on comparability of framework conditions
z Same as above
z Application in quasi-experimental designs can contribute to improved quality of findings
Pipeline approach
Micro and meso (institutional level)
z Project needs to be implemented in phases
z Treatment groups of each phase must be comparable
z Ex-ante and ex-post data from each group
z In principle comparable to quasi-experimental designs whereby costs increase with every round of data collection
z Internal validity of quasi-experimental design depends on comparability of groups
z External validity depends on comparability of framework conditions
z Same as above
z Allows for identifying time-variant effects if applied according to quasi-experimental design
Regression Discontinuity Design
Micro level z Treatment group must be selected according to a specified criterion
z Sufficient number of comparable cases
z Larger sample size than for experimentalquasi-experimental
z Comparable with quasi-experimental design mostly depending on sample size
z Internal validity restricted to comparable cases
z Enables impact measurement for individuals who have similar characteristics
Time series All levels z Panel focusing on individuals households organisations
z TSCS focusing on sectors countries regions
z Panel large sample size few repeated data collections
z TSCS sample size irrelevant large number of repeated data collections
z Depending on data availability individual data collections can be implemented quite cost-efficient
z Costs increase with length of panel and sample size
z Panel validity depends on compliance of sample size with statistical requirements (cf 331)
z TSCS validity is restricted to sample
z Provides reliable assessments of the contribution of an intervention to an observed change
z Makes it possible to control time-variant influences
Structural Equation Modelling
Meso and macro (system) level
z Focusing on entire sectors countries regions
z Statistical andor empirical data for each model- relevant construct
z Depending on data availability can be implemented cost-efficiently if combined with statistical data
z Validity depends on model fit (ie to what extent the endogenous construct is explained by the model)
z Enables contribution assessment and time-variant and invariant influences
37
Table 4 Example of question types
Question type Question Answer options
Dichotomous question What is your gender male female
hellip with nominal scaled answer options Where do you come from area 1 area 2 area 3 other area ________________
hellip with ordinal scaled answer options How do you assess the development of your livelihood situation in the last year
Deteriorated considerably Deteriorated slightly Did not change at all Improved slightly Improved significantly
hellip with a metric scaled answer option What is your monthly income _____ euromonth
It has to be added that for ordinal-scaled answer options that reflect a rating (eg satisfaction quality) it is important to lsquobalancersquo the answer options mean-ing that an equal number of positive as negative answer options must be provided in order to avoid biased findings
Besides single-choice questions there are also multi-ple-choice questions for example
What are your income sources (multiple answers possible)
Farming Livestock Fishery Temporary work Other hellip None
When analysing multiple-choice question data it has to be taken into account that it might be necessary (eg for calculating average means) to transform the data into separate lsquodummy variablesrsquo with dichoto-mous scales for each answer option (ie yesno for farming hellip for livestock etc)
When a survey is conducted its objectives and the information required to meet these objectives need to be considered first For this it makes sense to ask the following questions
Questions for identifying the survey objectives
` Which indicators need to be measured ` Who will use the information and how
Which decisions are depending on the survey findings
` Are there any particular expectations about the survey findings When are the findings of the survey considered positive or negative Or what would be a good or a bad finding
` Which information can the respondents pro-vide How does this match the information needs
` Which factors could have a negative impact on data collection Do the respondents have and remember the necessary information Might they be reluctant to answer Do they have the (verbal cognitive) capacities to answer correctly
Selecting a survey approach
After having defined the surveyrsquos objectives and information needs the survey approach can be specified giving consideration to the available and required resources The required financial human and time resources mainly depend on the size of the population that has been defined (as the target or comparison group) its spatial distribution and the logistical framework conditions in the area where the survey is implemented Furthermore the length and complexity of the questionnaire considerably influences your resource demands In order to get a better idea of how much time is needed it may be helpful to prepare a list of the individual tasks and estimated time needed for each task such as clarify-ing the survey objectives and sampling approach designing and testing the questionnaire collecting managing and analysing the data and reportingcommunicating the survey findings The following table shows what such a to-do list might look like
Phot
o copy
GIZ
Ala
n W
alsc
h
3 Rigorous evaluation designs and exam
ples of applicability in climate change adaptation projects
Impa
ct E
valu
atio
n G
uide
book
for C
limat
e Ch
ange
Ada
ptat
ion
Proj
ects
38
Table 5 Exemplary to-do list for preparing a survey
Task When Who Requirements
Clarification of survey objective First two weeks in January Project staff Results framework sample selection
Development of draft question-naire
By 31 January Evaluator in coordination with project staff
Clarification of information needs development of survey items
Pre-test of questionnaire 1 to 10 February Evaluator together with enu-merator team
Logistical preparation informa-tion of target groups accessibil-ity of target groups
Finalisation of questionnaire By 15 February Evaluator Consolidated feedback from the pre-test
Implementation of survey 16 to 31 February Enumerators coordinated by evaluator
Logistical support by partner staff etc
Data entry 1 to 5 April Enumerators coordinated by evaluator
Availability of technical infra-structure (notebooks software etc)
Data quality check 6 April Evaluator Full data set
Data analysis 7 to 15 April Evaluator Quality-assured data set
Integration of survey findings into evaluation report
16 to 30 April Evaluator Data analysis findings
Presentation of findings 1 May Evaluator and project staff Technical infrastructure for presentation (notebook projec-tor etc)
On the basis of such a timetable the costs of the sur-vey can be estimated These usually comprise logisti-cal costs (eg for traveltransportation accommoda-tion per diems) expenses for survey materials and the remuneration of the survey team
Surveys are usually carried out face-to-face or elec-tronically mediated (eg by telephone email or a web-based application) Both face-to-face and elec-tronically mediated surveys can be self-administered (ie the respondent fills out the questionnaire) or assisted (ie the surveyor fills out the questionnaire or at least supports the respondent in doing so) As all options have their advantages and disadvantages aspects such as the complexity and comprehensibil-ity of the survey topics the skills and accessibility of the potential respondents and the available time budget and human resources need to be considered Particular attention has to be paid to the aspect of the confidentiality of the information and the ano-nymity of the respondent when personal data (eg age income health status) are collected Ensuring anonymity is often an issue when it is necessary to be able to trace responses to individuals such as in panel surveys (cf 315) or when third parties (eg project staff beneficiaries) are tasked with data collection In those cases it might be necessary to separate the personal data from the survey data and link the data sets using a list of identification codes which can only be accessed by the people who are tasked with analysing the data
Selecting a sample
Due to time and budget constraints it is often not feasible to conduct a full population survey ie col-lect data from every potentially relevant respondent (eg beneficiary project participant) In such a case it is necessary to collect a sample ie to select respond-ents from the population However the findings of a sample population might be different to those from a survey of the entire population These disparate findings are induced by the so-called selection bias (see also 311) which can be reduced by various sam-pling techniques The common objective of these techniques is to approximate the sample characteris-tics to the characteristics of the full population rele-vant for the survey (eg the share of male and female respondents or the share of respondents from rural and urban areas) Doing so is necessary in order to draw conclusions from the survey findings with ref-erence to that population bearing in mind certain statistical quality criteria as further outlined below
In order to draw such conclusions the size and dis-tribution of the population for which the sample should provide representative findings needs to be identified For instance if the survey is to be used to identify the impact of a certain intervention (eg nationwide information campaign) on the behaviour of target groups (eg farmers adopting a new farm-ing method) in different provinces then it needs to be determined who constitutes the basic population (ie all farmers of the country) and how it is distrib-uted among the provinces (eg number of farmers in each province)
39
Once the basic population has been identified two sampling strategies are available probability (ie randomised) and non-probability (ie non-ran-domised) sampling Probability sampling means that each individual of a given population has the same known non-zero probability of being included in the sample ie it is randomly selected Non-probabil-ity sampling means that the chance of being selected for the survey differs among the population (eg due to accessibility or ability to participate) In the latter case findings based on the sample may not be gen-eralised without giving further thought to how to establish representativeness 23 otherwise (see below)
Only probability sampling (ie random sam-pling) makes it possible to calculate statistical parameters that inform use of the true value of a parameter in a basic population
Probability sampling
If probability sampling is applied it is possible to draw statistically valid conclusions from the survey findings for a population bearing in mind three sta-tistical parameters the aspired margin of error the level of confidence and the degree of variability These criteria are briefly explained below
The margin of error (also called lsquosampling errorrsquo or lsquolevel of precisionrsquo) indicates the maximum differ-ence of the value of a certain characteristic between the sample and the population ie the range in which the true value of the population is estimated This difference or range is usually defined in per-centage points (eg 1 5 10) For instance if a 5 margin of error is defined and your sample shows that 50 of the respondents adopted a new farming method the actual proportion of the basic popula-tion who did so is somewhere between 45 and 55 This is subject to a certain level of confidence see next paragraph
The level of confidence expresses the probability with which the actual sample value lies within the before- mentioned margin of error It is based on the assumption that if a sample is repeatedly (ran-domly) drawn from a given population the average value of an observed characteristic in this sample approximates to the true value of this characteristic in this population Furthermore the sample values are distributed lsquonormallyrsquo around this true value (ie
23 It has to be added that lsquorepresentativenessrsquo is not a defined statistical term but rather colloquially used to signify that a sample has been composed according to the prevalence of particular characteristics of the basic population
their frequency distribution follows a specific so-called lsquoGaussianrsquo function see the following figure) In practice confidence levels of between 90 and 999 are usually chosen A confidence level of 95 for instance means that in 95 out of a 100 samples the sample value would lie within the margin of error as specified before In other words there is a 5 chance that the sample value will deviate from the true population value by more than the defined mar-gin of error
Figure 8 Distribution of sample mean values in relation to the true population mean value
True value of a certain characteristic of the basic population
Range of mean values in eg 95 of all samples
Finally the degree of variability refers to the het-erogeneity of the population with regard to an observed characteristic ie how this characteristic is distributed in the given population The more het-erogeneous the population the larger the sample size necessary to reach a certain level of precision In this context 50 is the highest degree of variability because it indicates that half of the population has a certain characteristic (eg has adopted a new farm-ing technique) while the other half does not Annex 56 contains an introduction on how to calculate the appropriate sample size bearing in mind the above- mentioned statistical parameters
Non-probability sampling
As probability sampling requires all respondents to be within reach during data collection regardless of the required resources it may not always be feasible to apply such a strategy In that case non-probability sampling may be applied which requires the iden-tification of characteristics of the basic population that are relevant for analysis in order to establish representativeness For instance if the survey is intended to enable conclusions about the extent to which the impact depends on age gender ethnic affiliation etc information needs to be gathered about the composition of these characteristics in the population We should mentioned that while with non-probability sampling it may be possible to
3 Rigorous evaluation designs and exam
ples of applicability in climate change adaptation projects
Impa
ct E
valu
atio
n G
uide
book
for C
limat
e Ch
ange
Ada
ptat
ion
Proj
ects
40
develop plausible assumptions about a population the quality of these assumptions cannot be tested statistically and thus rely solely on the expertise of the researcher For non-probability sampling three common techniques may help to approximate the sample composition to the composition of the basic population systematisation stratification and clus-tering
Non-probability sampling does not make it possible to calculate statistical parameters
The representativeness of a sample relies on the knowledge about the basic population
Systematisation is an option when sufficient data about the basic population is available so that in principle each potential respondent can be identi-fied Ideally a comprehensive list is available that is used to draw the sample according to a particular selection scheme based on the individual data Such a scheme can for instance be oriented towards a tar-geted sample size (eg every 10th person) on logis-tical considerations (eg one household from each street village etc) or a certain threshold level (eg only families with more than three children or below a certain income) Which scheme is applied basically depends on the intervention logic (eg activities aim-ing at the poor) and the intended type of representa-tiveness (eg equal spatial representation)
A particular way to receive more specific findings is to stratify a sample Stratification means that a predefined number of individuals from each ana-lytically relevant sub-group of a population (eg age groups residence areas gender) is included in the sample Here too data about the composition of the basic population is necessary at least on a global level The intention is usually to match the sample composition with the composition of the popula-tion ie ensure that the proportions of each sub-group in the sample and in the population are equal in order to achieve representativeness (ie propor-tional sampling) However it may also be necessary to draw a disproportional sample eg due to logisti-
cal or budget constraints (eg 100 households per region) If that is the case then the cases for each sub-group need to be weighted reciprocally during data analysis So if for example a certain group represents 20 of a basic population but has only a share of 10 in the sample its cases need to be weighted by the factor two during the analysis
Clustering a sample may be helpful if it can be assumed that the sub-groups of a population show a sufficient degree of intra-group homogeneity ie that the individuals in each sub-group are similar with regard to a certain research question and inter-group heterogeneity ie that the individuals of dif-ferent sub-groups differ considerably in that regard If for example a project focuses on both several urban and rural areas and differences of its effec-tiveness in these areas are to be analysed it might be sufficient to conduct a full-population survey in one urban and rural area instead of taking samples in each area provided the residents in the respective areas show some commonalities that are relevant for the analysis (eg high incomes in urban areas low income in rural areas)
Finally we should note that other techniques exist for non-probability sampling in addition to those outlined above However other techniques such as convenience sampling (ie selecting individuals who are easiest to reach) or theoretical sampling (mainly used in explorative qualitative research) may not be applicable in rigorous evaluation designs as it is unlikely that they provide representative data Hence these techniques are not further discussed here
We recommend the following books articles and working papers for further reading on methodological requirements to collect quanti-tative data by means of surveys
Fink A (2003) How to Sample in Surveys The Survey Kit 2 Edition Thousand Oaks Sage Publications
Israel GD (2012) Determining Sample Size Gainesville University of Florida
Phot
o copy
GIZ
Har
ald
Fran
zen
41
In this last chapter the outlined methodological options and requirements are discussed by means of a practical case study The case study is based on a GIZ project entitled lsquoUrban Management of Inter-nal Migration due to Climate Changersquo that began in January 2015 and is being implemented on behalf of BMZ in two cities in Bangladesh The objective of the case study is to illustrate the possibilities for pro-viding empirical evidence about project impacts by applying an elaborated evaluation design that satis-fies scientific standards It will also be investigated which organisational and logistical precautions need to be taken to enable efficient data collection and analysis After a brief description of the project (41) two exemplary designs for measuring its impact are presented (42) followed by a draft of their practical implementation (43)
41 Background and project objectives
In Bangladesh climate change is considered to be one of the most important challenges Climate-related internal migration is jeopardising the over-all social stability of the country Climatic changes induce extreme weather events such as floods extreme precipitation and droughts In Bangladesh 40 out of 64 districts are affected by the impacts of climate change According to estimations six mil-lion people have already migrated due to weather and climate stresses of whom the majority lives in urban slums Especially in Khulna and Rajshahi the proportion of migrants is very high (70 of slum dwellers are migrants) For poor and vulnerable households migration is a crucial diversification and adaptation strategy However this can lead to acute vulnerability and have conflict-exacerbating effects if migrants who live in urban slums with inadequate infrastructure no access to basic services or income opportunities receive hardly public support from local government and administrative structures It is true that the decision to migrate is multi-causal that means that it is due to political social economic
demographic and environmental factors However in the two preselected cities experts believe that cli-mate and weather-related stress factors play a domi-nant role in migrantsrsquo decision to leave their homes In Rajshahi rising temperatures and drought declin-ing groundwater levels and river flooding threaten the population whereas in Khulna the population faces storms and storm surges extreme precipita-tion water logging and groundwater salinisation According to estimates the urban population (today 34) will exceed the rural population (today 66) by 2040 if economic opportunities do not reach the countryside
The core problem in the current situation is that so far there are no needs-oriented measures to improve the living conditions of climate migrants 24 in Khulna and Rajshahi City master plans do not address the influx of migrants This problem is caused by a lack of capacity of local governments and municipalities to deal with the challenges of climate-related inter-nal migration Public investment in the development and expansion of a basic infrastructure to mitigate the pressure on resources such as water energy food and housing is insufficient There is a lack of poli-cies and measures to manage settlement develop-ment Nor is there any data or information base on the movement of climate migrants to cities and their (urgent) needs This situation leads to an explosion of the population in these urban areas increasing pov-erty congested infrastructure and basic social ser-vices shortages of resources increasing distribution and opportunity conflicts and eventually reduced economic development opportunities for the entire population As urban development is a priority of the 6th Five-Year-Plan 2011ndash2015 (ie infrastruc-ture development promotion of economic activi-ties) national policies indicate that there is potential for change However there is a considerable gap between strategy and implementation
According to this situation the objective of the pro-ject is to improve the living conditions of climate migrants in preselected settlements in the divisional capitals Khulna and Rajshahi through needs-ori-ented measures 25
24 The International Organization for Migration (IOM) produced a definition of climate migrants as lsquopersons or groups of persons who for compelling reasons of sudden or progressive changes in the environment that adversely affect their lives or living con-ditions are obliged to leave their habitual homes or choose to do so either temporarily or permanently and who move either within their country or abroadrsquo
25 Since it is an integrative approach other inhabitants of the set-tlements will also benefit from improved basic urban services vocational training and temporary employment opportunities
4 Case study Urban Management of Internal Migration due to Climate Change
Impa
ct E
valu
atio
n G
uide
book
for C
limat
e Ch
ange
Ada
ptat
ion
Proj
ects
42
Four indicators were defined to achieve the project (module) objective
y In Khulna and Rajshahi X inhabitants of Y lsquohot-spotsrsquo with a high concentration of climate migrants have improved access to basic urban services (eg water energy or sewage systems through well drilling solar home systems or the construction of drainage ditches)
y In Khulna and Rajshahi X inhabitants of Y hot-spots with a high concentration of climate migrants have participated in labour-intensive measures for the expansion and building of a cli-mate-resilient basic infrastructure of whom Z are women
y In Khulna and Rajshahi in Y hotspots with a high concentration of climate migrants participants in needs-based general education and vocational training courses increased their income by X
y In each city the city corporations developed and tendered X project proposals for needs-based and labour-intensive measures for the expansion and building of climate-resilient basic urban ser-vices (eg health education water energy supply waste waterrefuse) as well as for the promotion of local economic development with the support of the Ministry of Social Welfare
In order to achieve this objective the project focuses on three intervention areas for which particular measures are currently being planned
1 Providing access to social services to the target groups by improving and extending existing services and adapting them to the needs of the migrants (eg finding social housing providing health and sanitation services) and raising the awareness of social workers for the needs of cli-mate migrants
2 Providing short-term income opportunities through labour-intensive work in and outside slum areas and providing access to basic infra-structure by its improvement together with city corporations and civil society
3 Providing long-term income opportunities by developing and implementing skills develop-ment measures in cooperation with training cen-tres and formal and informal SMEs in different sectors
Various Capacity Development measures will be implemented by long-term and short-term experts and financial support will be provided to upgrade slums and enhance resilience Particularly in the third intervention area cooperation is also planned with the local economy and training providers
It should be highlighted that the project is the first of its kind in German development cooperation to deal with the issue of climate-induced (internal)
migration The project therefore has an innovative and pilot character and aims to showcase a variety of measures to deal with climate-induced internal migration The integration of climate change adapta-tion into urban development planning and the con-tinuation of successful measures will be strengthend by other projects implemented by GIZ KfW and BGR
Selection of an impact evaluation design
In order to decide which evaluation design(s) could be suitable for measuring the impact of the project it makes sense to revisit the table at the end of Sec-tion 31 that summarises the characteristics and requirements of the discussed designs Looking first at the required project characteristics we should consider where the project aims to generate tangi-ble results that can be empirically verified Accord-ing to the project description the measures target climate migrants who constitute a distinguishable target treatment group as they are a sub-population of the entirety of residents in the intervention areas This treatment group however is not randomised but rather selected based on predefined criteria such as the settlements (lsquohotspotsrsquo) and their socio-eco-nomic status (lsquoclimate migrantsrsquo) Hence an experi-mental design does not come into consideration As the project description does not indicate a sequen-tial implementation of the measures a pipeline approach is also out of the question However if the project is scaled up at a later stage such an approach would still be feasible based on the data gathered by the design proposed below
Another feature of the treatment group is that it has individual characteristics that are likewise relevant for their selection and the treatment effect As these characteristics are in principle observable (eg eco-nomic situation migration background family sta-tus) both propensity score matching and a regression discontinuity design are in principle feasible With regard to the long-term measurement of treatment effects and their sustainability beyond the project implementation period a household panel appears to be suitable However according to the description of the framework conditions the migrant population fluctuates considerably Such a fluctuation will prob-ably result in a very high panel mortality ie par-ticipants dropping out from the sample that would undermine the significance and reliability of the findings Another feature of the project is that it does not focus solely on directly supporting individual climate migrants but also aims at improving social services and basic infrastructure which again should contribute indirectly to the improvement of the liv-ing conditions of these migrants and the population in the intervention areas at large Such a lsquosystemicrsquo approach calls for the use of structural equation
43
models which make it possible to measure the influ-ence of changed framework conditions on a popula-tionrsquos livelihood
Coming next to the data requirements the selec-tion of particular settlement areas makes it possible to create comparison groups ie migrants who are not supported by the project Furthermore as the evaluation is planned before the project activities start it should be possible to collect baseline data from both the treatment and comparison groups Since the project description does not provide any indication that measures in the selected settlements will be restricted to a certain sub-population of the potential target groups (ie there is no threshold level according to which the beneficiaries are selected) comparison groups need to be selected in spatially
remote areas This again makes it impossible to apply an RDD approach Nor would an RDD be recom-mended if such a restriction were made because the design of the measures facilitates spill-over effects which will likely bias the comparison findings With regard to the system-oriented measures the development of SEMs should be feasible provided that statistical or empirical data can be made avail-able for the required models throughout the project implementation (ie by the continuous results-based monitoring system) This is required to describe the relevant elements that constitute the framework conditions of the migrant population The following table summarises the applicability of the different evaluation designs based on the project characteris-tics
Table 6 Applicability of evaluation designs
Evaluation design Required project characteristics
Full-filled
Data requirements Full-filled
Experimental (RCT)
Distinguishable treatment group Ex-ante (baseline) and ex-post data available from treatment and control group
Random assignment to treatment and comparison group
ndash
Quasi- experimental with PSM
Distinguishable treatment group Observable individual characteristics relevant for the treatment effect
Pipeline approach
Sequenced project implementation ndash Ex-ante and ex-post data available each group na
Comparable treatment groups in each phase
na
RDD Selection of treatment group according to a specified criterion Sufficient number of comparable cases
(close to a threshold level)ndash
Time-series Panel focusing on individuals households organisations Panel large sample size few repeated data
collectionsndash
TSCS focusing on sectors countries regions
ndash TSCS sample size irrelevant large number of repeated data collections
na
SEM Focusing on entire sectors countries regions Statistical andor empirical data for each
model-relevant construct Unlikely to be achieved due to foreseeable panel mortality
Since PSMs and SEMs appear to be the most promis-ing approaches to measure the impact of the project we will go on to outline how the data collection pro-cess could be organised and what the related meth-odological and practical requirements are
42 Practical implementation
Starting with PSMs it first has to be clarified who constitutes the treatment and comparison group and how appropriate samples can be selected In the second step the hypotheses to be tested and the necessary indicators have to be developed Then we
need to consider which covariates have to be col-lected in order to enable the matching of cases (eg age gender place of origin duration of stay in target area education level ethnic affiliation marital sta-tus) Finally the data collection plan and instruments have to be developed
Based on the project description it is easy to iden-tify who should belong to the treatment climate and floating migrants in selected settlements as well as other poorest people in Khulna and Rajshahi Equally easy to identify is who should belong to the compari-son group climate migrants in settlements in these cities where no project activities are implemented If such settlements cannot be identified it would also
4 Case study U
rban Managem
ent of Internal Migration due to Clim
ate Change
Impa
ct E
valu
atio
n G
uide
book
for C
limat
e Ch
ange
Ada
ptat
ion
Proj
ects
44
be acceptable to choose climate migrants in other cities who face the same problem provided these cities are comparable in terms of the characteris-tics that were decisive for the selection of the pro-ject location As it can be assumed that the targeted population is rather large and the actual proportion presenting the characteristic of interest (improved living conditions) is not known beforehand the sample size should be calculated according to the first formula outlined in Section 56 (annex) The for-mula approximates a sample size of 400 for infinitely large populations with a level of confidence of 95 and an aspired margin of error of 5 26 Consider-ing the conceivable attrition loss during the data collection process a target gross sample size of 600 for the treatment group and at least 800 to 1000 for the comparison group (in order to receive sufficient matches) should be aimed at Depending how the dissimilarity of the socio-economic framework con-ditions in Khulna and Rajshahi is assessed it further has to be decided whether it is sufficient to split one sample across both cities ndash ie if they are generally comparable ndash or if the sample size needs to be dou-bled ndash ie if the framework conditions differ consid-erably with regard to the characteristics of interest
Next it has to be decided which hypotheses are to be tested and which data needs to be collected So far the project objective has been operationalised by four indicators of which three directly refer to the living conditions of climate migrants (1) access to lsquourban basic servicesrsquo (2) participation lsquoin labour-intensive measuresrsquo and (3) having an lsquoincreased incomersquo Leaving aside the question whether these indicators cover the entirety of factors that define the quality of lsquoliving conditionsrsquo ndash which however needs to be revisited during the development of the data collection instruments ndash it has to be clarified what information is needed to verify or disprove their achievement With regard to the first indicator such information would comprise for instance data on the types of existing services their general acces-sibility and finally the actual use of these services by the target group Of course such data would have to be collected for both the treatment and comparison group before and directly after the project imple-mentation and ideally again another three to five years later in order to assess the sustainability of the project measures
26 It should be noted that the proposed level of confidence and margin of error represent the lowest common accepted param-eters for inferential statistics It is up to the evaluation team to decide on stricter values which however will result in a need to collect considerably larger samples
Concerning the second indicator it may seem easy to provide empirical evidence about its achievement ie by comparing the factual number of participants with the targeted number It is however question-able whether the indicator actually makes it pos-sible to measure an impact since participation in a labour-intensive measure does not say anything about the living conditions of the migrants Since the outcome of their participation (eg the generated income and created infrastructure) can rather be considered to influence their living conditions it is recommended to revise this indicator
While the relevance of the third indicator for the impact to be measured is again clear it must be borne in mind that the findings are likely to be biased by contagion effects ie that income has been increased by sources other than the ones created by the project Therefore further qualitative data needs to be collected on the income sources and how and why they were obtained Furthermore it has to be remembered that providing information about onersquos own income may be a sensitive issue Hence data on proxy indicators such as private properties number of meals per day or school attendance of children (etc) has to be collected
In order to obtain a comprehensive picture about the net impact of the project it is further necessary to also gather information about its unintended positive and negative impacts Therefore it must be considered who else apart from the migrants might be affected by the project activities which secondary effects could be caused or how the project objectives interfere with partner strategies andor the activities of other donors For assessing the effectiveness of the particular project measures and helping to attribute the observed effects it is also necessary to collect data on the participation of the target group (eg in labour-intensive or training measures)
Finally to enable matching of the treatment and comparison group data covariates need to be col-lected that have to comply with the lsquostability cri-terionrsquo outlined in Section 53 This could be for instance the origin of the migrant his or her ethic and religious affiliation age gender and family sta-tus etc However we also have to bear in mind not to use variables such as profession socio-economic sta-tus type of migrant and so on as the project meas-ures (eg further training income generation) may influence these characteristics
The following table summarises the indicators data requirements data collection instruments and anal-ysis methods discussed above that would be part of the data collection plan for the migrant survey
45
Table 7 Draft (simplified) data collection plan
Indicator Required data Data collection instrument
Data analysis method
Improved access to basic urban services
Types of services provided Document analysis observation (for empirical verification)
Qualitative comparative analysis
General accessibility of service A B C hellip further operationalized eg by number and distribution of access points costs per service use capacities of service in terms of no of customers per day service can be provided to
Document analysis observation migrant survey
Qualitative and quantitative (double-difference) comparative analysis
Actual use of services by migrants disaggregated by eg types used frequency of use by type costs of use in relation to income
Migrant survey focus group discussion
Quantitative comparative analysis
Increased income Current income and income sources of migrants (operationalized by proxy indicators)
Migrant survey Quantitative comparative analysis
Further indicators for measuring the living conditions of the migrants
Further indicators for measuring the unintended effects of the projects
Further indicators about participation in project measures
Covariates eg origin ethnic and religious affiliation age gender family status
Migrant survey Used for calculating the propensity score
The draft shows that there are a number of blank spots that need to be looked into further regarding the operationalisation of impacts the project activi-ties and the covariates required for matching
Coming now to the structural equation model-ling (SEM) the first step is to identify the constructs that are relevant for the model Without further knowledge about the framework conditions and project measures such a model can only be roughly sketched However based on the project design its outputs in the three intervention areas (in terms of the capacities created for basic urban services train-ing as well as short-term and long-term income opportunities) can be considered as exogenous con-structs that aim to influence the living conditions of the migrants A further exogenous factor would be the general framework conditions as determined by
political strategies (eg government budget alloca-tion to infrastructure development) or economic societal and environmental developments (eg regional economic power number of small and medium enterprises migrant influx annual precipi-tation) Here we should consider whether it makes sense to further split up this construct due to its heterogeneity The living conditions of the migrants would represent the endogenous construct whereby the constitution of basic service infrastructure in the settlements could serve as another mediating construct This is on the one hand influenced by the framework conditions and the project activities and on the other hand has an influence on the living con-ditions of the migrants The following figure shows a (highly) simplified illustration of the SEM based on this outline with a few exemplary indicators for each construct
Phot
o copy
GIZ
Elm
ar F
oellm
i
4 Case study U
rban Managem
ent of Internal Migration due to Clim
ate Change
Impa
ct E
valu
atio
n G
uide
book
for C
limat
e Ch
ange
Ada
ptat
ion
Proj
ects
46
Figure 9 Simplified SEM for the GIZ project 33
Budget allocated to IF2
No of migrants in labour
No of basic services
No of customers served
School attendance of children
Self-assessed living conditions
Budget allocated to IF3
No of migrants trained
Budget allocated to IF1
No of migrants with access to
Budget for infrastructure
Migrant influx
No of SME
Total project budget
Partner contribution
Socio-econ FC
PO in IF2 (labour)
Project resources
PO in IF1 (access)
PO in IF3 (training)
Consti-tution of
infrastruc-ture
Living con-ditions of migrants
The figure shows that some of the measurement models are formative (project resources socio-economic framework conditions) while others are reflective (constitution of infrastructure achieve-ment of project outputs in the fields of intervention and living conditions of the migrants) Of course further constructs measurement models and struc-tural elements and relationships are conceivable There is however a need to define which elements the model requires in order to adequately reflect the lsquorealrsquo project situation and to enable measurement of the changes in its fields of intervention The appli-cation of the SEM requires the regular collection of the respective data ndash at least on an annual basis ndash to be able to calculate the parameters for assessing the project contributions Accordingly the indica-tors have to be included in the project monitoring system which should be developed in the course of the baseline study The latter is the first step of the impact evaluation
According to the outlined design the practical implementation of the impact evaluation should start with an in- depth document analysis and the elaboration of a detailed work plan specifying the
27 The figure was drawn using SmartPLSreg a software for developing variance-based SEMs
individual steps of data collection and analysis and the respective responsibilities Ideally before starting with the baseline study an exploratory preliminary mission should be conducted in order to gain further information for complementing the data collection plan (ie on the availability of data sources further needs of the target groups and other active actors in the intervention area) Furthermore the avail-ability of secondary data and the accessibility of the migrants for data collection the logistical require-ments and general feasibility of the evaluation design should be investigated
Once the data collection plan is finalised the data collection instruments (ie interview guidelines guidelines for focus group discussions question-naires) can be developed and tested In so doing par-ticular focus has to be placed on the socio-cultural adequacy of the instruments (eg appropriate and easy-to-understand language clear commonly understood categories in closed questions) and ndash as the survey will most likely be administered ndash the required qualifications of the interviewers (eg use of questionnaire particularly following the filtering procedure coding of answers ability to explain ques-tions if not understood by interviewees social skills)
FC framework conditions PO project outputs IF intervention field
47
After successful testing and finalisation of the instru-ments and interviewer training a sampling proce-dure should be identified that allows for randomi-sation eg by random walks through the selected settlements or by randomly selected spots (if reliable maps are available) Data collection should then start ideally simultaneously with the treatment and com-parison group in order to minimise time-induced bias Provided that the data has been collected according to the previously defined methodologi-cal standards the analysis will provide a picture of the migrantsrsquo current living conditions This will be based not only on the assessment of a few represent-atives andor experts but on a sound statistical foun-dation that makes it possible to transfer the sample findings to the entire target population This baseline data will also serve as the comparison base at a later stage for calculating the project impact
At the end of the baseline study a framework for the continuous results-based monitoring system should be developed As the monitoring system will not only be used for continuous reporting on project progress but also for the SEM analysis after project comple-tion the indicators used must satisfy the informa-tion needs of the model and thus not only focus on the project outcomes and impacts but also include data about the framework conditions The data col-lection instruments have to be adapted to suit these requirements Furthermore the timing of the con-tinuous data collection and the responsibilities have to be coordinated Given the three-year project term it may make sense to agree on a six-monthly or even quarterly collection in order to gather sufficient data (about eight to 10 cycles) for robust model calcula-tion If the measures need to be adapted during pro-ject implementation the indicators and maybe even the model need to be revised likewise
At the end of the project a second migrant survey has to be implemented according to the same meth-odological standards as for the baseline study In
combination with the baseline data the findings of that survey will be used for impact measurement and attribution as described in Section 311 Provided that the evaluation team has managed to gather the required data in line with the discussed require-ments the findings should enable valid and reliable attribution of the observed changes in the living conditions of the migrants to the project measures Due to the broad analytical perspective of the evalu-ation it should also be possible to document possible unintended effects as well as the influence of exter-nal (confounding) factors
However the project measures are not solely designed to improve living conditions in the short term Long-term effects and sustainability of the project impacts (eg climate resilience of built infra-structure) are also of interest In order to assess such long-term impacts another evaluation needs to be conducted It is recommended to conduct such an ex-post evaluation about three to five years after the project has been completed
As such an ex-post evaluation poses particular prac-tical challenges particularly regarding the retrieval of the former beneficiaries access to public authori-ties or logistical support on site (in case the imple-menting agencies are not active there anymore) it is of utmost importance to announce such an investi-gation during the project implementation phase in order to get sufficient support at a later stage There-fore all partners and further stakeholders should be made aware of its importance and supported in establishing adequate structures for future data col-lections Ideally a Memorandum of Understanding (MoU) could be agreed upon in which the responsi-bilities are clarified In return the partners could be supported in developing their own monitoring sys-tem which again might contribute to their owner-ship and understanding of the usefulness of collect-ing such data
Phot
o copy
GIZ
Ran
ak M
artin
4 Case study U
rban Managem
ent of Internal Migration due to Clim
ate Change
Impa
ct E
valu
atio
n G
uide
book
for C
limat
e Ch
ange
Ada
ptat
ion
Proj
ects
48
We will go on to present the individual tasks accord-ing to the proposed practical implementation of the impact evaluation in chronological order including
a rough estimation of the required time resources for each step
Figure 10 Draft schedule for impact monitoring and evaluation framework
` Document analysis selection of evaluation design development of a work plan (about 5 ndash 8 working days (WDs) depending on the amount of available documents)
` Exploratory preliminary mission gathering qualitative data for accomplishing the data collection plan checking the availabilityaccessibility of data sources and the feasibility of data collection (about 3 WDsrsquo preparation 3 days of travel 10 ndash 12 WDs on site 5 WDs for writing an inception report)
Preparatory tasks
` Adaptation of data collection instruments development of a resource plan and assignment of responsibilities (roughly 3 WDs)
` Implementation of monitoring system regular data collection according to data collection plan revision of data collection instruments as required (eg changing of project measures) (roughly 1-2 WDs per month depending on the monitoring data to be collected)
` Regular data analysis and reporting (about 3 ndash 4 WDs per report cycle)
` Finalisation of the data collection plan development and pre-testing of the data collection instruments (about 8 ndash 10 WDs depending on the selection of instruments and accessibility of target groups)
` Collection of baseline data data analysis and reporting (about 20 ndash 30 WDs for data collection depending on the number of available enumerators and logistical support on site about 10 WDs for data analysis 10 ndash 15 WDs for reporting incl results presentation and finalisation of ex-ante evaluation report)
` Preparation of a framework for continuous results-based monitoring system specification of indicators and data collection plan (about 5 WDs in collaboration with project team)
Baseline study
(ex-ante evaluation)
2015
` Adaptation of data collection plan and instruments review of monitoring data further document analysis (official statistics project documents etc) (about 5 ndash 8 WDs)
` Collection of final evaluation data data analysis and reporting (about 20 ndash 30 WDs for data col-lection depending on the number of available enumerators and logistical support on site about 15 WDs for data analysis 10 ndash 15 WDs for reporting incl results presentation and finalisation of ex-ante evaluation report)
Final evaluation
2018
` Adaptation of data collection plan and instruments further document analysis (approx 5 ndash 8 WDs) ` Collection of ex-post evaluation data data analysis and reporting (approx 20 ndash 30 WDs for data collection depending on the number of available enumerators and logistical support on site about 15 WDs for data analysis 10 ndash 15 WDs for reporting incl results presentation and finalisa-tion of ex-ante evaluation report)
Ex-post evaluation
20212223
Continuous results- based
monitoring2015 ndash 2018
Winding up we should point out that the above design and suggestions for its practical implementa-tion can only serve as a rough sketch which of course needs to be further elaborated during the inception phase of the research For the sake of convenience gender-related aspects or further aspects related to the living conditions of the migrants such as access to health services or education have not been dis-cussed Also the factually available resources for the evaluation and the logistical and practical feasibil-
ity of the data collection cannot be assessed without further information about the project concept and the framework conditions All the more important then to start the evaluation with an in-depth scop-ing phase to ensure appropriate data collection and analysis throughout the evaluation Valid and reli-able evaluation findings can only be produced with high-quality data In other words If the data is poor no design will save the day
49
Ndeg Project name Inst Country Design Data collection instruments Methodology
1 Noakhali Rural Development Project
Danida Bangla-desh
Ex-post facto
Quantitative analysis of project monitoring and contextual data Qualitative analysis documentary study archival work questionnaire surveys stakeholder and informant interviews rep-resentative surveys of project components assessment of buildings roads and irriga-tion canals village surveys and interviews observation focus group discussion case studies
Mixed-method approach
2 Climate Finance Readiness Pro-gramme
BMZ
GIZ
KfW
Global
3 National Ad-aptation Plan Global Support Programme
UNDP UNEP GEF
Global
4 Africa Adaptation Programme
UNDP WFP UNIDO UNICEF
Africa-wide
5 Strategic Ini-tiative to Address Climate Change in LDCs
UNDP Global
6 Climate Support Programme (CSP)
GIZ
BMU DEA
South Africa
NA ndash still ongoing
7 Public Invest-ment and Climate Change Adapta-tion (IPACC)
BMUB
GIZ APCI Ministries regional govern-ments of Cusco amp Piura
Peru (Cusco and Piura)
NA ndash still ongoing
8 Climate Change Adaptation in Rural Areas of India (CCA RAI)
GIZ BMZ
ministries Govern-ment of India govern-ments of federal states
India (Madhya Pradesh Rajasthan Tamil Nadu and West Bengal)
9 Sustainable agri-cultural develop-ment (PROAGRO I and II)
BMZ GIZ
SIDA ministries VIPFE
Bolivia (Chaco Northern Potosi Southern Cocha-bamba Valles)
Mid-Term Evalua-tion
Mainly qualitative evaluation design analysis of primary and secondary data semi-structured interviews and surveys with national counterparts strategic partners and target groups direct observation focus group discussions
Mainly qualitative evalua-tion design
5 Annex51 Overview of current CCA related-project evaluations
Impa
ct E
valu
atio
n G
uide
book
for C
limat
e Ch
ange
Ada
ptat
ion
Proj
ects
50
Ndeg Project name Inst Country Design Data collection instruments Methodology
10 Transboundary water manage-ment with the Mekong River Commission
BMZ GIZ
BMUB
Mekong River Commis-sion
Cambo-dia Laos Thailand Vietnam
NA ndash still ongoing
11
Rural Finance and Community Initiatives Project
IFAD The Gambia
Quasi-experi-mental
Field-level questionnaires focus group discussions interviews with key informants and case studies of the various community-based organisations and their members
For impact assessment the mission relied on a quanti-tative survey and participa-tory rural appraisal (PRA) exercise
12 Ghana Water Programme
CIDA Ghana Before-after
Document review key-informant inter-views internal benchmarking data from project reviews used for before vs after limited resources did not enable ex-post surveys
13 Chronic vulner-ability to food insecurity
WFP Kenya Experi-mental
Literature reviewsecondary data analysis Key Informant Discussions Participatory Vulnerability Profiles Field visits Focus Group Discussions
Study triangulates data from qualitative and quantitative sources It uses qualita-tive data from focus group discussions with community members and key-inform-ant interviews with com-munity opinion leaders and quantitative data involving about 3000 randomly sam-pled households
14 Food and Cash for Assets (FCFA) on Livelihood Resilience in Bangladesh
WFP Bangla-desh
Before-after approach
Document review On the quantitative front a household survey was conducted that covered 1500 households of participants non-participants and the comparison group Qualitative data were collected through focus group discus-sions asset assessments key-informant interviews semi-structured interviews
Mixed-method approach was adopted Participatory rural appraisal (PRA)
15 Impact of Food for Assets on Livelihood Resilience in Guatemala
WFP Guate-mala
Quasi-Experi-mental
Document review secondary data analysis and institutional Analysis community pro-file asset assessment institutional analysis household survey focus group discussion semi-structured interviews
Mixed-method approach Quantitative survey at the household level qualitative assessment of impacts at household and community levels assessment of tech-nical and biophysical assets in each community social and institutional analysis of networks and linkages at different levels especially communities
16 Impact of Food for Assets on Livelihood Resilience in Senegal
WFP Senegal Quasi-experi-mental
Document review household survey obser-vation village profiles gender-disaggregat-ed focus group discussions semi-structured interviews with major stakeholders asset assessments
Mixed-method Approach data triangulation
17 Effects of Climate Variability and Change on Household Food Sufficiency among Small-Scale Farmers of Yatta District
Journal article
Kenya Experi-mental
Desk research use of questionnaires inter-views focus group discussions observa-tions participatory vulnerability profiles development of indigenous knowledge systems
Mixed-method approach
Crop production data using Krejcie amp Morgan formula commonly used to calculate a sample size (random sampling procedure) coefficients of variation were computed for annual precipitation and then cor-related to crop production using Pearson correlation coefficient
51
Ndeg Project name Inst Country Design Data collection instruments Methodology
18 Analysis of vulnerability and resilience to climate change-induced shocks in North Shewa
Journal article
Ethiopia Experi-mental
Secondary data analysis surveys structured questionnaire interviews focus group discussion vulnerability analysis expert judgment
Mixed-method approach principal component analy-sis correlation with past disaster events ordered probit regression model use of fuzzy logic random sampling procedure
19 Vulnerabil-ity of Farming Households to Environmental Degradation in Developing Countries Evi-dence from North Central Nigeria
Journal article
Nigeria Experi-mental
Survey was used to generate household level data
Principal component analysis was used to develop vulnerability index for individual household so as to classify households depending on their level of vulnerability to environmen-tal degradation impacts use of multi-stage random sampling technique cluster analysis ordered logit regression model
20 An Index to Determine Vul-nerability of Communities in a Coastal Zone A Case Study of Baler Aurora
Journal article
Philip-pines
Experi-mental
Secondary data analysis survey (face-to-face and random) questionnaire observa-tions mappingGIS resource mapping activity workshops
Indicator method index computations following a balanced weighted aver-age approach Pearsonrsquos correlation coefficient of determination
21 Assessing House-hold Vulner-ability to Climate Change The Case Of Farmers In The Nile Basin
IFPRI Ethiopia Experi-mental
Expert knowledge use of household-level socio-economic survey interviews
Mixed-method approach Indicator and econometric method Principal compo-nent analysis correlation with past disaster events
22 Cambodia Community-Based Adaptation Programme
UNDP Cambodia Experi-mental
Secondary data analysis primary data key-informant interviews un-structured in-dividual interviews site visits observations semi-structured discussions structured Focus Group Discussions
Mixed-method data triangulation inductive and deductive approaches using quantitative and qualitative data
23 Strengthen-ing Adaptation Capacities and Reducing the Vulnerability to Climate Change in Burkina Faso
UNDP Burkina Faso
Document review individual interviews group discussions field visits observation
24 National Pro-gramme for Man-aging Climate Change in Malawi and the Malawi Africa Adaptation Programme
UNDP Malawi Desk review of project semi-structured interviews field visits workshops
Mixed-method approach data triangulation
25 Adaptation to Climate Change in the Nile Delta through Integrat-ed Coastal Zone Management
UNDP Egypt Document review and analysis (desktop study) interviews and meetings (face-to-face and by telephoneSkype and email questionnaires data collection in the field (interviews direct observations)
26 The Hill Maize Research Project
USAID Nepal Experi-mental
Secondary data published and unpublished documents and reports quantitative and qualitative tools Primary data structured and pre-tested questionnaire (household level) semi-structured checklist with a number of open-ended questions (community level) focus group discussion key-informant interviews using similar semi-structured checklist with open-ended questions data collected from key informants and focus group surveys were used for descrip-tive and qualitative analysis whereas those collected through household survey were used for quantitative analysis
Mixed-method approach randomised controlled trial propensity score matching (PSM)
5 A
nnex
Impa
ct E
valu
atio
n G
uide
book
for C
limat
e Ch
ange
Ada
ptat
ion
Proj
ects
52
Ndeg Project name Inst Country Design Data collection instruments Methodology
27 Small-Scale Irri-gation Manage-ment Project
JICA Indonesia Experi-mental
Household surveys direct interviews Focus Groups Discussions
Mixed-method approach propensity score match-ing regression disconti-nuity design estimation strategy T-test estimation of average treatment effect balancing test
28 Vulnerability to tropical storm impacts in coastal areas of the Red River Delta in Viet Nam and the adjacent region
Journal article
Vietnam Quantitative and qualitative surveys inter-views with key informants semi-structured interviews discussions mangrove utilisa-tion survey (quantitative model) focused interviews visualisation of storm track for various typhoon seasons
Mixed-method approach participatory rural appraisal
29 Sustainable Soil Management Program
Helvetas Swiss Inter-Co-operation amp SDC
Nepal Desk review of relevant documents field visits semi-structured interviews Focus group discussions observations separate focus group discussions for discussing is-sues related to labour migration apprecia-tive inquiry approach using open-ended questions storytelling about successes and challenges as well as visioning
30 Dry Zone Liveli-hood Support and Partnership Programme (DZLISPP)
IFAD Sri Lanka Quasi-experi-mental
Qualitative survey (key informant interviews with project staff and government officials focus group discussions with beneficiaries) and quantitative survey of 2560 households (both treatment and non-treatment group)
Mixed-method approach
31 Implement-ing sustainable water resources and wastewater management in Pacific island countries
UNDP Pa-cific island countries
Evaluation involved an orientation meeting in Nadi Fiji with Projectrsquos Regional Steering Committee two missions to visit six of the PICs and Skype and phone interviews with representatives of the remaining PICs and the implementing agencies construction of theory of change to evaluate the pathway of projectrsquos success
Mostly qualitative in nature
32 Supporting Integrated and Comprehensive Approaches to Climate Change Adaptation in Africa - Main-streaming CCA in the National Sectoral Policies of Tanzania
UNDP Tanzania Primary and secondary data were collected and analysed use of semi-structured indi-vidual and group interviews
No specific reference but seems to be highly qualita-tive
33 Climate Change Adaptation Action and Mainstreaming in Mozambique
UNDO Mozam-bique
Primary and secondary data were collected and analysed use of semi-structured indi-vidual and group interviews
No specific reference but seems to be highly qualita-tive
34 Integrating Disaster Risk Reduction and Climate Change Adaptation (DRRCCA) in Local Development Planning and Decision-making Processes
UNDP Philip-pines
Desk review key-informant interview (KII) using a questionnaire guide that focuses on particular agenciesinstitutions vis-agrave-vis outcomeoutput focus group discussion using a questionnaire guide and study or field visits where observation and interview methods are utilised for more insights
Mid-term review relies on qualitative information gen-erated through primary data gathering Opportunities for triangulation were sought However not all datainformation can be treated in this manner especially as certain key players have not been interviewed despite several attempts
35 Africa Adaptation Project Namibia Building the Foundation for a National Ap-proach to Climate Change Adapta-tion in Namibia
UNDP Namibia Interviews group interviews and document reviews Open-ended questionnaires were employed to facilitate interviews Literature and documents were reviewed to acquire relevant and appropriate information required to answer key evaluation questions and objectives Observations and case study approaches were used during field visits
Evaluation applied a mixed methodology of quantita-tive and qualitative research approaches
= No reference | NA = Not applicable
53
52 Calculation of net average treatment effect with double-difference approach
Figure 11 Calculation of the net treatment effect in an experimental or quasi-experimental design
Indicator lsquoIrsquo Intervention = Treatment
t0 t1 t2point in time
Difference of I between treatment and comparison group after treatment (t2)
Difference of I between treatment and comparison group before treatment (t0)
Average value of I for treatment group
Average value of I for comparison group
net average treatment effect
Estimated average counterfactual value of I for treatment group
The figure shows that the counterfactual value of the indicator for the treatment group is estimated on the basis of its (observed) value for the comparison group and the difference of its values between the groups before the treatment In other words it is assumed that without the treatment the treatment group would have developed in the same way as the com-parison group Accordingly the net average treat-ment effect ( ) can be calculated very easily by using the following formula
Whereby represents the value for the indicator of interest for the treatment (exponent = 1) and com-parison (exponent = 0) group at the points in time ( 0 = before and 2 = after treatment) when data is being collected ie before and after the treatment Sim-ply speaking the difference in the indicator mean value between the treatment and comparison group before the treatment is subtracted from its differ-ence between the treatment and comparison group after the treatment Therefore this approach is also called lsquodifference-in-differencersquo or lsquodouble-differ-encersquo approach
53 Propensity score matching (PSM)
The propensity score is an index that indicates the conditional probability of an individualrsquos being part of the treatment group This probability is calcu-lated based on a set of variables that are relevant for both selection for the treatment and the observed treatment effect The advantage of PSM is that in
contrast to other matching techniques it provides a one-dimensional score for the matching procedure and does not require any distribution assumptions regarding the basic population (cf 331) It does however require a set of assumptions to be fulfilled which limit its applicability to some extent These are
y Conditional independence assumption (CIA) The treatment effect (ie outcome differences between the treatment and the comparison group) has to be independent from the selection ie the effects may only be explained by the treat-ment confounding factors have to be excluded Example If an intervention aims at increasing the income of a group of people project benefi-ciaries need to be subject to the same external economic framework conditions that influence their income as non-beneficiaries The assump-tion would be violated for instance if a certain occupational group were selected (eg only farm-ers) and compared with a basic population that consists of various occupational groups
y Stable unit treatment value assumption (SUTVA) The treatment effect of an intervention on one person may not be influenced by the participa-tion of another person in the same intervention Example If an intervention aims at providing financial support to a group of people eg by micro-credits the potentially available amount for each beneficiary must be equal regardless of the amounts already spent In other words the project budget needs to be at least as big as the maximum budget needed if all beneficiaries were to request the maximum individual amount
5 A
nnex
Impa
ct E
valu
atio
n G
uide
book
for C
limat
e Ch
ange
Ada
ptat
ion
Proj
ects
54
y Stability of covariates against the treatment The covariates that are used to calculate the propen-sity score must not be influenced by the treat-ment Example If an intervention aims at increasing the income of a group of people then the income of the potential beneficiaries must not be used as a covariate (as it is an intended outcome of the project)
y Common support condition In order to be suit-able for matching both the treatment and com-parison group need to contain individuals with the same or at least a similar propensity score
y Balancing property Individuals who have the same propensity score need to be comparable regarding the particular characteristics that were chosen as covariates
If the project characteristics meet the above require-ments PSM can be applied according to the follow-ing sequence 28
Figure 12 PSM sequence
Estimating the
propensity score
Testing the common support
assumption
Selecting a matching algorithm
Testing the matching
quality and treatment
effects
Sensitivity analysis
Estimating the propensity score
The estimation of the propensity score is based on the selection of the covariates and the estimation procedure The estimation procedure again depends on the number of groups that need to be included in the analysis As in evaluations usually only two groups ndash the treatment and comparison group ndash are compared and only discrete choice models usu-ally logit or probit regressions 29 are used While the type of regression only plays a minor role as both provide very similar findings the variables that are used to calculate the propensity score are by far more important as they need to fulfil the conditional inde-pendence assumption (CIA) in order to provide valid findings Furthermore as the propensity score indi-
28 The following descriptions are based on a CEval working paper (no 19) written by Muumlller Christoph 2012
29 Regressions are used in statistics for identifying the relation-ships between one dependent and several independent varia-bles (eg income depending on education gender and age) Logit and probit regressions are usually used when a variable can only have two values (eg yes and no participant and non-participant)
cates the conditional probability that an individual will receive a treatment only those variables must be used that reflect this probability Therefore it is not correct to generally refer to lsquosocio-economic covari-atesrsquo as is still sometimes found in the literature (cf eg OECD 2014) While socio-economic variables may be appropriate for interventions that focus on the poor (ie the poorer a person the more likely he or she is to participate) they may not make any sense for an intervention that focuses on vulnerability (ie the more vulnerable a person is the more likely he or she is to participate) Accordingly in the latter case variables that reflect the vulnerability of a per-son (eg proximity to a disaster-prone area) need to be taken as covariates In any case the selection of covariates needs to be theoretically substantiated
Once the covariates are selected the propensity score is calculated by a simple (logit or probit) regression Here it is important to note that only metric (ie continuous eg income age) and dichotomous vari-ables (ie variables that can have two values eg yesno 10) can be included Nominal (ie variables that can only have discrete valuescategories without ranking eg religion marital status) and ordinal (ie variables with discrete ranked values eg educational level) variables need to be recoded in dichotomous variables for each category before the analysis
Testing the common support assumption
After the propensity score has been calculated for each case (ie person individual) of the treatment and control group the so-called area of common support (ACS) has to be identified The ACS com-prises the range in which the treatment and com-parison group show a similar density of propensity scores Only cases that lie within this area can be used for the subsequent matching procedure The ACS can either be defined by cutting off the range at the low-est and highest propensity scores available for both groups or by trimming ie setting a certain density threshold level beneath which cases are discarded In order to decide how to define the ACS it makes sense to visualise the distribution of the propensity scores as the following figure illustrates
55
Figure 13 Exemplary illustrations of propensity scores densities
0
02
04
06
08
1
01 02 03 04 05 06 07 08 09 10
02
04
06
08
1
01 02 03 04 05 06 07 08 09 1
Treatment group
Comparison group
Treatment group
Comparison group
As the illustration in the example on the left shows it would be appropriate to cut the ACS below 03 as there are no cases in the treatment group below this value and above 08 as there are no cases in the com-parison group above that value On the right both groups feature values in the entire range between 0 and 1 However the treatment group contains no cases with propensity scores between 07 and 08 which would make it impossible to create matches in that area Accordingly it would make sense to set a threshold level say at about 015 beneath which cases are excluded In that case the ACS would lie between 03 and 06 and between 09 and 1 Note If no ACS can be identified PSM cannot be applied
Selecting a matching algorithm
Once the ACS has been defined matching then starts with the selection of the matching algorithm As there are a number of matching algorithms that dif-fer depending on how cases from the comparison group are assigned to cases of the treatment group and the type of weighting several algorithms are usually applied in order to select the one that is most sensitive for identifying the treatment effect Three popular matching algorithms are briefly outlined below
A very popular and fairly simple matching algorithm is the so-called nearest neighbour matching (NNM) With NNM the case from the comparison group that features the most similar propensity score to each case or group of cases of the treatment group is assigned ie the one with the most similar prob-ability of being a member of the treatment group The approach prevents so-called bad matches ie that cases which are very different ndash in terms of their characteristics as represented by the covariates ndash to each other are compared Cases from the compari-son group can then usually be used repeatedly as a matching partner for cases from the treatment group It is also recommended to match several cases from the comparison group with each case from the treatment group in order to receive more robust findings (ie with less variance) Thus the com-parison group should be considerably larger than the treatment group (cf 331) It should be noted though that the decision to use cases more than once in order to minimise the variance has the trade-off of a potentially higher bias as inferior matches may also be used Figure 14 provides a simplified illustration of how the matches can be identified graphically
Figure 14 Graphical illustration of nearest neighbour matching
Treatment group cases
Comparison group cases
0 025 05 075 1
Propensity score
Treatment group cases
Comparison group cases
0 025 05
Propensity score075 1
1Weighting factor of cases
Treatment group cases
Comparison group cases
0 025 05
Propensity score075 1
Range (caliper)
5 A
nnex
Impa
ct E
valu
atio
n G
uide
book
for C
limat
e Ch
ange
Ada
ptat
ion
Proj
ects
56
As figure 14 shows in this example both treatment group and comparison group cases are used repeat-edly for matching and cases that are not the nearest neighbour to any of the cases of the respective other group are discarded
Another matching algorithm that is frequently used is so-called kernel matching The algorithm uses the weighted means of preferably all individuals of the
comparison group to estimate the counterfactual sit-uation of an individual from the treatment group To apply this matching algorithm it has to be decided in advance how to weight the individual cases dur-ing the matching ie define the probability density function (eg a Gaussian function) and how steep the function should be (ie the slew rate) Again here is a graphic to illustrate the matching process
Figure 15 Graphical illustration of kernel matching
Treatment group cases
Comparison group cases
0 025 05 075 1
Propensity score
Treatment group cases
Comparison group cases
0 025 05
Propensity score075 1
1Weighting factor of cases
Treatment group cases
Comparison group cases
0 025 05
Propensity score075 1
Range (caliper)
Figure 15 shows that comparison group cases are weighted according to the proximity of their propen-sity score to the score of the treatment group case they should be matched with
A matching algorithm that offers a kind of compro-mise is the so-called radius matching for which only those cases of the comparison group are used for the
matching that are within a certain predefined range (also called lsquocaliperrsquo) to the treatment group case The advantage of this algorithm is that the range can be adjusted according to the number of available cases in the comparison group so that it can provide more robust findings provided sufficient cases are avail-able
Figure 16 Graphical illustration of radius matching
Treatment group cases
Comparison group cases
0 025 05 075 1
Propensity score
Treatment group cases
Comparison group cases
0 025 05
Propensity score075 1
1Weighting factor of cases
Treatment group cases
Comparison group cases
0 025 05
Propensity score075 1
Range (caliper)
Figure 16 shows that cases that lie outside a prede-fined range are discarded Since there are no gen-eral rules about how to define this range we should note that a wider range leads on the one hand to a reduced variance of the findings (ie increased robustness) on the other it also introduces more bias as lsquonot so goodrsquo matches are also used Conversely a narrower range reduces the bias but increases the variance Thus there is always a trade-off between the robustness and bias of the findings
Testing the quality of matching and calculating the treatment effects
When the matching procedures have been com-pleted it needs to be verified once again whether the above-mentioned balancing property is fulfilled A common method for doing this is to check if the dif-ference in the covariates between the treatment and comparison group has been substantially reduced which can be (amongst others) done by calculating lsquoCohens drsquo an index for comparing differences in mean values before and after matching However further methods are available for verifying the bal-ancing property that cannot be discussed in detail
57
here but can be found in the recommended litera-ture at the end of this section
After all these steps have been taken finally the treatment effects can be assessed in different ways First of all of course the sign and the magnitude of the mean differences in the outcome variables after matching provide information about the direction and size of the relevant effect Furthermore one-sided T-tests can be performed for checking if the treatment effects are significant
Sensitivity analysis
The last step to provide for a distinct attribution of the observed effects to an intervention is to assess the robustness of the findings against unobserved confounding factors To do this a sensitivity analy-sis needs to be conducted eg based on the so-called Rosenbaum Bounds (RBs) that make it possible to estimate how strongly a confounding factor would need to bias the selection process in order to com-promise the robustness of the estimated treatment effect RBs represent the limits within which treat-ment effects are considered significant Estimation of the RBs is based on the assumption that with an increasing positive or negative selection treatment effects are respectively over- or underrated This also means that the probability of a positive treatment effect decreases with positive selection and increases with a negative selection There are further indexes such as the Hodges-Lehmann estimator (ie for esti-mating the minimum treatment effect to be consid-ered as significant) that can be used to further hedge the findings of the sensitivity analysis
Unfortunately since the calculation of these estima-tors requires a substantial statistical background they cannot be discussed here in detail However sta-tistical programs such as SPSSreg or STATAreg provide particular modules for these estimators which make it possible also for laypeople to perform the required calculations (provided they have understood the sense and benefit of such an analysis)
54 Fixed-effects random-effects models and time-series cross-section analysis
Fixed-effects models (FEM) are used to estimate the impact of a particular independent variable (eg treatment framework condition) that varies over time on individual outcomes (eg income health status) It is based on the assumption that these outcomes correlate with that independent vari-able Thus FEM can reveal the relationship between
predictor and outcome variables within an analyti-cal entity giving consideration to time-invariant individual characteristics that potentially affect the impact of these predictor variables (eg profession on income or gender on nutrition) These characteristics are considered to be time-invariant unique to the analytical entity and not to be correlated with other individual characteristics In that case the treatment effect on the outcome variable of interest can be esti-mated by regressing the individual outcomes as cal-culated with the following formula
Whereby stands for the dependent outcome variable of interest with representing its analytical entity and the point in time when the data is col-lected is the value of the independent variable for this entity at that time the coefficient for the inde-pendent variable the invariant individual char-acteristic that affects the outcome and the error term for other unobserved factors that vary over time With that model all time- invariant differences between the analytical entities are controlled so that it can be used to identify the causes of observed changes of an analytical entity over time
In contrast to FEM the random-effects model (REM) is based on the assumption that variations in the individual outcomes of the entities are random and uncorrelated with the predictor variables Accord-ingly the REM should be used if it is assumed that differences across entities influence the depend-ent outcome variable Thus the formula has to be amended by adding a second error term that expresses this difference
As the application of REM requires that the second error term does not correlate with the predictor vari-able individual characteristics that potentially have an influence on the predictor variables need to be specified Accordingly omitting relevant variables in the model may lead to biased findings
A number of tests are available for deciding which model to use in a panel analysis such as the so-called Hausman test which tests whether correlates with the regressors the Pasaran cross-sectional dependence test or serial correlation tests As the test procedures cannot be discussed in detail in this Guidebook further references are provided in the literature list at the end of this section Furthermore it has to be added that for both STATAreg and SPSSreg do-file respectively syntax templates are available that can perform such tests on suitable data sets
5 A
nnex
Impa
ct E
valu
atio
n G
uide
book
for C
limat
e Ch
ange
Ada
ptat
ion
Proj
ects
58
Another lsquopanel-likersquo approach for long-term impact assessment is the so-called time-series cross-section (TSCS) analysis Similar to the panel analysis the TSCS analysis is based on data being collected over time from the same analytical units However in contrast to the former approach conclusions made with TSCS analysis are limited to the sample ie are not transferable to another population without fur-ther ado Another difference is that while the panel analysis requires a large sample but also works with a few observations (at least three) TSCS Analysis works with a small number of analytical entities but requires more observations (at least about 10) in order to provide robust findings Due to these fea-tures TSCS analysis is mainly used for policy studies with macro data and analytical entities such as sec-tors countries or regions As one the one hand the statistical fundamentals of TSCS analysis are quite complex and on the other hand the approach is not (yet) very popular for project evaluations it will not be discussed here in detail
However the following literature reference list gives some recommendations for further reading on this subject too
Beck N (2006) Time-SeriesndashCross-Section Methods New York New York University
Beck N (2001) Time-SeriesndashCross-Section Data What Have We Learned in the Last Few Years San Diego University of Califor-nia
Beck N Katz JN (1995) What to do (and not to do) with Time-Series Cross-Section Data The American Political Science Review 89(3)634 ndash 647
Girosi F King G (2001) Time Series Cross-Sec-tional Analyses with Different Explanatory Variables in Each Cross-Section Cambridge Harvard University
Wooldridge JM (2010) Econometric Analysis of Cross Section and Panel Data Cambridge The MIT Press
55 Structural equation modelling
As outlined in Section 316 structural equation models consist of latent constructs and empirically measurable indicators With regard to the operation-alisation of the constructsvariables two types of measurement models can be distinguished models based on reflective indicators and those based on formative indicators While reflective indicators are defined by their construct (eg construct sportiness
rarr indicator time needed to run 100 metres) forma-tive indicators define the construct (eg indicator number of training modules per month rarr construct sportiness) Accordingly reflective indicators have to correlate with each other while formative ones do not necessarily have to do so (eg time needed to run 100 500 1000 metres vs number of running mod-ules number of swimming modules etc) Another difference between reflective and formative con-structs is that reflective indicators are replaceable (eg time taken to run 100 metres time taken to cycle 1 km) while an exchange of formative indicators would result in a modification of the construct (eg number of maths lessons instead of training mod-ules)
Before the causal relationship between the con-structs can be analysed the validity of the measure-ment models ie how well the indicators opera-tionalise a construct needs to be checked Due to the above-mentioned differences the analysis of reflective and formative indicators differs As reflec-tive measurement models correspond to an explora-tive factor analysis (main component analysis) their validity is assessed on the basis of the factor loadings (should be ge0707) their significance its reliability (composite reliability r should be gt07) and the aver-age explained variance of the construct (should be gt05) Furthermore a reflective measurement model is considered valid if the explained variance of a construct is higher than each squared correla-tion between this and any other construct (lsquoFornell-Larker-Criterionrsquo ie discriminatory validity) Forma-tive measurement models correspond to a multiple regression Accordingly their quality is assessed on the basis of the factor weights their significance and the co-linearity of the indicators (ie the so-called variance inflation factor should be lt10)
Concerning the number of indicators required to describe a construct it has to be considered that there is a trade-off between the reliability of the measurement and the danger of creating artefacts which biases the construct (eg overrepresentation of physical indicators when measuring the health sta-tus) Furthermore the sample size should be consid-erably larger than the number of indicators
While the measurement model specifies the rela-tionship between the latent constructs and their indicators the structural model describes the influ-ence of the constructs on each other These influ-ences are graphically marked by arrows which rep-resent assumed causal relationships The direction of the arrow indicates the direction of causality ie defines what is the cause and what is the effect In principle both the number of constructs and the number of (estimated) causal relations are unlimited This also means that a construct can be both affected
59
by one or more constructs and affect another one or more others
The relationship between two constructs is expressed by the so-called path coefficient which ranges from -1 (perfect negative relationship) to 1 (perfect positive relationship) A value of 0 may indi-cate that there is no statistical relationship between two constructs While a high value of is preferable in practice values higher than 04 (respectively lt-04) can be considered as very high It has to be added that SEM makes it possible to calculate not only direct effects but also indirect and total effects
The path coefficient can be calculated in two dif-ferent ways ie by means of co-variance analysis or variance analysis each having some advantages and disadvantages Although the theoretical founda-tions of the two methods cannot be discussed here in detail the main aspects that help decide which one to choose are summarised in the following table
Table 8 Decisive aspects for choosing co-variance or variance analysis 30
Co-variance analysis Variance analysis
Preferred method for analysing established theories and testing hypotheses
Preferred method in explorative studies ie if the causal relations between the constructs are not yet substantiated
Works best with large sample sizes (n gt100)
Also works with smaller sample size (n gt30)
Method of choice if statistical quality criteria1 are preferred for assessing the validity of the model
Method of choice if the model is validated nomologically
Available software eg AMOSreg LISRELreg
Available software eg SmartPLSreg
As the table shows variance analysis might be the preferred choice for evaluations since they are usu-ally explorative in nature and constructs that char-acterise the objectives of an intervention are more likely to be based on formative measurement mod-els The smaller required sample size also speaks for the use of variance analysis However the fact that no statistical indexes are available to assess the validity of variance analysis-based structural mod-els means that the researcher applying this method needs to have comprehensive knowledge about the system conditions and the causal linkages between its elements
Nevertheless variance analysis also provides indi-ces for assessing the contribution of an intervention
30 Adapted from Jahn 200716
to an observed effect such as the above-mentioned path coefficient (should be gt02) its significance and the effect strength (fsup2 weak gt002 average gt015 strong gt035) Furthermore the model fit (Rsup2 small gt02 average gt033 substantial gt067) indicates the informative value of the model (ie how far the inde-pendent constructs explain the variance of the indi-vidual constructs)
As also shown in the table meanwhile a number of user-friendly computer programs are available for calculating structural equation models at least on the basis of variance analysis While in principle even people with a limited methodological background can operate such software (at least it provides plausi-ble findings) it is not recommended to do so because incorrect theoretical assumptions or setting wrong parameters for calculating the quality criteria can lead to biased or even completely false findings
56 Calculating sample sizes for probability sampling
This section outlines three different ways to cal-culate the sample size depending on the available information about the basic population In the first example the size of the basic population is known but the true value of a certain dichotomous charac-teristic (ie can have two values eg whether or not a beneficiary applied an improved farming technique) is not In this case the required sample size can be calculated simply according to the formula
Whereby is the required sample size is the size of the basic population and is the desired margin of error So assuming the basic population amounts to 1000 persons and the desired margin of error is 005 then the minimum sample size would be
10001000 ∙ 005
1000
This means data from a minimum of 286 randomly selected respondents would be needed for the survey
5 A
nnex
Impa
ct E
valu
atio
n G
uide
book
for C
limat
e Ch
ange
Ada
ptat
ion
Proj
ects
60
An alternative way to calculate the minimum sam-ple size for large populations ndash even if the exact size of the basic population is not known ndash is illustrated next In this case it is advantageous to have a good estimate of the true value of an observed characteris-tic of interest (eg gender distribution)
Thereby is the area under the normal curve corre-sponding to the defined level of confidence and is the true share of the population that displays a cer-tain characteristic (eg is female)
For most common levels of confidence equals as follows
90 = 164595 = 196099 = 2575999 = 3290
eg for a population in which 48 are female and the desired margin of error is 005 the minimum sample size would be
196 ∙ 048 ∙005
0958900025
However if the actual share of the basic population that features a certain characteristic of interest (eg percentage of beneficiaries who have adopted a new farming technique or not) is not known it is always safe to assume a 50 share as then the term bull (1 - ) and accordingly the entire formula reaches its maximum
If the size of the basic population is known and if it is smaller than approximately 50000 one can still use the latter formula in a first step but reduce the sam-ple size in a second step by applying the following correction term
Whereby is the required sample size as calculated above Assuming that the basic population only com-prises 1000 persons then the minimum sample size would be
384
1000
3841383
So according to this correction term it is acceptable to reduce the sample size by 106 respondents which equals a reduction of more than a quarter
It must however be kept in mind that the sample sizes provided in these formulas corresponds to the actual number of necessary completed question-naires Accordingly when planning a survey the non-response rate has to be considered as well The rate indicates the share of those who do not par-ticipate in the survey despite being selected for the sample This needs to be compensated to assure that the sample remains large enough to achieve the desired level of confidence and margin of error So if for example a sample size of 500 is required and it is assumed that only 80 might answer the number of respondents needs to be increased to at least 625
Furthermore it has to be considered that if the sur-vey is part of an experimental or quasi-experimental design data need to be collected not only for the treatment group but also for a comparison group Therefore when applying PSM the comparison group sample needs to be considerably bigger than the treatment group sample ndash ideally about two to three times the size ndash in order to assure that suf-ficient cases are available for matching during data analysis (cf 312)
61
57 Literature
Bours D et al (2014) Guidance Note 1 Twelve Rea-sons why Climate Change Adaptation MampE Is Challenging httpwwwseachangecoporgsitesdefaultfilesdocuments2014200120SEA20Change20UKCIP20GN1201220Reasons20why20CCA20MandE20is20challengingpdf
Bours D et al (2014) Guidance Note 2 Selecting Indicators for Climate Change Adaptation Pro-gramming httpwwwseachangecoporgsitesdefaultfilesdocuments2014200120SEA20Change20UKCIP20GN220Selecting20indi-cators20for20CCA_0pdf
Bours D et al (2014) Guidance Note 3 Theory of Change Approach to Climate Change Adaptation Programming httpwwwseachangecoporgsitesdefaultfilesdocuments2014200220SEA20Change20UKCIP20GN320ToC20approach20to20CCA20programmingpdf
Bours D et al (2014) Monitoring and Evaluation for Climate Change Adaptation and Resilience A Syn-thesis of Tools Frameworks and Approaches Sec-ond Edition httpwwwseachangecoporgsitesdefaultfilesdocuments20142005201520SEA20Change20UKCIP20Synthesis20Report202nd20editionpdf
Bours D et al (2014) Design Monitoring and Evalu-ation in a Changing Climate Lessons Learned from Agriculture and Food Security Programme Evaluations in Asia httpwwwseachangecoporgsitesdefaultfilesdocuments2014200520SEA20Change20UKCIP20ER120Agriculture20and20food20security_0pdf
Bours D et al (2014) International and donor agency portfolio evaluations trends in monitor-ing and evaluation of climate change adapta-tion programs httpwwwseachangecoporgsitesdefaultfilesdocuments2014200620SEA20Change20UKCIP20ER220CCA20MandE20trends20from20porfolio20evalu-ations_0pdf
Conway D amp Mustelin J (2014) Strategies for improving adaptation practice in developing countries Nature Climate Change 4339-342
Cordero C (2014) Case Study Working with the Vulnerability Sourcebook in Chullcu Mayu Bolivia News GIZ httpwwwgizdeexpertisehtml15486html
Dinshaw A et al (2014) Monitoring and Evaluation of Climate Change Adaptation Methodological Approaches OECD Environment Working Paper No 74 OECD Publishing
Ford JD et al (2013) How to track Adaptation to Climate Change A typology of Approaches for National-Level Application Ecology and Society 18(3)40
Ford J D amp Berrang-Ford L (2015) The 4Cs of adap-tation tracking consistency comparability com-prehensiveness coherency Mitigation and Adap-tation Strategies for Global Change 1-21
Fischerova G (no date) Strategic Initiatives to Address Climate Change in LDCs (Boots on the Ground) Integrating Climate Change Risks into Development Planning and Programming UNDP Bratislava Regional Centre (PowerPoint Presenta-tion)
Foumlrch W et al (2014) Back to Baselines Measuring Change and Sharing Data Agriculture and Food Security 2014 313 httpwwwagricultureand-foodsecuritycomcontentpdf2048-7010-3-13pdf
Garcia JR amp Zazueta A (2015) Going Beyond Mixed Methods A Systems Perspective for Ask-ing the Right Questions Institute of Develop-ment Studies httponlinelibrarywileycomdoi1011111759-543612119epdf
German Federal Ministry for Economic Cooperation and Development (BMZ) (2013) Climate Finance Readiness Programme Early Action for Ambitious Goals httpwwwgizdeexpertisedownloadsgiz2013-en-climate-finance-readiness-flyerpdf
GIZ (2012) Disaster Risk Management and adapta-tion to climate change Experience from German Development Cooperation Deutsche Gesellschaft fuumlr Internationale Zusammenarbeit (GIZ) GmbH httpwwwipaccpedocen-disaster-risk-man-agement-climate-changepdf
GIZ (2013) GIZrsquos global GCF Readiness Programme Competence Centre for Climate Change Environ-ment and Climate Change Division httpwwwgizdeexpertisedownloadsgiz2013-en-climate-finance-gcfitpdf
5 A
nnex
Impa
ct E
valu
atio
n G
uide
book
for C
limat
e Ch
ange
Ada
ptat
ion
Proj
ects
62
GIZ (2013) GIZ in South Africa Programs and Pro-jects Deutsche Gesellschaft fuumlr Internationale Zusammenarbeit (GIZ) GmbH httpswwwgizdededownloadsgiz2013-en-giz-programs-pro-jects-south-africapdf
GIZ (2013) Guidelines on designing and using a results-based monitoring system (RBM system) httpswwwgiz2013-0110en-results-based-moni-toring-systempdf
GIZ (2014) Transboundary Water Management Sup-port to Cooperation on Shared Waters Deutsche Gesellschaft fuumlr Internationale Zusammenarbeit (GIZ) GmbH httpwwwgizdeexpertisedown-loadsgiz2014-en-mappe-transboundary-water-managementpdf
GIZ (2015a) The Sustainable Agricultural Programme (PROAGRO I amp II) httpproagro-boliviaorg (accessed on 22102015)
GIZ (2015b) Public Investment and Climate Change Adaptation (IPACC) project httpwwwgizdeenworldwide13314html (accessed on 22102015)
GIZ (2015c) Climate Support Programme (CSP) httpwwwgizdeenworldwide17807html (accessed on 22102015)
Hammill A et al (2013) Comparative Analysis of climate change vulnerability assessments Les-sons from Tunisia and Indonesia Competence Centre for Climate Change Deutsche Gesellschaft fuumlr Internationale Zusammenarbeit httpsgc21gizdeibtvarappwp342deP1443wp-contentuploadsfilebasevavulnerability-guides-man-uals-reportsComperative-analysis-of-climate-change-vulnerability-assessmentspdf
Hedger MM (2008) Desk Review Evaluation of Adaptation to Climate Change from a Develop-ment Perspective Institute of Development Stud-ies httpswwwclimate-evalorgsitesdefaultfileseventsalexandriaIDS_Report_on_Evaluat-ing_Adaptation_for_GE_publication_versionpdf
IIED (2015) Capacity Strengthening in Least Deve-loped Countries (LDCs) for Adaptation to Climate Change (CLACC) httpwwwiiedorgcapacity-strengthening-least-developed-countries-for-adaptation-climate-change-clacc (accessed on 22102015)
Karkoschka O et al (2013) Guidance for Integrat-ing Monitoring and Evaluation of Climate Change Adaptation into Strategies in Mongolia Deutsche Gesellschaft fuumlr Internationale Zusammenarbeit httpwwwseachangecoporgsitesdefaultfilesdocuments2013200720GIZ20-20Guid-ance20for20Integrating20M26E20of20CCA20into20Strategiespdf
Lamhauge N et al (2012) Monitoring and Evaluation for Adaptation Lessons from Development Coop-eration Agencies OECD Environment Working Paper No 38 OECD Publishing httpwwwoecd-ilibraryorg docserverdownload5kg20mj6c2bwpdfexpires=1425238023ampid=idampaccname=guestampchecksum=77BA5587F2D7AD9EF6C22B614A36C4D4
Leighton M et al (2011) Climate Change and Migra-tion Rethinking Policies for Adaptation and Disaster Risk Reduction No 152011 United National University - Institute for Environment and Human Security httpswwwehsunuedufileget8468
Leiter T (2015) Linking Monitoring and Evaluation of Adaptation to Climate Change across Scales Avenues and Practical Approaches In D Bours P Pringle amp C McGinn (Eds) Monitoring and Evalu-ation of Climate Change Adaptation A review of the landscape New Directions for Evaluation 147 117-127
OECD (2011) Handbook on the OECD-DAC Cli-mate Markers httpwwwoecdorgdacstats48785310pdf
OECD (2014) OECD DAC Statistics Aid to Climate Change Adaptation March 2014 Version 2 httpwwwoecdorgdacenvironment-developmentAdaptation-related20Aid20Flyer20-20March20201420v2pdf
Olivier J et al (2013) Adaptation made to measure A Guidebook to the Design and result-based moni-toring of climate change adaptation projects 2nd Edition Deutsche Gesellschaft fuumlr Internationale Zusammenarbeit (GIZ) GmbH httpsgc21gizdeibtvarappwp342deP1443wp-contentuploadsfilebasememe-guides-manuals-reportsGIZ-2013_Adaptation_made_to_measure_second_editionpdf
63
Prowse M et al (2010) Impact Evaluation and Intervention to address Climate Change A Scop-ing Study International Initiative for Impact Evaluation Working Paper 7 httpswwwclimate-evalorgsitesdefaultfilesevalua-tions53020Impact20Evaluation20and20Interventions20to20Address20Climate20Change20-20A20Scoping20Studypdf
Sanahuja H E (2011) A Framework for Monitoring and Evaluating Adaptation to Climate Change Community of Practice Global Environment Facility httpswwwclimate-evalorgsitesdefaultfilesstudiesClimate-Eval20Frame-work20for20Monitoring20and20Evalua-tion20of20Adaptation20to20Climate20Changepdf
Sara Orleans Reed et al (2014) Resilience projects as experiments implementing climate change resil-ience in Asian cities climate and development Published by Taylor amp Francis httpwwwtand-fonlinecomdoifull101080175655292014989190VPZRBvmG-NM
Scholze M (2013) Country Experiences with Main-streaming Adaptation ndash from Programme to National Level Webinar httpsgc21gizdeibtvarappwp342deP1443wp-contentuploadsfilebasems mainstreaming_webinareCoun-try_experiences_with_mainstreaming_adapta-tion_national_levelpdf
Schwartzendruber F (2014) Evaluation of NRM interventions linked to climate change A scoping study Draft version httpswwwclimate-evalorgsitesdefaultfilesstudiesNRM-Study-Draftpdf
Smit B amp Pilifosova O (2010) Adaptation to Climate Change in the Context of Sustainable Develop-ment and Equity httpswwwvieunuedufileget9995pdf
Smith JB Vogel J M and Cromwell J E (2009) An architecture for government action on adaptation to climate change An editorial comment Climatic Change 9553-61
UNDP (2009) Thematic Area Scaling up local and community-based actions UNDP Community Based Adaptation httpsunfcccintfilesadapta-tionapplicationpdfundp_ap_update_sep_09_cba_1_sppdf
UNDP (2011) Achievements in 2011 Strategic Initia-tive to Address Climate Change in Least Devel-oped Countries Boots on the Ground Report httpwwwundporgcontentdamundplibraryEnvironment20and20EnergyCli-mate20Change2011-Boots-on-the-Ground-Reportpdf
UNDP (2011) Brochure on Strategic Initiative to Address Climate Change in LDCs httpwwwundporgcontentdamundplibraryEnviron-ment20and20EnergyClimate20ChangeCapacity20DevelopmentFlyer20for20Boots20on20the20Ground_Final_rev20rcpdf
UNDP (2013) UNDP support to LDCs to Access Finance for Adaptation Basic Facts and Figures httpundp-almorgsitesdefaultfilesdown-loadsoverview_of_undp_ support_to_ldcs_to_access_finance_for_adaptation_-_nov_2013pdf
UNDP (2015a) Community-Based Wetland Manage-ment Project (BIRAM) httpwwwundp-almorgprojectsspa-cba-bangladesh-community-based-wetland-management-project-biram (accessed on 22102015)
UNDP (2015b) National Adaptation Plan Global Support Programme (NAP-GSP) httpwwwundp-almorgprojectsnaps-ldcs (accessed on 22102015)
UNDP (2015c) Pacific Integrated Water Resource Management (IWRM) project httpwwwtand-fonlinecomdoipdf10108019439341003786729 (accessed on 22102015)
Villanueva P S (2011) Learning to Adapt Monitor-ing and Evaluation Approaches in Climate Change Adaptation and Disaster Risk Reduction ndash Chal-lenges Gaps and Ways Forward httpr4ddfidgovukPDFOutputsClimateChangeSCR-Dis-cussionPaper9--Learning-to-ADAPTpdf
Wuumlrtenberger L (2013) GCFit GIZrsquos Global GCF Readiness Programme Deutsche Gesellschaft fuumlr Internationale Zusammenarbeit (GIZ) GmbH httpwwwcaribankorguploads201305GIZC2B4s-Global-GCF-Readiness-Programmpdf
5 A
nnex
Impa
ct E
valu
atio
n G
uide
book
for C
limat
e Ch
ange
Ada
ptat
ion
Proj
ects
64
Notes
65
Published by Deutsche Gesellschaft fuumlr Internationale Zusammenarbeit (GIZ) GmbH
Registered offices Bonn and Eschborn Germany
Global Project Effective Adaptation Finance (MampE Adapt)
BMZ Bonn Dahlmannstraszlige 4 53113 Bonn Germany Tel +49 (0) 228 99 535 - 0 Fax +49 (0) 228 99 535 - 3500
BMZ Berlin Stresemannstraszlige 94 10963 Berlin Germany Tel +49 (0) 30 18 535 - 0 Fax +49 (0) 30 18 535 - 2501
poststellebmzbundde wwwbmzde
Friedrich-Ebert-Allee 36 + 40 53113 Bonn Germany Tel +49 (0) 228 44 60 - 0 Fax +49 (0) 228 44 60 - 1766
Dag-Hammarskjoumlld-Weg 1-5 65760 Eschborn Germany Tel +49 (0) 6196 79 - 0 Fax +49 (0) 61 96 79 - 1115
climategizde wwwgizdeclimate
In cooperation with UNDP Center for Evaluation CEVAL
Autors Stefan Silvestrini Ines Bellino Susanne Vaumlth
Design and layout Ira Olaleye Eschborn Germany
Photo credits Title page copy Ranak Martin
As at September 2015
GIZ is responsible for the content of this publication
On behalf of Federal Ministry for Economic Cooperation and Development (BMZ) Special Unit lsquoClimatersquo
Addresses of the BMZ offices
- Impact Evaluation Guidebook for Climate Change Adaptation Projects
-
- Content
-
- List of figures
-
- Figure 1Flow chart for implementing an RIE
- Figure 2Illustration of the pipeline approach
- Figure 3Selection of individuals for comparison
- Figure 4Outcome scores before and after intervention
- Figure 5Generic layout of a structural equation model
- Figure 6Decision tree for selecting an evaluation design for measuring impacts at individual level
- Figure 7Decision tree for selecting an evaluation design for measuring impacts at institutional and system level
- Figure 8Distribution of sample mean values in relation to the true population mean value
- Figure 9Simplified SEM for the GIZ projectthinspthinsp33
- Figure 10Draft schedule for impact monitoring and evaluation framework
- Figure 11Calculation of the net treatment effect in an experimental or quasi-experimental design
- Figure 12PSM sequence
-
- List of tables
-
- Table 1Exemplary data collection plan
- Table 2Example table for matching on observables
- Table 3Required project characteristics and data
- Table 4Example of question types
- Table 5Exemplary to-do list for preparing a survey
- Table 6Applicability of evaluation designs
- Table 7Draft (simplified) data collection plan
- Table 8Decisive aspects for choosing co-variance or variance analysisthinsp
-
- List of abbreviations
- Glossary
-
- Executive Summary
- 1Introduction
-
- 11How to use the Guidebook
- 12How to plan and implement an RIE for CCA projects
-
- 2Evaluating climate change adaptation projects
-
- 21Types and key features of climate change adaptation projects
-
- 211Adaptation projects addressing the individual level
- 212Adaptation projects addressing the institutional level
- 213Adaptation projects addressing the systemic level
-
- 22Key challenges of climate change adaptation projects
- 23Review of current methods to evaluate the results of CCA projects
-
- 3Rigorous evaluation designs and examples of applicability in climate change adaptation projects
-
- 31Overview of evaluation designs ndash potentials and limitations for climate change adaptation projects
-
- 311Experimental and quasi-experimental designs
- 312Matching techniques
- 313Pipeline approach
- 314Regression discontinuity design
- 315Time-series designs
- 316Structural equation modelling
- 317Summary
-
- 32Providing reliable large-scale data
-
- 4Case study Urban Management of Internal Migration due to Climate Change
-
- 41Background and project objectives
- 42Practical implementation
-
- 5Annex
-
- 51Overview of current CCA related-project evaluations
- 52Calculation of net average treatment effect with double-difference approach
- 53Propensity score matching (PSM)
- 54Fixed-effects random-effects models and time-series cross-section analysis
- 55Structural equation modelling
- 56Calculating sample sizes for probability sampling
- 57Literature
-
- Publishing information
-

1
List of tables 2List of figures 2List of abbreviations 3Glossary 4
Executive Summary 6
1 Introduction 10
11 How to use the Guidebook 1112 How to plan and implement an RIE for CCA projects 11
2 Evaluating climate change adaptation projects 16
21 Types and key features of climate change adaptation projects 16 211 Adaptation projects addressing the individual level 16 212 Adaptation projects addressing the institutional level 17 213 Adaptation projects addressing the systemic level 18
22 Key challenges of climate change adaptation projects 1923 Review of current methods to evaluate the results of CCA projects 20
3 Rigorous evaluation designs and examples of applicability in climate change adaptation projects 22
31 Overview of evaluation designs ndash potentials and limitations for climate change adaptation projects 22 311 Experimental and quasi-experimental designs 23 312 Matching techniques 25 313 Pipeline approach 26 314 Regression discontinuity design 28 315 Time-series designs 29 316 Structural equation modelling 30 317 Summary 32
32 Providing reliable large-scale data 34
4 Case study Urban Management of Internal Migration due to Climate Change 39
41 Background and project objectives 4042 Practical implementation 42
5 Annex 48
51 Overview of current CCA related-project evaluations 4852 Calculation of net average treatment effect with double-difference approach 5253 Propensity score matching (PSM) 5254 Fixed-effects random-effects models and time-series cross-section analysis 5655 Structural equation modelling 5756 Calculating sample sizes for probability sampling 5857 Literature 60
Content
Impa
ct E
valu
atio
n G
uide
book
for C
limat
e Ch
ange
Ada
ptat
ion
Proj
ects
2
List of tablesTable 1 Exemplary data collection plan 13Table 2 Example table for matching on observables 25Table 3 Required project characteristics and data 35Table 4 Example of question types 36Table 5 Exemplary to-do list for preparing a survey 37Table 6 Applicability of evaluation designs 42Table 7 Draft (simplified) data collection plan 44Table 8 Decisive aspects for choosing co-variance 58
List of figuresFigure 1 Flow chart for implementing an RIE 14Figure 2 Illustration of the pipeline approach 27Figure 3 Selection of individuals for comparison 28Figure 4 Outcome scores before and after intervention 28Figure 5 Generic layout of a structural equation model 31Figure 6 Decision tree for selecting an evaluation design for measuring impacts at individual level 33Figure 7 Decision tree for selecting an evaluation design for measuring impacts at institutional and system level 34Figure 8 Distribution of sample mean values in relation to the true population mean value 38Figure 9 Simplified SEM for the GIZ project 45Figure 10 Draft schedule for impact monitoring and evaluation framework 47Figure 11 Calculation of the net treatment effect in an experimental or quasi-experimental design 52Figure 12 PSM sequence 53
3
List of abbreviations
AAP Africa Adaptation ProgrammeADB Asian Development BankBGR Federal Institute for Geosciences and Natural ResourcesBMZ German Federal Ministry for Economic Cooperation and DevelopmentBMUB German Federal Ministry for the Environment
Nature Conservation Building and Nuclear SafetyCCA Climate change adaptationCIDA Canadian International Development AgencyCO2 Carbon dioxide DAC Development Assistance CommitteeDfID Department for International DevelopmentEU European UnionGCF Green Climate Fund GHG Greenhouse gases GIZ Deutsche Gesellschaft fuumlr Internationale Zusammenarbeit GmbH IFAD International Fund for Agricultural DevelopmentKfW Kreditanstalt fuumlr WiederaufbauLDC Least developed countyLDCF Least Developed Countries FundMampE Monitoring and EvaluationNAMAs Nationally Appropriate Mitigation ActionsNAP National Adaptation PlanNC National CommunicationNGO Non-governmental organisation OECD Organisation for Economic Co-operation and DevelopmentPSM Propensity score matchingRDD Regression discontinuity designRCT Randomised controlled trialREDD Reducing Emissions from Deforestation and Forest DegradationSEM Structural equation model(ling)SIDA Swedish International Development AgencyToC Theory of changeUNDP United Nations Development ProgrammeUNEP United Nations Environment ProgrammeUNFCCC United Nations Framework Convention on Climate ChangeUNICEF United Nations Childrenrsquos FundUNIDO United Nations Industrial Development Organization USAID United States Agency for International Development WFP World Food Programme
Impa
ct E
valu
atio
n G
uide
book
for C
limat
e Ch
ange
Ada
ptat
ion
Proj
ects
4
Glossary
Accountability Obligation to demonstrate that work has been conducted in compliance with agreed rules and stand-ards or to report fairly and accurately on performance results vis-agrave-vis mandated roles andor plans This may require a careful demonstration that the work is consistent with the contract terms
Adaptation Adjustment in natural or human systems in response to actual or expected climatic stimuli or their effects which moderates harm or exploits beneficial opportunities Various types of adaptation can be distinguished including anticipatory autonomous and planned adaptation Anticipatory adaptation ndash Adaptation that takes place before impacts of climate change are observed Also referred to as proactive adaptation Autonomous adaptation ndash Adaptation that does not constitute a conscious response to climatic stimuli but is triggered by ecological changes in natural systems and by market or welfare changes in human systems Also referred to as spontaneous adaptation Planned adaptation ndash Adaptation that is the result of a deliberate policy decision based on an aware-ness that conditions have changed or are about to change and that action is required to return to maintain or achieve a desired state
Adaptive capacity
The ability of a system to adjust to climate change (including climate variability and extremes) to moderate potential damages to take advantage of opportunities or to cope with the consequences
Attribution Ascribing the cause of an effect (change) to a specific intervention An approach to () rigorous impact evaluation that concerns clear cause-effect relationships ie establishing causal links and drawing explanatory conclusions about observed changes (whether anticipated or not) and the con-cerned intervention Focusing on clear causation implies considering the () counterfactual to assess the () net impact of an intervention by a comparison of what has occurred with the intervention implemented (the factual) with the situation without the intervention (the counterfactual)
Climate change
Climate change refers to any change in climate over time whether due to natural variability or as a result of human activity This usage differs from that in the United Nations Framework Convention on Climate Change (UNFCCC) which defines lsquoclimate changersquo as lsquoa change of climate which is attrib-uted directly or indirectly to human activity that alters the composition of the global atmosphere and which is in addition to natural climate variability observed over comparable time periodsrsquo
Counterfactual The situation that would have happened if the intervention had not taken place (lsquowithoutrsquo situation) As the counterfactual is not directly observable the unobservable potential outcome of the counter-factual situation is estimated via the situation of an equivalent control comparison group that is not affected by the intervention This is done using () randomised controlled trials (RCT) or () quasi-experimental designs
Evaluability Extent to which an activity or a programme can be evaluated in a reliable and credible fashion
Experimental design
A study in which individuals (or groups of individuals) are randomly allocated (by chance alone) to an intervention group (treatment) or a control group (not being part of the intervention) Experimental studies ( RCTs) seek to measure an interventionrsquos () net impact by comparing the two groupsrsquo situations before and after the intervention ( attribution)
Exposure The nature and degree to which a system is exposed to significant climatic variations
Factual The observed outcome of an intervention (lsquowithrsquo situation) ( counterfactual)
Impact 1 Positive and negative primary and secondary long-term effects produced by an intervention directly or indirectly intended or unintended ( net impact)
Impact evaluation
An evaluation that looks beyond the immediate results of an intervention project programme or policy Impact evaluations may focus (i) on higher outcomes rather than intervention outputs (ii) on longer-term results (iii) on a group of interventions within a given sector or geographical area or (iv) explicitly on the impacts produced by an intervention ie attributing impacts to an intervention ( Rigorous impact evaluation)
Monitoring A continuing function that uses systematic collection of data on specified indicators to provide management and the main stakeholders of an ongoing development intervention with indications of the extent of progress and achievement of objectives and progress in the use of allocated funds
1 For GIZ colleagues a brief explanation of how this impact definition fits into GIZrsquos results model (GIZ 2013) The results model is an ex-pression of GIZrsquos Managing for Development Results approach The results model forms the detailed basis for GIZrsquos subsequent operation-al planning and for establishing the results-based monitoring system at the start of implementation Within this model GIZ understands results as the lsquointended or unintended positive or negative changes in a situation or behaviour as the direct or indirect consequence of an interventionrsquo Results include impacts outcomes and outputs Impacts are defined as lsquothe long-term overarching development results They are usually located at the level of the development cooperation programme objectiversquo This definition largely corresponds to the one used in this document However at some points in this publication the authors use the term lsquoimpactrsquo synonymously with the term lsquooutcomersquo when applied to GIZrsquos results model Within GIZ outcomes are defined as the lsquoexpected or actually achieved direct short-term and medium-term results of a measurersquos outputsrsquo
5
Net impact Effects exclusively produced by an intervention (without effects caused by other possible external causes) effects that can be () attributed to a specific intervention by clear () causation The net impact (b-c) is the difference between what has occurred with the intervention implemented (b-a) the () factual and the situation without the intervention (c-a) the () counterfactual
after intervention
beforeintervention
netimpact
bb
cc
aagrossimpact
change with intervention
change without intervention
impa
ct in
dica
tor
time
Technically speaking the net impact is defined as fol-lows an effect caused by a treatment (intervention) is the difference between the outcome under a treat-ment (T=1) minus the alternative outcome that would have happened without the treatment (T=0)
Partial least squares analysis
A multivariate statistical approach for the estimation of causal relationships It is a variance-based non-linear (ie no assumptions regarding the value distribution of a variable required) iterative method based on a linear regression model It allows the estimation of concrete values for latent (ie non-observablemeasurable) constructs with the help of manifest (ie observablemeasurable) indi-cators
Quality (rigorous) impact evaluations
As there is (i) a mistaken belief that () rigorous impact evaluations have to use () randomised con-trolled trials (RCTs) on the one side and (ii) the fact that most rigorous impact evaluations are being carried out by economists and econometricians (not evaluators) resulting in technically competent studies but not automatically very good evaluations on the other side more and more the term lsquoqual-ityrsquo impact evaluation is used to avoid misunderstanding and to focus on quality
Quasi-experimental designs
An attempt to uncover a causal () attribution even though a random pre-selection processes is not possible A quasi-experimental design is a type of experimental design ( RCT) where a randomised control group could not be established for either ethical or practical reasons and therefore the inter-vention grouprsquos situation is compared with those of a similar group of individuals not receiving inter-vention activities (comparison group)
Randomised controlled trial (RCT)
An () experimental study in which individuals (or groups of individuals) are randomly allocated (by chance alone) to an intervention group (treatment) or a control group (not being part of the interven-tion) RCTs seek to measure an interventionrsquos () net impact by comparing the two groupsrsquo situations before and after the intervention ( attribution)
Resilience The ability of a social or ecological system to absorb disturbances while retaining the same basic structure and ways of functioning the capacity for self-organisation and the capacity to adapt to stress and change
Rigorous impact evaluation
An () impact evaluation with strong emphasis on lsquoproduced byrsquo focusing on clear causationcausal attribution by establishing the counterfactual Assessing the effects produced by an intervention the () net impact requires a comparison of what has occurred with the intervention implemented ndash ie the () factual ndash with the situation without the intervention ndash ie the () counterfactual The term lsquorigorousrsquo is added to differentiate this approach from many ndash more traditional ndash () impact evalua-tion approaches
lsquoRigorisedrsquo impact evaluation
A () rigorous impact evaluation conducted in a real-life situation where necessary conditions are not (fully) given and which is therefore conducted as rigorously as is feasible
Sensitivity Sensitivity is the degree to which a system is affected either adversely or beneficially by climate vari-ability or change The effect may be direct (eg a change in crop yield in response to a change in the mean range or variability of temperature) or indirect (eg damages caused by an increase in the fre-quency of coastal flooding due to a rise in sea level)
Vulnerability Vulnerability is the degree to which a system is susceptible to and unable to cope with adverse effects of climate change including climate variability and extremes Vulnerability is a function of the char-acter magnitude and rate of climate change and variation to which a system is exposed its sensitiv-ity and its adaptive capacity
Glossary
Impa
ct E
valu
atio
n G
uide
book
for C
limat
e Ch
ange
Ada
ptat
ion
Proj
ects
6
Executive Summary
Phot
o copy
GIZ
Gue
nay
Ulu
tunc
ok
Monitoring and evaluating impacts is usually both costly and laborious Often it is also a challenging process particularly when complex causal linkages or uncertain framework conditions are involved All of this applies to climate change adaptation (CCA) projects which present further methodological and practical challenges that complicate the assessment of concrete adaptation results However provid-ing evidence about the impact of an intervention is often indispensable when it comes to generating knowledge about what works and what doesnrsquot ini-tiating organisational learning processes monitoring the progress made or simply being accountable for the use of resources This Guidebook seeks to sup-port project managers by providing an overview of different impact evaluation methods and how they can be applied to climate change adaptation projects The application of the Guidebook is further illustrated by a case study of an adaptation project in Bangladesh
Evaluations and rigorous impact evaluations ndash Whatrsquos the difference
While many evaluation approaches claim to pro-vide some kind of indication about project impacts (eg most significant change approach participatory rapid assessment) robust evidence can only be pro-vided by sophisticated evaluation designs that com-ply with scientific standards and are based on valid empirical data Evaluations that use such sophisti-cated designs and involve the collection of a consid-erable amount of empirical data are also called rig-orous impact evaluations (RIEs) The advantage of RIEs in contrast to lsquosofterrsquo designs is that they make it possible to clearly attribute observed changes to a particular intervention or at least make it possible to quantify the contribution an intervention has made
to these changes This Guidebook provides practi-tioners in the field of CCA with a selection of such RIE designs differentiated according to the type of impact (ie micro meso or macro-level impacts) they are able to measure
Rigorous impact evaluations (RIEs) make it possible to attribute observed changes to a particular intervention or at least quantify the contribution an intervention has made to these changes
The difficulties involved in measuring the impacts of CCA projects are widely recognised by practition-ers and the adaptation community (eg Bours et al 2014) The latter acknowledges the limited evidence on global adaptation progress and the gaps in the evolving adaptation science (FordBerrang-Ford 2015) For climate change mitigation progress can be tracked with reference to the global concentration of greenhouse gases (GHGs) For climate change adap-tation though there is no such single metric This explains the need to equip practitioners with the right methods to assess adaptation results and dem-onstrate the added value of their projects
Establishing causality on different levels
According to the OECDrsquos Development Assistance Committee (DAC) impact evaluations take into account intended and unintended positive and neg-ative as well as expected and unexpected changes They are supposed to not only provide information on all possible changes that have occurred during the implementation of an intervention but also to link these observed changes to their causes There-fore the establishment of causality (causeeffect relationship) is crucial in order to understand why particular incidents occurred during and after a pro-ject or programme In particular the question lsquoWhat would have happened without the project or pro-
7
grammersquo needs to be investigated in detail At this point a so-called counterfactual assessment (ie the comparison between what actually happened and what would have happened in the absence of the intervention) must be considered Since it is impos-sible to collect data on what would have happened if the intervention had not been implemented many RIEs are based on designs that include comparison data ie on individuals in a similar situation who were not exposed to the intervention
The RIE designs presented in this Impact Evaluation Guidebook are differentiated according to the type of impact they are able to measure ie
y micro (individual) y meso (institutional) or y macro (systemic)-level impacts
The aim of the Guidebook is to address the challenge of producing more and better impact evaluations giving practitioners the necessary know-how in order to plan implement and steer an RIE It enables practitioners to identify which of the RIE designs are suitable for successfully evaluating their par-ticular project or programme and also reveals the respective potentials and limitations of the differ-ent designs when it comes to their application in the field of CCA
The benefit of implementing RIEs for CCA projects
Why are RIEs increasingly being considered as an option for evaluating a CCA project The Paris Dec-laration on Aid Effectiveness which calls for more and better impact evaluations has created a cer-tain amount of pressure and consequently a rising demand to use RIEs This also explains why more funding is becoming available and the literature is growing in this area During the research for this Guidebook one crucial step was to understand how CCA projects were evaluated in the past and how they are currently evaluated So far RIEs have rarely been undertaken for CCA projects Addition-ally respected independent evaluation departments have seldom implemented RIEs with counterfactu-als for CCA projects up to now Since there is limited evidence on global adaptation progress to date RIEs have the capacity to redress the situation and gen-erate learning This is because they are conducted according to scientific quality standards that
i ensure the correctness of measurement findings (reliability)
ii exclude as far as possible alternative causes for an observed finding (internal validity) and
iii shift findings from an observed sample to a larger population (external validity)
No lsquoone size fits allrsquo RIE design
The numerous (methodological) challenges faced by CCA projects have led to intensive discussion among experts on how to adequately monitor and evaluate them The main challenges are
1 the lack of a conceptual agreement on definitions including what actually constitutes successful adaptation and therefore
2 the non-existence of a universal indicator (unlike for mitigation)
3 changes in the climatic context during a projectrsquos lifetime and the related problem of shifting base-lines
4 uncertainty about actual climate change patterns and their effects and
5 the long-time horizon of potential climate change impacts (see 22 for more details)
Individually none of these challenges are unique to CCA they also exist in projects in other sectors Together though they represent a fundamental difficulty for practitioners in terms of monitoring and evaluating project impacts Since adaptation projects vary widely in their scope and in the sec-tors they cover there is no such thing as a lsquoone size fits allrsquo evaluation design Whether and which RIE design(s) are to be used depends on various factors such as the level (micro meso or macro) at which the project generates an impact the availability of data and the time and resources available to the project For example at the systemic (macro) level a climate policy that is still at an early stage of implementation and project activities that have so far mainly focused on consultations and capacity building exercises may not be appropriate for a counterfactual assessment Nonetheless most CCA projects follow a multi-level approach which implies that a combination of two or more evaluation approaches may be required to measure the total impact of a project or programme
The selection of evaluation designs presented in this Guidebook is based on two considerations Firstly the design needs to comply with scientific standards in order to produce robust findings Secondly the selected designs should cover a wide range of differ-ent project approaches and all possible impact levels In particular six types of designs are discussed in detail
y experimental and quasi-experimental designs y matching techniques
Executive Summ
ary
8
y pipeline approach y regression discontinuity design (RDD) y time-series designs and y structural equation modelling (SEM)
Which evaluation design to choose ndash creating evidence at the individual level
At the individual level if a baseline is available (ex-ante and ex-post data from both the treatment and control group) three evaluation designs can be con-sidered for evaluating the CCA project an experi-mental quasi-experimental or regression disconti-nuity design
In an experimental design also known as a ran-domised controlled trial (RCT) a treatment and control group are compared with each other at two points in time ndash before and after the intervention ndash in order to estimate the counterfactual (what would have happened in the absence of the intervention) To be classified as an lsquoexperimentalrsquo design the ben-eficiaries need to be randomly selected during the planning phase of a project ie each person has the same chance of being a member of either the control or the treatment group If a random selection cannot be realised (eg due to self-selection bias or conscious selection) then such a design is called quasi-experi-mental In that case the group without treatment is called a lsquocomparison grouprsquo This means that some kind of matching technique needs to be applied dur-ing data analysis in order to control for selection bias
Thus both experimental and quasi-experimental designs are applicable to CCA projects as long as pro-ject activities aim at creating a direct impact at indi-vidual (micro) level The use of an experimental or quasi-experimental design calls for technical logis-tical and financial resources that mainly depend on the size and accessibility of the target group The data
selection process is often quite costly since a large team of enumerators is required Moreover there are two potential biases that may emerge and ham-per the process of attributing the observed change to project activities spill-over and contagion effects The former implies that the controlcomparison group indirectly receives a benefit from the project or programme and the latter occurs when differ-ent factors (eg projects operated by different agen-cies) affect the situation of the target population Nonetheless in terms of study design RCTs show the highest internal validity 2 and enable the clear attribution of interventions to impacts (the latter is also true of the quasi-experimental and pipeline approach) Regression discontinuity design (RDD) is a quasi-experimental evaluation method that can be applied if beneficiaries of the project are selected based on a special characteristic (eg income) of rel-evance to the desired impact that distinguishes them from the non-beneficiaries At the same time ben-eficiaries are compared with the comparison group in a number of other respects (eg location) Being a quasi-experimental design RDD does not require randomisation
If no baseline data have been collected beforehand two further evaluation designs can be considered at the individual level the pipeline approach and the panel design
The application of a pipeline approach is possible if a project is implemented sequentially (eg in dif-ferent regions) Thereby the selection of the target population that is not yet affected can serve as a quasi-comparison group for the group that is already affected It is important though that the treated groups of each phase are comparable Each data col-lection phase is just as labour-intensive and time-consuming as a quasi-experimental approach Panel designs a type of time-series design are in principle applicable for measuring impacts on all levels but require comparably larger sample sizes in order to be able to perform the necessary statistical calculations The special characteristic that differentiates the panel design from all the others mentioned above is that it requires data to be collected from identical units (eg persons households) at each point in time This makes it prone to attrition effects (ie decreasing sample sizes) over time It should also be mentioned that a panel design only makes it possible to estimate the contribution made by an intervention to observed changes but not to attribute these changes unambiguously
2 Internal validity is defined as the extent to which the variation of a dependent variable can be explained by the variation of a specific independent variable ie the extent to which alternative explana-tions for the variation of the dependent variable can be excluded
Impa
ct E
valu
atio
n G
uide
book
for C
limat
e Ch
ange
Ada
ptat
ion
Proj
ects
Phot
o copy
GIZ
Ste
inbe
rg
9
Creating evidence at institutional and system level
If an intervention aims to generate an impact at the institutional and system levels two further evalua-tion designs can be taken into account time-series designs and structural equation modelling
Time-series designs can be of particular use when it is necessary to cover longer periods than those set by a project or programme This makes them highly suitable for CCA projects where changes or results may unfold at later stages If data were collected repeatedly over a longer time period during the pro-ject time-series designs might be the best option It should be borne in mind though that these designs require a large number of repeated observations (at least about 10) in order to be able to perform the necessary statistical analyses for providing robust findings Finally if none of the designs fit structural equation modelling (SEM) could be an option for providing meaningful evidence about the impact of a project or programme It may be applied to meas-ure large-scale policy-based programmes that aim to affect an entire sector country or region SEM makes it possible to measure the statistical relation-ship between several influencing factors (eg public investments project funding disaster resilience of a population) This can be used to estimate the contri-bution of each of these factors one of which may be an intervention It should be pointed out that SEM and time-series designs only serve to estimate the contribution made by an intervention to observed changes
Conclusion and reading recommendation
The overview of available evaluation designs shows that there are several options for measuring impacts each with different potentials and limitations as well as methodological and data requirements This Impact Evaluation Guidebook provides practitioners with guidance on selecting the appropriate approach for a particular CCA project based on its characteris-tics and the available resources It also contains refer-ences to
y definitions and conclusions (blue framed boxes) y CCA project characteristics (green framed boxes) y practical tools and instruments (purple framed
boxes) y further reading material (orange framed boxes)
and y checklists summarising key issues (red framed
boxes)
Depending on the readerrsquos objective the different sections of the Guidebook may be of more or less interest However in order to obtain a comprehen-sive understanding of the subject matter we strongly recommended that you go through the lsquomust readsrsquo Section 12 which provides practical guidance for the planning and implementation of an RIE the summary at the end of Section 3 that contains an overview of the pros and cons of the different evalu-ation designs and leads you through the process of deciding which design to choose and Section 32 that focuses on the requirements for collecting large-scale quantitative data Once a particular evaluation design has been chosen the reader may consult the respective section that describes the chosen design in more detail (Sections 311 to 316) and as the case may be the further explanations in the annex If any of the technical terms or concepts are unclear the reader can consult the glossary MampE specialists who are not so familiar with the characteristics of CCA projects are advised to consult Section 2 in particu-lar Section 21 which discusses the key challenges of CCA projects with regard to their evaluation Finally the case study of an adaptation project in Bangladesh illustrates the application of this Guidebook
Phot
o copy
GIZ
Ran
ak M
artin
Executive Summ
ary
Impa
ct E
valu
atio
n G
uide
book
for C
limat
e Ch
ange
Ada
ptat
ion
Proj
ects
10
Are you planning to provide meaningful evidence of the impact of your climate change adaptation (CCA) project based on a sound empirical foundation Do you want to find out what difference it makes what changes can be observed in the field of inter-vention and how these changes are related to the project activities Or do you aim to gain knowledge about the inherent cause-and-effect relationships of a project learn from the past for the future fur-ther develop the project design or be accountable for the use of funds The decision about how to evalu-ate a project depends on a number of aspects such as the objectives of the evaluation its target groups and stakeholders or the available financial tech-nical human and time resources So the question lsquohowrsquo is closely related to several further aspects eg which design to implement which data collection instruments to apply or which analytical methods to choose
In this Guidebook we assume that you have decided to implement a rigorous impact evaluation (RIE) As the name says the focus of an RIE lies on the measurement and assessment of the impacts of a programme or project According to the OECDDAC evaluation criteria impact means any positive and negative primary and secondary long-term effect produced by an intervention directly or indirectly intended or unintended (OECDDAC 2006 6) Thus basically any observable change occurring in ndash and potentially beyond ndash a field of intervention presum-ably related to the evaluated programme or project may be subject to an RIE Another main characteris-tic of an RIE is that it aims to clearly attribute these observable changes to the intervention being exam-ined or at least to provide sufficient evidence to esti-mate the contribution the intervention has made to these changes Finally the term lsquorigorousrsquo implies that the measurement and attribution or contri-bution analysis is conducted in line with scientific quality standards This means that the findings of an RIE must meet the methodological demands that
apply to scientific research projects (ie that they should be reliable internally and externally valid and objective 3 These requirements ndash the rigorous measurement of impacts and attributioncontribu-tion analysis ndash determine the options for choosing a specific design or specific instruments and methods
As in every scientific research project the selection of the design further depends on the characteristics of the research subject With regard to impact evalu-ation the main characteristic to be considered is lsquowhat kind of impactrsquo needs to be evaluated While impact can be differentiated according to various category schemes (eg social political environmen-tal impacts) the most decisive aspect in terms of evaluation design is the lsquoaggregation levelrsquo at which it occurs This applies to climate change adaptation just as to any other field of intervention A distinction is usually made between three aggregation levels
y Individual (micro-level) impacts ie benefits or drawbacks for particular target groups (eg improving the resilience of a population to cli-mate change effects)
y Institutional (meso-level) impacts ie chang-ing the resources capacities performance etc of organisations such as enterprises governmental or non-governmental institutions (eg strength-ening the capacities of local authorities to deal with the socio-economic consequences of cli-mate change)
y Systemic (macro-level) impacts ie sectoral or regional developments (eg increasing the efforts of a government to reduce climate change-related causes of poverty or ill health)
The different accessibility of data at these levels implies that there is no lsquoone size fits allrsquo design For example while comparative analysis such as is applied in a quasi-experimental design (cf Sec-tion 311) may be suitable for measuring and assess-ing the livelihoods of climate migrants in a specified intervention area the influence on the capacities of basic urban service providers may call for the use of a structural equation modelling approach (cf Section 316) In the latter case there are many competing influences which makes it impossible to establish a comparison group (see Section 4 for an in-depth
3 Reliability internal and external validity and objectivity are count-ed among the most essential scientific quality criteria In empirical studies reliability indicates the correctness of measurement findings Internal validity means that the study design excludes alternative causes for an observed effect as far as possible while external validity means that the findings are in principle transfer-able from an observed sample to a greater population ie can be generalised Finally objectivity describes the independence of the measurement findings from their framework conditions (ie who collects the data who analyses them and under which conditions the findings are interpreted)
1 Introduction
11
discussion of this example) Given the complexity of climate change adaptation needs many CCA projects follow a multi-level approach Thus in an evalua-tion it may be necessary to combine several designs in order to assess the total effectiveness of such a project The Guidebook therefore aims to provide an operationally viable framework for evaluating CCA projects
According to this objective the structure of the Guidebook reflects the points to be considered when planning an RIE starting with a general overview of how to plan such an exercise (Section 12) This is fol-lowed by a discussion of the types and key features of CCA projects the typical challenges in the field of CCA and the way they are currently evaluated (Section 2) Section 3 presents the different options for rigorously evaluating CCA projects including references to the CCA-specific requirements and challenges outlined above The methodological pre-requisites for generating reliable empirical data on a large scale are also discussed Finally two exemplary evaluation designs are outlined on the basis of a GIZ case study (Section 4) including a brief presentation of their practical implementation The Guidebook closes with an annex containing further introduc-tions to some methodological aspects that need to be considered when designing an RIE a glossary of technical terms and further literature references
11 How to use the Guidebook
As the Guidebook aims to provide lsquohands-onrsquo infor-mation it contains a number of hints definitions practical examples links to further reading material and checklists which are highlighted as follows
Definitions and conclusions are presented in blue boxes followed by an exclamation mark
References to CCA projects are presented in green text boxes marked with a magnifying glass
Practical tools and exemplary instruments are presented in purple boxes flanked by two cogwheels
References and links to further reading material are presented in orange boxes highlighted with an open book
Checklists summarising key practical issues and recommendations for providing high- quality evaluation findings are presented in red boxes marked with a tick
Depending on the readerrsquos objective the different sections of the Guidebook may be of more or less interest However in order to obtain a comprehen-sive understanding of the subject matter we strongly recommend you to go through the lsquomust readsrsquo Section 12 which provides practical guidance for the planning and implementation of an RIE the summary at the end of Section 3 that contains an overview of the pros and cons of the different evalu-ation designs and leads you through the process of deciding which design to choose and Section 32 that focuses on the requirements for collecting large-scale quantitative data Once a particular evaluation design has been chosen the reader may consult the respective section that describes the chosen design in more detail (Sections 311 to 316) Some methodo-logical concepts discussed in these sections require some more methodological background and are therefore further explained in Annexes 52 to 56 If any of the technical terms or concepts are unclear the reader can consult the glossary MampE or evalua-tion specialists who are not so familiar with the char-acteristics of CCA projects are advised to consult Sec-tion 2 in particular Section 21 which discusses the key challenges of CCA projects with regard to their evaluation Finally the case study of an adaptation project in Bangladesh illustrates the application of this Guidebook
12 How to plan and implement an RIE for CCA projects
Letrsquos say you have decided to rigorously evaluate a CCA project How can this be done
First of all when planning such an endeavour you must realise that on the one hand an RIE needs to comply with scientific standards in order to produce valid and reliable empirical evidence of the impact of an intervention On the other hand you may face a number of obstacles such as time data and budget constraints (cf Bamberger 2004) which often make it difficult to adhere to such standards Planning any evaluation is therefore always a balancing act between fulfilling methodological demands as far as possible and keeping the evaluation feasible in practical terms To find the right lsquomiddle coursersquo it makes sense to begin the planning of an evaluation by answering a set of questions that determine its general framework
1 Introduction
Impa
ct E
valu
atio
n G
uide
book
for C
limat
e Ch
ange
Ada
ptat
ion
Proj
ects
12
Questions for determining the evaluation framework
` What is the object of the evaluation What is the scope of the evaluation in terms of observed period regions activities etc
` What are the objectives of the evaluation and which criteria will it use to assess the object of the evalua-tion
` Who are the recipients and who are the stakeholders of the evaluation ` What is the time frame of the evaluation When are the evaluation findings needed by ` Which human financial and organisational resources are available for the evaluation ` Who will implement the evaluation What qualifications and experience do the responsible persons have ` How will the evaluation be implemented What is the intended evaluation design Is it feasible with the
available resources ` Which data collection instruments and analysis methods will be applied Are the people in charge of data
collection and analysis familiar with these instruments and methods ` What tasks need to be performed during the evaluation and who will be in charge
As all of these aspects are interrelated it is crucial to answer these questions before actually start-ing to implement the evaluation For instance the scope and objectives depend on the stakeholders and recipients of an evaluation The design which determines the choice of instruments and meth-ods again depends on the available resources and qualifications and so on In view of these manifold interdependencies it makes a lot of sense to clarify document and communicate these issues among all involved stakeholders right from the outset Usu-ally when external consultants are commissioned to carry out an evaluation this is what should be out-lined in the terms of reference and agreed upon in the inception report if not before
When it comes to evaluating CCA projects some of these questions might be more difficult to answer than in other evaluations for instance the second question on the evaluation criteria Due to the lack of consensus about successful CCA (cf Section 22) it needs to be clarified right from the start what is understood by that concept in the specific context of
the project ideally in line with the project objectives Another important aspect which is not unique to the field of CCA however is the question of the sectoral expertise needed by the evaluation team Given the complexity of climate change-related issues a thor-ough understanding of the projectrsquos theory of change is a crucial prerequisite not only for data collection and analysis but also for integrating the findings into a larger (environmentaldevelopment-policy) framework particularly with regard to the projectrsquos contribution to overarching development goals (eg MDGs SDGs country development goals) Therefore it might be recommended to include a sector expert in the evaluation team who provides technical advice on assessing and interpreting the evaluation findings Finally to decide which evaluation design to choose the project characteristics need to be con-sidered (such as the uncertainty of the framework conditions in which it operates or the time frame within which its impacts can be observed) Section 3 of this Guidebook therefore provides several sugges-tions that take these and further characteristics into account
Phot
o copy
GIZ
Flo
rian
Kopp
13
Once these questions have been answered the first step of any evaluation is to develop a data collection plan (also called an evaluation matrix) structured according to the previously defined evaluation cri-teria A data collection plan is the reference docu-ment that guides the evaluation from instrument development to data analysis It provides a tabular
overview of the evaluation questions and hypotheses to be answeredtested the required indicators data sources and availability data collection instruments sampling procedures timing of the data collection data analysis methods responsibilities and required resources The following table gives an example of how such a data collection plan is usually structured
Table 1 Exemplary data collection plan
Analysis dimension
Hypothesis to be testedQuestion to be answered
Indicator Data source
Sample Data type Data collection instrument
Timing of data collection
Data analysis method
Respon-sible
Required resources
Direct outcomes
The livelihoods of climate migrants have improved
Proportion of climate migrants who have a job
Target group (climate migrants)
5 random sample of treat-ment and comparison group
Quantita-tive
Question-naire
Start of project end of project 3 years after end of project
t-test for inde-pendent samples
Evaluator no 1
1 working day (wd) for development of question-naire 2 wds for pre-testing 3 wds for implementing survey X euro for technical implementation
Income of respondent
Proportion of climate migrants who live in formal set-tlements
hellip hellip hellip hellip hellip hellip hellip hellip hellip
Working opportunities have been generated
No of working opportuni-ties
City corpo-rations
na Quantita-tive
Official statistics
Continuous monitoring
Time series analysis
Project officer
na
Types of working opportuni-ties
2 repre-sentatives of each involved city corpo-ration
Qualitative Interview with corporation representa-tives
Start of project then each 6 months update
Qualitative summary
Evaluator no 2
3 wds for conduct-ing interviews in each intervention area
Use of working oppor-tunities by target group
Target group
5 random sample of treatment group
Quantita-tive
Question-naire
End of project
Descriptive statistical analysis
Evaluator no 1
See above
Reasons for acceptance or non-acceptance of working opportuni-ties
Target group
3 groups of 6 to 10 persons in each interven-tion area
Qualitative Focus group discussion
End of project
Qualita-tive data analysis
Evaluator no 2
1 wd for conduct-ing FGD in each intervention area
hellip hellip hellip hellip hellip hellip hellip hellip
Access to health services has been improved
hellip hellip hellip hellip hellip hellip hellip hellip
hellip hellip hellip hellip hellip hellip hellip hellip hellip
hellip hellip hellip hellip hellip hellip hellip hellip hellip
Besides the construction of the indicators another important issue during the development of a data collection plan is the identification of the data sources If data is already available the question of whether they are sufficient for answering an evalu-ation question or whether additional data need to be gathered must be resolved If the available data are insufficient it needs to be decided which further data sources can be tapped and which instruments are applicable There are a number of factors to be
taken into account when deciding for or against a certain instrument including the costs incurred and the human resources and time required to complete the data collection For this it is necessary to draw up a plan of staff time and a finance which also shows who will be carrying out the respective tasks at what times and what costs will be involved The following flow chart summarises the typical sequence of an evaluation
1 Introduction
Impa
ct E
valu
atio
n G
uide
book
for C
limat
e Ch
ange
Ada
ptat
ion
Proj
ects
14
Figure 1 Flow chart for implementing an RIE
Clarication of objectives stakeholders and recipient(s) of the evaluation
Development of a data collection plan Formulation of evaluation questions
and hypotheses Development of indicators Identication of necessary data
sources
Development of survey design and data collection instruments
Data collection and quality check
Data complete
Data aggregation and analysis
Reporting Interpretation of ndings Development of conclusions
and recommendations
Data available
Yes
No
Yes
No
stakeholders need to be clarified A good starting point for considerations of this nature is provided by the feasibility standards established by the American Evaluation Association (AEA) which are intended to ensure lsquothat an evaluation is planned and conducted in a realistic prudent diplomatic and frugal wayrsquo 4
4 Cf httpwwwevalorgpcmldfid=103
During any evaluation a number of precautions need to be taken to ensure that the evaluation find-ings are not only valid and reliable but also well-understood and widely accepted Therefore all involved stakeholders should be informed that an evaluation is being conducted and why Further-more the roles and responsibilities of the different
Feasibility standards of the American Evaluation Association (AEA)
` F2 ndash Practical Procedures Evaluation procedures should be practical and responsive to the way the pro-gram operates Refers to the problem of the feasibility of scientifically ideal collection procedures with regard to the costs they incur and to ethical implications
` F3 ndash Contextual Viability Evaluations should recognize monitor and balance the cultural and political interests and needs of individuals and groups Points out the significance of taking into account the interests of all the stakeholders in a balanced way This is important since the use of the evaluation findings depends to a high degree on acceptance by the various stakeholders and because access to the relevant information often depends on peoplersquos willingness to cooperate
` F3 ndash Resource Use Evaluations should use resources effectively and efficiently Points to the necessity of taking into account the cost-benefit ratio in the implementation of evalua-tions In calculating the costs it is important to consider not only the consumption of tangible (financial) resources but also the intangible outlay (eg the use of time and deployment of human resources) though this can mostly be converted back into financial costs More difficult by far is the quantification of the ben-efit since it is not possible to provide any specific information about the expected findings in advance
15
When evaluating CCA projects it is especially impor-tant to consider the question of contextual viability as interventions may not always generate directly tangible benefits for the target groups All the more important then is to highlight the long-term objec-tives of a project when approaching the target groups for data collection Furthermore due to the usually large number of different stakeholder groups in CCA projects it may be necessary to start by iden-tifying the different needs capacities objectives and strategies of the different groups as well as their interrelations before collecting data For instance when a project focuses on adaptation to diminish-ing natural resources it is necessary to include not only the project beneficiaries but all groups who in principle depend on these resources or have a right to use them Ignoring the often complex actor con-stellations could lead not only to considerably biased evaluation findings (eg overestimation of impact) but also to the refusal of stakeholders to provide important information
Besides these formal aspects a number of further organisational issues need to be taken into account during the evaluation process such as the confi-dentiality of data Given the need to maintain the anonymity of those who provide the information certain rules must be adhered to when providing feedback on the evaluation findings Apart from the fact that there is a moral obligation to the lsquoinform-antsrsquo (ie interviewees participants in written sur-veys etc) not to abuse their willingness to cooperate a number of statutory provisions also exist
Regardless of how well an evaluation is planned and organised unforeseeable events can have nega-tive effects on its scheduling and findings The most common obstacles that must be anticipated when conducting the evaluation include the refusal of the informants to cooperate (refusal to be interviewed etc) and the occurrence of negative unintended effects in data collection (eg a rapidly deteriorat-ing work climate due to the respondents not having been given sufficient information about the evalu-ation) It is advisable in all cases to seek an oppor-tunity to talk to those concerned and if appropriate to arrange a meeting at which everyone is given the opportunity to present their point of view and work together to find solutions for instance through alter-native survey instruments or questionnaires In this situation it is of key importance that the evaluators are able to give a credible impression of their inde-pendence and neutrality
A potentially controversial question is whether or not recommendations should be included in the report and if so how they should be presented If it is decided when clarifying the assignment that recom-mendations will be made it is necessary to point out that they are intended as aids to orientation In other words it must be made clear what the evaluation can achieve and what it cannot in order to avoid unrea-sonable expectations This is even more true of the evaluation of CCA projects as due to the uncertainty of future climate developments a recommendation given at one point in time can prove to be wrong a few years later Therefore it is even more important to develop such recommendations together with the stakeholders and probably further climate experts in a participatory manner eg in the context of a work-shop Furthermore it may also be necessary to clarify the spatial and temporal validity of these recommen-dations and the assumptions under which they were made as regards the development of the framework conditions In any case it is necessary to differentiate between the evaluation findings and the conclusions and recommendations drawn from them
We recommend the following books and articles for further reading about practical evaluation requirements
Bamberger M Rugh J Church M Fort L Shoestring Evaluation Designing Impact Evaluations under Budget Time and Data Constraints American Journal of Evaluation 25(1) 2004 pp 5 ndash 37
Silvestrini S Organizational Aspects of Evalu-ations in Stockmann R (ed) A Practitioner Handbook on Evaluation Edward Elgar Cheltenham 2010
Stockmann R (ed) A Practitioner Handbook on Evaluation Edward Elgar Cheltenham 2010
1 Introduction
Impa
ct E
valu
atio
n G
uide
book
for C
limat
e Ch
ange
Ada
ptat
ion
Proj
ects
16
Phot
o copy
GIZ
Guy
2 Evaluating climate change adaptation projects
The first section of this chapter (21) provides an overview of the types and key features of CCA pro-ject interventions with regard to each level (micro meso macro) The second section (22) describes the challenges when it comes to evaluating CCA projects given their complexity Finally the third section (23) summarises currently used designs and data collec-tion methods to evaluate the results of CCA projects and shows their main shortcomings with regard to the quality of the evaluation findings
21 Types and key features of climate change adaptation projects
While most CCA projects follow a multi-level approach specific interventions (measures activi-ties) of such projects usually focus on a singular impact level be it on a particular target group such as climate migrants (individual level) local authori-ties (institutional level) or the legal and policy frame-work (system level) It is also important to under-stand that all three impact levels are interconnected For instance legal or policy changes (system level)
will necessarily have effects on the institutional level (eg local authorities companies) and the individual level (eg residents of a country or region) The indi-vidual benefits perceived by a specific target group (eg households in an intervention area) may even-tually be scaled up to the institutional and system level (eg through spill-over or other dissemination effects) The reason why it is important to make this distinction though is that the choice of the appro-priate evaluation design depends on the targeted impact level
211 Adaptation projects addressing the individual level
A particular type of adaptation intervention pri-marily affecting the individual level is the so-called community-based adaptation (CBA) approach which is often facilitated by a local organisation and can be implemented like a small-scale development project The primary objective of such an interven-tion is to improve the capacity of local communities to adapt to climate change applying an integrated approach that often combines traditional knowl-edge with innovative strategies Capacity building and awareness-raising are essential elements of such interventions In fact UNDP has found that com-munities and even policy-makers in target countries have limited knowledge of climate change issues especially of adaptation (UNDP 2009) Thus in order to be able to participate effectively locals must be supported to develop a good understanding of these issues which is why a lot of investments are being made in capacity building However working with communities can be a process that requires consider-able time financial resources and energy But it pays off because community engagement generates own-ership (at best) and enables empowerment giving communities a voice and the chance to participate Although CBA projects are situated at local level development cooperation aims to promote action at all levels to achieve systemic and sustainable change Relevant sectors for adaptation include rural devel-
17
Phot
o copy
GIZ
And
reas
K
opment agriculture water resources management coastal management disaster risk management and public health Typical practices address adjust-ments in the behaviour of individual groups as well as in the use and development of technologies (eg construction of large reservoirs adjustments to tra-ditional farming practices and risk reduction for the rural population)
The Community-Based Wetland Management Project (BIRAM) (UNDP 2015a) implemented by Boudhi Investigate and Research Assembly of Men supported by UNDP with funding from the Least Developed Country Fund the Government of Bang-ladesh and the UK Department for International Development is an example of a project that focuses on the micro level in five villages in Bangladesh (community level) The indigenous peoples living in the project areas are confronted with declining rain-fall rising temperatures and decreased water levels due to climate change A nearby stream is the main source of irrigation and fish farming Climate change forecasts predict that temperatures will continue to rise generating aridity in the target regions which will have negative consequences on ecosystems and livelihoods The project focuses on promoting sus-tainable crop varieties improved agricultural prac-tices and improved water collection Moreover it will train community members in alternative income-generating activities to reduce pressure on natural resources and diversify income sources 5
The Sustainable Agricultural Programme (PROAGRO I amp II) (GIZ 2015a) ndash a trilateral cooperation arrange-ment between Bolivia Germany and Sweden ndash is an example of a project that focuses on the individual level Its objectives are the following (1) to increase the resilience of smallholders in arid and semi-arid regions of Bolivia to climate change risks (2) to conserve and distribute scarce water resources as part of integrated watershed management and (3) to increase income from agricultural production A fourth component ndash ie adaptation to climate change ndash was integrated into PROAGRO II implemented by GIZ on behalf of BMZ A vulnerability assessment was conducted in 2013 following the approach of GIZrsquos lsquoVulnerability Sourcebookrsquo (Cordero 2014) The main climate risk is water scar-city which will probably increase in future and will have a negative impact on agricultural production The findings of the vulnerability assessment show that PROAGRO reduced the vulnerability of small-holder farmers by adjusting crop types and sowing dates and replacing old irrigation technologies with
5 More UNDP community-based adaptation projects can be found under the following link httpwwwundp-almorgprojectsspa-community-based-adaptation-project
more appropriate ones which enhanced water effi-ciency in the parcels (id) A mid-term evaluation was also conducted in 2013 using a mainly qualitative evaluation design (analysis of primary and secondary data semi-structured interviews and surveys with national counterparts strategic partners and target groups direct observation focus group discussions) (Kronik 2013)
212 Adaptation projects addressing the institutional level
Effective institutions are a major factor when it comes to the ability to respond to growing climate risks since they are designed to perform a set of functions related to decision-making and imple-mentation (Dixit et al 2011) They play a critical role in increasing societyrsquos capacity to adjust as condi-tions shift and as new climate change knowledge appears In a constantly changing climate the pro-cess of institutional change represents an impor-tant aspect of building adaptive capacities ie the ability of a national government and other entities and individuals to design and implement effective adaptation strategies or to react to negative climate stresses (Dixit et al 2011) Since national policy-makers international negotiators and funders assist in developing methods and guidelines for adapta-tion planning it is essential that they include a focus on building institutional capacity to adapt to cli-mate change impacts One of several ways in which climate-related challenges may require institutions to make significant adjustments involves meeting the needs of the most vulnerable people who tend to be poor or marginalised They usually have few resources with which to adapt and little say in public decision-making processes
Various CCA projects comprise interventions that aim at making an impact at institutional level One example is the National Adaptive Capacity (NAC) framework launched by the World Resources Insti-tute which assists governmental agencies in includ-
2 Evaluating clim
ate change adaptation projects
Impa
ct E
valu
atio
n G
uide
book
for C
limat
e Ch
ange
Ada
ptat
ion
Proj
ects
18
ing institutional capacity development in their adaptation planning processes It enables its users to systematically assess institutional strengths and weaknesses that may help or hinder adapta-tion National adaptation plans may then be better designed to make best use of strengths or remedy weaknesses (Dixit et al 2011) Another example is the Public Investment and Climate Change Adapta-tion (IPACC) project (GIZ 2015b) conducted by GIZ on behalf of BMUB in Peru The aim of the project is to raise awareness ndash among national and regional policy-makers and relevant technicians ndash of the potential environmental social and economic costs of climate change and to encourage decision-makers to consider climate-relevant criteria when formulat-ing and approving public investments Hence meth-ods were designed to integrate disaster risk man-agement and CCA considerations into a countryrsquos national investment planning to increase the adap-tive capacity and reduce climate-related risks (GIZ 2012) Next to initiatives in the policy field there are also CCA projects carried out by non-governmental organisations The DANIDA-funded project Capac-ity Strengthening in Least Developed Countries (LDCs) for Adaptation to Climate Change (CLACC) (IIED 2015) which is operated under the auspices of the International Institute for Environment and Development (IIED) strives to strengthen the capac-ity of civil society organisations in LDCs to adapt to climate change and foster adaptive capacity among the most vulnerable people This implies integrating adaptation to climate change into the work of NGOs and simultaneously setting up a system to share knowledge and experience among the adaptation community In this context IIED helped to establish the International Centre for Climate Change and Development (ICCCAD) in Bangladesh which pro-vides training on CCA and development for NGOs donors media government staff and the private sec-tor
213 Adaptation projects addressing the systemic level
CCA projects aiming to generate system-wide impacts often follow a top-down approach and com-prise interventions at global regional or national level Such interventions target policy changes (eg sectordevelopment strategies) changes in public opinion on a particular topic (eg climate change adaptation requirements) or changes in economic framework conditions (eg introduction of climate
change- adapted value chains 6) With regard to CCA projects two potential intervention types fall under this category country level and global or regional initiatives At the country level CCA projects provide policy advice to support the elaboration of national climate change strategies and action plans or to cre-ate awareness and facilitate consultation among (government) stakeholders The aim is to give con-sideration to climate change risks in laws planning policies and negotiations Such interventions also support the design of targeted policy strategies eg to climate-proof 7 the agricultural sector and intro-duce new crops cropping methods or efficient irri-gation technologies
An example of a CCA project that comprises such interventions at the federal level is the Climate Sup-port Programme (CSP) (GIZ 2015c) launched by GIZ on behalf of BMUB in South Africa in 2009 The projectrsquos aim is to assist the Department of Envi-ronmental Affairs (DEA) in reducing South Africarsquos carbon footprint mitigating climate change impacts and strengthening the countryrsquos resilience to climate change (GIZ 2013) The project supported the devel-opment and implementation of the Governmentrsquos white paper on the national climate policy 8 by pro-viding expertise contributing also to consensus-building among important stakeholders Section 12 of the white paper clearly mandates the develop-ment of an adaptation MampE system Moreover sector departments have started the process of reviewing their policies to align them with the white paper Additionally together with the BMZ-funded project lsquoEffective adaptation finance (MampE Adapt)rsquo GIZ is supporting the development and implementation of a monitoring and evaluation (MampE) system for adap-tation
6 See for instance the project lsquoPromoting a Value Chain Approach to Climate Change Adaptation in Agriculture in Ghanarsquo which aims to help reduce climate-induced risks and thereby contrib-ute to the achievement of food security and income-generating objectives for rural communities by focusing on the improvement and adaptation of the cassava value chain wwwthegeforggefsitesthegeforgfilesgef_prj_docsGEFProjectDocumentsCli-mate20ChangeGhana20-202843682920-20Promot-ing20Value20Chain20Approach20to20Adaptation20in20Ag1-17-20122020ID436820202020Ghana20SCCF20Full20Project20Document20for20Re-submis-sion2020Jan20201220cleanpdf
7 lsquoClimate-proofingrsquo is a methodological approach applied by GIZ that integrates climate change aspects into development plan-ning The reason for climate-proofing projects or programmes is the following even if GHG emissions are drastically re-duced climatic changes will still occur which will be fatal for some pop-ulations and ecosystems and will have negative con-sequences on the countryrsquos economy These climatic changes will gradually become more visible Consequently when de-signing a project it is of the utmost importance to consider climate change aspects especially if the project is supposed to run for a longer period of time (Hahn M 20102-6)
8 See White Paper of the National Climate Change Response Policy (published in 2011) httpravaqsensnetthemestheme_emissions111012nccr-whitepaperpdf
19
CCA projects with a global dimension include vari-ous international players who work together to achieve a common goal They mainly focus on con-ceptual work capacity building and knowledge exchange The institutions involved are responsible for the development of methods and tools for novel topics such as national adaptation plans (NAPs) and also for piloting these tools and methods in partner countries thereby cooperating with existing pro-jects within these countries In a best-case scenario the results and experiences of the CCA projects are shared with the CCA community to enable an exchange of knowledge and good practices through webinars workshops or online platforms 9 One example is the National Adaptation Plan Global Support Programme (NAP-GSP) (UNDP 2015b) for Least Developed Countries which is a UNDP-UNEP programme financed by the Least Developed Coun-try Fund (LDCF) and the Special Climate Change Fund managed by the Global Environment Facility (GEF) It helps LDCs 10 and developing economies to advance with their NAP 11 process through technical assistance provides tools and training to support the NAP process within the country and facilitates an exchange of lessons and knowledge through South-South and North-South cooperation The formula-tion and implementation of NAPs helps to identify the medium- and long-term adaptation needs of a technical institutional and financial nature and simultaneously develop and implement strategies and programmes to address these needs 12
22 Key challenges of climate change adaptation projects
CCA projects (including those with a partial focus on adaptation) pose specific methodological chal-lenges 13 which need to be taken into account throughout the whole project cycle These chal-
9 Examples of online platforms of this kind are wwwadaptation-communitynet wwwundp-almorg wwwadaptationlearning-mechanismcom wwwclimate-evalorg and wwwmediation-pro-jecteuplatform Europe-wide wwwclimate-adapteeaeuropaeu
10 26 LDCs have requested help with their NAP process11 The NAP process was initiated under the Cancun Adaptation
Framework (CAF)12 This paragraph is based on the information obtained on the
homepage (wwwundp-almorg)13 It must be mentioned however that the methodological chal-
lenges described below are by no means unique to CCA projects For instance most SWAPs have long time horizons (eg when re-forming a TVET system it may take several decades for benefits to become visible) uncertainty and shifting baselines are a problem in most fragile contexts and universal indicators (except maybe for education and economic development) are still lacking in most fields of intervention
lenges make it necessary to fine-tune development agenciesrsquo current MampE frameworks especially with regard to the development of indicators baselines milestones targets and the timing of MampE activities which need to be adjusted to the longer time horizon of the majority of adaptation initiatives These chal-lenges are outlined below
First of all the remaining ambiguity of the concepts used may impede the development of appropriate verifiable and measurable indicators There is no clear and commonly accepted definition of adapta-tion adaptive capacity and climate-resilient liveli-hoods which makes it difficult to define objective indicators There is also a lack of consensus about what actually constitutes successful adaptation Consequently there are no universal indicators for CCA projects since they depend not only on the individual project but also on the context scale sec-tor and location Unlike mitigation for which the amount of GHG emissions in the atmosphere serves as a universal MampE indicator the success of an adap-tation intervention cannot be measured by a single indicator Qualitative assessments are as important as quantitative ones since many aspects of adapta-tion are lsquosoftrsquo (eg institutional capacity behaviour change etc)
The establishment of a baseline is considered another major challenge for evaluating climate change adaptation projects A baseline is crucial to measure the projectrsquos impact as it provides a refer-ence point against which a change can actually be measured In climate change adaptation projects future climate change effects also need to be taken into account (ie a baseline projection of how the climate is going to evolve during the project term and beyond) Since climate change is most likely to unfold differently than assumed in the projection experts speak of a lsquoshifted baselinersquo Shifting baselines are considered to be problematic in terms of plan-ning since they change the context of the adaptation intervention
Thus uncertainty about actual climate change pat-terns and their effects is another aspect that needs to be addressed It may be impossible to anticipate when for example the next flood will occur in order to analyse to what extent adaptation took place in situ compared to the situation before the interven-tion Moreover adaptation strategies marked as suc-cessful in the short term may have negative impacts on vulnerability in the long term
2 Evaluating clim
ate change adaptation projects
Impa
ct E
valu
atio
n G
uide
book
for C
limat
e Ch
ange
Ada
ptat
ion
Proj
ects
20
Finally the long time horizon of potential climate change impacts poses an additional challenge that needs to be considered when designing the MampE framework for CCA projects Long-term impacts are unlikely to result from the project alone Instead they are rather generated by a series of factors or other interventions in the specific area Complexity increases when trying to identify the short-term and long-term outcomes that can be attributed to a par-ticular intervention For example the choice of farm-ing practices in a sustainable agriculture project also reflects the thought given to current or future cli-mate change However it remains difficult to isolate and assess the individual adaptation components reflected by these choices
23 Review of current methods to evaluate the results of CCA projects
The projects reviewed are conducted in developing countries and emerging economies 14 For the pur-pose of this guidebook emphasis was placed on the methodology ie the analysis of currently used eval-uation designs (experimental quasi-experimental ex-post etc) the presentation of the main data col-lection methods used (focus group discussions inter-views surveys direct observation etc) and lastly whether a quantitative qualitative or mixed-method approach was used The findings are summarised in Annex 51
During the research process two problems became visible first little use is made of RIEs in CCA projects which relates to the second finding namely the diffi-culty of ascertaining which evaluation methodology was applied Often it was difficult to identify which design was used since there was no reference to it in the methodology section of the evaluation Due to this difficulty we checked for keywords in the evalu-ation papers (eg randomisation randomised con-trolled trials (RCTs) control or comparison group quasi- and experimental design counterfactual and so forth) Very often none of these keywords were found in the whole document which is why there is no reference to the evaluation design in the table in Annex 51
14 Three different research approaches were used for this study (a) a simple google search using the following keywords lsquoclimate change adaptation impact evaluation vulnerability vulnerability assessments monitoring and evaluation of climate change adaptation adaptive capacity and resiliencersquo (b) a review of the reference lists of the journal articles found in (a) and (c) the scan-ning of relevant evaluations carried out by development agencies international organisations or independent evaluation institutions
Prowse and Snilstveit came to a similar conclusion in their study Impact Evaluation and Interventions to Address Climate Change A Scoping Study 15 pub-lished in 2010 saying that just a few RIEs were con-ducted (using mainly a quasi-experimental design) Although Prowse and Snilstveit recognised the chal-lenging nature of CCA projects this does not impede the use of RIEs Especially with regard to the increas-ing financial resources made available for climate change mitigation and adaptation projects it is important to make use of RIEs because evidence of the effectiveness of spending is required
Challenges inherent to evaluations of CCA projects involve the poor quality of the baseline (if there is one at all) randomisation and the development of a sample size which is often not representative The possible spreading of benefits from target to non-target groups is another limitation often referred to (see example below) In general data triangulation ie using a combination of qualitative and quantita-tive indicators (mixed-method approach) is visible in almost all CCA projects 16 which can be seen as a sign of progress in this field Just to name one example the evaluation of the project lsquoChronic Vulnerability to Food Insecurityrsquo implemented by the World Food Programme triangulates data from qualitative and quantitative sources It uses qualitative data from focus group discussions with community mem-bers and key-informant interviews with commu-nity opinion leaders and quantitative data involv-ing about 3000 randomly sampled households (cf Annex 51)
Another interesting finding concerns the way inter-national organisations conduct evaluations These evaluations are aligned with the Paris Declaration on Aid Effectiveness basing the evaluation mainly on the assessment of effectiveness efficiency relevance impact and sustainability (the DAC criteria) There is often no reference to the applied methodology
To name an example consider the Pacific Integrated Water Resource Management (IWRM) project (UNDP 2015c) established in 2009 which aimed to improve water resource and wastewater management and increase water use efficiency in Pacific island coun-tries in order to balance overuse and conflicting uses of scarce freshwater resources The evaluation is based on the DAC criteria for evaluating develop-ment assistance but it does not explain which design
15 Impact Evaluation and Interventions to Address Climate Change A Scoping Study httpwwwtandfonlinecomdoipdf10108019439341003786729
16 Although CCA evaluations are sometimes based on desk reviews and qualitative indicators (eg stakeholder interviews focus group discussions direct observations etc) and often lack robust quantitative data (see for example project Ndeg 31 in the table in Annex 51)
21
was applied In the methodological part only the data collection instruments are outlined (ie desk review and analysis interviews site visits) The same is true of many other evaluations within the Evalu-ation Resource Centre 17 of UNDPrsquos Independent Evaluation Office 18
In general when screening evaluations conducted by international organisations (see for instance the database of IFAD and the Global Environment Facil-ity (GEF) it becomes obvious that they have not conducted many rigorous impact evaluations so far hence there is not much experience in this field Take the Independent Evaluation Office of IFAD for instance narrowing down the search to look only at impact evaluations there is just one evaluation that was conducted in Sri Lanka in 2013 (Dry Zone Livelihood Support and Partnership Programme (DZLISPP)) 19 Although it is the only impact evalua-tion there is a clear methodology behind it For the first time IFAD undertook extensive data collection and analysis including a qualitative survey (30 key-informant interviews with project staff and relevant government officials) 41 focus group discussions with beneficiaries and a quantitative survey of over 2560 households Due to an absence of baseline data (which is often the case in CCA projects) two strate-gies were applied (1) an attempt to reconstruct the baseline through recall methods and (2) the use of a quasi-experimental design that does not strictly require baseline data Further challenges experienced were sample selection bias due to targeting and the potential spreading of benefits from target to non-target groups
The Independent Evaluation Office of the GEF offers more than one impact evaluation but the overall number is modest Furthermore the few impact evaluations that have been conducted only concern climate change mitigation projects (there are none for CCA projects yet) However although the GEF has not yet implemented many impact evaluations it
17 Evaluation Resource Centre httpercundporgindexhtml18 Independent Evaluation Office httpwebundporgevaluation19 Dry Zone Livelihood Support and Partnership Programme
(DZLISPP) httpwwwifadorgevaluationpublic_htmleksystdocimpact2013srilankaindexhtm
is clear that they deal with this topic since there are many publications that emphasise the impact evalu-ation of climate change projects It will surely be only a matter of time until there is a spillover to CCA pro-jects too In 2014 the GEF Independent Evaluation Office together with a number of multilateral and bilateral organisations including GIZ hosted the Sec-ond International Conference on Evaluating Climate Change and Development which aimed to promote and develop methods and good practices for MampE of adaptation and mitigation 20 A book of conference proceedings will be published by Springer in 2016
To be fair it has to be stressed that many CCA pro-jects focused on policy development and capacity building exercises at institutional level for which RIEs may not be an adequate evaluation design The National Adaptation Plan Global Support Pro-gramme or the Climate Finance Readiness Pro-gramme are examples where RIEs might be compli-cated These are global CCA projects that focus on policy development capacity building at institu-tional level and making sure that the target country is ready (institution-wise) to receive the financial resources earmarked for CCA projects
It should also be mentioned that lsquolearningrsquo is in many cases not the focus of the evaluation Frequently evaluations focus rather on the question lsquoHave we done what we said we wouldrsquo (accountability) than on lsquoWhat happened and whyrsquo (learning) This is especially true of development organisations (exam-ples are outlined in the table in the annex) Addi-tionally while screening CCA projects carried out by development organisations it became clear that many projects are still ongoing This means that an evaluation still has to be completed At best this pub-lication may raise awareness among practitioners to consider RIEs for CCA projects in order to increase the use of this evaluation design gain relevant expe-rience and simultaneously obtain valuable findings that can be shared with the adaptation community
20 Presentations and videos from the conference can be accessed at httpswwwclimate-evalorgevents2014-conference
Phot
o copy
GIZ
Ran
ak M
artin
2 Evaluating clim
ate change adaptation projects
Impa
ct E
valu
atio
n G
uide
book
for C
limat
e Ch
ange
Ada
ptat
ion
Proj
ects
22
3 Rigorous evaluation designs and examples of applicability in climate change adaptation projects
Having discussed the types and key features of CCA projects and the way they are currently evaluated this section will now provide an overview of the strategies and prerequisites for evaluating the impact of such projects bearing in mind their characteris-tics The first section thus deals with the potentials and limitations of different research designs used for impact evaluations when it comes to their applica-tion in the field of climate change adaptation (31) Section 32 discusses the methodological require-ments for providing reliable data on a large scale with a particular focus on adequate survey sampling techniques
31 Overview of evaluation designs ndash potentials and limitations for climate change adaptation projects
Before going further into the topic as such the term lsquodesignrsquo should be briefly explained as it is occasion-ally used with different meanings and confused with other terms such as lsquomethodrsquo or lsquoinstrumentrsquo
Generally speaking a research design describes how a research question is intended to be answered Evaluation designs usually differ with regard to the points in time when data is collected the data sources and the way the data is analysed (eg by com-paring target group with comparison group data) Most common evaluation designs are ex-post facto designs and single-difference designs (ie before-and-after comparisons or group comparisons) How-ever as these designs are not suitable for evaluating impact ndash at least when used as the only means during an evaluation ndash they are not discussed further in this Guidebook Instead we shall go on to present alter-native and more sophisticated evaluation designs that can provide sufficient empirical evidence
about the attribution or at least contribution of an intervention to observed changes We will explain the types of projects to which they can be applied which time budget and data resources they require and how informative their findings are We will also assess how valid and reliable the evaluation findings are provided the design has been implemented cor-rectly
A research design describes how a research question is answered
The descriptions start with experimental and quasi-experimental designs (311) which are favoured by a number of evaluation experts (eg DufloGlen-nersterKremer 2008 see also literature list at the end of this section) and considered by some as the lsquogold standardrsquo for impact evaluation In 312 an alternative approach for estimating the impact of an intervention is discussed so-called propensity score matching which may be suitable when poten-tial beneficiaries cannot be randomly assigned to a treatment and comparison group The next sec-tion deals with the so-called pipeline approach (313) This approach is of particular use if a project is implemented sequentially but aims to support target groups that feature comparable characteris-tics Another approach that is useful when the treat-ment decision depends on the beneficiary present-ing a threshold level of a specific characteristic (eg income or age) called the regression discontinu-ity approach is discussed in Section 314 In Sec-tion 315 the potentials of time-series evaluation designs are discussed by means of the so-called panel analysis Time-series designs are of particular value for long-term projects and observation periods and when complementary statistical data is acces-sible The last design discussed in detail is suitable for projects that aim to make a difference at policy level (type I and II projects) as it can provide empiri-cal evidence about their contribution to changes in a complex environment taking external influences into account (316) The design is called structural equation modelling and comes from the field of econometric research where it is commonly used to identify causal linkages between social and eco-nomic phenomena such as education and health The section closes (317) with a tabular overview of the applicability of the evaluation designs discussed above their methodological and practical require-ments and the validity of their findings (if applied correctly) The purpose of this overview is to enable the reader to choose a particular design bearing in mind the adaptation-specific project characteris-tics and given the financial technical and logistical framework conditions
311 Experimental and quasi- experimental designs
The following section outlines the main characteris-tics potentials and limitations and methodological prerequisites for applying an experimental or quasi-experimental design during an evaluation We will also discuss the kind of CCA-related interventions to which such designs can be applied and which meth-odological skills and (financial human and time) resources are required
Generally speaking experimental and quasi-exper-imental designs (in the field of applied empirical social sciences) consist of a comparison of two groups at two points in time One group receives a certain treatment (intervention measure activity etc in the following named lsquotreatment grouprsquo) and the other does not A design is called experimental or more precisely a randomised controlled trial (RCT) if the members of each group are selected at random This means that (ex-ante) the probability of each indi-vidual being a member of the treatment group is the same 21 The group that has not received any treatment is then called a lsquocontrol grouprsquo If such a random selec-tion cannot be ensured (eg due to self-selection bias or conscious selection) then such a design is called quasi-experimental In that case the group without treatment is called a lsquocomparison grouprsquo 22 However in order to simplify matters we will consistently use the term lsquocomparison grouprsquo in the remainder of this document
Experimental designs require a randomised selection of participants for an intervention
The purpose of employing such a design is to allow for attributing observable changes in a given popu-lation to an intervention This is done by estimating the so-called counterfactual ie the hypothetical situation of that population without having received the treatment In other words we do so by answer-ing the question lsquoWhat would have happened if no intervention had taken placersquo While estimating the counterfactual is also the foundation for calculating the treatment effect in pre- and post-test analyses and
21 It has to be highlighted that the equal probability that individuals of a given basic population will receive a treatment needs to be considered at the project planning stage That means that an RCT can only be applied if the project design allows for a random selec-tion of the treatment group
22 The rationale behind this distinction is that a lsquonon-interventionrsquo group that has not been selected at random cannot by definition act as a lsquocontrolrsquo for any time-variant or invariant variables There-fore particularly in the social sciences the term lsquocomparison grouprsquo is frequently used in settings where the groups were not selected at random
comparative analyses these designs have consider-able weaknesses regarding their underlying assump-tions These weaknesses compromise the validity of their findings in many cases In a simple pre- and post-test design the measurement prior to the inter-vention is taken as the counterfactual assuming that the situation of the target group would have remained stable without the intervention However because there is usually a considerable time span between the measurements this assumption is not valid as it cannot be assured that no other external factor would have influenced the situation of the treatment group Comparative designs estimate the counterfactual by collecting ex-post data from both the treatment group and a group that has not taken part in or benefited from the intervention ie a com-parison group In this case one assumes that the situ-ations of the treatment group and the comparison group were identical before the intervention How-ever this assumption cannot be held true either due to the potential selection bias The selection bias may be based on the intervention design (eg focusing on the most needy persons) the individual characteris-tics of the participants (eg self-selection by voluntari-ness) or on practical issues such as a limited budget the accessibility of the treatment group or other logis-tical constraints
Experimental and quasi-experimental designs tackle the issue of intervening time factors and potential differences between target and comparison groups by combining both a pre- and post-test and a compara-tive design This means that data is collected from both the target group and the comparison group before and after the intervention The net effect of an intervention (ie net average treatment effect) is then calculated on the basis of the average difference in the observable changes between the treatment and the comparison group (also called double-difference or difference-in-difference approach see Annex 52 for a further introduction to the calculation of the net average treatment effect using this approach)
Phot
o copy
GIZ
Har
ald
Fran
zen
3 Rigorous evaluation designs and exam
ples of applicability in climate change adaptation projects
Impa
ct E
valu
atio
n G
uide
book
for C
limat
e Ch
ange
Ada
ptat
ion
Proj
ects
24
CCA-specific requirements and challenges
Experimental and quasi-experimental designs are applicable to CCA projects whenever project measures aim at generating a direct impact at individual level ie if a distinguishable target group (eg inhabitants of a particular disaster-prone area farmers in arid regions) receive a specific benefit (eg knowledge of how to seek shelter in case of emergency technical assistance to install drip-irrigation systems) In order to apply such a design it must also be possible to establish a treatment and control or comparison group While in some cases the division of a population into a treatment and controlcomparison group may not be appro-priate for ethical reasons (ie if the denial of support would lead to an immediate deadly peril eg medi-cation in an epidemic) in many other cases financial logistical or technical constraints inevitably lead to selecting a sub-group of a larger population that in principle shares the same needs
A further requirement for applying an experimental or quasi-experimental design is that it must be pos-sible to detect an impact within a manageable time frame While it holds true that it may take a long time for CCA project impacts to become visible ndash which is also the case for impacts in other fields such as edu-cation financial systems or private sector development ndash there may also be some ways to work around the relevant constraints Referring to the first example mentioned above for instance one would not have to wait until another disaster happens to see if the project participants are able to seek shelter faster than those who did not participate A simple observation with a stopwatch during a test alarm would probably do the trick as well Concerning the second example it may not be necessary to wait until the environmental framework conditions have deteriorated in another 20 years to see if the drip-irrigation systems lead to the desired impact Even without any (further) climate change one can measure the reduced water consump-tion and increased yield in comparison to conventional farming methods However in the latter case too a time-series design (cf Section 315) may be a viable alternative for identifying the long-term impact of the project particularly if a comparison group can be established
It must be mentioned though that experimental and quasi-experimental designs also feature a number of challenges which limit their applicability to some extent First of all such designs require considerable tech-nical logistical and thus financial resources As one can imagine the collection of data from a large num-ber of people (cf Section 32 for further considerations about required sample sizes) particularly if they are located in difficult-to-reach areas is costly and time-consuming Furthermore the necessity to collect this data also from people who did not receive any benefit may be difficult as they may be not as willing to con-tribute to such an analysis as those who did For example a farmer who did not receive any technical assis-tance may not be as willing to provide information about his yields In such cases a suitable project design (possibly a pipeline approach see Section 313) may increase the willingness to participate
Finally the findings of such designs are prone to a certain degree of bias such as spill-over and conta-gion effects A spill-over effect means that the controlcomparison group indirectly receives a benefit eg through copying or learning from the treatment group (eg if the trained habitants in the disaster-prone area tell others who were not trained how to behave or if farmers who did not receive any assistance adopt irrigation schemes because they recognise their comparative advantage) Contagion effects may occur if the project under investigation is not the only one to provide support in the target area ie if other DC agencies are active in the same field In that case it may be difficult to attribute the observable impact to the particu-lar intervention (eg if the farmer was able to increase his yield because of the technical support provided by GIZ or because of the micro-credit he received from the ADB) While spill-over effects usually lead to an underestimation of the treatment effect (ie as the controlcomparison group receives a benefit as well) contagion effects can lead to both the over- and underestimation of the treatment effect depending which group has been (more) contaminated by other support measures Thus in multi-donor settings contribution analyses such as those conducted as part of a structural equation modelling approach (cf Section 316) may be more promising
25
312 Matching techniques
In an experimental design comparing the differ-ences in the outcomes of the treatment and control group would be sufficient for calculating the net effect of an intervention However as treatment groups are rarely selected randomly often such a design cannot be implemented in practice To obtain valid evaluation findings all the same the induced selection bias described above needs to be compen-sated for Various approaches are available for this purpose among these matching techniques appear to be especially suitable in evaluation studies The basic idea of matching techniques is to establish for each member of a treatment group a sub-set of pos-sibly similar comparison group members in order to estimate the treatment effect by calculating mean group differences That means that the counterfac-tual situation of the treated person (ie what would have happened if this person had not participated in the project) is approximated through the assignment of similar persons who have not participated
Matching techniques aim to approximate the counterfactual by comparing the outcomes of individuals from the treatment and the compari-son group that have identical or at least similar characteristics
A common matching approach is to identify statisti-cal twins by comparing individual characteristics (ie dimensions) that are supposed to have an influence on the outcomes of an intervention For example if one suspects that the effectiveness of a training measure (eg teaching farmers how to grow drought-resistant crops) also depends on the age and gender of the beneficiary the treatment and comparison group can be clustered accordingly and the outcomes can be individually compared for each sub-sample The following table illustrates the principle of the matching approach using the mentioned example
For further reading about impact evaluation in general and the above-discussed methodological aspects the potentials and limitations of experimental and quasi-experimental designs and particularly their practical implementation the following books articles and papers are recommended
General methodological introduction
Bertrand M Duflo E Mullainathan S How Much Should We Trust Differences-in-Differ-ences Estimates Working Paper 01 ndash 34 MIT Cambridge 2001
Stern E Stame N Mayne J Forss K Davies R Befani B Broadening the range of designs and methods for impact evaluations Working Paper 38 DFID London 2012
White H Some Reflections on Current Debates in Impact Evaluation International Initiative for Impact Evaluation New Delhi 2009
Practical guidelines and examples
Chambers R Karlan D Ravallion M Rogers P Designing impact evaluation different per-spectives International Initiative for Impact Evaluation New Delhi 2009
Khandker SR Koolwal GB Samad HA Handbook on Impact Evaluation Quantita-tive Methods and Practices The World Bank Washington DC 2010
Leeuw F Vaessen J Impact Evaluations and Development NONIE Guidance on Impact Evaluation NONIE Washington DC 2009
Vaessen J Todd D Methodological challenges of evaluating the impact of the Global Envi-ronment Facilitys biodiversity program Evalu-ation and Program Planning 31 2008 pp 231 ndash 240
3 Rigorous evaluation designs and exam
ples of applicability in climate change adaptation projects
Impa
ct E
valu
atio
n G
uide
book
for C
limat
e Ch
ange
Ada
ptat
ion
Proj
ects
26
Table 2 Example table for matching on observables
Group Treatment group Comparison group
Gender Male Female Male Female
lt 40 years old
ge 40 years old
Annotation Each cellarrow colour indicates an individual comparison
As the table shows each sub-sample of the treatment group (eg men of the age of 40 and above) is com-pared with a sub-sample of the comparison group that has the same characteristics The problem with this so-called matching on observables approach is that the size of comparable sub-samples decreases as the number of relevant dimensions grows This again limits the possibility of conducting statistical tests (eg t-test for comparing mean values of independ-ent samples) that require a minimum cell count of approximately 30 cases in order to reach valid find-ings
Another matching technique that has gained atten-tion in the last years is called propensity score matching (PSM cf RosenbaumRubin 1985) The advantage of this technique is that in contrast to matching on observables it provides a one-dimen-sional score for comparison (the so-called propensity score) that indicates the probability of any individual being a member of the treatment group Since this approach is methodologically quite demanding and thus requires a strong theoretical background its application will not be discussed here in detail Instead a short introduction into PSM and further reading material can be found in Annex 53
CCA-specific requirements and challenges
When we look at how these matching techniques can be applied to CCA projects the same characteristics apply as mentioned in the preceding section because they are primarily used on an individual level While institutional or even spatial (regional city-wise) matching can also be found in evaluation practice the meth-odological foundations and practical experiences concerning the validity of the findings provided by such matching approaches are still rather limited Therefore it is not recommended to pursue such an approach lsquoaboversquo the individual level Regarding the variables that are used for matching in the context of CCA projects it may be possible to work with characteristics such as proximity to hazardous areas degree to which individuals are affected by climate change effects or affiliation to specific ethnic social or religious groups etc
The challenges presented by matching approaches include two issues in particular The necessity of a rela-tively larger sample in order to find sufficient matching partners and the question of which characteristics to choose for the matching While the first issue constitutes a technical problem that can be solved by allocat-ing sufficient resources the second is a theoretical one which requires comprehensive sectoral and regional expertise The analysis of matched data can lead to significantly different findings compared with unmatched data depending on which characteristics are considered relevant Therefore it is of the utmost importance to substantiate the selection of the matching variables based on sound theory The most important questions to be answered in that regard are
` Could the characteristic influence the effectivenessoutcome of the intervention for the individual ` Does the basic population comprise sufficient individuals with different characteristics ` Will it be possible to identify sufficient individuals in the target group with identical characteristics
We should also point out that matching may not prevent potential bias as described in 311 However it may be possible to perform matching using aspects such as lsquodegree to which individuals are affected by other inter-ventionsrsquo in order to at least reduce the risk of contagion effects
27
For further reading on the methodological aspects potentials and limitations of PSM as well as its practical implementation the following books articles and papers are recommended
General methodological literature about PSM
Becker S Ichino A (2002) Estimation of average treatment effects based on propensity scores The Stata Journal 2(4)358 ndash 377
Luellen JK Shadish WR amp Clark MH (2005) Propensity scores An introduction and experimental test Evaluation Review 29(6)530 ndash 558
Morgan SL amp Winship C (2007) Counterfactu-als and causal inference methods and prin-ciples for social research Cambridge NY Cambridge University Press
Guo S amp Fraser MW (2010) Propensity score analysis Statistical methods and applications Thousand Oaks Sage
Steiner PM Cook TD Shadish WR amp Clark MH (2010) The importance of covariate selection in controlling for selection bias in observational studies Psychological Methods 15(3)250 ndash 267
Practical guidelines and case-studies
Caliendo M amp Kopeinig S (2008) Some practical guidance for the implementation of propen-sity score matching Journal of Economic Sur-veys 22(1)31 ndash 72
Cook TD amp Steiner PM (2010) Case match-ing and the reduction of selection bias in quasi-experiments The relative importance of pretest measures of outcome of unreliable measurement and of mode of data analysis Psychological Methods 15(1)56 ndash 68
Diaz JJ amp Handa S (2006) An assessment of propensity score matching as a nonexperi-mental impact estimator Evidence from Mex-icorsquos PROGRESA program Journal of Human Resources 41(2)319 ndash 345
Gaus H Muumlller C E (2012) Evaluating free-choice climate education interventions apply-ing Propensity Score Matching Evaluation Review 35(6)673 ndash 722
313 Pipeline approach
Often projects are not implemented on a broad scale right from the beginning targeting the entire poten-tially relevant target group but sequentially This may be because of logistical or budgetary reasons In these cases a so-called pipeline approach can be of particular use The idea behind the approach is that the section of the target group that receives a treat-ment (ie benefits from or takes part in a project) at a later stage can be used to approximate the counter-factual situation of those who did receive the treat-ment at the time of data collection In other words the part of the target group that is not yet affected
serves as a quasi-comparison group for the already affected part of the group In principle the approach can be applied repeatedly during an intervention depending on the number of phases in which the treatment (ie measures activities etc) is provided
In a pipeline approach the part of the treatment group that has not yet received any treatment is used for comparison
Figure 2 illustrates the basic concept of the approach using a three-phase intervention design
3 Rigorous evaluation designs and exam
ples of applicability in climate change adaptation projects
Impa
ct E
valu
atio
n G
uide
book
for C
limat
e Ch
ange
Ada
ptat
ion
Proj
ects
28
Figure 2 Illustration of the pipeline approach
( )t0 t1 t2 t3Timeline
Project phase IIIGroup C
Project phase IIGroup B
Project phase IGroup A
Ex-antebaseline data collection Final data collection Ex-postfollow-up data collection
( )
( )
As the figure shows in a three-phase project a total of four data collections (t0 ndash t3) are necessary of which at least during two (t1 amp t2) data sets have to be collected from two groups (group A amp B t1 respectively group B amp C t2) The treatment effects would then be estimated as in an ordinary single-difference design whereby group B would represent the comparison group to group A and group C to group B Provided the total project duration suffices ex-postfollow-up data from groups A amp B could also be collected at t3 which would probably allow further conclusions to be drawn about the sustain-
ability of the achieved results Further data collec-tions are conceivable such as from group C at t0 and t1 in order to estimate spill-over effects from groups A and B or to control for external influences on outcome variables (eg contagion effects from other projects) In any case the approach is quite flex-ible as it can be modified according to the informa-tion needs It can even compensate for a lsquoforgottenrsquo baseline study to some extent provided the group characteristics are comparable and remain relatively stable over time ie when the influence of external factors is negligible
CCA-specific requirements and challenges
With regard to evaluating CCA projects the pipeline approach is applicable for interventions that are planned to be implemented in phases for instance in different areas andor institutions (eg development and implementation of environmental information systems for local authorities in different provinces) and that aim to generate impact at individual or institutional level Provided that this is the case as outlined above it is still possible to start collecting data after the project has started ie it is not necessary to have baseline data for the first project phase This may be a considerable benefit for all projects that follow a replication or scaling-up design with a preceding pilot phase in which the (technical logistical etc) feasi-bility of the measures is tested before they are rolled out in other areas
The pipeline approach might also be of particular value for CCA projects which are confronted with the problem of shifting baselines (cf 22) The pipeline approach makes it possible to trace developments by comparing the baselines for each group (provided the group characteristics are in principle comparable) It may also be an option for projects that aim at generating long-term impacts that might not be observable directly at the end of their implementation
When applying a pipeline design however it should be borne in mind that each data collection phase is just as labour-intensive and time-consuming as a quasi-experimental design given that data needs to be collected for both the treatment and a comparison (ie future treatment) group except for the first and last round The same quality criteria therefore apply
The references to literature on experimental and quasi-experimental designs at the end of Section
311 are also suitable for further reading on the pipe-line approach
29
314 Regression discontinuity design
The approach discussed in this section is of par-ticular use when project participantsbeneficiaries are consciously selected on the basis of one specific characteristic that distinguishes them from non-participantsbeneficiaries (eg income) though they are similar in a number of other respects (eg loca-tion income sources education) If the participationeligibility of an individual depends on the value of a particular indicator that is relevant to the outcome of an intervention the treatment effect can be esti-mated by the so-called regression discontinuity design (RDD) The basic idea behind the approach is to estimate the treatment effect by comparing the
pre- and post-treatment indicator values (scores) of only those individuals from the treatment and com-parison group that are most similar with regard to their pre-treatment outcome score ie that lie within a comparison range close to the threshold level Fig-ure 3 shows the sample selection for assessing the treatment effect
The regression discontinuity design can be applied if project participantsbeneficiaries are selected based on a special characteristic that distinguishes them from non-participantsben-eficiaries
Figure 3 Selection of individuals for comparison
Individuals
Pre-intervention outcome score
Threshold levelComparison range
Untreated individuals
Compared untreated individuals
Compared treated individuals
Treated individuals
It is mandatory to adhere to the threshold level throughout the selection process as otherwise the regression analysis would lead to less valid findings Furthermore it must be assured that the individu-als cannot influence the pre-intervention outcome score (eg by temporarily lowering their income in order to receive support) as this would also bias the findings
Once the sample has been identified the pre- and post-treatment outcome scores are used to cal-culate regression functions for each group If the
intervention had an effect on the treatment group the functions should show different values at the threshold level This difference can be interpreted as the local average treatment effect for individuals that are most similar ie whose outcome values lie very close to the threshold line The discontinuity of the regression functions of the treatment and com-parison group can also be visualised by a Cartesian coordinate system in which the X-axis represents the pre-treatment and the Y-axis the post-treatment outcome score Figure 4 shows how such a disconti-nuity may look
Figure 4 Outcome scores before and after intervention
Pre intervention outcome score
Post intervention
outcomescore
Threshold level
Comparison range
Non treated individuals
Compared non treated individuals
Compared treated individuals
Treated individuals
3 Rigorous evaluation designs and exam
ples of applicability in climate change adaptation projects
Impa
ct E
valu
atio
n G
uide
book
for C
limat
e Ch
ange
Ada
ptat
ion
Proj
ects
30
As the treatment effect estimated with the RDD is based on a comparison of most similar individuals it can be considered to be widely unbiased How-ever a disadvantage of the approach is that the effect may not be generalisable for the entire population because individuals become less comparable the further they are from the threshold level Another disadvantage is the fact that in comparison to other designs RDD only uses a small fraction of the entire population to estimate the treatment effect
Due to its relatively ambitious requirements and methodological reservations RDD has only played a minor role in impact evaluation studies so far Never-
theless it may be applicable particularly for policy-field evaluations with large and clearly defined treatment groups provided the above-mentioned methodological requirements can be met In some publications (KhanderKoolwalSamad 2010) the use of a regression discontinuity approach is also recommended in scenarios where a threshold level is spatially defined (ie a geographical national or administrative border) However such an applica-tion needs to be carefully reviewed as populations in different regions present unobserved covariates (eg cultural or religious background) that may limit their comparability
CCA-specific requirements and challenges
RDD can be of particular use for evaluating CCA projects that focus on creating an impact at individual level and are implemented under framework conditions that involve a high degree of uncertainty provided the projects comply with the methodological requirements outlined above The benefit lies in the compara-tively simple data collection setup and clear interpretability of the evaluation findings which are quite robust against bias at least for those individuals who are very similar
On the other hand it has to be added that the findings are only of limited external validity Furthermore as only very similar individuals are compared (at least with regard to the outcome variable that is of interest) the sample selection can be less efficient because only a smaller number of individuals (ie those who are very similar) can be used for comparison Another challenge which is not restricted to CCA projects though is that it requires the project to adhere to a defined threshold level not to lsquoshiftrsquo it or make exceptions which in practice often proves to be a problem It is also only suitable for interventions where the impact becomes vis-ible in a manageable time frame which is not often the case for CCA projects
Finally it should be added that besides the outlined basic RDD there are several further more sophisti-cated variations of the approach These include ran-dom assignment at the threshold level or with more than one threshold level (eg if the treatment group is split further in sub-groups that receive different kinds of support depending on their pre-treatment outcome score) which cannot be discussed here
Therefore the following books articles and papers are recommended for further reading about methodological and practical require-ments as well as further applications of the approach
Imbens GW amp Lemieux T Regression discontinuity designs A guide to practice Journal of Econometrics 142(2) 2007 pp 615 ndash 635
Khandker SR Koolwal GB Samad HA Handbook on Impact Evaluation Quantita-tive Methods and Practices The World Bank Washington DC 2010
315 Time-series designs
While most evaluations focus on a limited time frame defined by the duration of an intervention sometimes it may be necessary to cover a longer period eg when the effectiveness of a series of past support activities or the development of (politi-cal economic etc) framework conditions are to be reviewed In those cases time-series designs can be of particular use We should add that there is no sin-gle time-series design this is rather an umbrella term for a number of different approaches What they have in common is that they are based on repeat-edly collected data over a longer period Time-series designs can be distinguished by whether they make use of only descriptive or also inferential statistics if data from the same analytical units (eg individuals households organisations cities countries) is used or not and if the data is quantitatively or qualitatively analysed
Time-series designs are based on frequently repeated data collections and are of use for measuring long-term impacts and the develop-ment of framework conditions
31
While it is simple to analyse the development of individual indicators descriptively by means of a trend analysis the identification of causal relation-ships calls for more sophisticated approaches Such approaches are often based on regression analyses that make it possible to estimate the influence of sev-eral independent variables (eg resources contextual factors) on dependent variables (eg attitudes behav-iour well-being) We shall go on to discuss an exem-plary design that has been successfully applied in a number of impact evaluation studies the so-called panel analysis
A panel analysis is based on repeated data collec-tions from identical analytical units The data needs to be comparable with regard to their informa-tion content ie the data collection instruments of each survey have to contain identical question and answer categories Furthermore the data sets must
be assignable to each respondent throughout the observation period Panel analyses usually require datasets with a large number of analytical units in order to be able to draw conclusions from the panel sample that apply to a larger basic population (cf 331) If these requirements are met panel analyses make it possible to trace developments not only on average but also on an individual basis and thus to identify variations caused by individual differences (ie unobserved heterogeneity) In addition given a sufficient observation period panel analysis makes it easier to identify the chronological sequence of changes and thus develop hypotheses about causali-ties The treatment effect can be estimated on the basis of various models The two most common of these the so-called fixed-effects model (FEM) and the random-effects model (REM) are briefly out-lined in Annex 54
CCA-specific requirements and challenges
Time-series designs appear to be most suitable for CCA projects as they are in principle applicable at each impact level and are of particular benefit when it comes to measuring long-term impacts As they make it possible to control time-variant confounding factors they are likewise useful for dealing with uncertain framework conditions as well as with shifting baselines given a sufficiently large sample size andor number of repeated data collections Due to their flexibility they can be applied in projects that focus on the adapta-tion of particular target groups to changing (climate environmental) framework conditions on the improve-ment of institutional capacities to deal with climate change-rooted environmental social or economic prob-lems or on national regional or global developments such as adaptation strategies in response to particular climate challenges Thus time-series designs are in fact more common in policy studies than in project evalu-ations
The challenges associated with time-series designs lie not so much in their practical implementation or the required financial resources as in the expert knowledge needed to do the lsquomathsrsquo They also call for a strong sectoral background in order to develop the right cause-and-effect hypotheses and draw the right conclu-sions from the analysis findings Very few evaluation experts have the know-how to adequately draft and implement such a design The high theoretical and methodological demands are reflected in a multitude of disputes among experts concerning the credibility of research which is of course not helpful for clearly com-municating evaluation findings
For further reading on panel data analysis the following literature is recommended
Berrington A Smith WF Sturgis P An Overview of Methods for the Analysis of Panel Data NCRM Methods Review Papers NCRM007 ESRC National Centre for Research Methods Southampton 2006
Hsiao C Analysis of Panel Data Cambridge University Press Cambridge 2014
316 Structural equation modelling
While the approaches discussed in the sections before are suitable for project types that differenti-ate between a treatment and a comparison group we will now go on to present an approach that may be applied for evaluating large-scale policy-based programmes that aim to affect an entire (national regional or global) population or sector (eg envi-ronmental or education sector labour market) With the so-called structural equation modelling (SEM) approach it is therefore not possible to attribute an observed effect to a specific intervention but to esti-mate the statistical relationship between several fac-tors over time one of which may be an intervention
3 Rigorous evaluation designs and exam
ples of applicability in climate change adaptation projects
Impa
ct E
valu
atio
n G
uide
book
for C
limat
e Ch
ange
Ada
ptat
ion
Proj
ects
32
Structural equation models make it possible to estimate statistical relations between con-structs which are defined by empirical measur-able indicators
Basically SEM is a multivariate statistical approach for testing hypotheses (deductive approach) about causal relationships between two or more latent constructs Its special feature is that it makes it pos-sible to test multiple statistical relationships (which are assumed to be causal) at the same time and can thus be used in complex environments In this con-
text latent construct means that the causes and effects (eg health employability) cannot be meas-ured directly but only by a number of manifest (ie empirically measurable) indicators (for health eg blood counts weight for employability education level qualifications) In principle a structural equa-tion model consists of two model types measure-ment models and structural models Measurement models describe the relationship between a latent construct and its indicators structural models describe the connection between latent constructs The following figure illustrates the differentiation between the model types according to the graphical representation of the system model described above
Figure 5 Generic layout of a structural equation model
It is important to note that the indicators that opera-tionalise the constructs and the causal relationships between the constructs have to be specified and theoretically substantiated by the researcher That means that it needs to be defined in advance which is the independent (ie exogenous) and which is the dependent (ie endogenous) variable In other words
the direction of the dependency has to be defined by the researcher In the figure above constructs 1 and 2 are exogenous variables (ie causes) while construct 3 is an endogenous variable (ie effects) A practical example on how to implement a SEM is given in sec-tion 42
CCA-specific requirements and challenges
With regard to the application of SEM for evaluating CCA projects the requirements and challenges sum-marised in the previous section on time-series designs are widely transferable with the difference that SEM is mainly suitable for projects that aim to create an impact at institutional and system level (eg political strategies) The practical requirements relating to SEM are not so difficult though it does take comprehensive theoretical know-how to develop the model As mentioned above the validity of the models relies on the expert knowledge of the people who create them Thus the findings of SEM analysis are as right or wrong as the model they are based upon Here the particular danger lies in omitting a system-relevant construct (ie influential factor) or indicators that define such a construct which would cause substantially biased findings What aggravates the problem is that in contrast to the designs discussed above unfortunately no quality criteria are available for assessing the validity of an SEM model Nevertheless given sufficient expert knowl-edge SEM can be of great benefit for providing the lsquobigger picturersquo and thereby revealing the manifold causal linkages between social political economic and environmental developments in the long run
33
For further reading on the methodological aspects potentials and limitations of SEM as well as its practical implementation we recommend the following books articles and papers
Cassel C Hackl P Anders HW (2010) Robust-ness of partial least-squares method for estimat-ing latent variable quality structures Journal of Applied Statistics 26(4)435 ndash 446
Chin W Newsted PR (1999) Structural Equation Modeling Analysis with small Samples Using Partial Least Squares In Hoyle R (ed) Statistical Strategies for Small Sample Research Thousand Oaks Sage
Diamantopoulos A Riefler P Roth KP (2008) Advancing formative measurement models Jour-nal of Business Research 61(2008)1203 ndash 1218
Garthwite PH (1994) An Interpretation of Partial Least Squares Journal of the American Statistical Association 89(425)122 ndash 127
Haenlein M Kaplan AM (2004) A Beginnerrsquos Guide to Partial Least Squares Analysis Understanding Statistics 3(4)283 ndash 297
Temme D Kreis H Hildebrandt L (2006) PLS Path Modeling ndash A Software Review SFB 649 Discussion Paper 2006-084 Berlin Humbold-University
Tenenhaus M Vinzi VE Chatelin Y-M Lauro C (2004) PLS path modeling Computational Statistics amp Data Analysis 48(2005)159 ndash 205
317 Summary
The prior descriptions show that a number of evalu-ation designs of sufficient methodological rigour are available that can provide reliable empirical evidence about the impact of CCA projects This sec-tion gives advice on which design(s) to choose based on the respective project characteristics Here it is again important to note that the applicability of a design primarily depends on the aggregation level at which an impact is generated (cf Section 1) Accord-ingly since many CCA projects operate on more than one level a combination of two or more evalu-ation designs might be necessary in order to assess the total impact balance of a project This complies with the need to combine qualitative and quantita-tive methods and triangulate data methods and researcher perspectives
At the individual level the decision which design to choose depends firstly on the existence of baseline data As explained in the previous sections three designs namely experimental quasi-experimental and regression discontinuity designs require such data This necessarily means that these designs can only be applied if they were drafted during the planning of the project If this is the case the next question is whether or not the beneficiaries were selected at random If this condition is also fulfilled in principle an experimental design can be applied provided sufficient resources are available to do so As described in 311 RCTs are quite costly due to the laborious data collection process which usually calls for the assignment of a large team to collect data It should also be said though that an RCT provides the highest internal validity and allows for clear impact attribution
If the project design does not allow for a random assignment of the treatment group a regression discontinuity design may also be feasible How-ever such a design requires the treatment group to be selected based on a specific outcome variable of interest (eg proximity to a disaster-prone area) If this is not the case a quasi-experimental design may be a feasible alternative The time and budget requirements of these two designs are compara-ble with those of an experimental design with the constraint that RDD might require a larger sample in order to identify sufficient cases that are close enough to the lsquothreshold levelrsquo to be compared With regard to the validity of the findings and their informative value we should add that while RDD-based evaluation findings are restricted to groups that are quite similar findings obtained using a quasi-experimental design can almost approxi-mate those of an RCT if the samples are adequately matched (eg with propensity score matching)
In case no baseline data has been collected before-hand two further rigorous evaluation designs may be used the pipeline approach and the panel design Both designs have further requirements the pipeline approach requires that the project be implemented sequentially (eg in different regions with differ-ent target groups) and the panel design that a larger sample size be available to enable reliable estima-tion of the impact It should also be considered that while a pipeline approach enables the attribution of impacts to an intervention a Panel Design lsquoonlyrsquo allows the contribution of an intervention to an observed change
If none of the above prerequisites can be satisfied most likely only a so-called ex-post facto design
3 Rigorous evaluation designs and exam
ples of applicability in climate change adaptation projects
Impa
ct E
valu
atio
n G
uide
book
for C
limat
e Ch
ange
Ada
ptat
ion
Proj
ects
34
with or without (single) comparison with a non-intervention group or with reconstructed baseline data may be possible However such a design is not regarded as lsquorigorousrsquo as it cannot provide for an attribution or contribution analysis
Based on these selection criteria the following deci-sion tree can be used to identify the lsquorightrsquo evaluation design for interventions that aim to generate impact at individual level
Figure 6 Decision tree for selecting an evaluation design for measuring impacts at individual level
Baseline data available
Random assignment of treatment group
Sequential implementation of project
yes no
yes
RCTQuasi-
experimental design
yes no
Pipeline approach
Regression discontinuity
design
Treatment group assignment according to specic criterion
Ex-post facto design (no RIE)
yes no
Panel design
yes
Large sample size possible
no (matter)
no
If an intervention aims to generate an impact at institutional level four rigorous evaluation designs are suitable Three of them have been previously introduced pipeline approach panel design and structural equation modelling (SEM) A potentially suitable design not discussed before is a time-series cross-sectional approach (TSCS) As already dis-cussed the pipeline approach requires a sequential implementation of the project in order to be appli-cable leaving three for those that are not As also discussed a panel design can only be applied if the sample (here of institutions eg governmental or non-governmental organisations enterprises) is large enough for statistical calculations (approx 30) If the intervention only focuses on a few institu-tions but at least about 10 repeated observations are possible then a TSCS might be the design of choice (see annex 54) Finally if none of these conditions can be fulfilled SEM is the only lsquorigorousrsquo option to
provide meaningful evidence about the impact of an intervention operating at the institutional level although it should be added that SEM like panel and TSCS designs can only provide for the estimation of its contribution On the positive side we should note that the latter three designs can be implemented with considerably less resources provided that sta-tistical data of sufficient quality are available for quantitative analysis
With regard to interventions geared to the system level (eg SWAPs government advice) the same selection of designs is basically available except the pipeline approach (due to the lacking comparabil-ity of sectors or countries for instance) Therefore in the following figure a joint decision tree for both intervention levels summarises the available choices of RIE approaches for institutional and system-level interventions
Phot
o copy
GIZ
Ran
ak M
artin
35
Figure 7 Decision tree for selecting an evaluation design for measuring impacts at institutional and system level
Sequential implementation of project
yes
Time-series cross-sectional approach
(see annex 54)
Structural equation modeling
yes no (matter)
Pipeline approach
Large number of repeated data collections possible
Panel design
yes
Large sample size possible
no (matter)
no
Decision tree for measuring system-level outcomes
Finally in table 3 on the next page all suggested RIE designs are listed with brief summaries of the impact level they are suitable for the project characteris-tics that must be in place the data time and budget requirements the validity of the analysis findings and their informative value (ie if they enable attri-bution or contribution analysis)
32 Providing reliable large-scale data
As outlined above empirical data is the founda-tion of any evaluation ndash and more or less of applied social sciences in general whether they are collected during the research process (ie lsquoprimary datarsquo) or reanalysed on the basis of statistical or documentary data (ie lsquosecondary datarsquo) Moreover impact evalu-ations mostly require data collections on a large scale in order to provide empirical evidence about the changes that have occurred in an interventionrsquos sphere of activity Such data is usually collected by means of a survey Surveys are used when mostly quantitative data from a considerable number of people eg all or a significant share of the projectrsquos beneficiaries non-beneficiaries or more generally residents of a certain area or particular social strata needs to be analysed During the data analysis sta-tistical parameters such as average means shares or distribution measures (eg standard deviation quan-tiles) of a given population (ie descriptive statistics) are calculated Provided that the data is collected from a random sample of sufficient size (see further elaborations below) probabilities regarding the val-ues and distribution of certain parameters in a larger
population can also be estimated (ie inferential sta-tistics) In the following the methodological aspects to be considered when collecting quantitative data by means of a survey are discussed with particular focus on an appropriate sampling strategy
Surveys often deal with knowledge opinions atti-tudes beliefs behaviours plans backgrounds devel-opments or assessments of the respondents The primary survey tool for data collection is the ques-tionnaire With a questionnaire (in contrast to an interview guideline) all respondents are asked the same questions in the same order The information gathered by a survey is often used to identify varia-tions of these parameters between different points in time (ie in order to identify developments) or dif-ferences between groups (eg in order to attribute the outcomes to a certain intervention or to reveal sys-tematic differences due to group characteristics such as gender age etc) or both With a survey infor-mation is collected in a systematic structured and mostly standardised way Structuring the subject of a survey means that not all potentially available infor-mation is relevant but only data that help to describe andor assess a certain measure development or framework characteristic Standardisation means that the respondents can choose from a number of answer options and that these options are grouped according to a predefined categorical system This means that the data is statistically calculable and consequently survey findings are comparable Such a categorical system can be dichotomous nominal ordinal or metric Table 4 contains an example of each single-choice question
3 Rigorous evaluation designs and exam
ples of applicability in climate change adaptation projects
Impa
ct E
valu
atio
n G
uide
book
for C
limat
e Ch
ange
Ada
ptat
ion
Proj
ects
36
Table 3 Required project characteristics and data
Evaluation design
Impact level Required project characteristics
Data requirements Time and budget requirements
Validity of findings Explanatory power
Experimental (RCT)quasi-experimental
Micro (individual) level
z Distinguishable treatment group
z RCT requires random assignment to treatment and comparison group
z Ex-ante (baseline) and ex-post data from treatment and controlcomparison group
z Depending on the size and accessibility of the target group
z Data collection process often quite costly as a large team of enumerators is needed
z RCT has highest internal validity
z Internal validity of quasi-experimental design depends on selection bias
z External validitytransferability depends on comparability of framework conditions
z Enables impact attribution at target group level given a sufficient sample size
Propensity score matching
Micro level z Discriminable treatment group
z Individual characteristics relevant for the treatment effect (covariates) must be observable
z Ex-ante and ex-post data from treatment and comparison group
z Data collection must include covariates
z Increases the costs of quasi-experimental designs as usually larger samples are necessary in order to identify sufficient matches
z Comparison group sample must be considerably larger
z Internal validity depends on completeness of covariates
z External validitytransferability depends on comparability of framework conditions
z Same as above
z Application in quasi-experimental designs can contribute to improved quality of findings
Pipeline approach
Micro and meso (institutional level)
z Project needs to be implemented in phases
z Treatment groups of each phase must be comparable
z Ex-ante and ex-post data from each group
z In principle comparable to quasi-experimental designs whereby costs increase with every round of data collection
z Internal validity of quasi-experimental design depends on comparability of groups
z External validity depends on comparability of framework conditions
z Same as above
z Allows for identifying time-variant effects if applied according to quasi-experimental design
Regression Discontinuity Design
Micro level z Treatment group must be selected according to a specified criterion
z Sufficient number of comparable cases
z Larger sample size than for experimentalquasi-experimental
z Comparable with quasi-experimental design mostly depending on sample size
z Internal validity restricted to comparable cases
z Enables impact measurement for individuals who have similar characteristics
Time series All levels z Panel focusing on individuals households organisations
z TSCS focusing on sectors countries regions
z Panel large sample size few repeated data collections
z TSCS sample size irrelevant large number of repeated data collections
z Depending on data availability individual data collections can be implemented quite cost-efficient
z Costs increase with length of panel and sample size
z Panel validity depends on compliance of sample size with statistical requirements (cf 331)
z TSCS validity is restricted to sample
z Provides reliable assessments of the contribution of an intervention to an observed change
z Makes it possible to control time-variant influences
Structural Equation Modelling
Meso and macro (system) level
z Focusing on entire sectors countries regions
z Statistical andor empirical data for each model- relevant construct
z Depending on data availability can be implemented cost-efficiently if combined with statistical data
z Validity depends on model fit (ie to what extent the endogenous construct is explained by the model)
z Enables contribution assessment and time-variant and invariant influences
37
Table 4 Example of question types
Question type Question Answer options
Dichotomous question What is your gender male female
hellip with nominal scaled answer options Where do you come from area 1 area 2 area 3 other area ________________
hellip with ordinal scaled answer options How do you assess the development of your livelihood situation in the last year
Deteriorated considerably Deteriorated slightly Did not change at all Improved slightly Improved significantly
hellip with a metric scaled answer option What is your monthly income _____ euromonth
It has to be added that for ordinal-scaled answer options that reflect a rating (eg satisfaction quality) it is important to lsquobalancersquo the answer options mean-ing that an equal number of positive as negative answer options must be provided in order to avoid biased findings
Besides single-choice questions there are also multi-ple-choice questions for example
What are your income sources (multiple answers possible)
Farming Livestock Fishery Temporary work Other hellip None
When analysing multiple-choice question data it has to be taken into account that it might be necessary (eg for calculating average means) to transform the data into separate lsquodummy variablesrsquo with dichoto-mous scales for each answer option (ie yesno for farming hellip for livestock etc)
When a survey is conducted its objectives and the information required to meet these objectives need to be considered first For this it makes sense to ask the following questions
Questions for identifying the survey objectives
` Which indicators need to be measured ` Who will use the information and how
Which decisions are depending on the survey findings
` Are there any particular expectations about the survey findings When are the findings of the survey considered positive or negative Or what would be a good or a bad finding
` Which information can the respondents pro-vide How does this match the information needs
` Which factors could have a negative impact on data collection Do the respondents have and remember the necessary information Might they be reluctant to answer Do they have the (verbal cognitive) capacities to answer correctly
Selecting a survey approach
After having defined the surveyrsquos objectives and information needs the survey approach can be specified giving consideration to the available and required resources The required financial human and time resources mainly depend on the size of the population that has been defined (as the target or comparison group) its spatial distribution and the logistical framework conditions in the area where the survey is implemented Furthermore the length and complexity of the questionnaire considerably influences your resource demands In order to get a better idea of how much time is needed it may be helpful to prepare a list of the individual tasks and estimated time needed for each task such as clarify-ing the survey objectives and sampling approach designing and testing the questionnaire collecting managing and analysing the data and reportingcommunicating the survey findings The following table shows what such a to-do list might look like
Phot
o copy
GIZ
Ala
n W
alsc
h
3 Rigorous evaluation designs and exam
ples of applicability in climate change adaptation projects
Impa
ct E
valu
atio
n G
uide
book
for C
limat
e Ch
ange
Ada
ptat
ion
Proj
ects
38
Table 5 Exemplary to-do list for preparing a survey
Task When Who Requirements
Clarification of survey objective First two weeks in January Project staff Results framework sample selection
Development of draft question-naire
By 31 January Evaluator in coordination with project staff
Clarification of information needs development of survey items
Pre-test of questionnaire 1 to 10 February Evaluator together with enu-merator team
Logistical preparation informa-tion of target groups accessibil-ity of target groups
Finalisation of questionnaire By 15 February Evaluator Consolidated feedback from the pre-test
Implementation of survey 16 to 31 February Enumerators coordinated by evaluator
Logistical support by partner staff etc
Data entry 1 to 5 April Enumerators coordinated by evaluator
Availability of technical infra-structure (notebooks software etc)
Data quality check 6 April Evaluator Full data set
Data analysis 7 to 15 April Evaluator Quality-assured data set
Integration of survey findings into evaluation report
16 to 30 April Evaluator Data analysis findings
Presentation of findings 1 May Evaluator and project staff Technical infrastructure for presentation (notebook projec-tor etc)
On the basis of such a timetable the costs of the sur-vey can be estimated These usually comprise logisti-cal costs (eg for traveltransportation accommoda-tion per diems) expenses for survey materials and the remuneration of the survey team
Surveys are usually carried out face-to-face or elec-tronically mediated (eg by telephone email or a web-based application) Both face-to-face and elec-tronically mediated surveys can be self-administered (ie the respondent fills out the questionnaire) or assisted (ie the surveyor fills out the questionnaire or at least supports the respondent in doing so) As all options have their advantages and disadvantages aspects such as the complexity and comprehensibil-ity of the survey topics the skills and accessibility of the potential respondents and the available time budget and human resources need to be considered Particular attention has to be paid to the aspect of the confidentiality of the information and the ano-nymity of the respondent when personal data (eg age income health status) are collected Ensuring anonymity is often an issue when it is necessary to be able to trace responses to individuals such as in panel surveys (cf 315) or when third parties (eg project staff beneficiaries) are tasked with data collection In those cases it might be necessary to separate the personal data from the survey data and link the data sets using a list of identification codes which can only be accessed by the people who are tasked with analysing the data
Selecting a sample
Due to time and budget constraints it is often not feasible to conduct a full population survey ie col-lect data from every potentially relevant respondent (eg beneficiary project participant) In such a case it is necessary to collect a sample ie to select respond-ents from the population However the findings of a sample population might be different to those from a survey of the entire population These disparate findings are induced by the so-called selection bias (see also 311) which can be reduced by various sam-pling techniques The common objective of these techniques is to approximate the sample characteris-tics to the characteristics of the full population rele-vant for the survey (eg the share of male and female respondents or the share of respondents from rural and urban areas) Doing so is necessary in order to draw conclusions from the survey findings with ref-erence to that population bearing in mind certain statistical quality criteria as further outlined below
In order to draw such conclusions the size and dis-tribution of the population for which the sample should provide representative findings needs to be identified For instance if the survey is to be used to identify the impact of a certain intervention (eg nationwide information campaign) on the behaviour of target groups (eg farmers adopting a new farm-ing method) in different provinces then it needs to be determined who constitutes the basic population (ie all farmers of the country) and how it is distrib-uted among the provinces (eg number of farmers in each province)
39
Once the basic population has been identified two sampling strategies are available probability (ie randomised) and non-probability (ie non-ran-domised) sampling Probability sampling means that each individual of a given population has the same known non-zero probability of being included in the sample ie it is randomly selected Non-probabil-ity sampling means that the chance of being selected for the survey differs among the population (eg due to accessibility or ability to participate) In the latter case findings based on the sample may not be gen-eralised without giving further thought to how to establish representativeness 23 otherwise (see below)
Only probability sampling (ie random sam-pling) makes it possible to calculate statistical parameters that inform use of the true value of a parameter in a basic population
Probability sampling
If probability sampling is applied it is possible to draw statistically valid conclusions from the survey findings for a population bearing in mind three sta-tistical parameters the aspired margin of error the level of confidence and the degree of variability These criteria are briefly explained below
The margin of error (also called lsquosampling errorrsquo or lsquolevel of precisionrsquo) indicates the maximum differ-ence of the value of a certain characteristic between the sample and the population ie the range in which the true value of the population is estimated This difference or range is usually defined in per-centage points (eg 1 5 10) For instance if a 5 margin of error is defined and your sample shows that 50 of the respondents adopted a new farming method the actual proportion of the basic popula-tion who did so is somewhere between 45 and 55 This is subject to a certain level of confidence see next paragraph
The level of confidence expresses the probability with which the actual sample value lies within the before- mentioned margin of error It is based on the assumption that if a sample is repeatedly (ran-domly) drawn from a given population the average value of an observed characteristic in this sample approximates to the true value of this characteristic in this population Furthermore the sample values are distributed lsquonormallyrsquo around this true value (ie
23 It has to be added that lsquorepresentativenessrsquo is not a defined statistical term but rather colloquially used to signify that a sample has been composed according to the prevalence of particular characteristics of the basic population
their frequency distribution follows a specific so-called lsquoGaussianrsquo function see the following figure) In practice confidence levels of between 90 and 999 are usually chosen A confidence level of 95 for instance means that in 95 out of a 100 samples the sample value would lie within the margin of error as specified before In other words there is a 5 chance that the sample value will deviate from the true population value by more than the defined mar-gin of error
Figure 8 Distribution of sample mean values in relation to the true population mean value
True value of a certain characteristic of the basic population
Range of mean values in eg 95 of all samples
Finally the degree of variability refers to the het-erogeneity of the population with regard to an observed characteristic ie how this characteristic is distributed in the given population The more het-erogeneous the population the larger the sample size necessary to reach a certain level of precision In this context 50 is the highest degree of variability because it indicates that half of the population has a certain characteristic (eg has adopted a new farm-ing technique) while the other half does not Annex 56 contains an introduction on how to calculate the appropriate sample size bearing in mind the above- mentioned statistical parameters
Non-probability sampling
As probability sampling requires all respondents to be within reach during data collection regardless of the required resources it may not always be feasible to apply such a strategy In that case non-probability sampling may be applied which requires the iden-tification of characteristics of the basic population that are relevant for analysis in order to establish representativeness For instance if the survey is intended to enable conclusions about the extent to which the impact depends on age gender ethnic affiliation etc information needs to be gathered about the composition of these characteristics in the population We should mentioned that while with non-probability sampling it may be possible to
3 Rigorous evaluation designs and exam
ples of applicability in climate change adaptation projects
Impa
ct E
valu
atio
n G
uide
book
for C
limat
e Ch
ange
Ada
ptat
ion
Proj
ects
40
develop plausible assumptions about a population the quality of these assumptions cannot be tested statistically and thus rely solely on the expertise of the researcher For non-probability sampling three common techniques may help to approximate the sample composition to the composition of the basic population systematisation stratification and clus-tering
Non-probability sampling does not make it possible to calculate statistical parameters
The representativeness of a sample relies on the knowledge about the basic population
Systematisation is an option when sufficient data about the basic population is available so that in principle each potential respondent can be identi-fied Ideally a comprehensive list is available that is used to draw the sample according to a particular selection scheme based on the individual data Such a scheme can for instance be oriented towards a tar-geted sample size (eg every 10th person) on logis-tical considerations (eg one household from each street village etc) or a certain threshold level (eg only families with more than three children or below a certain income) Which scheme is applied basically depends on the intervention logic (eg activities aim-ing at the poor) and the intended type of representa-tiveness (eg equal spatial representation)
A particular way to receive more specific findings is to stratify a sample Stratification means that a predefined number of individuals from each ana-lytically relevant sub-group of a population (eg age groups residence areas gender) is included in the sample Here too data about the composition of the basic population is necessary at least on a global level The intention is usually to match the sample composition with the composition of the popula-tion ie ensure that the proportions of each sub-group in the sample and in the population are equal in order to achieve representativeness (ie propor-tional sampling) However it may also be necessary to draw a disproportional sample eg due to logisti-
cal or budget constraints (eg 100 households per region) If that is the case then the cases for each sub-group need to be weighted reciprocally during data analysis So if for example a certain group represents 20 of a basic population but has only a share of 10 in the sample its cases need to be weighted by the factor two during the analysis
Clustering a sample may be helpful if it can be assumed that the sub-groups of a population show a sufficient degree of intra-group homogeneity ie that the individuals in each sub-group are similar with regard to a certain research question and inter-group heterogeneity ie that the individuals of dif-ferent sub-groups differ considerably in that regard If for example a project focuses on both several urban and rural areas and differences of its effec-tiveness in these areas are to be analysed it might be sufficient to conduct a full-population survey in one urban and rural area instead of taking samples in each area provided the residents in the respective areas show some commonalities that are relevant for the analysis (eg high incomes in urban areas low income in rural areas)
Finally we should note that other techniques exist for non-probability sampling in addition to those outlined above However other techniques such as convenience sampling (ie selecting individuals who are easiest to reach) or theoretical sampling (mainly used in explorative qualitative research) may not be applicable in rigorous evaluation designs as it is unlikely that they provide representative data Hence these techniques are not further discussed here
We recommend the following books articles and working papers for further reading on methodological requirements to collect quanti-tative data by means of surveys
Fink A (2003) How to Sample in Surveys The Survey Kit 2 Edition Thousand Oaks Sage Publications
Israel GD (2012) Determining Sample Size Gainesville University of Florida
Phot
o copy
GIZ
Har
ald
Fran
zen
41
In this last chapter the outlined methodological options and requirements are discussed by means of a practical case study The case study is based on a GIZ project entitled lsquoUrban Management of Inter-nal Migration due to Climate Changersquo that began in January 2015 and is being implemented on behalf of BMZ in two cities in Bangladesh The objective of the case study is to illustrate the possibilities for pro-viding empirical evidence about project impacts by applying an elaborated evaluation design that satis-fies scientific standards It will also be investigated which organisational and logistical precautions need to be taken to enable efficient data collection and analysis After a brief description of the project (41) two exemplary designs for measuring its impact are presented (42) followed by a draft of their practical implementation (43)
41 Background and project objectives
In Bangladesh climate change is considered to be one of the most important challenges Climate-related internal migration is jeopardising the over-all social stability of the country Climatic changes induce extreme weather events such as floods extreme precipitation and droughts In Bangladesh 40 out of 64 districts are affected by the impacts of climate change According to estimations six mil-lion people have already migrated due to weather and climate stresses of whom the majority lives in urban slums Especially in Khulna and Rajshahi the proportion of migrants is very high (70 of slum dwellers are migrants) For poor and vulnerable households migration is a crucial diversification and adaptation strategy However this can lead to acute vulnerability and have conflict-exacerbating effects if migrants who live in urban slums with inadequate infrastructure no access to basic services or income opportunities receive hardly public support from local government and administrative structures It is true that the decision to migrate is multi-causal that means that it is due to political social economic
demographic and environmental factors However in the two preselected cities experts believe that cli-mate and weather-related stress factors play a domi-nant role in migrantsrsquo decision to leave their homes In Rajshahi rising temperatures and drought declin-ing groundwater levels and river flooding threaten the population whereas in Khulna the population faces storms and storm surges extreme precipita-tion water logging and groundwater salinisation According to estimates the urban population (today 34) will exceed the rural population (today 66) by 2040 if economic opportunities do not reach the countryside
The core problem in the current situation is that so far there are no needs-oriented measures to improve the living conditions of climate migrants 24 in Khulna and Rajshahi City master plans do not address the influx of migrants This problem is caused by a lack of capacity of local governments and municipalities to deal with the challenges of climate-related inter-nal migration Public investment in the development and expansion of a basic infrastructure to mitigate the pressure on resources such as water energy food and housing is insufficient There is a lack of poli-cies and measures to manage settlement develop-ment Nor is there any data or information base on the movement of climate migrants to cities and their (urgent) needs This situation leads to an explosion of the population in these urban areas increasing pov-erty congested infrastructure and basic social ser-vices shortages of resources increasing distribution and opportunity conflicts and eventually reduced economic development opportunities for the entire population As urban development is a priority of the 6th Five-Year-Plan 2011ndash2015 (ie infrastruc-ture development promotion of economic activi-ties) national policies indicate that there is potential for change However there is a considerable gap between strategy and implementation
According to this situation the objective of the pro-ject is to improve the living conditions of climate migrants in preselected settlements in the divisional capitals Khulna and Rajshahi through needs-ori-ented measures 25
24 The International Organization for Migration (IOM) produced a definition of climate migrants as lsquopersons or groups of persons who for compelling reasons of sudden or progressive changes in the environment that adversely affect their lives or living con-ditions are obliged to leave their habitual homes or choose to do so either temporarily or permanently and who move either within their country or abroadrsquo
25 Since it is an integrative approach other inhabitants of the set-tlements will also benefit from improved basic urban services vocational training and temporary employment opportunities
4 Case study Urban Management of Internal Migration due to Climate Change
Impa
ct E
valu
atio
n G
uide
book
for C
limat
e Ch
ange
Ada
ptat
ion
Proj
ects
42
Four indicators were defined to achieve the project (module) objective
y In Khulna and Rajshahi X inhabitants of Y lsquohot-spotsrsquo with a high concentration of climate migrants have improved access to basic urban services (eg water energy or sewage systems through well drilling solar home systems or the construction of drainage ditches)
y In Khulna and Rajshahi X inhabitants of Y hot-spots with a high concentration of climate migrants have participated in labour-intensive measures for the expansion and building of a cli-mate-resilient basic infrastructure of whom Z are women
y In Khulna and Rajshahi in Y hotspots with a high concentration of climate migrants participants in needs-based general education and vocational training courses increased their income by X
y In each city the city corporations developed and tendered X project proposals for needs-based and labour-intensive measures for the expansion and building of climate-resilient basic urban ser-vices (eg health education water energy supply waste waterrefuse) as well as for the promotion of local economic development with the support of the Ministry of Social Welfare
In order to achieve this objective the project focuses on three intervention areas for which particular measures are currently being planned
1 Providing access to social services to the target groups by improving and extending existing services and adapting them to the needs of the migrants (eg finding social housing providing health and sanitation services) and raising the awareness of social workers for the needs of cli-mate migrants
2 Providing short-term income opportunities through labour-intensive work in and outside slum areas and providing access to basic infra-structure by its improvement together with city corporations and civil society
3 Providing long-term income opportunities by developing and implementing skills develop-ment measures in cooperation with training cen-tres and formal and informal SMEs in different sectors
Various Capacity Development measures will be implemented by long-term and short-term experts and financial support will be provided to upgrade slums and enhance resilience Particularly in the third intervention area cooperation is also planned with the local economy and training providers
It should be highlighted that the project is the first of its kind in German development cooperation to deal with the issue of climate-induced (internal)
migration The project therefore has an innovative and pilot character and aims to showcase a variety of measures to deal with climate-induced internal migration The integration of climate change adapta-tion into urban development planning and the con-tinuation of successful measures will be strengthend by other projects implemented by GIZ KfW and BGR
Selection of an impact evaluation design
In order to decide which evaluation design(s) could be suitable for measuring the impact of the project it makes sense to revisit the table at the end of Sec-tion 31 that summarises the characteristics and requirements of the discussed designs Looking first at the required project characteristics we should consider where the project aims to generate tangi-ble results that can be empirically verified Accord-ing to the project description the measures target climate migrants who constitute a distinguishable target treatment group as they are a sub-population of the entirety of residents in the intervention areas This treatment group however is not randomised but rather selected based on predefined criteria such as the settlements (lsquohotspotsrsquo) and their socio-eco-nomic status (lsquoclimate migrantsrsquo) Hence an experi-mental design does not come into consideration As the project description does not indicate a sequen-tial implementation of the measures a pipeline approach is also out of the question However if the project is scaled up at a later stage such an approach would still be feasible based on the data gathered by the design proposed below
Another feature of the treatment group is that it has individual characteristics that are likewise relevant for their selection and the treatment effect As these characteristics are in principle observable (eg eco-nomic situation migration background family sta-tus) both propensity score matching and a regression discontinuity design are in principle feasible With regard to the long-term measurement of treatment effects and their sustainability beyond the project implementation period a household panel appears to be suitable However according to the description of the framework conditions the migrant population fluctuates considerably Such a fluctuation will prob-ably result in a very high panel mortality ie par-ticipants dropping out from the sample that would undermine the significance and reliability of the findings Another feature of the project is that it does not focus solely on directly supporting individual climate migrants but also aims at improving social services and basic infrastructure which again should contribute indirectly to the improvement of the liv-ing conditions of these migrants and the population in the intervention areas at large Such a lsquosystemicrsquo approach calls for the use of structural equation
43
models which make it possible to measure the influ-ence of changed framework conditions on a popula-tionrsquos livelihood
Coming next to the data requirements the selec-tion of particular settlement areas makes it possible to create comparison groups ie migrants who are not supported by the project Furthermore as the evaluation is planned before the project activities start it should be possible to collect baseline data from both the treatment and comparison groups Since the project description does not provide any indication that measures in the selected settlements will be restricted to a certain sub-population of the potential target groups (ie there is no threshold level according to which the beneficiaries are selected) comparison groups need to be selected in spatially
remote areas This again makes it impossible to apply an RDD approach Nor would an RDD be recom-mended if such a restriction were made because the design of the measures facilitates spill-over effects which will likely bias the comparison findings With regard to the system-oriented measures the development of SEMs should be feasible provided that statistical or empirical data can be made avail-able for the required models throughout the project implementation (ie by the continuous results-based monitoring system) This is required to describe the relevant elements that constitute the framework conditions of the migrant population The following table summarises the applicability of the different evaluation designs based on the project characteris-tics
Table 6 Applicability of evaluation designs
Evaluation design Required project characteristics
Full-filled
Data requirements Full-filled
Experimental (RCT)
Distinguishable treatment group Ex-ante (baseline) and ex-post data available from treatment and control group
Random assignment to treatment and comparison group
ndash
Quasi- experimental with PSM
Distinguishable treatment group Observable individual characteristics relevant for the treatment effect
Pipeline approach
Sequenced project implementation ndash Ex-ante and ex-post data available each group na
Comparable treatment groups in each phase
na
RDD Selection of treatment group according to a specified criterion Sufficient number of comparable cases
(close to a threshold level)ndash
Time-series Panel focusing on individuals households organisations Panel large sample size few repeated data
collectionsndash
TSCS focusing on sectors countries regions
ndash TSCS sample size irrelevant large number of repeated data collections
na
SEM Focusing on entire sectors countries regions Statistical andor empirical data for each
model-relevant construct Unlikely to be achieved due to foreseeable panel mortality
Since PSMs and SEMs appear to be the most promis-ing approaches to measure the impact of the project we will go on to outline how the data collection pro-cess could be organised and what the related meth-odological and practical requirements are
42 Practical implementation
Starting with PSMs it first has to be clarified who constitutes the treatment and comparison group and how appropriate samples can be selected In the second step the hypotheses to be tested and the necessary indicators have to be developed Then we
need to consider which covariates have to be col-lected in order to enable the matching of cases (eg age gender place of origin duration of stay in target area education level ethnic affiliation marital sta-tus) Finally the data collection plan and instruments have to be developed
Based on the project description it is easy to iden-tify who should belong to the treatment climate and floating migrants in selected settlements as well as other poorest people in Khulna and Rajshahi Equally easy to identify is who should belong to the compari-son group climate migrants in settlements in these cities where no project activities are implemented If such settlements cannot be identified it would also
4 Case study U
rban Managem
ent of Internal Migration due to Clim
ate Change
Impa
ct E
valu
atio
n G
uide
book
for C
limat
e Ch
ange
Ada
ptat
ion
Proj
ects
44
be acceptable to choose climate migrants in other cities who face the same problem provided these cities are comparable in terms of the characteris-tics that were decisive for the selection of the pro-ject location As it can be assumed that the targeted population is rather large and the actual proportion presenting the characteristic of interest (improved living conditions) is not known beforehand the sample size should be calculated according to the first formula outlined in Section 56 (annex) The for-mula approximates a sample size of 400 for infinitely large populations with a level of confidence of 95 and an aspired margin of error of 5 26 Consider-ing the conceivable attrition loss during the data collection process a target gross sample size of 600 for the treatment group and at least 800 to 1000 for the comparison group (in order to receive sufficient matches) should be aimed at Depending how the dissimilarity of the socio-economic framework con-ditions in Khulna and Rajshahi is assessed it further has to be decided whether it is sufficient to split one sample across both cities ndash ie if they are generally comparable ndash or if the sample size needs to be dou-bled ndash ie if the framework conditions differ consid-erably with regard to the characteristics of interest
Next it has to be decided which hypotheses are to be tested and which data needs to be collected So far the project objective has been operationalised by four indicators of which three directly refer to the living conditions of climate migrants (1) access to lsquourban basic servicesrsquo (2) participation lsquoin labour-intensive measuresrsquo and (3) having an lsquoincreased incomersquo Leaving aside the question whether these indicators cover the entirety of factors that define the quality of lsquoliving conditionsrsquo ndash which however needs to be revisited during the development of the data collection instruments ndash it has to be clarified what information is needed to verify or disprove their achievement With regard to the first indicator such information would comprise for instance data on the types of existing services their general acces-sibility and finally the actual use of these services by the target group Of course such data would have to be collected for both the treatment and comparison group before and directly after the project imple-mentation and ideally again another three to five years later in order to assess the sustainability of the project measures
26 It should be noted that the proposed level of confidence and margin of error represent the lowest common accepted param-eters for inferential statistics It is up to the evaluation team to decide on stricter values which however will result in a need to collect considerably larger samples
Concerning the second indicator it may seem easy to provide empirical evidence about its achievement ie by comparing the factual number of participants with the targeted number It is however question-able whether the indicator actually makes it pos-sible to measure an impact since participation in a labour-intensive measure does not say anything about the living conditions of the migrants Since the outcome of their participation (eg the generated income and created infrastructure) can rather be considered to influence their living conditions it is recommended to revise this indicator
While the relevance of the third indicator for the impact to be measured is again clear it must be borne in mind that the findings are likely to be biased by contagion effects ie that income has been increased by sources other than the ones created by the project Therefore further qualitative data needs to be collected on the income sources and how and why they were obtained Furthermore it has to be remembered that providing information about onersquos own income may be a sensitive issue Hence data on proxy indicators such as private properties number of meals per day or school attendance of children (etc) has to be collected
In order to obtain a comprehensive picture about the net impact of the project it is further necessary to also gather information about its unintended positive and negative impacts Therefore it must be considered who else apart from the migrants might be affected by the project activities which secondary effects could be caused or how the project objectives interfere with partner strategies andor the activities of other donors For assessing the effectiveness of the particular project measures and helping to attribute the observed effects it is also necessary to collect data on the participation of the target group (eg in labour-intensive or training measures)
Finally to enable matching of the treatment and comparison group data covariates need to be col-lected that have to comply with the lsquostability cri-terionrsquo outlined in Section 53 This could be for instance the origin of the migrant his or her ethic and religious affiliation age gender and family sta-tus etc However we also have to bear in mind not to use variables such as profession socio-economic sta-tus type of migrant and so on as the project meas-ures (eg further training income generation) may influence these characteristics
The following table summarises the indicators data requirements data collection instruments and anal-ysis methods discussed above that would be part of the data collection plan for the migrant survey
45
Table 7 Draft (simplified) data collection plan
Indicator Required data Data collection instrument
Data analysis method
Improved access to basic urban services
Types of services provided Document analysis observation (for empirical verification)
Qualitative comparative analysis
General accessibility of service A B C hellip further operationalized eg by number and distribution of access points costs per service use capacities of service in terms of no of customers per day service can be provided to
Document analysis observation migrant survey
Qualitative and quantitative (double-difference) comparative analysis
Actual use of services by migrants disaggregated by eg types used frequency of use by type costs of use in relation to income
Migrant survey focus group discussion
Quantitative comparative analysis
Increased income Current income and income sources of migrants (operationalized by proxy indicators)
Migrant survey Quantitative comparative analysis
Further indicators for measuring the living conditions of the migrants
Further indicators for measuring the unintended effects of the projects
Further indicators about participation in project measures
Covariates eg origin ethnic and religious affiliation age gender family status
Migrant survey Used for calculating the propensity score
The draft shows that there are a number of blank spots that need to be looked into further regarding the operationalisation of impacts the project activi-ties and the covariates required for matching
Coming now to the structural equation model-ling (SEM) the first step is to identify the constructs that are relevant for the model Without further knowledge about the framework conditions and project measures such a model can only be roughly sketched However based on the project design its outputs in the three intervention areas (in terms of the capacities created for basic urban services train-ing as well as short-term and long-term income opportunities) can be considered as exogenous con-structs that aim to influence the living conditions of the migrants A further exogenous factor would be the general framework conditions as determined by
political strategies (eg government budget alloca-tion to infrastructure development) or economic societal and environmental developments (eg regional economic power number of small and medium enterprises migrant influx annual precipi-tation) Here we should consider whether it makes sense to further split up this construct due to its heterogeneity The living conditions of the migrants would represent the endogenous construct whereby the constitution of basic service infrastructure in the settlements could serve as another mediating construct This is on the one hand influenced by the framework conditions and the project activities and on the other hand has an influence on the living con-ditions of the migrants The following figure shows a (highly) simplified illustration of the SEM based on this outline with a few exemplary indicators for each construct
Phot
o copy
GIZ
Elm
ar F
oellm
i
4 Case study U
rban Managem
ent of Internal Migration due to Clim
ate Change
Impa
ct E
valu
atio
n G
uide
book
for C
limat
e Ch
ange
Ada
ptat
ion
Proj
ects
46
Figure 9 Simplified SEM for the GIZ project 33
Budget allocated to IF2
No of migrants in labour
No of basic services
No of customers served
School attendance of children
Self-assessed living conditions
Budget allocated to IF3
No of migrants trained
Budget allocated to IF1
No of migrants with access to
Budget for infrastructure
Migrant influx
No of SME
Total project budget
Partner contribution
Socio-econ FC
PO in IF2 (labour)
Project resources
PO in IF1 (access)
PO in IF3 (training)
Consti-tution of
infrastruc-ture
Living con-ditions of migrants
The figure shows that some of the measurement models are formative (project resources socio-economic framework conditions) while others are reflective (constitution of infrastructure achieve-ment of project outputs in the fields of intervention and living conditions of the migrants) Of course further constructs measurement models and struc-tural elements and relationships are conceivable There is however a need to define which elements the model requires in order to adequately reflect the lsquorealrsquo project situation and to enable measurement of the changes in its fields of intervention The appli-cation of the SEM requires the regular collection of the respective data ndash at least on an annual basis ndash to be able to calculate the parameters for assessing the project contributions Accordingly the indica-tors have to be included in the project monitoring system which should be developed in the course of the baseline study The latter is the first step of the impact evaluation
According to the outlined design the practical implementation of the impact evaluation should start with an in- depth document analysis and the elaboration of a detailed work plan specifying the
27 The figure was drawn using SmartPLSreg a software for developing variance-based SEMs
individual steps of data collection and analysis and the respective responsibilities Ideally before starting with the baseline study an exploratory preliminary mission should be conducted in order to gain further information for complementing the data collection plan (ie on the availability of data sources further needs of the target groups and other active actors in the intervention area) Furthermore the avail-ability of secondary data and the accessibility of the migrants for data collection the logistical require-ments and general feasibility of the evaluation design should be investigated
Once the data collection plan is finalised the data collection instruments (ie interview guidelines guidelines for focus group discussions question-naires) can be developed and tested In so doing par-ticular focus has to be placed on the socio-cultural adequacy of the instruments (eg appropriate and easy-to-understand language clear commonly understood categories in closed questions) and ndash as the survey will most likely be administered ndash the required qualifications of the interviewers (eg use of questionnaire particularly following the filtering procedure coding of answers ability to explain ques-tions if not understood by interviewees social skills)
FC framework conditions PO project outputs IF intervention field
47
After successful testing and finalisation of the instru-ments and interviewer training a sampling proce-dure should be identified that allows for randomi-sation eg by random walks through the selected settlements or by randomly selected spots (if reliable maps are available) Data collection should then start ideally simultaneously with the treatment and com-parison group in order to minimise time-induced bias Provided that the data has been collected according to the previously defined methodologi-cal standards the analysis will provide a picture of the migrantsrsquo current living conditions This will be based not only on the assessment of a few represent-atives andor experts but on a sound statistical foun-dation that makes it possible to transfer the sample findings to the entire target population This baseline data will also serve as the comparison base at a later stage for calculating the project impact
At the end of the baseline study a framework for the continuous results-based monitoring system should be developed As the monitoring system will not only be used for continuous reporting on project progress but also for the SEM analysis after project comple-tion the indicators used must satisfy the informa-tion needs of the model and thus not only focus on the project outcomes and impacts but also include data about the framework conditions The data col-lection instruments have to be adapted to suit these requirements Furthermore the timing of the con-tinuous data collection and the responsibilities have to be coordinated Given the three-year project term it may make sense to agree on a six-monthly or even quarterly collection in order to gather sufficient data (about eight to 10 cycles) for robust model calcula-tion If the measures need to be adapted during pro-ject implementation the indicators and maybe even the model need to be revised likewise
At the end of the project a second migrant survey has to be implemented according to the same meth-odological standards as for the baseline study In
combination with the baseline data the findings of that survey will be used for impact measurement and attribution as described in Section 311 Provided that the evaluation team has managed to gather the required data in line with the discussed require-ments the findings should enable valid and reliable attribution of the observed changes in the living conditions of the migrants to the project measures Due to the broad analytical perspective of the evalu-ation it should also be possible to document possible unintended effects as well as the influence of exter-nal (confounding) factors
However the project measures are not solely designed to improve living conditions in the short term Long-term effects and sustainability of the project impacts (eg climate resilience of built infra-structure) are also of interest In order to assess such long-term impacts another evaluation needs to be conducted It is recommended to conduct such an ex-post evaluation about three to five years after the project has been completed
As such an ex-post evaluation poses particular prac-tical challenges particularly regarding the retrieval of the former beneficiaries access to public authori-ties or logistical support on site (in case the imple-menting agencies are not active there anymore) it is of utmost importance to announce such an investi-gation during the project implementation phase in order to get sufficient support at a later stage There-fore all partners and further stakeholders should be made aware of its importance and supported in establishing adequate structures for future data col-lections Ideally a Memorandum of Understanding (MoU) could be agreed upon in which the responsi-bilities are clarified In return the partners could be supported in developing their own monitoring sys-tem which again might contribute to their owner-ship and understanding of the usefulness of collect-ing such data
Phot
o copy
GIZ
Ran
ak M
artin
4 Case study U
rban Managem
ent of Internal Migration due to Clim
ate Change
Impa
ct E
valu
atio
n G
uide
book
for C
limat
e Ch
ange
Ada
ptat
ion
Proj
ects
48
We will go on to present the individual tasks accord-ing to the proposed practical implementation of the impact evaluation in chronological order including
a rough estimation of the required time resources for each step
Figure 10 Draft schedule for impact monitoring and evaluation framework
` Document analysis selection of evaluation design development of a work plan (about 5 ndash 8 working days (WDs) depending on the amount of available documents)
` Exploratory preliminary mission gathering qualitative data for accomplishing the data collection plan checking the availabilityaccessibility of data sources and the feasibility of data collection (about 3 WDsrsquo preparation 3 days of travel 10 ndash 12 WDs on site 5 WDs for writing an inception report)
Preparatory tasks
` Adaptation of data collection instruments development of a resource plan and assignment of responsibilities (roughly 3 WDs)
` Implementation of monitoring system regular data collection according to data collection plan revision of data collection instruments as required (eg changing of project measures) (roughly 1-2 WDs per month depending on the monitoring data to be collected)
` Regular data analysis and reporting (about 3 ndash 4 WDs per report cycle)
` Finalisation of the data collection plan development and pre-testing of the data collection instruments (about 8 ndash 10 WDs depending on the selection of instruments and accessibility of target groups)
` Collection of baseline data data analysis and reporting (about 20 ndash 30 WDs for data collection depending on the number of available enumerators and logistical support on site about 10 WDs for data analysis 10 ndash 15 WDs for reporting incl results presentation and finalisation of ex-ante evaluation report)
` Preparation of a framework for continuous results-based monitoring system specification of indicators and data collection plan (about 5 WDs in collaboration with project team)
Baseline study
(ex-ante evaluation)
2015
` Adaptation of data collection plan and instruments review of monitoring data further document analysis (official statistics project documents etc) (about 5 ndash 8 WDs)
` Collection of final evaluation data data analysis and reporting (about 20 ndash 30 WDs for data col-lection depending on the number of available enumerators and logistical support on site about 15 WDs for data analysis 10 ndash 15 WDs for reporting incl results presentation and finalisation of ex-ante evaluation report)
Final evaluation
2018
` Adaptation of data collection plan and instruments further document analysis (approx 5 ndash 8 WDs) ` Collection of ex-post evaluation data data analysis and reporting (approx 20 ndash 30 WDs for data collection depending on the number of available enumerators and logistical support on site about 15 WDs for data analysis 10 ndash 15 WDs for reporting incl results presentation and finalisa-tion of ex-ante evaluation report)
Ex-post evaluation
20212223
Continuous results- based
monitoring2015 ndash 2018
Winding up we should point out that the above design and suggestions for its practical implementa-tion can only serve as a rough sketch which of course needs to be further elaborated during the inception phase of the research For the sake of convenience gender-related aspects or further aspects related to the living conditions of the migrants such as access to health services or education have not been dis-cussed Also the factually available resources for the evaluation and the logistical and practical feasibil-
ity of the data collection cannot be assessed without further information about the project concept and the framework conditions All the more important then to start the evaluation with an in-depth scop-ing phase to ensure appropriate data collection and analysis throughout the evaluation Valid and reli-able evaluation findings can only be produced with high-quality data In other words If the data is poor no design will save the day
49
Ndeg Project name Inst Country Design Data collection instruments Methodology
1 Noakhali Rural Development Project
Danida Bangla-desh
Ex-post facto
Quantitative analysis of project monitoring and contextual data Qualitative analysis documentary study archival work questionnaire surveys stakeholder and informant interviews rep-resentative surveys of project components assessment of buildings roads and irriga-tion canals village surveys and interviews observation focus group discussion case studies
Mixed-method approach
2 Climate Finance Readiness Pro-gramme
BMZ
GIZ
KfW
Global
3 National Ad-aptation Plan Global Support Programme
UNDP UNEP GEF
Global
4 Africa Adaptation Programme
UNDP WFP UNIDO UNICEF
Africa-wide
5 Strategic Ini-tiative to Address Climate Change in LDCs
UNDP Global
6 Climate Support Programme (CSP)
GIZ
BMU DEA
South Africa
NA ndash still ongoing
7 Public Invest-ment and Climate Change Adapta-tion (IPACC)
BMUB
GIZ APCI Ministries regional govern-ments of Cusco amp Piura
Peru (Cusco and Piura)
NA ndash still ongoing
8 Climate Change Adaptation in Rural Areas of India (CCA RAI)
GIZ BMZ
ministries Govern-ment of India govern-ments of federal states
India (Madhya Pradesh Rajasthan Tamil Nadu and West Bengal)
9 Sustainable agri-cultural develop-ment (PROAGRO I and II)
BMZ GIZ
SIDA ministries VIPFE
Bolivia (Chaco Northern Potosi Southern Cocha-bamba Valles)
Mid-Term Evalua-tion
Mainly qualitative evaluation design analysis of primary and secondary data semi-structured interviews and surveys with national counterparts strategic partners and target groups direct observation focus group discussions
Mainly qualitative evalua-tion design
5 Annex51 Overview of current CCA related-project evaluations
Impa
ct E
valu
atio
n G
uide
book
for C
limat
e Ch
ange
Ada
ptat
ion
Proj
ects
50
Ndeg Project name Inst Country Design Data collection instruments Methodology
10 Transboundary water manage-ment with the Mekong River Commission
BMZ GIZ
BMUB
Mekong River Commis-sion
Cambo-dia Laos Thailand Vietnam
NA ndash still ongoing
11
Rural Finance and Community Initiatives Project
IFAD The Gambia
Quasi-experi-mental
Field-level questionnaires focus group discussions interviews with key informants and case studies of the various community-based organisations and their members
For impact assessment the mission relied on a quanti-tative survey and participa-tory rural appraisal (PRA) exercise
12 Ghana Water Programme
CIDA Ghana Before-after
Document review key-informant inter-views internal benchmarking data from project reviews used for before vs after limited resources did not enable ex-post surveys
13 Chronic vulner-ability to food insecurity
WFP Kenya Experi-mental
Literature reviewsecondary data analysis Key Informant Discussions Participatory Vulnerability Profiles Field visits Focus Group Discussions
Study triangulates data from qualitative and quantitative sources It uses qualita-tive data from focus group discussions with community members and key-inform-ant interviews with com-munity opinion leaders and quantitative data involving about 3000 randomly sam-pled households
14 Food and Cash for Assets (FCFA) on Livelihood Resilience in Bangladesh
WFP Bangla-desh
Before-after approach
Document review On the quantitative front a household survey was conducted that covered 1500 households of participants non-participants and the comparison group Qualitative data were collected through focus group discus-sions asset assessments key-informant interviews semi-structured interviews
Mixed-method approach was adopted Participatory rural appraisal (PRA)
15 Impact of Food for Assets on Livelihood Resilience in Guatemala
WFP Guate-mala
Quasi-Experi-mental
Document review secondary data analysis and institutional Analysis community pro-file asset assessment institutional analysis household survey focus group discussion semi-structured interviews
Mixed-method approach Quantitative survey at the household level qualitative assessment of impacts at household and community levels assessment of tech-nical and biophysical assets in each community social and institutional analysis of networks and linkages at different levels especially communities
16 Impact of Food for Assets on Livelihood Resilience in Senegal
WFP Senegal Quasi-experi-mental
Document review household survey obser-vation village profiles gender-disaggregat-ed focus group discussions semi-structured interviews with major stakeholders asset assessments
Mixed-method Approach data triangulation
17 Effects of Climate Variability and Change on Household Food Sufficiency among Small-Scale Farmers of Yatta District
Journal article
Kenya Experi-mental
Desk research use of questionnaires inter-views focus group discussions observa-tions participatory vulnerability profiles development of indigenous knowledge systems
Mixed-method approach
Crop production data using Krejcie amp Morgan formula commonly used to calculate a sample size (random sampling procedure) coefficients of variation were computed for annual precipitation and then cor-related to crop production using Pearson correlation coefficient
51
Ndeg Project name Inst Country Design Data collection instruments Methodology
18 Analysis of vulnerability and resilience to climate change-induced shocks in North Shewa
Journal article
Ethiopia Experi-mental
Secondary data analysis surveys structured questionnaire interviews focus group discussion vulnerability analysis expert judgment
Mixed-method approach principal component analy-sis correlation with past disaster events ordered probit regression model use of fuzzy logic random sampling procedure
19 Vulnerabil-ity of Farming Households to Environmental Degradation in Developing Countries Evi-dence from North Central Nigeria
Journal article
Nigeria Experi-mental
Survey was used to generate household level data
Principal component analysis was used to develop vulnerability index for individual household so as to classify households depending on their level of vulnerability to environmen-tal degradation impacts use of multi-stage random sampling technique cluster analysis ordered logit regression model
20 An Index to Determine Vul-nerability of Communities in a Coastal Zone A Case Study of Baler Aurora
Journal article
Philip-pines
Experi-mental
Secondary data analysis survey (face-to-face and random) questionnaire observa-tions mappingGIS resource mapping activity workshops
Indicator method index computations following a balanced weighted aver-age approach Pearsonrsquos correlation coefficient of determination
21 Assessing House-hold Vulner-ability to Climate Change The Case Of Farmers In The Nile Basin
IFPRI Ethiopia Experi-mental
Expert knowledge use of household-level socio-economic survey interviews
Mixed-method approach Indicator and econometric method Principal compo-nent analysis correlation with past disaster events
22 Cambodia Community-Based Adaptation Programme
UNDP Cambodia Experi-mental
Secondary data analysis primary data key-informant interviews un-structured in-dividual interviews site visits observations semi-structured discussions structured Focus Group Discussions
Mixed-method data triangulation inductive and deductive approaches using quantitative and qualitative data
23 Strengthen-ing Adaptation Capacities and Reducing the Vulnerability to Climate Change in Burkina Faso
UNDP Burkina Faso
Document review individual interviews group discussions field visits observation
24 National Pro-gramme for Man-aging Climate Change in Malawi and the Malawi Africa Adaptation Programme
UNDP Malawi Desk review of project semi-structured interviews field visits workshops
Mixed-method approach data triangulation
25 Adaptation to Climate Change in the Nile Delta through Integrat-ed Coastal Zone Management
UNDP Egypt Document review and analysis (desktop study) interviews and meetings (face-to-face and by telephoneSkype and email questionnaires data collection in the field (interviews direct observations)
26 The Hill Maize Research Project
USAID Nepal Experi-mental
Secondary data published and unpublished documents and reports quantitative and qualitative tools Primary data structured and pre-tested questionnaire (household level) semi-structured checklist with a number of open-ended questions (community level) focus group discussion key-informant interviews using similar semi-structured checklist with open-ended questions data collected from key informants and focus group surveys were used for descrip-tive and qualitative analysis whereas those collected through household survey were used for quantitative analysis
Mixed-method approach randomised controlled trial propensity score matching (PSM)
5 A
nnex
Impa
ct E
valu
atio
n G
uide
book
for C
limat
e Ch
ange
Ada
ptat
ion
Proj
ects
52
Ndeg Project name Inst Country Design Data collection instruments Methodology
27 Small-Scale Irri-gation Manage-ment Project
JICA Indonesia Experi-mental
Household surveys direct interviews Focus Groups Discussions
Mixed-method approach propensity score match-ing regression disconti-nuity design estimation strategy T-test estimation of average treatment effect balancing test
28 Vulnerability to tropical storm impacts in coastal areas of the Red River Delta in Viet Nam and the adjacent region
Journal article
Vietnam Quantitative and qualitative surveys inter-views with key informants semi-structured interviews discussions mangrove utilisa-tion survey (quantitative model) focused interviews visualisation of storm track for various typhoon seasons
Mixed-method approach participatory rural appraisal
29 Sustainable Soil Management Program
Helvetas Swiss Inter-Co-operation amp SDC
Nepal Desk review of relevant documents field visits semi-structured interviews Focus group discussions observations separate focus group discussions for discussing is-sues related to labour migration apprecia-tive inquiry approach using open-ended questions storytelling about successes and challenges as well as visioning
30 Dry Zone Liveli-hood Support and Partnership Programme (DZLISPP)
IFAD Sri Lanka Quasi-experi-mental
Qualitative survey (key informant interviews with project staff and government officials focus group discussions with beneficiaries) and quantitative survey of 2560 households (both treatment and non-treatment group)
Mixed-method approach
31 Implement-ing sustainable water resources and wastewater management in Pacific island countries
UNDP Pa-cific island countries
Evaluation involved an orientation meeting in Nadi Fiji with Projectrsquos Regional Steering Committee two missions to visit six of the PICs and Skype and phone interviews with representatives of the remaining PICs and the implementing agencies construction of theory of change to evaluate the pathway of projectrsquos success
Mostly qualitative in nature
32 Supporting Integrated and Comprehensive Approaches to Climate Change Adaptation in Africa - Main-streaming CCA in the National Sectoral Policies of Tanzania
UNDP Tanzania Primary and secondary data were collected and analysed use of semi-structured indi-vidual and group interviews
No specific reference but seems to be highly qualita-tive
33 Climate Change Adaptation Action and Mainstreaming in Mozambique
UNDO Mozam-bique
Primary and secondary data were collected and analysed use of semi-structured indi-vidual and group interviews
No specific reference but seems to be highly qualita-tive
34 Integrating Disaster Risk Reduction and Climate Change Adaptation (DRRCCA) in Local Development Planning and Decision-making Processes
UNDP Philip-pines
Desk review key-informant interview (KII) using a questionnaire guide that focuses on particular agenciesinstitutions vis-agrave-vis outcomeoutput focus group discussion using a questionnaire guide and study or field visits where observation and interview methods are utilised for more insights
Mid-term review relies on qualitative information gen-erated through primary data gathering Opportunities for triangulation were sought However not all datainformation can be treated in this manner especially as certain key players have not been interviewed despite several attempts
35 Africa Adaptation Project Namibia Building the Foundation for a National Ap-proach to Climate Change Adapta-tion in Namibia
UNDP Namibia Interviews group interviews and document reviews Open-ended questionnaires were employed to facilitate interviews Literature and documents were reviewed to acquire relevant and appropriate information required to answer key evaluation questions and objectives Observations and case study approaches were used during field visits
Evaluation applied a mixed methodology of quantita-tive and qualitative research approaches
= No reference | NA = Not applicable
53
52 Calculation of net average treatment effect with double-difference approach
Figure 11 Calculation of the net treatment effect in an experimental or quasi-experimental design
Indicator lsquoIrsquo Intervention = Treatment
t0 t1 t2point in time
Difference of I between treatment and comparison group after treatment (t2)
Difference of I between treatment and comparison group before treatment (t0)
Average value of I for treatment group
Average value of I for comparison group
net average treatment effect
Estimated average counterfactual value of I for treatment group
The figure shows that the counterfactual value of the indicator for the treatment group is estimated on the basis of its (observed) value for the comparison group and the difference of its values between the groups before the treatment In other words it is assumed that without the treatment the treatment group would have developed in the same way as the com-parison group Accordingly the net average treat-ment effect ( ) can be calculated very easily by using the following formula
Whereby represents the value for the indicator of interest for the treatment (exponent = 1) and com-parison (exponent = 0) group at the points in time ( 0 = before and 2 = after treatment) when data is being collected ie before and after the treatment Sim-ply speaking the difference in the indicator mean value between the treatment and comparison group before the treatment is subtracted from its differ-ence between the treatment and comparison group after the treatment Therefore this approach is also called lsquodifference-in-differencersquo or lsquodouble-differ-encersquo approach
53 Propensity score matching (PSM)
The propensity score is an index that indicates the conditional probability of an individualrsquos being part of the treatment group This probability is calcu-lated based on a set of variables that are relevant for both selection for the treatment and the observed treatment effect The advantage of PSM is that in
contrast to other matching techniques it provides a one-dimensional score for the matching procedure and does not require any distribution assumptions regarding the basic population (cf 331) It does however require a set of assumptions to be fulfilled which limit its applicability to some extent These are
y Conditional independence assumption (CIA) The treatment effect (ie outcome differences between the treatment and the comparison group) has to be independent from the selection ie the effects may only be explained by the treat-ment confounding factors have to be excluded Example If an intervention aims at increasing the income of a group of people project benefi-ciaries need to be subject to the same external economic framework conditions that influence their income as non-beneficiaries The assump-tion would be violated for instance if a certain occupational group were selected (eg only farm-ers) and compared with a basic population that consists of various occupational groups
y Stable unit treatment value assumption (SUTVA) The treatment effect of an intervention on one person may not be influenced by the participa-tion of another person in the same intervention Example If an intervention aims at providing financial support to a group of people eg by micro-credits the potentially available amount for each beneficiary must be equal regardless of the amounts already spent In other words the project budget needs to be at least as big as the maximum budget needed if all beneficiaries were to request the maximum individual amount
5 A
nnex
Impa
ct E
valu
atio
n G
uide
book
for C
limat
e Ch
ange
Ada
ptat
ion
Proj
ects
54
y Stability of covariates against the treatment The covariates that are used to calculate the propen-sity score must not be influenced by the treat-ment Example If an intervention aims at increasing the income of a group of people then the income of the potential beneficiaries must not be used as a covariate (as it is an intended outcome of the project)
y Common support condition In order to be suit-able for matching both the treatment and com-parison group need to contain individuals with the same or at least a similar propensity score
y Balancing property Individuals who have the same propensity score need to be comparable regarding the particular characteristics that were chosen as covariates
If the project characteristics meet the above require-ments PSM can be applied according to the follow-ing sequence 28
Figure 12 PSM sequence
Estimating the
propensity score
Testing the common support
assumption
Selecting a matching algorithm
Testing the matching
quality and treatment
effects
Sensitivity analysis
Estimating the propensity score
The estimation of the propensity score is based on the selection of the covariates and the estimation procedure The estimation procedure again depends on the number of groups that need to be included in the analysis As in evaluations usually only two groups ndash the treatment and comparison group ndash are compared and only discrete choice models usu-ally logit or probit regressions 29 are used While the type of regression only plays a minor role as both provide very similar findings the variables that are used to calculate the propensity score are by far more important as they need to fulfil the conditional inde-pendence assumption (CIA) in order to provide valid findings Furthermore as the propensity score indi-
28 The following descriptions are based on a CEval working paper (no 19) written by Muumlller Christoph 2012
29 Regressions are used in statistics for identifying the relation-ships between one dependent and several independent varia-bles (eg income depending on education gender and age) Logit and probit regressions are usually used when a variable can only have two values (eg yes and no participant and non-participant)
cates the conditional probability that an individual will receive a treatment only those variables must be used that reflect this probability Therefore it is not correct to generally refer to lsquosocio-economic covari-atesrsquo as is still sometimes found in the literature (cf eg OECD 2014) While socio-economic variables may be appropriate for interventions that focus on the poor (ie the poorer a person the more likely he or she is to participate) they may not make any sense for an intervention that focuses on vulnerability (ie the more vulnerable a person is the more likely he or she is to participate) Accordingly in the latter case variables that reflect the vulnerability of a per-son (eg proximity to a disaster-prone area) need to be taken as covariates In any case the selection of covariates needs to be theoretically substantiated
Once the covariates are selected the propensity score is calculated by a simple (logit or probit) regression Here it is important to note that only metric (ie continuous eg income age) and dichotomous vari-ables (ie variables that can have two values eg yesno 10) can be included Nominal (ie variables that can only have discrete valuescategories without ranking eg religion marital status) and ordinal (ie variables with discrete ranked values eg educational level) variables need to be recoded in dichotomous variables for each category before the analysis
Testing the common support assumption
After the propensity score has been calculated for each case (ie person individual) of the treatment and control group the so-called area of common support (ACS) has to be identified The ACS com-prises the range in which the treatment and com-parison group show a similar density of propensity scores Only cases that lie within this area can be used for the subsequent matching procedure The ACS can either be defined by cutting off the range at the low-est and highest propensity scores available for both groups or by trimming ie setting a certain density threshold level beneath which cases are discarded In order to decide how to define the ACS it makes sense to visualise the distribution of the propensity scores as the following figure illustrates
55
Figure 13 Exemplary illustrations of propensity scores densities
0
02
04
06
08
1
01 02 03 04 05 06 07 08 09 10
02
04
06
08
1
01 02 03 04 05 06 07 08 09 1
Treatment group
Comparison group
Treatment group
Comparison group
As the illustration in the example on the left shows it would be appropriate to cut the ACS below 03 as there are no cases in the treatment group below this value and above 08 as there are no cases in the com-parison group above that value On the right both groups feature values in the entire range between 0 and 1 However the treatment group contains no cases with propensity scores between 07 and 08 which would make it impossible to create matches in that area Accordingly it would make sense to set a threshold level say at about 015 beneath which cases are excluded In that case the ACS would lie between 03 and 06 and between 09 and 1 Note If no ACS can be identified PSM cannot be applied
Selecting a matching algorithm
Once the ACS has been defined matching then starts with the selection of the matching algorithm As there are a number of matching algorithms that dif-fer depending on how cases from the comparison group are assigned to cases of the treatment group and the type of weighting several algorithms are usually applied in order to select the one that is most sensitive for identifying the treatment effect Three popular matching algorithms are briefly outlined below
A very popular and fairly simple matching algorithm is the so-called nearest neighbour matching (NNM) With NNM the case from the comparison group that features the most similar propensity score to each case or group of cases of the treatment group is assigned ie the one with the most similar prob-ability of being a member of the treatment group The approach prevents so-called bad matches ie that cases which are very different ndash in terms of their characteristics as represented by the covariates ndash to each other are compared Cases from the compari-son group can then usually be used repeatedly as a matching partner for cases from the treatment group It is also recommended to match several cases from the comparison group with each case from the treatment group in order to receive more robust findings (ie with less variance) Thus the com-parison group should be considerably larger than the treatment group (cf 331) It should be noted though that the decision to use cases more than once in order to minimise the variance has the trade-off of a potentially higher bias as inferior matches may also be used Figure 14 provides a simplified illustration of how the matches can be identified graphically
Figure 14 Graphical illustration of nearest neighbour matching
Treatment group cases
Comparison group cases
0 025 05 075 1
Propensity score
Treatment group cases
Comparison group cases
0 025 05
Propensity score075 1
1Weighting factor of cases
Treatment group cases
Comparison group cases
0 025 05
Propensity score075 1
Range (caliper)
5 A
nnex
Impa
ct E
valu
atio
n G
uide
book
for C
limat
e Ch
ange
Ada
ptat
ion
Proj
ects
56
As figure 14 shows in this example both treatment group and comparison group cases are used repeat-edly for matching and cases that are not the nearest neighbour to any of the cases of the respective other group are discarded
Another matching algorithm that is frequently used is so-called kernel matching The algorithm uses the weighted means of preferably all individuals of the
comparison group to estimate the counterfactual sit-uation of an individual from the treatment group To apply this matching algorithm it has to be decided in advance how to weight the individual cases dur-ing the matching ie define the probability density function (eg a Gaussian function) and how steep the function should be (ie the slew rate) Again here is a graphic to illustrate the matching process
Figure 15 Graphical illustration of kernel matching
Treatment group cases
Comparison group cases
0 025 05 075 1
Propensity score
Treatment group cases
Comparison group cases
0 025 05
Propensity score075 1
1Weighting factor of cases
Treatment group cases
Comparison group cases
0 025 05
Propensity score075 1
Range (caliper)
Figure 15 shows that comparison group cases are weighted according to the proximity of their propen-sity score to the score of the treatment group case they should be matched with
A matching algorithm that offers a kind of compro-mise is the so-called radius matching for which only those cases of the comparison group are used for the
matching that are within a certain predefined range (also called lsquocaliperrsquo) to the treatment group case The advantage of this algorithm is that the range can be adjusted according to the number of available cases in the comparison group so that it can provide more robust findings provided sufficient cases are avail-able
Figure 16 Graphical illustration of radius matching
Treatment group cases
Comparison group cases
0 025 05 075 1
Propensity score
Treatment group cases
Comparison group cases
0 025 05
Propensity score075 1
1Weighting factor of cases
Treatment group cases
Comparison group cases
0 025 05
Propensity score075 1
Range (caliper)
Figure 16 shows that cases that lie outside a prede-fined range are discarded Since there are no gen-eral rules about how to define this range we should note that a wider range leads on the one hand to a reduced variance of the findings (ie increased robustness) on the other it also introduces more bias as lsquonot so goodrsquo matches are also used Conversely a narrower range reduces the bias but increases the variance Thus there is always a trade-off between the robustness and bias of the findings
Testing the quality of matching and calculating the treatment effects
When the matching procedures have been com-pleted it needs to be verified once again whether the above-mentioned balancing property is fulfilled A common method for doing this is to check if the dif-ference in the covariates between the treatment and comparison group has been substantially reduced which can be (amongst others) done by calculating lsquoCohens drsquo an index for comparing differences in mean values before and after matching However further methods are available for verifying the bal-ancing property that cannot be discussed in detail
57
here but can be found in the recommended litera-ture at the end of this section
After all these steps have been taken finally the treatment effects can be assessed in different ways First of all of course the sign and the magnitude of the mean differences in the outcome variables after matching provide information about the direction and size of the relevant effect Furthermore one-sided T-tests can be performed for checking if the treatment effects are significant
Sensitivity analysis
The last step to provide for a distinct attribution of the observed effects to an intervention is to assess the robustness of the findings against unobserved confounding factors To do this a sensitivity analy-sis needs to be conducted eg based on the so-called Rosenbaum Bounds (RBs) that make it possible to estimate how strongly a confounding factor would need to bias the selection process in order to com-promise the robustness of the estimated treatment effect RBs represent the limits within which treat-ment effects are considered significant Estimation of the RBs is based on the assumption that with an increasing positive or negative selection treatment effects are respectively over- or underrated This also means that the probability of a positive treatment effect decreases with positive selection and increases with a negative selection There are further indexes such as the Hodges-Lehmann estimator (ie for esti-mating the minimum treatment effect to be consid-ered as significant) that can be used to further hedge the findings of the sensitivity analysis
Unfortunately since the calculation of these estima-tors requires a substantial statistical background they cannot be discussed here in detail However sta-tistical programs such as SPSSreg or STATAreg provide particular modules for these estimators which make it possible also for laypeople to perform the required calculations (provided they have understood the sense and benefit of such an analysis)
54 Fixed-effects random-effects models and time-series cross-section analysis
Fixed-effects models (FEM) are used to estimate the impact of a particular independent variable (eg treatment framework condition) that varies over time on individual outcomes (eg income health status) It is based on the assumption that these outcomes correlate with that independent vari-able Thus FEM can reveal the relationship between
predictor and outcome variables within an analyti-cal entity giving consideration to time-invariant individual characteristics that potentially affect the impact of these predictor variables (eg profession on income or gender on nutrition) These characteristics are considered to be time-invariant unique to the analytical entity and not to be correlated with other individual characteristics In that case the treatment effect on the outcome variable of interest can be esti-mated by regressing the individual outcomes as cal-culated with the following formula
Whereby stands for the dependent outcome variable of interest with representing its analytical entity and the point in time when the data is col-lected is the value of the independent variable for this entity at that time the coefficient for the inde-pendent variable the invariant individual char-acteristic that affects the outcome and the error term for other unobserved factors that vary over time With that model all time- invariant differences between the analytical entities are controlled so that it can be used to identify the causes of observed changes of an analytical entity over time
In contrast to FEM the random-effects model (REM) is based on the assumption that variations in the individual outcomes of the entities are random and uncorrelated with the predictor variables Accord-ingly the REM should be used if it is assumed that differences across entities influence the depend-ent outcome variable Thus the formula has to be amended by adding a second error term that expresses this difference
As the application of REM requires that the second error term does not correlate with the predictor vari-able individual characteristics that potentially have an influence on the predictor variables need to be specified Accordingly omitting relevant variables in the model may lead to biased findings
A number of tests are available for deciding which model to use in a panel analysis such as the so-called Hausman test which tests whether correlates with the regressors the Pasaran cross-sectional dependence test or serial correlation tests As the test procedures cannot be discussed in detail in this Guidebook further references are provided in the literature list at the end of this section Furthermore it has to be added that for both STATAreg and SPSSreg do-file respectively syntax templates are available that can perform such tests on suitable data sets
5 A
nnex
Impa
ct E
valu
atio
n G
uide
book
for C
limat
e Ch
ange
Ada
ptat
ion
Proj
ects
58
Another lsquopanel-likersquo approach for long-term impact assessment is the so-called time-series cross-section (TSCS) analysis Similar to the panel analysis the TSCS analysis is based on data being collected over time from the same analytical units However in contrast to the former approach conclusions made with TSCS analysis are limited to the sample ie are not transferable to another population without fur-ther ado Another difference is that while the panel analysis requires a large sample but also works with a few observations (at least three) TSCS Analysis works with a small number of analytical entities but requires more observations (at least about 10) in order to provide robust findings Due to these fea-tures TSCS analysis is mainly used for policy studies with macro data and analytical entities such as sec-tors countries or regions As one the one hand the statistical fundamentals of TSCS analysis are quite complex and on the other hand the approach is not (yet) very popular for project evaluations it will not be discussed here in detail
However the following literature reference list gives some recommendations for further reading on this subject too
Beck N (2006) Time-SeriesndashCross-Section Methods New York New York University
Beck N (2001) Time-SeriesndashCross-Section Data What Have We Learned in the Last Few Years San Diego University of Califor-nia
Beck N Katz JN (1995) What to do (and not to do) with Time-Series Cross-Section Data The American Political Science Review 89(3)634 ndash 647
Girosi F King G (2001) Time Series Cross-Sec-tional Analyses with Different Explanatory Variables in Each Cross-Section Cambridge Harvard University
Wooldridge JM (2010) Econometric Analysis of Cross Section and Panel Data Cambridge The MIT Press
55 Structural equation modelling
As outlined in Section 316 structural equation models consist of latent constructs and empirically measurable indicators With regard to the operation-alisation of the constructsvariables two types of measurement models can be distinguished models based on reflective indicators and those based on formative indicators While reflective indicators are defined by their construct (eg construct sportiness
rarr indicator time needed to run 100 metres) forma-tive indicators define the construct (eg indicator number of training modules per month rarr construct sportiness) Accordingly reflective indicators have to correlate with each other while formative ones do not necessarily have to do so (eg time needed to run 100 500 1000 metres vs number of running mod-ules number of swimming modules etc) Another difference between reflective and formative con-structs is that reflective indicators are replaceable (eg time taken to run 100 metres time taken to cycle 1 km) while an exchange of formative indicators would result in a modification of the construct (eg number of maths lessons instead of training mod-ules)
Before the causal relationship between the con-structs can be analysed the validity of the measure-ment models ie how well the indicators opera-tionalise a construct needs to be checked Due to the above-mentioned differences the analysis of reflective and formative indicators differs As reflec-tive measurement models correspond to an explora-tive factor analysis (main component analysis) their validity is assessed on the basis of the factor loadings (should be ge0707) their significance its reliability (composite reliability r should be gt07) and the aver-age explained variance of the construct (should be gt05) Furthermore a reflective measurement model is considered valid if the explained variance of a construct is higher than each squared correla-tion between this and any other construct (lsquoFornell-Larker-Criterionrsquo ie discriminatory validity) Forma-tive measurement models correspond to a multiple regression Accordingly their quality is assessed on the basis of the factor weights their significance and the co-linearity of the indicators (ie the so-called variance inflation factor should be lt10)
Concerning the number of indicators required to describe a construct it has to be considered that there is a trade-off between the reliability of the measurement and the danger of creating artefacts which biases the construct (eg overrepresentation of physical indicators when measuring the health sta-tus) Furthermore the sample size should be consid-erably larger than the number of indicators
While the measurement model specifies the rela-tionship between the latent constructs and their indicators the structural model describes the influ-ence of the constructs on each other These influ-ences are graphically marked by arrows which rep-resent assumed causal relationships The direction of the arrow indicates the direction of causality ie defines what is the cause and what is the effect In principle both the number of constructs and the number of (estimated) causal relations are unlimited This also means that a construct can be both affected
59
by one or more constructs and affect another one or more others
The relationship between two constructs is expressed by the so-called path coefficient which ranges from -1 (perfect negative relationship) to 1 (perfect positive relationship) A value of 0 may indi-cate that there is no statistical relationship between two constructs While a high value of is preferable in practice values higher than 04 (respectively lt-04) can be considered as very high It has to be added that SEM makes it possible to calculate not only direct effects but also indirect and total effects
The path coefficient can be calculated in two dif-ferent ways ie by means of co-variance analysis or variance analysis each having some advantages and disadvantages Although the theoretical founda-tions of the two methods cannot be discussed here in detail the main aspects that help decide which one to choose are summarised in the following table
Table 8 Decisive aspects for choosing co-variance or variance analysis 30
Co-variance analysis Variance analysis
Preferred method for analysing established theories and testing hypotheses
Preferred method in explorative studies ie if the causal relations between the constructs are not yet substantiated
Works best with large sample sizes (n gt100)
Also works with smaller sample size (n gt30)
Method of choice if statistical quality criteria1 are preferred for assessing the validity of the model
Method of choice if the model is validated nomologically
Available software eg AMOSreg LISRELreg
Available software eg SmartPLSreg
As the table shows variance analysis might be the preferred choice for evaluations since they are usu-ally explorative in nature and constructs that char-acterise the objectives of an intervention are more likely to be based on formative measurement mod-els The smaller required sample size also speaks for the use of variance analysis However the fact that no statistical indexes are available to assess the validity of variance analysis-based structural mod-els means that the researcher applying this method needs to have comprehensive knowledge about the system conditions and the causal linkages between its elements
Nevertheless variance analysis also provides indi-ces for assessing the contribution of an intervention
30 Adapted from Jahn 200716
to an observed effect such as the above-mentioned path coefficient (should be gt02) its significance and the effect strength (fsup2 weak gt002 average gt015 strong gt035) Furthermore the model fit (Rsup2 small gt02 average gt033 substantial gt067) indicates the informative value of the model (ie how far the inde-pendent constructs explain the variance of the indi-vidual constructs)
As also shown in the table meanwhile a number of user-friendly computer programs are available for calculating structural equation models at least on the basis of variance analysis While in principle even people with a limited methodological background can operate such software (at least it provides plausi-ble findings) it is not recommended to do so because incorrect theoretical assumptions or setting wrong parameters for calculating the quality criteria can lead to biased or even completely false findings
56 Calculating sample sizes for probability sampling
This section outlines three different ways to cal-culate the sample size depending on the available information about the basic population In the first example the size of the basic population is known but the true value of a certain dichotomous charac-teristic (ie can have two values eg whether or not a beneficiary applied an improved farming technique) is not In this case the required sample size can be calculated simply according to the formula
Whereby is the required sample size is the size of the basic population and is the desired margin of error So assuming the basic population amounts to 1000 persons and the desired margin of error is 005 then the minimum sample size would be
10001000 ∙ 005
1000
This means data from a minimum of 286 randomly selected respondents would be needed for the survey
5 A
nnex
Impa
ct E
valu
atio
n G
uide
book
for C
limat
e Ch
ange
Ada
ptat
ion
Proj
ects
60
An alternative way to calculate the minimum sam-ple size for large populations ndash even if the exact size of the basic population is not known ndash is illustrated next In this case it is advantageous to have a good estimate of the true value of an observed characteris-tic of interest (eg gender distribution)
Thereby is the area under the normal curve corre-sponding to the defined level of confidence and is the true share of the population that displays a cer-tain characteristic (eg is female)
For most common levels of confidence equals as follows
90 = 164595 = 196099 = 2575999 = 3290
eg for a population in which 48 are female and the desired margin of error is 005 the minimum sample size would be
196 ∙ 048 ∙005
0958900025
However if the actual share of the basic population that features a certain characteristic of interest (eg percentage of beneficiaries who have adopted a new farming technique or not) is not known it is always safe to assume a 50 share as then the term bull (1 - ) and accordingly the entire formula reaches its maximum
If the size of the basic population is known and if it is smaller than approximately 50000 one can still use the latter formula in a first step but reduce the sam-ple size in a second step by applying the following correction term
Whereby is the required sample size as calculated above Assuming that the basic population only com-prises 1000 persons then the minimum sample size would be
384
1000
3841383
So according to this correction term it is acceptable to reduce the sample size by 106 respondents which equals a reduction of more than a quarter
It must however be kept in mind that the sample sizes provided in these formulas corresponds to the actual number of necessary completed question-naires Accordingly when planning a survey the non-response rate has to be considered as well The rate indicates the share of those who do not par-ticipate in the survey despite being selected for the sample This needs to be compensated to assure that the sample remains large enough to achieve the desired level of confidence and margin of error So if for example a sample size of 500 is required and it is assumed that only 80 might answer the number of respondents needs to be increased to at least 625
Furthermore it has to be considered that if the sur-vey is part of an experimental or quasi-experimental design data need to be collected not only for the treatment group but also for a comparison group Therefore when applying PSM the comparison group sample needs to be considerably bigger than the treatment group sample ndash ideally about two to three times the size ndash in order to assure that suf-ficient cases are available for matching during data analysis (cf 312)
61
57 Literature
Bours D et al (2014) Guidance Note 1 Twelve Rea-sons why Climate Change Adaptation MampE Is Challenging httpwwwseachangecoporgsitesdefaultfilesdocuments2014200120SEA20Change20UKCIP20GN1201220Reasons20why20CCA20MandE20is20challengingpdf
Bours D et al (2014) Guidance Note 2 Selecting Indicators for Climate Change Adaptation Pro-gramming httpwwwseachangecoporgsitesdefaultfilesdocuments2014200120SEA20Change20UKCIP20GN220Selecting20indi-cators20for20CCA_0pdf
Bours D et al (2014) Guidance Note 3 Theory of Change Approach to Climate Change Adaptation Programming httpwwwseachangecoporgsitesdefaultfilesdocuments2014200220SEA20Change20UKCIP20GN320ToC20approach20to20CCA20programmingpdf
Bours D et al (2014) Monitoring and Evaluation for Climate Change Adaptation and Resilience A Syn-thesis of Tools Frameworks and Approaches Sec-ond Edition httpwwwseachangecoporgsitesdefaultfilesdocuments20142005201520SEA20Change20UKCIP20Synthesis20Report202nd20editionpdf
Bours D et al (2014) Design Monitoring and Evalu-ation in a Changing Climate Lessons Learned from Agriculture and Food Security Programme Evaluations in Asia httpwwwseachangecoporgsitesdefaultfilesdocuments2014200520SEA20Change20UKCIP20ER120Agriculture20and20food20security_0pdf
Bours D et al (2014) International and donor agency portfolio evaluations trends in monitor-ing and evaluation of climate change adapta-tion programs httpwwwseachangecoporgsitesdefaultfilesdocuments2014200620SEA20Change20UKCIP20ER220CCA20MandE20trends20from20porfolio20evalu-ations_0pdf
Conway D amp Mustelin J (2014) Strategies for improving adaptation practice in developing countries Nature Climate Change 4339-342
Cordero C (2014) Case Study Working with the Vulnerability Sourcebook in Chullcu Mayu Bolivia News GIZ httpwwwgizdeexpertisehtml15486html
Dinshaw A et al (2014) Monitoring and Evaluation of Climate Change Adaptation Methodological Approaches OECD Environment Working Paper No 74 OECD Publishing
Ford JD et al (2013) How to track Adaptation to Climate Change A typology of Approaches for National-Level Application Ecology and Society 18(3)40
Ford J D amp Berrang-Ford L (2015) The 4Cs of adap-tation tracking consistency comparability com-prehensiveness coherency Mitigation and Adap-tation Strategies for Global Change 1-21
Fischerova G (no date) Strategic Initiatives to Address Climate Change in LDCs (Boots on the Ground) Integrating Climate Change Risks into Development Planning and Programming UNDP Bratislava Regional Centre (PowerPoint Presenta-tion)
Foumlrch W et al (2014) Back to Baselines Measuring Change and Sharing Data Agriculture and Food Security 2014 313 httpwwwagricultureand-foodsecuritycomcontentpdf2048-7010-3-13pdf
Garcia JR amp Zazueta A (2015) Going Beyond Mixed Methods A Systems Perspective for Ask-ing the Right Questions Institute of Develop-ment Studies httponlinelibrarywileycomdoi1011111759-543612119epdf
German Federal Ministry for Economic Cooperation and Development (BMZ) (2013) Climate Finance Readiness Programme Early Action for Ambitious Goals httpwwwgizdeexpertisedownloadsgiz2013-en-climate-finance-readiness-flyerpdf
GIZ (2012) Disaster Risk Management and adapta-tion to climate change Experience from German Development Cooperation Deutsche Gesellschaft fuumlr Internationale Zusammenarbeit (GIZ) GmbH httpwwwipaccpedocen-disaster-risk-man-agement-climate-changepdf
GIZ (2013) GIZrsquos global GCF Readiness Programme Competence Centre for Climate Change Environ-ment and Climate Change Division httpwwwgizdeexpertisedownloadsgiz2013-en-climate-finance-gcfitpdf
5 A
nnex
Impa
ct E
valu
atio
n G
uide
book
for C
limat
e Ch
ange
Ada
ptat
ion
Proj
ects
62
GIZ (2013) GIZ in South Africa Programs and Pro-jects Deutsche Gesellschaft fuumlr Internationale Zusammenarbeit (GIZ) GmbH httpswwwgizdededownloadsgiz2013-en-giz-programs-pro-jects-south-africapdf
GIZ (2013) Guidelines on designing and using a results-based monitoring system (RBM system) httpswwwgiz2013-0110en-results-based-moni-toring-systempdf
GIZ (2014) Transboundary Water Management Sup-port to Cooperation on Shared Waters Deutsche Gesellschaft fuumlr Internationale Zusammenarbeit (GIZ) GmbH httpwwwgizdeexpertisedown-loadsgiz2014-en-mappe-transboundary-water-managementpdf
GIZ (2015a) The Sustainable Agricultural Programme (PROAGRO I amp II) httpproagro-boliviaorg (accessed on 22102015)
GIZ (2015b) Public Investment and Climate Change Adaptation (IPACC) project httpwwwgizdeenworldwide13314html (accessed on 22102015)
GIZ (2015c) Climate Support Programme (CSP) httpwwwgizdeenworldwide17807html (accessed on 22102015)
Hammill A et al (2013) Comparative Analysis of climate change vulnerability assessments Les-sons from Tunisia and Indonesia Competence Centre for Climate Change Deutsche Gesellschaft fuumlr Internationale Zusammenarbeit httpsgc21gizdeibtvarappwp342deP1443wp-contentuploadsfilebasevavulnerability-guides-man-uals-reportsComperative-analysis-of-climate-change-vulnerability-assessmentspdf
Hedger MM (2008) Desk Review Evaluation of Adaptation to Climate Change from a Develop-ment Perspective Institute of Development Stud-ies httpswwwclimate-evalorgsitesdefaultfileseventsalexandriaIDS_Report_on_Evaluat-ing_Adaptation_for_GE_publication_versionpdf
IIED (2015) Capacity Strengthening in Least Deve-loped Countries (LDCs) for Adaptation to Climate Change (CLACC) httpwwwiiedorgcapacity-strengthening-least-developed-countries-for-adaptation-climate-change-clacc (accessed on 22102015)
Karkoschka O et al (2013) Guidance for Integrat-ing Monitoring and Evaluation of Climate Change Adaptation into Strategies in Mongolia Deutsche Gesellschaft fuumlr Internationale Zusammenarbeit httpwwwseachangecoporgsitesdefaultfilesdocuments2013200720GIZ20-20Guid-ance20for20Integrating20M26E20of20CCA20into20Strategiespdf
Lamhauge N et al (2012) Monitoring and Evaluation for Adaptation Lessons from Development Coop-eration Agencies OECD Environment Working Paper No 38 OECD Publishing httpwwwoecd-ilibraryorg docserverdownload5kg20mj6c2bwpdfexpires=1425238023ampid=idampaccname=guestampchecksum=77BA5587F2D7AD9EF6C22B614A36C4D4
Leighton M et al (2011) Climate Change and Migra-tion Rethinking Policies for Adaptation and Disaster Risk Reduction No 152011 United National University - Institute for Environment and Human Security httpswwwehsunuedufileget8468
Leiter T (2015) Linking Monitoring and Evaluation of Adaptation to Climate Change across Scales Avenues and Practical Approaches In D Bours P Pringle amp C McGinn (Eds) Monitoring and Evalu-ation of Climate Change Adaptation A review of the landscape New Directions for Evaluation 147 117-127
OECD (2011) Handbook on the OECD-DAC Cli-mate Markers httpwwwoecdorgdacstats48785310pdf
OECD (2014) OECD DAC Statistics Aid to Climate Change Adaptation March 2014 Version 2 httpwwwoecdorgdacenvironment-developmentAdaptation-related20Aid20Flyer20-20March20201420v2pdf
Olivier J et al (2013) Adaptation made to measure A Guidebook to the Design and result-based moni-toring of climate change adaptation projects 2nd Edition Deutsche Gesellschaft fuumlr Internationale Zusammenarbeit (GIZ) GmbH httpsgc21gizdeibtvarappwp342deP1443wp-contentuploadsfilebasememe-guides-manuals-reportsGIZ-2013_Adaptation_made_to_measure_second_editionpdf
63
Prowse M et al (2010) Impact Evaluation and Intervention to address Climate Change A Scop-ing Study International Initiative for Impact Evaluation Working Paper 7 httpswwwclimate-evalorgsitesdefaultfilesevalua-tions53020Impact20Evaluation20and20Interventions20to20Address20Climate20Change20-20A20Scoping20Studypdf
Sanahuja H E (2011) A Framework for Monitoring and Evaluating Adaptation to Climate Change Community of Practice Global Environment Facility httpswwwclimate-evalorgsitesdefaultfilesstudiesClimate-Eval20Frame-work20for20Monitoring20and20Evalua-tion20of20Adaptation20to20Climate20Changepdf
Sara Orleans Reed et al (2014) Resilience projects as experiments implementing climate change resil-ience in Asian cities climate and development Published by Taylor amp Francis httpwwwtand-fonlinecomdoifull101080175655292014989190VPZRBvmG-NM
Scholze M (2013) Country Experiences with Main-streaming Adaptation ndash from Programme to National Level Webinar httpsgc21gizdeibtvarappwp342deP1443wp-contentuploadsfilebasems mainstreaming_webinareCoun-try_experiences_with_mainstreaming_adapta-tion_national_levelpdf
Schwartzendruber F (2014) Evaluation of NRM interventions linked to climate change A scoping study Draft version httpswwwclimate-evalorgsitesdefaultfilesstudiesNRM-Study-Draftpdf
Smit B amp Pilifosova O (2010) Adaptation to Climate Change in the Context of Sustainable Develop-ment and Equity httpswwwvieunuedufileget9995pdf
Smith JB Vogel J M and Cromwell J E (2009) An architecture for government action on adaptation to climate change An editorial comment Climatic Change 9553-61
UNDP (2009) Thematic Area Scaling up local and community-based actions UNDP Community Based Adaptation httpsunfcccintfilesadapta-tionapplicationpdfundp_ap_update_sep_09_cba_1_sppdf
UNDP (2011) Achievements in 2011 Strategic Initia-tive to Address Climate Change in Least Devel-oped Countries Boots on the Ground Report httpwwwundporgcontentdamundplibraryEnvironment20and20EnergyCli-mate20Change2011-Boots-on-the-Ground-Reportpdf
UNDP (2011) Brochure on Strategic Initiative to Address Climate Change in LDCs httpwwwundporgcontentdamundplibraryEnviron-ment20and20EnergyClimate20ChangeCapacity20DevelopmentFlyer20for20Boots20on20the20Ground_Final_rev20rcpdf
UNDP (2013) UNDP support to LDCs to Access Finance for Adaptation Basic Facts and Figures httpundp-almorgsitesdefaultfilesdown-loadsoverview_of_undp_ support_to_ldcs_to_access_finance_for_adaptation_-_nov_2013pdf
UNDP (2015a) Community-Based Wetland Manage-ment Project (BIRAM) httpwwwundp-almorgprojectsspa-cba-bangladesh-community-based-wetland-management-project-biram (accessed on 22102015)
UNDP (2015b) National Adaptation Plan Global Support Programme (NAP-GSP) httpwwwundp-almorgprojectsnaps-ldcs (accessed on 22102015)
UNDP (2015c) Pacific Integrated Water Resource Management (IWRM) project httpwwwtand-fonlinecomdoipdf10108019439341003786729 (accessed on 22102015)
Villanueva P S (2011) Learning to Adapt Monitor-ing and Evaluation Approaches in Climate Change Adaptation and Disaster Risk Reduction ndash Chal-lenges Gaps and Ways Forward httpr4ddfidgovukPDFOutputsClimateChangeSCR-Dis-cussionPaper9--Learning-to-ADAPTpdf
Wuumlrtenberger L (2013) GCFit GIZrsquos Global GCF Readiness Programme Deutsche Gesellschaft fuumlr Internationale Zusammenarbeit (GIZ) GmbH httpwwwcaribankorguploads201305GIZC2B4s-Global-GCF-Readiness-Programmpdf
5 A
nnex
Impa
ct E
valu
atio
n G
uide
book
for C
limat
e Ch
ange
Ada
ptat
ion
Proj
ects
64
Notes
65
Published by Deutsche Gesellschaft fuumlr Internationale Zusammenarbeit (GIZ) GmbH
Registered offices Bonn and Eschborn Germany
Global Project Effective Adaptation Finance (MampE Adapt)
BMZ Bonn Dahlmannstraszlige 4 53113 Bonn Germany Tel +49 (0) 228 99 535 - 0 Fax +49 (0) 228 99 535 - 3500
BMZ Berlin Stresemannstraszlige 94 10963 Berlin Germany Tel +49 (0) 30 18 535 - 0 Fax +49 (0) 30 18 535 - 2501
poststellebmzbundde wwwbmzde
Friedrich-Ebert-Allee 36 + 40 53113 Bonn Germany Tel +49 (0) 228 44 60 - 0 Fax +49 (0) 228 44 60 - 1766
Dag-Hammarskjoumlld-Weg 1-5 65760 Eschborn Germany Tel +49 (0) 6196 79 - 0 Fax +49 (0) 61 96 79 - 1115
climategizde wwwgizdeclimate
In cooperation with UNDP Center for Evaluation CEVAL
Autors Stefan Silvestrini Ines Bellino Susanne Vaumlth
Design and layout Ira Olaleye Eschborn Germany
Photo credits Title page copy Ranak Martin
As at September 2015
GIZ is responsible for the content of this publication
On behalf of Federal Ministry for Economic Cooperation and Development (BMZ) Special Unit lsquoClimatersquo
Addresses of the BMZ offices
- Impact Evaluation Guidebook for Climate Change Adaptation Projects
-
- Content
-
- List of figures
-
- Figure 1Flow chart for implementing an RIE
- Figure 2Illustration of the pipeline approach
- Figure 3Selection of individuals for comparison
- Figure 4Outcome scores before and after intervention
- Figure 5Generic layout of a structural equation model
- Figure 6Decision tree for selecting an evaluation design for measuring impacts at individual level
- Figure 7Decision tree for selecting an evaluation design for measuring impacts at institutional and system level
- Figure 8Distribution of sample mean values in relation to the true population mean value
- Figure 9Simplified SEM for the GIZ projectthinspthinsp33
- Figure 10Draft schedule for impact monitoring and evaluation framework
- Figure 11Calculation of the net treatment effect in an experimental or quasi-experimental design
- Figure 12PSM sequence
-
- List of tables
-
- Table 1Exemplary data collection plan
- Table 2Example table for matching on observables
- Table 3Required project characteristics and data
- Table 4Example of question types
- Table 5Exemplary to-do list for preparing a survey
- Table 6Applicability of evaluation designs
- Table 7Draft (simplified) data collection plan
- Table 8Decisive aspects for choosing co-variance or variance analysisthinsp
-
- List of abbreviations
- Glossary
-
- Executive Summary
- 1Introduction
-
- 11How to use the Guidebook
- 12How to plan and implement an RIE for CCA projects
-
- 2Evaluating climate change adaptation projects
-
- 21Types and key features of climate change adaptation projects
-
- 211Adaptation projects addressing the individual level
- 212Adaptation projects addressing the institutional level
- 213Adaptation projects addressing the systemic level
-
- 22Key challenges of climate change adaptation projects
- 23Review of current methods to evaluate the results of CCA projects
-
- 3Rigorous evaluation designs and examples of applicability in climate change adaptation projects
-
- 31Overview of evaluation designs ndash potentials and limitations for climate change adaptation projects
-
- 311Experimental and quasi-experimental designs
- 312Matching techniques
- 313Pipeline approach
- 314Regression discontinuity design
- 315Time-series designs
- 316Structural equation modelling
- 317Summary
-
- 32Providing reliable large-scale data
-
- 4Case study Urban Management of Internal Migration due to Climate Change
-
- 41Background and project objectives
- 42Practical implementation
-
- 5Annex
-
- 51Overview of current CCA related-project evaluations
- 52Calculation of net average treatment effect with double-difference approach
- 53Propensity score matching (PSM)
- 54Fixed-effects random-effects models and time-series cross-section analysis
- 55Structural equation modelling
- 56Calculating sample sizes for probability sampling
- 57Literature
-
- Publishing information
-

Impa
ct E
valu
atio
n G
uide
book
for C
limat
e Ch
ange
Ada
ptat
ion
Proj
ects
2
List of tablesTable 1 Exemplary data collection plan 13Table 2 Example table for matching on observables 25Table 3 Required project characteristics and data 35Table 4 Example of question types 36Table 5 Exemplary to-do list for preparing a survey 37Table 6 Applicability of evaluation designs 42Table 7 Draft (simplified) data collection plan 44Table 8 Decisive aspects for choosing co-variance 58
List of figuresFigure 1 Flow chart for implementing an RIE 14Figure 2 Illustration of the pipeline approach 27Figure 3 Selection of individuals for comparison 28Figure 4 Outcome scores before and after intervention 28Figure 5 Generic layout of a structural equation model 31Figure 6 Decision tree for selecting an evaluation design for measuring impacts at individual level 33Figure 7 Decision tree for selecting an evaluation design for measuring impacts at institutional and system level 34Figure 8 Distribution of sample mean values in relation to the true population mean value 38Figure 9 Simplified SEM for the GIZ project 45Figure 10 Draft schedule for impact monitoring and evaluation framework 47Figure 11 Calculation of the net treatment effect in an experimental or quasi-experimental design 52Figure 12 PSM sequence 53
3
List of abbreviations
AAP Africa Adaptation ProgrammeADB Asian Development BankBGR Federal Institute for Geosciences and Natural ResourcesBMZ German Federal Ministry for Economic Cooperation and DevelopmentBMUB German Federal Ministry for the Environment
Nature Conservation Building and Nuclear SafetyCCA Climate change adaptationCIDA Canadian International Development AgencyCO2 Carbon dioxide DAC Development Assistance CommitteeDfID Department for International DevelopmentEU European UnionGCF Green Climate Fund GHG Greenhouse gases GIZ Deutsche Gesellschaft fuumlr Internationale Zusammenarbeit GmbH IFAD International Fund for Agricultural DevelopmentKfW Kreditanstalt fuumlr WiederaufbauLDC Least developed countyLDCF Least Developed Countries FundMampE Monitoring and EvaluationNAMAs Nationally Appropriate Mitigation ActionsNAP National Adaptation PlanNC National CommunicationNGO Non-governmental organisation OECD Organisation for Economic Co-operation and DevelopmentPSM Propensity score matchingRDD Regression discontinuity designRCT Randomised controlled trialREDD Reducing Emissions from Deforestation and Forest DegradationSEM Structural equation model(ling)SIDA Swedish International Development AgencyToC Theory of changeUNDP United Nations Development ProgrammeUNEP United Nations Environment ProgrammeUNFCCC United Nations Framework Convention on Climate ChangeUNICEF United Nations Childrenrsquos FundUNIDO United Nations Industrial Development Organization USAID United States Agency for International Development WFP World Food Programme
Impa
ct E
valu
atio
n G
uide
book
for C
limat
e Ch
ange
Ada
ptat
ion
Proj
ects
4
Glossary
Accountability Obligation to demonstrate that work has been conducted in compliance with agreed rules and stand-ards or to report fairly and accurately on performance results vis-agrave-vis mandated roles andor plans This may require a careful demonstration that the work is consistent with the contract terms
Adaptation Adjustment in natural or human systems in response to actual or expected climatic stimuli or their effects which moderates harm or exploits beneficial opportunities Various types of adaptation can be distinguished including anticipatory autonomous and planned adaptation Anticipatory adaptation ndash Adaptation that takes place before impacts of climate change are observed Also referred to as proactive adaptation Autonomous adaptation ndash Adaptation that does not constitute a conscious response to climatic stimuli but is triggered by ecological changes in natural systems and by market or welfare changes in human systems Also referred to as spontaneous adaptation Planned adaptation ndash Adaptation that is the result of a deliberate policy decision based on an aware-ness that conditions have changed or are about to change and that action is required to return to maintain or achieve a desired state
Adaptive capacity
The ability of a system to adjust to climate change (including climate variability and extremes) to moderate potential damages to take advantage of opportunities or to cope with the consequences
Attribution Ascribing the cause of an effect (change) to a specific intervention An approach to () rigorous impact evaluation that concerns clear cause-effect relationships ie establishing causal links and drawing explanatory conclusions about observed changes (whether anticipated or not) and the con-cerned intervention Focusing on clear causation implies considering the () counterfactual to assess the () net impact of an intervention by a comparison of what has occurred with the intervention implemented (the factual) with the situation without the intervention (the counterfactual)
Climate change
Climate change refers to any change in climate over time whether due to natural variability or as a result of human activity This usage differs from that in the United Nations Framework Convention on Climate Change (UNFCCC) which defines lsquoclimate changersquo as lsquoa change of climate which is attrib-uted directly or indirectly to human activity that alters the composition of the global atmosphere and which is in addition to natural climate variability observed over comparable time periodsrsquo
Counterfactual The situation that would have happened if the intervention had not taken place (lsquowithoutrsquo situation) As the counterfactual is not directly observable the unobservable potential outcome of the counter-factual situation is estimated via the situation of an equivalent control comparison group that is not affected by the intervention This is done using () randomised controlled trials (RCT) or () quasi-experimental designs
Evaluability Extent to which an activity or a programme can be evaluated in a reliable and credible fashion
Experimental design
A study in which individuals (or groups of individuals) are randomly allocated (by chance alone) to an intervention group (treatment) or a control group (not being part of the intervention) Experimental studies ( RCTs) seek to measure an interventionrsquos () net impact by comparing the two groupsrsquo situations before and after the intervention ( attribution)
Exposure The nature and degree to which a system is exposed to significant climatic variations
Factual The observed outcome of an intervention (lsquowithrsquo situation) ( counterfactual)
Impact 1 Positive and negative primary and secondary long-term effects produced by an intervention directly or indirectly intended or unintended ( net impact)
Impact evaluation
An evaluation that looks beyond the immediate results of an intervention project programme or policy Impact evaluations may focus (i) on higher outcomes rather than intervention outputs (ii) on longer-term results (iii) on a group of interventions within a given sector or geographical area or (iv) explicitly on the impacts produced by an intervention ie attributing impacts to an intervention ( Rigorous impact evaluation)
Monitoring A continuing function that uses systematic collection of data on specified indicators to provide management and the main stakeholders of an ongoing development intervention with indications of the extent of progress and achievement of objectives and progress in the use of allocated funds
1 For GIZ colleagues a brief explanation of how this impact definition fits into GIZrsquos results model (GIZ 2013) The results model is an ex-pression of GIZrsquos Managing for Development Results approach The results model forms the detailed basis for GIZrsquos subsequent operation-al planning and for establishing the results-based monitoring system at the start of implementation Within this model GIZ understands results as the lsquointended or unintended positive or negative changes in a situation or behaviour as the direct or indirect consequence of an interventionrsquo Results include impacts outcomes and outputs Impacts are defined as lsquothe long-term overarching development results They are usually located at the level of the development cooperation programme objectiversquo This definition largely corresponds to the one used in this document However at some points in this publication the authors use the term lsquoimpactrsquo synonymously with the term lsquooutcomersquo when applied to GIZrsquos results model Within GIZ outcomes are defined as the lsquoexpected or actually achieved direct short-term and medium-term results of a measurersquos outputsrsquo
5
Net impact Effects exclusively produced by an intervention (without effects caused by other possible external causes) effects that can be () attributed to a specific intervention by clear () causation The net impact (b-c) is the difference between what has occurred with the intervention implemented (b-a) the () factual and the situation without the intervention (c-a) the () counterfactual
after intervention
beforeintervention
netimpact
bb
cc
aagrossimpact
change with intervention
change without intervention
impa
ct in
dica
tor
time
Technically speaking the net impact is defined as fol-lows an effect caused by a treatment (intervention) is the difference between the outcome under a treat-ment (T=1) minus the alternative outcome that would have happened without the treatment (T=0)
Partial least squares analysis
A multivariate statistical approach for the estimation of causal relationships It is a variance-based non-linear (ie no assumptions regarding the value distribution of a variable required) iterative method based on a linear regression model It allows the estimation of concrete values for latent (ie non-observablemeasurable) constructs with the help of manifest (ie observablemeasurable) indi-cators
Quality (rigorous) impact evaluations
As there is (i) a mistaken belief that () rigorous impact evaluations have to use () randomised con-trolled trials (RCTs) on the one side and (ii) the fact that most rigorous impact evaluations are being carried out by economists and econometricians (not evaluators) resulting in technically competent studies but not automatically very good evaluations on the other side more and more the term lsquoqual-ityrsquo impact evaluation is used to avoid misunderstanding and to focus on quality
Quasi-experimental designs
An attempt to uncover a causal () attribution even though a random pre-selection processes is not possible A quasi-experimental design is a type of experimental design ( RCT) where a randomised control group could not be established for either ethical or practical reasons and therefore the inter-vention grouprsquos situation is compared with those of a similar group of individuals not receiving inter-vention activities (comparison group)
Randomised controlled trial (RCT)
An () experimental study in which individuals (or groups of individuals) are randomly allocated (by chance alone) to an intervention group (treatment) or a control group (not being part of the interven-tion) RCTs seek to measure an interventionrsquos () net impact by comparing the two groupsrsquo situations before and after the intervention ( attribution)
Resilience The ability of a social or ecological system to absorb disturbances while retaining the same basic structure and ways of functioning the capacity for self-organisation and the capacity to adapt to stress and change
Rigorous impact evaluation
An () impact evaluation with strong emphasis on lsquoproduced byrsquo focusing on clear causationcausal attribution by establishing the counterfactual Assessing the effects produced by an intervention the () net impact requires a comparison of what has occurred with the intervention implemented ndash ie the () factual ndash with the situation without the intervention ndash ie the () counterfactual The term lsquorigorousrsquo is added to differentiate this approach from many ndash more traditional ndash () impact evalua-tion approaches
lsquoRigorisedrsquo impact evaluation
A () rigorous impact evaluation conducted in a real-life situation where necessary conditions are not (fully) given and which is therefore conducted as rigorously as is feasible
Sensitivity Sensitivity is the degree to which a system is affected either adversely or beneficially by climate vari-ability or change The effect may be direct (eg a change in crop yield in response to a change in the mean range or variability of temperature) or indirect (eg damages caused by an increase in the fre-quency of coastal flooding due to a rise in sea level)
Vulnerability Vulnerability is the degree to which a system is susceptible to and unable to cope with adverse effects of climate change including climate variability and extremes Vulnerability is a function of the char-acter magnitude and rate of climate change and variation to which a system is exposed its sensitiv-ity and its adaptive capacity
Glossary
Impa
ct E
valu
atio
n G
uide
book
for C
limat
e Ch
ange
Ada
ptat
ion
Proj
ects
6
Executive Summary
Phot
o copy
GIZ
Gue
nay
Ulu
tunc
ok
Monitoring and evaluating impacts is usually both costly and laborious Often it is also a challenging process particularly when complex causal linkages or uncertain framework conditions are involved All of this applies to climate change adaptation (CCA) projects which present further methodological and practical challenges that complicate the assessment of concrete adaptation results However provid-ing evidence about the impact of an intervention is often indispensable when it comes to generating knowledge about what works and what doesnrsquot ini-tiating organisational learning processes monitoring the progress made or simply being accountable for the use of resources This Guidebook seeks to sup-port project managers by providing an overview of different impact evaluation methods and how they can be applied to climate change adaptation projects The application of the Guidebook is further illustrated by a case study of an adaptation project in Bangladesh
Evaluations and rigorous impact evaluations ndash Whatrsquos the difference
While many evaluation approaches claim to pro-vide some kind of indication about project impacts (eg most significant change approach participatory rapid assessment) robust evidence can only be pro-vided by sophisticated evaluation designs that com-ply with scientific standards and are based on valid empirical data Evaluations that use such sophisti-cated designs and involve the collection of a consid-erable amount of empirical data are also called rig-orous impact evaluations (RIEs) The advantage of RIEs in contrast to lsquosofterrsquo designs is that they make it possible to clearly attribute observed changes to a particular intervention or at least make it possible to quantify the contribution an intervention has made
to these changes This Guidebook provides practi-tioners in the field of CCA with a selection of such RIE designs differentiated according to the type of impact (ie micro meso or macro-level impacts) they are able to measure
Rigorous impact evaluations (RIEs) make it possible to attribute observed changes to a particular intervention or at least quantify the contribution an intervention has made to these changes
The difficulties involved in measuring the impacts of CCA projects are widely recognised by practition-ers and the adaptation community (eg Bours et al 2014) The latter acknowledges the limited evidence on global adaptation progress and the gaps in the evolving adaptation science (FordBerrang-Ford 2015) For climate change mitigation progress can be tracked with reference to the global concentration of greenhouse gases (GHGs) For climate change adap-tation though there is no such single metric This explains the need to equip practitioners with the right methods to assess adaptation results and dem-onstrate the added value of their projects
Establishing causality on different levels
According to the OECDrsquos Development Assistance Committee (DAC) impact evaluations take into account intended and unintended positive and neg-ative as well as expected and unexpected changes They are supposed to not only provide information on all possible changes that have occurred during the implementation of an intervention but also to link these observed changes to their causes There-fore the establishment of causality (causeeffect relationship) is crucial in order to understand why particular incidents occurred during and after a pro-ject or programme In particular the question lsquoWhat would have happened without the project or pro-
7
grammersquo needs to be investigated in detail At this point a so-called counterfactual assessment (ie the comparison between what actually happened and what would have happened in the absence of the intervention) must be considered Since it is impos-sible to collect data on what would have happened if the intervention had not been implemented many RIEs are based on designs that include comparison data ie on individuals in a similar situation who were not exposed to the intervention
The RIE designs presented in this Impact Evaluation Guidebook are differentiated according to the type of impact they are able to measure ie
y micro (individual) y meso (institutional) or y macro (systemic)-level impacts
The aim of the Guidebook is to address the challenge of producing more and better impact evaluations giving practitioners the necessary know-how in order to plan implement and steer an RIE It enables practitioners to identify which of the RIE designs are suitable for successfully evaluating their par-ticular project or programme and also reveals the respective potentials and limitations of the differ-ent designs when it comes to their application in the field of CCA
The benefit of implementing RIEs for CCA projects
Why are RIEs increasingly being considered as an option for evaluating a CCA project The Paris Dec-laration on Aid Effectiveness which calls for more and better impact evaluations has created a cer-tain amount of pressure and consequently a rising demand to use RIEs This also explains why more funding is becoming available and the literature is growing in this area During the research for this Guidebook one crucial step was to understand how CCA projects were evaluated in the past and how they are currently evaluated So far RIEs have rarely been undertaken for CCA projects Addition-ally respected independent evaluation departments have seldom implemented RIEs with counterfactu-als for CCA projects up to now Since there is limited evidence on global adaptation progress to date RIEs have the capacity to redress the situation and gen-erate learning This is because they are conducted according to scientific quality standards that
i ensure the correctness of measurement findings (reliability)
ii exclude as far as possible alternative causes for an observed finding (internal validity) and
iii shift findings from an observed sample to a larger population (external validity)
No lsquoone size fits allrsquo RIE design
The numerous (methodological) challenges faced by CCA projects have led to intensive discussion among experts on how to adequately monitor and evaluate them The main challenges are
1 the lack of a conceptual agreement on definitions including what actually constitutes successful adaptation and therefore
2 the non-existence of a universal indicator (unlike for mitigation)
3 changes in the climatic context during a projectrsquos lifetime and the related problem of shifting base-lines
4 uncertainty about actual climate change patterns and their effects and
5 the long-time horizon of potential climate change impacts (see 22 for more details)
Individually none of these challenges are unique to CCA they also exist in projects in other sectors Together though they represent a fundamental difficulty for practitioners in terms of monitoring and evaluating project impacts Since adaptation projects vary widely in their scope and in the sec-tors they cover there is no such thing as a lsquoone size fits allrsquo evaluation design Whether and which RIE design(s) are to be used depends on various factors such as the level (micro meso or macro) at which the project generates an impact the availability of data and the time and resources available to the project For example at the systemic (macro) level a climate policy that is still at an early stage of implementation and project activities that have so far mainly focused on consultations and capacity building exercises may not be appropriate for a counterfactual assessment Nonetheless most CCA projects follow a multi-level approach which implies that a combination of two or more evaluation approaches may be required to measure the total impact of a project or programme
The selection of evaluation designs presented in this Guidebook is based on two considerations Firstly the design needs to comply with scientific standards in order to produce robust findings Secondly the selected designs should cover a wide range of differ-ent project approaches and all possible impact levels In particular six types of designs are discussed in detail
y experimental and quasi-experimental designs y matching techniques
Executive Summ
ary
8
y pipeline approach y regression discontinuity design (RDD) y time-series designs and y structural equation modelling (SEM)
Which evaluation design to choose ndash creating evidence at the individual level
At the individual level if a baseline is available (ex-ante and ex-post data from both the treatment and control group) three evaluation designs can be con-sidered for evaluating the CCA project an experi-mental quasi-experimental or regression disconti-nuity design
In an experimental design also known as a ran-domised controlled trial (RCT) a treatment and control group are compared with each other at two points in time ndash before and after the intervention ndash in order to estimate the counterfactual (what would have happened in the absence of the intervention) To be classified as an lsquoexperimentalrsquo design the ben-eficiaries need to be randomly selected during the planning phase of a project ie each person has the same chance of being a member of either the control or the treatment group If a random selection cannot be realised (eg due to self-selection bias or conscious selection) then such a design is called quasi-experi-mental In that case the group without treatment is called a lsquocomparison grouprsquo This means that some kind of matching technique needs to be applied dur-ing data analysis in order to control for selection bias
Thus both experimental and quasi-experimental designs are applicable to CCA projects as long as pro-ject activities aim at creating a direct impact at indi-vidual (micro) level The use of an experimental or quasi-experimental design calls for technical logis-tical and financial resources that mainly depend on the size and accessibility of the target group The data
selection process is often quite costly since a large team of enumerators is required Moreover there are two potential biases that may emerge and ham-per the process of attributing the observed change to project activities spill-over and contagion effects The former implies that the controlcomparison group indirectly receives a benefit from the project or programme and the latter occurs when differ-ent factors (eg projects operated by different agen-cies) affect the situation of the target population Nonetheless in terms of study design RCTs show the highest internal validity 2 and enable the clear attribution of interventions to impacts (the latter is also true of the quasi-experimental and pipeline approach) Regression discontinuity design (RDD) is a quasi-experimental evaluation method that can be applied if beneficiaries of the project are selected based on a special characteristic (eg income) of rel-evance to the desired impact that distinguishes them from the non-beneficiaries At the same time ben-eficiaries are compared with the comparison group in a number of other respects (eg location) Being a quasi-experimental design RDD does not require randomisation
If no baseline data have been collected beforehand two further evaluation designs can be considered at the individual level the pipeline approach and the panel design
The application of a pipeline approach is possible if a project is implemented sequentially (eg in dif-ferent regions) Thereby the selection of the target population that is not yet affected can serve as a quasi-comparison group for the group that is already affected It is important though that the treated groups of each phase are comparable Each data col-lection phase is just as labour-intensive and time-consuming as a quasi-experimental approach Panel designs a type of time-series design are in principle applicable for measuring impacts on all levels but require comparably larger sample sizes in order to be able to perform the necessary statistical calculations The special characteristic that differentiates the panel design from all the others mentioned above is that it requires data to be collected from identical units (eg persons households) at each point in time This makes it prone to attrition effects (ie decreasing sample sizes) over time It should also be mentioned that a panel design only makes it possible to estimate the contribution made by an intervention to observed changes but not to attribute these changes unambiguously
2 Internal validity is defined as the extent to which the variation of a dependent variable can be explained by the variation of a specific independent variable ie the extent to which alternative explana-tions for the variation of the dependent variable can be excluded
Impa
ct E
valu
atio
n G
uide
book
for C
limat
e Ch
ange
Ada
ptat
ion
Proj
ects
Phot
o copy
GIZ
Ste
inbe
rg
9
Creating evidence at institutional and system level
If an intervention aims to generate an impact at the institutional and system levels two further evalua-tion designs can be taken into account time-series designs and structural equation modelling
Time-series designs can be of particular use when it is necessary to cover longer periods than those set by a project or programme This makes them highly suitable for CCA projects where changes or results may unfold at later stages If data were collected repeatedly over a longer time period during the pro-ject time-series designs might be the best option It should be borne in mind though that these designs require a large number of repeated observations (at least about 10) in order to be able to perform the necessary statistical analyses for providing robust findings Finally if none of the designs fit structural equation modelling (SEM) could be an option for providing meaningful evidence about the impact of a project or programme It may be applied to meas-ure large-scale policy-based programmes that aim to affect an entire sector country or region SEM makes it possible to measure the statistical relation-ship between several influencing factors (eg public investments project funding disaster resilience of a population) This can be used to estimate the contri-bution of each of these factors one of which may be an intervention It should be pointed out that SEM and time-series designs only serve to estimate the contribution made by an intervention to observed changes
Conclusion and reading recommendation
The overview of available evaluation designs shows that there are several options for measuring impacts each with different potentials and limitations as well as methodological and data requirements This Impact Evaluation Guidebook provides practitioners with guidance on selecting the appropriate approach for a particular CCA project based on its characteris-tics and the available resources It also contains refer-ences to
y definitions and conclusions (blue framed boxes) y CCA project characteristics (green framed boxes) y practical tools and instruments (purple framed
boxes) y further reading material (orange framed boxes)
and y checklists summarising key issues (red framed
boxes)
Depending on the readerrsquos objective the different sections of the Guidebook may be of more or less interest However in order to obtain a comprehen-sive understanding of the subject matter we strongly recommended that you go through the lsquomust readsrsquo Section 12 which provides practical guidance for the planning and implementation of an RIE the summary at the end of Section 3 that contains an overview of the pros and cons of the different evalu-ation designs and leads you through the process of deciding which design to choose and Section 32 that focuses on the requirements for collecting large-scale quantitative data Once a particular evaluation design has been chosen the reader may consult the respective section that describes the chosen design in more detail (Sections 311 to 316) and as the case may be the further explanations in the annex If any of the technical terms or concepts are unclear the reader can consult the glossary MampE specialists who are not so familiar with the characteristics of CCA projects are advised to consult Section 2 in particu-lar Section 21 which discusses the key challenges of CCA projects with regard to their evaluation Finally the case study of an adaptation project in Bangladesh illustrates the application of this Guidebook
Phot
o copy
GIZ
Ran
ak M
artin
Executive Summ
ary
Impa
ct E
valu
atio
n G
uide
book
for C
limat
e Ch
ange
Ada
ptat
ion
Proj
ects
10
Are you planning to provide meaningful evidence of the impact of your climate change adaptation (CCA) project based on a sound empirical foundation Do you want to find out what difference it makes what changes can be observed in the field of inter-vention and how these changes are related to the project activities Or do you aim to gain knowledge about the inherent cause-and-effect relationships of a project learn from the past for the future fur-ther develop the project design or be accountable for the use of funds The decision about how to evalu-ate a project depends on a number of aspects such as the objectives of the evaluation its target groups and stakeholders or the available financial tech-nical human and time resources So the question lsquohowrsquo is closely related to several further aspects eg which design to implement which data collection instruments to apply or which analytical methods to choose
In this Guidebook we assume that you have decided to implement a rigorous impact evaluation (RIE) As the name says the focus of an RIE lies on the measurement and assessment of the impacts of a programme or project According to the OECDDAC evaluation criteria impact means any positive and negative primary and secondary long-term effect produced by an intervention directly or indirectly intended or unintended (OECDDAC 2006 6) Thus basically any observable change occurring in ndash and potentially beyond ndash a field of intervention presum-ably related to the evaluated programme or project may be subject to an RIE Another main characteris-tic of an RIE is that it aims to clearly attribute these observable changes to the intervention being exam-ined or at least to provide sufficient evidence to esti-mate the contribution the intervention has made to these changes Finally the term lsquorigorousrsquo implies that the measurement and attribution or contri-bution analysis is conducted in line with scientific quality standards This means that the findings of an RIE must meet the methodological demands that
apply to scientific research projects (ie that they should be reliable internally and externally valid and objective 3 These requirements ndash the rigorous measurement of impacts and attributioncontribu-tion analysis ndash determine the options for choosing a specific design or specific instruments and methods
As in every scientific research project the selection of the design further depends on the characteristics of the research subject With regard to impact evalu-ation the main characteristic to be considered is lsquowhat kind of impactrsquo needs to be evaluated While impact can be differentiated according to various category schemes (eg social political environmen-tal impacts) the most decisive aspect in terms of evaluation design is the lsquoaggregation levelrsquo at which it occurs This applies to climate change adaptation just as to any other field of intervention A distinction is usually made between three aggregation levels
y Individual (micro-level) impacts ie benefits or drawbacks for particular target groups (eg improving the resilience of a population to cli-mate change effects)
y Institutional (meso-level) impacts ie chang-ing the resources capacities performance etc of organisations such as enterprises governmental or non-governmental institutions (eg strength-ening the capacities of local authorities to deal with the socio-economic consequences of cli-mate change)
y Systemic (macro-level) impacts ie sectoral or regional developments (eg increasing the efforts of a government to reduce climate change-related causes of poverty or ill health)
The different accessibility of data at these levels implies that there is no lsquoone size fits allrsquo design For example while comparative analysis such as is applied in a quasi-experimental design (cf Sec-tion 311) may be suitable for measuring and assess-ing the livelihoods of climate migrants in a specified intervention area the influence on the capacities of basic urban service providers may call for the use of a structural equation modelling approach (cf Section 316) In the latter case there are many competing influences which makes it impossible to establish a comparison group (see Section 4 for an in-depth
3 Reliability internal and external validity and objectivity are count-ed among the most essential scientific quality criteria In empirical studies reliability indicates the correctness of measurement findings Internal validity means that the study design excludes alternative causes for an observed effect as far as possible while external validity means that the findings are in principle transfer-able from an observed sample to a greater population ie can be generalised Finally objectivity describes the independence of the measurement findings from their framework conditions (ie who collects the data who analyses them and under which conditions the findings are interpreted)
1 Introduction
11
discussion of this example) Given the complexity of climate change adaptation needs many CCA projects follow a multi-level approach Thus in an evalua-tion it may be necessary to combine several designs in order to assess the total effectiveness of such a project The Guidebook therefore aims to provide an operationally viable framework for evaluating CCA projects
According to this objective the structure of the Guidebook reflects the points to be considered when planning an RIE starting with a general overview of how to plan such an exercise (Section 12) This is fol-lowed by a discussion of the types and key features of CCA projects the typical challenges in the field of CCA and the way they are currently evaluated (Section 2) Section 3 presents the different options for rigorously evaluating CCA projects including references to the CCA-specific requirements and challenges outlined above The methodological pre-requisites for generating reliable empirical data on a large scale are also discussed Finally two exemplary evaluation designs are outlined on the basis of a GIZ case study (Section 4) including a brief presentation of their practical implementation The Guidebook closes with an annex containing further introduc-tions to some methodological aspects that need to be considered when designing an RIE a glossary of technical terms and further literature references
11 How to use the Guidebook
As the Guidebook aims to provide lsquohands-onrsquo infor-mation it contains a number of hints definitions practical examples links to further reading material and checklists which are highlighted as follows
Definitions and conclusions are presented in blue boxes followed by an exclamation mark
References to CCA projects are presented in green text boxes marked with a magnifying glass
Practical tools and exemplary instruments are presented in purple boxes flanked by two cogwheels
References and links to further reading material are presented in orange boxes highlighted with an open book
Checklists summarising key practical issues and recommendations for providing high- quality evaluation findings are presented in red boxes marked with a tick
Depending on the readerrsquos objective the different sections of the Guidebook may be of more or less interest However in order to obtain a comprehen-sive understanding of the subject matter we strongly recommend you to go through the lsquomust readsrsquo Section 12 which provides practical guidance for the planning and implementation of an RIE the summary at the end of Section 3 that contains an overview of the pros and cons of the different evalu-ation designs and leads you through the process of deciding which design to choose and Section 32 that focuses on the requirements for collecting large-scale quantitative data Once a particular evaluation design has been chosen the reader may consult the respective section that describes the chosen design in more detail (Sections 311 to 316) Some methodo-logical concepts discussed in these sections require some more methodological background and are therefore further explained in Annexes 52 to 56 If any of the technical terms or concepts are unclear the reader can consult the glossary MampE or evalua-tion specialists who are not so familiar with the char-acteristics of CCA projects are advised to consult Sec-tion 2 in particular Section 21 which discusses the key challenges of CCA projects with regard to their evaluation Finally the case study of an adaptation project in Bangladesh illustrates the application of this Guidebook
12 How to plan and implement an RIE for CCA projects
Letrsquos say you have decided to rigorously evaluate a CCA project How can this be done
First of all when planning such an endeavour you must realise that on the one hand an RIE needs to comply with scientific standards in order to produce valid and reliable empirical evidence of the impact of an intervention On the other hand you may face a number of obstacles such as time data and budget constraints (cf Bamberger 2004) which often make it difficult to adhere to such standards Planning any evaluation is therefore always a balancing act between fulfilling methodological demands as far as possible and keeping the evaluation feasible in practical terms To find the right lsquomiddle coursersquo it makes sense to begin the planning of an evaluation by answering a set of questions that determine its general framework
1 Introduction
Impa
ct E
valu
atio
n G
uide
book
for C
limat
e Ch
ange
Ada
ptat
ion
Proj
ects
12
Questions for determining the evaluation framework
` What is the object of the evaluation What is the scope of the evaluation in terms of observed period regions activities etc
` What are the objectives of the evaluation and which criteria will it use to assess the object of the evalua-tion
` Who are the recipients and who are the stakeholders of the evaluation ` What is the time frame of the evaluation When are the evaluation findings needed by ` Which human financial and organisational resources are available for the evaluation ` Who will implement the evaluation What qualifications and experience do the responsible persons have ` How will the evaluation be implemented What is the intended evaluation design Is it feasible with the
available resources ` Which data collection instruments and analysis methods will be applied Are the people in charge of data
collection and analysis familiar with these instruments and methods ` What tasks need to be performed during the evaluation and who will be in charge
As all of these aspects are interrelated it is crucial to answer these questions before actually start-ing to implement the evaluation For instance the scope and objectives depend on the stakeholders and recipients of an evaluation The design which determines the choice of instruments and meth-ods again depends on the available resources and qualifications and so on In view of these manifold interdependencies it makes a lot of sense to clarify document and communicate these issues among all involved stakeholders right from the outset Usu-ally when external consultants are commissioned to carry out an evaluation this is what should be out-lined in the terms of reference and agreed upon in the inception report if not before
When it comes to evaluating CCA projects some of these questions might be more difficult to answer than in other evaluations for instance the second question on the evaluation criteria Due to the lack of consensus about successful CCA (cf Section 22) it needs to be clarified right from the start what is understood by that concept in the specific context of
the project ideally in line with the project objectives Another important aspect which is not unique to the field of CCA however is the question of the sectoral expertise needed by the evaluation team Given the complexity of climate change-related issues a thor-ough understanding of the projectrsquos theory of change is a crucial prerequisite not only for data collection and analysis but also for integrating the findings into a larger (environmentaldevelopment-policy) framework particularly with regard to the projectrsquos contribution to overarching development goals (eg MDGs SDGs country development goals) Therefore it might be recommended to include a sector expert in the evaluation team who provides technical advice on assessing and interpreting the evaluation findings Finally to decide which evaluation design to choose the project characteristics need to be con-sidered (such as the uncertainty of the framework conditions in which it operates or the time frame within which its impacts can be observed) Section 3 of this Guidebook therefore provides several sugges-tions that take these and further characteristics into account
Phot
o copy
GIZ
Flo
rian
Kopp
13
Once these questions have been answered the first step of any evaluation is to develop a data collection plan (also called an evaluation matrix) structured according to the previously defined evaluation cri-teria A data collection plan is the reference docu-ment that guides the evaluation from instrument development to data analysis It provides a tabular
overview of the evaluation questions and hypotheses to be answeredtested the required indicators data sources and availability data collection instruments sampling procedures timing of the data collection data analysis methods responsibilities and required resources The following table gives an example of how such a data collection plan is usually structured
Table 1 Exemplary data collection plan
Analysis dimension
Hypothesis to be testedQuestion to be answered
Indicator Data source
Sample Data type Data collection instrument
Timing of data collection
Data analysis method
Respon-sible
Required resources
Direct outcomes
The livelihoods of climate migrants have improved
Proportion of climate migrants who have a job
Target group (climate migrants)
5 random sample of treat-ment and comparison group
Quantita-tive
Question-naire
Start of project end of project 3 years after end of project
t-test for inde-pendent samples
Evaluator no 1
1 working day (wd) for development of question-naire 2 wds for pre-testing 3 wds for implementing survey X euro for technical implementation
Income of respondent
Proportion of climate migrants who live in formal set-tlements
hellip hellip hellip hellip hellip hellip hellip hellip hellip
Working opportunities have been generated
No of working opportuni-ties
City corpo-rations
na Quantita-tive
Official statistics
Continuous monitoring
Time series analysis
Project officer
na
Types of working opportuni-ties
2 repre-sentatives of each involved city corpo-ration
Qualitative Interview with corporation representa-tives
Start of project then each 6 months update
Qualitative summary
Evaluator no 2
3 wds for conduct-ing interviews in each intervention area
Use of working oppor-tunities by target group
Target group
5 random sample of treatment group
Quantita-tive
Question-naire
End of project
Descriptive statistical analysis
Evaluator no 1
See above
Reasons for acceptance or non-acceptance of working opportuni-ties
Target group
3 groups of 6 to 10 persons in each interven-tion area
Qualitative Focus group discussion
End of project
Qualita-tive data analysis
Evaluator no 2
1 wd for conduct-ing FGD in each intervention area
hellip hellip hellip hellip hellip hellip hellip hellip
Access to health services has been improved
hellip hellip hellip hellip hellip hellip hellip hellip
hellip hellip hellip hellip hellip hellip hellip hellip hellip
hellip hellip hellip hellip hellip hellip hellip hellip hellip
Besides the construction of the indicators another important issue during the development of a data collection plan is the identification of the data sources If data is already available the question of whether they are sufficient for answering an evalu-ation question or whether additional data need to be gathered must be resolved If the available data are insufficient it needs to be decided which further data sources can be tapped and which instruments are applicable There are a number of factors to be
taken into account when deciding for or against a certain instrument including the costs incurred and the human resources and time required to complete the data collection For this it is necessary to draw up a plan of staff time and a finance which also shows who will be carrying out the respective tasks at what times and what costs will be involved The following flow chart summarises the typical sequence of an evaluation
1 Introduction
Impa
ct E
valu
atio
n G
uide
book
for C
limat
e Ch
ange
Ada
ptat
ion
Proj
ects
14
Figure 1 Flow chart for implementing an RIE
Clarication of objectives stakeholders and recipient(s) of the evaluation
Development of a data collection plan Formulation of evaluation questions
and hypotheses Development of indicators Identication of necessary data
sources
Development of survey design and data collection instruments
Data collection and quality check
Data complete
Data aggregation and analysis
Reporting Interpretation of ndings Development of conclusions
and recommendations
Data available
Yes
No
Yes
No
stakeholders need to be clarified A good starting point for considerations of this nature is provided by the feasibility standards established by the American Evaluation Association (AEA) which are intended to ensure lsquothat an evaluation is planned and conducted in a realistic prudent diplomatic and frugal wayrsquo 4
4 Cf httpwwwevalorgpcmldfid=103
During any evaluation a number of precautions need to be taken to ensure that the evaluation find-ings are not only valid and reliable but also well-understood and widely accepted Therefore all involved stakeholders should be informed that an evaluation is being conducted and why Further-more the roles and responsibilities of the different
Feasibility standards of the American Evaluation Association (AEA)
` F2 ndash Practical Procedures Evaluation procedures should be practical and responsive to the way the pro-gram operates Refers to the problem of the feasibility of scientifically ideal collection procedures with regard to the costs they incur and to ethical implications
` F3 ndash Contextual Viability Evaluations should recognize monitor and balance the cultural and political interests and needs of individuals and groups Points out the significance of taking into account the interests of all the stakeholders in a balanced way This is important since the use of the evaluation findings depends to a high degree on acceptance by the various stakeholders and because access to the relevant information often depends on peoplersquos willingness to cooperate
` F3 ndash Resource Use Evaluations should use resources effectively and efficiently Points to the necessity of taking into account the cost-benefit ratio in the implementation of evalua-tions In calculating the costs it is important to consider not only the consumption of tangible (financial) resources but also the intangible outlay (eg the use of time and deployment of human resources) though this can mostly be converted back into financial costs More difficult by far is the quantification of the ben-efit since it is not possible to provide any specific information about the expected findings in advance
15
When evaluating CCA projects it is especially impor-tant to consider the question of contextual viability as interventions may not always generate directly tangible benefits for the target groups All the more important then is to highlight the long-term objec-tives of a project when approaching the target groups for data collection Furthermore due to the usually large number of different stakeholder groups in CCA projects it may be necessary to start by iden-tifying the different needs capacities objectives and strategies of the different groups as well as their interrelations before collecting data For instance when a project focuses on adaptation to diminish-ing natural resources it is necessary to include not only the project beneficiaries but all groups who in principle depend on these resources or have a right to use them Ignoring the often complex actor con-stellations could lead not only to considerably biased evaluation findings (eg overestimation of impact) but also to the refusal of stakeholders to provide important information
Besides these formal aspects a number of further organisational issues need to be taken into account during the evaluation process such as the confi-dentiality of data Given the need to maintain the anonymity of those who provide the information certain rules must be adhered to when providing feedback on the evaluation findings Apart from the fact that there is a moral obligation to the lsquoinform-antsrsquo (ie interviewees participants in written sur-veys etc) not to abuse their willingness to cooperate a number of statutory provisions also exist
Regardless of how well an evaluation is planned and organised unforeseeable events can have nega-tive effects on its scheduling and findings The most common obstacles that must be anticipated when conducting the evaluation include the refusal of the informants to cooperate (refusal to be interviewed etc) and the occurrence of negative unintended effects in data collection (eg a rapidly deteriorat-ing work climate due to the respondents not having been given sufficient information about the evalu-ation) It is advisable in all cases to seek an oppor-tunity to talk to those concerned and if appropriate to arrange a meeting at which everyone is given the opportunity to present their point of view and work together to find solutions for instance through alter-native survey instruments or questionnaires In this situation it is of key importance that the evaluators are able to give a credible impression of their inde-pendence and neutrality
A potentially controversial question is whether or not recommendations should be included in the report and if so how they should be presented If it is decided when clarifying the assignment that recom-mendations will be made it is necessary to point out that they are intended as aids to orientation In other words it must be made clear what the evaluation can achieve and what it cannot in order to avoid unrea-sonable expectations This is even more true of the evaluation of CCA projects as due to the uncertainty of future climate developments a recommendation given at one point in time can prove to be wrong a few years later Therefore it is even more important to develop such recommendations together with the stakeholders and probably further climate experts in a participatory manner eg in the context of a work-shop Furthermore it may also be necessary to clarify the spatial and temporal validity of these recommen-dations and the assumptions under which they were made as regards the development of the framework conditions In any case it is necessary to differentiate between the evaluation findings and the conclusions and recommendations drawn from them
We recommend the following books and articles for further reading about practical evaluation requirements
Bamberger M Rugh J Church M Fort L Shoestring Evaluation Designing Impact Evaluations under Budget Time and Data Constraints American Journal of Evaluation 25(1) 2004 pp 5 ndash 37
Silvestrini S Organizational Aspects of Evalu-ations in Stockmann R (ed) A Practitioner Handbook on Evaluation Edward Elgar Cheltenham 2010
Stockmann R (ed) A Practitioner Handbook on Evaluation Edward Elgar Cheltenham 2010
1 Introduction
Impa
ct E
valu
atio
n G
uide
book
for C
limat
e Ch
ange
Ada
ptat
ion
Proj
ects
16
Phot
o copy
GIZ
Guy
2 Evaluating climate change adaptation projects
The first section of this chapter (21) provides an overview of the types and key features of CCA pro-ject interventions with regard to each level (micro meso macro) The second section (22) describes the challenges when it comes to evaluating CCA projects given their complexity Finally the third section (23) summarises currently used designs and data collec-tion methods to evaluate the results of CCA projects and shows their main shortcomings with regard to the quality of the evaluation findings
21 Types and key features of climate change adaptation projects
While most CCA projects follow a multi-level approach specific interventions (measures activi-ties) of such projects usually focus on a singular impact level be it on a particular target group such as climate migrants (individual level) local authori-ties (institutional level) or the legal and policy frame-work (system level) It is also important to under-stand that all three impact levels are interconnected For instance legal or policy changes (system level)
will necessarily have effects on the institutional level (eg local authorities companies) and the individual level (eg residents of a country or region) The indi-vidual benefits perceived by a specific target group (eg households in an intervention area) may even-tually be scaled up to the institutional and system level (eg through spill-over or other dissemination effects) The reason why it is important to make this distinction though is that the choice of the appro-priate evaluation design depends on the targeted impact level
211 Adaptation projects addressing the individual level
A particular type of adaptation intervention pri-marily affecting the individual level is the so-called community-based adaptation (CBA) approach which is often facilitated by a local organisation and can be implemented like a small-scale development project The primary objective of such an interven-tion is to improve the capacity of local communities to adapt to climate change applying an integrated approach that often combines traditional knowl-edge with innovative strategies Capacity building and awareness-raising are essential elements of such interventions In fact UNDP has found that com-munities and even policy-makers in target countries have limited knowledge of climate change issues especially of adaptation (UNDP 2009) Thus in order to be able to participate effectively locals must be supported to develop a good understanding of these issues which is why a lot of investments are being made in capacity building However working with communities can be a process that requires consider-able time financial resources and energy But it pays off because community engagement generates own-ership (at best) and enables empowerment giving communities a voice and the chance to participate Although CBA projects are situated at local level development cooperation aims to promote action at all levels to achieve systemic and sustainable change Relevant sectors for adaptation include rural devel-
17
Phot
o copy
GIZ
And
reas
K
opment agriculture water resources management coastal management disaster risk management and public health Typical practices address adjust-ments in the behaviour of individual groups as well as in the use and development of technologies (eg construction of large reservoirs adjustments to tra-ditional farming practices and risk reduction for the rural population)
The Community-Based Wetland Management Project (BIRAM) (UNDP 2015a) implemented by Boudhi Investigate and Research Assembly of Men supported by UNDP with funding from the Least Developed Country Fund the Government of Bang-ladesh and the UK Department for International Development is an example of a project that focuses on the micro level in five villages in Bangladesh (community level) The indigenous peoples living in the project areas are confronted with declining rain-fall rising temperatures and decreased water levels due to climate change A nearby stream is the main source of irrigation and fish farming Climate change forecasts predict that temperatures will continue to rise generating aridity in the target regions which will have negative consequences on ecosystems and livelihoods The project focuses on promoting sus-tainable crop varieties improved agricultural prac-tices and improved water collection Moreover it will train community members in alternative income-generating activities to reduce pressure on natural resources and diversify income sources 5
The Sustainable Agricultural Programme (PROAGRO I amp II) (GIZ 2015a) ndash a trilateral cooperation arrange-ment between Bolivia Germany and Sweden ndash is an example of a project that focuses on the individual level Its objectives are the following (1) to increase the resilience of smallholders in arid and semi-arid regions of Bolivia to climate change risks (2) to conserve and distribute scarce water resources as part of integrated watershed management and (3) to increase income from agricultural production A fourth component ndash ie adaptation to climate change ndash was integrated into PROAGRO II implemented by GIZ on behalf of BMZ A vulnerability assessment was conducted in 2013 following the approach of GIZrsquos lsquoVulnerability Sourcebookrsquo (Cordero 2014) The main climate risk is water scar-city which will probably increase in future and will have a negative impact on agricultural production The findings of the vulnerability assessment show that PROAGRO reduced the vulnerability of small-holder farmers by adjusting crop types and sowing dates and replacing old irrigation technologies with
5 More UNDP community-based adaptation projects can be found under the following link httpwwwundp-almorgprojectsspa-community-based-adaptation-project
more appropriate ones which enhanced water effi-ciency in the parcels (id) A mid-term evaluation was also conducted in 2013 using a mainly qualitative evaluation design (analysis of primary and secondary data semi-structured interviews and surveys with national counterparts strategic partners and target groups direct observation focus group discussions) (Kronik 2013)
212 Adaptation projects addressing the institutional level
Effective institutions are a major factor when it comes to the ability to respond to growing climate risks since they are designed to perform a set of functions related to decision-making and imple-mentation (Dixit et al 2011) They play a critical role in increasing societyrsquos capacity to adjust as condi-tions shift and as new climate change knowledge appears In a constantly changing climate the pro-cess of institutional change represents an impor-tant aspect of building adaptive capacities ie the ability of a national government and other entities and individuals to design and implement effective adaptation strategies or to react to negative climate stresses (Dixit et al 2011) Since national policy-makers international negotiators and funders assist in developing methods and guidelines for adapta-tion planning it is essential that they include a focus on building institutional capacity to adapt to cli-mate change impacts One of several ways in which climate-related challenges may require institutions to make significant adjustments involves meeting the needs of the most vulnerable people who tend to be poor or marginalised They usually have few resources with which to adapt and little say in public decision-making processes
Various CCA projects comprise interventions that aim at making an impact at institutional level One example is the National Adaptive Capacity (NAC) framework launched by the World Resources Insti-tute which assists governmental agencies in includ-
2 Evaluating clim
ate change adaptation projects
Impa
ct E
valu
atio
n G
uide
book
for C
limat
e Ch
ange
Ada
ptat
ion
Proj
ects
18
ing institutional capacity development in their adaptation planning processes It enables its users to systematically assess institutional strengths and weaknesses that may help or hinder adapta-tion National adaptation plans may then be better designed to make best use of strengths or remedy weaknesses (Dixit et al 2011) Another example is the Public Investment and Climate Change Adapta-tion (IPACC) project (GIZ 2015b) conducted by GIZ on behalf of BMUB in Peru The aim of the project is to raise awareness ndash among national and regional policy-makers and relevant technicians ndash of the potential environmental social and economic costs of climate change and to encourage decision-makers to consider climate-relevant criteria when formulat-ing and approving public investments Hence meth-ods were designed to integrate disaster risk man-agement and CCA considerations into a countryrsquos national investment planning to increase the adap-tive capacity and reduce climate-related risks (GIZ 2012) Next to initiatives in the policy field there are also CCA projects carried out by non-governmental organisations The DANIDA-funded project Capac-ity Strengthening in Least Developed Countries (LDCs) for Adaptation to Climate Change (CLACC) (IIED 2015) which is operated under the auspices of the International Institute for Environment and Development (IIED) strives to strengthen the capac-ity of civil society organisations in LDCs to adapt to climate change and foster adaptive capacity among the most vulnerable people This implies integrating adaptation to climate change into the work of NGOs and simultaneously setting up a system to share knowledge and experience among the adaptation community In this context IIED helped to establish the International Centre for Climate Change and Development (ICCCAD) in Bangladesh which pro-vides training on CCA and development for NGOs donors media government staff and the private sec-tor
213 Adaptation projects addressing the systemic level
CCA projects aiming to generate system-wide impacts often follow a top-down approach and com-prise interventions at global regional or national level Such interventions target policy changes (eg sectordevelopment strategies) changes in public opinion on a particular topic (eg climate change adaptation requirements) or changes in economic framework conditions (eg introduction of climate
change- adapted value chains 6) With regard to CCA projects two potential intervention types fall under this category country level and global or regional initiatives At the country level CCA projects provide policy advice to support the elaboration of national climate change strategies and action plans or to cre-ate awareness and facilitate consultation among (government) stakeholders The aim is to give con-sideration to climate change risks in laws planning policies and negotiations Such interventions also support the design of targeted policy strategies eg to climate-proof 7 the agricultural sector and intro-duce new crops cropping methods or efficient irri-gation technologies
An example of a CCA project that comprises such interventions at the federal level is the Climate Sup-port Programme (CSP) (GIZ 2015c) launched by GIZ on behalf of BMUB in South Africa in 2009 The projectrsquos aim is to assist the Department of Envi-ronmental Affairs (DEA) in reducing South Africarsquos carbon footprint mitigating climate change impacts and strengthening the countryrsquos resilience to climate change (GIZ 2013) The project supported the devel-opment and implementation of the Governmentrsquos white paper on the national climate policy 8 by pro-viding expertise contributing also to consensus-building among important stakeholders Section 12 of the white paper clearly mandates the develop-ment of an adaptation MampE system Moreover sector departments have started the process of reviewing their policies to align them with the white paper Additionally together with the BMZ-funded project lsquoEffective adaptation finance (MampE Adapt)rsquo GIZ is supporting the development and implementation of a monitoring and evaluation (MampE) system for adap-tation
6 See for instance the project lsquoPromoting a Value Chain Approach to Climate Change Adaptation in Agriculture in Ghanarsquo which aims to help reduce climate-induced risks and thereby contrib-ute to the achievement of food security and income-generating objectives for rural communities by focusing on the improvement and adaptation of the cassava value chain wwwthegeforggefsitesthegeforgfilesgef_prj_docsGEFProjectDocumentsCli-mate20ChangeGhana20-202843682920-20Promot-ing20Value20Chain20Approach20to20Adaptation20in20Ag1-17-20122020ID436820202020Ghana20SCCF20Full20Project20Document20for20Re-submis-sion2020Jan20201220cleanpdf
7 lsquoClimate-proofingrsquo is a methodological approach applied by GIZ that integrates climate change aspects into development plan-ning The reason for climate-proofing projects or programmes is the following even if GHG emissions are drastically re-duced climatic changes will still occur which will be fatal for some pop-ulations and ecosystems and will have negative con-sequences on the countryrsquos economy These climatic changes will gradually become more visible Consequently when de-signing a project it is of the utmost importance to consider climate change aspects especially if the project is supposed to run for a longer period of time (Hahn M 20102-6)
8 See White Paper of the National Climate Change Response Policy (published in 2011) httpravaqsensnetthemestheme_emissions111012nccr-whitepaperpdf
19
CCA projects with a global dimension include vari-ous international players who work together to achieve a common goal They mainly focus on con-ceptual work capacity building and knowledge exchange The institutions involved are responsible for the development of methods and tools for novel topics such as national adaptation plans (NAPs) and also for piloting these tools and methods in partner countries thereby cooperating with existing pro-jects within these countries In a best-case scenario the results and experiences of the CCA projects are shared with the CCA community to enable an exchange of knowledge and good practices through webinars workshops or online platforms 9 One example is the National Adaptation Plan Global Support Programme (NAP-GSP) (UNDP 2015b) for Least Developed Countries which is a UNDP-UNEP programme financed by the Least Developed Coun-try Fund (LDCF) and the Special Climate Change Fund managed by the Global Environment Facility (GEF) It helps LDCs 10 and developing economies to advance with their NAP 11 process through technical assistance provides tools and training to support the NAP process within the country and facilitates an exchange of lessons and knowledge through South-South and North-South cooperation The formula-tion and implementation of NAPs helps to identify the medium- and long-term adaptation needs of a technical institutional and financial nature and simultaneously develop and implement strategies and programmes to address these needs 12
22 Key challenges of climate change adaptation projects
CCA projects (including those with a partial focus on adaptation) pose specific methodological chal-lenges 13 which need to be taken into account throughout the whole project cycle These chal-
9 Examples of online platforms of this kind are wwwadaptation-communitynet wwwundp-almorg wwwadaptationlearning-mechanismcom wwwclimate-evalorg and wwwmediation-pro-jecteuplatform Europe-wide wwwclimate-adapteeaeuropaeu
10 26 LDCs have requested help with their NAP process11 The NAP process was initiated under the Cancun Adaptation
Framework (CAF)12 This paragraph is based on the information obtained on the
homepage (wwwundp-almorg)13 It must be mentioned however that the methodological chal-
lenges described below are by no means unique to CCA projects For instance most SWAPs have long time horizons (eg when re-forming a TVET system it may take several decades for benefits to become visible) uncertainty and shifting baselines are a problem in most fragile contexts and universal indicators (except maybe for education and economic development) are still lacking in most fields of intervention
lenges make it necessary to fine-tune development agenciesrsquo current MampE frameworks especially with regard to the development of indicators baselines milestones targets and the timing of MampE activities which need to be adjusted to the longer time horizon of the majority of adaptation initiatives These chal-lenges are outlined below
First of all the remaining ambiguity of the concepts used may impede the development of appropriate verifiable and measurable indicators There is no clear and commonly accepted definition of adapta-tion adaptive capacity and climate-resilient liveli-hoods which makes it difficult to define objective indicators There is also a lack of consensus about what actually constitutes successful adaptation Consequently there are no universal indicators for CCA projects since they depend not only on the individual project but also on the context scale sec-tor and location Unlike mitigation for which the amount of GHG emissions in the atmosphere serves as a universal MampE indicator the success of an adap-tation intervention cannot be measured by a single indicator Qualitative assessments are as important as quantitative ones since many aspects of adapta-tion are lsquosoftrsquo (eg institutional capacity behaviour change etc)
The establishment of a baseline is considered another major challenge for evaluating climate change adaptation projects A baseline is crucial to measure the projectrsquos impact as it provides a refer-ence point against which a change can actually be measured In climate change adaptation projects future climate change effects also need to be taken into account (ie a baseline projection of how the climate is going to evolve during the project term and beyond) Since climate change is most likely to unfold differently than assumed in the projection experts speak of a lsquoshifted baselinersquo Shifting baselines are considered to be problematic in terms of plan-ning since they change the context of the adaptation intervention
Thus uncertainty about actual climate change pat-terns and their effects is another aspect that needs to be addressed It may be impossible to anticipate when for example the next flood will occur in order to analyse to what extent adaptation took place in situ compared to the situation before the interven-tion Moreover adaptation strategies marked as suc-cessful in the short term may have negative impacts on vulnerability in the long term
2 Evaluating clim
ate change adaptation projects
Impa
ct E
valu
atio
n G
uide
book
for C
limat
e Ch
ange
Ada
ptat
ion
Proj
ects
20
Finally the long time horizon of potential climate change impacts poses an additional challenge that needs to be considered when designing the MampE framework for CCA projects Long-term impacts are unlikely to result from the project alone Instead they are rather generated by a series of factors or other interventions in the specific area Complexity increases when trying to identify the short-term and long-term outcomes that can be attributed to a par-ticular intervention For example the choice of farm-ing practices in a sustainable agriculture project also reflects the thought given to current or future cli-mate change However it remains difficult to isolate and assess the individual adaptation components reflected by these choices
23 Review of current methods to evaluate the results of CCA projects
The projects reviewed are conducted in developing countries and emerging economies 14 For the pur-pose of this guidebook emphasis was placed on the methodology ie the analysis of currently used eval-uation designs (experimental quasi-experimental ex-post etc) the presentation of the main data col-lection methods used (focus group discussions inter-views surveys direct observation etc) and lastly whether a quantitative qualitative or mixed-method approach was used The findings are summarised in Annex 51
During the research process two problems became visible first little use is made of RIEs in CCA projects which relates to the second finding namely the diffi-culty of ascertaining which evaluation methodology was applied Often it was difficult to identify which design was used since there was no reference to it in the methodology section of the evaluation Due to this difficulty we checked for keywords in the evalu-ation papers (eg randomisation randomised con-trolled trials (RCTs) control or comparison group quasi- and experimental design counterfactual and so forth) Very often none of these keywords were found in the whole document which is why there is no reference to the evaluation design in the table in Annex 51
14 Three different research approaches were used for this study (a) a simple google search using the following keywords lsquoclimate change adaptation impact evaluation vulnerability vulnerability assessments monitoring and evaluation of climate change adaptation adaptive capacity and resiliencersquo (b) a review of the reference lists of the journal articles found in (a) and (c) the scan-ning of relevant evaluations carried out by development agencies international organisations or independent evaluation institutions
Prowse and Snilstveit came to a similar conclusion in their study Impact Evaluation and Interventions to Address Climate Change A Scoping Study 15 pub-lished in 2010 saying that just a few RIEs were con-ducted (using mainly a quasi-experimental design) Although Prowse and Snilstveit recognised the chal-lenging nature of CCA projects this does not impede the use of RIEs Especially with regard to the increas-ing financial resources made available for climate change mitigation and adaptation projects it is important to make use of RIEs because evidence of the effectiveness of spending is required
Challenges inherent to evaluations of CCA projects involve the poor quality of the baseline (if there is one at all) randomisation and the development of a sample size which is often not representative The possible spreading of benefits from target to non-target groups is another limitation often referred to (see example below) In general data triangulation ie using a combination of qualitative and quantita-tive indicators (mixed-method approach) is visible in almost all CCA projects 16 which can be seen as a sign of progress in this field Just to name one example the evaluation of the project lsquoChronic Vulnerability to Food Insecurityrsquo implemented by the World Food Programme triangulates data from qualitative and quantitative sources It uses qualitative data from focus group discussions with community mem-bers and key-informant interviews with commu-nity opinion leaders and quantitative data involv-ing about 3000 randomly sampled households (cf Annex 51)
Another interesting finding concerns the way inter-national organisations conduct evaluations These evaluations are aligned with the Paris Declaration on Aid Effectiveness basing the evaluation mainly on the assessment of effectiveness efficiency relevance impact and sustainability (the DAC criteria) There is often no reference to the applied methodology
To name an example consider the Pacific Integrated Water Resource Management (IWRM) project (UNDP 2015c) established in 2009 which aimed to improve water resource and wastewater management and increase water use efficiency in Pacific island coun-tries in order to balance overuse and conflicting uses of scarce freshwater resources The evaluation is based on the DAC criteria for evaluating develop-ment assistance but it does not explain which design
15 Impact Evaluation and Interventions to Address Climate Change A Scoping Study httpwwwtandfonlinecomdoipdf10108019439341003786729
16 Although CCA evaluations are sometimes based on desk reviews and qualitative indicators (eg stakeholder interviews focus group discussions direct observations etc) and often lack robust quantitative data (see for example project Ndeg 31 in the table in Annex 51)
21
was applied In the methodological part only the data collection instruments are outlined (ie desk review and analysis interviews site visits) The same is true of many other evaluations within the Evalu-ation Resource Centre 17 of UNDPrsquos Independent Evaluation Office 18
In general when screening evaluations conducted by international organisations (see for instance the database of IFAD and the Global Environment Facil-ity (GEF) it becomes obvious that they have not conducted many rigorous impact evaluations so far hence there is not much experience in this field Take the Independent Evaluation Office of IFAD for instance narrowing down the search to look only at impact evaluations there is just one evaluation that was conducted in Sri Lanka in 2013 (Dry Zone Livelihood Support and Partnership Programme (DZLISPP)) 19 Although it is the only impact evalua-tion there is a clear methodology behind it For the first time IFAD undertook extensive data collection and analysis including a qualitative survey (30 key-informant interviews with project staff and relevant government officials) 41 focus group discussions with beneficiaries and a quantitative survey of over 2560 households Due to an absence of baseline data (which is often the case in CCA projects) two strate-gies were applied (1) an attempt to reconstruct the baseline through recall methods and (2) the use of a quasi-experimental design that does not strictly require baseline data Further challenges experienced were sample selection bias due to targeting and the potential spreading of benefits from target to non-target groups
The Independent Evaluation Office of the GEF offers more than one impact evaluation but the overall number is modest Furthermore the few impact evaluations that have been conducted only concern climate change mitigation projects (there are none for CCA projects yet) However although the GEF has not yet implemented many impact evaluations it
17 Evaluation Resource Centre httpercundporgindexhtml18 Independent Evaluation Office httpwebundporgevaluation19 Dry Zone Livelihood Support and Partnership Programme
(DZLISPP) httpwwwifadorgevaluationpublic_htmleksystdocimpact2013srilankaindexhtm
is clear that they deal with this topic since there are many publications that emphasise the impact evalu-ation of climate change projects It will surely be only a matter of time until there is a spillover to CCA pro-jects too In 2014 the GEF Independent Evaluation Office together with a number of multilateral and bilateral organisations including GIZ hosted the Sec-ond International Conference on Evaluating Climate Change and Development which aimed to promote and develop methods and good practices for MampE of adaptation and mitigation 20 A book of conference proceedings will be published by Springer in 2016
To be fair it has to be stressed that many CCA pro-jects focused on policy development and capacity building exercises at institutional level for which RIEs may not be an adequate evaluation design The National Adaptation Plan Global Support Pro-gramme or the Climate Finance Readiness Pro-gramme are examples where RIEs might be compli-cated These are global CCA projects that focus on policy development capacity building at institu-tional level and making sure that the target country is ready (institution-wise) to receive the financial resources earmarked for CCA projects
It should also be mentioned that lsquolearningrsquo is in many cases not the focus of the evaluation Frequently evaluations focus rather on the question lsquoHave we done what we said we wouldrsquo (accountability) than on lsquoWhat happened and whyrsquo (learning) This is especially true of development organisations (exam-ples are outlined in the table in the annex) Addi-tionally while screening CCA projects carried out by development organisations it became clear that many projects are still ongoing This means that an evaluation still has to be completed At best this pub-lication may raise awareness among practitioners to consider RIEs for CCA projects in order to increase the use of this evaluation design gain relevant expe-rience and simultaneously obtain valuable findings that can be shared with the adaptation community
20 Presentations and videos from the conference can be accessed at httpswwwclimate-evalorgevents2014-conference
Phot
o copy
GIZ
Ran
ak M
artin
2 Evaluating clim
ate change adaptation projects
Impa
ct E
valu
atio
n G
uide
book
for C
limat
e Ch
ange
Ada
ptat
ion
Proj
ects
22
3 Rigorous evaluation designs and examples of applicability in climate change adaptation projects
Having discussed the types and key features of CCA projects and the way they are currently evaluated this section will now provide an overview of the strategies and prerequisites for evaluating the impact of such projects bearing in mind their characteris-tics The first section thus deals with the potentials and limitations of different research designs used for impact evaluations when it comes to their applica-tion in the field of climate change adaptation (31) Section 32 discusses the methodological require-ments for providing reliable data on a large scale with a particular focus on adequate survey sampling techniques
31 Overview of evaluation designs ndash potentials and limitations for climate change adaptation projects
Before going further into the topic as such the term lsquodesignrsquo should be briefly explained as it is occasion-ally used with different meanings and confused with other terms such as lsquomethodrsquo or lsquoinstrumentrsquo
Generally speaking a research design describes how a research question is intended to be answered Evaluation designs usually differ with regard to the points in time when data is collected the data sources and the way the data is analysed (eg by com-paring target group with comparison group data) Most common evaluation designs are ex-post facto designs and single-difference designs (ie before-and-after comparisons or group comparisons) How-ever as these designs are not suitable for evaluating impact ndash at least when used as the only means during an evaluation ndash they are not discussed further in this Guidebook Instead we shall go on to present alter-native and more sophisticated evaluation designs that can provide sufficient empirical evidence
about the attribution or at least contribution of an intervention to observed changes We will explain the types of projects to which they can be applied which time budget and data resources they require and how informative their findings are We will also assess how valid and reliable the evaluation findings are provided the design has been implemented cor-rectly
A research design describes how a research question is answered
The descriptions start with experimental and quasi-experimental designs (311) which are favoured by a number of evaluation experts (eg DufloGlen-nersterKremer 2008 see also literature list at the end of this section) and considered by some as the lsquogold standardrsquo for impact evaluation In 312 an alternative approach for estimating the impact of an intervention is discussed so-called propensity score matching which may be suitable when poten-tial beneficiaries cannot be randomly assigned to a treatment and comparison group The next sec-tion deals with the so-called pipeline approach (313) This approach is of particular use if a project is implemented sequentially but aims to support target groups that feature comparable characteris-tics Another approach that is useful when the treat-ment decision depends on the beneficiary present-ing a threshold level of a specific characteristic (eg income or age) called the regression discontinu-ity approach is discussed in Section 314 In Sec-tion 315 the potentials of time-series evaluation designs are discussed by means of the so-called panel analysis Time-series designs are of particular value for long-term projects and observation periods and when complementary statistical data is acces-sible The last design discussed in detail is suitable for projects that aim to make a difference at policy level (type I and II projects) as it can provide empiri-cal evidence about their contribution to changes in a complex environment taking external influences into account (316) The design is called structural equation modelling and comes from the field of econometric research where it is commonly used to identify causal linkages between social and eco-nomic phenomena such as education and health The section closes (317) with a tabular overview of the applicability of the evaluation designs discussed above their methodological and practical require-ments and the validity of their findings (if applied correctly) The purpose of this overview is to enable the reader to choose a particular design bearing in mind the adaptation-specific project characteris-tics and given the financial technical and logistical framework conditions
311 Experimental and quasi- experimental designs
The following section outlines the main characteris-tics potentials and limitations and methodological prerequisites for applying an experimental or quasi-experimental design during an evaluation We will also discuss the kind of CCA-related interventions to which such designs can be applied and which meth-odological skills and (financial human and time) resources are required
Generally speaking experimental and quasi-exper-imental designs (in the field of applied empirical social sciences) consist of a comparison of two groups at two points in time One group receives a certain treatment (intervention measure activity etc in the following named lsquotreatment grouprsquo) and the other does not A design is called experimental or more precisely a randomised controlled trial (RCT) if the members of each group are selected at random This means that (ex-ante) the probability of each indi-vidual being a member of the treatment group is the same 21 The group that has not received any treatment is then called a lsquocontrol grouprsquo If such a random selec-tion cannot be ensured (eg due to self-selection bias or conscious selection) then such a design is called quasi-experimental In that case the group without treatment is called a lsquocomparison grouprsquo 22 However in order to simplify matters we will consistently use the term lsquocomparison grouprsquo in the remainder of this document
Experimental designs require a randomised selection of participants for an intervention
The purpose of employing such a design is to allow for attributing observable changes in a given popu-lation to an intervention This is done by estimating the so-called counterfactual ie the hypothetical situation of that population without having received the treatment In other words we do so by answer-ing the question lsquoWhat would have happened if no intervention had taken placersquo While estimating the counterfactual is also the foundation for calculating the treatment effect in pre- and post-test analyses and
21 It has to be highlighted that the equal probability that individuals of a given basic population will receive a treatment needs to be considered at the project planning stage That means that an RCT can only be applied if the project design allows for a random selec-tion of the treatment group
22 The rationale behind this distinction is that a lsquonon-interventionrsquo group that has not been selected at random cannot by definition act as a lsquocontrolrsquo for any time-variant or invariant variables There-fore particularly in the social sciences the term lsquocomparison grouprsquo is frequently used in settings where the groups were not selected at random
comparative analyses these designs have consider-able weaknesses regarding their underlying assump-tions These weaknesses compromise the validity of their findings in many cases In a simple pre- and post-test design the measurement prior to the inter-vention is taken as the counterfactual assuming that the situation of the target group would have remained stable without the intervention However because there is usually a considerable time span between the measurements this assumption is not valid as it cannot be assured that no other external factor would have influenced the situation of the treatment group Comparative designs estimate the counterfactual by collecting ex-post data from both the treatment group and a group that has not taken part in or benefited from the intervention ie a com-parison group In this case one assumes that the situ-ations of the treatment group and the comparison group were identical before the intervention How-ever this assumption cannot be held true either due to the potential selection bias The selection bias may be based on the intervention design (eg focusing on the most needy persons) the individual characteris-tics of the participants (eg self-selection by voluntari-ness) or on practical issues such as a limited budget the accessibility of the treatment group or other logis-tical constraints
Experimental and quasi-experimental designs tackle the issue of intervening time factors and potential differences between target and comparison groups by combining both a pre- and post-test and a compara-tive design This means that data is collected from both the target group and the comparison group before and after the intervention The net effect of an intervention (ie net average treatment effect) is then calculated on the basis of the average difference in the observable changes between the treatment and the comparison group (also called double-difference or difference-in-difference approach see Annex 52 for a further introduction to the calculation of the net average treatment effect using this approach)
Phot
o copy
GIZ
Har
ald
Fran
zen
3 Rigorous evaluation designs and exam
ples of applicability in climate change adaptation projects
Impa
ct E
valu
atio
n G
uide
book
for C
limat
e Ch
ange
Ada
ptat
ion
Proj
ects
24
CCA-specific requirements and challenges
Experimental and quasi-experimental designs are applicable to CCA projects whenever project measures aim at generating a direct impact at individual level ie if a distinguishable target group (eg inhabitants of a particular disaster-prone area farmers in arid regions) receive a specific benefit (eg knowledge of how to seek shelter in case of emergency technical assistance to install drip-irrigation systems) In order to apply such a design it must also be possible to establish a treatment and control or comparison group While in some cases the division of a population into a treatment and controlcomparison group may not be appro-priate for ethical reasons (ie if the denial of support would lead to an immediate deadly peril eg medi-cation in an epidemic) in many other cases financial logistical or technical constraints inevitably lead to selecting a sub-group of a larger population that in principle shares the same needs
A further requirement for applying an experimental or quasi-experimental design is that it must be pos-sible to detect an impact within a manageable time frame While it holds true that it may take a long time for CCA project impacts to become visible ndash which is also the case for impacts in other fields such as edu-cation financial systems or private sector development ndash there may also be some ways to work around the relevant constraints Referring to the first example mentioned above for instance one would not have to wait until another disaster happens to see if the project participants are able to seek shelter faster than those who did not participate A simple observation with a stopwatch during a test alarm would probably do the trick as well Concerning the second example it may not be necessary to wait until the environmental framework conditions have deteriorated in another 20 years to see if the drip-irrigation systems lead to the desired impact Even without any (further) climate change one can measure the reduced water consump-tion and increased yield in comparison to conventional farming methods However in the latter case too a time-series design (cf Section 315) may be a viable alternative for identifying the long-term impact of the project particularly if a comparison group can be established
It must be mentioned though that experimental and quasi-experimental designs also feature a number of challenges which limit their applicability to some extent First of all such designs require considerable tech-nical logistical and thus financial resources As one can imagine the collection of data from a large num-ber of people (cf Section 32 for further considerations about required sample sizes) particularly if they are located in difficult-to-reach areas is costly and time-consuming Furthermore the necessity to collect this data also from people who did not receive any benefit may be difficult as they may be not as willing to con-tribute to such an analysis as those who did For example a farmer who did not receive any technical assis-tance may not be as willing to provide information about his yields In such cases a suitable project design (possibly a pipeline approach see Section 313) may increase the willingness to participate
Finally the findings of such designs are prone to a certain degree of bias such as spill-over and conta-gion effects A spill-over effect means that the controlcomparison group indirectly receives a benefit eg through copying or learning from the treatment group (eg if the trained habitants in the disaster-prone area tell others who were not trained how to behave or if farmers who did not receive any assistance adopt irrigation schemes because they recognise their comparative advantage) Contagion effects may occur if the project under investigation is not the only one to provide support in the target area ie if other DC agencies are active in the same field In that case it may be difficult to attribute the observable impact to the particu-lar intervention (eg if the farmer was able to increase his yield because of the technical support provided by GIZ or because of the micro-credit he received from the ADB) While spill-over effects usually lead to an underestimation of the treatment effect (ie as the controlcomparison group receives a benefit as well) contagion effects can lead to both the over- and underestimation of the treatment effect depending which group has been (more) contaminated by other support measures Thus in multi-donor settings contribution analyses such as those conducted as part of a structural equation modelling approach (cf Section 316) may be more promising
25
312 Matching techniques
In an experimental design comparing the differ-ences in the outcomes of the treatment and control group would be sufficient for calculating the net effect of an intervention However as treatment groups are rarely selected randomly often such a design cannot be implemented in practice To obtain valid evaluation findings all the same the induced selection bias described above needs to be compen-sated for Various approaches are available for this purpose among these matching techniques appear to be especially suitable in evaluation studies The basic idea of matching techniques is to establish for each member of a treatment group a sub-set of pos-sibly similar comparison group members in order to estimate the treatment effect by calculating mean group differences That means that the counterfac-tual situation of the treated person (ie what would have happened if this person had not participated in the project) is approximated through the assignment of similar persons who have not participated
Matching techniques aim to approximate the counterfactual by comparing the outcomes of individuals from the treatment and the compari-son group that have identical or at least similar characteristics
A common matching approach is to identify statisti-cal twins by comparing individual characteristics (ie dimensions) that are supposed to have an influence on the outcomes of an intervention For example if one suspects that the effectiveness of a training measure (eg teaching farmers how to grow drought-resistant crops) also depends on the age and gender of the beneficiary the treatment and comparison group can be clustered accordingly and the outcomes can be individually compared for each sub-sample The following table illustrates the principle of the matching approach using the mentioned example
For further reading about impact evaluation in general and the above-discussed methodological aspects the potentials and limitations of experimental and quasi-experimental designs and particularly their practical implementation the following books articles and papers are recommended
General methodological introduction
Bertrand M Duflo E Mullainathan S How Much Should We Trust Differences-in-Differ-ences Estimates Working Paper 01 ndash 34 MIT Cambridge 2001
Stern E Stame N Mayne J Forss K Davies R Befani B Broadening the range of designs and methods for impact evaluations Working Paper 38 DFID London 2012
White H Some Reflections on Current Debates in Impact Evaluation International Initiative for Impact Evaluation New Delhi 2009
Practical guidelines and examples
Chambers R Karlan D Ravallion M Rogers P Designing impact evaluation different per-spectives International Initiative for Impact Evaluation New Delhi 2009
Khandker SR Koolwal GB Samad HA Handbook on Impact Evaluation Quantita-tive Methods and Practices The World Bank Washington DC 2010
Leeuw F Vaessen J Impact Evaluations and Development NONIE Guidance on Impact Evaluation NONIE Washington DC 2009
Vaessen J Todd D Methodological challenges of evaluating the impact of the Global Envi-ronment Facilitys biodiversity program Evalu-ation and Program Planning 31 2008 pp 231 ndash 240
3 Rigorous evaluation designs and exam
ples of applicability in climate change adaptation projects
Impa
ct E
valu
atio
n G
uide
book
for C
limat
e Ch
ange
Ada
ptat
ion
Proj
ects
26
Table 2 Example table for matching on observables
Group Treatment group Comparison group
Gender Male Female Male Female
lt 40 years old
ge 40 years old
Annotation Each cellarrow colour indicates an individual comparison
As the table shows each sub-sample of the treatment group (eg men of the age of 40 and above) is com-pared with a sub-sample of the comparison group that has the same characteristics The problem with this so-called matching on observables approach is that the size of comparable sub-samples decreases as the number of relevant dimensions grows This again limits the possibility of conducting statistical tests (eg t-test for comparing mean values of independ-ent samples) that require a minimum cell count of approximately 30 cases in order to reach valid find-ings
Another matching technique that has gained atten-tion in the last years is called propensity score matching (PSM cf RosenbaumRubin 1985) The advantage of this technique is that in contrast to matching on observables it provides a one-dimen-sional score for comparison (the so-called propensity score) that indicates the probability of any individual being a member of the treatment group Since this approach is methodologically quite demanding and thus requires a strong theoretical background its application will not be discussed here in detail Instead a short introduction into PSM and further reading material can be found in Annex 53
CCA-specific requirements and challenges
When we look at how these matching techniques can be applied to CCA projects the same characteristics apply as mentioned in the preceding section because they are primarily used on an individual level While institutional or even spatial (regional city-wise) matching can also be found in evaluation practice the meth-odological foundations and practical experiences concerning the validity of the findings provided by such matching approaches are still rather limited Therefore it is not recommended to pursue such an approach lsquoaboversquo the individual level Regarding the variables that are used for matching in the context of CCA projects it may be possible to work with characteristics such as proximity to hazardous areas degree to which individuals are affected by climate change effects or affiliation to specific ethnic social or religious groups etc
The challenges presented by matching approaches include two issues in particular The necessity of a rela-tively larger sample in order to find sufficient matching partners and the question of which characteristics to choose for the matching While the first issue constitutes a technical problem that can be solved by allocat-ing sufficient resources the second is a theoretical one which requires comprehensive sectoral and regional expertise The analysis of matched data can lead to significantly different findings compared with unmatched data depending on which characteristics are considered relevant Therefore it is of the utmost importance to substantiate the selection of the matching variables based on sound theory The most important questions to be answered in that regard are
` Could the characteristic influence the effectivenessoutcome of the intervention for the individual ` Does the basic population comprise sufficient individuals with different characteristics ` Will it be possible to identify sufficient individuals in the target group with identical characteristics
We should also point out that matching may not prevent potential bias as described in 311 However it may be possible to perform matching using aspects such as lsquodegree to which individuals are affected by other inter-ventionsrsquo in order to at least reduce the risk of contagion effects
27
For further reading on the methodological aspects potentials and limitations of PSM as well as its practical implementation the following books articles and papers are recommended
General methodological literature about PSM
Becker S Ichino A (2002) Estimation of average treatment effects based on propensity scores The Stata Journal 2(4)358 ndash 377
Luellen JK Shadish WR amp Clark MH (2005) Propensity scores An introduction and experimental test Evaluation Review 29(6)530 ndash 558
Morgan SL amp Winship C (2007) Counterfactu-als and causal inference methods and prin-ciples for social research Cambridge NY Cambridge University Press
Guo S amp Fraser MW (2010) Propensity score analysis Statistical methods and applications Thousand Oaks Sage
Steiner PM Cook TD Shadish WR amp Clark MH (2010) The importance of covariate selection in controlling for selection bias in observational studies Psychological Methods 15(3)250 ndash 267
Practical guidelines and case-studies
Caliendo M amp Kopeinig S (2008) Some practical guidance for the implementation of propen-sity score matching Journal of Economic Sur-veys 22(1)31 ndash 72
Cook TD amp Steiner PM (2010) Case match-ing and the reduction of selection bias in quasi-experiments The relative importance of pretest measures of outcome of unreliable measurement and of mode of data analysis Psychological Methods 15(1)56 ndash 68
Diaz JJ amp Handa S (2006) An assessment of propensity score matching as a nonexperi-mental impact estimator Evidence from Mex-icorsquos PROGRESA program Journal of Human Resources 41(2)319 ndash 345
Gaus H Muumlller C E (2012) Evaluating free-choice climate education interventions apply-ing Propensity Score Matching Evaluation Review 35(6)673 ndash 722
313 Pipeline approach
Often projects are not implemented on a broad scale right from the beginning targeting the entire poten-tially relevant target group but sequentially This may be because of logistical or budgetary reasons In these cases a so-called pipeline approach can be of particular use The idea behind the approach is that the section of the target group that receives a treat-ment (ie benefits from or takes part in a project) at a later stage can be used to approximate the counter-factual situation of those who did receive the treat-ment at the time of data collection In other words the part of the target group that is not yet affected
serves as a quasi-comparison group for the already affected part of the group In principle the approach can be applied repeatedly during an intervention depending on the number of phases in which the treatment (ie measures activities etc) is provided
In a pipeline approach the part of the treatment group that has not yet received any treatment is used for comparison
Figure 2 illustrates the basic concept of the approach using a three-phase intervention design
3 Rigorous evaluation designs and exam
ples of applicability in climate change adaptation projects
Impa
ct E
valu
atio
n G
uide
book
for C
limat
e Ch
ange
Ada
ptat
ion
Proj
ects
28
Figure 2 Illustration of the pipeline approach
( )t0 t1 t2 t3Timeline
Project phase IIIGroup C
Project phase IIGroup B
Project phase IGroup A
Ex-antebaseline data collection Final data collection Ex-postfollow-up data collection
( )
( )
As the figure shows in a three-phase project a total of four data collections (t0 ndash t3) are necessary of which at least during two (t1 amp t2) data sets have to be collected from two groups (group A amp B t1 respectively group B amp C t2) The treatment effects would then be estimated as in an ordinary single-difference design whereby group B would represent the comparison group to group A and group C to group B Provided the total project duration suffices ex-postfollow-up data from groups A amp B could also be collected at t3 which would probably allow further conclusions to be drawn about the sustain-
ability of the achieved results Further data collec-tions are conceivable such as from group C at t0 and t1 in order to estimate spill-over effects from groups A and B or to control for external influences on outcome variables (eg contagion effects from other projects) In any case the approach is quite flex-ible as it can be modified according to the informa-tion needs It can even compensate for a lsquoforgottenrsquo baseline study to some extent provided the group characteristics are comparable and remain relatively stable over time ie when the influence of external factors is negligible
CCA-specific requirements and challenges
With regard to evaluating CCA projects the pipeline approach is applicable for interventions that are planned to be implemented in phases for instance in different areas andor institutions (eg development and implementation of environmental information systems for local authorities in different provinces) and that aim to generate impact at individual or institutional level Provided that this is the case as outlined above it is still possible to start collecting data after the project has started ie it is not necessary to have baseline data for the first project phase This may be a considerable benefit for all projects that follow a replication or scaling-up design with a preceding pilot phase in which the (technical logistical etc) feasi-bility of the measures is tested before they are rolled out in other areas
The pipeline approach might also be of particular value for CCA projects which are confronted with the problem of shifting baselines (cf 22) The pipeline approach makes it possible to trace developments by comparing the baselines for each group (provided the group characteristics are in principle comparable) It may also be an option for projects that aim at generating long-term impacts that might not be observable directly at the end of their implementation
When applying a pipeline design however it should be borne in mind that each data collection phase is just as labour-intensive and time-consuming as a quasi-experimental design given that data needs to be collected for both the treatment and a comparison (ie future treatment) group except for the first and last round The same quality criteria therefore apply
The references to literature on experimental and quasi-experimental designs at the end of Section
311 are also suitable for further reading on the pipe-line approach
29
314 Regression discontinuity design
The approach discussed in this section is of par-ticular use when project participantsbeneficiaries are consciously selected on the basis of one specific characteristic that distinguishes them from non-participantsbeneficiaries (eg income) though they are similar in a number of other respects (eg loca-tion income sources education) If the participationeligibility of an individual depends on the value of a particular indicator that is relevant to the outcome of an intervention the treatment effect can be esti-mated by the so-called regression discontinuity design (RDD) The basic idea behind the approach is to estimate the treatment effect by comparing the
pre- and post-treatment indicator values (scores) of only those individuals from the treatment and com-parison group that are most similar with regard to their pre-treatment outcome score ie that lie within a comparison range close to the threshold level Fig-ure 3 shows the sample selection for assessing the treatment effect
The regression discontinuity design can be applied if project participantsbeneficiaries are selected based on a special characteristic that distinguishes them from non-participantsben-eficiaries
Figure 3 Selection of individuals for comparison
Individuals
Pre-intervention outcome score
Threshold levelComparison range
Untreated individuals
Compared untreated individuals
Compared treated individuals
Treated individuals
It is mandatory to adhere to the threshold level throughout the selection process as otherwise the regression analysis would lead to less valid findings Furthermore it must be assured that the individu-als cannot influence the pre-intervention outcome score (eg by temporarily lowering their income in order to receive support) as this would also bias the findings
Once the sample has been identified the pre- and post-treatment outcome scores are used to cal-culate regression functions for each group If the
intervention had an effect on the treatment group the functions should show different values at the threshold level This difference can be interpreted as the local average treatment effect for individuals that are most similar ie whose outcome values lie very close to the threshold line The discontinuity of the regression functions of the treatment and com-parison group can also be visualised by a Cartesian coordinate system in which the X-axis represents the pre-treatment and the Y-axis the post-treatment outcome score Figure 4 shows how such a disconti-nuity may look
Figure 4 Outcome scores before and after intervention
Pre intervention outcome score
Post intervention
outcomescore
Threshold level
Comparison range
Non treated individuals
Compared non treated individuals
Compared treated individuals
Treated individuals
3 Rigorous evaluation designs and exam
ples of applicability in climate change adaptation projects
Impa
ct E
valu
atio
n G
uide
book
for C
limat
e Ch
ange
Ada
ptat
ion
Proj
ects
30
As the treatment effect estimated with the RDD is based on a comparison of most similar individuals it can be considered to be widely unbiased How-ever a disadvantage of the approach is that the effect may not be generalisable for the entire population because individuals become less comparable the further they are from the threshold level Another disadvantage is the fact that in comparison to other designs RDD only uses a small fraction of the entire population to estimate the treatment effect
Due to its relatively ambitious requirements and methodological reservations RDD has only played a minor role in impact evaluation studies so far Never-
theless it may be applicable particularly for policy-field evaluations with large and clearly defined treatment groups provided the above-mentioned methodological requirements can be met In some publications (KhanderKoolwalSamad 2010) the use of a regression discontinuity approach is also recommended in scenarios where a threshold level is spatially defined (ie a geographical national or administrative border) However such an applica-tion needs to be carefully reviewed as populations in different regions present unobserved covariates (eg cultural or religious background) that may limit their comparability
CCA-specific requirements and challenges
RDD can be of particular use for evaluating CCA projects that focus on creating an impact at individual level and are implemented under framework conditions that involve a high degree of uncertainty provided the projects comply with the methodological requirements outlined above The benefit lies in the compara-tively simple data collection setup and clear interpretability of the evaluation findings which are quite robust against bias at least for those individuals who are very similar
On the other hand it has to be added that the findings are only of limited external validity Furthermore as only very similar individuals are compared (at least with regard to the outcome variable that is of interest) the sample selection can be less efficient because only a smaller number of individuals (ie those who are very similar) can be used for comparison Another challenge which is not restricted to CCA projects though is that it requires the project to adhere to a defined threshold level not to lsquoshiftrsquo it or make exceptions which in practice often proves to be a problem It is also only suitable for interventions where the impact becomes vis-ible in a manageable time frame which is not often the case for CCA projects
Finally it should be added that besides the outlined basic RDD there are several further more sophisti-cated variations of the approach These include ran-dom assignment at the threshold level or with more than one threshold level (eg if the treatment group is split further in sub-groups that receive different kinds of support depending on their pre-treatment outcome score) which cannot be discussed here
Therefore the following books articles and papers are recommended for further reading about methodological and practical require-ments as well as further applications of the approach
Imbens GW amp Lemieux T Regression discontinuity designs A guide to practice Journal of Econometrics 142(2) 2007 pp 615 ndash 635
Khandker SR Koolwal GB Samad HA Handbook on Impact Evaluation Quantita-tive Methods and Practices The World Bank Washington DC 2010
315 Time-series designs
While most evaluations focus on a limited time frame defined by the duration of an intervention sometimes it may be necessary to cover a longer period eg when the effectiveness of a series of past support activities or the development of (politi-cal economic etc) framework conditions are to be reviewed In those cases time-series designs can be of particular use We should add that there is no sin-gle time-series design this is rather an umbrella term for a number of different approaches What they have in common is that they are based on repeat-edly collected data over a longer period Time-series designs can be distinguished by whether they make use of only descriptive or also inferential statistics if data from the same analytical units (eg individuals households organisations cities countries) is used or not and if the data is quantitatively or qualitatively analysed
Time-series designs are based on frequently repeated data collections and are of use for measuring long-term impacts and the develop-ment of framework conditions
31
While it is simple to analyse the development of individual indicators descriptively by means of a trend analysis the identification of causal relation-ships calls for more sophisticated approaches Such approaches are often based on regression analyses that make it possible to estimate the influence of sev-eral independent variables (eg resources contextual factors) on dependent variables (eg attitudes behav-iour well-being) We shall go on to discuss an exem-plary design that has been successfully applied in a number of impact evaluation studies the so-called panel analysis
A panel analysis is based on repeated data collec-tions from identical analytical units The data needs to be comparable with regard to their informa-tion content ie the data collection instruments of each survey have to contain identical question and answer categories Furthermore the data sets must
be assignable to each respondent throughout the observation period Panel analyses usually require datasets with a large number of analytical units in order to be able to draw conclusions from the panel sample that apply to a larger basic population (cf 331) If these requirements are met panel analyses make it possible to trace developments not only on average but also on an individual basis and thus to identify variations caused by individual differences (ie unobserved heterogeneity) In addition given a sufficient observation period panel analysis makes it easier to identify the chronological sequence of changes and thus develop hypotheses about causali-ties The treatment effect can be estimated on the basis of various models The two most common of these the so-called fixed-effects model (FEM) and the random-effects model (REM) are briefly out-lined in Annex 54
CCA-specific requirements and challenges
Time-series designs appear to be most suitable for CCA projects as they are in principle applicable at each impact level and are of particular benefit when it comes to measuring long-term impacts As they make it possible to control time-variant confounding factors they are likewise useful for dealing with uncertain framework conditions as well as with shifting baselines given a sufficiently large sample size andor number of repeated data collections Due to their flexibility they can be applied in projects that focus on the adapta-tion of particular target groups to changing (climate environmental) framework conditions on the improve-ment of institutional capacities to deal with climate change-rooted environmental social or economic prob-lems or on national regional or global developments such as adaptation strategies in response to particular climate challenges Thus time-series designs are in fact more common in policy studies than in project evalu-ations
The challenges associated with time-series designs lie not so much in their practical implementation or the required financial resources as in the expert knowledge needed to do the lsquomathsrsquo They also call for a strong sectoral background in order to develop the right cause-and-effect hypotheses and draw the right conclu-sions from the analysis findings Very few evaluation experts have the know-how to adequately draft and implement such a design The high theoretical and methodological demands are reflected in a multitude of disputes among experts concerning the credibility of research which is of course not helpful for clearly com-municating evaluation findings
For further reading on panel data analysis the following literature is recommended
Berrington A Smith WF Sturgis P An Overview of Methods for the Analysis of Panel Data NCRM Methods Review Papers NCRM007 ESRC National Centre for Research Methods Southampton 2006
Hsiao C Analysis of Panel Data Cambridge University Press Cambridge 2014
316 Structural equation modelling
While the approaches discussed in the sections before are suitable for project types that differenti-ate between a treatment and a comparison group we will now go on to present an approach that may be applied for evaluating large-scale policy-based programmes that aim to affect an entire (national regional or global) population or sector (eg envi-ronmental or education sector labour market) With the so-called structural equation modelling (SEM) approach it is therefore not possible to attribute an observed effect to a specific intervention but to esti-mate the statistical relationship between several fac-tors over time one of which may be an intervention
3 Rigorous evaluation designs and exam
ples of applicability in climate change adaptation projects
Impa
ct E
valu
atio
n G
uide
book
for C
limat
e Ch
ange
Ada
ptat
ion
Proj
ects
32
Structural equation models make it possible to estimate statistical relations between con-structs which are defined by empirical measur-able indicators
Basically SEM is a multivariate statistical approach for testing hypotheses (deductive approach) about causal relationships between two or more latent constructs Its special feature is that it makes it pos-sible to test multiple statistical relationships (which are assumed to be causal) at the same time and can thus be used in complex environments In this con-
text latent construct means that the causes and effects (eg health employability) cannot be meas-ured directly but only by a number of manifest (ie empirically measurable) indicators (for health eg blood counts weight for employability education level qualifications) In principle a structural equa-tion model consists of two model types measure-ment models and structural models Measurement models describe the relationship between a latent construct and its indicators structural models describe the connection between latent constructs The following figure illustrates the differentiation between the model types according to the graphical representation of the system model described above
Figure 5 Generic layout of a structural equation model
It is important to note that the indicators that opera-tionalise the constructs and the causal relationships between the constructs have to be specified and theoretically substantiated by the researcher That means that it needs to be defined in advance which is the independent (ie exogenous) and which is the dependent (ie endogenous) variable In other words
the direction of the dependency has to be defined by the researcher In the figure above constructs 1 and 2 are exogenous variables (ie causes) while construct 3 is an endogenous variable (ie effects) A practical example on how to implement a SEM is given in sec-tion 42
CCA-specific requirements and challenges
With regard to the application of SEM for evaluating CCA projects the requirements and challenges sum-marised in the previous section on time-series designs are widely transferable with the difference that SEM is mainly suitable for projects that aim to create an impact at institutional and system level (eg political strategies) The practical requirements relating to SEM are not so difficult though it does take comprehensive theoretical know-how to develop the model As mentioned above the validity of the models relies on the expert knowledge of the people who create them Thus the findings of SEM analysis are as right or wrong as the model they are based upon Here the particular danger lies in omitting a system-relevant construct (ie influential factor) or indicators that define such a construct which would cause substantially biased findings What aggravates the problem is that in contrast to the designs discussed above unfortunately no quality criteria are available for assessing the validity of an SEM model Nevertheless given sufficient expert knowl-edge SEM can be of great benefit for providing the lsquobigger picturersquo and thereby revealing the manifold causal linkages between social political economic and environmental developments in the long run
33
For further reading on the methodological aspects potentials and limitations of SEM as well as its practical implementation we recommend the following books articles and papers
Cassel C Hackl P Anders HW (2010) Robust-ness of partial least-squares method for estimat-ing latent variable quality structures Journal of Applied Statistics 26(4)435 ndash 446
Chin W Newsted PR (1999) Structural Equation Modeling Analysis with small Samples Using Partial Least Squares In Hoyle R (ed) Statistical Strategies for Small Sample Research Thousand Oaks Sage
Diamantopoulos A Riefler P Roth KP (2008) Advancing formative measurement models Jour-nal of Business Research 61(2008)1203 ndash 1218
Garthwite PH (1994) An Interpretation of Partial Least Squares Journal of the American Statistical Association 89(425)122 ndash 127
Haenlein M Kaplan AM (2004) A Beginnerrsquos Guide to Partial Least Squares Analysis Understanding Statistics 3(4)283 ndash 297
Temme D Kreis H Hildebrandt L (2006) PLS Path Modeling ndash A Software Review SFB 649 Discussion Paper 2006-084 Berlin Humbold-University
Tenenhaus M Vinzi VE Chatelin Y-M Lauro C (2004) PLS path modeling Computational Statistics amp Data Analysis 48(2005)159 ndash 205
317 Summary
The prior descriptions show that a number of evalu-ation designs of sufficient methodological rigour are available that can provide reliable empirical evidence about the impact of CCA projects This sec-tion gives advice on which design(s) to choose based on the respective project characteristics Here it is again important to note that the applicability of a design primarily depends on the aggregation level at which an impact is generated (cf Section 1) Accord-ingly since many CCA projects operate on more than one level a combination of two or more evalu-ation designs might be necessary in order to assess the total impact balance of a project This complies with the need to combine qualitative and quantita-tive methods and triangulate data methods and researcher perspectives
At the individual level the decision which design to choose depends firstly on the existence of baseline data As explained in the previous sections three designs namely experimental quasi-experimental and regression discontinuity designs require such data This necessarily means that these designs can only be applied if they were drafted during the planning of the project If this is the case the next question is whether or not the beneficiaries were selected at random If this condition is also fulfilled in principle an experimental design can be applied provided sufficient resources are available to do so As described in 311 RCTs are quite costly due to the laborious data collection process which usually calls for the assignment of a large team to collect data It should also be said though that an RCT provides the highest internal validity and allows for clear impact attribution
If the project design does not allow for a random assignment of the treatment group a regression discontinuity design may also be feasible How-ever such a design requires the treatment group to be selected based on a specific outcome variable of interest (eg proximity to a disaster-prone area) If this is not the case a quasi-experimental design may be a feasible alternative The time and budget requirements of these two designs are compara-ble with those of an experimental design with the constraint that RDD might require a larger sample in order to identify sufficient cases that are close enough to the lsquothreshold levelrsquo to be compared With regard to the validity of the findings and their informative value we should add that while RDD-based evaluation findings are restricted to groups that are quite similar findings obtained using a quasi-experimental design can almost approxi-mate those of an RCT if the samples are adequately matched (eg with propensity score matching)
In case no baseline data has been collected before-hand two further rigorous evaluation designs may be used the pipeline approach and the panel design Both designs have further requirements the pipeline approach requires that the project be implemented sequentially (eg in different regions with differ-ent target groups) and the panel design that a larger sample size be available to enable reliable estima-tion of the impact It should also be considered that while a pipeline approach enables the attribution of impacts to an intervention a Panel Design lsquoonlyrsquo allows the contribution of an intervention to an observed change
If none of the above prerequisites can be satisfied most likely only a so-called ex-post facto design
3 Rigorous evaluation designs and exam
ples of applicability in climate change adaptation projects
Impa
ct E
valu
atio
n G
uide
book
for C
limat
e Ch
ange
Ada
ptat
ion
Proj
ects
34
with or without (single) comparison with a non-intervention group or with reconstructed baseline data may be possible However such a design is not regarded as lsquorigorousrsquo as it cannot provide for an attribution or contribution analysis
Based on these selection criteria the following deci-sion tree can be used to identify the lsquorightrsquo evaluation design for interventions that aim to generate impact at individual level
Figure 6 Decision tree for selecting an evaluation design for measuring impacts at individual level
Baseline data available
Random assignment of treatment group
Sequential implementation of project
yes no
yes
RCTQuasi-
experimental design
yes no
Pipeline approach
Regression discontinuity
design
Treatment group assignment according to specic criterion
Ex-post facto design (no RIE)
yes no
Panel design
yes
Large sample size possible
no (matter)
no
If an intervention aims to generate an impact at institutional level four rigorous evaluation designs are suitable Three of them have been previously introduced pipeline approach panel design and structural equation modelling (SEM) A potentially suitable design not discussed before is a time-series cross-sectional approach (TSCS) As already dis-cussed the pipeline approach requires a sequential implementation of the project in order to be appli-cable leaving three for those that are not As also discussed a panel design can only be applied if the sample (here of institutions eg governmental or non-governmental organisations enterprises) is large enough for statistical calculations (approx 30) If the intervention only focuses on a few institu-tions but at least about 10 repeated observations are possible then a TSCS might be the design of choice (see annex 54) Finally if none of these conditions can be fulfilled SEM is the only lsquorigorousrsquo option to
provide meaningful evidence about the impact of an intervention operating at the institutional level although it should be added that SEM like panel and TSCS designs can only provide for the estimation of its contribution On the positive side we should note that the latter three designs can be implemented with considerably less resources provided that sta-tistical data of sufficient quality are available for quantitative analysis
With regard to interventions geared to the system level (eg SWAPs government advice) the same selection of designs is basically available except the pipeline approach (due to the lacking comparabil-ity of sectors or countries for instance) Therefore in the following figure a joint decision tree for both intervention levels summarises the available choices of RIE approaches for institutional and system-level interventions
Phot
o copy
GIZ
Ran
ak M
artin
35
Figure 7 Decision tree for selecting an evaluation design for measuring impacts at institutional and system level
Sequential implementation of project
yes
Time-series cross-sectional approach
(see annex 54)
Structural equation modeling
yes no (matter)
Pipeline approach
Large number of repeated data collections possible
Panel design
yes
Large sample size possible
no (matter)
no
Decision tree for measuring system-level outcomes
Finally in table 3 on the next page all suggested RIE designs are listed with brief summaries of the impact level they are suitable for the project characteris-tics that must be in place the data time and budget requirements the validity of the analysis findings and their informative value (ie if they enable attri-bution or contribution analysis)
32 Providing reliable large-scale data
As outlined above empirical data is the founda-tion of any evaluation ndash and more or less of applied social sciences in general whether they are collected during the research process (ie lsquoprimary datarsquo) or reanalysed on the basis of statistical or documentary data (ie lsquosecondary datarsquo) Moreover impact evalu-ations mostly require data collections on a large scale in order to provide empirical evidence about the changes that have occurred in an interventionrsquos sphere of activity Such data is usually collected by means of a survey Surveys are used when mostly quantitative data from a considerable number of people eg all or a significant share of the projectrsquos beneficiaries non-beneficiaries or more generally residents of a certain area or particular social strata needs to be analysed During the data analysis sta-tistical parameters such as average means shares or distribution measures (eg standard deviation quan-tiles) of a given population (ie descriptive statistics) are calculated Provided that the data is collected from a random sample of sufficient size (see further elaborations below) probabilities regarding the val-ues and distribution of certain parameters in a larger
population can also be estimated (ie inferential sta-tistics) In the following the methodological aspects to be considered when collecting quantitative data by means of a survey are discussed with particular focus on an appropriate sampling strategy
Surveys often deal with knowledge opinions atti-tudes beliefs behaviours plans backgrounds devel-opments or assessments of the respondents The primary survey tool for data collection is the ques-tionnaire With a questionnaire (in contrast to an interview guideline) all respondents are asked the same questions in the same order The information gathered by a survey is often used to identify varia-tions of these parameters between different points in time (ie in order to identify developments) or dif-ferences between groups (eg in order to attribute the outcomes to a certain intervention or to reveal sys-tematic differences due to group characteristics such as gender age etc) or both With a survey infor-mation is collected in a systematic structured and mostly standardised way Structuring the subject of a survey means that not all potentially available infor-mation is relevant but only data that help to describe andor assess a certain measure development or framework characteristic Standardisation means that the respondents can choose from a number of answer options and that these options are grouped according to a predefined categorical system This means that the data is statistically calculable and consequently survey findings are comparable Such a categorical system can be dichotomous nominal ordinal or metric Table 4 contains an example of each single-choice question
3 Rigorous evaluation designs and exam
ples of applicability in climate change adaptation projects
Impa
ct E
valu
atio
n G
uide
book
for C
limat
e Ch
ange
Ada
ptat
ion
Proj
ects
36
Table 3 Required project characteristics and data
Evaluation design
Impact level Required project characteristics
Data requirements Time and budget requirements
Validity of findings Explanatory power
Experimental (RCT)quasi-experimental
Micro (individual) level
z Distinguishable treatment group
z RCT requires random assignment to treatment and comparison group
z Ex-ante (baseline) and ex-post data from treatment and controlcomparison group
z Depending on the size and accessibility of the target group
z Data collection process often quite costly as a large team of enumerators is needed
z RCT has highest internal validity
z Internal validity of quasi-experimental design depends on selection bias
z External validitytransferability depends on comparability of framework conditions
z Enables impact attribution at target group level given a sufficient sample size
Propensity score matching
Micro level z Discriminable treatment group
z Individual characteristics relevant for the treatment effect (covariates) must be observable
z Ex-ante and ex-post data from treatment and comparison group
z Data collection must include covariates
z Increases the costs of quasi-experimental designs as usually larger samples are necessary in order to identify sufficient matches
z Comparison group sample must be considerably larger
z Internal validity depends on completeness of covariates
z External validitytransferability depends on comparability of framework conditions
z Same as above
z Application in quasi-experimental designs can contribute to improved quality of findings
Pipeline approach
Micro and meso (institutional level)
z Project needs to be implemented in phases
z Treatment groups of each phase must be comparable
z Ex-ante and ex-post data from each group
z In principle comparable to quasi-experimental designs whereby costs increase with every round of data collection
z Internal validity of quasi-experimental design depends on comparability of groups
z External validity depends on comparability of framework conditions
z Same as above
z Allows for identifying time-variant effects if applied according to quasi-experimental design
Regression Discontinuity Design
Micro level z Treatment group must be selected according to a specified criterion
z Sufficient number of comparable cases
z Larger sample size than for experimentalquasi-experimental
z Comparable with quasi-experimental design mostly depending on sample size
z Internal validity restricted to comparable cases
z Enables impact measurement for individuals who have similar characteristics
Time series All levels z Panel focusing on individuals households organisations
z TSCS focusing on sectors countries regions
z Panel large sample size few repeated data collections
z TSCS sample size irrelevant large number of repeated data collections
z Depending on data availability individual data collections can be implemented quite cost-efficient
z Costs increase with length of panel and sample size
z Panel validity depends on compliance of sample size with statistical requirements (cf 331)
z TSCS validity is restricted to sample
z Provides reliable assessments of the contribution of an intervention to an observed change
z Makes it possible to control time-variant influences
Structural Equation Modelling
Meso and macro (system) level
z Focusing on entire sectors countries regions
z Statistical andor empirical data for each model- relevant construct
z Depending on data availability can be implemented cost-efficiently if combined with statistical data
z Validity depends on model fit (ie to what extent the endogenous construct is explained by the model)
z Enables contribution assessment and time-variant and invariant influences
37
Table 4 Example of question types
Question type Question Answer options
Dichotomous question What is your gender male female
hellip with nominal scaled answer options Where do you come from area 1 area 2 area 3 other area ________________
hellip with ordinal scaled answer options How do you assess the development of your livelihood situation in the last year
Deteriorated considerably Deteriorated slightly Did not change at all Improved slightly Improved significantly
hellip with a metric scaled answer option What is your monthly income _____ euromonth
It has to be added that for ordinal-scaled answer options that reflect a rating (eg satisfaction quality) it is important to lsquobalancersquo the answer options mean-ing that an equal number of positive as negative answer options must be provided in order to avoid biased findings
Besides single-choice questions there are also multi-ple-choice questions for example
What are your income sources (multiple answers possible)
Farming Livestock Fishery Temporary work Other hellip None
When analysing multiple-choice question data it has to be taken into account that it might be necessary (eg for calculating average means) to transform the data into separate lsquodummy variablesrsquo with dichoto-mous scales for each answer option (ie yesno for farming hellip for livestock etc)
When a survey is conducted its objectives and the information required to meet these objectives need to be considered first For this it makes sense to ask the following questions
Questions for identifying the survey objectives
` Which indicators need to be measured ` Who will use the information and how
Which decisions are depending on the survey findings
` Are there any particular expectations about the survey findings When are the findings of the survey considered positive or negative Or what would be a good or a bad finding
` Which information can the respondents pro-vide How does this match the information needs
` Which factors could have a negative impact on data collection Do the respondents have and remember the necessary information Might they be reluctant to answer Do they have the (verbal cognitive) capacities to answer correctly
Selecting a survey approach
After having defined the surveyrsquos objectives and information needs the survey approach can be specified giving consideration to the available and required resources The required financial human and time resources mainly depend on the size of the population that has been defined (as the target or comparison group) its spatial distribution and the logistical framework conditions in the area where the survey is implemented Furthermore the length and complexity of the questionnaire considerably influences your resource demands In order to get a better idea of how much time is needed it may be helpful to prepare a list of the individual tasks and estimated time needed for each task such as clarify-ing the survey objectives and sampling approach designing and testing the questionnaire collecting managing and analysing the data and reportingcommunicating the survey findings The following table shows what such a to-do list might look like
Phot
o copy
GIZ
Ala
n W
alsc
h
3 Rigorous evaluation designs and exam
ples of applicability in climate change adaptation projects
Impa
ct E
valu
atio
n G
uide
book
for C
limat
e Ch
ange
Ada
ptat
ion
Proj
ects
38
Table 5 Exemplary to-do list for preparing a survey
Task When Who Requirements
Clarification of survey objective First two weeks in January Project staff Results framework sample selection
Development of draft question-naire
By 31 January Evaluator in coordination with project staff
Clarification of information needs development of survey items
Pre-test of questionnaire 1 to 10 February Evaluator together with enu-merator team
Logistical preparation informa-tion of target groups accessibil-ity of target groups
Finalisation of questionnaire By 15 February Evaluator Consolidated feedback from the pre-test
Implementation of survey 16 to 31 February Enumerators coordinated by evaluator
Logistical support by partner staff etc
Data entry 1 to 5 April Enumerators coordinated by evaluator
Availability of technical infra-structure (notebooks software etc)
Data quality check 6 April Evaluator Full data set
Data analysis 7 to 15 April Evaluator Quality-assured data set
Integration of survey findings into evaluation report
16 to 30 April Evaluator Data analysis findings
Presentation of findings 1 May Evaluator and project staff Technical infrastructure for presentation (notebook projec-tor etc)
On the basis of such a timetable the costs of the sur-vey can be estimated These usually comprise logisti-cal costs (eg for traveltransportation accommoda-tion per diems) expenses for survey materials and the remuneration of the survey team
Surveys are usually carried out face-to-face or elec-tronically mediated (eg by telephone email or a web-based application) Both face-to-face and elec-tronically mediated surveys can be self-administered (ie the respondent fills out the questionnaire) or assisted (ie the surveyor fills out the questionnaire or at least supports the respondent in doing so) As all options have their advantages and disadvantages aspects such as the complexity and comprehensibil-ity of the survey topics the skills and accessibility of the potential respondents and the available time budget and human resources need to be considered Particular attention has to be paid to the aspect of the confidentiality of the information and the ano-nymity of the respondent when personal data (eg age income health status) are collected Ensuring anonymity is often an issue when it is necessary to be able to trace responses to individuals such as in panel surveys (cf 315) or when third parties (eg project staff beneficiaries) are tasked with data collection In those cases it might be necessary to separate the personal data from the survey data and link the data sets using a list of identification codes which can only be accessed by the people who are tasked with analysing the data
Selecting a sample
Due to time and budget constraints it is often not feasible to conduct a full population survey ie col-lect data from every potentially relevant respondent (eg beneficiary project participant) In such a case it is necessary to collect a sample ie to select respond-ents from the population However the findings of a sample population might be different to those from a survey of the entire population These disparate findings are induced by the so-called selection bias (see also 311) which can be reduced by various sam-pling techniques The common objective of these techniques is to approximate the sample characteris-tics to the characteristics of the full population rele-vant for the survey (eg the share of male and female respondents or the share of respondents from rural and urban areas) Doing so is necessary in order to draw conclusions from the survey findings with ref-erence to that population bearing in mind certain statistical quality criteria as further outlined below
In order to draw such conclusions the size and dis-tribution of the population for which the sample should provide representative findings needs to be identified For instance if the survey is to be used to identify the impact of a certain intervention (eg nationwide information campaign) on the behaviour of target groups (eg farmers adopting a new farm-ing method) in different provinces then it needs to be determined who constitutes the basic population (ie all farmers of the country) and how it is distrib-uted among the provinces (eg number of farmers in each province)
39
Once the basic population has been identified two sampling strategies are available probability (ie randomised) and non-probability (ie non-ran-domised) sampling Probability sampling means that each individual of a given population has the same known non-zero probability of being included in the sample ie it is randomly selected Non-probabil-ity sampling means that the chance of being selected for the survey differs among the population (eg due to accessibility or ability to participate) In the latter case findings based on the sample may not be gen-eralised without giving further thought to how to establish representativeness 23 otherwise (see below)
Only probability sampling (ie random sam-pling) makes it possible to calculate statistical parameters that inform use of the true value of a parameter in a basic population
Probability sampling
If probability sampling is applied it is possible to draw statistically valid conclusions from the survey findings for a population bearing in mind three sta-tistical parameters the aspired margin of error the level of confidence and the degree of variability These criteria are briefly explained below
The margin of error (also called lsquosampling errorrsquo or lsquolevel of precisionrsquo) indicates the maximum differ-ence of the value of a certain characteristic between the sample and the population ie the range in which the true value of the population is estimated This difference or range is usually defined in per-centage points (eg 1 5 10) For instance if a 5 margin of error is defined and your sample shows that 50 of the respondents adopted a new farming method the actual proportion of the basic popula-tion who did so is somewhere between 45 and 55 This is subject to a certain level of confidence see next paragraph
The level of confidence expresses the probability with which the actual sample value lies within the before- mentioned margin of error It is based on the assumption that if a sample is repeatedly (ran-domly) drawn from a given population the average value of an observed characteristic in this sample approximates to the true value of this characteristic in this population Furthermore the sample values are distributed lsquonormallyrsquo around this true value (ie
23 It has to be added that lsquorepresentativenessrsquo is not a defined statistical term but rather colloquially used to signify that a sample has been composed according to the prevalence of particular characteristics of the basic population
their frequency distribution follows a specific so-called lsquoGaussianrsquo function see the following figure) In practice confidence levels of between 90 and 999 are usually chosen A confidence level of 95 for instance means that in 95 out of a 100 samples the sample value would lie within the margin of error as specified before In other words there is a 5 chance that the sample value will deviate from the true population value by more than the defined mar-gin of error
Figure 8 Distribution of sample mean values in relation to the true population mean value
True value of a certain characteristic of the basic population
Range of mean values in eg 95 of all samples
Finally the degree of variability refers to the het-erogeneity of the population with regard to an observed characteristic ie how this characteristic is distributed in the given population The more het-erogeneous the population the larger the sample size necessary to reach a certain level of precision In this context 50 is the highest degree of variability because it indicates that half of the population has a certain characteristic (eg has adopted a new farm-ing technique) while the other half does not Annex 56 contains an introduction on how to calculate the appropriate sample size bearing in mind the above- mentioned statistical parameters
Non-probability sampling
As probability sampling requires all respondents to be within reach during data collection regardless of the required resources it may not always be feasible to apply such a strategy In that case non-probability sampling may be applied which requires the iden-tification of characteristics of the basic population that are relevant for analysis in order to establish representativeness For instance if the survey is intended to enable conclusions about the extent to which the impact depends on age gender ethnic affiliation etc information needs to be gathered about the composition of these characteristics in the population We should mentioned that while with non-probability sampling it may be possible to
3 Rigorous evaluation designs and exam
ples of applicability in climate change adaptation projects
Impa
ct E
valu
atio
n G
uide
book
for C
limat
e Ch
ange
Ada
ptat
ion
Proj
ects
40
develop plausible assumptions about a population the quality of these assumptions cannot be tested statistically and thus rely solely on the expertise of the researcher For non-probability sampling three common techniques may help to approximate the sample composition to the composition of the basic population systematisation stratification and clus-tering
Non-probability sampling does not make it possible to calculate statistical parameters
The representativeness of a sample relies on the knowledge about the basic population
Systematisation is an option when sufficient data about the basic population is available so that in principle each potential respondent can be identi-fied Ideally a comprehensive list is available that is used to draw the sample according to a particular selection scheme based on the individual data Such a scheme can for instance be oriented towards a tar-geted sample size (eg every 10th person) on logis-tical considerations (eg one household from each street village etc) or a certain threshold level (eg only families with more than three children or below a certain income) Which scheme is applied basically depends on the intervention logic (eg activities aim-ing at the poor) and the intended type of representa-tiveness (eg equal spatial representation)
A particular way to receive more specific findings is to stratify a sample Stratification means that a predefined number of individuals from each ana-lytically relevant sub-group of a population (eg age groups residence areas gender) is included in the sample Here too data about the composition of the basic population is necessary at least on a global level The intention is usually to match the sample composition with the composition of the popula-tion ie ensure that the proportions of each sub-group in the sample and in the population are equal in order to achieve representativeness (ie propor-tional sampling) However it may also be necessary to draw a disproportional sample eg due to logisti-
cal or budget constraints (eg 100 households per region) If that is the case then the cases for each sub-group need to be weighted reciprocally during data analysis So if for example a certain group represents 20 of a basic population but has only a share of 10 in the sample its cases need to be weighted by the factor two during the analysis
Clustering a sample may be helpful if it can be assumed that the sub-groups of a population show a sufficient degree of intra-group homogeneity ie that the individuals in each sub-group are similar with regard to a certain research question and inter-group heterogeneity ie that the individuals of dif-ferent sub-groups differ considerably in that regard If for example a project focuses on both several urban and rural areas and differences of its effec-tiveness in these areas are to be analysed it might be sufficient to conduct a full-population survey in one urban and rural area instead of taking samples in each area provided the residents in the respective areas show some commonalities that are relevant for the analysis (eg high incomes in urban areas low income in rural areas)
Finally we should note that other techniques exist for non-probability sampling in addition to those outlined above However other techniques such as convenience sampling (ie selecting individuals who are easiest to reach) or theoretical sampling (mainly used in explorative qualitative research) may not be applicable in rigorous evaluation designs as it is unlikely that they provide representative data Hence these techniques are not further discussed here
We recommend the following books articles and working papers for further reading on methodological requirements to collect quanti-tative data by means of surveys
Fink A (2003) How to Sample in Surveys The Survey Kit 2 Edition Thousand Oaks Sage Publications
Israel GD (2012) Determining Sample Size Gainesville University of Florida
Phot
o copy
GIZ
Har
ald
Fran
zen
41
In this last chapter the outlined methodological options and requirements are discussed by means of a practical case study The case study is based on a GIZ project entitled lsquoUrban Management of Inter-nal Migration due to Climate Changersquo that began in January 2015 and is being implemented on behalf of BMZ in two cities in Bangladesh The objective of the case study is to illustrate the possibilities for pro-viding empirical evidence about project impacts by applying an elaborated evaluation design that satis-fies scientific standards It will also be investigated which organisational and logistical precautions need to be taken to enable efficient data collection and analysis After a brief description of the project (41) two exemplary designs for measuring its impact are presented (42) followed by a draft of their practical implementation (43)
41 Background and project objectives
In Bangladesh climate change is considered to be one of the most important challenges Climate-related internal migration is jeopardising the over-all social stability of the country Climatic changes induce extreme weather events such as floods extreme precipitation and droughts In Bangladesh 40 out of 64 districts are affected by the impacts of climate change According to estimations six mil-lion people have already migrated due to weather and climate stresses of whom the majority lives in urban slums Especially in Khulna and Rajshahi the proportion of migrants is very high (70 of slum dwellers are migrants) For poor and vulnerable households migration is a crucial diversification and adaptation strategy However this can lead to acute vulnerability and have conflict-exacerbating effects if migrants who live in urban slums with inadequate infrastructure no access to basic services or income opportunities receive hardly public support from local government and administrative structures It is true that the decision to migrate is multi-causal that means that it is due to political social economic
demographic and environmental factors However in the two preselected cities experts believe that cli-mate and weather-related stress factors play a domi-nant role in migrantsrsquo decision to leave their homes In Rajshahi rising temperatures and drought declin-ing groundwater levels and river flooding threaten the population whereas in Khulna the population faces storms and storm surges extreme precipita-tion water logging and groundwater salinisation According to estimates the urban population (today 34) will exceed the rural population (today 66) by 2040 if economic opportunities do not reach the countryside
The core problem in the current situation is that so far there are no needs-oriented measures to improve the living conditions of climate migrants 24 in Khulna and Rajshahi City master plans do not address the influx of migrants This problem is caused by a lack of capacity of local governments and municipalities to deal with the challenges of climate-related inter-nal migration Public investment in the development and expansion of a basic infrastructure to mitigate the pressure on resources such as water energy food and housing is insufficient There is a lack of poli-cies and measures to manage settlement develop-ment Nor is there any data or information base on the movement of climate migrants to cities and their (urgent) needs This situation leads to an explosion of the population in these urban areas increasing pov-erty congested infrastructure and basic social ser-vices shortages of resources increasing distribution and opportunity conflicts and eventually reduced economic development opportunities for the entire population As urban development is a priority of the 6th Five-Year-Plan 2011ndash2015 (ie infrastruc-ture development promotion of economic activi-ties) national policies indicate that there is potential for change However there is a considerable gap between strategy and implementation
According to this situation the objective of the pro-ject is to improve the living conditions of climate migrants in preselected settlements in the divisional capitals Khulna and Rajshahi through needs-ori-ented measures 25
24 The International Organization for Migration (IOM) produced a definition of climate migrants as lsquopersons or groups of persons who for compelling reasons of sudden or progressive changes in the environment that adversely affect their lives or living con-ditions are obliged to leave their habitual homes or choose to do so either temporarily or permanently and who move either within their country or abroadrsquo
25 Since it is an integrative approach other inhabitants of the set-tlements will also benefit from improved basic urban services vocational training and temporary employment opportunities
4 Case study Urban Management of Internal Migration due to Climate Change
Impa
ct E
valu
atio
n G
uide
book
for C
limat
e Ch
ange
Ada
ptat
ion
Proj
ects
42
Four indicators were defined to achieve the project (module) objective
y In Khulna and Rajshahi X inhabitants of Y lsquohot-spotsrsquo with a high concentration of climate migrants have improved access to basic urban services (eg water energy or sewage systems through well drilling solar home systems or the construction of drainage ditches)
y In Khulna and Rajshahi X inhabitants of Y hot-spots with a high concentration of climate migrants have participated in labour-intensive measures for the expansion and building of a cli-mate-resilient basic infrastructure of whom Z are women
y In Khulna and Rajshahi in Y hotspots with a high concentration of climate migrants participants in needs-based general education and vocational training courses increased their income by X
y In each city the city corporations developed and tendered X project proposals for needs-based and labour-intensive measures for the expansion and building of climate-resilient basic urban ser-vices (eg health education water energy supply waste waterrefuse) as well as for the promotion of local economic development with the support of the Ministry of Social Welfare
In order to achieve this objective the project focuses on three intervention areas for which particular measures are currently being planned
1 Providing access to social services to the target groups by improving and extending existing services and adapting them to the needs of the migrants (eg finding social housing providing health and sanitation services) and raising the awareness of social workers for the needs of cli-mate migrants
2 Providing short-term income opportunities through labour-intensive work in and outside slum areas and providing access to basic infra-structure by its improvement together with city corporations and civil society
3 Providing long-term income opportunities by developing and implementing skills develop-ment measures in cooperation with training cen-tres and formal and informal SMEs in different sectors
Various Capacity Development measures will be implemented by long-term and short-term experts and financial support will be provided to upgrade slums and enhance resilience Particularly in the third intervention area cooperation is also planned with the local economy and training providers
It should be highlighted that the project is the first of its kind in German development cooperation to deal with the issue of climate-induced (internal)
migration The project therefore has an innovative and pilot character and aims to showcase a variety of measures to deal with climate-induced internal migration The integration of climate change adapta-tion into urban development planning and the con-tinuation of successful measures will be strengthend by other projects implemented by GIZ KfW and BGR
Selection of an impact evaluation design
In order to decide which evaluation design(s) could be suitable for measuring the impact of the project it makes sense to revisit the table at the end of Sec-tion 31 that summarises the characteristics and requirements of the discussed designs Looking first at the required project characteristics we should consider where the project aims to generate tangi-ble results that can be empirically verified Accord-ing to the project description the measures target climate migrants who constitute a distinguishable target treatment group as they are a sub-population of the entirety of residents in the intervention areas This treatment group however is not randomised but rather selected based on predefined criteria such as the settlements (lsquohotspotsrsquo) and their socio-eco-nomic status (lsquoclimate migrantsrsquo) Hence an experi-mental design does not come into consideration As the project description does not indicate a sequen-tial implementation of the measures a pipeline approach is also out of the question However if the project is scaled up at a later stage such an approach would still be feasible based on the data gathered by the design proposed below
Another feature of the treatment group is that it has individual characteristics that are likewise relevant for their selection and the treatment effect As these characteristics are in principle observable (eg eco-nomic situation migration background family sta-tus) both propensity score matching and a regression discontinuity design are in principle feasible With regard to the long-term measurement of treatment effects and their sustainability beyond the project implementation period a household panel appears to be suitable However according to the description of the framework conditions the migrant population fluctuates considerably Such a fluctuation will prob-ably result in a very high panel mortality ie par-ticipants dropping out from the sample that would undermine the significance and reliability of the findings Another feature of the project is that it does not focus solely on directly supporting individual climate migrants but also aims at improving social services and basic infrastructure which again should contribute indirectly to the improvement of the liv-ing conditions of these migrants and the population in the intervention areas at large Such a lsquosystemicrsquo approach calls for the use of structural equation
43
models which make it possible to measure the influ-ence of changed framework conditions on a popula-tionrsquos livelihood
Coming next to the data requirements the selec-tion of particular settlement areas makes it possible to create comparison groups ie migrants who are not supported by the project Furthermore as the evaluation is planned before the project activities start it should be possible to collect baseline data from both the treatment and comparison groups Since the project description does not provide any indication that measures in the selected settlements will be restricted to a certain sub-population of the potential target groups (ie there is no threshold level according to which the beneficiaries are selected) comparison groups need to be selected in spatially
remote areas This again makes it impossible to apply an RDD approach Nor would an RDD be recom-mended if such a restriction were made because the design of the measures facilitates spill-over effects which will likely bias the comparison findings With regard to the system-oriented measures the development of SEMs should be feasible provided that statistical or empirical data can be made avail-able for the required models throughout the project implementation (ie by the continuous results-based monitoring system) This is required to describe the relevant elements that constitute the framework conditions of the migrant population The following table summarises the applicability of the different evaluation designs based on the project characteris-tics
Table 6 Applicability of evaluation designs
Evaluation design Required project characteristics
Full-filled
Data requirements Full-filled
Experimental (RCT)
Distinguishable treatment group Ex-ante (baseline) and ex-post data available from treatment and control group
Random assignment to treatment and comparison group
ndash
Quasi- experimental with PSM
Distinguishable treatment group Observable individual characteristics relevant for the treatment effect
Pipeline approach
Sequenced project implementation ndash Ex-ante and ex-post data available each group na
Comparable treatment groups in each phase
na
RDD Selection of treatment group according to a specified criterion Sufficient number of comparable cases
(close to a threshold level)ndash
Time-series Panel focusing on individuals households organisations Panel large sample size few repeated data
collectionsndash
TSCS focusing on sectors countries regions
ndash TSCS sample size irrelevant large number of repeated data collections
na
SEM Focusing on entire sectors countries regions Statistical andor empirical data for each
model-relevant construct Unlikely to be achieved due to foreseeable panel mortality
Since PSMs and SEMs appear to be the most promis-ing approaches to measure the impact of the project we will go on to outline how the data collection pro-cess could be organised and what the related meth-odological and practical requirements are
42 Practical implementation
Starting with PSMs it first has to be clarified who constitutes the treatment and comparison group and how appropriate samples can be selected In the second step the hypotheses to be tested and the necessary indicators have to be developed Then we
need to consider which covariates have to be col-lected in order to enable the matching of cases (eg age gender place of origin duration of stay in target area education level ethnic affiliation marital sta-tus) Finally the data collection plan and instruments have to be developed
Based on the project description it is easy to iden-tify who should belong to the treatment climate and floating migrants in selected settlements as well as other poorest people in Khulna and Rajshahi Equally easy to identify is who should belong to the compari-son group climate migrants in settlements in these cities where no project activities are implemented If such settlements cannot be identified it would also
4 Case study U
rban Managem
ent of Internal Migration due to Clim
ate Change
Impa
ct E
valu
atio
n G
uide
book
for C
limat
e Ch
ange
Ada
ptat
ion
Proj
ects
44
be acceptable to choose climate migrants in other cities who face the same problem provided these cities are comparable in terms of the characteris-tics that were decisive for the selection of the pro-ject location As it can be assumed that the targeted population is rather large and the actual proportion presenting the characteristic of interest (improved living conditions) is not known beforehand the sample size should be calculated according to the first formula outlined in Section 56 (annex) The for-mula approximates a sample size of 400 for infinitely large populations with a level of confidence of 95 and an aspired margin of error of 5 26 Consider-ing the conceivable attrition loss during the data collection process a target gross sample size of 600 for the treatment group and at least 800 to 1000 for the comparison group (in order to receive sufficient matches) should be aimed at Depending how the dissimilarity of the socio-economic framework con-ditions in Khulna and Rajshahi is assessed it further has to be decided whether it is sufficient to split one sample across both cities ndash ie if they are generally comparable ndash or if the sample size needs to be dou-bled ndash ie if the framework conditions differ consid-erably with regard to the characteristics of interest
Next it has to be decided which hypotheses are to be tested and which data needs to be collected So far the project objective has been operationalised by four indicators of which three directly refer to the living conditions of climate migrants (1) access to lsquourban basic servicesrsquo (2) participation lsquoin labour-intensive measuresrsquo and (3) having an lsquoincreased incomersquo Leaving aside the question whether these indicators cover the entirety of factors that define the quality of lsquoliving conditionsrsquo ndash which however needs to be revisited during the development of the data collection instruments ndash it has to be clarified what information is needed to verify or disprove their achievement With regard to the first indicator such information would comprise for instance data on the types of existing services their general acces-sibility and finally the actual use of these services by the target group Of course such data would have to be collected for both the treatment and comparison group before and directly after the project imple-mentation and ideally again another three to five years later in order to assess the sustainability of the project measures
26 It should be noted that the proposed level of confidence and margin of error represent the lowest common accepted param-eters for inferential statistics It is up to the evaluation team to decide on stricter values which however will result in a need to collect considerably larger samples
Concerning the second indicator it may seem easy to provide empirical evidence about its achievement ie by comparing the factual number of participants with the targeted number It is however question-able whether the indicator actually makes it pos-sible to measure an impact since participation in a labour-intensive measure does not say anything about the living conditions of the migrants Since the outcome of their participation (eg the generated income and created infrastructure) can rather be considered to influence their living conditions it is recommended to revise this indicator
While the relevance of the third indicator for the impact to be measured is again clear it must be borne in mind that the findings are likely to be biased by contagion effects ie that income has been increased by sources other than the ones created by the project Therefore further qualitative data needs to be collected on the income sources and how and why they were obtained Furthermore it has to be remembered that providing information about onersquos own income may be a sensitive issue Hence data on proxy indicators such as private properties number of meals per day or school attendance of children (etc) has to be collected
In order to obtain a comprehensive picture about the net impact of the project it is further necessary to also gather information about its unintended positive and negative impacts Therefore it must be considered who else apart from the migrants might be affected by the project activities which secondary effects could be caused or how the project objectives interfere with partner strategies andor the activities of other donors For assessing the effectiveness of the particular project measures and helping to attribute the observed effects it is also necessary to collect data on the participation of the target group (eg in labour-intensive or training measures)
Finally to enable matching of the treatment and comparison group data covariates need to be col-lected that have to comply with the lsquostability cri-terionrsquo outlined in Section 53 This could be for instance the origin of the migrant his or her ethic and religious affiliation age gender and family sta-tus etc However we also have to bear in mind not to use variables such as profession socio-economic sta-tus type of migrant and so on as the project meas-ures (eg further training income generation) may influence these characteristics
The following table summarises the indicators data requirements data collection instruments and anal-ysis methods discussed above that would be part of the data collection plan for the migrant survey
45
Table 7 Draft (simplified) data collection plan
Indicator Required data Data collection instrument
Data analysis method
Improved access to basic urban services
Types of services provided Document analysis observation (for empirical verification)
Qualitative comparative analysis
General accessibility of service A B C hellip further operationalized eg by number and distribution of access points costs per service use capacities of service in terms of no of customers per day service can be provided to
Document analysis observation migrant survey
Qualitative and quantitative (double-difference) comparative analysis
Actual use of services by migrants disaggregated by eg types used frequency of use by type costs of use in relation to income
Migrant survey focus group discussion
Quantitative comparative analysis
Increased income Current income and income sources of migrants (operationalized by proxy indicators)
Migrant survey Quantitative comparative analysis
Further indicators for measuring the living conditions of the migrants
Further indicators for measuring the unintended effects of the projects
Further indicators about participation in project measures
Covariates eg origin ethnic and religious affiliation age gender family status
Migrant survey Used for calculating the propensity score
The draft shows that there are a number of blank spots that need to be looked into further regarding the operationalisation of impacts the project activi-ties and the covariates required for matching
Coming now to the structural equation model-ling (SEM) the first step is to identify the constructs that are relevant for the model Without further knowledge about the framework conditions and project measures such a model can only be roughly sketched However based on the project design its outputs in the three intervention areas (in terms of the capacities created for basic urban services train-ing as well as short-term and long-term income opportunities) can be considered as exogenous con-structs that aim to influence the living conditions of the migrants A further exogenous factor would be the general framework conditions as determined by
political strategies (eg government budget alloca-tion to infrastructure development) or economic societal and environmental developments (eg regional economic power number of small and medium enterprises migrant influx annual precipi-tation) Here we should consider whether it makes sense to further split up this construct due to its heterogeneity The living conditions of the migrants would represent the endogenous construct whereby the constitution of basic service infrastructure in the settlements could serve as another mediating construct This is on the one hand influenced by the framework conditions and the project activities and on the other hand has an influence on the living con-ditions of the migrants The following figure shows a (highly) simplified illustration of the SEM based on this outline with a few exemplary indicators for each construct
Phot
o copy
GIZ
Elm
ar F
oellm
i
4 Case study U
rban Managem
ent of Internal Migration due to Clim
ate Change
Impa
ct E
valu
atio
n G
uide
book
for C
limat
e Ch
ange
Ada
ptat
ion
Proj
ects
46
Figure 9 Simplified SEM for the GIZ project 33
Budget allocated to IF2
No of migrants in labour
No of basic services
No of customers served
School attendance of children
Self-assessed living conditions
Budget allocated to IF3
No of migrants trained
Budget allocated to IF1
No of migrants with access to
Budget for infrastructure
Migrant influx
No of SME
Total project budget
Partner contribution
Socio-econ FC
PO in IF2 (labour)
Project resources
PO in IF1 (access)
PO in IF3 (training)
Consti-tution of
infrastruc-ture
Living con-ditions of migrants
The figure shows that some of the measurement models are formative (project resources socio-economic framework conditions) while others are reflective (constitution of infrastructure achieve-ment of project outputs in the fields of intervention and living conditions of the migrants) Of course further constructs measurement models and struc-tural elements and relationships are conceivable There is however a need to define which elements the model requires in order to adequately reflect the lsquorealrsquo project situation and to enable measurement of the changes in its fields of intervention The appli-cation of the SEM requires the regular collection of the respective data ndash at least on an annual basis ndash to be able to calculate the parameters for assessing the project contributions Accordingly the indica-tors have to be included in the project monitoring system which should be developed in the course of the baseline study The latter is the first step of the impact evaluation
According to the outlined design the practical implementation of the impact evaluation should start with an in- depth document analysis and the elaboration of a detailed work plan specifying the
27 The figure was drawn using SmartPLSreg a software for developing variance-based SEMs
individual steps of data collection and analysis and the respective responsibilities Ideally before starting with the baseline study an exploratory preliminary mission should be conducted in order to gain further information for complementing the data collection plan (ie on the availability of data sources further needs of the target groups and other active actors in the intervention area) Furthermore the avail-ability of secondary data and the accessibility of the migrants for data collection the logistical require-ments and general feasibility of the evaluation design should be investigated
Once the data collection plan is finalised the data collection instruments (ie interview guidelines guidelines for focus group discussions question-naires) can be developed and tested In so doing par-ticular focus has to be placed on the socio-cultural adequacy of the instruments (eg appropriate and easy-to-understand language clear commonly understood categories in closed questions) and ndash as the survey will most likely be administered ndash the required qualifications of the interviewers (eg use of questionnaire particularly following the filtering procedure coding of answers ability to explain ques-tions if not understood by interviewees social skills)
FC framework conditions PO project outputs IF intervention field
47
After successful testing and finalisation of the instru-ments and interviewer training a sampling proce-dure should be identified that allows for randomi-sation eg by random walks through the selected settlements or by randomly selected spots (if reliable maps are available) Data collection should then start ideally simultaneously with the treatment and com-parison group in order to minimise time-induced bias Provided that the data has been collected according to the previously defined methodologi-cal standards the analysis will provide a picture of the migrantsrsquo current living conditions This will be based not only on the assessment of a few represent-atives andor experts but on a sound statistical foun-dation that makes it possible to transfer the sample findings to the entire target population This baseline data will also serve as the comparison base at a later stage for calculating the project impact
At the end of the baseline study a framework for the continuous results-based monitoring system should be developed As the monitoring system will not only be used for continuous reporting on project progress but also for the SEM analysis after project comple-tion the indicators used must satisfy the informa-tion needs of the model and thus not only focus on the project outcomes and impacts but also include data about the framework conditions The data col-lection instruments have to be adapted to suit these requirements Furthermore the timing of the con-tinuous data collection and the responsibilities have to be coordinated Given the three-year project term it may make sense to agree on a six-monthly or even quarterly collection in order to gather sufficient data (about eight to 10 cycles) for robust model calcula-tion If the measures need to be adapted during pro-ject implementation the indicators and maybe even the model need to be revised likewise
At the end of the project a second migrant survey has to be implemented according to the same meth-odological standards as for the baseline study In
combination with the baseline data the findings of that survey will be used for impact measurement and attribution as described in Section 311 Provided that the evaluation team has managed to gather the required data in line with the discussed require-ments the findings should enable valid and reliable attribution of the observed changes in the living conditions of the migrants to the project measures Due to the broad analytical perspective of the evalu-ation it should also be possible to document possible unintended effects as well as the influence of exter-nal (confounding) factors
However the project measures are not solely designed to improve living conditions in the short term Long-term effects and sustainability of the project impacts (eg climate resilience of built infra-structure) are also of interest In order to assess such long-term impacts another evaluation needs to be conducted It is recommended to conduct such an ex-post evaluation about three to five years after the project has been completed
As such an ex-post evaluation poses particular prac-tical challenges particularly regarding the retrieval of the former beneficiaries access to public authori-ties or logistical support on site (in case the imple-menting agencies are not active there anymore) it is of utmost importance to announce such an investi-gation during the project implementation phase in order to get sufficient support at a later stage There-fore all partners and further stakeholders should be made aware of its importance and supported in establishing adequate structures for future data col-lections Ideally a Memorandum of Understanding (MoU) could be agreed upon in which the responsi-bilities are clarified In return the partners could be supported in developing their own monitoring sys-tem which again might contribute to their owner-ship and understanding of the usefulness of collect-ing such data
Phot
o copy
GIZ
Ran
ak M
artin
4 Case study U
rban Managem
ent of Internal Migration due to Clim
ate Change
Impa
ct E
valu
atio
n G
uide
book
for C
limat
e Ch
ange
Ada
ptat
ion
Proj
ects
48
We will go on to present the individual tasks accord-ing to the proposed practical implementation of the impact evaluation in chronological order including
a rough estimation of the required time resources for each step
Figure 10 Draft schedule for impact monitoring and evaluation framework
` Document analysis selection of evaluation design development of a work plan (about 5 ndash 8 working days (WDs) depending on the amount of available documents)
` Exploratory preliminary mission gathering qualitative data for accomplishing the data collection plan checking the availabilityaccessibility of data sources and the feasibility of data collection (about 3 WDsrsquo preparation 3 days of travel 10 ndash 12 WDs on site 5 WDs for writing an inception report)
Preparatory tasks
` Adaptation of data collection instruments development of a resource plan and assignment of responsibilities (roughly 3 WDs)
` Implementation of monitoring system regular data collection according to data collection plan revision of data collection instruments as required (eg changing of project measures) (roughly 1-2 WDs per month depending on the monitoring data to be collected)
` Regular data analysis and reporting (about 3 ndash 4 WDs per report cycle)
` Finalisation of the data collection plan development and pre-testing of the data collection instruments (about 8 ndash 10 WDs depending on the selection of instruments and accessibility of target groups)
` Collection of baseline data data analysis and reporting (about 20 ndash 30 WDs for data collection depending on the number of available enumerators and logistical support on site about 10 WDs for data analysis 10 ndash 15 WDs for reporting incl results presentation and finalisation of ex-ante evaluation report)
` Preparation of a framework for continuous results-based monitoring system specification of indicators and data collection plan (about 5 WDs in collaboration with project team)
Baseline study
(ex-ante evaluation)
2015
` Adaptation of data collection plan and instruments review of monitoring data further document analysis (official statistics project documents etc) (about 5 ndash 8 WDs)
` Collection of final evaluation data data analysis and reporting (about 20 ndash 30 WDs for data col-lection depending on the number of available enumerators and logistical support on site about 15 WDs for data analysis 10 ndash 15 WDs for reporting incl results presentation and finalisation of ex-ante evaluation report)
Final evaluation
2018
` Adaptation of data collection plan and instruments further document analysis (approx 5 ndash 8 WDs) ` Collection of ex-post evaluation data data analysis and reporting (approx 20 ndash 30 WDs for data collection depending on the number of available enumerators and logistical support on site about 15 WDs for data analysis 10 ndash 15 WDs for reporting incl results presentation and finalisa-tion of ex-ante evaluation report)
Ex-post evaluation
20212223
Continuous results- based
monitoring2015 ndash 2018
Winding up we should point out that the above design and suggestions for its practical implementa-tion can only serve as a rough sketch which of course needs to be further elaborated during the inception phase of the research For the sake of convenience gender-related aspects or further aspects related to the living conditions of the migrants such as access to health services or education have not been dis-cussed Also the factually available resources for the evaluation and the logistical and practical feasibil-
ity of the data collection cannot be assessed without further information about the project concept and the framework conditions All the more important then to start the evaluation with an in-depth scop-ing phase to ensure appropriate data collection and analysis throughout the evaluation Valid and reli-able evaluation findings can only be produced with high-quality data In other words If the data is poor no design will save the day
49
Ndeg Project name Inst Country Design Data collection instruments Methodology
1 Noakhali Rural Development Project
Danida Bangla-desh
Ex-post facto
Quantitative analysis of project monitoring and contextual data Qualitative analysis documentary study archival work questionnaire surveys stakeholder and informant interviews rep-resentative surveys of project components assessment of buildings roads and irriga-tion canals village surveys and interviews observation focus group discussion case studies
Mixed-method approach
2 Climate Finance Readiness Pro-gramme
BMZ
GIZ
KfW
Global
3 National Ad-aptation Plan Global Support Programme
UNDP UNEP GEF
Global
4 Africa Adaptation Programme
UNDP WFP UNIDO UNICEF
Africa-wide
5 Strategic Ini-tiative to Address Climate Change in LDCs
UNDP Global
6 Climate Support Programme (CSP)
GIZ
BMU DEA
South Africa
NA ndash still ongoing
7 Public Invest-ment and Climate Change Adapta-tion (IPACC)
BMUB
GIZ APCI Ministries regional govern-ments of Cusco amp Piura
Peru (Cusco and Piura)
NA ndash still ongoing
8 Climate Change Adaptation in Rural Areas of India (CCA RAI)
GIZ BMZ
ministries Govern-ment of India govern-ments of federal states
India (Madhya Pradesh Rajasthan Tamil Nadu and West Bengal)
9 Sustainable agri-cultural develop-ment (PROAGRO I and II)
BMZ GIZ
SIDA ministries VIPFE
Bolivia (Chaco Northern Potosi Southern Cocha-bamba Valles)
Mid-Term Evalua-tion
Mainly qualitative evaluation design analysis of primary and secondary data semi-structured interviews and surveys with national counterparts strategic partners and target groups direct observation focus group discussions
Mainly qualitative evalua-tion design
5 Annex51 Overview of current CCA related-project evaluations
Impa
ct E
valu
atio
n G
uide
book
for C
limat
e Ch
ange
Ada
ptat
ion
Proj
ects
50
Ndeg Project name Inst Country Design Data collection instruments Methodology
10 Transboundary water manage-ment with the Mekong River Commission
BMZ GIZ
BMUB
Mekong River Commis-sion
Cambo-dia Laos Thailand Vietnam
NA ndash still ongoing
11
Rural Finance and Community Initiatives Project
IFAD The Gambia
Quasi-experi-mental
Field-level questionnaires focus group discussions interviews with key informants and case studies of the various community-based organisations and their members
For impact assessment the mission relied on a quanti-tative survey and participa-tory rural appraisal (PRA) exercise
12 Ghana Water Programme
CIDA Ghana Before-after
Document review key-informant inter-views internal benchmarking data from project reviews used for before vs after limited resources did not enable ex-post surveys
13 Chronic vulner-ability to food insecurity
WFP Kenya Experi-mental
Literature reviewsecondary data analysis Key Informant Discussions Participatory Vulnerability Profiles Field visits Focus Group Discussions
Study triangulates data from qualitative and quantitative sources It uses qualita-tive data from focus group discussions with community members and key-inform-ant interviews with com-munity opinion leaders and quantitative data involving about 3000 randomly sam-pled households
14 Food and Cash for Assets (FCFA) on Livelihood Resilience in Bangladesh
WFP Bangla-desh
Before-after approach
Document review On the quantitative front a household survey was conducted that covered 1500 households of participants non-participants and the comparison group Qualitative data were collected through focus group discus-sions asset assessments key-informant interviews semi-structured interviews
Mixed-method approach was adopted Participatory rural appraisal (PRA)
15 Impact of Food for Assets on Livelihood Resilience in Guatemala
WFP Guate-mala
Quasi-Experi-mental
Document review secondary data analysis and institutional Analysis community pro-file asset assessment institutional analysis household survey focus group discussion semi-structured interviews
Mixed-method approach Quantitative survey at the household level qualitative assessment of impacts at household and community levels assessment of tech-nical and biophysical assets in each community social and institutional analysis of networks and linkages at different levels especially communities
16 Impact of Food for Assets on Livelihood Resilience in Senegal
WFP Senegal Quasi-experi-mental
Document review household survey obser-vation village profiles gender-disaggregat-ed focus group discussions semi-structured interviews with major stakeholders asset assessments
Mixed-method Approach data triangulation
17 Effects of Climate Variability and Change on Household Food Sufficiency among Small-Scale Farmers of Yatta District
Journal article
Kenya Experi-mental
Desk research use of questionnaires inter-views focus group discussions observa-tions participatory vulnerability profiles development of indigenous knowledge systems
Mixed-method approach
Crop production data using Krejcie amp Morgan formula commonly used to calculate a sample size (random sampling procedure) coefficients of variation were computed for annual precipitation and then cor-related to crop production using Pearson correlation coefficient
51
Ndeg Project name Inst Country Design Data collection instruments Methodology
18 Analysis of vulnerability and resilience to climate change-induced shocks in North Shewa
Journal article
Ethiopia Experi-mental
Secondary data analysis surveys structured questionnaire interviews focus group discussion vulnerability analysis expert judgment
Mixed-method approach principal component analy-sis correlation with past disaster events ordered probit regression model use of fuzzy logic random sampling procedure
19 Vulnerabil-ity of Farming Households to Environmental Degradation in Developing Countries Evi-dence from North Central Nigeria
Journal article
Nigeria Experi-mental
Survey was used to generate household level data
Principal component analysis was used to develop vulnerability index for individual household so as to classify households depending on their level of vulnerability to environmen-tal degradation impacts use of multi-stage random sampling technique cluster analysis ordered logit regression model
20 An Index to Determine Vul-nerability of Communities in a Coastal Zone A Case Study of Baler Aurora
Journal article
Philip-pines
Experi-mental
Secondary data analysis survey (face-to-face and random) questionnaire observa-tions mappingGIS resource mapping activity workshops
Indicator method index computations following a balanced weighted aver-age approach Pearsonrsquos correlation coefficient of determination
21 Assessing House-hold Vulner-ability to Climate Change The Case Of Farmers In The Nile Basin
IFPRI Ethiopia Experi-mental
Expert knowledge use of household-level socio-economic survey interviews
Mixed-method approach Indicator and econometric method Principal compo-nent analysis correlation with past disaster events
22 Cambodia Community-Based Adaptation Programme
UNDP Cambodia Experi-mental
Secondary data analysis primary data key-informant interviews un-structured in-dividual interviews site visits observations semi-structured discussions structured Focus Group Discussions
Mixed-method data triangulation inductive and deductive approaches using quantitative and qualitative data
23 Strengthen-ing Adaptation Capacities and Reducing the Vulnerability to Climate Change in Burkina Faso
UNDP Burkina Faso
Document review individual interviews group discussions field visits observation
24 National Pro-gramme for Man-aging Climate Change in Malawi and the Malawi Africa Adaptation Programme
UNDP Malawi Desk review of project semi-structured interviews field visits workshops
Mixed-method approach data triangulation
25 Adaptation to Climate Change in the Nile Delta through Integrat-ed Coastal Zone Management
UNDP Egypt Document review and analysis (desktop study) interviews and meetings (face-to-face and by telephoneSkype and email questionnaires data collection in the field (interviews direct observations)
26 The Hill Maize Research Project
USAID Nepal Experi-mental
Secondary data published and unpublished documents and reports quantitative and qualitative tools Primary data structured and pre-tested questionnaire (household level) semi-structured checklist with a number of open-ended questions (community level) focus group discussion key-informant interviews using similar semi-structured checklist with open-ended questions data collected from key informants and focus group surveys were used for descrip-tive and qualitative analysis whereas those collected through household survey were used for quantitative analysis
Mixed-method approach randomised controlled trial propensity score matching (PSM)
5 A
nnex
Impa
ct E
valu
atio
n G
uide
book
for C
limat
e Ch
ange
Ada
ptat
ion
Proj
ects
52
Ndeg Project name Inst Country Design Data collection instruments Methodology
27 Small-Scale Irri-gation Manage-ment Project
JICA Indonesia Experi-mental
Household surveys direct interviews Focus Groups Discussions
Mixed-method approach propensity score match-ing regression disconti-nuity design estimation strategy T-test estimation of average treatment effect balancing test
28 Vulnerability to tropical storm impacts in coastal areas of the Red River Delta in Viet Nam and the adjacent region
Journal article
Vietnam Quantitative and qualitative surveys inter-views with key informants semi-structured interviews discussions mangrove utilisa-tion survey (quantitative model) focused interviews visualisation of storm track for various typhoon seasons
Mixed-method approach participatory rural appraisal
29 Sustainable Soil Management Program
Helvetas Swiss Inter-Co-operation amp SDC
Nepal Desk review of relevant documents field visits semi-structured interviews Focus group discussions observations separate focus group discussions for discussing is-sues related to labour migration apprecia-tive inquiry approach using open-ended questions storytelling about successes and challenges as well as visioning
30 Dry Zone Liveli-hood Support and Partnership Programme (DZLISPP)
IFAD Sri Lanka Quasi-experi-mental
Qualitative survey (key informant interviews with project staff and government officials focus group discussions with beneficiaries) and quantitative survey of 2560 households (both treatment and non-treatment group)
Mixed-method approach
31 Implement-ing sustainable water resources and wastewater management in Pacific island countries
UNDP Pa-cific island countries
Evaluation involved an orientation meeting in Nadi Fiji with Projectrsquos Regional Steering Committee two missions to visit six of the PICs and Skype and phone interviews with representatives of the remaining PICs and the implementing agencies construction of theory of change to evaluate the pathway of projectrsquos success
Mostly qualitative in nature
32 Supporting Integrated and Comprehensive Approaches to Climate Change Adaptation in Africa - Main-streaming CCA in the National Sectoral Policies of Tanzania
UNDP Tanzania Primary and secondary data were collected and analysed use of semi-structured indi-vidual and group interviews
No specific reference but seems to be highly qualita-tive
33 Climate Change Adaptation Action and Mainstreaming in Mozambique
UNDO Mozam-bique
Primary and secondary data were collected and analysed use of semi-structured indi-vidual and group interviews
No specific reference but seems to be highly qualita-tive
34 Integrating Disaster Risk Reduction and Climate Change Adaptation (DRRCCA) in Local Development Planning and Decision-making Processes
UNDP Philip-pines
Desk review key-informant interview (KII) using a questionnaire guide that focuses on particular agenciesinstitutions vis-agrave-vis outcomeoutput focus group discussion using a questionnaire guide and study or field visits where observation and interview methods are utilised for more insights
Mid-term review relies on qualitative information gen-erated through primary data gathering Opportunities for triangulation were sought However not all datainformation can be treated in this manner especially as certain key players have not been interviewed despite several attempts
35 Africa Adaptation Project Namibia Building the Foundation for a National Ap-proach to Climate Change Adapta-tion in Namibia
UNDP Namibia Interviews group interviews and document reviews Open-ended questionnaires were employed to facilitate interviews Literature and documents were reviewed to acquire relevant and appropriate information required to answer key evaluation questions and objectives Observations and case study approaches were used during field visits
Evaluation applied a mixed methodology of quantita-tive and qualitative research approaches
= No reference | NA = Not applicable
53
52 Calculation of net average treatment effect with double-difference approach
Figure 11 Calculation of the net treatment effect in an experimental or quasi-experimental design
Indicator lsquoIrsquo Intervention = Treatment
t0 t1 t2point in time
Difference of I between treatment and comparison group after treatment (t2)
Difference of I between treatment and comparison group before treatment (t0)
Average value of I for treatment group
Average value of I for comparison group
net average treatment effect
Estimated average counterfactual value of I for treatment group
The figure shows that the counterfactual value of the indicator for the treatment group is estimated on the basis of its (observed) value for the comparison group and the difference of its values between the groups before the treatment In other words it is assumed that without the treatment the treatment group would have developed in the same way as the com-parison group Accordingly the net average treat-ment effect ( ) can be calculated very easily by using the following formula
Whereby represents the value for the indicator of interest for the treatment (exponent = 1) and com-parison (exponent = 0) group at the points in time ( 0 = before and 2 = after treatment) when data is being collected ie before and after the treatment Sim-ply speaking the difference in the indicator mean value between the treatment and comparison group before the treatment is subtracted from its differ-ence between the treatment and comparison group after the treatment Therefore this approach is also called lsquodifference-in-differencersquo or lsquodouble-differ-encersquo approach
53 Propensity score matching (PSM)
The propensity score is an index that indicates the conditional probability of an individualrsquos being part of the treatment group This probability is calcu-lated based on a set of variables that are relevant for both selection for the treatment and the observed treatment effect The advantage of PSM is that in
contrast to other matching techniques it provides a one-dimensional score for the matching procedure and does not require any distribution assumptions regarding the basic population (cf 331) It does however require a set of assumptions to be fulfilled which limit its applicability to some extent These are
y Conditional independence assumption (CIA) The treatment effect (ie outcome differences between the treatment and the comparison group) has to be independent from the selection ie the effects may only be explained by the treat-ment confounding factors have to be excluded Example If an intervention aims at increasing the income of a group of people project benefi-ciaries need to be subject to the same external economic framework conditions that influence their income as non-beneficiaries The assump-tion would be violated for instance if a certain occupational group were selected (eg only farm-ers) and compared with a basic population that consists of various occupational groups
y Stable unit treatment value assumption (SUTVA) The treatment effect of an intervention on one person may not be influenced by the participa-tion of another person in the same intervention Example If an intervention aims at providing financial support to a group of people eg by micro-credits the potentially available amount for each beneficiary must be equal regardless of the amounts already spent In other words the project budget needs to be at least as big as the maximum budget needed if all beneficiaries were to request the maximum individual amount
5 A
nnex
Impa
ct E
valu
atio
n G
uide
book
for C
limat
e Ch
ange
Ada
ptat
ion
Proj
ects
54
y Stability of covariates against the treatment The covariates that are used to calculate the propen-sity score must not be influenced by the treat-ment Example If an intervention aims at increasing the income of a group of people then the income of the potential beneficiaries must not be used as a covariate (as it is an intended outcome of the project)
y Common support condition In order to be suit-able for matching both the treatment and com-parison group need to contain individuals with the same or at least a similar propensity score
y Balancing property Individuals who have the same propensity score need to be comparable regarding the particular characteristics that were chosen as covariates
If the project characteristics meet the above require-ments PSM can be applied according to the follow-ing sequence 28
Figure 12 PSM sequence
Estimating the
propensity score
Testing the common support
assumption
Selecting a matching algorithm
Testing the matching
quality and treatment
effects
Sensitivity analysis
Estimating the propensity score
The estimation of the propensity score is based on the selection of the covariates and the estimation procedure The estimation procedure again depends on the number of groups that need to be included in the analysis As in evaluations usually only two groups ndash the treatment and comparison group ndash are compared and only discrete choice models usu-ally logit or probit regressions 29 are used While the type of regression only plays a minor role as both provide very similar findings the variables that are used to calculate the propensity score are by far more important as they need to fulfil the conditional inde-pendence assumption (CIA) in order to provide valid findings Furthermore as the propensity score indi-
28 The following descriptions are based on a CEval working paper (no 19) written by Muumlller Christoph 2012
29 Regressions are used in statistics for identifying the relation-ships between one dependent and several independent varia-bles (eg income depending on education gender and age) Logit and probit regressions are usually used when a variable can only have two values (eg yes and no participant and non-participant)
cates the conditional probability that an individual will receive a treatment only those variables must be used that reflect this probability Therefore it is not correct to generally refer to lsquosocio-economic covari-atesrsquo as is still sometimes found in the literature (cf eg OECD 2014) While socio-economic variables may be appropriate for interventions that focus on the poor (ie the poorer a person the more likely he or she is to participate) they may not make any sense for an intervention that focuses on vulnerability (ie the more vulnerable a person is the more likely he or she is to participate) Accordingly in the latter case variables that reflect the vulnerability of a per-son (eg proximity to a disaster-prone area) need to be taken as covariates In any case the selection of covariates needs to be theoretically substantiated
Once the covariates are selected the propensity score is calculated by a simple (logit or probit) regression Here it is important to note that only metric (ie continuous eg income age) and dichotomous vari-ables (ie variables that can have two values eg yesno 10) can be included Nominal (ie variables that can only have discrete valuescategories without ranking eg religion marital status) and ordinal (ie variables with discrete ranked values eg educational level) variables need to be recoded in dichotomous variables for each category before the analysis
Testing the common support assumption
After the propensity score has been calculated for each case (ie person individual) of the treatment and control group the so-called area of common support (ACS) has to be identified The ACS com-prises the range in which the treatment and com-parison group show a similar density of propensity scores Only cases that lie within this area can be used for the subsequent matching procedure The ACS can either be defined by cutting off the range at the low-est and highest propensity scores available for both groups or by trimming ie setting a certain density threshold level beneath which cases are discarded In order to decide how to define the ACS it makes sense to visualise the distribution of the propensity scores as the following figure illustrates
55
Figure 13 Exemplary illustrations of propensity scores densities
0
02
04
06
08
1
01 02 03 04 05 06 07 08 09 10
02
04
06
08
1
01 02 03 04 05 06 07 08 09 1
Treatment group
Comparison group
Treatment group
Comparison group
As the illustration in the example on the left shows it would be appropriate to cut the ACS below 03 as there are no cases in the treatment group below this value and above 08 as there are no cases in the com-parison group above that value On the right both groups feature values in the entire range between 0 and 1 However the treatment group contains no cases with propensity scores between 07 and 08 which would make it impossible to create matches in that area Accordingly it would make sense to set a threshold level say at about 015 beneath which cases are excluded In that case the ACS would lie between 03 and 06 and between 09 and 1 Note If no ACS can be identified PSM cannot be applied
Selecting a matching algorithm
Once the ACS has been defined matching then starts with the selection of the matching algorithm As there are a number of matching algorithms that dif-fer depending on how cases from the comparison group are assigned to cases of the treatment group and the type of weighting several algorithms are usually applied in order to select the one that is most sensitive for identifying the treatment effect Three popular matching algorithms are briefly outlined below
A very popular and fairly simple matching algorithm is the so-called nearest neighbour matching (NNM) With NNM the case from the comparison group that features the most similar propensity score to each case or group of cases of the treatment group is assigned ie the one with the most similar prob-ability of being a member of the treatment group The approach prevents so-called bad matches ie that cases which are very different ndash in terms of their characteristics as represented by the covariates ndash to each other are compared Cases from the compari-son group can then usually be used repeatedly as a matching partner for cases from the treatment group It is also recommended to match several cases from the comparison group with each case from the treatment group in order to receive more robust findings (ie with less variance) Thus the com-parison group should be considerably larger than the treatment group (cf 331) It should be noted though that the decision to use cases more than once in order to minimise the variance has the trade-off of a potentially higher bias as inferior matches may also be used Figure 14 provides a simplified illustration of how the matches can be identified graphically
Figure 14 Graphical illustration of nearest neighbour matching
Treatment group cases
Comparison group cases
0 025 05 075 1
Propensity score
Treatment group cases
Comparison group cases
0 025 05
Propensity score075 1
1Weighting factor of cases
Treatment group cases
Comparison group cases
0 025 05
Propensity score075 1
Range (caliper)
5 A
nnex
Impa
ct E
valu
atio
n G
uide
book
for C
limat
e Ch
ange
Ada
ptat
ion
Proj
ects
56
As figure 14 shows in this example both treatment group and comparison group cases are used repeat-edly for matching and cases that are not the nearest neighbour to any of the cases of the respective other group are discarded
Another matching algorithm that is frequently used is so-called kernel matching The algorithm uses the weighted means of preferably all individuals of the
comparison group to estimate the counterfactual sit-uation of an individual from the treatment group To apply this matching algorithm it has to be decided in advance how to weight the individual cases dur-ing the matching ie define the probability density function (eg a Gaussian function) and how steep the function should be (ie the slew rate) Again here is a graphic to illustrate the matching process
Figure 15 Graphical illustration of kernel matching
Treatment group cases
Comparison group cases
0 025 05 075 1
Propensity score
Treatment group cases
Comparison group cases
0 025 05
Propensity score075 1
1Weighting factor of cases
Treatment group cases
Comparison group cases
0 025 05
Propensity score075 1
Range (caliper)
Figure 15 shows that comparison group cases are weighted according to the proximity of their propen-sity score to the score of the treatment group case they should be matched with
A matching algorithm that offers a kind of compro-mise is the so-called radius matching for which only those cases of the comparison group are used for the
matching that are within a certain predefined range (also called lsquocaliperrsquo) to the treatment group case The advantage of this algorithm is that the range can be adjusted according to the number of available cases in the comparison group so that it can provide more robust findings provided sufficient cases are avail-able
Figure 16 Graphical illustration of radius matching
Treatment group cases
Comparison group cases
0 025 05 075 1
Propensity score
Treatment group cases
Comparison group cases
0 025 05
Propensity score075 1
1Weighting factor of cases
Treatment group cases
Comparison group cases
0 025 05
Propensity score075 1
Range (caliper)
Figure 16 shows that cases that lie outside a prede-fined range are discarded Since there are no gen-eral rules about how to define this range we should note that a wider range leads on the one hand to a reduced variance of the findings (ie increased robustness) on the other it also introduces more bias as lsquonot so goodrsquo matches are also used Conversely a narrower range reduces the bias but increases the variance Thus there is always a trade-off between the robustness and bias of the findings
Testing the quality of matching and calculating the treatment effects
When the matching procedures have been com-pleted it needs to be verified once again whether the above-mentioned balancing property is fulfilled A common method for doing this is to check if the dif-ference in the covariates between the treatment and comparison group has been substantially reduced which can be (amongst others) done by calculating lsquoCohens drsquo an index for comparing differences in mean values before and after matching However further methods are available for verifying the bal-ancing property that cannot be discussed in detail
57
here but can be found in the recommended litera-ture at the end of this section
After all these steps have been taken finally the treatment effects can be assessed in different ways First of all of course the sign and the magnitude of the mean differences in the outcome variables after matching provide information about the direction and size of the relevant effect Furthermore one-sided T-tests can be performed for checking if the treatment effects are significant
Sensitivity analysis
The last step to provide for a distinct attribution of the observed effects to an intervention is to assess the robustness of the findings against unobserved confounding factors To do this a sensitivity analy-sis needs to be conducted eg based on the so-called Rosenbaum Bounds (RBs) that make it possible to estimate how strongly a confounding factor would need to bias the selection process in order to com-promise the robustness of the estimated treatment effect RBs represent the limits within which treat-ment effects are considered significant Estimation of the RBs is based on the assumption that with an increasing positive or negative selection treatment effects are respectively over- or underrated This also means that the probability of a positive treatment effect decreases with positive selection and increases with a negative selection There are further indexes such as the Hodges-Lehmann estimator (ie for esti-mating the minimum treatment effect to be consid-ered as significant) that can be used to further hedge the findings of the sensitivity analysis
Unfortunately since the calculation of these estima-tors requires a substantial statistical background they cannot be discussed here in detail However sta-tistical programs such as SPSSreg or STATAreg provide particular modules for these estimators which make it possible also for laypeople to perform the required calculations (provided they have understood the sense and benefit of such an analysis)
54 Fixed-effects random-effects models and time-series cross-section analysis
Fixed-effects models (FEM) are used to estimate the impact of a particular independent variable (eg treatment framework condition) that varies over time on individual outcomes (eg income health status) It is based on the assumption that these outcomes correlate with that independent vari-able Thus FEM can reveal the relationship between
predictor and outcome variables within an analyti-cal entity giving consideration to time-invariant individual characteristics that potentially affect the impact of these predictor variables (eg profession on income or gender on nutrition) These characteristics are considered to be time-invariant unique to the analytical entity and not to be correlated with other individual characteristics In that case the treatment effect on the outcome variable of interest can be esti-mated by regressing the individual outcomes as cal-culated with the following formula
Whereby stands for the dependent outcome variable of interest with representing its analytical entity and the point in time when the data is col-lected is the value of the independent variable for this entity at that time the coefficient for the inde-pendent variable the invariant individual char-acteristic that affects the outcome and the error term for other unobserved factors that vary over time With that model all time- invariant differences between the analytical entities are controlled so that it can be used to identify the causes of observed changes of an analytical entity over time
In contrast to FEM the random-effects model (REM) is based on the assumption that variations in the individual outcomes of the entities are random and uncorrelated with the predictor variables Accord-ingly the REM should be used if it is assumed that differences across entities influence the depend-ent outcome variable Thus the formula has to be amended by adding a second error term that expresses this difference
As the application of REM requires that the second error term does not correlate with the predictor vari-able individual characteristics that potentially have an influence on the predictor variables need to be specified Accordingly omitting relevant variables in the model may lead to biased findings
A number of tests are available for deciding which model to use in a panel analysis such as the so-called Hausman test which tests whether correlates with the regressors the Pasaran cross-sectional dependence test or serial correlation tests As the test procedures cannot be discussed in detail in this Guidebook further references are provided in the literature list at the end of this section Furthermore it has to be added that for both STATAreg and SPSSreg do-file respectively syntax templates are available that can perform such tests on suitable data sets
5 A
nnex
Impa
ct E
valu
atio
n G
uide
book
for C
limat
e Ch
ange
Ada
ptat
ion
Proj
ects
58
Another lsquopanel-likersquo approach for long-term impact assessment is the so-called time-series cross-section (TSCS) analysis Similar to the panel analysis the TSCS analysis is based on data being collected over time from the same analytical units However in contrast to the former approach conclusions made with TSCS analysis are limited to the sample ie are not transferable to another population without fur-ther ado Another difference is that while the panel analysis requires a large sample but also works with a few observations (at least three) TSCS Analysis works with a small number of analytical entities but requires more observations (at least about 10) in order to provide robust findings Due to these fea-tures TSCS analysis is mainly used for policy studies with macro data and analytical entities such as sec-tors countries or regions As one the one hand the statistical fundamentals of TSCS analysis are quite complex and on the other hand the approach is not (yet) very popular for project evaluations it will not be discussed here in detail
However the following literature reference list gives some recommendations for further reading on this subject too
Beck N (2006) Time-SeriesndashCross-Section Methods New York New York University
Beck N (2001) Time-SeriesndashCross-Section Data What Have We Learned in the Last Few Years San Diego University of Califor-nia
Beck N Katz JN (1995) What to do (and not to do) with Time-Series Cross-Section Data The American Political Science Review 89(3)634 ndash 647
Girosi F King G (2001) Time Series Cross-Sec-tional Analyses with Different Explanatory Variables in Each Cross-Section Cambridge Harvard University
Wooldridge JM (2010) Econometric Analysis of Cross Section and Panel Data Cambridge The MIT Press
55 Structural equation modelling
As outlined in Section 316 structural equation models consist of latent constructs and empirically measurable indicators With regard to the operation-alisation of the constructsvariables two types of measurement models can be distinguished models based on reflective indicators and those based on formative indicators While reflective indicators are defined by their construct (eg construct sportiness
rarr indicator time needed to run 100 metres) forma-tive indicators define the construct (eg indicator number of training modules per month rarr construct sportiness) Accordingly reflective indicators have to correlate with each other while formative ones do not necessarily have to do so (eg time needed to run 100 500 1000 metres vs number of running mod-ules number of swimming modules etc) Another difference between reflective and formative con-structs is that reflective indicators are replaceable (eg time taken to run 100 metres time taken to cycle 1 km) while an exchange of formative indicators would result in a modification of the construct (eg number of maths lessons instead of training mod-ules)
Before the causal relationship between the con-structs can be analysed the validity of the measure-ment models ie how well the indicators opera-tionalise a construct needs to be checked Due to the above-mentioned differences the analysis of reflective and formative indicators differs As reflec-tive measurement models correspond to an explora-tive factor analysis (main component analysis) their validity is assessed on the basis of the factor loadings (should be ge0707) their significance its reliability (composite reliability r should be gt07) and the aver-age explained variance of the construct (should be gt05) Furthermore a reflective measurement model is considered valid if the explained variance of a construct is higher than each squared correla-tion between this and any other construct (lsquoFornell-Larker-Criterionrsquo ie discriminatory validity) Forma-tive measurement models correspond to a multiple regression Accordingly their quality is assessed on the basis of the factor weights their significance and the co-linearity of the indicators (ie the so-called variance inflation factor should be lt10)
Concerning the number of indicators required to describe a construct it has to be considered that there is a trade-off between the reliability of the measurement and the danger of creating artefacts which biases the construct (eg overrepresentation of physical indicators when measuring the health sta-tus) Furthermore the sample size should be consid-erably larger than the number of indicators
While the measurement model specifies the rela-tionship between the latent constructs and their indicators the structural model describes the influ-ence of the constructs on each other These influ-ences are graphically marked by arrows which rep-resent assumed causal relationships The direction of the arrow indicates the direction of causality ie defines what is the cause and what is the effect In principle both the number of constructs and the number of (estimated) causal relations are unlimited This also means that a construct can be both affected
59
by one or more constructs and affect another one or more others
The relationship between two constructs is expressed by the so-called path coefficient which ranges from -1 (perfect negative relationship) to 1 (perfect positive relationship) A value of 0 may indi-cate that there is no statistical relationship between two constructs While a high value of is preferable in practice values higher than 04 (respectively lt-04) can be considered as very high It has to be added that SEM makes it possible to calculate not only direct effects but also indirect and total effects
The path coefficient can be calculated in two dif-ferent ways ie by means of co-variance analysis or variance analysis each having some advantages and disadvantages Although the theoretical founda-tions of the two methods cannot be discussed here in detail the main aspects that help decide which one to choose are summarised in the following table
Table 8 Decisive aspects for choosing co-variance or variance analysis 30
Co-variance analysis Variance analysis
Preferred method for analysing established theories and testing hypotheses
Preferred method in explorative studies ie if the causal relations between the constructs are not yet substantiated
Works best with large sample sizes (n gt100)
Also works with smaller sample size (n gt30)
Method of choice if statistical quality criteria1 are preferred for assessing the validity of the model
Method of choice if the model is validated nomologically
Available software eg AMOSreg LISRELreg
Available software eg SmartPLSreg
As the table shows variance analysis might be the preferred choice for evaluations since they are usu-ally explorative in nature and constructs that char-acterise the objectives of an intervention are more likely to be based on formative measurement mod-els The smaller required sample size also speaks for the use of variance analysis However the fact that no statistical indexes are available to assess the validity of variance analysis-based structural mod-els means that the researcher applying this method needs to have comprehensive knowledge about the system conditions and the causal linkages between its elements
Nevertheless variance analysis also provides indi-ces for assessing the contribution of an intervention
30 Adapted from Jahn 200716
to an observed effect such as the above-mentioned path coefficient (should be gt02) its significance and the effect strength (fsup2 weak gt002 average gt015 strong gt035) Furthermore the model fit (Rsup2 small gt02 average gt033 substantial gt067) indicates the informative value of the model (ie how far the inde-pendent constructs explain the variance of the indi-vidual constructs)
As also shown in the table meanwhile a number of user-friendly computer programs are available for calculating structural equation models at least on the basis of variance analysis While in principle even people with a limited methodological background can operate such software (at least it provides plausi-ble findings) it is not recommended to do so because incorrect theoretical assumptions or setting wrong parameters for calculating the quality criteria can lead to biased or even completely false findings
56 Calculating sample sizes for probability sampling
This section outlines three different ways to cal-culate the sample size depending on the available information about the basic population In the first example the size of the basic population is known but the true value of a certain dichotomous charac-teristic (ie can have two values eg whether or not a beneficiary applied an improved farming technique) is not In this case the required sample size can be calculated simply according to the formula
Whereby is the required sample size is the size of the basic population and is the desired margin of error So assuming the basic population amounts to 1000 persons and the desired margin of error is 005 then the minimum sample size would be
10001000 ∙ 005
1000
This means data from a minimum of 286 randomly selected respondents would be needed for the survey
5 A
nnex
Impa
ct E
valu
atio
n G
uide
book
for C
limat
e Ch
ange
Ada
ptat
ion
Proj
ects
60
An alternative way to calculate the minimum sam-ple size for large populations ndash even if the exact size of the basic population is not known ndash is illustrated next In this case it is advantageous to have a good estimate of the true value of an observed characteris-tic of interest (eg gender distribution)
Thereby is the area under the normal curve corre-sponding to the defined level of confidence and is the true share of the population that displays a cer-tain characteristic (eg is female)
For most common levels of confidence equals as follows
90 = 164595 = 196099 = 2575999 = 3290
eg for a population in which 48 are female and the desired margin of error is 005 the minimum sample size would be
196 ∙ 048 ∙005
0958900025
However if the actual share of the basic population that features a certain characteristic of interest (eg percentage of beneficiaries who have adopted a new farming technique or not) is not known it is always safe to assume a 50 share as then the term bull (1 - ) and accordingly the entire formula reaches its maximum
If the size of the basic population is known and if it is smaller than approximately 50000 one can still use the latter formula in a first step but reduce the sam-ple size in a second step by applying the following correction term
Whereby is the required sample size as calculated above Assuming that the basic population only com-prises 1000 persons then the minimum sample size would be
384
1000
3841383
So according to this correction term it is acceptable to reduce the sample size by 106 respondents which equals a reduction of more than a quarter
It must however be kept in mind that the sample sizes provided in these formulas corresponds to the actual number of necessary completed question-naires Accordingly when planning a survey the non-response rate has to be considered as well The rate indicates the share of those who do not par-ticipate in the survey despite being selected for the sample This needs to be compensated to assure that the sample remains large enough to achieve the desired level of confidence and margin of error So if for example a sample size of 500 is required and it is assumed that only 80 might answer the number of respondents needs to be increased to at least 625
Furthermore it has to be considered that if the sur-vey is part of an experimental or quasi-experimental design data need to be collected not only for the treatment group but also for a comparison group Therefore when applying PSM the comparison group sample needs to be considerably bigger than the treatment group sample ndash ideally about two to three times the size ndash in order to assure that suf-ficient cases are available for matching during data analysis (cf 312)
61
57 Literature
Bours D et al (2014) Guidance Note 1 Twelve Rea-sons why Climate Change Adaptation MampE Is Challenging httpwwwseachangecoporgsitesdefaultfilesdocuments2014200120SEA20Change20UKCIP20GN1201220Reasons20why20CCA20MandE20is20challengingpdf
Bours D et al (2014) Guidance Note 2 Selecting Indicators for Climate Change Adaptation Pro-gramming httpwwwseachangecoporgsitesdefaultfilesdocuments2014200120SEA20Change20UKCIP20GN220Selecting20indi-cators20for20CCA_0pdf
Bours D et al (2014) Guidance Note 3 Theory of Change Approach to Climate Change Adaptation Programming httpwwwseachangecoporgsitesdefaultfilesdocuments2014200220SEA20Change20UKCIP20GN320ToC20approach20to20CCA20programmingpdf
Bours D et al (2014) Monitoring and Evaluation for Climate Change Adaptation and Resilience A Syn-thesis of Tools Frameworks and Approaches Sec-ond Edition httpwwwseachangecoporgsitesdefaultfilesdocuments20142005201520SEA20Change20UKCIP20Synthesis20Report202nd20editionpdf
Bours D et al (2014) Design Monitoring and Evalu-ation in a Changing Climate Lessons Learned from Agriculture and Food Security Programme Evaluations in Asia httpwwwseachangecoporgsitesdefaultfilesdocuments2014200520SEA20Change20UKCIP20ER120Agriculture20and20food20security_0pdf
Bours D et al (2014) International and donor agency portfolio evaluations trends in monitor-ing and evaluation of climate change adapta-tion programs httpwwwseachangecoporgsitesdefaultfilesdocuments2014200620SEA20Change20UKCIP20ER220CCA20MandE20trends20from20porfolio20evalu-ations_0pdf
Conway D amp Mustelin J (2014) Strategies for improving adaptation practice in developing countries Nature Climate Change 4339-342
Cordero C (2014) Case Study Working with the Vulnerability Sourcebook in Chullcu Mayu Bolivia News GIZ httpwwwgizdeexpertisehtml15486html
Dinshaw A et al (2014) Monitoring and Evaluation of Climate Change Adaptation Methodological Approaches OECD Environment Working Paper No 74 OECD Publishing
Ford JD et al (2013) How to track Adaptation to Climate Change A typology of Approaches for National-Level Application Ecology and Society 18(3)40
Ford J D amp Berrang-Ford L (2015) The 4Cs of adap-tation tracking consistency comparability com-prehensiveness coherency Mitigation and Adap-tation Strategies for Global Change 1-21
Fischerova G (no date) Strategic Initiatives to Address Climate Change in LDCs (Boots on the Ground) Integrating Climate Change Risks into Development Planning and Programming UNDP Bratislava Regional Centre (PowerPoint Presenta-tion)
Foumlrch W et al (2014) Back to Baselines Measuring Change and Sharing Data Agriculture and Food Security 2014 313 httpwwwagricultureand-foodsecuritycomcontentpdf2048-7010-3-13pdf
Garcia JR amp Zazueta A (2015) Going Beyond Mixed Methods A Systems Perspective for Ask-ing the Right Questions Institute of Develop-ment Studies httponlinelibrarywileycomdoi1011111759-543612119epdf
German Federal Ministry for Economic Cooperation and Development (BMZ) (2013) Climate Finance Readiness Programme Early Action for Ambitious Goals httpwwwgizdeexpertisedownloadsgiz2013-en-climate-finance-readiness-flyerpdf
GIZ (2012) Disaster Risk Management and adapta-tion to climate change Experience from German Development Cooperation Deutsche Gesellschaft fuumlr Internationale Zusammenarbeit (GIZ) GmbH httpwwwipaccpedocen-disaster-risk-man-agement-climate-changepdf
GIZ (2013) GIZrsquos global GCF Readiness Programme Competence Centre for Climate Change Environ-ment and Climate Change Division httpwwwgizdeexpertisedownloadsgiz2013-en-climate-finance-gcfitpdf
5 A
nnex
Impa
ct E
valu
atio
n G
uide
book
for C
limat
e Ch
ange
Ada
ptat
ion
Proj
ects
62
GIZ (2013) GIZ in South Africa Programs and Pro-jects Deutsche Gesellschaft fuumlr Internationale Zusammenarbeit (GIZ) GmbH httpswwwgizdededownloadsgiz2013-en-giz-programs-pro-jects-south-africapdf
GIZ (2013) Guidelines on designing and using a results-based monitoring system (RBM system) httpswwwgiz2013-0110en-results-based-moni-toring-systempdf
GIZ (2014) Transboundary Water Management Sup-port to Cooperation on Shared Waters Deutsche Gesellschaft fuumlr Internationale Zusammenarbeit (GIZ) GmbH httpwwwgizdeexpertisedown-loadsgiz2014-en-mappe-transboundary-water-managementpdf
GIZ (2015a) The Sustainable Agricultural Programme (PROAGRO I amp II) httpproagro-boliviaorg (accessed on 22102015)
GIZ (2015b) Public Investment and Climate Change Adaptation (IPACC) project httpwwwgizdeenworldwide13314html (accessed on 22102015)
GIZ (2015c) Climate Support Programme (CSP) httpwwwgizdeenworldwide17807html (accessed on 22102015)
Hammill A et al (2013) Comparative Analysis of climate change vulnerability assessments Les-sons from Tunisia and Indonesia Competence Centre for Climate Change Deutsche Gesellschaft fuumlr Internationale Zusammenarbeit httpsgc21gizdeibtvarappwp342deP1443wp-contentuploadsfilebasevavulnerability-guides-man-uals-reportsComperative-analysis-of-climate-change-vulnerability-assessmentspdf
Hedger MM (2008) Desk Review Evaluation of Adaptation to Climate Change from a Develop-ment Perspective Institute of Development Stud-ies httpswwwclimate-evalorgsitesdefaultfileseventsalexandriaIDS_Report_on_Evaluat-ing_Adaptation_for_GE_publication_versionpdf
IIED (2015) Capacity Strengthening in Least Deve-loped Countries (LDCs) for Adaptation to Climate Change (CLACC) httpwwwiiedorgcapacity-strengthening-least-developed-countries-for-adaptation-climate-change-clacc (accessed on 22102015)
Karkoschka O et al (2013) Guidance for Integrat-ing Monitoring and Evaluation of Climate Change Adaptation into Strategies in Mongolia Deutsche Gesellschaft fuumlr Internationale Zusammenarbeit httpwwwseachangecoporgsitesdefaultfilesdocuments2013200720GIZ20-20Guid-ance20for20Integrating20M26E20of20CCA20into20Strategiespdf
Lamhauge N et al (2012) Monitoring and Evaluation for Adaptation Lessons from Development Coop-eration Agencies OECD Environment Working Paper No 38 OECD Publishing httpwwwoecd-ilibraryorg docserverdownload5kg20mj6c2bwpdfexpires=1425238023ampid=idampaccname=guestampchecksum=77BA5587F2D7AD9EF6C22B614A36C4D4
Leighton M et al (2011) Climate Change and Migra-tion Rethinking Policies for Adaptation and Disaster Risk Reduction No 152011 United National University - Institute for Environment and Human Security httpswwwehsunuedufileget8468
Leiter T (2015) Linking Monitoring and Evaluation of Adaptation to Climate Change across Scales Avenues and Practical Approaches In D Bours P Pringle amp C McGinn (Eds) Monitoring and Evalu-ation of Climate Change Adaptation A review of the landscape New Directions for Evaluation 147 117-127
OECD (2011) Handbook on the OECD-DAC Cli-mate Markers httpwwwoecdorgdacstats48785310pdf
OECD (2014) OECD DAC Statistics Aid to Climate Change Adaptation March 2014 Version 2 httpwwwoecdorgdacenvironment-developmentAdaptation-related20Aid20Flyer20-20March20201420v2pdf
Olivier J et al (2013) Adaptation made to measure A Guidebook to the Design and result-based moni-toring of climate change adaptation projects 2nd Edition Deutsche Gesellschaft fuumlr Internationale Zusammenarbeit (GIZ) GmbH httpsgc21gizdeibtvarappwp342deP1443wp-contentuploadsfilebasememe-guides-manuals-reportsGIZ-2013_Adaptation_made_to_measure_second_editionpdf
63
Prowse M et al (2010) Impact Evaluation and Intervention to address Climate Change A Scop-ing Study International Initiative for Impact Evaluation Working Paper 7 httpswwwclimate-evalorgsitesdefaultfilesevalua-tions53020Impact20Evaluation20and20Interventions20to20Address20Climate20Change20-20A20Scoping20Studypdf
Sanahuja H E (2011) A Framework for Monitoring and Evaluating Adaptation to Climate Change Community of Practice Global Environment Facility httpswwwclimate-evalorgsitesdefaultfilesstudiesClimate-Eval20Frame-work20for20Monitoring20and20Evalua-tion20of20Adaptation20to20Climate20Changepdf
Sara Orleans Reed et al (2014) Resilience projects as experiments implementing climate change resil-ience in Asian cities climate and development Published by Taylor amp Francis httpwwwtand-fonlinecomdoifull101080175655292014989190VPZRBvmG-NM
Scholze M (2013) Country Experiences with Main-streaming Adaptation ndash from Programme to National Level Webinar httpsgc21gizdeibtvarappwp342deP1443wp-contentuploadsfilebasems mainstreaming_webinareCoun-try_experiences_with_mainstreaming_adapta-tion_national_levelpdf
Schwartzendruber F (2014) Evaluation of NRM interventions linked to climate change A scoping study Draft version httpswwwclimate-evalorgsitesdefaultfilesstudiesNRM-Study-Draftpdf
Smit B amp Pilifosova O (2010) Adaptation to Climate Change in the Context of Sustainable Develop-ment and Equity httpswwwvieunuedufileget9995pdf
Smith JB Vogel J M and Cromwell J E (2009) An architecture for government action on adaptation to climate change An editorial comment Climatic Change 9553-61
UNDP (2009) Thematic Area Scaling up local and community-based actions UNDP Community Based Adaptation httpsunfcccintfilesadapta-tionapplicationpdfundp_ap_update_sep_09_cba_1_sppdf
UNDP (2011) Achievements in 2011 Strategic Initia-tive to Address Climate Change in Least Devel-oped Countries Boots on the Ground Report httpwwwundporgcontentdamundplibraryEnvironment20and20EnergyCli-mate20Change2011-Boots-on-the-Ground-Reportpdf
UNDP (2011) Brochure on Strategic Initiative to Address Climate Change in LDCs httpwwwundporgcontentdamundplibraryEnviron-ment20and20EnergyClimate20ChangeCapacity20DevelopmentFlyer20for20Boots20on20the20Ground_Final_rev20rcpdf
UNDP (2013) UNDP support to LDCs to Access Finance for Adaptation Basic Facts and Figures httpundp-almorgsitesdefaultfilesdown-loadsoverview_of_undp_ support_to_ldcs_to_access_finance_for_adaptation_-_nov_2013pdf
UNDP (2015a) Community-Based Wetland Manage-ment Project (BIRAM) httpwwwundp-almorgprojectsspa-cba-bangladesh-community-based-wetland-management-project-biram (accessed on 22102015)
UNDP (2015b) National Adaptation Plan Global Support Programme (NAP-GSP) httpwwwundp-almorgprojectsnaps-ldcs (accessed on 22102015)
UNDP (2015c) Pacific Integrated Water Resource Management (IWRM) project httpwwwtand-fonlinecomdoipdf10108019439341003786729 (accessed on 22102015)
Villanueva P S (2011) Learning to Adapt Monitor-ing and Evaluation Approaches in Climate Change Adaptation and Disaster Risk Reduction ndash Chal-lenges Gaps and Ways Forward httpr4ddfidgovukPDFOutputsClimateChangeSCR-Dis-cussionPaper9--Learning-to-ADAPTpdf
Wuumlrtenberger L (2013) GCFit GIZrsquos Global GCF Readiness Programme Deutsche Gesellschaft fuumlr Internationale Zusammenarbeit (GIZ) GmbH httpwwwcaribankorguploads201305GIZC2B4s-Global-GCF-Readiness-Programmpdf
5 A
nnex
Impa
ct E
valu
atio
n G
uide
book
for C
limat
e Ch
ange
Ada
ptat
ion
Proj
ects
64
Notes
65
Published by Deutsche Gesellschaft fuumlr Internationale Zusammenarbeit (GIZ) GmbH
Registered offices Bonn and Eschborn Germany
Global Project Effective Adaptation Finance (MampE Adapt)
BMZ Bonn Dahlmannstraszlige 4 53113 Bonn Germany Tel +49 (0) 228 99 535 - 0 Fax +49 (0) 228 99 535 - 3500
BMZ Berlin Stresemannstraszlige 94 10963 Berlin Germany Tel +49 (0) 30 18 535 - 0 Fax +49 (0) 30 18 535 - 2501
poststellebmzbundde wwwbmzde
Friedrich-Ebert-Allee 36 + 40 53113 Bonn Germany Tel +49 (0) 228 44 60 - 0 Fax +49 (0) 228 44 60 - 1766
Dag-Hammarskjoumlld-Weg 1-5 65760 Eschborn Germany Tel +49 (0) 6196 79 - 0 Fax +49 (0) 61 96 79 - 1115
climategizde wwwgizdeclimate
In cooperation with UNDP Center for Evaluation CEVAL
Autors Stefan Silvestrini Ines Bellino Susanne Vaumlth
Design and layout Ira Olaleye Eschborn Germany
Photo credits Title page copy Ranak Martin
As at September 2015
GIZ is responsible for the content of this publication
On behalf of Federal Ministry for Economic Cooperation and Development (BMZ) Special Unit lsquoClimatersquo
Addresses of the BMZ offices
- Impact Evaluation Guidebook for Climate Change Adaptation Projects
-
- Content
-
- List of figures
-
- Figure 1Flow chart for implementing an RIE
- Figure 2Illustration of the pipeline approach
- Figure 3Selection of individuals for comparison
- Figure 4Outcome scores before and after intervention
- Figure 5Generic layout of a structural equation model
- Figure 6Decision tree for selecting an evaluation design for measuring impacts at individual level
- Figure 7Decision tree for selecting an evaluation design for measuring impacts at institutional and system level
- Figure 8Distribution of sample mean values in relation to the true population mean value
- Figure 9Simplified SEM for the GIZ projectthinspthinsp33
- Figure 10Draft schedule for impact monitoring and evaluation framework
- Figure 11Calculation of the net treatment effect in an experimental or quasi-experimental design
- Figure 12PSM sequence
-
- List of tables
-
- Table 1Exemplary data collection plan
- Table 2Example table for matching on observables
- Table 3Required project characteristics and data
- Table 4Example of question types
- Table 5Exemplary to-do list for preparing a survey
- Table 6Applicability of evaluation designs
- Table 7Draft (simplified) data collection plan
- Table 8Decisive aspects for choosing co-variance or variance analysisthinsp
-
- List of abbreviations
- Glossary
-
- Executive Summary
- 1Introduction
-
- 11How to use the Guidebook
- 12How to plan and implement an RIE for CCA projects
-
- 2Evaluating climate change adaptation projects
-
- 21Types and key features of climate change adaptation projects
-
- 211Adaptation projects addressing the individual level
- 212Adaptation projects addressing the institutional level
- 213Adaptation projects addressing the systemic level
-
- 22Key challenges of climate change adaptation projects
- 23Review of current methods to evaluate the results of CCA projects
-
- 3Rigorous evaluation designs and examples of applicability in climate change adaptation projects
-
- 31Overview of evaluation designs ndash potentials and limitations for climate change adaptation projects
-
- 311Experimental and quasi-experimental designs
- 312Matching techniques
- 313Pipeline approach
- 314Regression discontinuity design
- 315Time-series designs
- 316Structural equation modelling
- 317Summary
-
- 32Providing reliable large-scale data
-
- 4Case study Urban Management of Internal Migration due to Climate Change
-
- 41Background and project objectives
- 42Practical implementation
-
- 5Annex
-
- 51Overview of current CCA related-project evaluations
- 52Calculation of net average treatment effect with double-difference approach
- 53Propensity score matching (PSM)
- 54Fixed-effects random-effects models and time-series cross-section analysis
- 55Structural equation modelling
- 56Calculating sample sizes for probability sampling
- 57Literature
-
- Publishing information
-

Impa
ct E
valu
atio
n G
uide
book
for C
limat
e Ch
ange
Ada
ptat
ion
Proj
ects
4
Glossary
Accountability Obligation to demonstrate that work has been conducted in compliance with agreed rules and stand-ards or to report fairly and accurately on performance results vis-agrave-vis mandated roles andor plans This may require a careful demonstration that the work is consistent with the contract terms
Adaptation Adjustment in natural or human systems in response to actual or expected climatic stimuli or their effects which moderates harm or exploits beneficial opportunities Various types of adaptation can be distinguished including anticipatory autonomous and planned adaptation Anticipatory adaptation ndash Adaptation that takes place before impacts of climate change are observed Also referred to as proactive adaptation Autonomous adaptation ndash Adaptation that does not constitute a conscious response to climatic stimuli but is triggered by ecological changes in natural systems and by market or welfare changes in human systems Also referred to as spontaneous adaptation Planned adaptation ndash Adaptation that is the result of a deliberate policy decision based on an aware-ness that conditions have changed or are about to change and that action is required to return to maintain or achieve a desired state
Adaptive capacity
The ability of a system to adjust to climate change (including climate variability and extremes) to moderate potential damages to take advantage of opportunities or to cope with the consequences
Attribution Ascribing the cause of an effect (change) to a specific intervention An approach to () rigorous impact evaluation that concerns clear cause-effect relationships ie establishing causal links and drawing explanatory conclusions about observed changes (whether anticipated or not) and the con-cerned intervention Focusing on clear causation implies considering the () counterfactual to assess the () net impact of an intervention by a comparison of what has occurred with the intervention implemented (the factual) with the situation without the intervention (the counterfactual)
Climate change
Climate change refers to any change in climate over time whether due to natural variability or as a result of human activity This usage differs from that in the United Nations Framework Convention on Climate Change (UNFCCC) which defines lsquoclimate changersquo as lsquoa change of climate which is attrib-uted directly or indirectly to human activity that alters the composition of the global atmosphere and which is in addition to natural climate variability observed over comparable time periodsrsquo
Counterfactual The situation that would have happened if the intervention had not taken place (lsquowithoutrsquo situation) As the counterfactual is not directly observable the unobservable potential outcome of the counter-factual situation is estimated via the situation of an equivalent control comparison group that is not affected by the intervention This is done using () randomised controlled trials (RCT) or () quasi-experimental designs
Evaluability Extent to which an activity or a programme can be evaluated in a reliable and credible fashion
Experimental design
A study in which individuals (or groups of individuals) are randomly allocated (by chance alone) to an intervention group (treatment) or a control group (not being part of the intervention) Experimental studies ( RCTs) seek to measure an interventionrsquos () net impact by comparing the two groupsrsquo situations before and after the intervention ( attribution)
Exposure The nature and degree to which a system is exposed to significant climatic variations
Factual The observed outcome of an intervention (lsquowithrsquo situation) ( counterfactual)
Impact 1 Positive and negative primary and secondary long-term effects produced by an intervention directly or indirectly intended or unintended ( net impact)
Impact evaluation
An evaluation that looks beyond the immediate results of an intervention project programme or policy Impact evaluations may focus (i) on higher outcomes rather than intervention outputs (ii) on longer-term results (iii) on a group of interventions within a given sector or geographical area or (iv) explicitly on the impacts produced by an intervention ie attributing impacts to an intervention ( Rigorous impact evaluation)
Monitoring A continuing function that uses systematic collection of data on specified indicators to provide management and the main stakeholders of an ongoing development intervention with indications of the extent of progress and achievement of objectives and progress in the use of allocated funds
1 For GIZ colleagues a brief explanation of how this impact definition fits into GIZrsquos results model (GIZ 2013) The results model is an ex-pression of GIZrsquos Managing for Development Results approach The results model forms the detailed basis for GIZrsquos subsequent operation-al planning and for establishing the results-based monitoring system at the start of implementation Within this model GIZ understands results as the lsquointended or unintended positive or negative changes in a situation or behaviour as the direct or indirect consequence of an interventionrsquo Results include impacts outcomes and outputs Impacts are defined as lsquothe long-term overarching development results They are usually located at the level of the development cooperation programme objectiversquo This definition largely corresponds to the one used in this document However at some points in this publication the authors use the term lsquoimpactrsquo synonymously with the term lsquooutcomersquo when applied to GIZrsquos results model Within GIZ outcomes are defined as the lsquoexpected or actually achieved direct short-term and medium-term results of a measurersquos outputsrsquo
5
Net impact Effects exclusively produced by an intervention (without effects caused by other possible external causes) effects that can be () attributed to a specific intervention by clear () causation The net impact (b-c) is the difference between what has occurred with the intervention implemented (b-a) the () factual and the situation without the intervention (c-a) the () counterfactual
after intervention
beforeintervention
netimpact
bb
cc
aagrossimpact
change with intervention
change without intervention
impa
ct in
dica
tor
time
Technically speaking the net impact is defined as fol-lows an effect caused by a treatment (intervention) is the difference between the outcome under a treat-ment (T=1) minus the alternative outcome that would have happened without the treatment (T=0)
Partial least squares analysis
A multivariate statistical approach for the estimation of causal relationships It is a variance-based non-linear (ie no assumptions regarding the value distribution of a variable required) iterative method based on a linear regression model It allows the estimation of concrete values for latent (ie non-observablemeasurable) constructs with the help of manifest (ie observablemeasurable) indi-cators
Quality (rigorous) impact evaluations
As there is (i) a mistaken belief that () rigorous impact evaluations have to use () randomised con-trolled trials (RCTs) on the one side and (ii) the fact that most rigorous impact evaluations are being carried out by economists and econometricians (not evaluators) resulting in technically competent studies but not automatically very good evaluations on the other side more and more the term lsquoqual-ityrsquo impact evaluation is used to avoid misunderstanding and to focus on quality
Quasi-experimental designs
An attempt to uncover a causal () attribution even though a random pre-selection processes is not possible A quasi-experimental design is a type of experimental design ( RCT) where a randomised control group could not be established for either ethical or practical reasons and therefore the inter-vention grouprsquos situation is compared with those of a similar group of individuals not receiving inter-vention activities (comparison group)
Randomised controlled trial (RCT)
An () experimental study in which individuals (or groups of individuals) are randomly allocated (by chance alone) to an intervention group (treatment) or a control group (not being part of the interven-tion) RCTs seek to measure an interventionrsquos () net impact by comparing the two groupsrsquo situations before and after the intervention ( attribution)
Resilience The ability of a social or ecological system to absorb disturbances while retaining the same basic structure and ways of functioning the capacity for self-organisation and the capacity to adapt to stress and change
Rigorous impact evaluation
An () impact evaluation with strong emphasis on lsquoproduced byrsquo focusing on clear causationcausal attribution by establishing the counterfactual Assessing the effects produced by an intervention the () net impact requires a comparison of what has occurred with the intervention implemented ndash ie the () factual ndash with the situation without the intervention ndash ie the () counterfactual The term lsquorigorousrsquo is added to differentiate this approach from many ndash more traditional ndash () impact evalua-tion approaches
lsquoRigorisedrsquo impact evaluation
A () rigorous impact evaluation conducted in a real-life situation where necessary conditions are not (fully) given and which is therefore conducted as rigorously as is feasible
Sensitivity Sensitivity is the degree to which a system is affected either adversely or beneficially by climate vari-ability or change The effect may be direct (eg a change in crop yield in response to a change in the mean range or variability of temperature) or indirect (eg damages caused by an increase in the fre-quency of coastal flooding due to a rise in sea level)
Vulnerability Vulnerability is the degree to which a system is susceptible to and unable to cope with adverse effects of climate change including climate variability and extremes Vulnerability is a function of the char-acter magnitude and rate of climate change and variation to which a system is exposed its sensitiv-ity and its adaptive capacity
Glossary
Impa
ct E
valu
atio
n G
uide
book
for C
limat
e Ch
ange
Ada
ptat
ion
Proj
ects
6
Executive Summary
Phot
o copy
GIZ
Gue
nay
Ulu
tunc
ok
Monitoring and evaluating impacts is usually both costly and laborious Often it is also a challenging process particularly when complex causal linkages or uncertain framework conditions are involved All of this applies to climate change adaptation (CCA) projects which present further methodological and practical challenges that complicate the assessment of concrete adaptation results However provid-ing evidence about the impact of an intervention is often indispensable when it comes to generating knowledge about what works and what doesnrsquot ini-tiating organisational learning processes monitoring the progress made or simply being accountable for the use of resources This Guidebook seeks to sup-port project managers by providing an overview of different impact evaluation methods and how they can be applied to climate change adaptation projects The application of the Guidebook is further illustrated by a case study of an adaptation project in Bangladesh
Evaluations and rigorous impact evaluations ndash Whatrsquos the difference
While many evaluation approaches claim to pro-vide some kind of indication about project impacts (eg most significant change approach participatory rapid assessment) robust evidence can only be pro-vided by sophisticated evaluation designs that com-ply with scientific standards and are based on valid empirical data Evaluations that use such sophisti-cated designs and involve the collection of a consid-erable amount of empirical data are also called rig-orous impact evaluations (RIEs) The advantage of RIEs in contrast to lsquosofterrsquo designs is that they make it possible to clearly attribute observed changes to a particular intervention or at least make it possible to quantify the contribution an intervention has made
to these changes This Guidebook provides practi-tioners in the field of CCA with a selection of such RIE designs differentiated according to the type of impact (ie micro meso or macro-level impacts) they are able to measure
Rigorous impact evaluations (RIEs) make it possible to attribute observed changes to a particular intervention or at least quantify the contribution an intervention has made to these changes
The difficulties involved in measuring the impacts of CCA projects are widely recognised by practition-ers and the adaptation community (eg Bours et al 2014) The latter acknowledges the limited evidence on global adaptation progress and the gaps in the evolving adaptation science (FordBerrang-Ford 2015) For climate change mitigation progress can be tracked with reference to the global concentration of greenhouse gases (GHGs) For climate change adap-tation though there is no such single metric This explains the need to equip practitioners with the right methods to assess adaptation results and dem-onstrate the added value of their projects
Establishing causality on different levels
According to the OECDrsquos Development Assistance Committee (DAC) impact evaluations take into account intended and unintended positive and neg-ative as well as expected and unexpected changes They are supposed to not only provide information on all possible changes that have occurred during the implementation of an intervention but also to link these observed changes to their causes There-fore the establishment of causality (causeeffect relationship) is crucial in order to understand why particular incidents occurred during and after a pro-ject or programme In particular the question lsquoWhat would have happened without the project or pro-
7
grammersquo needs to be investigated in detail At this point a so-called counterfactual assessment (ie the comparison between what actually happened and what would have happened in the absence of the intervention) must be considered Since it is impos-sible to collect data on what would have happened if the intervention had not been implemented many RIEs are based on designs that include comparison data ie on individuals in a similar situation who were not exposed to the intervention
The RIE designs presented in this Impact Evaluation Guidebook are differentiated according to the type of impact they are able to measure ie
y micro (individual) y meso (institutional) or y macro (systemic)-level impacts
The aim of the Guidebook is to address the challenge of producing more and better impact evaluations giving practitioners the necessary know-how in order to plan implement and steer an RIE It enables practitioners to identify which of the RIE designs are suitable for successfully evaluating their par-ticular project or programme and also reveals the respective potentials and limitations of the differ-ent designs when it comes to their application in the field of CCA
The benefit of implementing RIEs for CCA projects
Why are RIEs increasingly being considered as an option for evaluating a CCA project The Paris Dec-laration on Aid Effectiveness which calls for more and better impact evaluations has created a cer-tain amount of pressure and consequently a rising demand to use RIEs This also explains why more funding is becoming available and the literature is growing in this area During the research for this Guidebook one crucial step was to understand how CCA projects were evaluated in the past and how they are currently evaluated So far RIEs have rarely been undertaken for CCA projects Addition-ally respected independent evaluation departments have seldom implemented RIEs with counterfactu-als for CCA projects up to now Since there is limited evidence on global adaptation progress to date RIEs have the capacity to redress the situation and gen-erate learning This is because they are conducted according to scientific quality standards that
i ensure the correctness of measurement findings (reliability)
ii exclude as far as possible alternative causes for an observed finding (internal validity) and
iii shift findings from an observed sample to a larger population (external validity)
No lsquoone size fits allrsquo RIE design
The numerous (methodological) challenges faced by CCA projects have led to intensive discussion among experts on how to adequately monitor and evaluate them The main challenges are
1 the lack of a conceptual agreement on definitions including what actually constitutes successful adaptation and therefore
2 the non-existence of a universal indicator (unlike for mitigation)
3 changes in the climatic context during a projectrsquos lifetime and the related problem of shifting base-lines
4 uncertainty about actual climate change patterns and their effects and
5 the long-time horizon of potential climate change impacts (see 22 for more details)
Individually none of these challenges are unique to CCA they also exist in projects in other sectors Together though they represent a fundamental difficulty for practitioners in terms of monitoring and evaluating project impacts Since adaptation projects vary widely in their scope and in the sec-tors they cover there is no such thing as a lsquoone size fits allrsquo evaluation design Whether and which RIE design(s) are to be used depends on various factors such as the level (micro meso or macro) at which the project generates an impact the availability of data and the time and resources available to the project For example at the systemic (macro) level a climate policy that is still at an early stage of implementation and project activities that have so far mainly focused on consultations and capacity building exercises may not be appropriate for a counterfactual assessment Nonetheless most CCA projects follow a multi-level approach which implies that a combination of two or more evaluation approaches may be required to measure the total impact of a project or programme
The selection of evaluation designs presented in this Guidebook is based on two considerations Firstly the design needs to comply with scientific standards in order to produce robust findings Secondly the selected designs should cover a wide range of differ-ent project approaches and all possible impact levels In particular six types of designs are discussed in detail
y experimental and quasi-experimental designs y matching techniques
Executive Summ
ary
8
y pipeline approach y regression discontinuity design (RDD) y time-series designs and y structural equation modelling (SEM)
Which evaluation design to choose ndash creating evidence at the individual level
At the individual level if a baseline is available (ex-ante and ex-post data from both the treatment and control group) three evaluation designs can be con-sidered for evaluating the CCA project an experi-mental quasi-experimental or regression disconti-nuity design
In an experimental design also known as a ran-domised controlled trial (RCT) a treatment and control group are compared with each other at two points in time ndash before and after the intervention ndash in order to estimate the counterfactual (what would have happened in the absence of the intervention) To be classified as an lsquoexperimentalrsquo design the ben-eficiaries need to be randomly selected during the planning phase of a project ie each person has the same chance of being a member of either the control or the treatment group If a random selection cannot be realised (eg due to self-selection bias or conscious selection) then such a design is called quasi-experi-mental In that case the group without treatment is called a lsquocomparison grouprsquo This means that some kind of matching technique needs to be applied dur-ing data analysis in order to control for selection bias
Thus both experimental and quasi-experimental designs are applicable to CCA projects as long as pro-ject activities aim at creating a direct impact at indi-vidual (micro) level The use of an experimental or quasi-experimental design calls for technical logis-tical and financial resources that mainly depend on the size and accessibility of the target group The data
selection process is often quite costly since a large team of enumerators is required Moreover there are two potential biases that may emerge and ham-per the process of attributing the observed change to project activities spill-over and contagion effects The former implies that the controlcomparison group indirectly receives a benefit from the project or programme and the latter occurs when differ-ent factors (eg projects operated by different agen-cies) affect the situation of the target population Nonetheless in terms of study design RCTs show the highest internal validity 2 and enable the clear attribution of interventions to impacts (the latter is also true of the quasi-experimental and pipeline approach) Regression discontinuity design (RDD) is a quasi-experimental evaluation method that can be applied if beneficiaries of the project are selected based on a special characteristic (eg income) of rel-evance to the desired impact that distinguishes them from the non-beneficiaries At the same time ben-eficiaries are compared with the comparison group in a number of other respects (eg location) Being a quasi-experimental design RDD does not require randomisation
If no baseline data have been collected beforehand two further evaluation designs can be considered at the individual level the pipeline approach and the panel design
The application of a pipeline approach is possible if a project is implemented sequentially (eg in dif-ferent regions) Thereby the selection of the target population that is not yet affected can serve as a quasi-comparison group for the group that is already affected It is important though that the treated groups of each phase are comparable Each data col-lection phase is just as labour-intensive and time-consuming as a quasi-experimental approach Panel designs a type of time-series design are in principle applicable for measuring impacts on all levels but require comparably larger sample sizes in order to be able to perform the necessary statistical calculations The special characteristic that differentiates the panel design from all the others mentioned above is that it requires data to be collected from identical units (eg persons households) at each point in time This makes it prone to attrition effects (ie decreasing sample sizes) over time It should also be mentioned that a panel design only makes it possible to estimate the contribution made by an intervention to observed changes but not to attribute these changes unambiguously
2 Internal validity is defined as the extent to which the variation of a dependent variable can be explained by the variation of a specific independent variable ie the extent to which alternative explana-tions for the variation of the dependent variable can be excluded
Impa
ct E
valu
atio
n G
uide
book
for C
limat
e Ch
ange
Ada
ptat
ion
Proj
ects
Phot
o copy
GIZ
Ste
inbe
rg
9
Creating evidence at institutional and system level
If an intervention aims to generate an impact at the institutional and system levels two further evalua-tion designs can be taken into account time-series designs and structural equation modelling
Time-series designs can be of particular use when it is necessary to cover longer periods than those set by a project or programme This makes them highly suitable for CCA projects where changes or results may unfold at later stages If data were collected repeatedly over a longer time period during the pro-ject time-series designs might be the best option It should be borne in mind though that these designs require a large number of repeated observations (at least about 10) in order to be able to perform the necessary statistical analyses for providing robust findings Finally if none of the designs fit structural equation modelling (SEM) could be an option for providing meaningful evidence about the impact of a project or programme It may be applied to meas-ure large-scale policy-based programmes that aim to affect an entire sector country or region SEM makes it possible to measure the statistical relation-ship between several influencing factors (eg public investments project funding disaster resilience of a population) This can be used to estimate the contri-bution of each of these factors one of which may be an intervention It should be pointed out that SEM and time-series designs only serve to estimate the contribution made by an intervention to observed changes
Conclusion and reading recommendation
The overview of available evaluation designs shows that there are several options for measuring impacts each with different potentials and limitations as well as methodological and data requirements This Impact Evaluation Guidebook provides practitioners with guidance on selecting the appropriate approach for a particular CCA project based on its characteris-tics and the available resources It also contains refer-ences to
y definitions and conclusions (blue framed boxes) y CCA project characteristics (green framed boxes) y practical tools and instruments (purple framed
boxes) y further reading material (orange framed boxes)
and y checklists summarising key issues (red framed
boxes)
Depending on the readerrsquos objective the different sections of the Guidebook may be of more or less interest However in order to obtain a comprehen-sive understanding of the subject matter we strongly recommended that you go through the lsquomust readsrsquo Section 12 which provides practical guidance for the planning and implementation of an RIE the summary at the end of Section 3 that contains an overview of the pros and cons of the different evalu-ation designs and leads you through the process of deciding which design to choose and Section 32 that focuses on the requirements for collecting large-scale quantitative data Once a particular evaluation design has been chosen the reader may consult the respective section that describes the chosen design in more detail (Sections 311 to 316) and as the case may be the further explanations in the annex If any of the technical terms or concepts are unclear the reader can consult the glossary MampE specialists who are not so familiar with the characteristics of CCA projects are advised to consult Section 2 in particu-lar Section 21 which discusses the key challenges of CCA projects with regard to their evaluation Finally the case study of an adaptation project in Bangladesh illustrates the application of this Guidebook
Phot
o copy
GIZ
Ran
ak M
artin
Executive Summ
ary
Impa
ct E
valu
atio
n G
uide
book
for C
limat
e Ch
ange
Ada
ptat
ion
Proj
ects
10
Are you planning to provide meaningful evidence of the impact of your climate change adaptation (CCA) project based on a sound empirical foundation Do you want to find out what difference it makes what changes can be observed in the field of inter-vention and how these changes are related to the project activities Or do you aim to gain knowledge about the inherent cause-and-effect relationships of a project learn from the past for the future fur-ther develop the project design or be accountable for the use of funds The decision about how to evalu-ate a project depends on a number of aspects such as the objectives of the evaluation its target groups and stakeholders or the available financial tech-nical human and time resources So the question lsquohowrsquo is closely related to several further aspects eg which design to implement which data collection instruments to apply or which analytical methods to choose
In this Guidebook we assume that you have decided to implement a rigorous impact evaluation (RIE) As the name says the focus of an RIE lies on the measurement and assessment of the impacts of a programme or project According to the OECDDAC evaluation criteria impact means any positive and negative primary and secondary long-term effect produced by an intervention directly or indirectly intended or unintended (OECDDAC 2006 6) Thus basically any observable change occurring in ndash and potentially beyond ndash a field of intervention presum-ably related to the evaluated programme or project may be subject to an RIE Another main characteris-tic of an RIE is that it aims to clearly attribute these observable changes to the intervention being exam-ined or at least to provide sufficient evidence to esti-mate the contribution the intervention has made to these changes Finally the term lsquorigorousrsquo implies that the measurement and attribution or contri-bution analysis is conducted in line with scientific quality standards This means that the findings of an RIE must meet the methodological demands that
apply to scientific research projects (ie that they should be reliable internally and externally valid and objective 3 These requirements ndash the rigorous measurement of impacts and attributioncontribu-tion analysis ndash determine the options for choosing a specific design or specific instruments and methods
As in every scientific research project the selection of the design further depends on the characteristics of the research subject With regard to impact evalu-ation the main characteristic to be considered is lsquowhat kind of impactrsquo needs to be evaluated While impact can be differentiated according to various category schemes (eg social political environmen-tal impacts) the most decisive aspect in terms of evaluation design is the lsquoaggregation levelrsquo at which it occurs This applies to climate change adaptation just as to any other field of intervention A distinction is usually made between three aggregation levels
y Individual (micro-level) impacts ie benefits or drawbacks for particular target groups (eg improving the resilience of a population to cli-mate change effects)
y Institutional (meso-level) impacts ie chang-ing the resources capacities performance etc of organisations such as enterprises governmental or non-governmental institutions (eg strength-ening the capacities of local authorities to deal with the socio-economic consequences of cli-mate change)
y Systemic (macro-level) impacts ie sectoral or regional developments (eg increasing the efforts of a government to reduce climate change-related causes of poverty or ill health)
The different accessibility of data at these levels implies that there is no lsquoone size fits allrsquo design For example while comparative analysis such as is applied in a quasi-experimental design (cf Sec-tion 311) may be suitable for measuring and assess-ing the livelihoods of climate migrants in a specified intervention area the influence on the capacities of basic urban service providers may call for the use of a structural equation modelling approach (cf Section 316) In the latter case there are many competing influences which makes it impossible to establish a comparison group (see Section 4 for an in-depth
3 Reliability internal and external validity and objectivity are count-ed among the most essential scientific quality criteria In empirical studies reliability indicates the correctness of measurement findings Internal validity means that the study design excludes alternative causes for an observed effect as far as possible while external validity means that the findings are in principle transfer-able from an observed sample to a greater population ie can be generalised Finally objectivity describes the independence of the measurement findings from their framework conditions (ie who collects the data who analyses them and under which conditions the findings are interpreted)
1 Introduction
11
discussion of this example) Given the complexity of climate change adaptation needs many CCA projects follow a multi-level approach Thus in an evalua-tion it may be necessary to combine several designs in order to assess the total effectiveness of such a project The Guidebook therefore aims to provide an operationally viable framework for evaluating CCA projects
According to this objective the structure of the Guidebook reflects the points to be considered when planning an RIE starting with a general overview of how to plan such an exercise (Section 12) This is fol-lowed by a discussion of the types and key features of CCA projects the typical challenges in the field of CCA and the way they are currently evaluated (Section 2) Section 3 presents the different options for rigorously evaluating CCA projects including references to the CCA-specific requirements and challenges outlined above The methodological pre-requisites for generating reliable empirical data on a large scale are also discussed Finally two exemplary evaluation designs are outlined on the basis of a GIZ case study (Section 4) including a brief presentation of their practical implementation The Guidebook closes with an annex containing further introduc-tions to some methodological aspects that need to be considered when designing an RIE a glossary of technical terms and further literature references
11 How to use the Guidebook
As the Guidebook aims to provide lsquohands-onrsquo infor-mation it contains a number of hints definitions practical examples links to further reading material and checklists which are highlighted as follows
Definitions and conclusions are presented in blue boxes followed by an exclamation mark
References to CCA projects are presented in green text boxes marked with a magnifying glass
Practical tools and exemplary instruments are presented in purple boxes flanked by two cogwheels
References and links to further reading material are presented in orange boxes highlighted with an open book
Checklists summarising key practical issues and recommendations for providing high- quality evaluation findings are presented in red boxes marked with a tick
Depending on the readerrsquos objective the different sections of the Guidebook may be of more or less interest However in order to obtain a comprehen-sive understanding of the subject matter we strongly recommend you to go through the lsquomust readsrsquo Section 12 which provides practical guidance for the planning and implementation of an RIE the summary at the end of Section 3 that contains an overview of the pros and cons of the different evalu-ation designs and leads you through the process of deciding which design to choose and Section 32 that focuses on the requirements for collecting large-scale quantitative data Once a particular evaluation design has been chosen the reader may consult the respective section that describes the chosen design in more detail (Sections 311 to 316) Some methodo-logical concepts discussed in these sections require some more methodological background and are therefore further explained in Annexes 52 to 56 If any of the technical terms or concepts are unclear the reader can consult the glossary MampE or evalua-tion specialists who are not so familiar with the char-acteristics of CCA projects are advised to consult Sec-tion 2 in particular Section 21 which discusses the key challenges of CCA projects with regard to their evaluation Finally the case study of an adaptation project in Bangladesh illustrates the application of this Guidebook
12 How to plan and implement an RIE for CCA projects
Letrsquos say you have decided to rigorously evaluate a CCA project How can this be done
First of all when planning such an endeavour you must realise that on the one hand an RIE needs to comply with scientific standards in order to produce valid and reliable empirical evidence of the impact of an intervention On the other hand you may face a number of obstacles such as time data and budget constraints (cf Bamberger 2004) which often make it difficult to adhere to such standards Planning any evaluation is therefore always a balancing act between fulfilling methodological demands as far as possible and keeping the evaluation feasible in practical terms To find the right lsquomiddle coursersquo it makes sense to begin the planning of an evaluation by answering a set of questions that determine its general framework
1 Introduction
Impa
ct E
valu
atio
n G
uide
book
for C
limat
e Ch
ange
Ada
ptat
ion
Proj
ects
12
Questions for determining the evaluation framework
` What is the object of the evaluation What is the scope of the evaluation in terms of observed period regions activities etc
` What are the objectives of the evaluation and which criteria will it use to assess the object of the evalua-tion
` Who are the recipients and who are the stakeholders of the evaluation ` What is the time frame of the evaluation When are the evaluation findings needed by ` Which human financial and organisational resources are available for the evaluation ` Who will implement the evaluation What qualifications and experience do the responsible persons have ` How will the evaluation be implemented What is the intended evaluation design Is it feasible with the
available resources ` Which data collection instruments and analysis methods will be applied Are the people in charge of data
collection and analysis familiar with these instruments and methods ` What tasks need to be performed during the evaluation and who will be in charge
As all of these aspects are interrelated it is crucial to answer these questions before actually start-ing to implement the evaluation For instance the scope and objectives depend on the stakeholders and recipients of an evaluation The design which determines the choice of instruments and meth-ods again depends on the available resources and qualifications and so on In view of these manifold interdependencies it makes a lot of sense to clarify document and communicate these issues among all involved stakeholders right from the outset Usu-ally when external consultants are commissioned to carry out an evaluation this is what should be out-lined in the terms of reference and agreed upon in the inception report if not before
When it comes to evaluating CCA projects some of these questions might be more difficult to answer than in other evaluations for instance the second question on the evaluation criteria Due to the lack of consensus about successful CCA (cf Section 22) it needs to be clarified right from the start what is understood by that concept in the specific context of
the project ideally in line with the project objectives Another important aspect which is not unique to the field of CCA however is the question of the sectoral expertise needed by the evaluation team Given the complexity of climate change-related issues a thor-ough understanding of the projectrsquos theory of change is a crucial prerequisite not only for data collection and analysis but also for integrating the findings into a larger (environmentaldevelopment-policy) framework particularly with regard to the projectrsquos contribution to overarching development goals (eg MDGs SDGs country development goals) Therefore it might be recommended to include a sector expert in the evaluation team who provides technical advice on assessing and interpreting the evaluation findings Finally to decide which evaluation design to choose the project characteristics need to be con-sidered (such as the uncertainty of the framework conditions in which it operates or the time frame within which its impacts can be observed) Section 3 of this Guidebook therefore provides several sugges-tions that take these and further characteristics into account
Phot
o copy
GIZ
Flo
rian
Kopp
13
Once these questions have been answered the first step of any evaluation is to develop a data collection plan (also called an evaluation matrix) structured according to the previously defined evaluation cri-teria A data collection plan is the reference docu-ment that guides the evaluation from instrument development to data analysis It provides a tabular
overview of the evaluation questions and hypotheses to be answeredtested the required indicators data sources and availability data collection instruments sampling procedures timing of the data collection data analysis methods responsibilities and required resources The following table gives an example of how such a data collection plan is usually structured
Table 1 Exemplary data collection plan
Analysis dimension
Hypothesis to be testedQuestion to be answered
Indicator Data source
Sample Data type Data collection instrument
Timing of data collection
Data analysis method
Respon-sible
Required resources
Direct outcomes
The livelihoods of climate migrants have improved
Proportion of climate migrants who have a job
Target group (climate migrants)
5 random sample of treat-ment and comparison group
Quantita-tive
Question-naire
Start of project end of project 3 years after end of project
t-test for inde-pendent samples
Evaluator no 1
1 working day (wd) for development of question-naire 2 wds for pre-testing 3 wds for implementing survey X euro for technical implementation
Income of respondent
Proportion of climate migrants who live in formal set-tlements
hellip hellip hellip hellip hellip hellip hellip hellip hellip
Working opportunities have been generated
No of working opportuni-ties
City corpo-rations
na Quantita-tive
Official statistics
Continuous monitoring
Time series analysis
Project officer
na
Types of working opportuni-ties
2 repre-sentatives of each involved city corpo-ration
Qualitative Interview with corporation representa-tives
Start of project then each 6 months update
Qualitative summary
Evaluator no 2
3 wds for conduct-ing interviews in each intervention area
Use of working oppor-tunities by target group
Target group
5 random sample of treatment group
Quantita-tive
Question-naire
End of project
Descriptive statistical analysis
Evaluator no 1
See above
Reasons for acceptance or non-acceptance of working opportuni-ties
Target group
3 groups of 6 to 10 persons in each interven-tion area
Qualitative Focus group discussion
End of project
Qualita-tive data analysis
Evaluator no 2
1 wd for conduct-ing FGD in each intervention area
hellip hellip hellip hellip hellip hellip hellip hellip
Access to health services has been improved
hellip hellip hellip hellip hellip hellip hellip hellip
hellip hellip hellip hellip hellip hellip hellip hellip hellip
hellip hellip hellip hellip hellip hellip hellip hellip hellip
Besides the construction of the indicators another important issue during the development of a data collection plan is the identification of the data sources If data is already available the question of whether they are sufficient for answering an evalu-ation question or whether additional data need to be gathered must be resolved If the available data are insufficient it needs to be decided which further data sources can be tapped and which instruments are applicable There are a number of factors to be
taken into account when deciding for or against a certain instrument including the costs incurred and the human resources and time required to complete the data collection For this it is necessary to draw up a plan of staff time and a finance which also shows who will be carrying out the respective tasks at what times and what costs will be involved The following flow chart summarises the typical sequence of an evaluation
1 Introduction
Impa
ct E
valu
atio
n G
uide
book
for C
limat
e Ch
ange
Ada
ptat
ion
Proj
ects
14
Figure 1 Flow chart for implementing an RIE
Clarication of objectives stakeholders and recipient(s) of the evaluation
Development of a data collection plan Formulation of evaluation questions
and hypotheses Development of indicators Identication of necessary data
sources
Development of survey design and data collection instruments
Data collection and quality check
Data complete
Data aggregation and analysis
Reporting Interpretation of ndings Development of conclusions
and recommendations
Data available
Yes
No
Yes
No
stakeholders need to be clarified A good starting point for considerations of this nature is provided by the feasibility standards established by the American Evaluation Association (AEA) which are intended to ensure lsquothat an evaluation is planned and conducted in a realistic prudent diplomatic and frugal wayrsquo 4
4 Cf httpwwwevalorgpcmldfid=103
During any evaluation a number of precautions need to be taken to ensure that the evaluation find-ings are not only valid and reliable but also well-understood and widely accepted Therefore all involved stakeholders should be informed that an evaluation is being conducted and why Further-more the roles and responsibilities of the different
Feasibility standards of the American Evaluation Association (AEA)
` F2 ndash Practical Procedures Evaluation procedures should be practical and responsive to the way the pro-gram operates Refers to the problem of the feasibility of scientifically ideal collection procedures with regard to the costs they incur and to ethical implications
` F3 ndash Contextual Viability Evaluations should recognize monitor and balance the cultural and political interests and needs of individuals and groups Points out the significance of taking into account the interests of all the stakeholders in a balanced way This is important since the use of the evaluation findings depends to a high degree on acceptance by the various stakeholders and because access to the relevant information often depends on peoplersquos willingness to cooperate
` F3 ndash Resource Use Evaluations should use resources effectively and efficiently Points to the necessity of taking into account the cost-benefit ratio in the implementation of evalua-tions In calculating the costs it is important to consider not only the consumption of tangible (financial) resources but also the intangible outlay (eg the use of time and deployment of human resources) though this can mostly be converted back into financial costs More difficult by far is the quantification of the ben-efit since it is not possible to provide any specific information about the expected findings in advance
15
When evaluating CCA projects it is especially impor-tant to consider the question of contextual viability as interventions may not always generate directly tangible benefits for the target groups All the more important then is to highlight the long-term objec-tives of a project when approaching the target groups for data collection Furthermore due to the usually large number of different stakeholder groups in CCA projects it may be necessary to start by iden-tifying the different needs capacities objectives and strategies of the different groups as well as their interrelations before collecting data For instance when a project focuses on adaptation to diminish-ing natural resources it is necessary to include not only the project beneficiaries but all groups who in principle depend on these resources or have a right to use them Ignoring the often complex actor con-stellations could lead not only to considerably biased evaluation findings (eg overestimation of impact) but also to the refusal of stakeholders to provide important information
Besides these formal aspects a number of further organisational issues need to be taken into account during the evaluation process such as the confi-dentiality of data Given the need to maintain the anonymity of those who provide the information certain rules must be adhered to when providing feedback on the evaluation findings Apart from the fact that there is a moral obligation to the lsquoinform-antsrsquo (ie interviewees participants in written sur-veys etc) not to abuse their willingness to cooperate a number of statutory provisions also exist
Regardless of how well an evaluation is planned and organised unforeseeable events can have nega-tive effects on its scheduling and findings The most common obstacles that must be anticipated when conducting the evaluation include the refusal of the informants to cooperate (refusal to be interviewed etc) and the occurrence of negative unintended effects in data collection (eg a rapidly deteriorat-ing work climate due to the respondents not having been given sufficient information about the evalu-ation) It is advisable in all cases to seek an oppor-tunity to talk to those concerned and if appropriate to arrange a meeting at which everyone is given the opportunity to present their point of view and work together to find solutions for instance through alter-native survey instruments or questionnaires In this situation it is of key importance that the evaluators are able to give a credible impression of their inde-pendence and neutrality
A potentially controversial question is whether or not recommendations should be included in the report and if so how they should be presented If it is decided when clarifying the assignment that recom-mendations will be made it is necessary to point out that they are intended as aids to orientation In other words it must be made clear what the evaluation can achieve and what it cannot in order to avoid unrea-sonable expectations This is even more true of the evaluation of CCA projects as due to the uncertainty of future climate developments a recommendation given at one point in time can prove to be wrong a few years later Therefore it is even more important to develop such recommendations together with the stakeholders and probably further climate experts in a participatory manner eg in the context of a work-shop Furthermore it may also be necessary to clarify the spatial and temporal validity of these recommen-dations and the assumptions under which they were made as regards the development of the framework conditions In any case it is necessary to differentiate between the evaluation findings and the conclusions and recommendations drawn from them
We recommend the following books and articles for further reading about practical evaluation requirements
Bamberger M Rugh J Church M Fort L Shoestring Evaluation Designing Impact Evaluations under Budget Time and Data Constraints American Journal of Evaluation 25(1) 2004 pp 5 ndash 37
Silvestrini S Organizational Aspects of Evalu-ations in Stockmann R (ed) A Practitioner Handbook on Evaluation Edward Elgar Cheltenham 2010
Stockmann R (ed) A Practitioner Handbook on Evaluation Edward Elgar Cheltenham 2010
1 Introduction
Impa
ct E
valu
atio
n G
uide
book
for C
limat
e Ch
ange
Ada
ptat
ion
Proj
ects
16
Phot
o copy
GIZ
Guy
2 Evaluating climate change adaptation projects
The first section of this chapter (21) provides an overview of the types and key features of CCA pro-ject interventions with regard to each level (micro meso macro) The second section (22) describes the challenges when it comes to evaluating CCA projects given their complexity Finally the third section (23) summarises currently used designs and data collec-tion methods to evaluate the results of CCA projects and shows their main shortcomings with regard to the quality of the evaluation findings
21 Types and key features of climate change adaptation projects
While most CCA projects follow a multi-level approach specific interventions (measures activi-ties) of such projects usually focus on a singular impact level be it on a particular target group such as climate migrants (individual level) local authori-ties (institutional level) or the legal and policy frame-work (system level) It is also important to under-stand that all three impact levels are interconnected For instance legal or policy changes (system level)
will necessarily have effects on the institutional level (eg local authorities companies) and the individual level (eg residents of a country or region) The indi-vidual benefits perceived by a specific target group (eg households in an intervention area) may even-tually be scaled up to the institutional and system level (eg through spill-over or other dissemination effects) The reason why it is important to make this distinction though is that the choice of the appro-priate evaluation design depends on the targeted impact level
211 Adaptation projects addressing the individual level
A particular type of adaptation intervention pri-marily affecting the individual level is the so-called community-based adaptation (CBA) approach which is often facilitated by a local organisation and can be implemented like a small-scale development project The primary objective of such an interven-tion is to improve the capacity of local communities to adapt to climate change applying an integrated approach that often combines traditional knowl-edge with innovative strategies Capacity building and awareness-raising are essential elements of such interventions In fact UNDP has found that com-munities and even policy-makers in target countries have limited knowledge of climate change issues especially of adaptation (UNDP 2009) Thus in order to be able to participate effectively locals must be supported to develop a good understanding of these issues which is why a lot of investments are being made in capacity building However working with communities can be a process that requires consider-able time financial resources and energy But it pays off because community engagement generates own-ership (at best) and enables empowerment giving communities a voice and the chance to participate Although CBA projects are situated at local level development cooperation aims to promote action at all levels to achieve systemic and sustainable change Relevant sectors for adaptation include rural devel-
17
Phot
o copy
GIZ
And
reas
K
opment agriculture water resources management coastal management disaster risk management and public health Typical practices address adjust-ments in the behaviour of individual groups as well as in the use and development of technologies (eg construction of large reservoirs adjustments to tra-ditional farming practices and risk reduction for the rural population)
The Community-Based Wetland Management Project (BIRAM) (UNDP 2015a) implemented by Boudhi Investigate and Research Assembly of Men supported by UNDP with funding from the Least Developed Country Fund the Government of Bang-ladesh and the UK Department for International Development is an example of a project that focuses on the micro level in five villages in Bangladesh (community level) The indigenous peoples living in the project areas are confronted with declining rain-fall rising temperatures and decreased water levels due to climate change A nearby stream is the main source of irrigation and fish farming Climate change forecasts predict that temperatures will continue to rise generating aridity in the target regions which will have negative consequences on ecosystems and livelihoods The project focuses on promoting sus-tainable crop varieties improved agricultural prac-tices and improved water collection Moreover it will train community members in alternative income-generating activities to reduce pressure on natural resources and diversify income sources 5
The Sustainable Agricultural Programme (PROAGRO I amp II) (GIZ 2015a) ndash a trilateral cooperation arrange-ment between Bolivia Germany and Sweden ndash is an example of a project that focuses on the individual level Its objectives are the following (1) to increase the resilience of smallholders in arid and semi-arid regions of Bolivia to climate change risks (2) to conserve and distribute scarce water resources as part of integrated watershed management and (3) to increase income from agricultural production A fourth component ndash ie adaptation to climate change ndash was integrated into PROAGRO II implemented by GIZ on behalf of BMZ A vulnerability assessment was conducted in 2013 following the approach of GIZrsquos lsquoVulnerability Sourcebookrsquo (Cordero 2014) The main climate risk is water scar-city which will probably increase in future and will have a negative impact on agricultural production The findings of the vulnerability assessment show that PROAGRO reduced the vulnerability of small-holder farmers by adjusting crop types and sowing dates and replacing old irrigation technologies with
5 More UNDP community-based adaptation projects can be found under the following link httpwwwundp-almorgprojectsspa-community-based-adaptation-project
more appropriate ones which enhanced water effi-ciency in the parcels (id) A mid-term evaluation was also conducted in 2013 using a mainly qualitative evaluation design (analysis of primary and secondary data semi-structured interviews and surveys with national counterparts strategic partners and target groups direct observation focus group discussions) (Kronik 2013)
212 Adaptation projects addressing the institutional level
Effective institutions are a major factor when it comes to the ability to respond to growing climate risks since they are designed to perform a set of functions related to decision-making and imple-mentation (Dixit et al 2011) They play a critical role in increasing societyrsquos capacity to adjust as condi-tions shift and as new climate change knowledge appears In a constantly changing climate the pro-cess of institutional change represents an impor-tant aspect of building adaptive capacities ie the ability of a national government and other entities and individuals to design and implement effective adaptation strategies or to react to negative climate stresses (Dixit et al 2011) Since national policy-makers international negotiators and funders assist in developing methods and guidelines for adapta-tion planning it is essential that they include a focus on building institutional capacity to adapt to cli-mate change impacts One of several ways in which climate-related challenges may require institutions to make significant adjustments involves meeting the needs of the most vulnerable people who tend to be poor or marginalised They usually have few resources with which to adapt and little say in public decision-making processes
Various CCA projects comprise interventions that aim at making an impact at institutional level One example is the National Adaptive Capacity (NAC) framework launched by the World Resources Insti-tute which assists governmental agencies in includ-
2 Evaluating clim
ate change adaptation projects
Impa
ct E
valu
atio
n G
uide
book
for C
limat
e Ch
ange
Ada
ptat
ion
Proj
ects
18
ing institutional capacity development in their adaptation planning processes It enables its users to systematically assess institutional strengths and weaknesses that may help or hinder adapta-tion National adaptation plans may then be better designed to make best use of strengths or remedy weaknesses (Dixit et al 2011) Another example is the Public Investment and Climate Change Adapta-tion (IPACC) project (GIZ 2015b) conducted by GIZ on behalf of BMUB in Peru The aim of the project is to raise awareness ndash among national and regional policy-makers and relevant technicians ndash of the potential environmental social and economic costs of climate change and to encourage decision-makers to consider climate-relevant criteria when formulat-ing and approving public investments Hence meth-ods were designed to integrate disaster risk man-agement and CCA considerations into a countryrsquos national investment planning to increase the adap-tive capacity and reduce climate-related risks (GIZ 2012) Next to initiatives in the policy field there are also CCA projects carried out by non-governmental organisations The DANIDA-funded project Capac-ity Strengthening in Least Developed Countries (LDCs) for Adaptation to Climate Change (CLACC) (IIED 2015) which is operated under the auspices of the International Institute for Environment and Development (IIED) strives to strengthen the capac-ity of civil society organisations in LDCs to adapt to climate change and foster adaptive capacity among the most vulnerable people This implies integrating adaptation to climate change into the work of NGOs and simultaneously setting up a system to share knowledge and experience among the adaptation community In this context IIED helped to establish the International Centre for Climate Change and Development (ICCCAD) in Bangladesh which pro-vides training on CCA and development for NGOs donors media government staff and the private sec-tor
213 Adaptation projects addressing the systemic level
CCA projects aiming to generate system-wide impacts often follow a top-down approach and com-prise interventions at global regional or national level Such interventions target policy changes (eg sectordevelopment strategies) changes in public opinion on a particular topic (eg climate change adaptation requirements) or changes in economic framework conditions (eg introduction of climate
change- adapted value chains 6) With regard to CCA projects two potential intervention types fall under this category country level and global or regional initiatives At the country level CCA projects provide policy advice to support the elaboration of national climate change strategies and action plans or to cre-ate awareness and facilitate consultation among (government) stakeholders The aim is to give con-sideration to climate change risks in laws planning policies and negotiations Such interventions also support the design of targeted policy strategies eg to climate-proof 7 the agricultural sector and intro-duce new crops cropping methods or efficient irri-gation technologies
An example of a CCA project that comprises such interventions at the federal level is the Climate Sup-port Programme (CSP) (GIZ 2015c) launched by GIZ on behalf of BMUB in South Africa in 2009 The projectrsquos aim is to assist the Department of Envi-ronmental Affairs (DEA) in reducing South Africarsquos carbon footprint mitigating climate change impacts and strengthening the countryrsquos resilience to climate change (GIZ 2013) The project supported the devel-opment and implementation of the Governmentrsquos white paper on the national climate policy 8 by pro-viding expertise contributing also to consensus-building among important stakeholders Section 12 of the white paper clearly mandates the develop-ment of an adaptation MampE system Moreover sector departments have started the process of reviewing their policies to align them with the white paper Additionally together with the BMZ-funded project lsquoEffective adaptation finance (MampE Adapt)rsquo GIZ is supporting the development and implementation of a monitoring and evaluation (MampE) system for adap-tation
6 See for instance the project lsquoPromoting a Value Chain Approach to Climate Change Adaptation in Agriculture in Ghanarsquo which aims to help reduce climate-induced risks and thereby contrib-ute to the achievement of food security and income-generating objectives for rural communities by focusing on the improvement and adaptation of the cassava value chain wwwthegeforggefsitesthegeforgfilesgef_prj_docsGEFProjectDocumentsCli-mate20ChangeGhana20-202843682920-20Promot-ing20Value20Chain20Approach20to20Adaptation20in20Ag1-17-20122020ID436820202020Ghana20SCCF20Full20Project20Document20for20Re-submis-sion2020Jan20201220cleanpdf
7 lsquoClimate-proofingrsquo is a methodological approach applied by GIZ that integrates climate change aspects into development plan-ning The reason for climate-proofing projects or programmes is the following even if GHG emissions are drastically re-duced climatic changes will still occur which will be fatal for some pop-ulations and ecosystems and will have negative con-sequences on the countryrsquos economy These climatic changes will gradually become more visible Consequently when de-signing a project it is of the utmost importance to consider climate change aspects especially if the project is supposed to run for a longer period of time (Hahn M 20102-6)
8 See White Paper of the National Climate Change Response Policy (published in 2011) httpravaqsensnetthemestheme_emissions111012nccr-whitepaperpdf
19
CCA projects with a global dimension include vari-ous international players who work together to achieve a common goal They mainly focus on con-ceptual work capacity building and knowledge exchange The institutions involved are responsible for the development of methods and tools for novel topics such as national adaptation plans (NAPs) and also for piloting these tools and methods in partner countries thereby cooperating with existing pro-jects within these countries In a best-case scenario the results and experiences of the CCA projects are shared with the CCA community to enable an exchange of knowledge and good practices through webinars workshops or online platforms 9 One example is the National Adaptation Plan Global Support Programme (NAP-GSP) (UNDP 2015b) for Least Developed Countries which is a UNDP-UNEP programme financed by the Least Developed Coun-try Fund (LDCF) and the Special Climate Change Fund managed by the Global Environment Facility (GEF) It helps LDCs 10 and developing economies to advance with their NAP 11 process through technical assistance provides tools and training to support the NAP process within the country and facilitates an exchange of lessons and knowledge through South-South and North-South cooperation The formula-tion and implementation of NAPs helps to identify the medium- and long-term adaptation needs of a technical institutional and financial nature and simultaneously develop and implement strategies and programmes to address these needs 12
22 Key challenges of climate change adaptation projects
CCA projects (including those with a partial focus on adaptation) pose specific methodological chal-lenges 13 which need to be taken into account throughout the whole project cycle These chal-
9 Examples of online platforms of this kind are wwwadaptation-communitynet wwwundp-almorg wwwadaptationlearning-mechanismcom wwwclimate-evalorg and wwwmediation-pro-jecteuplatform Europe-wide wwwclimate-adapteeaeuropaeu
10 26 LDCs have requested help with their NAP process11 The NAP process was initiated under the Cancun Adaptation
Framework (CAF)12 This paragraph is based on the information obtained on the
homepage (wwwundp-almorg)13 It must be mentioned however that the methodological chal-
lenges described below are by no means unique to CCA projects For instance most SWAPs have long time horizons (eg when re-forming a TVET system it may take several decades for benefits to become visible) uncertainty and shifting baselines are a problem in most fragile contexts and universal indicators (except maybe for education and economic development) are still lacking in most fields of intervention
lenges make it necessary to fine-tune development agenciesrsquo current MampE frameworks especially with regard to the development of indicators baselines milestones targets and the timing of MampE activities which need to be adjusted to the longer time horizon of the majority of adaptation initiatives These chal-lenges are outlined below
First of all the remaining ambiguity of the concepts used may impede the development of appropriate verifiable and measurable indicators There is no clear and commonly accepted definition of adapta-tion adaptive capacity and climate-resilient liveli-hoods which makes it difficult to define objective indicators There is also a lack of consensus about what actually constitutes successful adaptation Consequently there are no universal indicators for CCA projects since they depend not only on the individual project but also on the context scale sec-tor and location Unlike mitigation for which the amount of GHG emissions in the atmosphere serves as a universal MampE indicator the success of an adap-tation intervention cannot be measured by a single indicator Qualitative assessments are as important as quantitative ones since many aspects of adapta-tion are lsquosoftrsquo (eg institutional capacity behaviour change etc)
The establishment of a baseline is considered another major challenge for evaluating climate change adaptation projects A baseline is crucial to measure the projectrsquos impact as it provides a refer-ence point against which a change can actually be measured In climate change adaptation projects future climate change effects also need to be taken into account (ie a baseline projection of how the climate is going to evolve during the project term and beyond) Since climate change is most likely to unfold differently than assumed in the projection experts speak of a lsquoshifted baselinersquo Shifting baselines are considered to be problematic in terms of plan-ning since they change the context of the adaptation intervention
Thus uncertainty about actual climate change pat-terns and their effects is another aspect that needs to be addressed It may be impossible to anticipate when for example the next flood will occur in order to analyse to what extent adaptation took place in situ compared to the situation before the interven-tion Moreover adaptation strategies marked as suc-cessful in the short term may have negative impacts on vulnerability in the long term
2 Evaluating clim
ate change adaptation projects
Impa
ct E
valu
atio
n G
uide
book
for C
limat
e Ch
ange
Ada
ptat
ion
Proj
ects
20
Finally the long time horizon of potential climate change impacts poses an additional challenge that needs to be considered when designing the MampE framework for CCA projects Long-term impacts are unlikely to result from the project alone Instead they are rather generated by a series of factors or other interventions in the specific area Complexity increases when trying to identify the short-term and long-term outcomes that can be attributed to a par-ticular intervention For example the choice of farm-ing practices in a sustainable agriculture project also reflects the thought given to current or future cli-mate change However it remains difficult to isolate and assess the individual adaptation components reflected by these choices
23 Review of current methods to evaluate the results of CCA projects
The projects reviewed are conducted in developing countries and emerging economies 14 For the pur-pose of this guidebook emphasis was placed on the methodology ie the analysis of currently used eval-uation designs (experimental quasi-experimental ex-post etc) the presentation of the main data col-lection methods used (focus group discussions inter-views surveys direct observation etc) and lastly whether a quantitative qualitative or mixed-method approach was used The findings are summarised in Annex 51
During the research process two problems became visible first little use is made of RIEs in CCA projects which relates to the second finding namely the diffi-culty of ascertaining which evaluation methodology was applied Often it was difficult to identify which design was used since there was no reference to it in the methodology section of the evaluation Due to this difficulty we checked for keywords in the evalu-ation papers (eg randomisation randomised con-trolled trials (RCTs) control or comparison group quasi- and experimental design counterfactual and so forth) Very often none of these keywords were found in the whole document which is why there is no reference to the evaluation design in the table in Annex 51
14 Three different research approaches were used for this study (a) a simple google search using the following keywords lsquoclimate change adaptation impact evaluation vulnerability vulnerability assessments monitoring and evaluation of climate change adaptation adaptive capacity and resiliencersquo (b) a review of the reference lists of the journal articles found in (a) and (c) the scan-ning of relevant evaluations carried out by development agencies international organisations or independent evaluation institutions
Prowse and Snilstveit came to a similar conclusion in their study Impact Evaluation and Interventions to Address Climate Change A Scoping Study 15 pub-lished in 2010 saying that just a few RIEs were con-ducted (using mainly a quasi-experimental design) Although Prowse and Snilstveit recognised the chal-lenging nature of CCA projects this does not impede the use of RIEs Especially with regard to the increas-ing financial resources made available for climate change mitigation and adaptation projects it is important to make use of RIEs because evidence of the effectiveness of spending is required
Challenges inherent to evaluations of CCA projects involve the poor quality of the baseline (if there is one at all) randomisation and the development of a sample size which is often not representative The possible spreading of benefits from target to non-target groups is another limitation often referred to (see example below) In general data triangulation ie using a combination of qualitative and quantita-tive indicators (mixed-method approach) is visible in almost all CCA projects 16 which can be seen as a sign of progress in this field Just to name one example the evaluation of the project lsquoChronic Vulnerability to Food Insecurityrsquo implemented by the World Food Programme triangulates data from qualitative and quantitative sources It uses qualitative data from focus group discussions with community mem-bers and key-informant interviews with commu-nity opinion leaders and quantitative data involv-ing about 3000 randomly sampled households (cf Annex 51)
Another interesting finding concerns the way inter-national organisations conduct evaluations These evaluations are aligned with the Paris Declaration on Aid Effectiveness basing the evaluation mainly on the assessment of effectiveness efficiency relevance impact and sustainability (the DAC criteria) There is often no reference to the applied methodology
To name an example consider the Pacific Integrated Water Resource Management (IWRM) project (UNDP 2015c) established in 2009 which aimed to improve water resource and wastewater management and increase water use efficiency in Pacific island coun-tries in order to balance overuse and conflicting uses of scarce freshwater resources The evaluation is based on the DAC criteria for evaluating develop-ment assistance but it does not explain which design
15 Impact Evaluation and Interventions to Address Climate Change A Scoping Study httpwwwtandfonlinecomdoipdf10108019439341003786729
16 Although CCA evaluations are sometimes based on desk reviews and qualitative indicators (eg stakeholder interviews focus group discussions direct observations etc) and often lack robust quantitative data (see for example project Ndeg 31 in the table in Annex 51)
21
was applied In the methodological part only the data collection instruments are outlined (ie desk review and analysis interviews site visits) The same is true of many other evaluations within the Evalu-ation Resource Centre 17 of UNDPrsquos Independent Evaluation Office 18
In general when screening evaluations conducted by international organisations (see for instance the database of IFAD and the Global Environment Facil-ity (GEF) it becomes obvious that they have not conducted many rigorous impact evaluations so far hence there is not much experience in this field Take the Independent Evaluation Office of IFAD for instance narrowing down the search to look only at impact evaluations there is just one evaluation that was conducted in Sri Lanka in 2013 (Dry Zone Livelihood Support and Partnership Programme (DZLISPP)) 19 Although it is the only impact evalua-tion there is a clear methodology behind it For the first time IFAD undertook extensive data collection and analysis including a qualitative survey (30 key-informant interviews with project staff and relevant government officials) 41 focus group discussions with beneficiaries and a quantitative survey of over 2560 households Due to an absence of baseline data (which is often the case in CCA projects) two strate-gies were applied (1) an attempt to reconstruct the baseline through recall methods and (2) the use of a quasi-experimental design that does not strictly require baseline data Further challenges experienced were sample selection bias due to targeting and the potential spreading of benefits from target to non-target groups
The Independent Evaluation Office of the GEF offers more than one impact evaluation but the overall number is modest Furthermore the few impact evaluations that have been conducted only concern climate change mitigation projects (there are none for CCA projects yet) However although the GEF has not yet implemented many impact evaluations it
17 Evaluation Resource Centre httpercundporgindexhtml18 Independent Evaluation Office httpwebundporgevaluation19 Dry Zone Livelihood Support and Partnership Programme
(DZLISPP) httpwwwifadorgevaluationpublic_htmleksystdocimpact2013srilankaindexhtm
is clear that they deal with this topic since there are many publications that emphasise the impact evalu-ation of climate change projects It will surely be only a matter of time until there is a spillover to CCA pro-jects too In 2014 the GEF Independent Evaluation Office together with a number of multilateral and bilateral organisations including GIZ hosted the Sec-ond International Conference on Evaluating Climate Change and Development which aimed to promote and develop methods and good practices for MampE of adaptation and mitigation 20 A book of conference proceedings will be published by Springer in 2016
To be fair it has to be stressed that many CCA pro-jects focused on policy development and capacity building exercises at institutional level for which RIEs may not be an adequate evaluation design The National Adaptation Plan Global Support Pro-gramme or the Climate Finance Readiness Pro-gramme are examples where RIEs might be compli-cated These are global CCA projects that focus on policy development capacity building at institu-tional level and making sure that the target country is ready (institution-wise) to receive the financial resources earmarked for CCA projects
It should also be mentioned that lsquolearningrsquo is in many cases not the focus of the evaluation Frequently evaluations focus rather on the question lsquoHave we done what we said we wouldrsquo (accountability) than on lsquoWhat happened and whyrsquo (learning) This is especially true of development organisations (exam-ples are outlined in the table in the annex) Addi-tionally while screening CCA projects carried out by development organisations it became clear that many projects are still ongoing This means that an evaluation still has to be completed At best this pub-lication may raise awareness among practitioners to consider RIEs for CCA projects in order to increase the use of this evaluation design gain relevant expe-rience and simultaneously obtain valuable findings that can be shared with the adaptation community
20 Presentations and videos from the conference can be accessed at httpswwwclimate-evalorgevents2014-conference
Phot
o copy
GIZ
Ran
ak M
artin
2 Evaluating clim
ate change adaptation projects
Impa
ct E
valu
atio
n G
uide
book
for C
limat
e Ch
ange
Ada
ptat
ion
Proj
ects
22
3 Rigorous evaluation designs and examples of applicability in climate change adaptation projects
Having discussed the types and key features of CCA projects and the way they are currently evaluated this section will now provide an overview of the strategies and prerequisites for evaluating the impact of such projects bearing in mind their characteris-tics The first section thus deals with the potentials and limitations of different research designs used for impact evaluations when it comes to their applica-tion in the field of climate change adaptation (31) Section 32 discusses the methodological require-ments for providing reliable data on a large scale with a particular focus on adequate survey sampling techniques
31 Overview of evaluation designs ndash potentials and limitations for climate change adaptation projects
Before going further into the topic as such the term lsquodesignrsquo should be briefly explained as it is occasion-ally used with different meanings and confused with other terms such as lsquomethodrsquo or lsquoinstrumentrsquo
Generally speaking a research design describes how a research question is intended to be answered Evaluation designs usually differ with regard to the points in time when data is collected the data sources and the way the data is analysed (eg by com-paring target group with comparison group data) Most common evaluation designs are ex-post facto designs and single-difference designs (ie before-and-after comparisons or group comparisons) How-ever as these designs are not suitable for evaluating impact ndash at least when used as the only means during an evaluation ndash they are not discussed further in this Guidebook Instead we shall go on to present alter-native and more sophisticated evaluation designs that can provide sufficient empirical evidence
about the attribution or at least contribution of an intervention to observed changes We will explain the types of projects to which they can be applied which time budget and data resources they require and how informative their findings are We will also assess how valid and reliable the evaluation findings are provided the design has been implemented cor-rectly
A research design describes how a research question is answered
The descriptions start with experimental and quasi-experimental designs (311) which are favoured by a number of evaluation experts (eg DufloGlen-nersterKremer 2008 see also literature list at the end of this section) and considered by some as the lsquogold standardrsquo for impact evaluation In 312 an alternative approach for estimating the impact of an intervention is discussed so-called propensity score matching which may be suitable when poten-tial beneficiaries cannot be randomly assigned to a treatment and comparison group The next sec-tion deals with the so-called pipeline approach (313) This approach is of particular use if a project is implemented sequentially but aims to support target groups that feature comparable characteris-tics Another approach that is useful when the treat-ment decision depends on the beneficiary present-ing a threshold level of a specific characteristic (eg income or age) called the regression discontinu-ity approach is discussed in Section 314 In Sec-tion 315 the potentials of time-series evaluation designs are discussed by means of the so-called panel analysis Time-series designs are of particular value for long-term projects and observation periods and when complementary statistical data is acces-sible The last design discussed in detail is suitable for projects that aim to make a difference at policy level (type I and II projects) as it can provide empiri-cal evidence about their contribution to changes in a complex environment taking external influences into account (316) The design is called structural equation modelling and comes from the field of econometric research where it is commonly used to identify causal linkages between social and eco-nomic phenomena such as education and health The section closes (317) with a tabular overview of the applicability of the evaluation designs discussed above their methodological and practical require-ments and the validity of their findings (if applied correctly) The purpose of this overview is to enable the reader to choose a particular design bearing in mind the adaptation-specific project characteris-tics and given the financial technical and logistical framework conditions
311 Experimental and quasi- experimental designs
The following section outlines the main characteris-tics potentials and limitations and methodological prerequisites for applying an experimental or quasi-experimental design during an evaluation We will also discuss the kind of CCA-related interventions to which such designs can be applied and which meth-odological skills and (financial human and time) resources are required
Generally speaking experimental and quasi-exper-imental designs (in the field of applied empirical social sciences) consist of a comparison of two groups at two points in time One group receives a certain treatment (intervention measure activity etc in the following named lsquotreatment grouprsquo) and the other does not A design is called experimental or more precisely a randomised controlled trial (RCT) if the members of each group are selected at random This means that (ex-ante) the probability of each indi-vidual being a member of the treatment group is the same 21 The group that has not received any treatment is then called a lsquocontrol grouprsquo If such a random selec-tion cannot be ensured (eg due to self-selection bias or conscious selection) then such a design is called quasi-experimental In that case the group without treatment is called a lsquocomparison grouprsquo 22 However in order to simplify matters we will consistently use the term lsquocomparison grouprsquo in the remainder of this document
Experimental designs require a randomised selection of participants for an intervention
The purpose of employing such a design is to allow for attributing observable changes in a given popu-lation to an intervention This is done by estimating the so-called counterfactual ie the hypothetical situation of that population without having received the treatment In other words we do so by answer-ing the question lsquoWhat would have happened if no intervention had taken placersquo While estimating the counterfactual is also the foundation for calculating the treatment effect in pre- and post-test analyses and
21 It has to be highlighted that the equal probability that individuals of a given basic population will receive a treatment needs to be considered at the project planning stage That means that an RCT can only be applied if the project design allows for a random selec-tion of the treatment group
22 The rationale behind this distinction is that a lsquonon-interventionrsquo group that has not been selected at random cannot by definition act as a lsquocontrolrsquo for any time-variant or invariant variables There-fore particularly in the social sciences the term lsquocomparison grouprsquo is frequently used in settings where the groups were not selected at random
comparative analyses these designs have consider-able weaknesses regarding their underlying assump-tions These weaknesses compromise the validity of their findings in many cases In a simple pre- and post-test design the measurement prior to the inter-vention is taken as the counterfactual assuming that the situation of the target group would have remained stable without the intervention However because there is usually a considerable time span between the measurements this assumption is not valid as it cannot be assured that no other external factor would have influenced the situation of the treatment group Comparative designs estimate the counterfactual by collecting ex-post data from both the treatment group and a group that has not taken part in or benefited from the intervention ie a com-parison group In this case one assumes that the situ-ations of the treatment group and the comparison group were identical before the intervention How-ever this assumption cannot be held true either due to the potential selection bias The selection bias may be based on the intervention design (eg focusing on the most needy persons) the individual characteris-tics of the participants (eg self-selection by voluntari-ness) or on practical issues such as a limited budget the accessibility of the treatment group or other logis-tical constraints
Experimental and quasi-experimental designs tackle the issue of intervening time factors and potential differences between target and comparison groups by combining both a pre- and post-test and a compara-tive design This means that data is collected from both the target group and the comparison group before and after the intervention The net effect of an intervention (ie net average treatment effect) is then calculated on the basis of the average difference in the observable changes between the treatment and the comparison group (also called double-difference or difference-in-difference approach see Annex 52 for a further introduction to the calculation of the net average treatment effect using this approach)
Phot
o copy
GIZ
Har
ald
Fran
zen
3 Rigorous evaluation designs and exam
ples of applicability in climate change adaptation projects
Impa
ct E
valu
atio
n G
uide
book
for C
limat
e Ch
ange
Ada
ptat
ion
Proj
ects
24
CCA-specific requirements and challenges
Experimental and quasi-experimental designs are applicable to CCA projects whenever project measures aim at generating a direct impact at individual level ie if a distinguishable target group (eg inhabitants of a particular disaster-prone area farmers in arid regions) receive a specific benefit (eg knowledge of how to seek shelter in case of emergency technical assistance to install drip-irrigation systems) In order to apply such a design it must also be possible to establish a treatment and control or comparison group While in some cases the division of a population into a treatment and controlcomparison group may not be appro-priate for ethical reasons (ie if the denial of support would lead to an immediate deadly peril eg medi-cation in an epidemic) in many other cases financial logistical or technical constraints inevitably lead to selecting a sub-group of a larger population that in principle shares the same needs
A further requirement for applying an experimental or quasi-experimental design is that it must be pos-sible to detect an impact within a manageable time frame While it holds true that it may take a long time for CCA project impacts to become visible ndash which is also the case for impacts in other fields such as edu-cation financial systems or private sector development ndash there may also be some ways to work around the relevant constraints Referring to the first example mentioned above for instance one would not have to wait until another disaster happens to see if the project participants are able to seek shelter faster than those who did not participate A simple observation with a stopwatch during a test alarm would probably do the trick as well Concerning the second example it may not be necessary to wait until the environmental framework conditions have deteriorated in another 20 years to see if the drip-irrigation systems lead to the desired impact Even without any (further) climate change one can measure the reduced water consump-tion and increased yield in comparison to conventional farming methods However in the latter case too a time-series design (cf Section 315) may be a viable alternative for identifying the long-term impact of the project particularly if a comparison group can be established
It must be mentioned though that experimental and quasi-experimental designs also feature a number of challenges which limit their applicability to some extent First of all such designs require considerable tech-nical logistical and thus financial resources As one can imagine the collection of data from a large num-ber of people (cf Section 32 for further considerations about required sample sizes) particularly if they are located in difficult-to-reach areas is costly and time-consuming Furthermore the necessity to collect this data also from people who did not receive any benefit may be difficult as they may be not as willing to con-tribute to such an analysis as those who did For example a farmer who did not receive any technical assis-tance may not be as willing to provide information about his yields In such cases a suitable project design (possibly a pipeline approach see Section 313) may increase the willingness to participate
Finally the findings of such designs are prone to a certain degree of bias such as spill-over and conta-gion effects A spill-over effect means that the controlcomparison group indirectly receives a benefit eg through copying or learning from the treatment group (eg if the trained habitants in the disaster-prone area tell others who were not trained how to behave or if farmers who did not receive any assistance adopt irrigation schemes because they recognise their comparative advantage) Contagion effects may occur if the project under investigation is not the only one to provide support in the target area ie if other DC agencies are active in the same field In that case it may be difficult to attribute the observable impact to the particu-lar intervention (eg if the farmer was able to increase his yield because of the technical support provided by GIZ or because of the micro-credit he received from the ADB) While spill-over effects usually lead to an underestimation of the treatment effect (ie as the controlcomparison group receives a benefit as well) contagion effects can lead to both the over- and underestimation of the treatment effect depending which group has been (more) contaminated by other support measures Thus in multi-donor settings contribution analyses such as those conducted as part of a structural equation modelling approach (cf Section 316) may be more promising
25
312 Matching techniques
In an experimental design comparing the differ-ences in the outcomes of the treatment and control group would be sufficient for calculating the net effect of an intervention However as treatment groups are rarely selected randomly often such a design cannot be implemented in practice To obtain valid evaluation findings all the same the induced selection bias described above needs to be compen-sated for Various approaches are available for this purpose among these matching techniques appear to be especially suitable in evaluation studies The basic idea of matching techniques is to establish for each member of a treatment group a sub-set of pos-sibly similar comparison group members in order to estimate the treatment effect by calculating mean group differences That means that the counterfac-tual situation of the treated person (ie what would have happened if this person had not participated in the project) is approximated through the assignment of similar persons who have not participated
Matching techniques aim to approximate the counterfactual by comparing the outcomes of individuals from the treatment and the compari-son group that have identical or at least similar characteristics
A common matching approach is to identify statisti-cal twins by comparing individual characteristics (ie dimensions) that are supposed to have an influence on the outcomes of an intervention For example if one suspects that the effectiveness of a training measure (eg teaching farmers how to grow drought-resistant crops) also depends on the age and gender of the beneficiary the treatment and comparison group can be clustered accordingly and the outcomes can be individually compared for each sub-sample The following table illustrates the principle of the matching approach using the mentioned example
For further reading about impact evaluation in general and the above-discussed methodological aspects the potentials and limitations of experimental and quasi-experimental designs and particularly their practical implementation the following books articles and papers are recommended
General methodological introduction
Bertrand M Duflo E Mullainathan S How Much Should We Trust Differences-in-Differ-ences Estimates Working Paper 01 ndash 34 MIT Cambridge 2001
Stern E Stame N Mayne J Forss K Davies R Befani B Broadening the range of designs and methods for impact evaluations Working Paper 38 DFID London 2012
White H Some Reflections on Current Debates in Impact Evaluation International Initiative for Impact Evaluation New Delhi 2009
Practical guidelines and examples
Chambers R Karlan D Ravallion M Rogers P Designing impact evaluation different per-spectives International Initiative for Impact Evaluation New Delhi 2009
Khandker SR Koolwal GB Samad HA Handbook on Impact Evaluation Quantita-tive Methods and Practices The World Bank Washington DC 2010
Leeuw F Vaessen J Impact Evaluations and Development NONIE Guidance on Impact Evaluation NONIE Washington DC 2009
Vaessen J Todd D Methodological challenges of evaluating the impact of the Global Envi-ronment Facilitys biodiversity program Evalu-ation and Program Planning 31 2008 pp 231 ndash 240
3 Rigorous evaluation designs and exam
ples of applicability in climate change adaptation projects
Impa
ct E
valu
atio
n G
uide
book
for C
limat
e Ch
ange
Ada
ptat
ion
Proj
ects
26
Table 2 Example table for matching on observables
Group Treatment group Comparison group
Gender Male Female Male Female
lt 40 years old
ge 40 years old
Annotation Each cellarrow colour indicates an individual comparison
As the table shows each sub-sample of the treatment group (eg men of the age of 40 and above) is com-pared with a sub-sample of the comparison group that has the same characteristics The problem with this so-called matching on observables approach is that the size of comparable sub-samples decreases as the number of relevant dimensions grows This again limits the possibility of conducting statistical tests (eg t-test for comparing mean values of independ-ent samples) that require a minimum cell count of approximately 30 cases in order to reach valid find-ings
Another matching technique that has gained atten-tion in the last years is called propensity score matching (PSM cf RosenbaumRubin 1985) The advantage of this technique is that in contrast to matching on observables it provides a one-dimen-sional score for comparison (the so-called propensity score) that indicates the probability of any individual being a member of the treatment group Since this approach is methodologically quite demanding and thus requires a strong theoretical background its application will not be discussed here in detail Instead a short introduction into PSM and further reading material can be found in Annex 53
CCA-specific requirements and challenges
When we look at how these matching techniques can be applied to CCA projects the same characteristics apply as mentioned in the preceding section because they are primarily used on an individual level While institutional or even spatial (regional city-wise) matching can also be found in evaluation practice the meth-odological foundations and practical experiences concerning the validity of the findings provided by such matching approaches are still rather limited Therefore it is not recommended to pursue such an approach lsquoaboversquo the individual level Regarding the variables that are used for matching in the context of CCA projects it may be possible to work with characteristics such as proximity to hazardous areas degree to which individuals are affected by climate change effects or affiliation to specific ethnic social or religious groups etc
The challenges presented by matching approaches include two issues in particular The necessity of a rela-tively larger sample in order to find sufficient matching partners and the question of which characteristics to choose for the matching While the first issue constitutes a technical problem that can be solved by allocat-ing sufficient resources the second is a theoretical one which requires comprehensive sectoral and regional expertise The analysis of matched data can lead to significantly different findings compared with unmatched data depending on which characteristics are considered relevant Therefore it is of the utmost importance to substantiate the selection of the matching variables based on sound theory The most important questions to be answered in that regard are
` Could the characteristic influence the effectivenessoutcome of the intervention for the individual ` Does the basic population comprise sufficient individuals with different characteristics ` Will it be possible to identify sufficient individuals in the target group with identical characteristics
We should also point out that matching may not prevent potential bias as described in 311 However it may be possible to perform matching using aspects such as lsquodegree to which individuals are affected by other inter-ventionsrsquo in order to at least reduce the risk of contagion effects
27
For further reading on the methodological aspects potentials and limitations of PSM as well as its practical implementation the following books articles and papers are recommended
General methodological literature about PSM
Becker S Ichino A (2002) Estimation of average treatment effects based on propensity scores The Stata Journal 2(4)358 ndash 377
Luellen JK Shadish WR amp Clark MH (2005) Propensity scores An introduction and experimental test Evaluation Review 29(6)530 ndash 558
Morgan SL amp Winship C (2007) Counterfactu-als and causal inference methods and prin-ciples for social research Cambridge NY Cambridge University Press
Guo S amp Fraser MW (2010) Propensity score analysis Statistical methods and applications Thousand Oaks Sage
Steiner PM Cook TD Shadish WR amp Clark MH (2010) The importance of covariate selection in controlling for selection bias in observational studies Psychological Methods 15(3)250 ndash 267
Practical guidelines and case-studies
Caliendo M amp Kopeinig S (2008) Some practical guidance for the implementation of propen-sity score matching Journal of Economic Sur-veys 22(1)31 ndash 72
Cook TD amp Steiner PM (2010) Case match-ing and the reduction of selection bias in quasi-experiments The relative importance of pretest measures of outcome of unreliable measurement and of mode of data analysis Psychological Methods 15(1)56 ndash 68
Diaz JJ amp Handa S (2006) An assessment of propensity score matching as a nonexperi-mental impact estimator Evidence from Mex-icorsquos PROGRESA program Journal of Human Resources 41(2)319 ndash 345
Gaus H Muumlller C E (2012) Evaluating free-choice climate education interventions apply-ing Propensity Score Matching Evaluation Review 35(6)673 ndash 722
313 Pipeline approach
Often projects are not implemented on a broad scale right from the beginning targeting the entire poten-tially relevant target group but sequentially This may be because of logistical or budgetary reasons In these cases a so-called pipeline approach can be of particular use The idea behind the approach is that the section of the target group that receives a treat-ment (ie benefits from or takes part in a project) at a later stage can be used to approximate the counter-factual situation of those who did receive the treat-ment at the time of data collection In other words the part of the target group that is not yet affected
serves as a quasi-comparison group for the already affected part of the group In principle the approach can be applied repeatedly during an intervention depending on the number of phases in which the treatment (ie measures activities etc) is provided
In a pipeline approach the part of the treatment group that has not yet received any treatment is used for comparison
Figure 2 illustrates the basic concept of the approach using a three-phase intervention design
3 Rigorous evaluation designs and exam
ples of applicability in climate change adaptation projects
Impa
ct E
valu
atio
n G
uide
book
for C
limat
e Ch
ange
Ada
ptat
ion
Proj
ects
28
Figure 2 Illustration of the pipeline approach
( )t0 t1 t2 t3Timeline
Project phase IIIGroup C
Project phase IIGroup B
Project phase IGroup A
Ex-antebaseline data collection Final data collection Ex-postfollow-up data collection
( )
( )
As the figure shows in a three-phase project a total of four data collections (t0 ndash t3) are necessary of which at least during two (t1 amp t2) data sets have to be collected from two groups (group A amp B t1 respectively group B amp C t2) The treatment effects would then be estimated as in an ordinary single-difference design whereby group B would represent the comparison group to group A and group C to group B Provided the total project duration suffices ex-postfollow-up data from groups A amp B could also be collected at t3 which would probably allow further conclusions to be drawn about the sustain-
ability of the achieved results Further data collec-tions are conceivable such as from group C at t0 and t1 in order to estimate spill-over effects from groups A and B or to control for external influences on outcome variables (eg contagion effects from other projects) In any case the approach is quite flex-ible as it can be modified according to the informa-tion needs It can even compensate for a lsquoforgottenrsquo baseline study to some extent provided the group characteristics are comparable and remain relatively stable over time ie when the influence of external factors is negligible
CCA-specific requirements and challenges
With regard to evaluating CCA projects the pipeline approach is applicable for interventions that are planned to be implemented in phases for instance in different areas andor institutions (eg development and implementation of environmental information systems for local authorities in different provinces) and that aim to generate impact at individual or institutional level Provided that this is the case as outlined above it is still possible to start collecting data after the project has started ie it is not necessary to have baseline data for the first project phase This may be a considerable benefit for all projects that follow a replication or scaling-up design with a preceding pilot phase in which the (technical logistical etc) feasi-bility of the measures is tested before they are rolled out in other areas
The pipeline approach might also be of particular value for CCA projects which are confronted with the problem of shifting baselines (cf 22) The pipeline approach makes it possible to trace developments by comparing the baselines for each group (provided the group characteristics are in principle comparable) It may also be an option for projects that aim at generating long-term impacts that might not be observable directly at the end of their implementation
When applying a pipeline design however it should be borne in mind that each data collection phase is just as labour-intensive and time-consuming as a quasi-experimental design given that data needs to be collected for both the treatment and a comparison (ie future treatment) group except for the first and last round The same quality criteria therefore apply
The references to literature on experimental and quasi-experimental designs at the end of Section
311 are also suitable for further reading on the pipe-line approach
29
314 Regression discontinuity design
The approach discussed in this section is of par-ticular use when project participantsbeneficiaries are consciously selected on the basis of one specific characteristic that distinguishes them from non-participantsbeneficiaries (eg income) though they are similar in a number of other respects (eg loca-tion income sources education) If the participationeligibility of an individual depends on the value of a particular indicator that is relevant to the outcome of an intervention the treatment effect can be esti-mated by the so-called regression discontinuity design (RDD) The basic idea behind the approach is to estimate the treatment effect by comparing the
pre- and post-treatment indicator values (scores) of only those individuals from the treatment and com-parison group that are most similar with regard to their pre-treatment outcome score ie that lie within a comparison range close to the threshold level Fig-ure 3 shows the sample selection for assessing the treatment effect
The regression discontinuity design can be applied if project participantsbeneficiaries are selected based on a special characteristic that distinguishes them from non-participantsben-eficiaries
Figure 3 Selection of individuals for comparison
Individuals
Pre-intervention outcome score
Threshold levelComparison range
Untreated individuals
Compared untreated individuals
Compared treated individuals
Treated individuals
It is mandatory to adhere to the threshold level throughout the selection process as otherwise the regression analysis would lead to less valid findings Furthermore it must be assured that the individu-als cannot influence the pre-intervention outcome score (eg by temporarily lowering their income in order to receive support) as this would also bias the findings
Once the sample has been identified the pre- and post-treatment outcome scores are used to cal-culate regression functions for each group If the
intervention had an effect on the treatment group the functions should show different values at the threshold level This difference can be interpreted as the local average treatment effect for individuals that are most similar ie whose outcome values lie very close to the threshold line The discontinuity of the regression functions of the treatment and com-parison group can also be visualised by a Cartesian coordinate system in which the X-axis represents the pre-treatment and the Y-axis the post-treatment outcome score Figure 4 shows how such a disconti-nuity may look
Figure 4 Outcome scores before and after intervention
Pre intervention outcome score
Post intervention
outcomescore
Threshold level
Comparison range
Non treated individuals
Compared non treated individuals
Compared treated individuals
Treated individuals
3 Rigorous evaluation designs and exam
ples of applicability in climate change adaptation projects
Impa
ct E
valu
atio
n G
uide
book
for C
limat
e Ch
ange
Ada
ptat
ion
Proj
ects
30
As the treatment effect estimated with the RDD is based on a comparison of most similar individuals it can be considered to be widely unbiased How-ever a disadvantage of the approach is that the effect may not be generalisable for the entire population because individuals become less comparable the further they are from the threshold level Another disadvantage is the fact that in comparison to other designs RDD only uses a small fraction of the entire population to estimate the treatment effect
Due to its relatively ambitious requirements and methodological reservations RDD has only played a minor role in impact evaluation studies so far Never-
theless it may be applicable particularly for policy-field evaluations with large and clearly defined treatment groups provided the above-mentioned methodological requirements can be met In some publications (KhanderKoolwalSamad 2010) the use of a regression discontinuity approach is also recommended in scenarios where a threshold level is spatially defined (ie a geographical national or administrative border) However such an applica-tion needs to be carefully reviewed as populations in different regions present unobserved covariates (eg cultural or religious background) that may limit their comparability
CCA-specific requirements and challenges
RDD can be of particular use for evaluating CCA projects that focus on creating an impact at individual level and are implemented under framework conditions that involve a high degree of uncertainty provided the projects comply with the methodological requirements outlined above The benefit lies in the compara-tively simple data collection setup and clear interpretability of the evaluation findings which are quite robust against bias at least for those individuals who are very similar
On the other hand it has to be added that the findings are only of limited external validity Furthermore as only very similar individuals are compared (at least with regard to the outcome variable that is of interest) the sample selection can be less efficient because only a smaller number of individuals (ie those who are very similar) can be used for comparison Another challenge which is not restricted to CCA projects though is that it requires the project to adhere to a defined threshold level not to lsquoshiftrsquo it or make exceptions which in practice often proves to be a problem It is also only suitable for interventions where the impact becomes vis-ible in a manageable time frame which is not often the case for CCA projects
Finally it should be added that besides the outlined basic RDD there are several further more sophisti-cated variations of the approach These include ran-dom assignment at the threshold level or with more than one threshold level (eg if the treatment group is split further in sub-groups that receive different kinds of support depending on their pre-treatment outcome score) which cannot be discussed here
Therefore the following books articles and papers are recommended for further reading about methodological and practical require-ments as well as further applications of the approach
Imbens GW amp Lemieux T Regression discontinuity designs A guide to practice Journal of Econometrics 142(2) 2007 pp 615 ndash 635
Khandker SR Koolwal GB Samad HA Handbook on Impact Evaluation Quantita-tive Methods and Practices The World Bank Washington DC 2010
315 Time-series designs
While most evaluations focus on a limited time frame defined by the duration of an intervention sometimes it may be necessary to cover a longer period eg when the effectiveness of a series of past support activities or the development of (politi-cal economic etc) framework conditions are to be reviewed In those cases time-series designs can be of particular use We should add that there is no sin-gle time-series design this is rather an umbrella term for a number of different approaches What they have in common is that they are based on repeat-edly collected data over a longer period Time-series designs can be distinguished by whether they make use of only descriptive or also inferential statistics if data from the same analytical units (eg individuals households organisations cities countries) is used or not and if the data is quantitatively or qualitatively analysed
Time-series designs are based on frequently repeated data collections and are of use for measuring long-term impacts and the develop-ment of framework conditions
31
While it is simple to analyse the development of individual indicators descriptively by means of a trend analysis the identification of causal relation-ships calls for more sophisticated approaches Such approaches are often based on regression analyses that make it possible to estimate the influence of sev-eral independent variables (eg resources contextual factors) on dependent variables (eg attitudes behav-iour well-being) We shall go on to discuss an exem-plary design that has been successfully applied in a number of impact evaluation studies the so-called panel analysis
A panel analysis is based on repeated data collec-tions from identical analytical units The data needs to be comparable with regard to their informa-tion content ie the data collection instruments of each survey have to contain identical question and answer categories Furthermore the data sets must
be assignable to each respondent throughout the observation period Panel analyses usually require datasets with a large number of analytical units in order to be able to draw conclusions from the panel sample that apply to a larger basic population (cf 331) If these requirements are met panel analyses make it possible to trace developments not only on average but also on an individual basis and thus to identify variations caused by individual differences (ie unobserved heterogeneity) In addition given a sufficient observation period panel analysis makes it easier to identify the chronological sequence of changes and thus develop hypotheses about causali-ties The treatment effect can be estimated on the basis of various models The two most common of these the so-called fixed-effects model (FEM) and the random-effects model (REM) are briefly out-lined in Annex 54
CCA-specific requirements and challenges
Time-series designs appear to be most suitable for CCA projects as they are in principle applicable at each impact level and are of particular benefit when it comes to measuring long-term impacts As they make it possible to control time-variant confounding factors they are likewise useful for dealing with uncertain framework conditions as well as with shifting baselines given a sufficiently large sample size andor number of repeated data collections Due to their flexibility they can be applied in projects that focus on the adapta-tion of particular target groups to changing (climate environmental) framework conditions on the improve-ment of institutional capacities to deal with climate change-rooted environmental social or economic prob-lems or on national regional or global developments such as adaptation strategies in response to particular climate challenges Thus time-series designs are in fact more common in policy studies than in project evalu-ations
The challenges associated with time-series designs lie not so much in their practical implementation or the required financial resources as in the expert knowledge needed to do the lsquomathsrsquo They also call for a strong sectoral background in order to develop the right cause-and-effect hypotheses and draw the right conclu-sions from the analysis findings Very few evaluation experts have the know-how to adequately draft and implement such a design The high theoretical and methodological demands are reflected in a multitude of disputes among experts concerning the credibility of research which is of course not helpful for clearly com-municating evaluation findings
For further reading on panel data analysis the following literature is recommended
Berrington A Smith WF Sturgis P An Overview of Methods for the Analysis of Panel Data NCRM Methods Review Papers NCRM007 ESRC National Centre for Research Methods Southampton 2006
Hsiao C Analysis of Panel Data Cambridge University Press Cambridge 2014
316 Structural equation modelling
While the approaches discussed in the sections before are suitable for project types that differenti-ate between a treatment and a comparison group we will now go on to present an approach that may be applied for evaluating large-scale policy-based programmes that aim to affect an entire (national regional or global) population or sector (eg envi-ronmental or education sector labour market) With the so-called structural equation modelling (SEM) approach it is therefore not possible to attribute an observed effect to a specific intervention but to esti-mate the statistical relationship between several fac-tors over time one of which may be an intervention
3 Rigorous evaluation designs and exam
ples of applicability in climate change adaptation projects
Impa
ct E
valu
atio
n G
uide
book
for C
limat
e Ch
ange
Ada
ptat
ion
Proj
ects
32
Structural equation models make it possible to estimate statistical relations between con-structs which are defined by empirical measur-able indicators
Basically SEM is a multivariate statistical approach for testing hypotheses (deductive approach) about causal relationships between two or more latent constructs Its special feature is that it makes it pos-sible to test multiple statistical relationships (which are assumed to be causal) at the same time and can thus be used in complex environments In this con-
text latent construct means that the causes and effects (eg health employability) cannot be meas-ured directly but only by a number of manifest (ie empirically measurable) indicators (for health eg blood counts weight for employability education level qualifications) In principle a structural equa-tion model consists of two model types measure-ment models and structural models Measurement models describe the relationship between a latent construct and its indicators structural models describe the connection between latent constructs The following figure illustrates the differentiation between the model types according to the graphical representation of the system model described above
Figure 5 Generic layout of a structural equation model
It is important to note that the indicators that opera-tionalise the constructs and the causal relationships between the constructs have to be specified and theoretically substantiated by the researcher That means that it needs to be defined in advance which is the independent (ie exogenous) and which is the dependent (ie endogenous) variable In other words
the direction of the dependency has to be defined by the researcher In the figure above constructs 1 and 2 are exogenous variables (ie causes) while construct 3 is an endogenous variable (ie effects) A practical example on how to implement a SEM is given in sec-tion 42
CCA-specific requirements and challenges
With regard to the application of SEM for evaluating CCA projects the requirements and challenges sum-marised in the previous section on time-series designs are widely transferable with the difference that SEM is mainly suitable for projects that aim to create an impact at institutional and system level (eg political strategies) The practical requirements relating to SEM are not so difficult though it does take comprehensive theoretical know-how to develop the model As mentioned above the validity of the models relies on the expert knowledge of the people who create them Thus the findings of SEM analysis are as right or wrong as the model they are based upon Here the particular danger lies in omitting a system-relevant construct (ie influential factor) or indicators that define such a construct which would cause substantially biased findings What aggravates the problem is that in contrast to the designs discussed above unfortunately no quality criteria are available for assessing the validity of an SEM model Nevertheless given sufficient expert knowl-edge SEM can be of great benefit for providing the lsquobigger picturersquo and thereby revealing the manifold causal linkages between social political economic and environmental developments in the long run
33
For further reading on the methodological aspects potentials and limitations of SEM as well as its practical implementation we recommend the following books articles and papers
Cassel C Hackl P Anders HW (2010) Robust-ness of partial least-squares method for estimat-ing latent variable quality structures Journal of Applied Statistics 26(4)435 ndash 446
Chin W Newsted PR (1999) Structural Equation Modeling Analysis with small Samples Using Partial Least Squares In Hoyle R (ed) Statistical Strategies for Small Sample Research Thousand Oaks Sage
Diamantopoulos A Riefler P Roth KP (2008) Advancing formative measurement models Jour-nal of Business Research 61(2008)1203 ndash 1218
Garthwite PH (1994) An Interpretation of Partial Least Squares Journal of the American Statistical Association 89(425)122 ndash 127
Haenlein M Kaplan AM (2004) A Beginnerrsquos Guide to Partial Least Squares Analysis Understanding Statistics 3(4)283 ndash 297
Temme D Kreis H Hildebrandt L (2006) PLS Path Modeling ndash A Software Review SFB 649 Discussion Paper 2006-084 Berlin Humbold-University
Tenenhaus M Vinzi VE Chatelin Y-M Lauro C (2004) PLS path modeling Computational Statistics amp Data Analysis 48(2005)159 ndash 205
317 Summary
The prior descriptions show that a number of evalu-ation designs of sufficient methodological rigour are available that can provide reliable empirical evidence about the impact of CCA projects This sec-tion gives advice on which design(s) to choose based on the respective project characteristics Here it is again important to note that the applicability of a design primarily depends on the aggregation level at which an impact is generated (cf Section 1) Accord-ingly since many CCA projects operate on more than one level a combination of two or more evalu-ation designs might be necessary in order to assess the total impact balance of a project This complies with the need to combine qualitative and quantita-tive methods and triangulate data methods and researcher perspectives
At the individual level the decision which design to choose depends firstly on the existence of baseline data As explained in the previous sections three designs namely experimental quasi-experimental and regression discontinuity designs require such data This necessarily means that these designs can only be applied if they were drafted during the planning of the project If this is the case the next question is whether or not the beneficiaries were selected at random If this condition is also fulfilled in principle an experimental design can be applied provided sufficient resources are available to do so As described in 311 RCTs are quite costly due to the laborious data collection process which usually calls for the assignment of a large team to collect data It should also be said though that an RCT provides the highest internal validity and allows for clear impact attribution
If the project design does not allow for a random assignment of the treatment group a regression discontinuity design may also be feasible How-ever such a design requires the treatment group to be selected based on a specific outcome variable of interest (eg proximity to a disaster-prone area) If this is not the case a quasi-experimental design may be a feasible alternative The time and budget requirements of these two designs are compara-ble with those of an experimental design with the constraint that RDD might require a larger sample in order to identify sufficient cases that are close enough to the lsquothreshold levelrsquo to be compared With regard to the validity of the findings and their informative value we should add that while RDD-based evaluation findings are restricted to groups that are quite similar findings obtained using a quasi-experimental design can almost approxi-mate those of an RCT if the samples are adequately matched (eg with propensity score matching)
In case no baseline data has been collected before-hand two further rigorous evaluation designs may be used the pipeline approach and the panel design Both designs have further requirements the pipeline approach requires that the project be implemented sequentially (eg in different regions with differ-ent target groups) and the panel design that a larger sample size be available to enable reliable estima-tion of the impact It should also be considered that while a pipeline approach enables the attribution of impacts to an intervention a Panel Design lsquoonlyrsquo allows the contribution of an intervention to an observed change
If none of the above prerequisites can be satisfied most likely only a so-called ex-post facto design
3 Rigorous evaluation designs and exam
ples of applicability in climate change adaptation projects
Impa
ct E
valu
atio
n G
uide
book
for C
limat
e Ch
ange
Ada
ptat
ion
Proj
ects
34
with or without (single) comparison with a non-intervention group or with reconstructed baseline data may be possible However such a design is not regarded as lsquorigorousrsquo as it cannot provide for an attribution or contribution analysis
Based on these selection criteria the following deci-sion tree can be used to identify the lsquorightrsquo evaluation design for interventions that aim to generate impact at individual level
Figure 6 Decision tree for selecting an evaluation design for measuring impacts at individual level
Baseline data available
Random assignment of treatment group
Sequential implementation of project
yes no
yes
RCTQuasi-
experimental design
yes no
Pipeline approach
Regression discontinuity
design
Treatment group assignment according to specic criterion
Ex-post facto design (no RIE)
yes no
Panel design
yes
Large sample size possible
no (matter)
no
If an intervention aims to generate an impact at institutional level four rigorous evaluation designs are suitable Three of them have been previously introduced pipeline approach panel design and structural equation modelling (SEM) A potentially suitable design not discussed before is a time-series cross-sectional approach (TSCS) As already dis-cussed the pipeline approach requires a sequential implementation of the project in order to be appli-cable leaving three for those that are not As also discussed a panel design can only be applied if the sample (here of institutions eg governmental or non-governmental organisations enterprises) is large enough for statistical calculations (approx 30) If the intervention only focuses on a few institu-tions but at least about 10 repeated observations are possible then a TSCS might be the design of choice (see annex 54) Finally if none of these conditions can be fulfilled SEM is the only lsquorigorousrsquo option to
provide meaningful evidence about the impact of an intervention operating at the institutional level although it should be added that SEM like panel and TSCS designs can only provide for the estimation of its contribution On the positive side we should note that the latter three designs can be implemented with considerably less resources provided that sta-tistical data of sufficient quality are available for quantitative analysis
With regard to interventions geared to the system level (eg SWAPs government advice) the same selection of designs is basically available except the pipeline approach (due to the lacking comparabil-ity of sectors or countries for instance) Therefore in the following figure a joint decision tree for both intervention levels summarises the available choices of RIE approaches for institutional and system-level interventions
Phot
o copy
GIZ
Ran
ak M
artin
35
Figure 7 Decision tree for selecting an evaluation design for measuring impacts at institutional and system level
Sequential implementation of project
yes
Time-series cross-sectional approach
(see annex 54)
Structural equation modeling
yes no (matter)
Pipeline approach
Large number of repeated data collections possible
Panel design
yes
Large sample size possible
no (matter)
no
Decision tree for measuring system-level outcomes
Finally in table 3 on the next page all suggested RIE designs are listed with brief summaries of the impact level they are suitable for the project characteris-tics that must be in place the data time and budget requirements the validity of the analysis findings and their informative value (ie if they enable attri-bution or contribution analysis)
32 Providing reliable large-scale data
As outlined above empirical data is the founda-tion of any evaluation ndash and more or less of applied social sciences in general whether they are collected during the research process (ie lsquoprimary datarsquo) or reanalysed on the basis of statistical or documentary data (ie lsquosecondary datarsquo) Moreover impact evalu-ations mostly require data collections on a large scale in order to provide empirical evidence about the changes that have occurred in an interventionrsquos sphere of activity Such data is usually collected by means of a survey Surveys are used when mostly quantitative data from a considerable number of people eg all or a significant share of the projectrsquos beneficiaries non-beneficiaries or more generally residents of a certain area or particular social strata needs to be analysed During the data analysis sta-tistical parameters such as average means shares or distribution measures (eg standard deviation quan-tiles) of a given population (ie descriptive statistics) are calculated Provided that the data is collected from a random sample of sufficient size (see further elaborations below) probabilities regarding the val-ues and distribution of certain parameters in a larger
population can also be estimated (ie inferential sta-tistics) In the following the methodological aspects to be considered when collecting quantitative data by means of a survey are discussed with particular focus on an appropriate sampling strategy
Surveys often deal with knowledge opinions atti-tudes beliefs behaviours plans backgrounds devel-opments or assessments of the respondents The primary survey tool for data collection is the ques-tionnaire With a questionnaire (in contrast to an interview guideline) all respondents are asked the same questions in the same order The information gathered by a survey is often used to identify varia-tions of these parameters between different points in time (ie in order to identify developments) or dif-ferences between groups (eg in order to attribute the outcomes to a certain intervention or to reveal sys-tematic differences due to group characteristics such as gender age etc) or both With a survey infor-mation is collected in a systematic structured and mostly standardised way Structuring the subject of a survey means that not all potentially available infor-mation is relevant but only data that help to describe andor assess a certain measure development or framework characteristic Standardisation means that the respondents can choose from a number of answer options and that these options are grouped according to a predefined categorical system This means that the data is statistically calculable and consequently survey findings are comparable Such a categorical system can be dichotomous nominal ordinal or metric Table 4 contains an example of each single-choice question
3 Rigorous evaluation designs and exam
ples of applicability in climate change adaptation projects
Impa
ct E
valu
atio
n G
uide
book
for C
limat
e Ch
ange
Ada
ptat
ion
Proj
ects
36
Table 3 Required project characteristics and data
Evaluation design
Impact level Required project characteristics
Data requirements Time and budget requirements
Validity of findings Explanatory power
Experimental (RCT)quasi-experimental
Micro (individual) level
z Distinguishable treatment group
z RCT requires random assignment to treatment and comparison group
z Ex-ante (baseline) and ex-post data from treatment and controlcomparison group
z Depending on the size and accessibility of the target group
z Data collection process often quite costly as a large team of enumerators is needed
z RCT has highest internal validity
z Internal validity of quasi-experimental design depends on selection bias
z External validitytransferability depends on comparability of framework conditions
z Enables impact attribution at target group level given a sufficient sample size
Propensity score matching
Micro level z Discriminable treatment group
z Individual characteristics relevant for the treatment effect (covariates) must be observable
z Ex-ante and ex-post data from treatment and comparison group
z Data collection must include covariates
z Increases the costs of quasi-experimental designs as usually larger samples are necessary in order to identify sufficient matches
z Comparison group sample must be considerably larger
z Internal validity depends on completeness of covariates
z External validitytransferability depends on comparability of framework conditions
z Same as above
z Application in quasi-experimental designs can contribute to improved quality of findings
Pipeline approach
Micro and meso (institutional level)
z Project needs to be implemented in phases
z Treatment groups of each phase must be comparable
z Ex-ante and ex-post data from each group
z In principle comparable to quasi-experimental designs whereby costs increase with every round of data collection
z Internal validity of quasi-experimental design depends on comparability of groups
z External validity depends on comparability of framework conditions
z Same as above
z Allows for identifying time-variant effects if applied according to quasi-experimental design
Regression Discontinuity Design
Micro level z Treatment group must be selected according to a specified criterion
z Sufficient number of comparable cases
z Larger sample size than for experimentalquasi-experimental
z Comparable with quasi-experimental design mostly depending on sample size
z Internal validity restricted to comparable cases
z Enables impact measurement for individuals who have similar characteristics
Time series All levels z Panel focusing on individuals households organisations
z TSCS focusing on sectors countries regions
z Panel large sample size few repeated data collections
z TSCS sample size irrelevant large number of repeated data collections
z Depending on data availability individual data collections can be implemented quite cost-efficient
z Costs increase with length of panel and sample size
z Panel validity depends on compliance of sample size with statistical requirements (cf 331)
z TSCS validity is restricted to sample
z Provides reliable assessments of the contribution of an intervention to an observed change
z Makes it possible to control time-variant influences
Structural Equation Modelling
Meso and macro (system) level
z Focusing on entire sectors countries regions
z Statistical andor empirical data for each model- relevant construct
z Depending on data availability can be implemented cost-efficiently if combined with statistical data
z Validity depends on model fit (ie to what extent the endogenous construct is explained by the model)
z Enables contribution assessment and time-variant and invariant influences
37
Table 4 Example of question types
Question type Question Answer options
Dichotomous question What is your gender male female
hellip with nominal scaled answer options Where do you come from area 1 area 2 area 3 other area ________________
hellip with ordinal scaled answer options How do you assess the development of your livelihood situation in the last year
Deteriorated considerably Deteriorated slightly Did not change at all Improved slightly Improved significantly
hellip with a metric scaled answer option What is your monthly income _____ euromonth
It has to be added that for ordinal-scaled answer options that reflect a rating (eg satisfaction quality) it is important to lsquobalancersquo the answer options mean-ing that an equal number of positive as negative answer options must be provided in order to avoid biased findings
Besides single-choice questions there are also multi-ple-choice questions for example
What are your income sources (multiple answers possible)
Farming Livestock Fishery Temporary work Other hellip None
When analysing multiple-choice question data it has to be taken into account that it might be necessary (eg for calculating average means) to transform the data into separate lsquodummy variablesrsquo with dichoto-mous scales for each answer option (ie yesno for farming hellip for livestock etc)
When a survey is conducted its objectives and the information required to meet these objectives need to be considered first For this it makes sense to ask the following questions
Questions for identifying the survey objectives
` Which indicators need to be measured ` Who will use the information and how
Which decisions are depending on the survey findings
` Are there any particular expectations about the survey findings When are the findings of the survey considered positive or negative Or what would be a good or a bad finding
` Which information can the respondents pro-vide How does this match the information needs
` Which factors could have a negative impact on data collection Do the respondents have and remember the necessary information Might they be reluctant to answer Do they have the (verbal cognitive) capacities to answer correctly
Selecting a survey approach
After having defined the surveyrsquos objectives and information needs the survey approach can be specified giving consideration to the available and required resources The required financial human and time resources mainly depend on the size of the population that has been defined (as the target or comparison group) its spatial distribution and the logistical framework conditions in the area where the survey is implemented Furthermore the length and complexity of the questionnaire considerably influences your resource demands In order to get a better idea of how much time is needed it may be helpful to prepare a list of the individual tasks and estimated time needed for each task such as clarify-ing the survey objectives and sampling approach designing and testing the questionnaire collecting managing and analysing the data and reportingcommunicating the survey findings The following table shows what such a to-do list might look like
Phot
o copy
GIZ
Ala
n W
alsc
h
3 Rigorous evaluation designs and exam
ples of applicability in climate change adaptation projects
Impa
ct E
valu
atio
n G
uide
book
for C
limat
e Ch
ange
Ada
ptat
ion
Proj
ects
38
Table 5 Exemplary to-do list for preparing a survey
Task When Who Requirements
Clarification of survey objective First two weeks in January Project staff Results framework sample selection
Development of draft question-naire
By 31 January Evaluator in coordination with project staff
Clarification of information needs development of survey items
Pre-test of questionnaire 1 to 10 February Evaluator together with enu-merator team
Logistical preparation informa-tion of target groups accessibil-ity of target groups
Finalisation of questionnaire By 15 February Evaluator Consolidated feedback from the pre-test
Implementation of survey 16 to 31 February Enumerators coordinated by evaluator
Logistical support by partner staff etc
Data entry 1 to 5 April Enumerators coordinated by evaluator
Availability of technical infra-structure (notebooks software etc)
Data quality check 6 April Evaluator Full data set
Data analysis 7 to 15 April Evaluator Quality-assured data set
Integration of survey findings into evaluation report
16 to 30 April Evaluator Data analysis findings
Presentation of findings 1 May Evaluator and project staff Technical infrastructure for presentation (notebook projec-tor etc)
On the basis of such a timetable the costs of the sur-vey can be estimated These usually comprise logisti-cal costs (eg for traveltransportation accommoda-tion per diems) expenses for survey materials and the remuneration of the survey team
Surveys are usually carried out face-to-face or elec-tronically mediated (eg by telephone email or a web-based application) Both face-to-face and elec-tronically mediated surveys can be self-administered (ie the respondent fills out the questionnaire) or assisted (ie the surveyor fills out the questionnaire or at least supports the respondent in doing so) As all options have their advantages and disadvantages aspects such as the complexity and comprehensibil-ity of the survey topics the skills and accessibility of the potential respondents and the available time budget and human resources need to be considered Particular attention has to be paid to the aspect of the confidentiality of the information and the ano-nymity of the respondent when personal data (eg age income health status) are collected Ensuring anonymity is often an issue when it is necessary to be able to trace responses to individuals such as in panel surveys (cf 315) or when third parties (eg project staff beneficiaries) are tasked with data collection In those cases it might be necessary to separate the personal data from the survey data and link the data sets using a list of identification codes which can only be accessed by the people who are tasked with analysing the data
Selecting a sample
Due to time and budget constraints it is often not feasible to conduct a full population survey ie col-lect data from every potentially relevant respondent (eg beneficiary project participant) In such a case it is necessary to collect a sample ie to select respond-ents from the population However the findings of a sample population might be different to those from a survey of the entire population These disparate findings are induced by the so-called selection bias (see also 311) which can be reduced by various sam-pling techniques The common objective of these techniques is to approximate the sample characteris-tics to the characteristics of the full population rele-vant for the survey (eg the share of male and female respondents or the share of respondents from rural and urban areas) Doing so is necessary in order to draw conclusions from the survey findings with ref-erence to that population bearing in mind certain statistical quality criteria as further outlined below
In order to draw such conclusions the size and dis-tribution of the population for which the sample should provide representative findings needs to be identified For instance if the survey is to be used to identify the impact of a certain intervention (eg nationwide information campaign) on the behaviour of target groups (eg farmers adopting a new farm-ing method) in different provinces then it needs to be determined who constitutes the basic population (ie all farmers of the country) and how it is distrib-uted among the provinces (eg number of farmers in each province)
39
Once the basic population has been identified two sampling strategies are available probability (ie randomised) and non-probability (ie non-ran-domised) sampling Probability sampling means that each individual of a given population has the same known non-zero probability of being included in the sample ie it is randomly selected Non-probabil-ity sampling means that the chance of being selected for the survey differs among the population (eg due to accessibility or ability to participate) In the latter case findings based on the sample may not be gen-eralised without giving further thought to how to establish representativeness 23 otherwise (see below)
Only probability sampling (ie random sam-pling) makes it possible to calculate statistical parameters that inform use of the true value of a parameter in a basic population
Probability sampling
If probability sampling is applied it is possible to draw statistically valid conclusions from the survey findings for a population bearing in mind three sta-tistical parameters the aspired margin of error the level of confidence and the degree of variability These criteria are briefly explained below
The margin of error (also called lsquosampling errorrsquo or lsquolevel of precisionrsquo) indicates the maximum differ-ence of the value of a certain characteristic between the sample and the population ie the range in which the true value of the population is estimated This difference or range is usually defined in per-centage points (eg 1 5 10) For instance if a 5 margin of error is defined and your sample shows that 50 of the respondents adopted a new farming method the actual proportion of the basic popula-tion who did so is somewhere between 45 and 55 This is subject to a certain level of confidence see next paragraph
The level of confidence expresses the probability with which the actual sample value lies within the before- mentioned margin of error It is based on the assumption that if a sample is repeatedly (ran-domly) drawn from a given population the average value of an observed characteristic in this sample approximates to the true value of this characteristic in this population Furthermore the sample values are distributed lsquonormallyrsquo around this true value (ie
23 It has to be added that lsquorepresentativenessrsquo is not a defined statistical term but rather colloquially used to signify that a sample has been composed according to the prevalence of particular characteristics of the basic population
their frequency distribution follows a specific so-called lsquoGaussianrsquo function see the following figure) In practice confidence levels of between 90 and 999 are usually chosen A confidence level of 95 for instance means that in 95 out of a 100 samples the sample value would lie within the margin of error as specified before In other words there is a 5 chance that the sample value will deviate from the true population value by more than the defined mar-gin of error
Figure 8 Distribution of sample mean values in relation to the true population mean value
True value of a certain characteristic of the basic population
Range of mean values in eg 95 of all samples
Finally the degree of variability refers to the het-erogeneity of the population with regard to an observed characteristic ie how this characteristic is distributed in the given population The more het-erogeneous the population the larger the sample size necessary to reach a certain level of precision In this context 50 is the highest degree of variability because it indicates that half of the population has a certain characteristic (eg has adopted a new farm-ing technique) while the other half does not Annex 56 contains an introduction on how to calculate the appropriate sample size bearing in mind the above- mentioned statistical parameters
Non-probability sampling
As probability sampling requires all respondents to be within reach during data collection regardless of the required resources it may not always be feasible to apply such a strategy In that case non-probability sampling may be applied which requires the iden-tification of characteristics of the basic population that are relevant for analysis in order to establish representativeness For instance if the survey is intended to enable conclusions about the extent to which the impact depends on age gender ethnic affiliation etc information needs to be gathered about the composition of these characteristics in the population We should mentioned that while with non-probability sampling it may be possible to
3 Rigorous evaluation designs and exam
ples of applicability in climate change adaptation projects
Impa
ct E
valu
atio
n G
uide
book
for C
limat
e Ch
ange
Ada
ptat
ion
Proj
ects
40
develop plausible assumptions about a population the quality of these assumptions cannot be tested statistically and thus rely solely on the expertise of the researcher For non-probability sampling three common techniques may help to approximate the sample composition to the composition of the basic population systematisation stratification and clus-tering
Non-probability sampling does not make it possible to calculate statistical parameters
The representativeness of a sample relies on the knowledge about the basic population
Systematisation is an option when sufficient data about the basic population is available so that in principle each potential respondent can be identi-fied Ideally a comprehensive list is available that is used to draw the sample according to a particular selection scheme based on the individual data Such a scheme can for instance be oriented towards a tar-geted sample size (eg every 10th person) on logis-tical considerations (eg one household from each street village etc) or a certain threshold level (eg only families with more than three children or below a certain income) Which scheme is applied basically depends on the intervention logic (eg activities aim-ing at the poor) and the intended type of representa-tiveness (eg equal spatial representation)
A particular way to receive more specific findings is to stratify a sample Stratification means that a predefined number of individuals from each ana-lytically relevant sub-group of a population (eg age groups residence areas gender) is included in the sample Here too data about the composition of the basic population is necessary at least on a global level The intention is usually to match the sample composition with the composition of the popula-tion ie ensure that the proportions of each sub-group in the sample and in the population are equal in order to achieve representativeness (ie propor-tional sampling) However it may also be necessary to draw a disproportional sample eg due to logisti-
cal or budget constraints (eg 100 households per region) If that is the case then the cases for each sub-group need to be weighted reciprocally during data analysis So if for example a certain group represents 20 of a basic population but has only a share of 10 in the sample its cases need to be weighted by the factor two during the analysis
Clustering a sample may be helpful if it can be assumed that the sub-groups of a population show a sufficient degree of intra-group homogeneity ie that the individuals in each sub-group are similar with regard to a certain research question and inter-group heterogeneity ie that the individuals of dif-ferent sub-groups differ considerably in that regard If for example a project focuses on both several urban and rural areas and differences of its effec-tiveness in these areas are to be analysed it might be sufficient to conduct a full-population survey in one urban and rural area instead of taking samples in each area provided the residents in the respective areas show some commonalities that are relevant for the analysis (eg high incomes in urban areas low income in rural areas)
Finally we should note that other techniques exist for non-probability sampling in addition to those outlined above However other techniques such as convenience sampling (ie selecting individuals who are easiest to reach) or theoretical sampling (mainly used in explorative qualitative research) may not be applicable in rigorous evaluation designs as it is unlikely that they provide representative data Hence these techniques are not further discussed here
We recommend the following books articles and working papers for further reading on methodological requirements to collect quanti-tative data by means of surveys
Fink A (2003) How to Sample in Surveys The Survey Kit 2 Edition Thousand Oaks Sage Publications
Israel GD (2012) Determining Sample Size Gainesville University of Florida
Phot
o copy
GIZ
Har
ald
Fran
zen
41
In this last chapter the outlined methodological options and requirements are discussed by means of a practical case study The case study is based on a GIZ project entitled lsquoUrban Management of Inter-nal Migration due to Climate Changersquo that began in January 2015 and is being implemented on behalf of BMZ in two cities in Bangladesh The objective of the case study is to illustrate the possibilities for pro-viding empirical evidence about project impacts by applying an elaborated evaluation design that satis-fies scientific standards It will also be investigated which organisational and logistical precautions need to be taken to enable efficient data collection and analysis After a brief description of the project (41) two exemplary designs for measuring its impact are presented (42) followed by a draft of their practical implementation (43)
41 Background and project objectives
In Bangladesh climate change is considered to be one of the most important challenges Climate-related internal migration is jeopardising the over-all social stability of the country Climatic changes induce extreme weather events such as floods extreme precipitation and droughts In Bangladesh 40 out of 64 districts are affected by the impacts of climate change According to estimations six mil-lion people have already migrated due to weather and climate stresses of whom the majority lives in urban slums Especially in Khulna and Rajshahi the proportion of migrants is very high (70 of slum dwellers are migrants) For poor and vulnerable households migration is a crucial diversification and adaptation strategy However this can lead to acute vulnerability and have conflict-exacerbating effects if migrants who live in urban slums with inadequate infrastructure no access to basic services or income opportunities receive hardly public support from local government and administrative structures It is true that the decision to migrate is multi-causal that means that it is due to political social economic
demographic and environmental factors However in the two preselected cities experts believe that cli-mate and weather-related stress factors play a domi-nant role in migrantsrsquo decision to leave their homes In Rajshahi rising temperatures and drought declin-ing groundwater levels and river flooding threaten the population whereas in Khulna the population faces storms and storm surges extreme precipita-tion water logging and groundwater salinisation According to estimates the urban population (today 34) will exceed the rural population (today 66) by 2040 if economic opportunities do not reach the countryside
The core problem in the current situation is that so far there are no needs-oriented measures to improve the living conditions of climate migrants 24 in Khulna and Rajshahi City master plans do not address the influx of migrants This problem is caused by a lack of capacity of local governments and municipalities to deal with the challenges of climate-related inter-nal migration Public investment in the development and expansion of a basic infrastructure to mitigate the pressure on resources such as water energy food and housing is insufficient There is a lack of poli-cies and measures to manage settlement develop-ment Nor is there any data or information base on the movement of climate migrants to cities and their (urgent) needs This situation leads to an explosion of the population in these urban areas increasing pov-erty congested infrastructure and basic social ser-vices shortages of resources increasing distribution and opportunity conflicts and eventually reduced economic development opportunities for the entire population As urban development is a priority of the 6th Five-Year-Plan 2011ndash2015 (ie infrastruc-ture development promotion of economic activi-ties) national policies indicate that there is potential for change However there is a considerable gap between strategy and implementation
According to this situation the objective of the pro-ject is to improve the living conditions of climate migrants in preselected settlements in the divisional capitals Khulna and Rajshahi through needs-ori-ented measures 25
24 The International Organization for Migration (IOM) produced a definition of climate migrants as lsquopersons or groups of persons who for compelling reasons of sudden or progressive changes in the environment that adversely affect their lives or living con-ditions are obliged to leave their habitual homes or choose to do so either temporarily or permanently and who move either within their country or abroadrsquo
25 Since it is an integrative approach other inhabitants of the set-tlements will also benefit from improved basic urban services vocational training and temporary employment opportunities
4 Case study Urban Management of Internal Migration due to Climate Change
Impa
ct E
valu
atio
n G
uide
book
for C
limat
e Ch
ange
Ada
ptat
ion
Proj
ects
42
Four indicators were defined to achieve the project (module) objective
y In Khulna and Rajshahi X inhabitants of Y lsquohot-spotsrsquo with a high concentration of climate migrants have improved access to basic urban services (eg water energy or sewage systems through well drilling solar home systems or the construction of drainage ditches)
y In Khulna and Rajshahi X inhabitants of Y hot-spots with a high concentration of climate migrants have participated in labour-intensive measures for the expansion and building of a cli-mate-resilient basic infrastructure of whom Z are women
y In Khulna and Rajshahi in Y hotspots with a high concentration of climate migrants participants in needs-based general education and vocational training courses increased their income by X
y In each city the city corporations developed and tendered X project proposals for needs-based and labour-intensive measures for the expansion and building of climate-resilient basic urban ser-vices (eg health education water energy supply waste waterrefuse) as well as for the promotion of local economic development with the support of the Ministry of Social Welfare
In order to achieve this objective the project focuses on three intervention areas for which particular measures are currently being planned
1 Providing access to social services to the target groups by improving and extending existing services and adapting them to the needs of the migrants (eg finding social housing providing health and sanitation services) and raising the awareness of social workers for the needs of cli-mate migrants
2 Providing short-term income opportunities through labour-intensive work in and outside slum areas and providing access to basic infra-structure by its improvement together with city corporations and civil society
3 Providing long-term income opportunities by developing and implementing skills develop-ment measures in cooperation with training cen-tres and formal and informal SMEs in different sectors
Various Capacity Development measures will be implemented by long-term and short-term experts and financial support will be provided to upgrade slums and enhance resilience Particularly in the third intervention area cooperation is also planned with the local economy and training providers
It should be highlighted that the project is the first of its kind in German development cooperation to deal with the issue of climate-induced (internal)
migration The project therefore has an innovative and pilot character and aims to showcase a variety of measures to deal with climate-induced internal migration The integration of climate change adapta-tion into urban development planning and the con-tinuation of successful measures will be strengthend by other projects implemented by GIZ KfW and BGR
Selection of an impact evaluation design
In order to decide which evaluation design(s) could be suitable for measuring the impact of the project it makes sense to revisit the table at the end of Sec-tion 31 that summarises the characteristics and requirements of the discussed designs Looking first at the required project characteristics we should consider where the project aims to generate tangi-ble results that can be empirically verified Accord-ing to the project description the measures target climate migrants who constitute a distinguishable target treatment group as they are a sub-population of the entirety of residents in the intervention areas This treatment group however is not randomised but rather selected based on predefined criteria such as the settlements (lsquohotspotsrsquo) and their socio-eco-nomic status (lsquoclimate migrantsrsquo) Hence an experi-mental design does not come into consideration As the project description does not indicate a sequen-tial implementation of the measures a pipeline approach is also out of the question However if the project is scaled up at a later stage such an approach would still be feasible based on the data gathered by the design proposed below
Another feature of the treatment group is that it has individual characteristics that are likewise relevant for their selection and the treatment effect As these characteristics are in principle observable (eg eco-nomic situation migration background family sta-tus) both propensity score matching and a regression discontinuity design are in principle feasible With regard to the long-term measurement of treatment effects and their sustainability beyond the project implementation period a household panel appears to be suitable However according to the description of the framework conditions the migrant population fluctuates considerably Such a fluctuation will prob-ably result in a very high panel mortality ie par-ticipants dropping out from the sample that would undermine the significance and reliability of the findings Another feature of the project is that it does not focus solely on directly supporting individual climate migrants but also aims at improving social services and basic infrastructure which again should contribute indirectly to the improvement of the liv-ing conditions of these migrants and the population in the intervention areas at large Such a lsquosystemicrsquo approach calls for the use of structural equation
43
models which make it possible to measure the influ-ence of changed framework conditions on a popula-tionrsquos livelihood
Coming next to the data requirements the selec-tion of particular settlement areas makes it possible to create comparison groups ie migrants who are not supported by the project Furthermore as the evaluation is planned before the project activities start it should be possible to collect baseline data from both the treatment and comparison groups Since the project description does not provide any indication that measures in the selected settlements will be restricted to a certain sub-population of the potential target groups (ie there is no threshold level according to which the beneficiaries are selected) comparison groups need to be selected in spatially
remote areas This again makes it impossible to apply an RDD approach Nor would an RDD be recom-mended if such a restriction were made because the design of the measures facilitates spill-over effects which will likely bias the comparison findings With regard to the system-oriented measures the development of SEMs should be feasible provided that statistical or empirical data can be made avail-able for the required models throughout the project implementation (ie by the continuous results-based monitoring system) This is required to describe the relevant elements that constitute the framework conditions of the migrant population The following table summarises the applicability of the different evaluation designs based on the project characteris-tics
Table 6 Applicability of evaluation designs
Evaluation design Required project characteristics
Full-filled
Data requirements Full-filled
Experimental (RCT)
Distinguishable treatment group Ex-ante (baseline) and ex-post data available from treatment and control group
Random assignment to treatment and comparison group
ndash
Quasi- experimental with PSM
Distinguishable treatment group Observable individual characteristics relevant for the treatment effect
Pipeline approach
Sequenced project implementation ndash Ex-ante and ex-post data available each group na
Comparable treatment groups in each phase
na
RDD Selection of treatment group according to a specified criterion Sufficient number of comparable cases
(close to a threshold level)ndash
Time-series Panel focusing on individuals households organisations Panel large sample size few repeated data
collectionsndash
TSCS focusing on sectors countries regions
ndash TSCS sample size irrelevant large number of repeated data collections
na
SEM Focusing on entire sectors countries regions Statistical andor empirical data for each
model-relevant construct Unlikely to be achieved due to foreseeable panel mortality
Since PSMs and SEMs appear to be the most promis-ing approaches to measure the impact of the project we will go on to outline how the data collection pro-cess could be organised and what the related meth-odological and practical requirements are
42 Practical implementation
Starting with PSMs it first has to be clarified who constitutes the treatment and comparison group and how appropriate samples can be selected In the second step the hypotheses to be tested and the necessary indicators have to be developed Then we
need to consider which covariates have to be col-lected in order to enable the matching of cases (eg age gender place of origin duration of stay in target area education level ethnic affiliation marital sta-tus) Finally the data collection plan and instruments have to be developed
Based on the project description it is easy to iden-tify who should belong to the treatment climate and floating migrants in selected settlements as well as other poorest people in Khulna and Rajshahi Equally easy to identify is who should belong to the compari-son group climate migrants in settlements in these cities where no project activities are implemented If such settlements cannot be identified it would also
4 Case study U
rban Managem
ent of Internal Migration due to Clim
ate Change
Impa
ct E
valu
atio
n G
uide
book
for C
limat
e Ch
ange
Ada
ptat
ion
Proj
ects
44
be acceptable to choose climate migrants in other cities who face the same problem provided these cities are comparable in terms of the characteris-tics that were decisive for the selection of the pro-ject location As it can be assumed that the targeted population is rather large and the actual proportion presenting the characteristic of interest (improved living conditions) is not known beforehand the sample size should be calculated according to the first formula outlined in Section 56 (annex) The for-mula approximates a sample size of 400 for infinitely large populations with a level of confidence of 95 and an aspired margin of error of 5 26 Consider-ing the conceivable attrition loss during the data collection process a target gross sample size of 600 for the treatment group and at least 800 to 1000 for the comparison group (in order to receive sufficient matches) should be aimed at Depending how the dissimilarity of the socio-economic framework con-ditions in Khulna and Rajshahi is assessed it further has to be decided whether it is sufficient to split one sample across both cities ndash ie if they are generally comparable ndash or if the sample size needs to be dou-bled ndash ie if the framework conditions differ consid-erably with regard to the characteristics of interest
Next it has to be decided which hypotheses are to be tested and which data needs to be collected So far the project objective has been operationalised by four indicators of which three directly refer to the living conditions of climate migrants (1) access to lsquourban basic servicesrsquo (2) participation lsquoin labour-intensive measuresrsquo and (3) having an lsquoincreased incomersquo Leaving aside the question whether these indicators cover the entirety of factors that define the quality of lsquoliving conditionsrsquo ndash which however needs to be revisited during the development of the data collection instruments ndash it has to be clarified what information is needed to verify or disprove their achievement With regard to the first indicator such information would comprise for instance data on the types of existing services their general acces-sibility and finally the actual use of these services by the target group Of course such data would have to be collected for both the treatment and comparison group before and directly after the project imple-mentation and ideally again another three to five years later in order to assess the sustainability of the project measures
26 It should be noted that the proposed level of confidence and margin of error represent the lowest common accepted param-eters for inferential statistics It is up to the evaluation team to decide on stricter values which however will result in a need to collect considerably larger samples
Concerning the second indicator it may seem easy to provide empirical evidence about its achievement ie by comparing the factual number of participants with the targeted number It is however question-able whether the indicator actually makes it pos-sible to measure an impact since participation in a labour-intensive measure does not say anything about the living conditions of the migrants Since the outcome of their participation (eg the generated income and created infrastructure) can rather be considered to influence their living conditions it is recommended to revise this indicator
While the relevance of the third indicator for the impact to be measured is again clear it must be borne in mind that the findings are likely to be biased by contagion effects ie that income has been increased by sources other than the ones created by the project Therefore further qualitative data needs to be collected on the income sources and how and why they were obtained Furthermore it has to be remembered that providing information about onersquos own income may be a sensitive issue Hence data on proxy indicators such as private properties number of meals per day or school attendance of children (etc) has to be collected
In order to obtain a comprehensive picture about the net impact of the project it is further necessary to also gather information about its unintended positive and negative impacts Therefore it must be considered who else apart from the migrants might be affected by the project activities which secondary effects could be caused or how the project objectives interfere with partner strategies andor the activities of other donors For assessing the effectiveness of the particular project measures and helping to attribute the observed effects it is also necessary to collect data on the participation of the target group (eg in labour-intensive or training measures)
Finally to enable matching of the treatment and comparison group data covariates need to be col-lected that have to comply with the lsquostability cri-terionrsquo outlined in Section 53 This could be for instance the origin of the migrant his or her ethic and religious affiliation age gender and family sta-tus etc However we also have to bear in mind not to use variables such as profession socio-economic sta-tus type of migrant and so on as the project meas-ures (eg further training income generation) may influence these characteristics
The following table summarises the indicators data requirements data collection instruments and anal-ysis methods discussed above that would be part of the data collection plan for the migrant survey
45
Table 7 Draft (simplified) data collection plan
Indicator Required data Data collection instrument
Data analysis method
Improved access to basic urban services
Types of services provided Document analysis observation (for empirical verification)
Qualitative comparative analysis
General accessibility of service A B C hellip further operationalized eg by number and distribution of access points costs per service use capacities of service in terms of no of customers per day service can be provided to
Document analysis observation migrant survey
Qualitative and quantitative (double-difference) comparative analysis
Actual use of services by migrants disaggregated by eg types used frequency of use by type costs of use in relation to income
Migrant survey focus group discussion
Quantitative comparative analysis
Increased income Current income and income sources of migrants (operationalized by proxy indicators)
Migrant survey Quantitative comparative analysis
Further indicators for measuring the living conditions of the migrants
Further indicators for measuring the unintended effects of the projects
Further indicators about participation in project measures
Covariates eg origin ethnic and religious affiliation age gender family status
Migrant survey Used for calculating the propensity score
The draft shows that there are a number of blank spots that need to be looked into further regarding the operationalisation of impacts the project activi-ties and the covariates required for matching
Coming now to the structural equation model-ling (SEM) the first step is to identify the constructs that are relevant for the model Without further knowledge about the framework conditions and project measures such a model can only be roughly sketched However based on the project design its outputs in the three intervention areas (in terms of the capacities created for basic urban services train-ing as well as short-term and long-term income opportunities) can be considered as exogenous con-structs that aim to influence the living conditions of the migrants A further exogenous factor would be the general framework conditions as determined by
political strategies (eg government budget alloca-tion to infrastructure development) or economic societal and environmental developments (eg regional economic power number of small and medium enterprises migrant influx annual precipi-tation) Here we should consider whether it makes sense to further split up this construct due to its heterogeneity The living conditions of the migrants would represent the endogenous construct whereby the constitution of basic service infrastructure in the settlements could serve as another mediating construct This is on the one hand influenced by the framework conditions and the project activities and on the other hand has an influence on the living con-ditions of the migrants The following figure shows a (highly) simplified illustration of the SEM based on this outline with a few exemplary indicators for each construct
Phot
o copy
GIZ
Elm
ar F
oellm
i
4 Case study U
rban Managem
ent of Internal Migration due to Clim
ate Change
Impa
ct E
valu
atio
n G
uide
book
for C
limat
e Ch
ange
Ada
ptat
ion
Proj
ects
46
Figure 9 Simplified SEM for the GIZ project 33
Budget allocated to IF2
No of migrants in labour
No of basic services
No of customers served
School attendance of children
Self-assessed living conditions
Budget allocated to IF3
No of migrants trained
Budget allocated to IF1
No of migrants with access to
Budget for infrastructure
Migrant influx
No of SME
Total project budget
Partner contribution
Socio-econ FC
PO in IF2 (labour)
Project resources
PO in IF1 (access)
PO in IF3 (training)
Consti-tution of
infrastruc-ture
Living con-ditions of migrants
The figure shows that some of the measurement models are formative (project resources socio-economic framework conditions) while others are reflective (constitution of infrastructure achieve-ment of project outputs in the fields of intervention and living conditions of the migrants) Of course further constructs measurement models and struc-tural elements and relationships are conceivable There is however a need to define which elements the model requires in order to adequately reflect the lsquorealrsquo project situation and to enable measurement of the changes in its fields of intervention The appli-cation of the SEM requires the regular collection of the respective data ndash at least on an annual basis ndash to be able to calculate the parameters for assessing the project contributions Accordingly the indica-tors have to be included in the project monitoring system which should be developed in the course of the baseline study The latter is the first step of the impact evaluation
According to the outlined design the practical implementation of the impact evaluation should start with an in- depth document analysis and the elaboration of a detailed work plan specifying the
27 The figure was drawn using SmartPLSreg a software for developing variance-based SEMs
individual steps of data collection and analysis and the respective responsibilities Ideally before starting with the baseline study an exploratory preliminary mission should be conducted in order to gain further information for complementing the data collection plan (ie on the availability of data sources further needs of the target groups and other active actors in the intervention area) Furthermore the avail-ability of secondary data and the accessibility of the migrants for data collection the logistical require-ments and general feasibility of the evaluation design should be investigated
Once the data collection plan is finalised the data collection instruments (ie interview guidelines guidelines for focus group discussions question-naires) can be developed and tested In so doing par-ticular focus has to be placed on the socio-cultural adequacy of the instruments (eg appropriate and easy-to-understand language clear commonly understood categories in closed questions) and ndash as the survey will most likely be administered ndash the required qualifications of the interviewers (eg use of questionnaire particularly following the filtering procedure coding of answers ability to explain ques-tions if not understood by interviewees social skills)
FC framework conditions PO project outputs IF intervention field
47
After successful testing and finalisation of the instru-ments and interviewer training a sampling proce-dure should be identified that allows for randomi-sation eg by random walks through the selected settlements or by randomly selected spots (if reliable maps are available) Data collection should then start ideally simultaneously with the treatment and com-parison group in order to minimise time-induced bias Provided that the data has been collected according to the previously defined methodologi-cal standards the analysis will provide a picture of the migrantsrsquo current living conditions This will be based not only on the assessment of a few represent-atives andor experts but on a sound statistical foun-dation that makes it possible to transfer the sample findings to the entire target population This baseline data will also serve as the comparison base at a later stage for calculating the project impact
At the end of the baseline study a framework for the continuous results-based monitoring system should be developed As the monitoring system will not only be used for continuous reporting on project progress but also for the SEM analysis after project comple-tion the indicators used must satisfy the informa-tion needs of the model and thus not only focus on the project outcomes and impacts but also include data about the framework conditions The data col-lection instruments have to be adapted to suit these requirements Furthermore the timing of the con-tinuous data collection and the responsibilities have to be coordinated Given the three-year project term it may make sense to agree on a six-monthly or even quarterly collection in order to gather sufficient data (about eight to 10 cycles) for robust model calcula-tion If the measures need to be adapted during pro-ject implementation the indicators and maybe even the model need to be revised likewise
At the end of the project a second migrant survey has to be implemented according to the same meth-odological standards as for the baseline study In
combination with the baseline data the findings of that survey will be used for impact measurement and attribution as described in Section 311 Provided that the evaluation team has managed to gather the required data in line with the discussed require-ments the findings should enable valid and reliable attribution of the observed changes in the living conditions of the migrants to the project measures Due to the broad analytical perspective of the evalu-ation it should also be possible to document possible unintended effects as well as the influence of exter-nal (confounding) factors
However the project measures are not solely designed to improve living conditions in the short term Long-term effects and sustainability of the project impacts (eg climate resilience of built infra-structure) are also of interest In order to assess such long-term impacts another evaluation needs to be conducted It is recommended to conduct such an ex-post evaluation about three to five years after the project has been completed
As such an ex-post evaluation poses particular prac-tical challenges particularly regarding the retrieval of the former beneficiaries access to public authori-ties or logistical support on site (in case the imple-menting agencies are not active there anymore) it is of utmost importance to announce such an investi-gation during the project implementation phase in order to get sufficient support at a later stage There-fore all partners and further stakeholders should be made aware of its importance and supported in establishing adequate structures for future data col-lections Ideally a Memorandum of Understanding (MoU) could be agreed upon in which the responsi-bilities are clarified In return the partners could be supported in developing their own monitoring sys-tem which again might contribute to their owner-ship and understanding of the usefulness of collect-ing such data
Phot
o copy
GIZ
Ran
ak M
artin
4 Case study U
rban Managem
ent of Internal Migration due to Clim
ate Change
Impa
ct E
valu
atio
n G
uide
book
for C
limat
e Ch
ange
Ada
ptat
ion
Proj
ects
48
We will go on to present the individual tasks accord-ing to the proposed practical implementation of the impact evaluation in chronological order including
a rough estimation of the required time resources for each step
Figure 10 Draft schedule for impact monitoring and evaluation framework
` Document analysis selection of evaluation design development of a work plan (about 5 ndash 8 working days (WDs) depending on the amount of available documents)
` Exploratory preliminary mission gathering qualitative data for accomplishing the data collection plan checking the availabilityaccessibility of data sources and the feasibility of data collection (about 3 WDsrsquo preparation 3 days of travel 10 ndash 12 WDs on site 5 WDs for writing an inception report)
Preparatory tasks
` Adaptation of data collection instruments development of a resource plan and assignment of responsibilities (roughly 3 WDs)
` Implementation of monitoring system regular data collection according to data collection plan revision of data collection instruments as required (eg changing of project measures) (roughly 1-2 WDs per month depending on the monitoring data to be collected)
` Regular data analysis and reporting (about 3 ndash 4 WDs per report cycle)
` Finalisation of the data collection plan development and pre-testing of the data collection instruments (about 8 ndash 10 WDs depending on the selection of instruments and accessibility of target groups)
` Collection of baseline data data analysis and reporting (about 20 ndash 30 WDs for data collection depending on the number of available enumerators and logistical support on site about 10 WDs for data analysis 10 ndash 15 WDs for reporting incl results presentation and finalisation of ex-ante evaluation report)
` Preparation of a framework for continuous results-based monitoring system specification of indicators and data collection plan (about 5 WDs in collaboration with project team)
Baseline study
(ex-ante evaluation)
2015
` Adaptation of data collection plan and instruments review of monitoring data further document analysis (official statistics project documents etc) (about 5 ndash 8 WDs)
` Collection of final evaluation data data analysis and reporting (about 20 ndash 30 WDs for data col-lection depending on the number of available enumerators and logistical support on site about 15 WDs for data analysis 10 ndash 15 WDs for reporting incl results presentation and finalisation of ex-ante evaluation report)
Final evaluation
2018
` Adaptation of data collection plan and instruments further document analysis (approx 5 ndash 8 WDs) ` Collection of ex-post evaluation data data analysis and reporting (approx 20 ndash 30 WDs for data collection depending on the number of available enumerators and logistical support on site about 15 WDs for data analysis 10 ndash 15 WDs for reporting incl results presentation and finalisa-tion of ex-ante evaluation report)
Ex-post evaluation
20212223
Continuous results- based
monitoring2015 ndash 2018
Winding up we should point out that the above design and suggestions for its practical implementa-tion can only serve as a rough sketch which of course needs to be further elaborated during the inception phase of the research For the sake of convenience gender-related aspects or further aspects related to the living conditions of the migrants such as access to health services or education have not been dis-cussed Also the factually available resources for the evaluation and the logistical and practical feasibil-
ity of the data collection cannot be assessed without further information about the project concept and the framework conditions All the more important then to start the evaluation with an in-depth scop-ing phase to ensure appropriate data collection and analysis throughout the evaluation Valid and reli-able evaluation findings can only be produced with high-quality data In other words If the data is poor no design will save the day
49
Ndeg Project name Inst Country Design Data collection instruments Methodology
1 Noakhali Rural Development Project
Danida Bangla-desh
Ex-post facto
Quantitative analysis of project monitoring and contextual data Qualitative analysis documentary study archival work questionnaire surveys stakeholder and informant interviews rep-resentative surveys of project components assessment of buildings roads and irriga-tion canals village surveys and interviews observation focus group discussion case studies
Mixed-method approach
2 Climate Finance Readiness Pro-gramme
BMZ
GIZ
KfW
Global
3 National Ad-aptation Plan Global Support Programme
UNDP UNEP GEF
Global
4 Africa Adaptation Programme
UNDP WFP UNIDO UNICEF
Africa-wide
5 Strategic Ini-tiative to Address Climate Change in LDCs
UNDP Global
6 Climate Support Programme (CSP)
GIZ
BMU DEA
South Africa
NA ndash still ongoing
7 Public Invest-ment and Climate Change Adapta-tion (IPACC)
BMUB
GIZ APCI Ministries regional govern-ments of Cusco amp Piura
Peru (Cusco and Piura)
NA ndash still ongoing
8 Climate Change Adaptation in Rural Areas of India (CCA RAI)
GIZ BMZ
ministries Govern-ment of India govern-ments of federal states
India (Madhya Pradesh Rajasthan Tamil Nadu and West Bengal)
9 Sustainable agri-cultural develop-ment (PROAGRO I and II)
BMZ GIZ
SIDA ministries VIPFE
Bolivia (Chaco Northern Potosi Southern Cocha-bamba Valles)
Mid-Term Evalua-tion
Mainly qualitative evaluation design analysis of primary and secondary data semi-structured interviews and surveys with national counterparts strategic partners and target groups direct observation focus group discussions
Mainly qualitative evalua-tion design
5 Annex51 Overview of current CCA related-project evaluations
Impa
ct E
valu
atio
n G
uide
book
for C
limat
e Ch
ange
Ada
ptat
ion
Proj
ects
50
Ndeg Project name Inst Country Design Data collection instruments Methodology
10 Transboundary water manage-ment with the Mekong River Commission
BMZ GIZ
BMUB
Mekong River Commis-sion
Cambo-dia Laos Thailand Vietnam
NA ndash still ongoing
11
Rural Finance and Community Initiatives Project
IFAD The Gambia
Quasi-experi-mental
Field-level questionnaires focus group discussions interviews with key informants and case studies of the various community-based organisations and their members
For impact assessment the mission relied on a quanti-tative survey and participa-tory rural appraisal (PRA) exercise
12 Ghana Water Programme
CIDA Ghana Before-after
Document review key-informant inter-views internal benchmarking data from project reviews used for before vs after limited resources did not enable ex-post surveys
13 Chronic vulner-ability to food insecurity
WFP Kenya Experi-mental
Literature reviewsecondary data analysis Key Informant Discussions Participatory Vulnerability Profiles Field visits Focus Group Discussions
Study triangulates data from qualitative and quantitative sources It uses qualita-tive data from focus group discussions with community members and key-inform-ant interviews with com-munity opinion leaders and quantitative data involving about 3000 randomly sam-pled households
14 Food and Cash for Assets (FCFA) on Livelihood Resilience in Bangladesh
WFP Bangla-desh
Before-after approach
Document review On the quantitative front a household survey was conducted that covered 1500 households of participants non-participants and the comparison group Qualitative data were collected through focus group discus-sions asset assessments key-informant interviews semi-structured interviews
Mixed-method approach was adopted Participatory rural appraisal (PRA)
15 Impact of Food for Assets on Livelihood Resilience in Guatemala
WFP Guate-mala
Quasi-Experi-mental
Document review secondary data analysis and institutional Analysis community pro-file asset assessment institutional analysis household survey focus group discussion semi-structured interviews
Mixed-method approach Quantitative survey at the household level qualitative assessment of impacts at household and community levels assessment of tech-nical and biophysical assets in each community social and institutional analysis of networks and linkages at different levels especially communities
16 Impact of Food for Assets on Livelihood Resilience in Senegal
WFP Senegal Quasi-experi-mental
Document review household survey obser-vation village profiles gender-disaggregat-ed focus group discussions semi-structured interviews with major stakeholders asset assessments
Mixed-method Approach data triangulation
17 Effects of Climate Variability and Change on Household Food Sufficiency among Small-Scale Farmers of Yatta District
Journal article
Kenya Experi-mental
Desk research use of questionnaires inter-views focus group discussions observa-tions participatory vulnerability profiles development of indigenous knowledge systems
Mixed-method approach
Crop production data using Krejcie amp Morgan formula commonly used to calculate a sample size (random sampling procedure) coefficients of variation were computed for annual precipitation and then cor-related to crop production using Pearson correlation coefficient
51
Ndeg Project name Inst Country Design Data collection instruments Methodology
18 Analysis of vulnerability and resilience to climate change-induced shocks in North Shewa
Journal article
Ethiopia Experi-mental
Secondary data analysis surveys structured questionnaire interviews focus group discussion vulnerability analysis expert judgment
Mixed-method approach principal component analy-sis correlation with past disaster events ordered probit regression model use of fuzzy logic random sampling procedure
19 Vulnerabil-ity of Farming Households to Environmental Degradation in Developing Countries Evi-dence from North Central Nigeria
Journal article
Nigeria Experi-mental
Survey was used to generate household level data
Principal component analysis was used to develop vulnerability index for individual household so as to classify households depending on their level of vulnerability to environmen-tal degradation impacts use of multi-stage random sampling technique cluster analysis ordered logit regression model
20 An Index to Determine Vul-nerability of Communities in a Coastal Zone A Case Study of Baler Aurora
Journal article
Philip-pines
Experi-mental
Secondary data analysis survey (face-to-face and random) questionnaire observa-tions mappingGIS resource mapping activity workshops
Indicator method index computations following a balanced weighted aver-age approach Pearsonrsquos correlation coefficient of determination
21 Assessing House-hold Vulner-ability to Climate Change The Case Of Farmers In The Nile Basin
IFPRI Ethiopia Experi-mental
Expert knowledge use of household-level socio-economic survey interviews
Mixed-method approach Indicator and econometric method Principal compo-nent analysis correlation with past disaster events
22 Cambodia Community-Based Adaptation Programme
UNDP Cambodia Experi-mental
Secondary data analysis primary data key-informant interviews un-structured in-dividual interviews site visits observations semi-structured discussions structured Focus Group Discussions
Mixed-method data triangulation inductive and deductive approaches using quantitative and qualitative data
23 Strengthen-ing Adaptation Capacities and Reducing the Vulnerability to Climate Change in Burkina Faso
UNDP Burkina Faso
Document review individual interviews group discussions field visits observation
24 National Pro-gramme for Man-aging Climate Change in Malawi and the Malawi Africa Adaptation Programme
UNDP Malawi Desk review of project semi-structured interviews field visits workshops
Mixed-method approach data triangulation
25 Adaptation to Climate Change in the Nile Delta through Integrat-ed Coastal Zone Management
UNDP Egypt Document review and analysis (desktop study) interviews and meetings (face-to-face and by telephoneSkype and email questionnaires data collection in the field (interviews direct observations)
26 The Hill Maize Research Project
USAID Nepal Experi-mental
Secondary data published and unpublished documents and reports quantitative and qualitative tools Primary data structured and pre-tested questionnaire (household level) semi-structured checklist with a number of open-ended questions (community level) focus group discussion key-informant interviews using similar semi-structured checklist with open-ended questions data collected from key informants and focus group surveys were used for descrip-tive and qualitative analysis whereas those collected through household survey were used for quantitative analysis
Mixed-method approach randomised controlled trial propensity score matching (PSM)
5 A
nnex
Impa
ct E
valu
atio
n G
uide
book
for C
limat
e Ch
ange
Ada
ptat
ion
Proj
ects
52
Ndeg Project name Inst Country Design Data collection instruments Methodology
27 Small-Scale Irri-gation Manage-ment Project
JICA Indonesia Experi-mental
Household surveys direct interviews Focus Groups Discussions
Mixed-method approach propensity score match-ing regression disconti-nuity design estimation strategy T-test estimation of average treatment effect balancing test
28 Vulnerability to tropical storm impacts in coastal areas of the Red River Delta in Viet Nam and the adjacent region
Journal article
Vietnam Quantitative and qualitative surveys inter-views with key informants semi-structured interviews discussions mangrove utilisa-tion survey (quantitative model) focused interviews visualisation of storm track for various typhoon seasons
Mixed-method approach participatory rural appraisal
29 Sustainable Soil Management Program
Helvetas Swiss Inter-Co-operation amp SDC
Nepal Desk review of relevant documents field visits semi-structured interviews Focus group discussions observations separate focus group discussions for discussing is-sues related to labour migration apprecia-tive inquiry approach using open-ended questions storytelling about successes and challenges as well as visioning
30 Dry Zone Liveli-hood Support and Partnership Programme (DZLISPP)
IFAD Sri Lanka Quasi-experi-mental
Qualitative survey (key informant interviews with project staff and government officials focus group discussions with beneficiaries) and quantitative survey of 2560 households (both treatment and non-treatment group)
Mixed-method approach
31 Implement-ing sustainable water resources and wastewater management in Pacific island countries
UNDP Pa-cific island countries
Evaluation involved an orientation meeting in Nadi Fiji with Projectrsquos Regional Steering Committee two missions to visit six of the PICs and Skype and phone interviews with representatives of the remaining PICs and the implementing agencies construction of theory of change to evaluate the pathway of projectrsquos success
Mostly qualitative in nature
32 Supporting Integrated and Comprehensive Approaches to Climate Change Adaptation in Africa - Main-streaming CCA in the National Sectoral Policies of Tanzania
UNDP Tanzania Primary and secondary data were collected and analysed use of semi-structured indi-vidual and group interviews
No specific reference but seems to be highly qualita-tive
33 Climate Change Adaptation Action and Mainstreaming in Mozambique
UNDO Mozam-bique
Primary and secondary data were collected and analysed use of semi-structured indi-vidual and group interviews
No specific reference but seems to be highly qualita-tive
34 Integrating Disaster Risk Reduction and Climate Change Adaptation (DRRCCA) in Local Development Planning and Decision-making Processes
UNDP Philip-pines
Desk review key-informant interview (KII) using a questionnaire guide that focuses on particular agenciesinstitutions vis-agrave-vis outcomeoutput focus group discussion using a questionnaire guide and study or field visits where observation and interview methods are utilised for more insights
Mid-term review relies on qualitative information gen-erated through primary data gathering Opportunities for triangulation were sought However not all datainformation can be treated in this manner especially as certain key players have not been interviewed despite several attempts
35 Africa Adaptation Project Namibia Building the Foundation for a National Ap-proach to Climate Change Adapta-tion in Namibia
UNDP Namibia Interviews group interviews and document reviews Open-ended questionnaires were employed to facilitate interviews Literature and documents were reviewed to acquire relevant and appropriate information required to answer key evaluation questions and objectives Observations and case study approaches were used during field visits
Evaluation applied a mixed methodology of quantita-tive and qualitative research approaches
= No reference | NA = Not applicable
53
52 Calculation of net average treatment effect with double-difference approach
Figure 11 Calculation of the net treatment effect in an experimental or quasi-experimental design
Indicator lsquoIrsquo Intervention = Treatment
t0 t1 t2point in time
Difference of I between treatment and comparison group after treatment (t2)
Difference of I between treatment and comparison group before treatment (t0)
Average value of I for treatment group
Average value of I for comparison group
net average treatment effect
Estimated average counterfactual value of I for treatment group
The figure shows that the counterfactual value of the indicator for the treatment group is estimated on the basis of its (observed) value for the comparison group and the difference of its values between the groups before the treatment In other words it is assumed that without the treatment the treatment group would have developed in the same way as the com-parison group Accordingly the net average treat-ment effect ( ) can be calculated very easily by using the following formula
Whereby represents the value for the indicator of interest for the treatment (exponent = 1) and com-parison (exponent = 0) group at the points in time ( 0 = before and 2 = after treatment) when data is being collected ie before and after the treatment Sim-ply speaking the difference in the indicator mean value between the treatment and comparison group before the treatment is subtracted from its differ-ence between the treatment and comparison group after the treatment Therefore this approach is also called lsquodifference-in-differencersquo or lsquodouble-differ-encersquo approach
53 Propensity score matching (PSM)
The propensity score is an index that indicates the conditional probability of an individualrsquos being part of the treatment group This probability is calcu-lated based on a set of variables that are relevant for both selection for the treatment and the observed treatment effect The advantage of PSM is that in
contrast to other matching techniques it provides a one-dimensional score for the matching procedure and does not require any distribution assumptions regarding the basic population (cf 331) It does however require a set of assumptions to be fulfilled which limit its applicability to some extent These are
y Conditional independence assumption (CIA) The treatment effect (ie outcome differences between the treatment and the comparison group) has to be independent from the selection ie the effects may only be explained by the treat-ment confounding factors have to be excluded Example If an intervention aims at increasing the income of a group of people project benefi-ciaries need to be subject to the same external economic framework conditions that influence their income as non-beneficiaries The assump-tion would be violated for instance if a certain occupational group were selected (eg only farm-ers) and compared with a basic population that consists of various occupational groups
y Stable unit treatment value assumption (SUTVA) The treatment effect of an intervention on one person may not be influenced by the participa-tion of another person in the same intervention Example If an intervention aims at providing financial support to a group of people eg by micro-credits the potentially available amount for each beneficiary must be equal regardless of the amounts already spent In other words the project budget needs to be at least as big as the maximum budget needed if all beneficiaries were to request the maximum individual amount
5 A
nnex
Impa
ct E
valu
atio
n G
uide
book
for C
limat
e Ch
ange
Ada
ptat
ion
Proj
ects
54
y Stability of covariates against the treatment The covariates that are used to calculate the propen-sity score must not be influenced by the treat-ment Example If an intervention aims at increasing the income of a group of people then the income of the potential beneficiaries must not be used as a covariate (as it is an intended outcome of the project)
y Common support condition In order to be suit-able for matching both the treatment and com-parison group need to contain individuals with the same or at least a similar propensity score
y Balancing property Individuals who have the same propensity score need to be comparable regarding the particular characteristics that were chosen as covariates
If the project characteristics meet the above require-ments PSM can be applied according to the follow-ing sequence 28
Figure 12 PSM sequence
Estimating the
propensity score
Testing the common support
assumption
Selecting a matching algorithm
Testing the matching
quality and treatment
effects
Sensitivity analysis
Estimating the propensity score
The estimation of the propensity score is based on the selection of the covariates and the estimation procedure The estimation procedure again depends on the number of groups that need to be included in the analysis As in evaluations usually only two groups ndash the treatment and comparison group ndash are compared and only discrete choice models usu-ally logit or probit regressions 29 are used While the type of regression only plays a minor role as both provide very similar findings the variables that are used to calculate the propensity score are by far more important as they need to fulfil the conditional inde-pendence assumption (CIA) in order to provide valid findings Furthermore as the propensity score indi-
28 The following descriptions are based on a CEval working paper (no 19) written by Muumlller Christoph 2012
29 Regressions are used in statistics for identifying the relation-ships between one dependent and several independent varia-bles (eg income depending on education gender and age) Logit and probit regressions are usually used when a variable can only have two values (eg yes and no participant and non-participant)
cates the conditional probability that an individual will receive a treatment only those variables must be used that reflect this probability Therefore it is not correct to generally refer to lsquosocio-economic covari-atesrsquo as is still sometimes found in the literature (cf eg OECD 2014) While socio-economic variables may be appropriate for interventions that focus on the poor (ie the poorer a person the more likely he or she is to participate) they may not make any sense for an intervention that focuses on vulnerability (ie the more vulnerable a person is the more likely he or she is to participate) Accordingly in the latter case variables that reflect the vulnerability of a per-son (eg proximity to a disaster-prone area) need to be taken as covariates In any case the selection of covariates needs to be theoretically substantiated
Once the covariates are selected the propensity score is calculated by a simple (logit or probit) regression Here it is important to note that only metric (ie continuous eg income age) and dichotomous vari-ables (ie variables that can have two values eg yesno 10) can be included Nominal (ie variables that can only have discrete valuescategories without ranking eg religion marital status) and ordinal (ie variables with discrete ranked values eg educational level) variables need to be recoded in dichotomous variables for each category before the analysis
Testing the common support assumption
After the propensity score has been calculated for each case (ie person individual) of the treatment and control group the so-called area of common support (ACS) has to be identified The ACS com-prises the range in which the treatment and com-parison group show a similar density of propensity scores Only cases that lie within this area can be used for the subsequent matching procedure The ACS can either be defined by cutting off the range at the low-est and highest propensity scores available for both groups or by trimming ie setting a certain density threshold level beneath which cases are discarded In order to decide how to define the ACS it makes sense to visualise the distribution of the propensity scores as the following figure illustrates
55
Figure 13 Exemplary illustrations of propensity scores densities
0
02
04
06
08
1
01 02 03 04 05 06 07 08 09 10
02
04
06
08
1
01 02 03 04 05 06 07 08 09 1
Treatment group
Comparison group
Treatment group
Comparison group
As the illustration in the example on the left shows it would be appropriate to cut the ACS below 03 as there are no cases in the treatment group below this value and above 08 as there are no cases in the com-parison group above that value On the right both groups feature values in the entire range between 0 and 1 However the treatment group contains no cases with propensity scores between 07 and 08 which would make it impossible to create matches in that area Accordingly it would make sense to set a threshold level say at about 015 beneath which cases are excluded In that case the ACS would lie between 03 and 06 and between 09 and 1 Note If no ACS can be identified PSM cannot be applied
Selecting a matching algorithm
Once the ACS has been defined matching then starts with the selection of the matching algorithm As there are a number of matching algorithms that dif-fer depending on how cases from the comparison group are assigned to cases of the treatment group and the type of weighting several algorithms are usually applied in order to select the one that is most sensitive for identifying the treatment effect Three popular matching algorithms are briefly outlined below
A very popular and fairly simple matching algorithm is the so-called nearest neighbour matching (NNM) With NNM the case from the comparison group that features the most similar propensity score to each case or group of cases of the treatment group is assigned ie the one with the most similar prob-ability of being a member of the treatment group The approach prevents so-called bad matches ie that cases which are very different ndash in terms of their characteristics as represented by the covariates ndash to each other are compared Cases from the compari-son group can then usually be used repeatedly as a matching partner for cases from the treatment group It is also recommended to match several cases from the comparison group with each case from the treatment group in order to receive more robust findings (ie with less variance) Thus the com-parison group should be considerably larger than the treatment group (cf 331) It should be noted though that the decision to use cases more than once in order to minimise the variance has the trade-off of a potentially higher bias as inferior matches may also be used Figure 14 provides a simplified illustration of how the matches can be identified graphically
Figure 14 Graphical illustration of nearest neighbour matching
Treatment group cases
Comparison group cases
0 025 05 075 1
Propensity score
Treatment group cases
Comparison group cases
0 025 05
Propensity score075 1
1Weighting factor of cases
Treatment group cases
Comparison group cases
0 025 05
Propensity score075 1
Range (caliper)
5 A
nnex
Impa
ct E
valu
atio
n G
uide
book
for C
limat
e Ch
ange
Ada
ptat
ion
Proj
ects
56
As figure 14 shows in this example both treatment group and comparison group cases are used repeat-edly for matching and cases that are not the nearest neighbour to any of the cases of the respective other group are discarded
Another matching algorithm that is frequently used is so-called kernel matching The algorithm uses the weighted means of preferably all individuals of the
comparison group to estimate the counterfactual sit-uation of an individual from the treatment group To apply this matching algorithm it has to be decided in advance how to weight the individual cases dur-ing the matching ie define the probability density function (eg a Gaussian function) and how steep the function should be (ie the slew rate) Again here is a graphic to illustrate the matching process
Figure 15 Graphical illustration of kernel matching
Treatment group cases
Comparison group cases
0 025 05 075 1
Propensity score
Treatment group cases
Comparison group cases
0 025 05
Propensity score075 1
1Weighting factor of cases
Treatment group cases
Comparison group cases
0 025 05
Propensity score075 1
Range (caliper)
Figure 15 shows that comparison group cases are weighted according to the proximity of their propen-sity score to the score of the treatment group case they should be matched with
A matching algorithm that offers a kind of compro-mise is the so-called radius matching for which only those cases of the comparison group are used for the
matching that are within a certain predefined range (also called lsquocaliperrsquo) to the treatment group case The advantage of this algorithm is that the range can be adjusted according to the number of available cases in the comparison group so that it can provide more robust findings provided sufficient cases are avail-able
Figure 16 Graphical illustration of radius matching
Treatment group cases
Comparison group cases
0 025 05 075 1
Propensity score
Treatment group cases
Comparison group cases
0 025 05
Propensity score075 1
1Weighting factor of cases
Treatment group cases
Comparison group cases
0 025 05
Propensity score075 1
Range (caliper)
Figure 16 shows that cases that lie outside a prede-fined range are discarded Since there are no gen-eral rules about how to define this range we should note that a wider range leads on the one hand to a reduced variance of the findings (ie increased robustness) on the other it also introduces more bias as lsquonot so goodrsquo matches are also used Conversely a narrower range reduces the bias but increases the variance Thus there is always a trade-off between the robustness and bias of the findings
Testing the quality of matching and calculating the treatment effects
When the matching procedures have been com-pleted it needs to be verified once again whether the above-mentioned balancing property is fulfilled A common method for doing this is to check if the dif-ference in the covariates between the treatment and comparison group has been substantially reduced which can be (amongst others) done by calculating lsquoCohens drsquo an index for comparing differences in mean values before and after matching However further methods are available for verifying the bal-ancing property that cannot be discussed in detail
57
here but can be found in the recommended litera-ture at the end of this section
After all these steps have been taken finally the treatment effects can be assessed in different ways First of all of course the sign and the magnitude of the mean differences in the outcome variables after matching provide information about the direction and size of the relevant effect Furthermore one-sided T-tests can be performed for checking if the treatment effects are significant
Sensitivity analysis
The last step to provide for a distinct attribution of the observed effects to an intervention is to assess the robustness of the findings against unobserved confounding factors To do this a sensitivity analy-sis needs to be conducted eg based on the so-called Rosenbaum Bounds (RBs) that make it possible to estimate how strongly a confounding factor would need to bias the selection process in order to com-promise the robustness of the estimated treatment effect RBs represent the limits within which treat-ment effects are considered significant Estimation of the RBs is based on the assumption that with an increasing positive or negative selection treatment effects are respectively over- or underrated This also means that the probability of a positive treatment effect decreases with positive selection and increases with a negative selection There are further indexes such as the Hodges-Lehmann estimator (ie for esti-mating the minimum treatment effect to be consid-ered as significant) that can be used to further hedge the findings of the sensitivity analysis
Unfortunately since the calculation of these estima-tors requires a substantial statistical background they cannot be discussed here in detail However sta-tistical programs such as SPSSreg or STATAreg provide particular modules for these estimators which make it possible also for laypeople to perform the required calculations (provided they have understood the sense and benefit of such an analysis)
54 Fixed-effects random-effects models and time-series cross-section analysis
Fixed-effects models (FEM) are used to estimate the impact of a particular independent variable (eg treatment framework condition) that varies over time on individual outcomes (eg income health status) It is based on the assumption that these outcomes correlate with that independent vari-able Thus FEM can reveal the relationship between
predictor and outcome variables within an analyti-cal entity giving consideration to time-invariant individual characteristics that potentially affect the impact of these predictor variables (eg profession on income or gender on nutrition) These characteristics are considered to be time-invariant unique to the analytical entity and not to be correlated with other individual characteristics In that case the treatment effect on the outcome variable of interest can be esti-mated by regressing the individual outcomes as cal-culated with the following formula
Whereby stands for the dependent outcome variable of interest with representing its analytical entity and the point in time when the data is col-lected is the value of the independent variable for this entity at that time the coefficient for the inde-pendent variable the invariant individual char-acteristic that affects the outcome and the error term for other unobserved factors that vary over time With that model all time- invariant differences between the analytical entities are controlled so that it can be used to identify the causes of observed changes of an analytical entity over time
In contrast to FEM the random-effects model (REM) is based on the assumption that variations in the individual outcomes of the entities are random and uncorrelated with the predictor variables Accord-ingly the REM should be used if it is assumed that differences across entities influence the depend-ent outcome variable Thus the formula has to be amended by adding a second error term that expresses this difference
As the application of REM requires that the second error term does not correlate with the predictor vari-able individual characteristics that potentially have an influence on the predictor variables need to be specified Accordingly omitting relevant variables in the model may lead to biased findings
A number of tests are available for deciding which model to use in a panel analysis such as the so-called Hausman test which tests whether correlates with the regressors the Pasaran cross-sectional dependence test or serial correlation tests As the test procedures cannot be discussed in detail in this Guidebook further references are provided in the literature list at the end of this section Furthermore it has to be added that for both STATAreg and SPSSreg do-file respectively syntax templates are available that can perform such tests on suitable data sets
5 A
nnex
Impa
ct E
valu
atio
n G
uide
book
for C
limat
e Ch
ange
Ada
ptat
ion
Proj
ects
58
Another lsquopanel-likersquo approach for long-term impact assessment is the so-called time-series cross-section (TSCS) analysis Similar to the panel analysis the TSCS analysis is based on data being collected over time from the same analytical units However in contrast to the former approach conclusions made with TSCS analysis are limited to the sample ie are not transferable to another population without fur-ther ado Another difference is that while the panel analysis requires a large sample but also works with a few observations (at least three) TSCS Analysis works with a small number of analytical entities but requires more observations (at least about 10) in order to provide robust findings Due to these fea-tures TSCS analysis is mainly used for policy studies with macro data and analytical entities such as sec-tors countries or regions As one the one hand the statistical fundamentals of TSCS analysis are quite complex and on the other hand the approach is not (yet) very popular for project evaluations it will not be discussed here in detail
However the following literature reference list gives some recommendations for further reading on this subject too
Beck N (2006) Time-SeriesndashCross-Section Methods New York New York University
Beck N (2001) Time-SeriesndashCross-Section Data What Have We Learned in the Last Few Years San Diego University of Califor-nia
Beck N Katz JN (1995) What to do (and not to do) with Time-Series Cross-Section Data The American Political Science Review 89(3)634 ndash 647
Girosi F King G (2001) Time Series Cross-Sec-tional Analyses with Different Explanatory Variables in Each Cross-Section Cambridge Harvard University
Wooldridge JM (2010) Econometric Analysis of Cross Section and Panel Data Cambridge The MIT Press
55 Structural equation modelling
As outlined in Section 316 structural equation models consist of latent constructs and empirically measurable indicators With regard to the operation-alisation of the constructsvariables two types of measurement models can be distinguished models based on reflective indicators and those based on formative indicators While reflective indicators are defined by their construct (eg construct sportiness
rarr indicator time needed to run 100 metres) forma-tive indicators define the construct (eg indicator number of training modules per month rarr construct sportiness) Accordingly reflective indicators have to correlate with each other while formative ones do not necessarily have to do so (eg time needed to run 100 500 1000 metres vs number of running mod-ules number of swimming modules etc) Another difference between reflective and formative con-structs is that reflective indicators are replaceable (eg time taken to run 100 metres time taken to cycle 1 km) while an exchange of formative indicators would result in a modification of the construct (eg number of maths lessons instead of training mod-ules)
Before the causal relationship between the con-structs can be analysed the validity of the measure-ment models ie how well the indicators opera-tionalise a construct needs to be checked Due to the above-mentioned differences the analysis of reflective and formative indicators differs As reflec-tive measurement models correspond to an explora-tive factor analysis (main component analysis) their validity is assessed on the basis of the factor loadings (should be ge0707) their significance its reliability (composite reliability r should be gt07) and the aver-age explained variance of the construct (should be gt05) Furthermore a reflective measurement model is considered valid if the explained variance of a construct is higher than each squared correla-tion between this and any other construct (lsquoFornell-Larker-Criterionrsquo ie discriminatory validity) Forma-tive measurement models correspond to a multiple regression Accordingly their quality is assessed on the basis of the factor weights their significance and the co-linearity of the indicators (ie the so-called variance inflation factor should be lt10)
Concerning the number of indicators required to describe a construct it has to be considered that there is a trade-off between the reliability of the measurement and the danger of creating artefacts which biases the construct (eg overrepresentation of physical indicators when measuring the health sta-tus) Furthermore the sample size should be consid-erably larger than the number of indicators
While the measurement model specifies the rela-tionship between the latent constructs and their indicators the structural model describes the influ-ence of the constructs on each other These influ-ences are graphically marked by arrows which rep-resent assumed causal relationships The direction of the arrow indicates the direction of causality ie defines what is the cause and what is the effect In principle both the number of constructs and the number of (estimated) causal relations are unlimited This also means that a construct can be both affected
59
by one or more constructs and affect another one or more others
The relationship between two constructs is expressed by the so-called path coefficient which ranges from -1 (perfect negative relationship) to 1 (perfect positive relationship) A value of 0 may indi-cate that there is no statistical relationship between two constructs While a high value of is preferable in practice values higher than 04 (respectively lt-04) can be considered as very high It has to be added that SEM makes it possible to calculate not only direct effects but also indirect and total effects
The path coefficient can be calculated in two dif-ferent ways ie by means of co-variance analysis or variance analysis each having some advantages and disadvantages Although the theoretical founda-tions of the two methods cannot be discussed here in detail the main aspects that help decide which one to choose are summarised in the following table
Table 8 Decisive aspects for choosing co-variance or variance analysis 30
Co-variance analysis Variance analysis
Preferred method for analysing established theories and testing hypotheses
Preferred method in explorative studies ie if the causal relations between the constructs are not yet substantiated
Works best with large sample sizes (n gt100)
Also works with smaller sample size (n gt30)
Method of choice if statistical quality criteria1 are preferred for assessing the validity of the model
Method of choice if the model is validated nomologically
Available software eg AMOSreg LISRELreg
Available software eg SmartPLSreg
As the table shows variance analysis might be the preferred choice for evaluations since they are usu-ally explorative in nature and constructs that char-acterise the objectives of an intervention are more likely to be based on formative measurement mod-els The smaller required sample size also speaks for the use of variance analysis However the fact that no statistical indexes are available to assess the validity of variance analysis-based structural mod-els means that the researcher applying this method needs to have comprehensive knowledge about the system conditions and the causal linkages between its elements
Nevertheless variance analysis also provides indi-ces for assessing the contribution of an intervention
30 Adapted from Jahn 200716
to an observed effect such as the above-mentioned path coefficient (should be gt02) its significance and the effect strength (fsup2 weak gt002 average gt015 strong gt035) Furthermore the model fit (Rsup2 small gt02 average gt033 substantial gt067) indicates the informative value of the model (ie how far the inde-pendent constructs explain the variance of the indi-vidual constructs)
As also shown in the table meanwhile a number of user-friendly computer programs are available for calculating structural equation models at least on the basis of variance analysis While in principle even people with a limited methodological background can operate such software (at least it provides plausi-ble findings) it is not recommended to do so because incorrect theoretical assumptions or setting wrong parameters for calculating the quality criteria can lead to biased or even completely false findings
56 Calculating sample sizes for probability sampling
This section outlines three different ways to cal-culate the sample size depending on the available information about the basic population In the first example the size of the basic population is known but the true value of a certain dichotomous charac-teristic (ie can have two values eg whether or not a beneficiary applied an improved farming technique) is not In this case the required sample size can be calculated simply according to the formula
Whereby is the required sample size is the size of the basic population and is the desired margin of error So assuming the basic population amounts to 1000 persons and the desired margin of error is 005 then the minimum sample size would be
10001000 ∙ 005
1000
This means data from a minimum of 286 randomly selected respondents would be needed for the survey
5 A
nnex
Impa
ct E
valu
atio
n G
uide
book
for C
limat
e Ch
ange
Ada
ptat
ion
Proj
ects
60
An alternative way to calculate the minimum sam-ple size for large populations ndash even if the exact size of the basic population is not known ndash is illustrated next In this case it is advantageous to have a good estimate of the true value of an observed characteris-tic of interest (eg gender distribution)
Thereby is the area under the normal curve corre-sponding to the defined level of confidence and is the true share of the population that displays a cer-tain characteristic (eg is female)
For most common levels of confidence equals as follows
90 = 164595 = 196099 = 2575999 = 3290
eg for a population in which 48 are female and the desired margin of error is 005 the minimum sample size would be
196 ∙ 048 ∙005
0958900025
However if the actual share of the basic population that features a certain characteristic of interest (eg percentage of beneficiaries who have adopted a new farming technique or not) is not known it is always safe to assume a 50 share as then the term bull (1 - ) and accordingly the entire formula reaches its maximum
If the size of the basic population is known and if it is smaller than approximately 50000 one can still use the latter formula in a first step but reduce the sam-ple size in a second step by applying the following correction term
Whereby is the required sample size as calculated above Assuming that the basic population only com-prises 1000 persons then the minimum sample size would be
384
1000
3841383
So according to this correction term it is acceptable to reduce the sample size by 106 respondents which equals a reduction of more than a quarter
It must however be kept in mind that the sample sizes provided in these formulas corresponds to the actual number of necessary completed question-naires Accordingly when planning a survey the non-response rate has to be considered as well The rate indicates the share of those who do not par-ticipate in the survey despite being selected for the sample This needs to be compensated to assure that the sample remains large enough to achieve the desired level of confidence and margin of error So if for example a sample size of 500 is required and it is assumed that only 80 might answer the number of respondents needs to be increased to at least 625
Furthermore it has to be considered that if the sur-vey is part of an experimental or quasi-experimental design data need to be collected not only for the treatment group but also for a comparison group Therefore when applying PSM the comparison group sample needs to be considerably bigger than the treatment group sample ndash ideally about two to three times the size ndash in order to assure that suf-ficient cases are available for matching during data analysis (cf 312)
61
57 Literature
Bours D et al (2014) Guidance Note 1 Twelve Rea-sons why Climate Change Adaptation MampE Is Challenging httpwwwseachangecoporgsitesdefaultfilesdocuments2014200120SEA20Change20UKCIP20GN1201220Reasons20why20CCA20MandE20is20challengingpdf
Bours D et al (2014) Guidance Note 2 Selecting Indicators for Climate Change Adaptation Pro-gramming httpwwwseachangecoporgsitesdefaultfilesdocuments2014200120SEA20Change20UKCIP20GN220Selecting20indi-cators20for20CCA_0pdf
Bours D et al (2014) Guidance Note 3 Theory of Change Approach to Climate Change Adaptation Programming httpwwwseachangecoporgsitesdefaultfilesdocuments2014200220SEA20Change20UKCIP20GN320ToC20approach20to20CCA20programmingpdf
Bours D et al (2014) Monitoring and Evaluation for Climate Change Adaptation and Resilience A Syn-thesis of Tools Frameworks and Approaches Sec-ond Edition httpwwwseachangecoporgsitesdefaultfilesdocuments20142005201520SEA20Change20UKCIP20Synthesis20Report202nd20editionpdf
Bours D et al (2014) Design Monitoring and Evalu-ation in a Changing Climate Lessons Learned from Agriculture and Food Security Programme Evaluations in Asia httpwwwseachangecoporgsitesdefaultfilesdocuments2014200520SEA20Change20UKCIP20ER120Agriculture20and20food20security_0pdf
Bours D et al (2014) International and donor agency portfolio evaluations trends in monitor-ing and evaluation of climate change adapta-tion programs httpwwwseachangecoporgsitesdefaultfilesdocuments2014200620SEA20Change20UKCIP20ER220CCA20MandE20trends20from20porfolio20evalu-ations_0pdf
Conway D amp Mustelin J (2014) Strategies for improving adaptation practice in developing countries Nature Climate Change 4339-342
Cordero C (2014) Case Study Working with the Vulnerability Sourcebook in Chullcu Mayu Bolivia News GIZ httpwwwgizdeexpertisehtml15486html
Dinshaw A et al (2014) Monitoring and Evaluation of Climate Change Adaptation Methodological Approaches OECD Environment Working Paper No 74 OECD Publishing
Ford JD et al (2013) How to track Adaptation to Climate Change A typology of Approaches for National-Level Application Ecology and Society 18(3)40
Ford J D amp Berrang-Ford L (2015) The 4Cs of adap-tation tracking consistency comparability com-prehensiveness coherency Mitigation and Adap-tation Strategies for Global Change 1-21
Fischerova G (no date) Strategic Initiatives to Address Climate Change in LDCs (Boots on the Ground) Integrating Climate Change Risks into Development Planning and Programming UNDP Bratislava Regional Centre (PowerPoint Presenta-tion)
Foumlrch W et al (2014) Back to Baselines Measuring Change and Sharing Data Agriculture and Food Security 2014 313 httpwwwagricultureand-foodsecuritycomcontentpdf2048-7010-3-13pdf
Garcia JR amp Zazueta A (2015) Going Beyond Mixed Methods A Systems Perspective for Ask-ing the Right Questions Institute of Develop-ment Studies httponlinelibrarywileycomdoi1011111759-543612119epdf
German Federal Ministry for Economic Cooperation and Development (BMZ) (2013) Climate Finance Readiness Programme Early Action for Ambitious Goals httpwwwgizdeexpertisedownloadsgiz2013-en-climate-finance-readiness-flyerpdf
GIZ (2012) Disaster Risk Management and adapta-tion to climate change Experience from German Development Cooperation Deutsche Gesellschaft fuumlr Internationale Zusammenarbeit (GIZ) GmbH httpwwwipaccpedocen-disaster-risk-man-agement-climate-changepdf
GIZ (2013) GIZrsquos global GCF Readiness Programme Competence Centre for Climate Change Environ-ment and Climate Change Division httpwwwgizdeexpertisedownloadsgiz2013-en-climate-finance-gcfitpdf
5 A
nnex
Impa
ct E
valu
atio
n G
uide
book
for C
limat
e Ch
ange
Ada
ptat
ion
Proj
ects
62
GIZ (2013) GIZ in South Africa Programs and Pro-jects Deutsche Gesellschaft fuumlr Internationale Zusammenarbeit (GIZ) GmbH httpswwwgizdededownloadsgiz2013-en-giz-programs-pro-jects-south-africapdf
GIZ (2013) Guidelines on designing and using a results-based monitoring system (RBM system) httpswwwgiz2013-0110en-results-based-moni-toring-systempdf
GIZ (2014) Transboundary Water Management Sup-port to Cooperation on Shared Waters Deutsche Gesellschaft fuumlr Internationale Zusammenarbeit (GIZ) GmbH httpwwwgizdeexpertisedown-loadsgiz2014-en-mappe-transboundary-water-managementpdf
GIZ (2015a) The Sustainable Agricultural Programme (PROAGRO I amp II) httpproagro-boliviaorg (accessed on 22102015)
GIZ (2015b) Public Investment and Climate Change Adaptation (IPACC) project httpwwwgizdeenworldwide13314html (accessed on 22102015)
GIZ (2015c) Climate Support Programme (CSP) httpwwwgizdeenworldwide17807html (accessed on 22102015)
Hammill A et al (2013) Comparative Analysis of climate change vulnerability assessments Les-sons from Tunisia and Indonesia Competence Centre for Climate Change Deutsche Gesellschaft fuumlr Internationale Zusammenarbeit httpsgc21gizdeibtvarappwp342deP1443wp-contentuploadsfilebasevavulnerability-guides-man-uals-reportsComperative-analysis-of-climate-change-vulnerability-assessmentspdf
Hedger MM (2008) Desk Review Evaluation of Adaptation to Climate Change from a Develop-ment Perspective Institute of Development Stud-ies httpswwwclimate-evalorgsitesdefaultfileseventsalexandriaIDS_Report_on_Evaluat-ing_Adaptation_for_GE_publication_versionpdf
IIED (2015) Capacity Strengthening in Least Deve-loped Countries (LDCs) for Adaptation to Climate Change (CLACC) httpwwwiiedorgcapacity-strengthening-least-developed-countries-for-adaptation-climate-change-clacc (accessed on 22102015)
Karkoschka O et al (2013) Guidance for Integrat-ing Monitoring and Evaluation of Climate Change Adaptation into Strategies in Mongolia Deutsche Gesellschaft fuumlr Internationale Zusammenarbeit httpwwwseachangecoporgsitesdefaultfilesdocuments2013200720GIZ20-20Guid-ance20for20Integrating20M26E20of20CCA20into20Strategiespdf
Lamhauge N et al (2012) Monitoring and Evaluation for Adaptation Lessons from Development Coop-eration Agencies OECD Environment Working Paper No 38 OECD Publishing httpwwwoecd-ilibraryorg docserverdownload5kg20mj6c2bwpdfexpires=1425238023ampid=idampaccname=guestampchecksum=77BA5587F2D7AD9EF6C22B614A36C4D4
Leighton M et al (2011) Climate Change and Migra-tion Rethinking Policies for Adaptation and Disaster Risk Reduction No 152011 United National University - Institute for Environment and Human Security httpswwwehsunuedufileget8468
Leiter T (2015) Linking Monitoring and Evaluation of Adaptation to Climate Change across Scales Avenues and Practical Approaches In D Bours P Pringle amp C McGinn (Eds) Monitoring and Evalu-ation of Climate Change Adaptation A review of the landscape New Directions for Evaluation 147 117-127
OECD (2011) Handbook on the OECD-DAC Cli-mate Markers httpwwwoecdorgdacstats48785310pdf
OECD (2014) OECD DAC Statistics Aid to Climate Change Adaptation March 2014 Version 2 httpwwwoecdorgdacenvironment-developmentAdaptation-related20Aid20Flyer20-20March20201420v2pdf
Olivier J et al (2013) Adaptation made to measure A Guidebook to the Design and result-based moni-toring of climate change adaptation projects 2nd Edition Deutsche Gesellschaft fuumlr Internationale Zusammenarbeit (GIZ) GmbH httpsgc21gizdeibtvarappwp342deP1443wp-contentuploadsfilebasememe-guides-manuals-reportsGIZ-2013_Adaptation_made_to_measure_second_editionpdf
63
Prowse M et al (2010) Impact Evaluation and Intervention to address Climate Change A Scop-ing Study International Initiative for Impact Evaluation Working Paper 7 httpswwwclimate-evalorgsitesdefaultfilesevalua-tions53020Impact20Evaluation20and20Interventions20to20Address20Climate20Change20-20A20Scoping20Studypdf
Sanahuja H E (2011) A Framework for Monitoring and Evaluating Adaptation to Climate Change Community of Practice Global Environment Facility httpswwwclimate-evalorgsitesdefaultfilesstudiesClimate-Eval20Frame-work20for20Monitoring20and20Evalua-tion20of20Adaptation20to20Climate20Changepdf
Sara Orleans Reed et al (2014) Resilience projects as experiments implementing climate change resil-ience in Asian cities climate and development Published by Taylor amp Francis httpwwwtand-fonlinecomdoifull101080175655292014989190VPZRBvmG-NM
Scholze M (2013) Country Experiences with Main-streaming Adaptation ndash from Programme to National Level Webinar httpsgc21gizdeibtvarappwp342deP1443wp-contentuploadsfilebasems mainstreaming_webinareCoun-try_experiences_with_mainstreaming_adapta-tion_national_levelpdf
Schwartzendruber F (2014) Evaluation of NRM interventions linked to climate change A scoping study Draft version httpswwwclimate-evalorgsitesdefaultfilesstudiesNRM-Study-Draftpdf
Smit B amp Pilifosova O (2010) Adaptation to Climate Change in the Context of Sustainable Develop-ment and Equity httpswwwvieunuedufileget9995pdf
Smith JB Vogel J M and Cromwell J E (2009) An architecture for government action on adaptation to climate change An editorial comment Climatic Change 9553-61
UNDP (2009) Thematic Area Scaling up local and community-based actions UNDP Community Based Adaptation httpsunfcccintfilesadapta-tionapplicationpdfundp_ap_update_sep_09_cba_1_sppdf
UNDP (2011) Achievements in 2011 Strategic Initia-tive to Address Climate Change in Least Devel-oped Countries Boots on the Ground Report httpwwwundporgcontentdamundplibraryEnvironment20and20EnergyCli-mate20Change2011-Boots-on-the-Ground-Reportpdf
UNDP (2011) Brochure on Strategic Initiative to Address Climate Change in LDCs httpwwwundporgcontentdamundplibraryEnviron-ment20and20EnergyClimate20ChangeCapacity20DevelopmentFlyer20for20Boots20on20the20Ground_Final_rev20rcpdf
UNDP (2013) UNDP support to LDCs to Access Finance for Adaptation Basic Facts and Figures httpundp-almorgsitesdefaultfilesdown-loadsoverview_of_undp_ support_to_ldcs_to_access_finance_for_adaptation_-_nov_2013pdf
UNDP (2015a) Community-Based Wetland Manage-ment Project (BIRAM) httpwwwundp-almorgprojectsspa-cba-bangladesh-community-based-wetland-management-project-biram (accessed on 22102015)
UNDP (2015b) National Adaptation Plan Global Support Programme (NAP-GSP) httpwwwundp-almorgprojectsnaps-ldcs (accessed on 22102015)
UNDP (2015c) Pacific Integrated Water Resource Management (IWRM) project httpwwwtand-fonlinecomdoipdf10108019439341003786729 (accessed on 22102015)
Villanueva P S (2011) Learning to Adapt Monitor-ing and Evaluation Approaches in Climate Change Adaptation and Disaster Risk Reduction ndash Chal-lenges Gaps and Ways Forward httpr4ddfidgovukPDFOutputsClimateChangeSCR-Dis-cussionPaper9--Learning-to-ADAPTpdf
Wuumlrtenberger L (2013) GCFit GIZrsquos Global GCF Readiness Programme Deutsche Gesellschaft fuumlr Internationale Zusammenarbeit (GIZ) GmbH httpwwwcaribankorguploads201305GIZC2B4s-Global-GCF-Readiness-Programmpdf
5 A
nnex
Impa
ct E
valu
atio
n G
uide
book
for C
limat
e Ch
ange
Ada
ptat
ion
Proj
ects
64
Notes
65
Published by Deutsche Gesellschaft fuumlr Internationale Zusammenarbeit (GIZ) GmbH
Registered offices Bonn and Eschborn Germany
Global Project Effective Adaptation Finance (MampE Adapt)
BMZ Bonn Dahlmannstraszlige 4 53113 Bonn Germany Tel +49 (0) 228 99 535 - 0 Fax +49 (0) 228 99 535 - 3500
BMZ Berlin Stresemannstraszlige 94 10963 Berlin Germany Tel +49 (0) 30 18 535 - 0 Fax +49 (0) 30 18 535 - 2501
poststellebmzbundde wwwbmzde
Friedrich-Ebert-Allee 36 + 40 53113 Bonn Germany Tel +49 (0) 228 44 60 - 0 Fax +49 (0) 228 44 60 - 1766
Dag-Hammarskjoumlld-Weg 1-5 65760 Eschborn Germany Tel +49 (0) 6196 79 - 0 Fax +49 (0) 61 96 79 - 1115
climategizde wwwgizdeclimate
In cooperation with UNDP Center for Evaluation CEVAL
Autors Stefan Silvestrini Ines Bellino Susanne Vaumlth
Design and layout Ira Olaleye Eschborn Germany
Photo credits Title page copy Ranak Martin
As at September 2015
GIZ is responsible for the content of this publication
On behalf of Federal Ministry for Economic Cooperation and Development (BMZ) Special Unit lsquoClimatersquo
Addresses of the BMZ offices
- Impact Evaluation Guidebook for Climate Change Adaptation Projects
-
- Content
-
- List of figures
-
- Figure 1Flow chart for implementing an RIE
- Figure 2Illustration of the pipeline approach
- Figure 3Selection of individuals for comparison
- Figure 4Outcome scores before and after intervention
- Figure 5Generic layout of a structural equation model
- Figure 6Decision tree for selecting an evaluation design for measuring impacts at individual level
- Figure 7Decision tree for selecting an evaluation design for measuring impacts at institutional and system level
- Figure 8Distribution of sample mean values in relation to the true population mean value
- Figure 9Simplified SEM for the GIZ projectthinspthinsp33
- Figure 10Draft schedule for impact monitoring and evaluation framework
- Figure 11Calculation of the net treatment effect in an experimental or quasi-experimental design
- Figure 12PSM sequence
-
- List of tables
-
- Table 1Exemplary data collection plan
- Table 2Example table for matching on observables
- Table 3Required project characteristics and data
- Table 4Example of question types
- Table 5Exemplary to-do list for preparing a survey
- Table 6Applicability of evaluation designs
- Table 7Draft (simplified) data collection plan
- Table 8Decisive aspects for choosing co-variance or variance analysisthinsp
-
- List of abbreviations
- Glossary
-
- Executive Summary
- 1Introduction
-
- 11How to use the Guidebook
- 12How to plan and implement an RIE for CCA projects
-
- 2Evaluating climate change adaptation projects
-
- 21Types and key features of climate change adaptation projects
-
- 211Adaptation projects addressing the individual level
- 212Adaptation projects addressing the institutional level
- 213Adaptation projects addressing the systemic level
-
- 22Key challenges of climate change adaptation projects
- 23Review of current methods to evaluate the results of CCA projects
-
- 3Rigorous evaluation designs and examples of applicability in climate change adaptation projects
-
- 31Overview of evaluation designs ndash potentials and limitations for climate change adaptation projects
-
- 311Experimental and quasi-experimental designs
- 312Matching techniques
- 313Pipeline approach
- 314Regression discontinuity design
- 315Time-series designs
- 316Structural equation modelling
- 317Summary
-
- 32Providing reliable large-scale data
-
- 4Case study Urban Management of Internal Migration due to Climate Change
-
- 41Background and project objectives
- 42Practical implementation
-
- 5Annex
-
- 51Overview of current CCA related-project evaluations
- 52Calculation of net average treatment effect with double-difference approach
- 53Propensity score matching (PSM)
- 54Fixed-effects random-effects models and time-series cross-section analysis
- 55Structural equation modelling
- 56Calculating sample sizes for probability sampling
- 57Literature
-
- Publishing information
-

Impa
ct E
valu
atio
n G
uide
book
for C
limat
e Ch
ange
Ada
ptat
ion
Proj
ects
6
Executive Summary
Phot
o copy
GIZ
Gue
nay
Ulu
tunc
ok
Monitoring and evaluating impacts is usually both costly and laborious Often it is also a challenging process particularly when complex causal linkages or uncertain framework conditions are involved All of this applies to climate change adaptation (CCA) projects which present further methodological and practical challenges that complicate the assessment of concrete adaptation results However provid-ing evidence about the impact of an intervention is often indispensable when it comes to generating knowledge about what works and what doesnrsquot ini-tiating organisational learning processes monitoring the progress made or simply being accountable for the use of resources This Guidebook seeks to sup-port project managers by providing an overview of different impact evaluation methods and how they can be applied to climate change adaptation projects The application of the Guidebook is further illustrated by a case study of an adaptation project in Bangladesh
Evaluations and rigorous impact evaluations ndash Whatrsquos the difference
While many evaluation approaches claim to pro-vide some kind of indication about project impacts (eg most significant change approach participatory rapid assessment) robust evidence can only be pro-vided by sophisticated evaluation designs that com-ply with scientific standards and are based on valid empirical data Evaluations that use such sophisti-cated designs and involve the collection of a consid-erable amount of empirical data are also called rig-orous impact evaluations (RIEs) The advantage of RIEs in contrast to lsquosofterrsquo designs is that they make it possible to clearly attribute observed changes to a particular intervention or at least make it possible to quantify the contribution an intervention has made
to these changes This Guidebook provides practi-tioners in the field of CCA with a selection of such RIE designs differentiated according to the type of impact (ie micro meso or macro-level impacts) they are able to measure
Rigorous impact evaluations (RIEs) make it possible to attribute observed changes to a particular intervention or at least quantify the contribution an intervention has made to these changes
The difficulties involved in measuring the impacts of CCA projects are widely recognised by practition-ers and the adaptation community (eg Bours et al 2014) The latter acknowledges the limited evidence on global adaptation progress and the gaps in the evolving adaptation science (FordBerrang-Ford 2015) For climate change mitigation progress can be tracked with reference to the global concentration of greenhouse gases (GHGs) For climate change adap-tation though there is no such single metric This explains the need to equip practitioners with the right methods to assess adaptation results and dem-onstrate the added value of their projects
Establishing causality on different levels
According to the OECDrsquos Development Assistance Committee (DAC) impact evaluations take into account intended and unintended positive and neg-ative as well as expected and unexpected changes They are supposed to not only provide information on all possible changes that have occurred during the implementation of an intervention but also to link these observed changes to their causes There-fore the establishment of causality (causeeffect relationship) is crucial in order to understand why particular incidents occurred during and after a pro-ject or programme In particular the question lsquoWhat would have happened without the project or pro-
7
grammersquo needs to be investigated in detail At this point a so-called counterfactual assessment (ie the comparison between what actually happened and what would have happened in the absence of the intervention) must be considered Since it is impos-sible to collect data on what would have happened if the intervention had not been implemented many RIEs are based on designs that include comparison data ie on individuals in a similar situation who were not exposed to the intervention
The RIE designs presented in this Impact Evaluation Guidebook are differentiated according to the type of impact they are able to measure ie
y micro (individual) y meso (institutional) or y macro (systemic)-level impacts
The aim of the Guidebook is to address the challenge of producing more and better impact evaluations giving practitioners the necessary know-how in order to plan implement and steer an RIE It enables practitioners to identify which of the RIE designs are suitable for successfully evaluating their par-ticular project or programme and also reveals the respective potentials and limitations of the differ-ent designs when it comes to their application in the field of CCA
The benefit of implementing RIEs for CCA projects
Why are RIEs increasingly being considered as an option for evaluating a CCA project The Paris Dec-laration on Aid Effectiveness which calls for more and better impact evaluations has created a cer-tain amount of pressure and consequently a rising demand to use RIEs This also explains why more funding is becoming available and the literature is growing in this area During the research for this Guidebook one crucial step was to understand how CCA projects were evaluated in the past and how they are currently evaluated So far RIEs have rarely been undertaken for CCA projects Addition-ally respected independent evaluation departments have seldom implemented RIEs with counterfactu-als for CCA projects up to now Since there is limited evidence on global adaptation progress to date RIEs have the capacity to redress the situation and gen-erate learning This is because they are conducted according to scientific quality standards that
i ensure the correctness of measurement findings (reliability)
ii exclude as far as possible alternative causes for an observed finding (internal validity) and
iii shift findings from an observed sample to a larger population (external validity)
No lsquoone size fits allrsquo RIE design
The numerous (methodological) challenges faced by CCA projects have led to intensive discussion among experts on how to adequately monitor and evaluate them The main challenges are
1 the lack of a conceptual agreement on definitions including what actually constitutes successful adaptation and therefore
2 the non-existence of a universal indicator (unlike for mitigation)
3 changes in the climatic context during a projectrsquos lifetime and the related problem of shifting base-lines
4 uncertainty about actual climate change patterns and their effects and
5 the long-time horizon of potential climate change impacts (see 22 for more details)
Individually none of these challenges are unique to CCA they also exist in projects in other sectors Together though they represent a fundamental difficulty for practitioners in terms of monitoring and evaluating project impacts Since adaptation projects vary widely in their scope and in the sec-tors they cover there is no such thing as a lsquoone size fits allrsquo evaluation design Whether and which RIE design(s) are to be used depends on various factors such as the level (micro meso or macro) at which the project generates an impact the availability of data and the time and resources available to the project For example at the systemic (macro) level a climate policy that is still at an early stage of implementation and project activities that have so far mainly focused on consultations and capacity building exercises may not be appropriate for a counterfactual assessment Nonetheless most CCA projects follow a multi-level approach which implies that a combination of two or more evaluation approaches may be required to measure the total impact of a project or programme
The selection of evaluation designs presented in this Guidebook is based on two considerations Firstly the design needs to comply with scientific standards in order to produce robust findings Secondly the selected designs should cover a wide range of differ-ent project approaches and all possible impact levels In particular six types of designs are discussed in detail
y experimental and quasi-experimental designs y matching techniques
Executive Summ
ary
8
y pipeline approach y regression discontinuity design (RDD) y time-series designs and y structural equation modelling (SEM)
Which evaluation design to choose ndash creating evidence at the individual level
At the individual level if a baseline is available (ex-ante and ex-post data from both the treatment and control group) three evaluation designs can be con-sidered for evaluating the CCA project an experi-mental quasi-experimental or regression disconti-nuity design
In an experimental design also known as a ran-domised controlled trial (RCT) a treatment and control group are compared with each other at two points in time ndash before and after the intervention ndash in order to estimate the counterfactual (what would have happened in the absence of the intervention) To be classified as an lsquoexperimentalrsquo design the ben-eficiaries need to be randomly selected during the planning phase of a project ie each person has the same chance of being a member of either the control or the treatment group If a random selection cannot be realised (eg due to self-selection bias or conscious selection) then such a design is called quasi-experi-mental In that case the group without treatment is called a lsquocomparison grouprsquo This means that some kind of matching technique needs to be applied dur-ing data analysis in order to control for selection bias
Thus both experimental and quasi-experimental designs are applicable to CCA projects as long as pro-ject activities aim at creating a direct impact at indi-vidual (micro) level The use of an experimental or quasi-experimental design calls for technical logis-tical and financial resources that mainly depend on the size and accessibility of the target group The data
selection process is often quite costly since a large team of enumerators is required Moreover there are two potential biases that may emerge and ham-per the process of attributing the observed change to project activities spill-over and contagion effects The former implies that the controlcomparison group indirectly receives a benefit from the project or programme and the latter occurs when differ-ent factors (eg projects operated by different agen-cies) affect the situation of the target population Nonetheless in terms of study design RCTs show the highest internal validity 2 and enable the clear attribution of interventions to impacts (the latter is also true of the quasi-experimental and pipeline approach) Regression discontinuity design (RDD) is a quasi-experimental evaluation method that can be applied if beneficiaries of the project are selected based on a special characteristic (eg income) of rel-evance to the desired impact that distinguishes them from the non-beneficiaries At the same time ben-eficiaries are compared with the comparison group in a number of other respects (eg location) Being a quasi-experimental design RDD does not require randomisation
If no baseline data have been collected beforehand two further evaluation designs can be considered at the individual level the pipeline approach and the panel design
The application of a pipeline approach is possible if a project is implemented sequentially (eg in dif-ferent regions) Thereby the selection of the target population that is not yet affected can serve as a quasi-comparison group for the group that is already affected It is important though that the treated groups of each phase are comparable Each data col-lection phase is just as labour-intensive and time-consuming as a quasi-experimental approach Panel designs a type of time-series design are in principle applicable for measuring impacts on all levels but require comparably larger sample sizes in order to be able to perform the necessary statistical calculations The special characteristic that differentiates the panel design from all the others mentioned above is that it requires data to be collected from identical units (eg persons households) at each point in time This makes it prone to attrition effects (ie decreasing sample sizes) over time It should also be mentioned that a panel design only makes it possible to estimate the contribution made by an intervention to observed changes but not to attribute these changes unambiguously
2 Internal validity is defined as the extent to which the variation of a dependent variable can be explained by the variation of a specific independent variable ie the extent to which alternative explana-tions for the variation of the dependent variable can be excluded
Impa
ct E
valu
atio
n G
uide
book
for C
limat
e Ch
ange
Ada
ptat
ion
Proj
ects
Phot
o copy
GIZ
Ste
inbe
rg
9
Creating evidence at institutional and system level
If an intervention aims to generate an impact at the institutional and system levels two further evalua-tion designs can be taken into account time-series designs and structural equation modelling
Time-series designs can be of particular use when it is necessary to cover longer periods than those set by a project or programme This makes them highly suitable for CCA projects where changes or results may unfold at later stages If data were collected repeatedly over a longer time period during the pro-ject time-series designs might be the best option It should be borne in mind though that these designs require a large number of repeated observations (at least about 10) in order to be able to perform the necessary statistical analyses for providing robust findings Finally if none of the designs fit structural equation modelling (SEM) could be an option for providing meaningful evidence about the impact of a project or programme It may be applied to meas-ure large-scale policy-based programmes that aim to affect an entire sector country or region SEM makes it possible to measure the statistical relation-ship between several influencing factors (eg public investments project funding disaster resilience of a population) This can be used to estimate the contri-bution of each of these factors one of which may be an intervention It should be pointed out that SEM and time-series designs only serve to estimate the contribution made by an intervention to observed changes
Conclusion and reading recommendation
The overview of available evaluation designs shows that there are several options for measuring impacts each with different potentials and limitations as well as methodological and data requirements This Impact Evaluation Guidebook provides practitioners with guidance on selecting the appropriate approach for a particular CCA project based on its characteris-tics and the available resources It also contains refer-ences to
y definitions and conclusions (blue framed boxes) y CCA project characteristics (green framed boxes) y practical tools and instruments (purple framed
boxes) y further reading material (orange framed boxes)
and y checklists summarising key issues (red framed
boxes)
Depending on the readerrsquos objective the different sections of the Guidebook may be of more or less interest However in order to obtain a comprehen-sive understanding of the subject matter we strongly recommended that you go through the lsquomust readsrsquo Section 12 which provides practical guidance for the planning and implementation of an RIE the summary at the end of Section 3 that contains an overview of the pros and cons of the different evalu-ation designs and leads you through the process of deciding which design to choose and Section 32 that focuses on the requirements for collecting large-scale quantitative data Once a particular evaluation design has been chosen the reader may consult the respective section that describes the chosen design in more detail (Sections 311 to 316) and as the case may be the further explanations in the annex If any of the technical terms or concepts are unclear the reader can consult the glossary MampE specialists who are not so familiar with the characteristics of CCA projects are advised to consult Section 2 in particu-lar Section 21 which discusses the key challenges of CCA projects with regard to their evaluation Finally the case study of an adaptation project in Bangladesh illustrates the application of this Guidebook
Phot
o copy
GIZ
Ran
ak M
artin
Executive Summ
ary
Impa
ct E
valu
atio
n G
uide
book
for C
limat
e Ch
ange
Ada
ptat
ion
Proj
ects
10
Are you planning to provide meaningful evidence of the impact of your climate change adaptation (CCA) project based on a sound empirical foundation Do you want to find out what difference it makes what changes can be observed in the field of inter-vention and how these changes are related to the project activities Or do you aim to gain knowledge about the inherent cause-and-effect relationships of a project learn from the past for the future fur-ther develop the project design or be accountable for the use of funds The decision about how to evalu-ate a project depends on a number of aspects such as the objectives of the evaluation its target groups and stakeholders or the available financial tech-nical human and time resources So the question lsquohowrsquo is closely related to several further aspects eg which design to implement which data collection instruments to apply or which analytical methods to choose
In this Guidebook we assume that you have decided to implement a rigorous impact evaluation (RIE) As the name says the focus of an RIE lies on the measurement and assessment of the impacts of a programme or project According to the OECDDAC evaluation criteria impact means any positive and negative primary and secondary long-term effect produced by an intervention directly or indirectly intended or unintended (OECDDAC 2006 6) Thus basically any observable change occurring in ndash and potentially beyond ndash a field of intervention presum-ably related to the evaluated programme or project may be subject to an RIE Another main characteris-tic of an RIE is that it aims to clearly attribute these observable changes to the intervention being exam-ined or at least to provide sufficient evidence to esti-mate the contribution the intervention has made to these changes Finally the term lsquorigorousrsquo implies that the measurement and attribution or contri-bution analysis is conducted in line with scientific quality standards This means that the findings of an RIE must meet the methodological demands that
apply to scientific research projects (ie that they should be reliable internally and externally valid and objective 3 These requirements ndash the rigorous measurement of impacts and attributioncontribu-tion analysis ndash determine the options for choosing a specific design or specific instruments and methods
As in every scientific research project the selection of the design further depends on the characteristics of the research subject With regard to impact evalu-ation the main characteristic to be considered is lsquowhat kind of impactrsquo needs to be evaluated While impact can be differentiated according to various category schemes (eg social political environmen-tal impacts) the most decisive aspect in terms of evaluation design is the lsquoaggregation levelrsquo at which it occurs This applies to climate change adaptation just as to any other field of intervention A distinction is usually made between three aggregation levels
y Individual (micro-level) impacts ie benefits or drawbacks for particular target groups (eg improving the resilience of a population to cli-mate change effects)
y Institutional (meso-level) impacts ie chang-ing the resources capacities performance etc of organisations such as enterprises governmental or non-governmental institutions (eg strength-ening the capacities of local authorities to deal with the socio-economic consequences of cli-mate change)
y Systemic (macro-level) impacts ie sectoral or regional developments (eg increasing the efforts of a government to reduce climate change-related causes of poverty or ill health)
The different accessibility of data at these levels implies that there is no lsquoone size fits allrsquo design For example while comparative analysis such as is applied in a quasi-experimental design (cf Sec-tion 311) may be suitable for measuring and assess-ing the livelihoods of climate migrants in a specified intervention area the influence on the capacities of basic urban service providers may call for the use of a structural equation modelling approach (cf Section 316) In the latter case there are many competing influences which makes it impossible to establish a comparison group (see Section 4 for an in-depth
3 Reliability internal and external validity and objectivity are count-ed among the most essential scientific quality criteria In empirical studies reliability indicates the correctness of measurement findings Internal validity means that the study design excludes alternative causes for an observed effect as far as possible while external validity means that the findings are in principle transfer-able from an observed sample to a greater population ie can be generalised Finally objectivity describes the independence of the measurement findings from their framework conditions (ie who collects the data who analyses them and under which conditions the findings are interpreted)
1 Introduction
11
discussion of this example) Given the complexity of climate change adaptation needs many CCA projects follow a multi-level approach Thus in an evalua-tion it may be necessary to combine several designs in order to assess the total effectiveness of such a project The Guidebook therefore aims to provide an operationally viable framework for evaluating CCA projects
According to this objective the structure of the Guidebook reflects the points to be considered when planning an RIE starting with a general overview of how to plan such an exercise (Section 12) This is fol-lowed by a discussion of the types and key features of CCA projects the typical challenges in the field of CCA and the way they are currently evaluated (Section 2) Section 3 presents the different options for rigorously evaluating CCA projects including references to the CCA-specific requirements and challenges outlined above The methodological pre-requisites for generating reliable empirical data on a large scale are also discussed Finally two exemplary evaluation designs are outlined on the basis of a GIZ case study (Section 4) including a brief presentation of their practical implementation The Guidebook closes with an annex containing further introduc-tions to some methodological aspects that need to be considered when designing an RIE a glossary of technical terms and further literature references
11 How to use the Guidebook
As the Guidebook aims to provide lsquohands-onrsquo infor-mation it contains a number of hints definitions practical examples links to further reading material and checklists which are highlighted as follows
Definitions and conclusions are presented in blue boxes followed by an exclamation mark
References to CCA projects are presented in green text boxes marked with a magnifying glass
Practical tools and exemplary instruments are presented in purple boxes flanked by two cogwheels
References and links to further reading material are presented in orange boxes highlighted with an open book
Checklists summarising key practical issues and recommendations for providing high- quality evaluation findings are presented in red boxes marked with a tick
Depending on the readerrsquos objective the different sections of the Guidebook may be of more or less interest However in order to obtain a comprehen-sive understanding of the subject matter we strongly recommend you to go through the lsquomust readsrsquo Section 12 which provides practical guidance for the planning and implementation of an RIE the summary at the end of Section 3 that contains an overview of the pros and cons of the different evalu-ation designs and leads you through the process of deciding which design to choose and Section 32 that focuses on the requirements for collecting large-scale quantitative data Once a particular evaluation design has been chosen the reader may consult the respective section that describes the chosen design in more detail (Sections 311 to 316) Some methodo-logical concepts discussed in these sections require some more methodological background and are therefore further explained in Annexes 52 to 56 If any of the technical terms or concepts are unclear the reader can consult the glossary MampE or evalua-tion specialists who are not so familiar with the char-acteristics of CCA projects are advised to consult Sec-tion 2 in particular Section 21 which discusses the key challenges of CCA projects with regard to their evaluation Finally the case study of an adaptation project in Bangladesh illustrates the application of this Guidebook
12 How to plan and implement an RIE for CCA projects
Letrsquos say you have decided to rigorously evaluate a CCA project How can this be done
First of all when planning such an endeavour you must realise that on the one hand an RIE needs to comply with scientific standards in order to produce valid and reliable empirical evidence of the impact of an intervention On the other hand you may face a number of obstacles such as time data and budget constraints (cf Bamberger 2004) which often make it difficult to adhere to such standards Planning any evaluation is therefore always a balancing act between fulfilling methodological demands as far as possible and keeping the evaluation feasible in practical terms To find the right lsquomiddle coursersquo it makes sense to begin the planning of an evaluation by answering a set of questions that determine its general framework
1 Introduction
Impa
ct E
valu
atio
n G
uide
book
for C
limat
e Ch
ange
Ada
ptat
ion
Proj
ects
12
Questions for determining the evaluation framework
` What is the object of the evaluation What is the scope of the evaluation in terms of observed period regions activities etc
` What are the objectives of the evaluation and which criteria will it use to assess the object of the evalua-tion
` Who are the recipients and who are the stakeholders of the evaluation ` What is the time frame of the evaluation When are the evaluation findings needed by ` Which human financial and organisational resources are available for the evaluation ` Who will implement the evaluation What qualifications and experience do the responsible persons have ` How will the evaluation be implemented What is the intended evaluation design Is it feasible with the
available resources ` Which data collection instruments and analysis methods will be applied Are the people in charge of data
collection and analysis familiar with these instruments and methods ` What tasks need to be performed during the evaluation and who will be in charge
As all of these aspects are interrelated it is crucial to answer these questions before actually start-ing to implement the evaluation For instance the scope and objectives depend on the stakeholders and recipients of an evaluation The design which determines the choice of instruments and meth-ods again depends on the available resources and qualifications and so on In view of these manifold interdependencies it makes a lot of sense to clarify document and communicate these issues among all involved stakeholders right from the outset Usu-ally when external consultants are commissioned to carry out an evaluation this is what should be out-lined in the terms of reference and agreed upon in the inception report if not before
When it comes to evaluating CCA projects some of these questions might be more difficult to answer than in other evaluations for instance the second question on the evaluation criteria Due to the lack of consensus about successful CCA (cf Section 22) it needs to be clarified right from the start what is understood by that concept in the specific context of
the project ideally in line with the project objectives Another important aspect which is not unique to the field of CCA however is the question of the sectoral expertise needed by the evaluation team Given the complexity of climate change-related issues a thor-ough understanding of the projectrsquos theory of change is a crucial prerequisite not only for data collection and analysis but also for integrating the findings into a larger (environmentaldevelopment-policy) framework particularly with regard to the projectrsquos contribution to overarching development goals (eg MDGs SDGs country development goals) Therefore it might be recommended to include a sector expert in the evaluation team who provides technical advice on assessing and interpreting the evaluation findings Finally to decide which evaluation design to choose the project characteristics need to be con-sidered (such as the uncertainty of the framework conditions in which it operates or the time frame within which its impacts can be observed) Section 3 of this Guidebook therefore provides several sugges-tions that take these and further characteristics into account
Phot
o copy
GIZ
Flo
rian
Kopp
13
Once these questions have been answered the first step of any evaluation is to develop a data collection plan (also called an evaluation matrix) structured according to the previously defined evaluation cri-teria A data collection plan is the reference docu-ment that guides the evaluation from instrument development to data analysis It provides a tabular
overview of the evaluation questions and hypotheses to be answeredtested the required indicators data sources and availability data collection instruments sampling procedures timing of the data collection data analysis methods responsibilities and required resources The following table gives an example of how such a data collection plan is usually structured
Table 1 Exemplary data collection plan
Analysis dimension
Hypothesis to be testedQuestion to be answered
Indicator Data source
Sample Data type Data collection instrument
Timing of data collection
Data analysis method
Respon-sible
Required resources
Direct outcomes
The livelihoods of climate migrants have improved
Proportion of climate migrants who have a job
Target group (climate migrants)
5 random sample of treat-ment and comparison group
Quantita-tive
Question-naire
Start of project end of project 3 years after end of project
t-test for inde-pendent samples
Evaluator no 1
1 working day (wd) for development of question-naire 2 wds for pre-testing 3 wds for implementing survey X euro for technical implementation
Income of respondent
Proportion of climate migrants who live in formal set-tlements
hellip hellip hellip hellip hellip hellip hellip hellip hellip
Working opportunities have been generated
No of working opportuni-ties
City corpo-rations
na Quantita-tive
Official statistics
Continuous monitoring
Time series analysis
Project officer
na
Types of working opportuni-ties
2 repre-sentatives of each involved city corpo-ration
Qualitative Interview with corporation representa-tives
Start of project then each 6 months update
Qualitative summary
Evaluator no 2
3 wds for conduct-ing interviews in each intervention area
Use of working oppor-tunities by target group
Target group
5 random sample of treatment group
Quantita-tive
Question-naire
End of project
Descriptive statistical analysis
Evaluator no 1
See above
Reasons for acceptance or non-acceptance of working opportuni-ties
Target group
3 groups of 6 to 10 persons in each interven-tion area
Qualitative Focus group discussion
End of project
Qualita-tive data analysis
Evaluator no 2
1 wd for conduct-ing FGD in each intervention area
hellip hellip hellip hellip hellip hellip hellip hellip
Access to health services has been improved
hellip hellip hellip hellip hellip hellip hellip hellip
hellip hellip hellip hellip hellip hellip hellip hellip hellip
hellip hellip hellip hellip hellip hellip hellip hellip hellip
Besides the construction of the indicators another important issue during the development of a data collection plan is the identification of the data sources If data is already available the question of whether they are sufficient for answering an evalu-ation question or whether additional data need to be gathered must be resolved If the available data are insufficient it needs to be decided which further data sources can be tapped and which instruments are applicable There are a number of factors to be
taken into account when deciding for or against a certain instrument including the costs incurred and the human resources and time required to complete the data collection For this it is necessary to draw up a plan of staff time and a finance which also shows who will be carrying out the respective tasks at what times and what costs will be involved The following flow chart summarises the typical sequence of an evaluation
1 Introduction
Impa
ct E
valu
atio
n G
uide
book
for C
limat
e Ch
ange
Ada
ptat
ion
Proj
ects
14
Figure 1 Flow chart for implementing an RIE
Clarication of objectives stakeholders and recipient(s) of the evaluation
Development of a data collection plan Formulation of evaluation questions
and hypotheses Development of indicators Identication of necessary data
sources
Development of survey design and data collection instruments
Data collection and quality check
Data complete
Data aggregation and analysis
Reporting Interpretation of ndings Development of conclusions
and recommendations
Data available
Yes
No
Yes
No
stakeholders need to be clarified A good starting point for considerations of this nature is provided by the feasibility standards established by the American Evaluation Association (AEA) which are intended to ensure lsquothat an evaluation is planned and conducted in a realistic prudent diplomatic and frugal wayrsquo 4
4 Cf httpwwwevalorgpcmldfid=103
During any evaluation a number of precautions need to be taken to ensure that the evaluation find-ings are not only valid and reliable but also well-understood and widely accepted Therefore all involved stakeholders should be informed that an evaluation is being conducted and why Further-more the roles and responsibilities of the different
Feasibility standards of the American Evaluation Association (AEA)
` F2 ndash Practical Procedures Evaluation procedures should be practical and responsive to the way the pro-gram operates Refers to the problem of the feasibility of scientifically ideal collection procedures with regard to the costs they incur and to ethical implications
` F3 ndash Contextual Viability Evaluations should recognize monitor and balance the cultural and political interests and needs of individuals and groups Points out the significance of taking into account the interests of all the stakeholders in a balanced way This is important since the use of the evaluation findings depends to a high degree on acceptance by the various stakeholders and because access to the relevant information often depends on peoplersquos willingness to cooperate
` F3 ndash Resource Use Evaluations should use resources effectively and efficiently Points to the necessity of taking into account the cost-benefit ratio in the implementation of evalua-tions In calculating the costs it is important to consider not only the consumption of tangible (financial) resources but also the intangible outlay (eg the use of time and deployment of human resources) though this can mostly be converted back into financial costs More difficult by far is the quantification of the ben-efit since it is not possible to provide any specific information about the expected findings in advance
15
When evaluating CCA projects it is especially impor-tant to consider the question of contextual viability as interventions may not always generate directly tangible benefits for the target groups All the more important then is to highlight the long-term objec-tives of a project when approaching the target groups for data collection Furthermore due to the usually large number of different stakeholder groups in CCA projects it may be necessary to start by iden-tifying the different needs capacities objectives and strategies of the different groups as well as their interrelations before collecting data For instance when a project focuses on adaptation to diminish-ing natural resources it is necessary to include not only the project beneficiaries but all groups who in principle depend on these resources or have a right to use them Ignoring the often complex actor con-stellations could lead not only to considerably biased evaluation findings (eg overestimation of impact) but also to the refusal of stakeholders to provide important information
Besides these formal aspects a number of further organisational issues need to be taken into account during the evaluation process such as the confi-dentiality of data Given the need to maintain the anonymity of those who provide the information certain rules must be adhered to when providing feedback on the evaluation findings Apart from the fact that there is a moral obligation to the lsquoinform-antsrsquo (ie interviewees participants in written sur-veys etc) not to abuse their willingness to cooperate a number of statutory provisions also exist
Regardless of how well an evaluation is planned and organised unforeseeable events can have nega-tive effects on its scheduling and findings The most common obstacles that must be anticipated when conducting the evaluation include the refusal of the informants to cooperate (refusal to be interviewed etc) and the occurrence of negative unintended effects in data collection (eg a rapidly deteriorat-ing work climate due to the respondents not having been given sufficient information about the evalu-ation) It is advisable in all cases to seek an oppor-tunity to talk to those concerned and if appropriate to arrange a meeting at which everyone is given the opportunity to present their point of view and work together to find solutions for instance through alter-native survey instruments or questionnaires In this situation it is of key importance that the evaluators are able to give a credible impression of their inde-pendence and neutrality
A potentially controversial question is whether or not recommendations should be included in the report and if so how they should be presented If it is decided when clarifying the assignment that recom-mendations will be made it is necessary to point out that they are intended as aids to orientation In other words it must be made clear what the evaluation can achieve and what it cannot in order to avoid unrea-sonable expectations This is even more true of the evaluation of CCA projects as due to the uncertainty of future climate developments a recommendation given at one point in time can prove to be wrong a few years later Therefore it is even more important to develop such recommendations together with the stakeholders and probably further climate experts in a participatory manner eg in the context of a work-shop Furthermore it may also be necessary to clarify the spatial and temporal validity of these recommen-dations and the assumptions under which they were made as regards the development of the framework conditions In any case it is necessary to differentiate between the evaluation findings and the conclusions and recommendations drawn from them
We recommend the following books and articles for further reading about practical evaluation requirements
Bamberger M Rugh J Church M Fort L Shoestring Evaluation Designing Impact Evaluations under Budget Time and Data Constraints American Journal of Evaluation 25(1) 2004 pp 5 ndash 37
Silvestrini S Organizational Aspects of Evalu-ations in Stockmann R (ed) A Practitioner Handbook on Evaluation Edward Elgar Cheltenham 2010
Stockmann R (ed) A Practitioner Handbook on Evaluation Edward Elgar Cheltenham 2010
1 Introduction
Impa
ct E
valu
atio
n G
uide
book
for C
limat
e Ch
ange
Ada
ptat
ion
Proj
ects
16
Phot
o copy
GIZ
Guy
2 Evaluating climate change adaptation projects
The first section of this chapter (21) provides an overview of the types and key features of CCA pro-ject interventions with regard to each level (micro meso macro) The second section (22) describes the challenges when it comes to evaluating CCA projects given their complexity Finally the third section (23) summarises currently used designs and data collec-tion methods to evaluate the results of CCA projects and shows their main shortcomings with regard to the quality of the evaluation findings
21 Types and key features of climate change adaptation projects
While most CCA projects follow a multi-level approach specific interventions (measures activi-ties) of such projects usually focus on a singular impact level be it on a particular target group such as climate migrants (individual level) local authori-ties (institutional level) or the legal and policy frame-work (system level) It is also important to under-stand that all three impact levels are interconnected For instance legal or policy changes (system level)
will necessarily have effects on the institutional level (eg local authorities companies) and the individual level (eg residents of a country or region) The indi-vidual benefits perceived by a specific target group (eg households in an intervention area) may even-tually be scaled up to the institutional and system level (eg through spill-over or other dissemination effects) The reason why it is important to make this distinction though is that the choice of the appro-priate evaluation design depends on the targeted impact level
211 Adaptation projects addressing the individual level
A particular type of adaptation intervention pri-marily affecting the individual level is the so-called community-based adaptation (CBA) approach which is often facilitated by a local organisation and can be implemented like a small-scale development project The primary objective of such an interven-tion is to improve the capacity of local communities to adapt to climate change applying an integrated approach that often combines traditional knowl-edge with innovative strategies Capacity building and awareness-raising are essential elements of such interventions In fact UNDP has found that com-munities and even policy-makers in target countries have limited knowledge of climate change issues especially of adaptation (UNDP 2009) Thus in order to be able to participate effectively locals must be supported to develop a good understanding of these issues which is why a lot of investments are being made in capacity building However working with communities can be a process that requires consider-able time financial resources and energy But it pays off because community engagement generates own-ership (at best) and enables empowerment giving communities a voice and the chance to participate Although CBA projects are situated at local level development cooperation aims to promote action at all levels to achieve systemic and sustainable change Relevant sectors for adaptation include rural devel-
17
Phot
o copy
GIZ
And
reas
K
opment agriculture water resources management coastal management disaster risk management and public health Typical practices address adjust-ments in the behaviour of individual groups as well as in the use and development of technologies (eg construction of large reservoirs adjustments to tra-ditional farming practices and risk reduction for the rural population)
The Community-Based Wetland Management Project (BIRAM) (UNDP 2015a) implemented by Boudhi Investigate and Research Assembly of Men supported by UNDP with funding from the Least Developed Country Fund the Government of Bang-ladesh and the UK Department for International Development is an example of a project that focuses on the micro level in five villages in Bangladesh (community level) The indigenous peoples living in the project areas are confronted with declining rain-fall rising temperatures and decreased water levels due to climate change A nearby stream is the main source of irrigation and fish farming Climate change forecasts predict that temperatures will continue to rise generating aridity in the target regions which will have negative consequences on ecosystems and livelihoods The project focuses on promoting sus-tainable crop varieties improved agricultural prac-tices and improved water collection Moreover it will train community members in alternative income-generating activities to reduce pressure on natural resources and diversify income sources 5
The Sustainable Agricultural Programme (PROAGRO I amp II) (GIZ 2015a) ndash a trilateral cooperation arrange-ment between Bolivia Germany and Sweden ndash is an example of a project that focuses on the individual level Its objectives are the following (1) to increase the resilience of smallholders in arid and semi-arid regions of Bolivia to climate change risks (2) to conserve and distribute scarce water resources as part of integrated watershed management and (3) to increase income from agricultural production A fourth component ndash ie adaptation to climate change ndash was integrated into PROAGRO II implemented by GIZ on behalf of BMZ A vulnerability assessment was conducted in 2013 following the approach of GIZrsquos lsquoVulnerability Sourcebookrsquo (Cordero 2014) The main climate risk is water scar-city which will probably increase in future and will have a negative impact on agricultural production The findings of the vulnerability assessment show that PROAGRO reduced the vulnerability of small-holder farmers by adjusting crop types and sowing dates and replacing old irrigation technologies with
5 More UNDP community-based adaptation projects can be found under the following link httpwwwundp-almorgprojectsspa-community-based-adaptation-project
more appropriate ones which enhanced water effi-ciency in the parcels (id) A mid-term evaluation was also conducted in 2013 using a mainly qualitative evaluation design (analysis of primary and secondary data semi-structured interviews and surveys with national counterparts strategic partners and target groups direct observation focus group discussions) (Kronik 2013)
212 Adaptation projects addressing the institutional level
Effective institutions are a major factor when it comes to the ability to respond to growing climate risks since they are designed to perform a set of functions related to decision-making and imple-mentation (Dixit et al 2011) They play a critical role in increasing societyrsquos capacity to adjust as condi-tions shift and as new climate change knowledge appears In a constantly changing climate the pro-cess of institutional change represents an impor-tant aspect of building adaptive capacities ie the ability of a national government and other entities and individuals to design and implement effective adaptation strategies or to react to negative climate stresses (Dixit et al 2011) Since national policy-makers international negotiators and funders assist in developing methods and guidelines for adapta-tion planning it is essential that they include a focus on building institutional capacity to adapt to cli-mate change impacts One of several ways in which climate-related challenges may require institutions to make significant adjustments involves meeting the needs of the most vulnerable people who tend to be poor or marginalised They usually have few resources with which to adapt and little say in public decision-making processes
Various CCA projects comprise interventions that aim at making an impact at institutional level One example is the National Adaptive Capacity (NAC) framework launched by the World Resources Insti-tute which assists governmental agencies in includ-
2 Evaluating clim
ate change adaptation projects
Impa
ct E
valu
atio
n G
uide
book
for C
limat
e Ch
ange
Ada
ptat
ion
Proj
ects
18
ing institutional capacity development in their adaptation planning processes It enables its users to systematically assess institutional strengths and weaknesses that may help or hinder adapta-tion National adaptation plans may then be better designed to make best use of strengths or remedy weaknesses (Dixit et al 2011) Another example is the Public Investment and Climate Change Adapta-tion (IPACC) project (GIZ 2015b) conducted by GIZ on behalf of BMUB in Peru The aim of the project is to raise awareness ndash among national and regional policy-makers and relevant technicians ndash of the potential environmental social and economic costs of climate change and to encourage decision-makers to consider climate-relevant criteria when formulat-ing and approving public investments Hence meth-ods were designed to integrate disaster risk man-agement and CCA considerations into a countryrsquos national investment planning to increase the adap-tive capacity and reduce climate-related risks (GIZ 2012) Next to initiatives in the policy field there are also CCA projects carried out by non-governmental organisations The DANIDA-funded project Capac-ity Strengthening in Least Developed Countries (LDCs) for Adaptation to Climate Change (CLACC) (IIED 2015) which is operated under the auspices of the International Institute for Environment and Development (IIED) strives to strengthen the capac-ity of civil society organisations in LDCs to adapt to climate change and foster adaptive capacity among the most vulnerable people This implies integrating adaptation to climate change into the work of NGOs and simultaneously setting up a system to share knowledge and experience among the adaptation community In this context IIED helped to establish the International Centre for Climate Change and Development (ICCCAD) in Bangladesh which pro-vides training on CCA and development for NGOs donors media government staff and the private sec-tor
213 Adaptation projects addressing the systemic level
CCA projects aiming to generate system-wide impacts often follow a top-down approach and com-prise interventions at global regional or national level Such interventions target policy changes (eg sectordevelopment strategies) changes in public opinion on a particular topic (eg climate change adaptation requirements) or changes in economic framework conditions (eg introduction of climate
change- adapted value chains 6) With regard to CCA projects two potential intervention types fall under this category country level and global or regional initiatives At the country level CCA projects provide policy advice to support the elaboration of national climate change strategies and action plans or to cre-ate awareness and facilitate consultation among (government) stakeholders The aim is to give con-sideration to climate change risks in laws planning policies and negotiations Such interventions also support the design of targeted policy strategies eg to climate-proof 7 the agricultural sector and intro-duce new crops cropping methods or efficient irri-gation technologies
An example of a CCA project that comprises such interventions at the federal level is the Climate Sup-port Programme (CSP) (GIZ 2015c) launched by GIZ on behalf of BMUB in South Africa in 2009 The projectrsquos aim is to assist the Department of Envi-ronmental Affairs (DEA) in reducing South Africarsquos carbon footprint mitigating climate change impacts and strengthening the countryrsquos resilience to climate change (GIZ 2013) The project supported the devel-opment and implementation of the Governmentrsquos white paper on the national climate policy 8 by pro-viding expertise contributing also to consensus-building among important stakeholders Section 12 of the white paper clearly mandates the develop-ment of an adaptation MampE system Moreover sector departments have started the process of reviewing their policies to align them with the white paper Additionally together with the BMZ-funded project lsquoEffective adaptation finance (MampE Adapt)rsquo GIZ is supporting the development and implementation of a monitoring and evaluation (MampE) system for adap-tation
6 See for instance the project lsquoPromoting a Value Chain Approach to Climate Change Adaptation in Agriculture in Ghanarsquo which aims to help reduce climate-induced risks and thereby contrib-ute to the achievement of food security and income-generating objectives for rural communities by focusing on the improvement and adaptation of the cassava value chain wwwthegeforggefsitesthegeforgfilesgef_prj_docsGEFProjectDocumentsCli-mate20ChangeGhana20-202843682920-20Promot-ing20Value20Chain20Approach20to20Adaptation20in20Ag1-17-20122020ID436820202020Ghana20SCCF20Full20Project20Document20for20Re-submis-sion2020Jan20201220cleanpdf
7 lsquoClimate-proofingrsquo is a methodological approach applied by GIZ that integrates climate change aspects into development plan-ning The reason for climate-proofing projects or programmes is the following even if GHG emissions are drastically re-duced climatic changes will still occur which will be fatal for some pop-ulations and ecosystems and will have negative con-sequences on the countryrsquos economy These climatic changes will gradually become more visible Consequently when de-signing a project it is of the utmost importance to consider climate change aspects especially if the project is supposed to run for a longer period of time (Hahn M 20102-6)
8 See White Paper of the National Climate Change Response Policy (published in 2011) httpravaqsensnetthemestheme_emissions111012nccr-whitepaperpdf
19
CCA projects with a global dimension include vari-ous international players who work together to achieve a common goal They mainly focus on con-ceptual work capacity building and knowledge exchange The institutions involved are responsible for the development of methods and tools for novel topics such as national adaptation plans (NAPs) and also for piloting these tools and methods in partner countries thereby cooperating with existing pro-jects within these countries In a best-case scenario the results and experiences of the CCA projects are shared with the CCA community to enable an exchange of knowledge and good practices through webinars workshops or online platforms 9 One example is the National Adaptation Plan Global Support Programme (NAP-GSP) (UNDP 2015b) for Least Developed Countries which is a UNDP-UNEP programme financed by the Least Developed Coun-try Fund (LDCF) and the Special Climate Change Fund managed by the Global Environment Facility (GEF) It helps LDCs 10 and developing economies to advance with their NAP 11 process through technical assistance provides tools and training to support the NAP process within the country and facilitates an exchange of lessons and knowledge through South-South and North-South cooperation The formula-tion and implementation of NAPs helps to identify the medium- and long-term adaptation needs of a technical institutional and financial nature and simultaneously develop and implement strategies and programmes to address these needs 12
22 Key challenges of climate change adaptation projects
CCA projects (including those with a partial focus on adaptation) pose specific methodological chal-lenges 13 which need to be taken into account throughout the whole project cycle These chal-
9 Examples of online platforms of this kind are wwwadaptation-communitynet wwwundp-almorg wwwadaptationlearning-mechanismcom wwwclimate-evalorg and wwwmediation-pro-jecteuplatform Europe-wide wwwclimate-adapteeaeuropaeu
10 26 LDCs have requested help with their NAP process11 The NAP process was initiated under the Cancun Adaptation
Framework (CAF)12 This paragraph is based on the information obtained on the
homepage (wwwundp-almorg)13 It must be mentioned however that the methodological chal-
lenges described below are by no means unique to CCA projects For instance most SWAPs have long time horizons (eg when re-forming a TVET system it may take several decades for benefits to become visible) uncertainty and shifting baselines are a problem in most fragile contexts and universal indicators (except maybe for education and economic development) are still lacking in most fields of intervention
lenges make it necessary to fine-tune development agenciesrsquo current MampE frameworks especially with regard to the development of indicators baselines milestones targets and the timing of MampE activities which need to be adjusted to the longer time horizon of the majority of adaptation initiatives These chal-lenges are outlined below
First of all the remaining ambiguity of the concepts used may impede the development of appropriate verifiable and measurable indicators There is no clear and commonly accepted definition of adapta-tion adaptive capacity and climate-resilient liveli-hoods which makes it difficult to define objective indicators There is also a lack of consensus about what actually constitutes successful adaptation Consequently there are no universal indicators for CCA projects since they depend not only on the individual project but also on the context scale sec-tor and location Unlike mitigation for which the amount of GHG emissions in the atmosphere serves as a universal MampE indicator the success of an adap-tation intervention cannot be measured by a single indicator Qualitative assessments are as important as quantitative ones since many aspects of adapta-tion are lsquosoftrsquo (eg institutional capacity behaviour change etc)
The establishment of a baseline is considered another major challenge for evaluating climate change adaptation projects A baseline is crucial to measure the projectrsquos impact as it provides a refer-ence point against which a change can actually be measured In climate change adaptation projects future climate change effects also need to be taken into account (ie a baseline projection of how the climate is going to evolve during the project term and beyond) Since climate change is most likely to unfold differently than assumed in the projection experts speak of a lsquoshifted baselinersquo Shifting baselines are considered to be problematic in terms of plan-ning since they change the context of the adaptation intervention
Thus uncertainty about actual climate change pat-terns and their effects is another aspect that needs to be addressed It may be impossible to anticipate when for example the next flood will occur in order to analyse to what extent adaptation took place in situ compared to the situation before the interven-tion Moreover adaptation strategies marked as suc-cessful in the short term may have negative impacts on vulnerability in the long term
2 Evaluating clim
ate change adaptation projects
Impa
ct E
valu
atio
n G
uide
book
for C
limat
e Ch
ange
Ada
ptat
ion
Proj
ects
20
Finally the long time horizon of potential climate change impacts poses an additional challenge that needs to be considered when designing the MampE framework for CCA projects Long-term impacts are unlikely to result from the project alone Instead they are rather generated by a series of factors or other interventions in the specific area Complexity increases when trying to identify the short-term and long-term outcomes that can be attributed to a par-ticular intervention For example the choice of farm-ing practices in a sustainable agriculture project also reflects the thought given to current or future cli-mate change However it remains difficult to isolate and assess the individual adaptation components reflected by these choices
23 Review of current methods to evaluate the results of CCA projects
The projects reviewed are conducted in developing countries and emerging economies 14 For the pur-pose of this guidebook emphasis was placed on the methodology ie the analysis of currently used eval-uation designs (experimental quasi-experimental ex-post etc) the presentation of the main data col-lection methods used (focus group discussions inter-views surveys direct observation etc) and lastly whether a quantitative qualitative or mixed-method approach was used The findings are summarised in Annex 51
During the research process two problems became visible first little use is made of RIEs in CCA projects which relates to the second finding namely the diffi-culty of ascertaining which evaluation methodology was applied Often it was difficult to identify which design was used since there was no reference to it in the methodology section of the evaluation Due to this difficulty we checked for keywords in the evalu-ation papers (eg randomisation randomised con-trolled trials (RCTs) control or comparison group quasi- and experimental design counterfactual and so forth) Very often none of these keywords were found in the whole document which is why there is no reference to the evaluation design in the table in Annex 51
14 Three different research approaches were used for this study (a) a simple google search using the following keywords lsquoclimate change adaptation impact evaluation vulnerability vulnerability assessments monitoring and evaluation of climate change adaptation adaptive capacity and resiliencersquo (b) a review of the reference lists of the journal articles found in (a) and (c) the scan-ning of relevant evaluations carried out by development agencies international organisations or independent evaluation institutions
Prowse and Snilstveit came to a similar conclusion in their study Impact Evaluation and Interventions to Address Climate Change A Scoping Study 15 pub-lished in 2010 saying that just a few RIEs were con-ducted (using mainly a quasi-experimental design) Although Prowse and Snilstveit recognised the chal-lenging nature of CCA projects this does not impede the use of RIEs Especially with regard to the increas-ing financial resources made available for climate change mitigation and adaptation projects it is important to make use of RIEs because evidence of the effectiveness of spending is required
Challenges inherent to evaluations of CCA projects involve the poor quality of the baseline (if there is one at all) randomisation and the development of a sample size which is often not representative The possible spreading of benefits from target to non-target groups is another limitation often referred to (see example below) In general data triangulation ie using a combination of qualitative and quantita-tive indicators (mixed-method approach) is visible in almost all CCA projects 16 which can be seen as a sign of progress in this field Just to name one example the evaluation of the project lsquoChronic Vulnerability to Food Insecurityrsquo implemented by the World Food Programme triangulates data from qualitative and quantitative sources It uses qualitative data from focus group discussions with community mem-bers and key-informant interviews with commu-nity opinion leaders and quantitative data involv-ing about 3000 randomly sampled households (cf Annex 51)
Another interesting finding concerns the way inter-national organisations conduct evaluations These evaluations are aligned with the Paris Declaration on Aid Effectiveness basing the evaluation mainly on the assessment of effectiveness efficiency relevance impact and sustainability (the DAC criteria) There is often no reference to the applied methodology
To name an example consider the Pacific Integrated Water Resource Management (IWRM) project (UNDP 2015c) established in 2009 which aimed to improve water resource and wastewater management and increase water use efficiency in Pacific island coun-tries in order to balance overuse and conflicting uses of scarce freshwater resources The evaluation is based on the DAC criteria for evaluating develop-ment assistance but it does not explain which design
15 Impact Evaluation and Interventions to Address Climate Change A Scoping Study httpwwwtandfonlinecomdoipdf10108019439341003786729
16 Although CCA evaluations are sometimes based on desk reviews and qualitative indicators (eg stakeholder interviews focus group discussions direct observations etc) and often lack robust quantitative data (see for example project Ndeg 31 in the table in Annex 51)
21
was applied In the methodological part only the data collection instruments are outlined (ie desk review and analysis interviews site visits) The same is true of many other evaluations within the Evalu-ation Resource Centre 17 of UNDPrsquos Independent Evaluation Office 18
In general when screening evaluations conducted by international organisations (see for instance the database of IFAD and the Global Environment Facil-ity (GEF) it becomes obvious that they have not conducted many rigorous impact evaluations so far hence there is not much experience in this field Take the Independent Evaluation Office of IFAD for instance narrowing down the search to look only at impact evaluations there is just one evaluation that was conducted in Sri Lanka in 2013 (Dry Zone Livelihood Support and Partnership Programme (DZLISPP)) 19 Although it is the only impact evalua-tion there is a clear methodology behind it For the first time IFAD undertook extensive data collection and analysis including a qualitative survey (30 key-informant interviews with project staff and relevant government officials) 41 focus group discussions with beneficiaries and a quantitative survey of over 2560 households Due to an absence of baseline data (which is often the case in CCA projects) two strate-gies were applied (1) an attempt to reconstruct the baseline through recall methods and (2) the use of a quasi-experimental design that does not strictly require baseline data Further challenges experienced were sample selection bias due to targeting and the potential spreading of benefits from target to non-target groups
The Independent Evaluation Office of the GEF offers more than one impact evaluation but the overall number is modest Furthermore the few impact evaluations that have been conducted only concern climate change mitigation projects (there are none for CCA projects yet) However although the GEF has not yet implemented many impact evaluations it
17 Evaluation Resource Centre httpercundporgindexhtml18 Independent Evaluation Office httpwebundporgevaluation19 Dry Zone Livelihood Support and Partnership Programme
(DZLISPP) httpwwwifadorgevaluationpublic_htmleksystdocimpact2013srilankaindexhtm
is clear that they deal with this topic since there are many publications that emphasise the impact evalu-ation of climate change projects It will surely be only a matter of time until there is a spillover to CCA pro-jects too In 2014 the GEF Independent Evaluation Office together with a number of multilateral and bilateral organisations including GIZ hosted the Sec-ond International Conference on Evaluating Climate Change and Development which aimed to promote and develop methods and good practices for MampE of adaptation and mitigation 20 A book of conference proceedings will be published by Springer in 2016
To be fair it has to be stressed that many CCA pro-jects focused on policy development and capacity building exercises at institutional level for which RIEs may not be an adequate evaluation design The National Adaptation Plan Global Support Pro-gramme or the Climate Finance Readiness Pro-gramme are examples where RIEs might be compli-cated These are global CCA projects that focus on policy development capacity building at institu-tional level and making sure that the target country is ready (institution-wise) to receive the financial resources earmarked for CCA projects
It should also be mentioned that lsquolearningrsquo is in many cases not the focus of the evaluation Frequently evaluations focus rather on the question lsquoHave we done what we said we wouldrsquo (accountability) than on lsquoWhat happened and whyrsquo (learning) This is especially true of development organisations (exam-ples are outlined in the table in the annex) Addi-tionally while screening CCA projects carried out by development organisations it became clear that many projects are still ongoing This means that an evaluation still has to be completed At best this pub-lication may raise awareness among practitioners to consider RIEs for CCA projects in order to increase the use of this evaluation design gain relevant expe-rience and simultaneously obtain valuable findings that can be shared with the adaptation community
20 Presentations and videos from the conference can be accessed at httpswwwclimate-evalorgevents2014-conference
Phot
o copy
GIZ
Ran
ak M
artin
2 Evaluating clim
ate change adaptation projects
Impa
ct E
valu
atio
n G
uide
book
for C
limat
e Ch
ange
Ada
ptat
ion
Proj
ects
22
3 Rigorous evaluation designs and examples of applicability in climate change adaptation projects
Having discussed the types and key features of CCA projects and the way they are currently evaluated this section will now provide an overview of the strategies and prerequisites for evaluating the impact of such projects bearing in mind their characteris-tics The first section thus deals with the potentials and limitations of different research designs used for impact evaluations when it comes to their applica-tion in the field of climate change adaptation (31) Section 32 discusses the methodological require-ments for providing reliable data on a large scale with a particular focus on adequate survey sampling techniques
31 Overview of evaluation designs ndash potentials and limitations for climate change adaptation projects
Before going further into the topic as such the term lsquodesignrsquo should be briefly explained as it is occasion-ally used with different meanings and confused with other terms such as lsquomethodrsquo or lsquoinstrumentrsquo
Generally speaking a research design describes how a research question is intended to be answered Evaluation designs usually differ with regard to the points in time when data is collected the data sources and the way the data is analysed (eg by com-paring target group with comparison group data) Most common evaluation designs are ex-post facto designs and single-difference designs (ie before-and-after comparisons or group comparisons) How-ever as these designs are not suitable for evaluating impact ndash at least when used as the only means during an evaluation ndash they are not discussed further in this Guidebook Instead we shall go on to present alter-native and more sophisticated evaluation designs that can provide sufficient empirical evidence
about the attribution or at least contribution of an intervention to observed changes We will explain the types of projects to which they can be applied which time budget and data resources they require and how informative their findings are We will also assess how valid and reliable the evaluation findings are provided the design has been implemented cor-rectly
A research design describes how a research question is answered
The descriptions start with experimental and quasi-experimental designs (311) which are favoured by a number of evaluation experts (eg DufloGlen-nersterKremer 2008 see also literature list at the end of this section) and considered by some as the lsquogold standardrsquo for impact evaluation In 312 an alternative approach for estimating the impact of an intervention is discussed so-called propensity score matching which may be suitable when poten-tial beneficiaries cannot be randomly assigned to a treatment and comparison group The next sec-tion deals with the so-called pipeline approach (313) This approach is of particular use if a project is implemented sequentially but aims to support target groups that feature comparable characteris-tics Another approach that is useful when the treat-ment decision depends on the beneficiary present-ing a threshold level of a specific characteristic (eg income or age) called the regression discontinu-ity approach is discussed in Section 314 In Sec-tion 315 the potentials of time-series evaluation designs are discussed by means of the so-called panel analysis Time-series designs are of particular value for long-term projects and observation periods and when complementary statistical data is acces-sible The last design discussed in detail is suitable for projects that aim to make a difference at policy level (type I and II projects) as it can provide empiri-cal evidence about their contribution to changes in a complex environment taking external influences into account (316) The design is called structural equation modelling and comes from the field of econometric research where it is commonly used to identify causal linkages between social and eco-nomic phenomena such as education and health The section closes (317) with a tabular overview of the applicability of the evaluation designs discussed above their methodological and practical require-ments and the validity of their findings (if applied correctly) The purpose of this overview is to enable the reader to choose a particular design bearing in mind the adaptation-specific project characteris-tics and given the financial technical and logistical framework conditions
311 Experimental and quasi- experimental designs
The following section outlines the main characteris-tics potentials and limitations and methodological prerequisites for applying an experimental or quasi-experimental design during an evaluation We will also discuss the kind of CCA-related interventions to which such designs can be applied and which meth-odological skills and (financial human and time) resources are required
Generally speaking experimental and quasi-exper-imental designs (in the field of applied empirical social sciences) consist of a comparison of two groups at two points in time One group receives a certain treatment (intervention measure activity etc in the following named lsquotreatment grouprsquo) and the other does not A design is called experimental or more precisely a randomised controlled trial (RCT) if the members of each group are selected at random This means that (ex-ante) the probability of each indi-vidual being a member of the treatment group is the same 21 The group that has not received any treatment is then called a lsquocontrol grouprsquo If such a random selec-tion cannot be ensured (eg due to self-selection bias or conscious selection) then such a design is called quasi-experimental In that case the group without treatment is called a lsquocomparison grouprsquo 22 However in order to simplify matters we will consistently use the term lsquocomparison grouprsquo in the remainder of this document
Experimental designs require a randomised selection of participants for an intervention
The purpose of employing such a design is to allow for attributing observable changes in a given popu-lation to an intervention This is done by estimating the so-called counterfactual ie the hypothetical situation of that population without having received the treatment In other words we do so by answer-ing the question lsquoWhat would have happened if no intervention had taken placersquo While estimating the counterfactual is also the foundation for calculating the treatment effect in pre- and post-test analyses and
21 It has to be highlighted that the equal probability that individuals of a given basic population will receive a treatment needs to be considered at the project planning stage That means that an RCT can only be applied if the project design allows for a random selec-tion of the treatment group
22 The rationale behind this distinction is that a lsquonon-interventionrsquo group that has not been selected at random cannot by definition act as a lsquocontrolrsquo for any time-variant or invariant variables There-fore particularly in the social sciences the term lsquocomparison grouprsquo is frequently used in settings where the groups were not selected at random
comparative analyses these designs have consider-able weaknesses regarding their underlying assump-tions These weaknesses compromise the validity of their findings in many cases In a simple pre- and post-test design the measurement prior to the inter-vention is taken as the counterfactual assuming that the situation of the target group would have remained stable without the intervention However because there is usually a considerable time span between the measurements this assumption is not valid as it cannot be assured that no other external factor would have influenced the situation of the treatment group Comparative designs estimate the counterfactual by collecting ex-post data from both the treatment group and a group that has not taken part in or benefited from the intervention ie a com-parison group In this case one assumes that the situ-ations of the treatment group and the comparison group were identical before the intervention How-ever this assumption cannot be held true either due to the potential selection bias The selection bias may be based on the intervention design (eg focusing on the most needy persons) the individual characteris-tics of the participants (eg self-selection by voluntari-ness) or on practical issues such as a limited budget the accessibility of the treatment group or other logis-tical constraints
Experimental and quasi-experimental designs tackle the issue of intervening time factors and potential differences between target and comparison groups by combining both a pre- and post-test and a compara-tive design This means that data is collected from both the target group and the comparison group before and after the intervention The net effect of an intervention (ie net average treatment effect) is then calculated on the basis of the average difference in the observable changes between the treatment and the comparison group (also called double-difference or difference-in-difference approach see Annex 52 for a further introduction to the calculation of the net average treatment effect using this approach)
Phot
o copy
GIZ
Har
ald
Fran
zen
3 Rigorous evaluation designs and exam
ples of applicability in climate change adaptation projects
Impa
ct E
valu
atio
n G
uide
book
for C
limat
e Ch
ange
Ada
ptat
ion
Proj
ects
24
CCA-specific requirements and challenges
Experimental and quasi-experimental designs are applicable to CCA projects whenever project measures aim at generating a direct impact at individual level ie if a distinguishable target group (eg inhabitants of a particular disaster-prone area farmers in arid regions) receive a specific benefit (eg knowledge of how to seek shelter in case of emergency technical assistance to install drip-irrigation systems) In order to apply such a design it must also be possible to establish a treatment and control or comparison group While in some cases the division of a population into a treatment and controlcomparison group may not be appro-priate for ethical reasons (ie if the denial of support would lead to an immediate deadly peril eg medi-cation in an epidemic) in many other cases financial logistical or technical constraints inevitably lead to selecting a sub-group of a larger population that in principle shares the same needs
A further requirement for applying an experimental or quasi-experimental design is that it must be pos-sible to detect an impact within a manageable time frame While it holds true that it may take a long time for CCA project impacts to become visible ndash which is also the case for impacts in other fields such as edu-cation financial systems or private sector development ndash there may also be some ways to work around the relevant constraints Referring to the first example mentioned above for instance one would not have to wait until another disaster happens to see if the project participants are able to seek shelter faster than those who did not participate A simple observation with a stopwatch during a test alarm would probably do the trick as well Concerning the second example it may not be necessary to wait until the environmental framework conditions have deteriorated in another 20 years to see if the drip-irrigation systems lead to the desired impact Even without any (further) climate change one can measure the reduced water consump-tion and increased yield in comparison to conventional farming methods However in the latter case too a time-series design (cf Section 315) may be a viable alternative for identifying the long-term impact of the project particularly if a comparison group can be established
It must be mentioned though that experimental and quasi-experimental designs also feature a number of challenges which limit their applicability to some extent First of all such designs require considerable tech-nical logistical and thus financial resources As one can imagine the collection of data from a large num-ber of people (cf Section 32 for further considerations about required sample sizes) particularly if they are located in difficult-to-reach areas is costly and time-consuming Furthermore the necessity to collect this data also from people who did not receive any benefit may be difficult as they may be not as willing to con-tribute to such an analysis as those who did For example a farmer who did not receive any technical assis-tance may not be as willing to provide information about his yields In such cases a suitable project design (possibly a pipeline approach see Section 313) may increase the willingness to participate
Finally the findings of such designs are prone to a certain degree of bias such as spill-over and conta-gion effects A spill-over effect means that the controlcomparison group indirectly receives a benefit eg through copying or learning from the treatment group (eg if the trained habitants in the disaster-prone area tell others who were not trained how to behave or if farmers who did not receive any assistance adopt irrigation schemes because they recognise their comparative advantage) Contagion effects may occur if the project under investigation is not the only one to provide support in the target area ie if other DC agencies are active in the same field In that case it may be difficult to attribute the observable impact to the particu-lar intervention (eg if the farmer was able to increase his yield because of the technical support provided by GIZ or because of the micro-credit he received from the ADB) While spill-over effects usually lead to an underestimation of the treatment effect (ie as the controlcomparison group receives a benefit as well) contagion effects can lead to both the over- and underestimation of the treatment effect depending which group has been (more) contaminated by other support measures Thus in multi-donor settings contribution analyses such as those conducted as part of a structural equation modelling approach (cf Section 316) may be more promising
25
312 Matching techniques
In an experimental design comparing the differ-ences in the outcomes of the treatment and control group would be sufficient for calculating the net effect of an intervention However as treatment groups are rarely selected randomly often such a design cannot be implemented in practice To obtain valid evaluation findings all the same the induced selection bias described above needs to be compen-sated for Various approaches are available for this purpose among these matching techniques appear to be especially suitable in evaluation studies The basic idea of matching techniques is to establish for each member of a treatment group a sub-set of pos-sibly similar comparison group members in order to estimate the treatment effect by calculating mean group differences That means that the counterfac-tual situation of the treated person (ie what would have happened if this person had not participated in the project) is approximated through the assignment of similar persons who have not participated
Matching techniques aim to approximate the counterfactual by comparing the outcomes of individuals from the treatment and the compari-son group that have identical or at least similar characteristics
A common matching approach is to identify statisti-cal twins by comparing individual characteristics (ie dimensions) that are supposed to have an influence on the outcomes of an intervention For example if one suspects that the effectiveness of a training measure (eg teaching farmers how to grow drought-resistant crops) also depends on the age and gender of the beneficiary the treatment and comparison group can be clustered accordingly and the outcomes can be individually compared for each sub-sample The following table illustrates the principle of the matching approach using the mentioned example
For further reading about impact evaluation in general and the above-discussed methodological aspects the potentials and limitations of experimental and quasi-experimental designs and particularly their practical implementation the following books articles and papers are recommended
General methodological introduction
Bertrand M Duflo E Mullainathan S How Much Should We Trust Differences-in-Differ-ences Estimates Working Paper 01 ndash 34 MIT Cambridge 2001
Stern E Stame N Mayne J Forss K Davies R Befani B Broadening the range of designs and methods for impact evaluations Working Paper 38 DFID London 2012
White H Some Reflections on Current Debates in Impact Evaluation International Initiative for Impact Evaluation New Delhi 2009
Practical guidelines and examples
Chambers R Karlan D Ravallion M Rogers P Designing impact evaluation different per-spectives International Initiative for Impact Evaluation New Delhi 2009
Khandker SR Koolwal GB Samad HA Handbook on Impact Evaluation Quantita-tive Methods and Practices The World Bank Washington DC 2010
Leeuw F Vaessen J Impact Evaluations and Development NONIE Guidance on Impact Evaluation NONIE Washington DC 2009
Vaessen J Todd D Methodological challenges of evaluating the impact of the Global Envi-ronment Facilitys biodiversity program Evalu-ation and Program Planning 31 2008 pp 231 ndash 240
3 Rigorous evaluation designs and exam
ples of applicability in climate change adaptation projects
Impa
ct E
valu
atio
n G
uide
book
for C
limat
e Ch
ange
Ada
ptat
ion
Proj
ects
26
Table 2 Example table for matching on observables
Group Treatment group Comparison group
Gender Male Female Male Female
lt 40 years old
ge 40 years old
Annotation Each cellarrow colour indicates an individual comparison
As the table shows each sub-sample of the treatment group (eg men of the age of 40 and above) is com-pared with a sub-sample of the comparison group that has the same characteristics The problem with this so-called matching on observables approach is that the size of comparable sub-samples decreases as the number of relevant dimensions grows This again limits the possibility of conducting statistical tests (eg t-test for comparing mean values of independ-ent samples) that require a minimum cell count of approximately 30 cases in order to reach valid find-ings
Another matching technique that has gained atten-tion in the last years is called propensity score matching (PSM cf RosenbaumRubin 1985) The advantage of this technique is that in contrast to matching on observables it provides a one-dimen-sional score for comparison (the so-called propensity score) that indicates the probability of any individual being a member of the treatment group Since this approach is methodologically quite demanding and thus requires a strong theoretical background its application will not be discussed here in detail Instead a short introduction into PSM and further reading material can be found in Annex 53
CCA-specific requirements and challenges
When we look at how these matching techniques can be applied to CCA projects the same characteristics apply as mentioned in the preceding section because they are primarily used on an individual level While institutional or even spatial (regional city-wise) matching can also be found in evaluation practice the meth-odological foundations and practical experiences concerning the validity of the findings provided by such matching approaches are still rather limited Therefore it is not recommended to pursue such an approach lsquoaboversquo the individual level Regarding the variables that are used for matching in the context of CCA projects it may be possible to work with characteristics such as proximity to hazardous areas degree to which individuals are affected by climate change effects or affiliation to specific ethnic social or religious groups etc
The challenges presented by matching approaches include two issues in particular The necessity of a rela-tively larger sample in order to find sufficient matching partners and the question of which characteristics to choose for the matching While the first issue constitutes a technical problem that can be solved by allocat-ing sufficient resources the second is a theoretical one which requires comprehensive sectoral and regional expertise The analysis of matched data can lead to significantly different findings compared with unmatched data depending on which characteristics are considered relevant Therefore it is of the utmost importance to substantiate the selection of the matching variables based on sound theory The most important questions to be answered in that regard are
` Could the characteristic influence the effectivenessoutcome of the intervention for the individual ` Does the basic population comprise sufficient individuals with different characteristics ` Will it be possible to identify sufficient individuals in the target group with identical characteristics
We should also point out that matching may not prevent potential bias as described in 311 However it may be possible to perform matching using aspects such as lsquodegree to which individuals are affected by other inter-ventionsrsquo in order to at least reduce the risk of contagion effects
27
For further reading on the methodological aspects potentials and limitations of PSM as well as its practical implementation the following books articles and papers are recommended
General methodological literature about PSM
Becker S Ichino A (2002) Estimation of average treatment effects based on propensity scores The Stata Journal 2(4)358 ndash 377
Luellen JK Shadish WR amp Clark MH (2005) Propensity scores An introduction and experimental test Evaluation Review 29(6)530 ndash 558
Morgan SL amp Winship C (2007) Counterfactu-als and causal inference methods and prin-ciples for social research Cambridge NY Cambridge University Press
Guo S amp Fraser MW (2010) Propensity score analysis Statistical methods and applications Thousand Oaks Sage
Steiner PM Cook TD Shadish WR amp Clark MH (2010) The importance of covariate selection in controlling for selection bias in observational studies Psychological Methods 15(3)250 ndash 267
Practical guidelines and case-studies
Caliendo M amp Kopeinig S (2008) Some practical guidance for the implementation of propen-sity score matching Journal of Economic Sur-veys 22(1)31 ndash 72
Cook TD amp Steiner PM (2010) Case match-ing and the reduction of selection bias in quasi-experiments The relative importance of pretest measures of outcome of unreliable measurement and of mode of data analysis Psychological Methods 15(1)56 ndash 68
Diaz JJ amp Handa S (2006) An assessment of propensity score matching as a nonexperi-mental impact estimator Evidence from Mex-icorsquos PROGRESA program Journal of Human Resources 41(2)319 ndash 345
Gaus H Muumlller C E (2012) Evaluating free-choice climate education interventions apply-ing Propensity Score Matching Evaluation Review 35(6)673 ndash 722
313 Pipeline approach
Often projects are not implemented on a broad scale right from the beginning targeting the entire poten-tially relevant target group but sequentially This may be because of logistical or budgetary reasons In these cases a so-called pipeline approach can be of particular use The idea behind the approach is that the section of the target group that receives a treat-ment (ie benefits from or takes part in a project) at a later stage can be used to approximate the counter-factual situation of those who did receive the treat-ment at the time of data collection In other words the part of the target group that is not yet affected
serves as a quasi-comparison group for the already affected part of the group In principle the approach can be applied repeatedly during an intervention depending on the number of phases in which the treatment (ie measures activities etc) is provided
In a pipeline approach the part of the treatment group that has not yet received any treatment is used for comparison
Figure 2 illustrates the basic concept of the approach using a three-phase intervention design
3 Rigorous evaluation designs and exam
ples of applicability in climate change adaptation projects
Impa
ct E
valu
atio
n G
uide
book
for C
limat
e Ch
ange
Ada
ptat
ion
Proj
ects
28
Figure 2 Illustration of the pipeline approach
( )t0 t1 t2 t3Timeline
Project phase IIIGroup C
Project phase IIGroup B
Project phase IGroup A
Ex-antebaseline data collection Final data collection Ex-postfollow-up data collection
( )
( )
As the figure shows in a three-phase project a total of four data collections (t0 ndash t3) are necessary of which at least during two (t1 amp t2) data sets have to be collected from two groups (group A amp B t1 respectively group B amp C t2) The treatment effects would then be estimated as in an ordinary single-difference design whereby group B would represent the comparison group to group A and group C to group B Provided the total project duration suffices ex-postfollow-up data from groups A amp B could also be collected at t3 which would probably allow further conclusions to be drawn about the sustain-
ability of the achieved results Further data collec-tions are conceivable such as from group C at t0 and t1 in order to estimate spill-over effects from groups A and B or to control for external influences on outcome variables (eg contagion effects from other projects) In any case the approach is quite flex-ible as it can be modified according to the informa-tion needs It can even compensate for a lsquoforgottenrsquo baseline study to some extent provided the group characteristics are comparable and remain relatively stable over time ie when the influence of external factors is negligible
CCA-specific requirements and challenges
With regard to evaluating CCA projects the pipeline approach is applicable for interventions that are planned to be implemented in phases for instance in different areas andor institutions (eg development and implementation of environmental information systems for local authorities in different provinces) and that aim to generate impact at individual or institutional level Provided that this is the case as outlined above it is still possible to start collecting data after the project has started ie it is not necessary to have baseline data for the first project phase This may be a considerable benefit for all projects that follow a replication or scaling-up design with a preceding pilot phase in which the (technical logistical etc) feasi-bility of the measures is tested before they are rolled out in other areas
The pipeline approach might also be of particular value for CCA projects which are confronted with the problem of shifting baselines (cf 22) The pipeline approach makes it possible to trace developments by comparing the baselines for each group (provided the group characteristics are in principle comparable) It may also be an option for projects that aim at generating long-term impacts that might not be observable directly at the end of their implementation
When applying a pipeline design however it should be borne in mind that each data collection phase is just as labour-intensive and time-consuming as a quasi-experimental design given that data needs to be collected for both the treatment and a comparison (ie future treatment) group except for the first and last round The same quality criteria therefore apply
The references to literature on experimental and quasi-experimental designs at the end of Section
311 are also suitable for further reading on the pipe-line approach
29
314 Regression discontinuity design
The approach discussed in this section is of par-ticular use when project participantsbeneficiaries are consciously selected on the basis of one specific characteristic that distinguishes them from non-participantsbeneficiaries (eg income) though they are similar in a number of other respects (eg loca-tion income sources education) If the participationeligibility of an individual depends on the value of a particular indicator that is relevant to the outcome of an intervention the treatment effect can be esti-mated by the so-called regression discontinuity design (RDD) The basic idea behind the approach is to estimate the treatment effect by comparing the
pre- and post-treatment indicator values (scores) of only those individuals from the treatment and com-parison group that are most similar with regard to their pre-treatment outcome score ie that lie within a comparison range close to the threshold level Fig-ure 3 shows the sample selection for assessing the treatment effect
The regression discontinuity design can be applied if project participantsbeneficiaries are selected based on a special characteristic that distinguishes them from non-participantsben-eficiaries
Figure 3 Selection of individuals for comparison
Individuals
Pre-intervention outcome score
Threshold levelComparison range
Untreated individuals
Compared untreated individuals
Compared treated individuals
Treated individuals
It is mandatory to adhere to the threshold level throughout the selection process as otherwise the regression analysis would lead to less valid findings Furthermore it must be assured that the individu-als cannot influence the pre-intervention outcome score (eg by temporarily lowering their income in order to receive support) as this would also bias the findings
Once the sample has been identified the pre- and post-treatment outcome scores are used to cal-culate regression functions for each group If the
intervention had an effect on the treatment group the functions should show different values at the threshold level This difference can be interpreted as the local average treatment effect for individuals that are most similar ie whose outcome values lie very close to the threshold line The discontinuity of the regression functions of the treatment and com-parison group can also be visualised by a Cartesian coordinate system in which the X-axis represents the pre-treatment and the Y-axis the post-treatment outcome score Figure 4 shows how such a disconti-nuity may look
Figure 4 Outcome scores before and after intervention
Pre intervention outcome score
Post intervention
outcomescore
Threshold level
Comparison range
Non treated individuals
Compared non treated individuals
Compared treated individuals
Treated individuals
3 Rigorous evaluation designs and exam
ples of applicability in climate change adaptation projects
Impa
ct E
valu
atio
n G
uide
book
for C
limat
e Ch
ange
Ada
ptat
ion
Proj
ects
30
As the treatment effect estimated with the RDD is based on a comparison of most similar individuals it can be considered to be widely unbiased How-ever a disadvantage of the approach is that the effect may not be generalisable for the entire population because individuals become less comparable the further they are from the threshold level Another disadvantage is the fact that in comparison to other designs RDD only uses a small fraction of the entire population to estimate the treatment effect
Due to its relatively ambitious requirements and methodological reservations RDD has only played a minor role in impact evaluation studies so far Never-
theless it may be applicable particularly for policy-field evaluations with large and clearly defined treatment groups provided the above-mentioned methodological requirements can be met In some publications (KhanderKoolwalSamad 2010) the use of a regression discontinuity approach is also recommended in scenarios where a threshold level is spatially defined (ie a geographical national or administrative border) However such an applica-tion needs to be carefully reviewed as populations in different regions present unobserved covariates (eg cultural or religious background) that may limit their comparability
CCA-specific requirements and challenges
RDD can be of particular use for evaluating CCA projects that focus on creating an impact at individual level and are implemented under framework conditions that involve a high degree of uncertainty provided the projects comply with the methodological requirements outlined above The benefit lies in the compara-tively simple data collection setup and clear interpretability of the evaluation findings which are quite robust against bias at least for those individuals who are very similar
On the other hand it has to be added that the findings are only of limited external validity Furthermore as only very similar individuals are compared (at least with regard to the outcome variable that is of interest) the sample selection can be less efficient because only a smaller number of individuals (ie those who are very similar) can be used for comparison Another challenge which is not restricted to CCA projects though is that it requires the project to adhere to a defined threshold level not to lsquoshiftrsquo it or make exceptions which in practice often proves to be a problem It is also only suitable for interventions where the impact becomes vis-ible in a manageable time frame which is not often the case for CCA projects
Finally it should be added that besides the outlined basic RDD there are several further more sophisti-cated variations of the approach These include ran-dom assignment at the threshold level or with more than one threshold level (eg if the treatment group is split further in sub-groups that receive different kinds of support depending on their pre-treatment outcome score) which cannot be discussed here
Therefore the following books articles and papers are recommended for further reading about methodological and practical require-ments as well as further applications of the approach
Imbens GW amp Lemieux T Regression discontinuity designs A guide to practice Journal of Econometrics 142(2) 2007 pp 615 ndash 635
Khandker SR Koolwal GB Samad HA Handbook on Impact Evaluation Quantita-tive Methods and Practices The World Bank Washington DC 2010
315 Time-series designs
While most evaluations focus on a limited time frame defined by the duration of an intervention sometimes it may be necessary to cover a longer period eg when the effectiveness of a series of past support activities or the development of (politi-cal economic etc) framework conditions are to be reviewed In those cases time-series designs can be of particular use We should add that there is no sin-gle time-series design this is rather an umbrella term for a number of different approaches What they have in common is that they are based on repeat-edly collected data over a longer period Time-series designs can be distinguished by whether they make use of only descriptive or also inferential statistics if data from the same analytical units (eg individuals households organisations cities countries) is used or not and if the data is quantitatively or qualitatively analysed
Time-series designs are based on frequently repeated data collections and are of use for measuring long-term impacts and the develop-ment of framework conditions
31
While it is simple to analyse the development of individual indicators descriptively by means of a trend analysis the identification of causal relation-ships calls for more sophisticated approaches Such approaches are often based on regression analyses that make it possible to estimate the influence of sev-eral independent variables (eg resources contextual factors) on dependent variables (eg attitudes behav-iour well-being) We shall go on to discuss an exem-plary design that has been successfully applied in a number of impact evaluation studies the so-called panel analysis
A panel analysis is based on repeated data collec-tions from identical analytical units The data needs to be comparable with regard to their informa-tion content ie the data collection instruments of each survey have to contain identical question and answer categories Furthermore the data sets must
be assignable to each respondent throughout the observation period Panel analyses usually require datasets with a large number of analytical units in order to be able to draw conclusions from the panel sample that apply to a larger basic population (cf 331) If these requirements are met panel analyses make it possible to trace developments not only on average but also on an individual basis and thus to identify variations caused by individual differences (ie unobserved heterogeneity) In addition given a sufficient observation period panel analysis makes it easier to identify the chronological sequence of changes and thus develop hypotheses about causali-ties The treatment effect can be estimated on the basis of various models The two most common of these the so-called fixed-effects model (FEM) and the random-effects model (REM) are briefly out-lined in Annex 54
CCA-specific requirements and challenges
Time-series designs appear to be most suitable for CCA projects as they are in principle applicable at each impact level and are of particular benefit when it comes to measuring long-term impacts As they make it possible to control time-variant confounding factors they are likewise useful for dealing with uncertain framework conditions as well as with shifting baselines given a sufficiently large sample size andor number of repeated data collections Due to their flexibility they can be applied in projects that focus on the adapta-tion of particular target groups to changing (climate environmental) framework conditions on the improve-ment of institutional capacities to deal with climate change-rooted environmental social or economic prob-lems or on national regional or global developments such as adaptation strategies in response to particular climate challenges Thus time-series designs are in fact more common in policy studies than in project evalu-ations
The challenges associated with time-series designs lie not so much in their practical implementation or the required financial resources as in the expert knowledge needed to do the lsquomathsrsquo They also call for a strong sectoral background in order to develop the right cause-and-effect hypotheses and draw the right conclu-sions from the analysis findings Very few evaluation experts have the know-how to adequately draft and implement such a design The high theoretical and methodological demands are reflected in a multitude of disputes among experts concerning the credibility of research which is of course not helpful for clearly com-municating evaluation findings
For further reading on panel data analysis the following literature is recommended
Berrington A Smith WF Sturgis P An Overview of Methods for the Analysis of Panel Data NCRM Methods Review Papers NCRM007 ESRC National Centre for Research Methods Southampton 2006
Hsiao C Analysis of Panel Data Cambridge University Press Cambridge 2014
316 Structural equation modelling
While the approaches discussed in the sections before are suitable for project types that differenti-ate between a treatment and a comparison group we will now go on to present an approach that may be applied for evaluating large-scale policy-based programmes that aim to affect an entire (national regional or global) population or sector (eg envi-ronmental or education sector labour market) With the so-called structural equation modelling (SEM) approach it is therefore not possible to attribute an observed effect to a specific intervention but to esti-mate the statistical relationship between several fac-tors over time one of which may be an intervention
3 Rigorous evaluation designs and exam
ples of applicability in climate change adaptation projects
Impa
ct E
valu
atio
n G
uide
book
for C
limat
e Ch
ange
Ada
ptat
ion
Proj
ects
32
Structural equation models make it possible to estimate statistical relations between con-structs which are defined by empirical measur-able indicators
Basically SEM is a multivariate statistical approach for testing hypotheses (deductive approach) about causal relationships between two or more latent constructs Its special feature is that it makes it pos-sible to test multiple statistical relationships (which are assumed to be causal) at the same time and can thus be used in complex environments In this con-
text latent construct means that the causes and effects (eg health employability) cannot be meas-ured directly but only by a number of manifest (ie empirically measurable) indicators (for health eg blood counts weight for employability education level qualifications) In principle a structural equa-tion model consists of two model types measure-ment models and structural models Measurement models describe the relationship between a latent construct and its indicators structural models describe the connection between latent constructs The following figure illustrates the differentiation between the model types according to the graphical representation of the system model described above
Figure 5 Generic layout of a structural equation model
It is important to note that the indicators that opera-tionalise the constructs and the causal relationships between the constructs have to be specified and theoretically substantiated by the researcher That means that it needs to be defined in advance which is the independent (ie exogenous) and which is the dependent (ie endogenous) variable In other words
the direction of the dependency has to be defined by the researcher In the figure above constructs 1 and 2 are exogenous variables (ie causes) while construct 3 is an endogenous variable (ie effects) A practical example on how to implement a SEM is given in sec-tion 42
CCA-specific requirements and challenges
With regard to the application of SEM for evaluating CCA projects the requirements and challenges sum-marised in the previous section on time-series designs are widely transferable with the difference that SEM is mainly suitable for projects that aim to create an impact at institutional and system level (eg political strategies) The practical requirements relating to SEM are not so difficult though it does take comprehensive theoretical know-how to develop the model As mentioned above the validity of the models relies on the expert knowledge of the people who create them Thus the findings of SEM analysis are as right or wrong as the model they are based upon Here the particular danger lies in omitting a system-relevant construct (ie influential factor) or indicators that define such a construct which would cause substantially biased findings What aggravates the problem is that in contrast to the designs discussed above unfortunately no quality criteria are available for assessing the validity of an SEM model Nevertheless given sufficient expert knowl-edge SEM can be of great benefit for providing the lsquobigger picturersquo and thereby revealing the manifold causal linkages between social political economic and environmental developments in the long run
33
For further reading on the methodological aspects potentials and limitations of SEM as well as its practical implementation we recommend the following books articles and papers
Cassel C Hackl P Anders HW (2010) Robust-ness of partial least-squares method for estimat-ing latent variable quality structures Journal of Applied Statistics 26(4)435 ndash 446
Chin W Newsted PR (1999) Structural Equation Modeling Analysis with small Samples Using Partial Least Squares In Hoyle R (ed) Statistical Strategies for Small Sample Research Thousand Oaks Sage
Diamantopoulos A Riefler P Roth KP (2008) Advancing formative measurement models Jour-nal of Business Research 61(2008)1203 ndash 1218
Garthwite PH (1994) An Interpretation of Partial Least Squares Journal of the American Statistical Association 89(425)122 ndash 127
Haenlein M Kaplan AM (2004) A Beginnerrsquos Guide to Partial Least Squares Analysis Understanding Statistics 3(4)283 ndash 297
Temme D Kreis H Hildebrandt L (2006) PLS Path Modeling ndash A Software Review SFB 649 Discussion Paper 2006-084 Berlin Humbold-University
Tenenhaus M Vinzi VE Chatelin Y-M Lauro C (2004) PLS path modeling Computational Statistics amp Data Analysis 48(2005)159 ndash 205
317 Summary
The prior descriptions show that a number of evalu-ation designs of sufficient methodological rigour are available that can provide reliable empirical evidence about the impact of CCA projects This sec-tion gives advice on which design(s) to choose based on the respective project characteristics Here it is again important to note that the applicability of a design primarily depends on the aggregation level at which an impact is generated (cf Section 1) Accord-ingly since many CCA projects operate on more than one level a combination of two or more evalu-ation designs might be necessary in order to assess the total impact balance of a project This complies with the need to combine qualitative and quantita-tive methods and triangulate data methods and researcher perspectives
At the individual level the decision which design to choose depends firstly on the existence of baseline data As explained in the previous sections three designs namely experimental quasi-experimental and regression discontinuity designs require such data This necessarily means that these designs can only be applied if they were drafted during the planning of the project If this is the case the next question is whether or not the beneficiaries were selected at random If this condition is also fulfilled in principle an experimental design can be applied provided sufficient resources are available to do so As described in 311 RCTs are quite costly due to the laborious data collection process which usually calls for the assignment of a large team to collect data It should also be said though that an RCT provides the highest internal validity and allows for clear impact attribution
If the project design does not allow for a random assignment of the treatment group a regression discontinuity design may also be feasible How-ever such a design requires the treatment group to be selected based on a specific outcome variable of interest (eg proximity to a disaster-prone area) If this is not the case a quasi-experimental design may be a feasible alternative The time and budget requirements of these two designs are compara-ble with those of an experimental design with the constraint that RDD might require a larger sample in order to identify sufficient cases that are close enough to the lsquothreshold levelrsquo to be compared With regard to the validity of the findings and their informative value we should add that while RDD-based evaluation findings are restricted to groups that are quite similar findings obtained using a quasi-experimental design can almost approxi-mate those of an RCT if the samples are adequately matched (eg with propensity score matching)
In case no baseline data has been collected before-hand two further rigorous evaluation designs may be used the pipeline approach and the panel design Both designs have further requirements the pipeline approach requires that the project be implemented sequentially (eg in different regions with differ-ent target groups) and the panel design that a larger sample size be available to enable reliable estima-tion of the impact It should also be considered that while a pipeline approach enables the attribution of impacts to an intervention a Panel Design lsquoonlyrsquo allows the contribution of an intervention to an observed change
If none of the above prerequisites can be satisfied most likely only a so-called ex-post facto design
3 Rigorous evaluation designs and exam
ples of applicability in climate change adaptation projects
Impa
ct E
valu
atio
n G
uide
book
for C
limat
e Ch
ange
Ada
ptat
ion
Proj
ects
34
with or without (single) comparison with a non-intervention group or with reconstructed baseline data may be possible However such a design is not regarded as lsquorigorousrsquo as it cannot provide for an attribution or contribution analysis
Based on these selection criteria the following deci-sion tree can be used to identify the lsquorightrsquo evaluation design for interventions that aim to generate impact at individual level
Figure 6 Decision tree for selecting an evaluation design for measuring impacts at individual level
Baseline data available
Random assignment of treatment group
Sequential implementation of project
yes no
yes
RCTQuasi-
experimental design
yes no
Pipeline approach
Regression discontinuity
design
Treatment group assignment according to specic criterion
Ex-post facto design (no RIE)
yes no
Panel design
yes
Large sample size possible
no (matter)
no
If an intervention aims to generate an impact at institutional level four rigorous evaluation designs are suitable Three of them have been previously introduced pipeline approach panel design and structural equation modelling (SEM) A potentially suitable design not discussed before is a time-series cross-sectional approach (TSCS) As already dis-cussed the pipeline approach requires a sequential implementation of the project in order to be appli-cable leaving three for those that are not As also discussed a panel design can only be applied if the sample (here of institutions eg governmental or non-governmental organisations enterprises) is large enough for statistical calculations (approx 30) If the intervention only focuses on a few institu-tions but at least about 10 repeated observations are possible then a TSCS might be the design of choice (see annex 54) Finally if none of these conditions can be fulfilled SEM is the only lsquorigorousrsquo option to
provide meaningful evidence about the impact of an intervention operating at the institutional level although it should be added that SEM like panel and TSCS designs can only provide for the estimation of its contribution On the positive side we should note that the latter three designs can be implemented with considerably less resources provided that sta-tistical data of sufficient quality are available for quantitative analysis
With regard to interventions geared to the system level (eg SWAPs government advice) the same selection of designs is basically available except the pipeline approach (due to the lacking comparabil-ity of sectors or countries for instance) Therefore in the following figure a joint decision tree for both intervention levels summarises the available choices of RIE approaches for institutional and system-level interventions
Phot
o copy
GIZ
Ran
ak M
artin
35
Figure 7 Decision tree for selecting an evaluation design for measuring impacts at institutional and system level
Sequential implementation of project
yes
Time-series cross-sectional approach
(see annex 54)
Structural equation modeling
yes no (matter)
Pipeline approach
Large number of repeated data collections possible
Panel design
yes
Large sample size possible
no (matter)
no
Decision tree for measuring system-level outcomes
Finally in table 3 on the next page all suggested RIE designs are listed with brief summaries of the impact level they are suitable for the project characteris-tics that must be in place the data time and budget requirements the validity of the analysis findings and their informative value (ie if they enable attri-bution or contribution analysis)
32 Providing reliable large-scale data
As outlined above empirical data is the founda-tion of any evaluation ndash and more or less of applied social sciences in general whether they are collected during the research process (ie lsquoprimary datarsquo) or reanalysed on the basis of statistical or documentary data (ie lsquosecondary datarsquo) Moreover impact evalu-ations mostly require data collections on a large scale in order to provide empirical evidence about the changes that have occurred in an interventionrsquos sphere of activity Such data is usually collected by means of a survey Surveys are used when mostly quantitative data from a considerable number of people eg all or a significant share of the projectrsquos beneficiaries non-beneficiaries or more generally residents of a certain area or particular social strata needs to be analysed During the data analysis sta-tistical parameters such as average means shares or distribution measures (eg standard deviation quan-tiles) of a given population (ie descriptive statistics) are calculated Provided that the data is collected from a random sample of sufficient size (see further elaborations below) probabilities regarding the val-ues and distribution of certain parameters in a larger
population can also be estimated (ie inferential sta-tistics) In the following the methodological aspects to be considered when collecting quantitative data by means of a survey are discussed with particular focus on an appropriate sampling strategy
Surveys often deal with knowledge opinions atti-tudes beliefs behaviours plans backgrounds devel-opments or assessments of the respondents The primary survey tool for data collection is the ques-tionnaire With a questionnaire (in contrast to an interview guideline) all respondents are asked the same questions in the same order The information gathered by a survey is often used to identify varia-tions of these parameters between different points in time (ie in order to identify developments) or dif-ferences between groups (eg in order to attribute the outcomes to a certain intervention or to reveal sys-tematic differences due to group characteristics such as gender age etc) or both With a survey infor-mation is collected in a systematic structured and mostly standardised way Structuring the subject of a survey means that not all potentially available infor-mation is relevant but only data that help to describe andor assess a certain measure development or framework characteristic Standardisation means that the respondents can choose from a number of answer options and that these options are grouped according to a predefined categorical system This means that the data is statistically calculable and consequently survey findings are comparable Such a categorical system can be dichotomous nominal ordinal or metric Table 4 contains an example of each single-choice question
3 Rigorous evaluation designs and exam
ples of applicability in climate change adaptation projects
Impa
ct E
valu
atio
n G
uide
book
for C
limat
e Ch
ange
Ada
ptat
ion
Proj
ects
36
Table 3 Required project characteristics and data
Evaluation design
Impact level Required project characteristics
Data requirements Time and budget requirements
Validity of findings Explanatory power
Experimental (RCT)quasi-experimental
Micro (individual) level
z Distinguishable treatment group
z RCT requires random assignment to treatment and comparison group
z Ex-ante (baseline) and ex-post data from treatment and controlcomparison group
z Depending on the size and accessibility of the target group
z Data collection process often quite costly as a large team of enumerators is needed
z RCT has highest internal validity
z Internal validity of quasi-experimental design depends on selection bias
z External validitytransferability depends on comparability of framework conditions
z Enables impact attribution at target group level given a sufficient sample size
Propensity score matching
Micro level z Discriminable treatment group
z Individual characteristics relevant for the treatment effect (covariates) must be observable
z Ex-ante and ex-post data from treatment and comparison group
z Data collection must include covariates
z Increases the costs of quasi-experimental designs as usually larger samples are necessary in order to identify sufficient matches
z Comparison group sample must be considerably larger
z Internal validity depends on completeness of covariates
z External validitytransferability depends on comparability of framework conditions
z Same as above
z Application in quasi-experimental designs can contribute to improved quality of findings
Pipeline approach
Micro and meso (institutional level)
z Project needs to be implemented in phases
z Treatment groups of each phase must be comparable
z Ex-ante and ex-post data from each group
z In principle comparable to quasi-experimental designs whereby costs increase with every round of data collection
z Internal validity of quasi-experimental design depends on comparability of groups
z External validity depends on comparability of framework conditions
z Same as above
z Allows for identifying time-variant effects if applied according to quasi-experimental design
Regression Discontinuity Design
Micro level z Treatment group must be selected according to a specified criterion
z Sufficient number of comparable cases
z Larger sample size than for experimentalquasi-experimental
z Comparable with quasi-experimental design mostly depending on sample size
z Internal validity restricted to comparable cases
z Enables impact measurement for individuals who have similar characteristics
Time series All levels z Panel focusing on individuals households organisations
z TSCS focusing on sectors countries regions
z Panel large sample size few repeated data collections
z TSCS sample size irrelevant large number of repeated data collections
z Depending on data availability individual data collections can be implemented quite cost-efficient
z Costs increase with length of panel and sample size
z Panel validity depends on compliance of sample size with statistical requirements (cf 331)
z TSCS validity is restricted to sample
z Provides reliable assessments of the contribution of an intervention to an observed change
z Makes it possible to control time-variant influences
Structural Equation Modelling
Meso and macro (system) level
z Focusing on entire sectors countries regions
z Statistical andor empirical data for each model- relevant construct
z Depending on data availability can be implemented cost-efficiently if combined with statistical data
z Validity depends on model fit (ie to what extent the endogenous construct is explained by the model)
z Enables contribution assessment and time-variant and invariant influences
37
Table 4 Example of question types
Question type Question Answer options
Dichotomous question What is your gender male female
hellip with nominal scaled answer options Where do you come from area 1 area 2 area 3 other area ________________
hellip with ordinal scaled answer options How do you assess the development of your livelihood situation in the last year
Deteriorated considerably Deteriorated slightly Did not change at all Improved slightly Improved significantly
hellip with a metric scaled answer option What is your monthly income _____ euromonth
It has to be added that for ordinal-scaled answer options that reflect a rating (eg satisfaction quality) it is important to lsquobalancersquo the answer options mean-ing that an equal number of positive as negative answer options must be provided in order to avoid biased findings
Besides single-choice questions there are also multi-ple-choice questions for example
What are your income sources (multiple answers possible)
Farming Livestock Fishery Temporary work Other hellip None
When analysing multiple-choice question data it has to be taken into account that it might be necessary (eg for calculating average means) to transform the data into separate lsquodummy variablesrsquo with dichoto-mous scales for each answer option (ie yesno for farming hellip for livestock etc)
When a survey is conducted its objectives and the information required to meet these objectives need to be considered first For this it makes sense to ask the following questions
Questions for identifying the survey objectives
` Which indicators need to be measured ` Who will use the information and how
Which decisions are depending on the survey findings
` Are there any particular expectations about the survey findings When are the findings of the survey considered positive or negative Or what would be a good or a bad finding
` Which information can the respondents pro-vide How does this match the information needs
` Which factors could have a negative impact on data collection Do the respondents have and remember the necessary information Might they be reluctant to answer Do they have the (verbal cognitive) capacities to answer correctly
Selecting a survey approach
After having defined the surveyrsquos objectives and information needs the survey approach can be specified giving consideration to the available and required resources The required financial human and time resources mainly depend on the size of the population that has been defined (as the target or comparison group) its spatial distribution and the logistical framework conditions in the area where the survey is implemented Furthermore the length and complexity of the questionnaire considerably influences your resource demands In order to get a better idea of how much time is needed it may be helpful to prepare a list of the individual tasks and estimated time needed for each task such as clarify-ing the survey objectives and sampling approach designing and testing the questionnaire collecting managing and analysing the data and reportingcommunicating the survey findings The following table shows what such a to-do list might look like
Phot
o copy
GIZ
Ala
n W
alsc
h
3 Rigorous evaluation designs and exam
ples of applicability in climate change adaptation projects
Impa
ct E
valu
atio
n G
uide
book
for C
limat
e Ch
ange
Ada
ptat
ion
Proj
ects
38
Table 5 Exemplary to-do list for preparing a survey
Task When Who Requirements
Clarification of survey objective First two weeks in January Project staff Results framework sample selection
Development of draft question-naire
By 31 January Evaluator in coordination with project staff
Clarification of information needs development of survey items
Pre-test of questionnaire 1 to 10 February Evaluator together with enu-merator team
Logistical preparation informa-tion of target groups accessibil-ity of target groups
Finalisation of questionnaire By 15 February Evaluator Consolidated feedback from the pre-test
Implementation of survey 16 to 31 February Enumerators coordinated by evaluator
Logistical support by partner staff etc
Data entry 1 to 5 April Enumerators coordinated by evaluator
Availability of technical infra-structure (notebooks software etc)
Data quality check 6 April Evaluator Full data set
Data analysis 7 to 15 April Evaluator Quality-assured data set
Integration of survey findings into evaluation report
16 to 30 April Evaluator Data analysis findings
Presentation of findings 1 May Evaluator and project staff Technical infrastructure for presentation (notebook projec-tor etc)
On the basis of such a timetable the costs of the sur-vey can be estimated These usually comprise logisti-cal costs (eg for traveltransportation accommoda-tion per diems) expenses for survey materials and the remuneration of the survey team
Surveys are usually carried out face-to-face or elec-tronically mediated (eg by telephone email or a web-based application) Both face-to-face and elec-tronically mediated surveys can be self-administered (ie the respondent fills out the questionnaire) or assisted (ie the surveyor fills out the questionnaire or at least supports the respondent in doing so) As all options have their advantages and disadvantages aspects such as the complexity and comprehensibil-ity of the survey topics the skills and accessibility of the potential respondents and the available time budget and human resources need to be considered Particular attention has to be paid to the aspect of the confidentiality of the information and the ano-nymity of the respondent when personal data (eg age income health status) are collected Ensuring anonymity is often an issue when it is necessary to be able to trace responses to individuals such as in panel surveys (cf 315) or when third parties (eg project staff beneficiaries) are tasked with data collection In those cases it might be necessary to separate the personal data from the survey data and link the data sets using a list of identification codes which can only be accessed by the people who are tasked with analysing the data
Selecting a sample
Due to time and budget constraints it is often not feasible to conduct a full population survey ie col-lect data from every potentially relevant respondent (eg beneficiary project participant) In such a case it is necessary to collect a sample ie to select respond-ents from the population However the findings of a sample population might be different to those from a survey of the entire population These disparate findings are induced by the so-called selection bias (see also 311) which can be reduced by various sam-pling techniques The common objective of these techniques is to approximate the sample characteris-tics to the characteristics of the full population rele-vant for the survey (eg the share of male and female respondents or the share of respondents from rural and urban areas) Doing so is necessary in order to draw conclusions from the survey findings with ref-erence to that population bearing in mind certain statistical quality criteria as further outlined below
In order to draw such conclusions the size and dis-tribution of the population for which the sample should provide representative findings needs to be identified For instance if the survey is to be used to identify the impact of a certain intervention (eg nationwide information campaign) on the behaviour of target groups (eg farmers adopting a new farm-ing method) in different provinces then it needs to be determined who constitutes the basic population (ie all farmers of the country) and how it is distrib-uted among the provinces (eg number of farmers in each province)
39
Once the basic population has been identified two sampling strategies are available probability (ie randomised) and non-probability (ie non-ran-domised) sampling Probability sampling means that each individual of a given population has the same known non-zero probability of being included in the sample ie it is randomly selected Non-probabil-ity sampling means that the chance of being selected for the survey differs among the population (eg due to accessibility or ability to participate) In the latter case findings based on the sample may not be gen-eralised without giving further thought to how to establish representativeness 23 otherwise (see below)
Only probability sampling (ie random sam-pling) makes it possible to calculate statistical parameters that inform use of the true value of a parameter in a basic population
Probability sampling
If probability sampling is applied it is possible to draw statistically valid conclusions from the survey findings for a population bearing in mind three sta-tistical parameters the aspired margin of error the level of confidence and the degree of variability These criteria are briefly explained below
The margin of error (also called lsquosampling errorrsquo or lsquolevel of precisionrsquo) indicates the maximum differ-ence of the value of a certain characteristic between the sample and the population ie the range in which the true value of the population is estimated This difference or range is usually defined in per-centage points (eg 1 5 10) For instance if a 5 margin of error is defined and your sample shows that 50 of the respondents adopted a new farming method the actual proportion of the basic popula-tion who did so is somewhere between 45 and 55 This is subject to a certain level of confidence see next paragraph
The level of confidence expresses the probability with which the actual sample value lies within the before- mentioned margin of error It is based on the assumption that if a sample is repeatedly (ran-domly) drawn from a given population the average value of an observed characteristic in this sample approximates to the true value of this characteristic in this population Furthermore the sample values are distributed lsquonormallyrsquo around this true value (ie
23 It has to be added that lsquorepresentativenessrsquo is not a defined statistical term but rather colloquially used to signify that a sample has been composed according to the prevalence of particular characteristics of the basic population
their frequency distribution follows a specific so-called lsquoGaussianrsquo function see the following figure) In practice confidence levels of between 90 and 999 are usually chosen A confidence level of 95 for instance means that in 95 out of a 100 samples the sample value would lie within the margin of error as specified before In other words there is a 5 chance that the sample value will deviate from the true population value by more than the defined mar-gin of error
Figure 8 Distribution of sample mean values in relation to the true population mean value
True value of a certain characteristic of the basic population
Range of mean values in eg 95 of all samples
Finally the degree of variability refers to the het-erogeneity of the population with regard to an observed characteristic ie how this characteristic is distributed in the given population The more het-erogeneous the population the larger the sample size necessary to reach a certain level of precision In this context 50 is the highest degree of variability because it indicates that half of the population has a certain characteristic (eg has adopted a new farm-ing technique) while the other half does not Annex 56 contains an introduction on how to calculate the appropriate sample size bearing in mind the above- mentioned statistical parameters
Non-probability sampling
As probability sampling requires all respondents to be within reach during data collection regardless of the required resources it may not always be feasible to apply such a strategy In that case non-probability sampling may be applied which requires the iden-tification of characteristics of the basic population that are relevant for analysis in order to establish representativeness For instance if the survey is intended to enable conclusions about the extent to which the impact depends on age gender ethnic affiliation etc information needs to be gathered about the composition of these characteristics in the population We should mentioned that while with non-probability sampling it may be possible to
3 Rigorous evaluation designs and exam
ples of applicability in climate change adaptation projects
Impa
ct E
valu
atio
n G
uide
book
for C
limat
e Ch
ange
Ada
ptat
ion
Proj
ects
40
develop plausible assumptions about a population the quality of these assumptions cannot be tested statistically and thus rely solely on the expertise of the researcher For non-probability sampling three common techniques may help to approximate the sample composition to the composition of the basic population systematisation stratification and clus-tering
Non-probability sampling does not make it possible to calculate statistical parameters
The representativeness of a sample relies on the knowledge about the basic population
Systematisation is an option when sufficient data about the basic population is available so that in principle each potential respondent can be identi-fied Ideally a comprehensive list is available that is used to draw the sample according to a particular selection scheme based on the individual data Such a scheme can for instance be oriented towards a tar-geted sample size (eg every 10th person) on logis-tical considerations (eg one household from each street village etc) or a certain threshold level (eg only families with more than three children or below a certain income) Which scheme is applied basically depends on the intervention logic (eg activities aim-ing at the poor) and the intended type of representa-tiveness (eg equal spatial representation)
A particular way to receive more specific findings is to stratify a sample Stratification means that a predefined number of individuals from each ana-lytically relevant sub-group of a population (eg age groups residence areas gender) is included in the sample Here too data about the composition of the basic population is necessary at least on a global level The intention is usually to match the sample composition with the composition of the popula-tion ie ensure that the proportions of each sub-group in the sample and in the population are equal in order to achieve representativeness (ie propor-tional sampling) However it may also be necessary to draw a disproportional sample eg due to logisti-
cal or budget constraints (eg 100 households per region) If that is the case then the cases for each sub-group need to be weighted reciprocally during data analysis So if for example a certain group represents 20 of a basic population but has only a share of 10 in the sample its cases need to be weighted by the factor two during the analysis
Clustering a sample may be helpful if it can be assumed that the sub-groups of a population show a sufficient degree of intra-group homogeneity ie that the individuals in each sub-group are similar with regard to a certain research question and inter-group heterogeneity ie that the individuals of dif-ferent sub-groups differ considerably in that regard If for example a project focuses on both several urban and rural areas and differences of its effec-tiveness in these areas are to be analysed it might be sufficient to conduct a full-population survey in one urban and rural area instead of taking samples in each area provided the residents in the respective areas show some commonalities that are relevant for the analysis (eg high incomes in urban areas low income in rural areas)
Finally we should note that other techniques exist for non-probability sampling in addition to those outlined above However other techniques such as convenience sampling (ie selecting individuals who are easiest to reach) or theoretical sampling (mainly used in explorative qualitative research) may not be applicable in rigorous evaluation designs as it is unlikely that they provide representative data Hence these techniques are not further discussed here
We recommend the following books articles and working papers for further reading on methodological requirements to collect quanti-tative data by means of surveys
Fink A (2003) How to Sample in Surveys The Survey Kit 2 Edition Thousand Oaks Sage Publications
Israel GD (2012) Determining Sample Size Gainesville University of Florida
Phot
o copy
GIZ
Har
ald
Fran
zen
41
In this last chapter the outlined methodological options and requirements are discussed by means of a practical case study The case study is based on a GIZ project entitled lsquoUrban Management of Inter-nal Migration due to Climate Changersquo that began in January 2015 and is being implemented on behalf of BMZ in two cities in Bangladesh The objective of the case study is to illustrate the possibilities for pro-viding empirical evidence about project impacts by applying an elaborated evaluation design that satis-fies scientific standards It will also be investigated which organisational and logistical precautions need to be taken to enable efficient data collection and analysis After a brief description of the project (41) two exemplary designs for measuring its impact are presented (42) followed by a draft of their practical implementation (43)
41 Background and project objectives
In Bangladesh climate change is considered to be one of the most important challenges Climate-related internal migration is jeopardising the over-all social stability of the country Climatic changes induce extreme weather events such as floods extreme precipitation and droughts In Bangladesh 40 out of 64 districts are affected by the impacts of climate change According to estimations six mil-lion people have already migrated due to weather and climate stresses of whom the majority lives in urban slums Especially in Khulna and Rajshahi the proportion of migrants is very high (70 of slum dwellers are migrants) For poor and vulnerable households migration is a crucial diversification and adaptation strategy However this can lead to acute vulnerability and have conflict-exacerbating effects if migrants who live in urban slums with inadequate infrastructure no access to basic services or income opportunities receive hardly public support from local government and administrative structures It is true that the decision to migrate is multi-causal that means that it is due to political social economic
demographic and environmental factors However in the two preselected cities experts believe that cli-mate and weather-related stress factors play a domi-nant role in migrantsrsquo decision to leave their homes In Rajshahi rising temperatures and drought declin-ing groundwater levels and river flooding threaten the population whereas in Khulna the population faces storms and storm surges extreme precipita-tion water logging and groundwater salinisation According to estimates the urban population (today 34) will exceed the rural population (today 66) by 2040 if economic opportunities do not reach the countryside
The core problem in the current situation is that so far there are no needs-oriented measures to improve the living conditions of climate migrants 24 in Khulna and Rajshahi City master plans do not address the influx of migrants This problem is caused by a lack of capacity of local governments and municipalities to deal with the challenges of climate-related inter-nal migration Public investment in the development and expansion of a basic infrastructure to mitigate the pressure on resources such as water energy food and housing is insufficient There is a lack of poli-cies and measures to manage settlement develop-ment Nor is there any data or information base on the movement of climate migrants to cities and their (urgent) needs This situation leads to an explosion of the population in these urban areas increasing pov-erty congested infrastructure and basic social ser-vices shortages of resources increasing distribution and opportunity conflicts and eventually reduced economic development opportunities for the entire population As urban development is a priority of the 6th Five-Year-Plan 2011ndash2015 (ie infrastruc-ture development promotion of economic activi-ties) national policies indicate that there is potential for change However there is a considerable gap between strategy and implementation
According to this situation the objective of the pro-ject is to improve the living conditions of climate migrants in preselected settlements in the divisional capitals Khulna and Rajshahi through needs-ori-ented measures 25
24 The International Organization for Migration (IOM) produced a definition of climate migrants as lsquopersons or groups of persons who for compelling reasons of sudden or progressive changes in the environment that adversely affect their lives or living con-ditions are obliged to leave their habitual homes or choose to do so either temporarily or permanently and who move either within their country or abroadrsquo
25 Since it is an integrative approach other inhabitants of the set-tlements will also benefit from improved basic urban services vocational training and temporary employment opportunities
4 Case study Urban Management of Internal Migration due to Climate Change
Impa
ct E
valu
atio
n G
uide
book
for C
limat
e Ch
ange
Ada
ptat
ion
Proj
ects
42
Four indicators were defined to achieve the project (module) objective
y In Khulna and Rajshahi X inhabitants of Y lsquohot-spotsrsquo with a high concentration of climate migrants have improved access to basic urban services (eg water energy or sewage systems through well drilling solar home systems or the construction of drainage ditches)
y In Khulna and Rajshahi X inhabitants of Y hot-spots with a high concentration of climate migrants have participated in labour-intensive measures for the expansion and building of a cli-mate-resilient basic infrastructure of whom Z are women
y In Khulna and Rajshahi in Y hotspots with a high concentration of climate migrants participants in needs-based general education and vocational training courses increased their income by X
y In each city the city corporations developed and tendered X project proposals for needs-based and labour-intensive measures for the expansion and building of climate-resilient basic urban ser-vices (eg health education water energy supply waste waterrefuse) as well as for the promotion of local economic development with the support of the Ministry of Social Welfare
In order to achieve this objective the project focuses on three intervention areas for which particular measures are currently being planned
1 Providing access to social services to the target groups by improving and extending existing services and adapting them to the needs of the migrants (eg finding social housing providing health and sanitation services) and raising the awareness of social workers for the needs of cli-mate migrants
2 Providing short-term income opportunities through labour-intensive work in and outside slum areas and providing access to basic infra-structure by its improvement together with city corporations and civil society
3 Providing long-term income opportunities by developing and implementing skills develop-ment measures in cooperation with training cen-tres and formal and informal SMEs in different sectors
Various Capacity Development measures will be implemented by long-term and short-term experts and financial support will be provided to upgrade slums and enhance resilience Particularly in the third intervention area cooperation is also planned with the local economy and training providers
It should be highlighted that the project is the first of its kind in German development cooperation to deal with the issue of climate-induced (internal)
migration The project therefore has an innovative and pilot character and aims to showcase a variety of measures to deal with climate-induced internal migration The integration of climate change adapta-tion into urban development planning and the con-tinuation of successful measures will be strengthend by other projects implemented by GIZ KfW and BGR
Selection of an impact evaluation design
In order to decide which evaluation design(s) could be suitable for measuring the impact of the project it makes sense to revisit the table at the end of Sec-tion 31 that summarises the characteristics and requirements of the discussed designs Looking first at the required project characteristics we should consider where the project aims to generate tangi-ble results that can be empirically verified Accord-ing to the project description the measures target climate migrants who constitute a distinguishable target treatment group as they are a sub-population of the entirety of residents in the intervention areas This treatment group however is not randomised but rather selected based on predefined criteria such as the settlements (lsquohotspotsrsquo) and their socio-eco-nomic status (lsquoclimate migrantsrsquo) Hence an experi-mental design does not come into consideration As the project description does not indicate a sequen-tial implementation of the measures a pipeline approach is also out of the question However if the project is scaled up at a later stage such an approach would still be feasible based on the data gathered by the design proposed below
Another feature of the treatment group is that it has individual characteristics that are likewise relevant for their selection and the treatment effect As these characteristics are in principle observable (eg eco-nomic situation migration background family sta-tus) both propensity score matching and a regression discontinuity design are in principle feasible With regard to the long-term measurement of treatment effects and their sustainability beyond the project implementation period a household panel appears to be suitable However according to the description of the framework conditions the migrant population fluctuates considerably Such a fluctuation will prob-ably result in a very high panel mortality ie par-ticipants dropping out from the sample that would undermine the significance and reliability of the findings Another feature of the project is that it does not focus solely on directly supporting individual climate migrants but also aims at improving social services and basic infrastructure which again should contribute indirectly to the improvement of the liv-ing conditions of these migrants and the population in the intervention areas at large Such a lsquosystemicrsquo approach calls for the use of structural equation
43
models which make it possible to measure the influ-ence of changed framework conditions on a popula-tionrsquos livelihood
Coming next to the data requirements the selec-tion of particular settlement areas makes it possible to create comparison groups ie migrants who are not supported by the project Furthermore as the evaluation is planned before the project activities start it should be possible to collect baseline data from both the treatment and comparison groups Since the project description does not provide any indication that measures in the selected settlements will be restricted to a certain sub-population of the potential target groups (ie there is no threshold level according to which the beneficiaries are selected) comparison groups need to be selected in spatially
remote areas This again makes it impossible to apply an RDD approach Nor would an RDD be recom-mended if such a restriction were made because the design of the measures facilitates spill-over effects which will likely bias the comparison findings With regard to the system-oriented measures the development of SEMs should be feasible provided that statistical or empirical data can be made avail-able for the required models throughout the project implementation (ie by the continuous results-based monitoring system) This is required to describe the relevant elements that constitute the framework conditions of the migrant population The following table summarises the applicability of the different evaluation designs based on the project characteris-tics
Table 6 Applicability of evaluation designs
Evaluation design Required project characteristics
Full-filled
Data requirements Full-filled
Experimental (RCT)
Distinguishable treatment group Ex-ante (baseline) and ex-post data available from treatment and control group
Random assignment to treatment and comparison group
ndash
Quasi- experimental with PSM
Distinguishable treatment group Observable individual characteristics relevant for the treatment effect
Pipeline approach
Sequenced project implementation ndash Ex-ante and ex-post data available each group na
Comparable treatment groups in each phase
na
RDD Selection of treatment group according to a specified criterion Sufficient number of comparable cases
(close to a threshold level)ndash
Time-series Panel focusing on individuals households organisations Panel large sample size few repeated data
collectionsndash
TSCS focusing on sectors countries regions
ndash TSCS sample size irrelevant large number of repeated data collections
na
SEM Focusing on entire sectors countries regions Statistical andor empirical data for each
model-relevant construct Unlikely to be achieved due to foreseeable panel mortality
Since PSMs and SEMs appear to be the most promis-ing approaches to measure the impact of the project we will go on to outline how the data collection pro-cess could be organised and what the related meth-odological and practical requirements are
42 Practical implementation
Starting with PSMs it first has to be clarified who constitutes the treatment and comparison group and how appropriate samples can be selected In the second step the hypotheses to be tested and the necessary indicators have to be developed Then we
need to consider which covariates have to be col-lected in order to enable the matching of cases (eg age gender place of origin duration of stay in target area education level ethnic affiliation marital sta-tus) Finally the data collection plan and instruments have to be developed
Based on the project description it is easy to iden-tify who should belong to the treatment climate and floating migrants in selected settlements as well as other poorest people in Khulna and Rajshahi Equally easy to identify is who should belong to the compari-son group climate migrants in settlements in these cities where no project activities are implemented If such settlements cannot be identified it would also
4 Case study U
rban Managem
ent of Internal Migration due to Clim
ate Change
Impa
ct E
valu
atio
n G
uide
book
for C
limat
e Ch
ange
Ada
ptat
ion
Proj
ects
44
be acceptable to choose climate migrants in other cities who face the same problem provided these cities are comparable in terms of the characteris-tics that were decisive for the selection of the pro-ject location As it can be assumed that the targeted population is rather large and the actual proportion presenting the characteristic of interest (improved living conditions) is not known beforehand the sample size should be calculated according to the first formula outlined in Section 56 (annex) The for-mula approximates a sample size of 400 for infinitely large populations with a level of confidence of 95 and an aspired margin of error of 5 26 Consider-ing the conceivable attrition loss during the data collection process a target gross sample size of 600 for the treatment group and at least 800 to 1000 for the comparison group (in order to receive sufficient matches) should be aimed at Depending how the dissimilarity of the socio-economic framework con-ditions in Khulna and Rajshahi is assessed it further has to be decided whether it is sufficient to split one sample across both cities ndash ie if they are generally comparable ndash or if the sample size needs to be dou-bled ndash ie if the framework conditions differ consid-erably with regard to the characteristics of interest
Next it has to be decided which hypotheses are to be tested and which data needs to be collected So far the project objective has been operationalised by four indicators of which three directly refer to the living conditions of climate migrants (1) access to lsquourban basic servicesrsquo (2) participation lsquoin labour-intensive measuresrsquo and (3) having an lsquoincreased incomersquo Leaving aside the question whether these indicators cover the entirety of factors that define the quality of lsquoliving conditionsrsquo ndash which however needs to be revisited during the development of the data collection instruments ndash it has to be clarified what information is needed to verify or disprove their achievement With regard to the first indicator such information would comprise for instance data on the types of existing services their general acces-sibility and finally the actual use of these services by the target group Of course such data would have to be collected for both the treatment and comparison group before and directly after the project imple-mentation and ideally again another three to five years later in order to assess the sustainability of the project measures
26 It should be noted that the proposed level of confidence and margin of error represent the lowest common accepted param-eters for inferential statistics It is up to the evaluation team to decide on stricter values which however will result in a need to collect considerably larger samples
Concerning the second indicator it may seem easy to provide empirical evidence about its achievement ie by comparing the factual number of participants with the targeted number It is however question-able whether the indicator actually makes it pos-sible to measure an impact since participation in a labour-intensive measure does not say anything about the living conditions of the migrants Since the outcome of their participation (eg the generated income and created infrastructure) can rather be considered to influence their living conditions it is recommended to revise this indicator
While the relevance of the third indicator for the impact to be measured is again clear it must be borne in mind that the findings are likely to be biased by contagion effects ie that income has been increased by sources other than the ones created by the project Therefore further qualitative data needs to be collected on the income sources and how and why they were obtained Furthermore it has to be remembered that providing information about onersquos own income may be a sensitive issue Hence data on proxy indicators such as private properties number of meals per day or school attendance of children (etc) has to be collected
In order to obtain a comprehensive picture about the net impact of the project it is further necessary to also gather information about its unintended positive and negative impacts Therefore it must be considered who else apart from the migrants might be affected by the project activities which secondary effects could be caused or how the project objectives interfere with partner strategies andor the activities of other donors For assessing the effectiveness of the particular project measures and helping to attribute the observed effects it is also necessary to collect data on the participation of the target group (eg in labour-intensive or training measures)
Finally to enable matching of the treatment and comparison group data covariates need to be col-lected that have to comply with the lsquostability cri-terionrsquo outlined in Section 53 This could be for instance the origin of the migrant his or her ethic and religious affiliation age gender and family sta-tus etc However we also have to bear in mind not to use variables such as profession socio-economic sta-tus type of migrant and so on as the project meas-ures (eg further training income generation) may influence these characteristics
The following table summarises the indicators data requirements data collection instruments and anal-ysis methods discussed above that would be part of the data collection plan for the migrant survey
45
Table 7 Draft (simplified) data collection plan
Indicator Required data Data collection instrument
Data analysis method
Improved access to basic urban services
Types of services provided Document analysis observation (for empirical verification)
Qualitative comparative analysis
General accessibility of service A B C hellip further operationalized eg by number and distribution of access points costs per service use capacities of service in terms of no of customers per day service can be provided to
Document analysis observation migrant survey
Qualitative and quantitative (double-difference) comparative analysis
Actual use of services by migrants disaggregated by eg types used frequency of use by type costs of use in relation to income
Migrant survey focus group discussion
Quantitative comparative analysis
Increased income Current income and income sources of migrants (operationalized by proxy indicators)
Migrant survey Quantitative comparative analysis
Further indicators for measuring the living conditions of the migrants
Further indicators for measuring the unintended effects of the projects
Further indicators about participation in project measures
Covariates eg origin ethnic and religious affiliation age gender family status
Migrant survey Used for calculating the propensity score
The draft shows that there are a number of blank spots that need to be looked into further regarding the operationalisation of impacts the project activi-ties and the covariates required for matching
Coming now to the structural equation model-ling (SEM) the first step is to identify the constructs that are relevant for the model Without further knowledge about the framework conditions and project measures such a model can only be roughly sketched However based on the project design its outputs in the three intervention areas (in terms of the capacities created for basic urban services train-ing as well as short-term and long-term income opportunities) can be considered as exogenous con-structs that aim to influence the living conditions of the migrants A further exogenous factor would be the general framework conditions as determined by
political strategies (eg government budget alloca-tion to infrastructure development) or economic societal and environmental developments (eg regional economic power number of small and medium enterprises migrant influx annual precipi-tation) Here we should consider whether it makes sense to further split up this construct due to its heterogeneity The living conditions of the migrants would represent the endogenous construct whereby the constitution of basic service infrastructure in the settlements could serve as another mediating construct This is on the one hand influenced by the framework conditions and the project activities and on the other hand has an influence on the living con-ditions of the migrants The following figure shows a (highly) simplified illustration of the SEM based on this outline with a few exemplary indicators for each construct
Phot
o copy
GIZ
Elm
ar F
oellm
i
4 Case study U
rban Managem
ent of Internal Migration due to Clim
ate Change
Impa
ct E
valu
atio
n G
uide
book
for C
limat
e Ch
ange
Ada
ptat
ion
Proj
ects
46
Figure 9 Simplified SEM for the GIZ project 33
Budget allocated to IF2
No of migrants in labour
No of basic services
No of customers served
School attendance of children
Self-assessed living conditions
Budget allocated to IF3
No of migrants trained
Budget allocated to IF1
No of migrants with access to
Budget for infrastructure
Migrant influx
No of SME
Total project budget
Partner contribution
Socio-econ FC
PO in IF2 (labour)
Project resources
PO in IF1 (access)
PO in IF3 (training)
Consti-tution of
infrastruc-ture
Living con-ditions of migrants
The figure shows that some of the measurement models are formative (project resources socio-economic framework conditions) while others are reflective (constitution of infrastructure achieve-ment of project outputs in the fields of intervention and living conditions of the migrants) Of course further constructs measurement models and struc-tural elements and relationships are conceivable There is however a need to define which elements the model requires in order to adequately reflect the lsquorealrsquo project situation and to enable measurement of the changes in its fields of intervention The appli-cation of the SEM requires the regular collection of the respective data ndash at least on an annual basis ndash to be able to calculate the parameters for assessing the project contributions Accordingly the indica-tors have to be included in the project monitoring system which should be developed in the course of the baseline study The latter is the first step of the impact evaluation
According to the outlined design the practical implementation of the impact evaluation should start with an in- depth document analysis and the elaboration of a detailed work plan specifying the
27 The figure was drawn using SmartPLSreg a software for developing variance-based SEMs
individual steps of data collection and analysis and the respective responsibilities Ideally before starting with the baseline study an exploratory preliminary mission should be conducted in order to gain further information for complementing the data collection plan (ie on the availability of data sources further needs of the target groups and other active actors in the intervention area) Furthermore the avail-ability of secondary data and the accessibility of the migrants for data collection the logistical require-ments and general feasibility of the evaluation design should be investigated
Once the data collection plan is finalised the data collection instruments (ie interview guidelines guidelines for focus group discussions question-naires) can be developed and tested In so doing par-ticular focus has to be placed on the socio-cultural adequacy of the instruments (eg appropriate and easy-to-understand language clear commonly understood categories in closed questions) and ndash as the survey will most likely be administered ndash the required qualifications of the interviewers (eg use of questionnaire particularly following the filtering procedure coding of answers ability to explain ques-tions if not understood by interviewees social skills)
FC framework conditions PO project outputs IF intervention field
47
After successful testing and finalisation of the instru-ments and interviewer training a sampling proce-dure should be identified that allows for randomi-sation eg by random walks through the selected settlements or by randomly selected spots (if reliable maps are available) Data collection should then start ideally simultaneously with the treatment and com-parison group in order to minimise time-induced bias Provided that the data has been collected according to the previously defined methodologi-cal standards the analysis will provide a picture of the migrantsrsquo current living conditions This will be based not only on the assessment of a few represent-atives andor experts but on a sound statistical foun-dation that makes it possible to transfer the sample findings to the entire target population This baseline data will also serve as the comparison base at a later stage for calculating the project impact
At the end of the baseline study a framework for the continuous results-based monitoring system should be developed As the monitoring system will not only be used for continuous reporting on project progress but also for the SEM analysis after project comple-tion the indicators used must satisfy the informa-tion needs of the model and thus not only focus on the project outcomes and impacts but also include data about the framework conditions The data col-lection instruments have to be adapted to suit these requirements Furthermore the timing of the con-tinuous data collection and the responsibilities have to be coordinated Given the three-year project term it may make sense to agree on a six-monthly or even quarterly collection in order to gather sufficient data (about eight to 10 cycles) for robust model calcula-tion If the measures need to be adapted during pro-ject implementation the indicators and maybe even the model need to be revised likewise
At the end of the project a second migrant survey has to be implemented according to the same meth-odological standards as for the baseline study In
combination with the baseline data the findings of that survey will be used for impact measurement and attribution as described in Section 311 Provided that the evaluation team has managed to gather the required data in line with the discussed require-ments the findings should enable valid and reliable attribution of the observed changes in the living conditions of the migrants to the project measures Due to the broad analytical perspective of the evalu-ation it should also be possible to document possible unintended effects as well as the influence of exter-nal (confounding) factors
However the project measures are not solely designed to improve living conditions in the short term Long-term effects and sustainability of the project impacts (eg climate resilience of built infra-structure) are also of interest In order to assess such long-term impacts another evaluation needs to be conducted It is recommended to conduct such an ex-post evaluation about three to five years after the project has been completed
As such an ex-post evaluation poses particular prac-tical challenges particularly regarding the retrieval of the former beneficiaries access to public authori-ties or logistical support on site (in case the imple-menting agencies are not active there anymore) it is of utmost importance to announce such an investi-gation during the project implementation phase in order to get sufficient support at a later stage There-fore all partners and further stakeholders should be made aware of its importance and supported in establishing adequate structures for future data col-lections Ideally a Memorandum of Understanding (MoU) could be agreed upon in which the responsi-bilities are clarified In return the partners could be supported in developing their own monitoring sys-tem which again might contribute to their owner-ship and understanding of the usefulness of collect-ing such data
Phot
o copy
GIZ
Ran
ak M
artin
4 Case study U
rban Managem
ent of Internal Migration due to Clim
ate Change
Impa
ct E
valu
atio
n G
uide
book
for C
limat
e Ch
ange
Ada
ptat
ion
Proj
ects
48
We will go on to present the individual tasks accord-ing to the proposed practical implementation of the impact evaluation in chronological order including
a rough estimation of the required time resources for each step
Figure 10 Draft schedule for impact monitoring and evaluation framework
` Document analysis selection of evaluation design development of a work plan (about 5 ndash 8 working days (WDs) depending on the amount of available documents)
` Exploratory preliminary mission gathering qualitative data for accomplishing the data collection plan checking the availabilityaccessibility of data sources and the feasibility of data collection (about 3 WDsrsquo preparation 3 days of travel 10 ndash 12 WDs on site 5 WDs for writing an inception report)
Preparatory tasks
` Adaptation of data collection instruments development of a resource plan and assignment of responsibilities (roughly 3 WDs)
` Implementation of monitoring system regular data collection according to data collection plan revision of data collection instruments as required (eg changing of project measures) (roughly 1-2 WDs per month depending on the monitoring data to be collected)
` Regular data analysis and reporting (about 3 ndash 4 WDs per report cycle)
` Finalisation of the data collection plan development and pre-testing of the data collection instruments (about 8 ndash 10 WDs depending on the selection of instruments and accessibility of target groups)
` Collection of baseline data data analysis and reporting (about 20 ndash 30 WDs for data collection depending on the number of available enumerators and logistical support on site about 10 WDs for data analysis 10 ndash 15 WDs for reporting incl results presentation and finalisation of ex-ante evaluation report)
` Preparation of a framework for continuous results-based monitoring system specification of indicators and data collection plan (about 5 WDs in collaboration with project team)
Baseline study
(ex-ante evaluation)
2015
` Adaptation of data collection plan and instruments review of monitoring data further document analysis (official statistics project documents etc) (about 5 ndash 8 WDs)
` Collection of final evaluation data data analysis and reporting (about 20 ndash 30 WDs for data col-lection depending on the number of available enumerators and logistical support on site about 15 WDs for data analysis 10 ndash 15 WDs for reporting incl results presentation and finalisation of ex-ante evaluation report)
Final evaluation
2018
` Adaptation of data collection plan and instruments further document analysis (approx 5 ndash 8 WDs) ` Collection of ex-post evaluation data data analysis and reporting (approx 20 ndash 30 WDs for data collection depending on the number of available enumerators and logistical support on site about 15 WDs for data analysis 10 ndash 15 WDs for reporting incl results presentation and finalisa-tion of ex-ante evaluation report)
Ex-post evaluation
20212223
Continuous results- based
monitoring2015 ndash 2018
Winding up we should point out that the above design and suggestions for its practical implementa-tion can only serve as a rough sketch which of course needs to be further elaborated during the inception phase of the research For the sake of convenience gender-related aspects or further aspects related to the living conditions of the migrants such as access to health services or education have not been dis-cussed Also the factually available resources for the evaluation and the logistical and practical feasibil-
ity of the data collection cannot be assessed without further information about the project concept and the framework conditions All the more important then to start the evaluation with an in-depth scop-ing phase to ensure appropriate data collection and analysis throughout the evaluation Valid and reli-able evaluation findings can only be produced with high-quality data In other words If the data is poor no design will save the day
49
Ndeg Project name Inst Country Design Data collection instruments Methodology
1 Noakhali Rural Development Project
Danida Bangla-desh
Ex-post facto
Quantitative analysis of project monitoring and contextual data Qualitative analysis documentary study archival work questionnaire surveys stakeholder and informant interviews rep-resentative surveys of project components assessment of buildings roads and irriga-tion canals village surveys and interviews observation focus group discussion case studies
Mixed-method approach
2 Climate Finance Readiness Pro-gramme
BMZ
GIZ
KfW
Global
3 National Ad-aptation Plan Global Support Programme
UNDP UNEP GEF
Global
4 Africa Adaptation Programme
UNDP WFP UNIDO UNICEF
Africa-wide
5 Strategic Ini-tiative to Address Climate Change in LDCs
UNDP Global
6 Climate Support Programme (CSP)
GIZ
BMU DEA
South Africa
NA ndash still ongoing
7 Public Invest-ment and Climate Change Adapta-tion (IPACC)
BMUB
GIZ APCI Ministries regional govern-ments of Cusco amp Piura
Peru (Cusco and Piura)
NA ndash still ongoing
8 Climate Change Adaptation in Rural Areas of India (CCA RAI)
GIZ BMZ
ministries Govern-ment of India govern-ments of federal states
India (Madhya Pradesh Rajasthan Tamil Nadu and West Bengal)
9 Sustainable agri-cultural develop-ment (PROAGRO I and II)
BMZ GIZ
SIDA ministries VIPFE
Bolivia (Chaco Northern Potosi Southern Cocha-bamba Valles)
Mid-Term Evalua-tion
Mainly qualitative evaluation design analysis of primary and secondary data semi-structured interviews and surveys with national counterparts strategic partners and target groups direct observation focus group discussions
Mainly qualitative evalua-tion design
5 Annex51 Overview of current CCA related-project evaluations
Impa
ct E
valu
atio
n G
uide
book
for C
limat
e Ch
ange
Ada
ptat
ion
Proj
ects
50
Ndeg Project name Inst Country Design Data collection instruments Methodology
10 Transboundary water manage-ment with the Mekong River Commission
BMZ GIZ
BMUB
Mekong River Commis-sion
Cambo-dia Laos Thailand Vietnam
NA ndash still ongoing
11
Rural Finance and Community Initiatives Project
IFAD The Gambia
Quasi-experi-mental
Field-level questionnaires focus group discussions interviews with key informants and case studies of the various community-based organisations and their members
For impact assessment the mission relied on a quanti-tative survey and participa-tory rural appraisal (PRA) exercise
12 Ghana Water Programme
CIDA Ghana Before-after
Document review key-informant inter-views internal benchmarking data from project reviews used for before vs after limited resources did not enable ex-post surveys
13 Chronic vulner-ability to food insecurity
WFP Kenya Experi-mental
Literature reviewsecondary data analysis Key Informant Discussions Participatory Vulnerability Profiles Field visits Focus Group Discussions
Study triangulates data from qualitative and quantitative sources It uses qualita-tive data from focus group discussions with community members and key-inform-ant interviews with com-munity opinion leaders and quantitative data involving about 3000 randomly sam-pled households
14 Food and Cash for Assets (FCFA) on Livelihood Resilience in Bangladesh
WFP Bangla-desh
Before-after approach
Document review On the quantitative front a household survey was conducted that covered 1500 households of participants non-participants and the comparison group Qualitative data were collected through focus group discus-sions asset assessments key-informant interviews semi-structured interviews
Mixed-method approach was adopted Participatory rural appraisal (PRA)
15 Impact of Food for Assets on Livelihood Resilience in Guatemala
WFP Guate-mala
Quasi-Experi-mental
Document review secondary data analysis and institutional Analysis community pro-file asset assessment institutional analysis household survey focus group discussion semi-structured interviews
Mixed-method approach Quantitative survey at the household level qualitative assessment of impacts at household and community levels assessment of tech-nical and biophysical assets in each community social and institutional analysis of networks and linkages at different levels especially communities
16 Impact of Food for Assets on Livelihood Resilience in Senegal
WFP Senegal Quasi-experi-mental
Document review household survey obser-vation village profiles gender-disaggregat-ed focus group discussions semi-structured interviews with major stakeholders asset assessments
Mixed-method Approach data triangulation
17 Effects of Climate Variability and Change on Household Food Sufficiency among Small-Scale Farmers of Yatta District
Journal article
Kenya Experi-mental
Desk research use of questionnaires inter-views focus group discussions observa-tions participatory vulnerability profiles development of indigenous knowledge systems
Mixed-method approach
Crop production data using Krejcie amp Morgan formula commonly used to calculate a sample size (random sampling procedure) coefficients of variation were computed for annual precipitation and then cor-related to crop production using Pearson correlation coefficient
51
Ndeg Project name Inst Country Design Data collection instruments Methodology
18 Analysis of vulnerability and resilience to climate change-induced shocks in North Shewa
Journal article
Ethiopia Experi-mental
Secondary data analysis surveys structured questionnaire interviews focus group discussion vulnerability analysis expert judgment
Mixed-method approach principal component analy-sis correlation with past disaster events ordered probit regression model use of fuzzy logic random sampling procedure
19 Vulnerabil-ity of Farming Households to Environmental Degradation in Developing Countries Evi-dence from North Central Nigeria
Journal article
Nigeria Experi-mental
Survey was used to generate household level data
Principal component analysis was used to develop vulnerability index for individual household so as to classify households depending on their level of vulnerability to environmen-tal degradation impacts use of multi-stage random sampling technique cluster analysis ordered logit regression model
20 An Index to Determine Vul-nerability of Communities in a Coastal Zone A Case Study of Baler Aurora
Journal article
Philip-pines
Experi-mental
Secondary data analysis survey (face-to-face and random) questionnaire observa-tions mappingGIS resource mapping activity workshops
Indicator method index computations following a balanced weighted aver-age approach Pearsonrsquos correlation coefficient of determination
21 Assessing House-hold Vulner-ability to Climate Change The Case Of Farmers In The Nile Basin
IFPRI Ethiopia Experi-mental
Expert knowledge use of household-level socio-economic survey interviews
Mixed-method approach Indicator and econometric method Principal compo-nent analysis correlation with past disaster events
22 Cambodia Community-Based Adaptation Programme
UNDP Cambodia Experi-mental
Secondary data analysis primary data key-informant interviews un-structured in-dividual interviews site visits observations semi-structured discussions structured Focus Group Discussions
Mixed-method data triangulation inductive and deductive approaches using quantitative and qualitative data
23 Strengthen-ing Adaptation Capacities and Reducing the Vulnerability to Climate Change in Burkina Faso
UNDP Burkina Faso
Document review individual interviews group discussions field visits observation
24 National Pro-gramme for Man-aging Climate Change in Malawi and the Malawi Africa Adaptation Programme
UNDP Malawi Desk review of project semi-structured interviews field visits workshops
Mixed-method approach data triangulation
25 Adaptation to Climate Change in the Nile Delta through Integrat-ed Coastal Zone Management
UNDP Egypt Document review and analysis (desktop study) interviews and meetings (face-to-face and by telephoneSkype and email questionnaires data collection in the field (interviews direct observations)
26 The Hill Maize Research Project
USAID Nepal Experi-mental
Secondary data published and unpublished documents and reports quantitative and qualitative tools Primary data structured and pre-tested questionnaire (household level) semi-structured checklist with a number of open-ended questions (community level) focus group discussion key-informant interviews using similar semi-structured checklist with open-ended questions data collected from key informants and focus group surveys were used for descrip-tive and qualitative analysis whereas those collected through household survey were used for quantitative analysis
Mixed-method approach randomised controlled trial propensity score matching (PSM)
5 A
nnex
Impa
ct E
valu
atio
n G
uide
book
for C
limat
e Ch
ange
Ada
ptat
ion
Proj
ects
52
Ndeg Project name Inst Country Design Data collection instruments Methodology
27 Small-Scale Irri-gation Manage-ment Project
JICA Indonesia Experi-mental
Household surveys direct interviews Focus Groups Discussions
Mixed-method approach propensity score match-ing regression disconti-nuity design estimation strategy T-test estimation of average treatment effect balancing test
28 Vulnerability to tropical storm impacts in coastal areas of the Red River Delta in Viet Nam and the adjacent region
Journal article
Vietnam Quantitative and qualitative surveys inter-views with key informants semi-structured interviews discussions mangrove utilisa-tion survey (quantitative model) focused interviews visualisation of storm track for various typhoon seasons
Mixed-method approach participatory rural appraisal
29 Sustainable Soil Management Program
Helvetas Swiss Inter-Co-operation amp SDC
Nepal Desk review of relevant documents field visits semi-structured interviews Focus group discussions observations separate focus group discussions for discussing is-sues related to labour migration apprecia-tive inquiry approach using open-ended questions storytelling about successes and challenges as well as visioning
30 Dry Zone Liveli-hood Support and Partnership Programme (DZLISPP)
IFAD Sri Lanka Quasi-experi-mental
Qualitative survey (key informant interviews with project staff and government officials focus group discussions with beneficiaries) and quantitative survey of 2560 households (both treatment and non-treatment group)
Mixed-method approach
31 Implement-ing sustainable water resources and wastewater management in Pacific island countries
UNDP Pa-cific island countries
Evaluation involved an orientation meeting in Nadi Fiji with Projectrsquos Regional Steering Committee two missions to visit six of the PICs and Skype and phone interviews with representatives of the remaining PICs and the implementing agencies construction of theory of change to evaluate the pathway of projectrsquos success
Mostly qualitative in nature
32 Supporting Integrated and Comprehensive Approaches to Climate Change Adaptation in Africa - Main-streaming CCA in the National Sectoral Policies of Tanzania
UNDP Tanzania Primary and secondary data were collected and analysed use of semi-structured indi-vidual and group interviews
No specific reference but seems to be highly qualita-tive
33 Climate Change Adaptation Action and Mainstreaming in Mozambique
UNDO Mozam-bique
Primary and secondary data were collected and analysed use of semi-structured indi-vidual and group interviews
No specific reference but seems to be highly qualita-tive
34 Integrating Disaster Risk Reduction and Climate Change Adaptation (DRRCCA) in Local Development Planning and Decision-making Processes
UNDP Philip-pines
Desk review key-informant interview (KII) using a questionnaire guide that focuses on particular agenciesinstitutions vis-agrave-vis outcomeoutput focus group discussion using a questionnaire guide and study or field visits where observation and interview methods are utilised for more insights
Mid-term review relies on qualitative information gen-erated through primary data gathering Opportunities for triangulation were sought However not all datainformation can be treated in this manner especially as certain key players have not been interviewed despite several attempts
35 Africa Adaptation Project Namibia Building the Foundation for a National Ap-proach to Climate Change Adapta-tion in Namibia
UNDP Namibia Interviews group interviews and document reviews Open-ended questionnaires were employed to facilitate interviews Literature and documents were reviewed to acquire relevant and appropriate information required to answer key evaluation questions and objectives Observations and case study approaches were used during field visits
Evaluation applied a mixed methodology of quantita-tive and qualitative research approaches
= No reference | NA = Not applicable
53
52 Calculation of net average treatment effect with double-difference approach
Figure 11 Calculation of the net treatment effect in an experimental or quasi-experimental design
Indicator lsquoIrsquo Intervention = Treatment
t0 t1 t2point in time
Difference of I between treatment and comparison group after treatment (t2)
Difference of I between treatment and comparison group before treatment (t0)
Average value of I for treatment group
Average value of I for comparison group
net average treatment effect
Estimated average counterfactual value of I for treatment group
The figure shows that the counterfactual value of the indicator for the treatment group is estimated on the basis of its (observed) value for the comparison group and the difference of its values between the groups before the treatment In other words it is assumed that without the treatment the treatment group would have developed in the same way as the com-parison group Accordingly the net average treat-ment effect ( ) can be calculated very easily by using the following formula
Whereby represents the value for the indicator of interest for the treatment (exponent = 1) and com-parison (exponent = 0) group at the points in time ( 0 = before and 2 = after treatment) when data is being collected ie before and after the treatment Sim-ply speaking the difference in the indicator mean value between the treatment and comparison group before the treatment is subtracted from its differ-ence between the treatment and comparison group after the treatment Therefore this approach is also called lsquodifference-in-differencersquo or lsquodouble-differ-encersquo approach
53 Propensity score matching (PSM)
The propensity score is an index that indicates the conditional probability of an individualrsquos being part of the treatment group This probability is calcu-lated based on a set of variables that are relevant for both selection for the treatment and the observed treatment effect The advantage of PSM is that in
contrast to other matching techniques it provides a one-dimensional score for the matching procedure and does not require any distribution assumptions regarding the basic population (cf 331) It does however require a set of assumptions to be fulfilled which limit its applicability to some extent These are
y Conditional independence assumption (CIA) The treatment effect (ie outcome differences between the treatment and the comparison group) has to be independent from the selection ie the effects may only be explained by the treat-ment confounding factors have to be excluded Example If an intervention aims at increasing the income of a group of people project benefi-ciaries need to be subject to the same external economic framework conditions that influence their income as non-beneficiaries The assump-tion would be violated for instance if a certain occupational group were selected (eg only farm-ers) and compared with a basic population that consists of various occupational groups
y Stable unit treatment value assumption (SUTVA) The treatment effect of an intervention on one person may not be influenced by the participa-tion of another person in the same intervention Example If an intervention aims at providing financial support to a group of people eg by micro-credits the potentially available amount for each beneficiary must be equal regardless of the amounts already spent In other words the project budget needs to be at least as big as the maximum budget needed if all beneficiaries were to request the maximum individual amount
5 A
nnex
Impa
ct E
valu
atio
n G
uide
book
for C
limat
e Ch
ange
Ada
ptat
ion
Proj
ects
54
y Stability of covariates against the treatment The covariates that are used to calculate the propen-sity score must not be influenced by the treat-ment Example If an intervention aims at increasing the income of a group of people then the income of the potential beneficiaries must not be used as a covariate (as it is an intended outcome of the project)
y Common support condition In order to be suit-able for matching both the treatment and com-parison group need to contain individuals with the same or at least a similar propensity score
y Balancing property Individuals who have the same propensity score need to be comparable regarding the particular characteristics that were chosen as covariates
If the project characteristics meet the above require-ments PSM can be applied according to the follow-ing sequence 28
Figure 12 PSM sequence
Estimating the
propensity score
Testing the common support
assumption
Selecting a matching algorithm
Testing the matching
quality and treatment
effects
Sensitivity analysis
Estimating the propensity score
The estimation of the propensity score is based on the selection of the covariates and the estimation procedure The estimation procedure again depends on the number of groups that need to be included in the analysis As in evaluations usually only two groups ndash the treatment and comparison group ndash are compared and only discrete choice models usu-ally logit or probit regressions 29 are used While the type of regression only plays a minor role as both provide very similar findings the variables that are used to calculate the propensity score are by far more important as they need to fulfil the conditional inde-pendence assumption (CIA) in order to provide valid findings Furthermore as the propensity score indi-
28 The following descriptions are based on a CEval working paper (no 19) written by Muumlller Christoph 2012
29 Regressions are used in statistics for identifying the relation-ships between one dependent and several independent varia-bles (eg income depending on education gender and age) Logit and probit regressions are usually used when a variable can only have two values (eg yes and no participant and non-participant)
cates the conditional probability that an individual will receive a treatment only those variables must be used that reflect this probability Therefore it is not correct to generally refer to lsquosocio-economic covari-atesrsquo as is still sometimes found in the literature (cf eg OECD 2014) While socio-economic variables may be appropriate for interventions that focus on the poor (ie the poorer a person the more likely he or she is to participate) they may not make any sense for an intervention that focuses on vulnerability (ie the more vulnerable a person is the more likely he or she is to participate) Accordingly in the latter case variables that reflect the vulnerability of a per-son (eg proximity to a disaster-prone area) need to be taken as covariates In any case the selection of covariates needs to be theoretically substantiated
Once the covariates are selected the propensity score is calculated by a simple (logit or probit) regression Here it is important to note that only metric (ie continuous eg income age) and dichotomous vari-ables (ie variables that can have two values eg yesno 10) can be included Nominal (ie variables that can only have discrete valuescategories without ranking eg religion marital status) and ordinal (ie variables with discrete ranked values eg educational level) variables need to be recoded in dichotomous variables for each category before the analysis
Testing the common support assumption
After the propensity score has been calculated for each case (ie person individual) of the treatment and control group the so-called area of common support (ACS) has to be identified The ACS com-prises the range in which the treatment and com-parison group show a similar density of propensity scores Only cases that lie within this area can be used for the subsequent matching procedure The ACS can either be defined by cutting off the range at the low-est and highest propensity scores available for both groups or by trimming ie setting a certain density threshold level beneath which cases are discarded In order to decide how to define the ACS it makes sense to visualise the distribution of the propensity scores as the following figure illustrates
55
Figure 13 Exemplary illustrations of propensity scores densities
0
02
04
06
08
1
01 02 03 04 05 06 07 08 09 10
02
04
06
08
1
01 02 03 04 05 06 07 08 09 1
Treatment group
Comparison group
Treatment group
Comparison group
As the illustration in the example on the left shows it would be appropriate to cut the ACS below 03 as there are no cases in the treatment group below this value and above 08 as there are no cases in the com-parison group above that value On the right both groups feature values in the entire range between 0 and 1 However the treatment group contains no cases with propensity scores between 07 and 08 which would make it impossible to create matches in that area Accordingly it would make sense to set a threshold level say at about 015 beneath which cases are excluded In that case the ACS would lie between 03 and 06 and between 09 and 1 Note If no ACS can be identified PSM cannot be applied
Selecting a matching algorithm
Once the ACS has been defined matching then starts with the selection of the matching algorithm As there are a number of matching algorithms that dif-fer depending on how cases from the comparison group are assigned to cases of the treatment group and the type of weighting several algorithms are usually applied in order to select the one that is most sensitive for identifying the treatment effect Three popular matching algorithms are briefly outlined below
A very popular and fairly simple matching algorithm is the so-called nearest neighbour matching (NNM) With NNM the case from the comparison group that features the most similar propensity score to each case or group of cases of the treatment group is assigned ie the one with the most similar prob-ability of being a member of the treatment group The approach prevents so-called bad matches ie that cases which are very different ndash in terms of their characteristics as represented by the covariates ndash to each other are compared Cases from the compari-son group can then usually be used repeatedly as a matching partner for cases from the treatment group It is also recommended to match several cases from the comparison group with each case from the treatment group in order to receive more robust findings (ie with less variance) Thus the com-parison group should be considerably larger than the treatment group (cf 331) It should be noted though that the decision to use cases more than once in order to minimise the variance has the trade-off of a potentially higher bias as inferior matches may also be used Figure 14 provides a simplified illustration of how the matches can be identified graphically
Figure 14 Graphical illustration of nearest neighbour matching
Treatment group cases
Comparison group cases
0 025 05 075 1
Propensity score
Treatment group cases
Comparison group cases
0 025 05
Propensity score075 1
1Weighting factor of cases
Treatment group cases
Comparison group cases
0 025 05
Propensity score075 1
Range (caliper)
5 A
nnex
Impa
ct E
valu
atio
n G
uide
book
for C
limat
e Ch
ange
Ada
ptat
ion
Proj
ects
56
As figure 14 shows in this example both treatment group and comparison group cases are used repeat-edly for matching and cases that are not the nearest neighbour to any of the cases of the respective other group are discarded
Another matching algorithm that is frequently used is so-called kernel matching The algorithm uses the weighted means of preferably all individuals of the
comparison group to estimate the counterfactual sit-uation of an individual from the treatment group To apply this matching algorithm it has to be decided in advance how to weight the individual cases dur-ing the matching ie define the probability density function (eg a Gaussian function) and how steep the function should be (ie the slew rate) Again here is a graphic to illustrate the matching process
Figure 15 Graphical illustration of kernel matching
Treatment group cases
Comparison group cases
0 025 05 075 1
Propensity score
Treatment group cases
Comparison group cases
0 025 05
Propensity score075 1
1Weighting factor of cases
Treatment group cases
Comparison group cases
0 025 05
Propensity score075 1
Range (caliper)
Figure 15 shows that comparison group cases are weighted according to the proximity of their propen-sity score to the score of the treatment group case they should be matched with
A matching algorithm that offers a kind of compro-mise is the so-called radius matching for which only those cases of the comparison group are used for the
matching that are within a certain predefined range (also called lsquocaliperrsquo) to the treatment group case The advantage of this algorithm is that the range can be adjusted according to the number of available cases in the comparison group so that it can provide more robust findings provided sufficient cases are avail-able
Figure 16 Graphical illustration of radius matching
Treatment group cases
Comparison group cases
0 025 05 075 1
Propensity score
Treatment group cases
Comparison group cases
0 025 05
Propensity score075 1
1Weighting factor of cases
Treatment group cases
Comparison group cases
0 025 05
Propensity score075 1
Range (caliper)
Figure 16 shows that cases that lie outside a prede-fined range are discarded Since there are no gen-eral rules about how to define this range we should note that a wider range leads on the one hand to a reduced variance of the findings (ie increased robustness) on the other it also introduces more bias as lsquonot so goodrsquo matches are also used Conversely a narrower range reduces the bias but increases the variance Thus there is always a trade-off between the robustness and bias of the findings
Testing the quality of matching and calculating the treatment effects
When the matching procedures have been com-pleted it needs to be verified once again whether the above-mentioned balancing property is fulfilled A common method for doing this is to check if the dif-ference in the covariates between the treatment and comparison group has been substantially reduced which can be (amongst others) done by calculating lsquoCohens drsquo an index for comparing differences in mean values before and after matching However further methods are available for verifying the bal-ancing property that cannot be discussed in detail
57
here but can be found in the recommended litera-ture at the end of this section
After all these steps have been taken finally the treatment effects can be assessed in different ways First of all of course the sign and the magnitude of the mean differences in the outcome variables after matching provide information about the direction and size of the relevant effect Furthermore one-sided T-tests can be performed for checking if the treatment effects are significant
Sensitivity analysis
The last step to provide for a distinct attribution of the observed effects to an intervention is to assess the robustness of the findings against unobserved confounding factors To do this a sensitivity analy-sis needs to be conducted eg based on the so-called Rosenbaum Bounds (RBs) that make it possible to estimate how strongly a confounding factor would need to bias the selection process in order to com-promise the robustness of the estimated treatment effect RBs represent the limits within which treat-ment effects are considered significant Estimation of the RBs is based on the assumption that with an increasing positive or negative selection treatment effects are respectively over- or underrated This also means that the probability of a positive treatment effect decreases with positive selection and increases with a negative selection There are further indexes such as the Hodges-Lehmann estimator (ie for esti-mating the minimum treatment effect to be consid-ered as significant) that can be used to further hedge the findings of the sensitivity analysis
Unfortunately since the calculation of these estima-tors requires a substantial statistical background they cannot be discussed here in detail However sta-tistical programs such as SPSSreg or STATAreg provide particular modules for these estimators which make it possible also for laypeople to perform the required calculations (provided they have understood the sense and benefit of such an analysis)
54 Fixed-effects random-effects models and time-series cross-section analysis
Fixed-effects models (FEM) are used to estimate the impact of a particular independent variable (eg treatment framework condition) that varies over time on individual outcomes (eg income health status) It is based on the assumption that these outcomes correlate with that independent vari-able Thus FEM can reveal the relationship between
predictor and outcome variables within an analyti-cal entity giving consideration to time-invariant individual characteristics that potentially affect the impact of these predictor variables (eg profession on income or gender on nutrition) These characteristics are considered to be time-invariant unique to the analytical entity and not to be correlated with other individual characteristics In that case the treatment effect on the outcome variable of interest can be esti-mated by regressing the individual outcomes as cal-culated with the following formula
Whereby stands for the dependent outcome variable of interest with representing its analytical entity and the point in time when the data is col-lected is the value of the independent variable for this entity at that time the coefficient for the inde-pendent variable the invariant individual char-acteristic that affects the outcome and the error term for other unobserved factors that vary over time With that model all time- invariant differences between the analytical entities are controlled so that it can be used to identify the causes of observed changes of an analytical entity over time
In contrast to FEM the random-effects model (REM) is based on the assumption that variations in the individual outcomes of the entities are random and uncorrelated with the predictor variables Accord-ingly the REM should be used if it is assumed that differences across entities influence the depend-ent outcome variable Thus the formula has to be amended by adding a second error term that expresses this difference
As the application of REM requires that the second error term does not correlate with the predictor vari-able individual characteristics that potentially have an influence on the predictor variables need to be specified Accordingly omitting relevant variables in the model may lead to biased findings
A number of tests are available for deciding which model to use in a panel analysis such as the so-called Hausman test which tests whether correlates with the regressors the Pasaran cross-sectional dependence test or serial correlation tests As the test procedures cannot be discussed in detail in this Guidebook further references are provided in the literature list at the end of this section Furthermore it has to be added that for both STATAreg and SPSSreg do-file respectively syntax templates are available that can perform such tests on suitable data sets
5 A
nnex
Impa
ct E
valu
atio
n G
uide
book
for C
limat
e Ch
ange
Ada
ptat
ion
Proj
ects
58
Another lsquopanel-likersquo approach for long-term impact assessment is the so-called time-series cross-section (TSCS) analysis Similar to the panel analysis the TSCS analysis is based on data being collected over time from the same analytical units However in contrast to the former approach conclusions made with TSCS analysis are limited to the sample ie are not transferable to another population without fur-ther ado Another difference is that while the panel analysis requires a large sample but also works with a few observations (at least three) TSCS Analysis works with a small number of analytical entities but requires more observations (at least about 10) in order to provide robust findings Due to these fea-tures TSCS analysis is mainly used for policy studies with macro data and analytical entities such as sec-tors countries or regions As one the one hand the statistical fundamentals of TSCS analysis are quite complex and on the other hand the approach is not (yet) very popular for project evaluations it will not be discussed here in detail
However the following literature reference list gives some recommendations for further reading on this subject too
Beck N (2006) Time-SeriesndashCross-Section Methods New York New York University
Beck N (2001) Time-SeriesndashCross-Section Data What Have We Learned in the Last Few Years San Diego University of Califor-nia
Beck N Katz JN (1995) What to do (and not to do) with Time-Series Cross-Section Data The American Political Science Review 89(3)634 ndash 647
Girosi F King G (2001) Time Series Cross-Sec-tional Analyses with Different Explanatory Variables in Each Cross-Section Cambridge Harvard University
Wooldridge JM (2010) Econometric Analysis of Cross Section and Panel Data Cambridge The MIT Press
55 Structural equation modelling
As outlined in Section 316 structural equation models consist of latent constructs and empirically measurable indicators With regard to the operation-alisation of the constructsvariables two types of measurement models can be distinguished models based on reflective indicators and those based on formative indicators While reflective indicators are defined by their construct (eg construct sportiness
rarr indicator time needed to run 100 metres) forma-tive indicators define the construct (eg indicator number of training modules per month rarr construct sportiness) Accordingly reflective indicators have to correlate with each other while formative ones do not necessarily have to do so (eg time needed to run 100 500 1000 metres vs number of running mod-ules number of swimming modules etc) Another difference between reflective and formative con-structs is that reflective indicators are replaceable (eg time taken to run 100 metres time taken to cycle 1 km) while an exchange of formative indicators would result in a modification of the construct (eg number of maths lessons instead of training mod-ules)
Before the causal relationship between the con-structs can be analysed the validity of the measure-ment models ie how well the indicators opera-tionalise a construct needs to be checked Due to the above-mentioned differences the analysis of reflective and formative indicators differs As reflec-tive measurement models correspond to an explora-tive factor analysis (main component analysis) their validity is assessed on the basis of the factor loadings (should be ge0707) their significance its reliability (composite reliability r should be gt07) and the aver-age explained variance of the construct (should be gt05) Furthermore a reflective measurement model is considered valid if the explained variance of a construct is higher than each squared correla-tion between this and any other construct (lsquoFornell-Larker-Criterionrsquo ie discriminatory validity) Forma-tive measurement models correspond to a multiple regression Accordingly their quality is assessed on the basis of the factor weights their significance and the co-linearity of the indicators (ie the so-called variance inflation factor should be lt10)
Concerning the number of indicators required to describe a construct it has to be considered that there is a trade-off between the reliability of the measurement and the danger of creating artefacts which biases the construct (eg overrepresentation of physical indicators when measuring the health sta-tus) Furthermore the sample size should be consid-erably larger than the number of indicators
While the measurement model specifies the rela-tionship between the latent constructs and their indicators the structural model describes the influ-ence of the constructs on each other These influ-ences are graphically marked by arrows which rep-resent assumed causal relationships The direction of the arrow indicates the direction of causality ie defines what is the cause and what is the effect In principle both the number of constructs and the number of (estimated) causal relations are unlimited This also means that a construct can be both affected
59
by one or more constructs and affect another one or more others
The relationship between two constructs is expressed by the so-called path coefficient which ranges from -1 (perfect negative relationship) to 1 (perfect positive relationship) A value of 0 may indi-cate that there is no statistical relationship between two constructs While a high value of is preferable in practice values higher than 04 (respectively lt-04) can be considered as very high It has to be added that SEM makes it possible to calculate not only direct effects but also indirect and total effects
The path coefficient can be calculated in two dif-ferent ways ie by means of co-variance analysis or variance analysis each having some advantages and disadvantages Although the theoretical founda-tions of the two methods cannot be discussed here in detail the main aspects that help decide which one to choose are summarised in the following table
Table 8 Decisive aspects for choosing co-variance or variance analysis 30
Co-variance analysis Variance analysis
Preferred method for analysing established theories and testing hypotheses
Preferred method in explorative studies ie if the causal relations between the constructs are not yet substantiated
Works best with large sample sizes (n gt100)
Also works with smaller sample size (n gt30)
Method of choice if statistical quality criteria1 are preferred for assessing the validity of the model
Method of choice if the model is validated nomologically
Available software eg AMOSreg LISRELreg
Available software eg SmartPLSreg
As the table shows variance analysis might be the preferred choice for evaluations since they are usu-ally explorative in nature and constructs that char-acterise the objectives of an intervention are more likely to be based on formative measurement mod-els The smaller required sample size also speaks for the use of variance analysis However the fact that no statistical indexes are available to assess the validity of variance analysis-based structural mod-els means that the researcher applying this method needs to have comprehensive knowledge about the system conditions and the causal linkages between its elements
Nevertheless variance analysis also provides indi-ces for assessing the contribution of an intervention
30 Adapted from Jahn 200716
to an observed effect such as the above-mentioned path coefficient (should be gt02) its significance and the effect strength (fsup2 weak gt002 average gt015 strong gt035) Furthermore the model fit (Rsup2 small gt02 average gt033 substantial gt067) indicates the informative value of the model (ie how far the inde-pendent constructs explain the variance of the indi-vidual constructs)
As also shown in the table meanwhile a number of user-friendly computer programs are available for calculating structural equation models at least on the basis of variance analysis While in principle even people with a limited methodological background can operate such software (at least it provides plausi-ble findings) it is not recommended to do so because incorrect theoretical assumptions or setting wrong parameters for calculating the quality criteria can lead to biased or even completely false findings
56 Calculating sample sizes for probability sampling
This section outlines three different ways to cal-culate the sample size depending on the available information about the basic population In the first example the size of the basic population is known but the true value of a certain dichotomous charac-teristic (ie can have two values eg whether or not a beneficiary applied an improved farming technique) is not In this case the required sample size can be calculated simply according to the formula
Whereby is the required sample size is the size of the basic population and is the desired margin of error So assuming the basic population amounts to 1000 persons and the desired margin of error is 005 then the minimum sample size would be
10001000 ∙ 005
1000
This means data from a minimum of 286 randomly selected respondents would be needed for the survey
5 A
nnex
Impa
ct E
valu
atio
n G
uide
book
for C
limat
e Ch
ange
Ada
ptat
ion
Proj
ects
60
An alternative way to calculate the minimum sam-ple size for large populations ndash even if the exact size of the basic population is not known ndash is illustrated next In this case it is advantageous to have a good estimate of the true value of an observed characteris-tic of interest (eg gender distribution)
Thereby is the area under the normal curve corre-sponding to the defined level of confidence and is the true share of the population that displays a cer-tain characteristic (eg is female)
For most common levels of confidence equals as follows
90 = 164595 = 196099 = 2575999 = 3290
eg for a population in which 48 are female and the desired margin of error is 005 the minimum sample size would be
196 ∙ 048 ∙005
0958900025
However if the actual share of the basic population that features a certain characteristic of interest (eg percentage of beneficiaries who have adopted a new farming technique or not) is not known it is always safe to assume a 50 share as then the term bull (1 - ) and accordingly the entire formula reaches its maximum
If the size of the basic population is known and if it is smaller than approximately 50000 one can still use the latter formula in a first step but reduce the sam-ple size in a second step by applying the following correction term
Whereby is the required sample size as calculated above Assuming that the basic population only com-prises 1000 persons then the minimum sample size would be
384
1000
3841383
So according to this correction term it is acceptable to reduce the sample size by 106 respondents which equals a reduction of more than a quarter
It must however be kept in mind that the sample sizes provided in these formulas corresponds to the actual number of necessary completed question-naires Accordingly when planning a survey the non-response rate has to be considered as well The rate indicates the share of those who do not par-ticipate in the survey despite being selected for the sample This needs to be compensated to assure that the sample remains large enough to achieve the desired level of confidence and margin of error So if for example a sample size of 500 is required and it is assumed that only 80 might answer the number of respondents needs to be increased to at least 625
Furthermore it has to be considered that if the sur-vey is part of an experimental or quasi-experimental design data need to be collected not only for the treatment group but also for a comparison group Therefore when applying PSM the comparison group sample needs to be considerably bigger than the treatment group sample ndash ideally about two to three times the size ndash in order to assure that suf-ficient cases are available for matching during data analysis (cf 312)
61
57 Literature
Bours D et al (2014) Guidance Note 1 Twelve Rea-sons why Climate Change Adaptation MampE Is Challenging httpwwwseachangecoporgsitesdefaultfilesdocuments2014200120SEA20Change20UKCIP20GN1201220Reasons20why20CCA20MandE20is20challengingpdf
Bours D et al (2014) Guidance Note 2 Selecting Indicators for Climate Change Adaptation Pro-gramming httpwwwseachangecoporgsitesdefaultfilesdocuments2014200120SEA20Change20UKCIP20GN220Selecting20indi-cators20for20CCA_0pdf
Bours D et al (2014) Guidance Note 3 Theory of Change Approach to Climate Change Adaptation Programming httpwwwseachangecoporgsitesdefaultfilesdocuments2014200220SEA20Change20UKCIP20GN320ToC20approach20to20CCA20programmingpdf
Bours D et al (2014) Monitoring and Evaluation for Climate Change Adaptation and Resilience A Syn-thesis of Tools Frameworks and Approaches Sec-ond Edition httpwwwseachangecoporgsitesdefaultfilesdocuments20142005201520SEA20Change20UKCIP20Synthesis20Report202nd20editionpdf
Bours D et al (2014) Design Monitoring and Evalu-ation in a Changing Climate Lessons Learned from Agriculture and Food Security Programme Evaluations in Asia httpwwwseachangecoporgsitesdefaultfilesdocuments2014200520SEA20Change20UKCIP20ER120Agriculture20and20food20security_0pdf
Bours D et al (2014) International and donor agency portfolio evaluations trends in monitor-ing and evaluation of climate change adapta-tion programs httpwwwseachangecoporgsitesdefaultfilesdocuments2014200620SEA20Change20UKCIP20ER220CCA20MandE20trends20from20porfolio20evalu-ations_0pdf
Conway D amp Mustelin J (2014) Strategies for improving adaptation practice in developing countries Nature Climate Change 4339-342
Cordero C (2014) Case Study Working with the Vulnerability Sourcebook in Chullcu Mayu Bolivia News GIZ httpwwwgizdeexpertisehtml15486html
Dinshaw A et al (2014) Monitoring and Evaluation of Climate Change Adaptation Methodological Approaches OECD Environment Working Paper No 74 OECD Publishing
Ford JD et al (2013) How to track Adaptation to Climate Change A typology of Approaches for National-Level Application Ecology and Society 18(3)40
Ford J D amp Berrang-Ford L (2015) The 4Cs of adap-tation tracking consistency comparability com-prehensiveness coherency Mitigation and Adap-tation Strategies for Global Change 1-21
Fischerova G (no date) Strategic Initiatives to Address Climate Change in LDCs (Boots on the Ground) Integrating Climate Change Risks into Development Planning and Programming UNDP Bratislava Regional Centre (PowerPoint Presenta-tion)
Foumlrch W et al (2014) Back to Baselines Measuring Change and Sharing Data Agriculture and Food Security 2014 313 httpwwwagricultureand-foodsecuritycomcontentpdf2048-7010-3-13pdf
Garcia JR amp Zazueta A (2015) Going Beyond Mixed Methods A Systems Perspective for Ask-ing the Right Questions Institute of Develop-ment Studies httponlinelibrarywileycomdoi1011111759-543612119epdf
German Federal Ministry for Economic Cooperation and Development (BMZ) (2013) Climate Finance Readiness Programme Early Action for Ambitious Goals httpwwwgizdeexpertisedownloadsgiz2013-en-climate-finance-readiness-flyerpdf
GIZ (2012) Disaster Risk Management and adapta-tion to climate change Experience from German Development Cooperation Deutsche Gesellschaft fuumlr Internationale Zusammenarbeit (GIZ) GmbH httpwwwipaccpedocen-disaster-risk-man-agement-climate-changepdf
GIZ (2013) GIZrsquos global GCF Readiness Programme Competence Centre for Climate Change Environ-ment and Climate Change Division httpwwwgizdeexpertisedownloadsgiz2013-en-climate-finance-gcfitpdf
5 A
nnex
Impa
ct E
valu
atio
n G
uide
book
for C
limat
e Ch
ange
Ada
ptat
ion
Proj
ects
62
GIZ (2013) GIZ in South Africa Programs and Pro-jects Deutsche Gesellschaft fuumlr Internationale Zusammenarbeit (GIZ) GmbH httpswwwgizdededownloadsgiz2013-en-giz-programs-pro-jects-south-africapdf
GIZ (2013) Guidelines on designing and using a results-based monitoring system (RBM system) httpswwwgiz2013-0110en-results-based-moni-toring-systempdf
GIZ (2014) Transboundary Water Management Sup-port to Cooperation on Shared Waters Deutsche Gesellschaft fuumlr Internationale Zusammenarbeit (GIZ) GmbH httpwwwgizdeexpertisedown-loadsgiz2014-en-mappe-transboundary-water-managementpdf
GIZ (2015a) The Sustainable Agricultural Programme (PROAGRO I amp II) httpproagro-boliviaorg (accessed on 22102015)
GIZ (2015b) Public Investment and Climate Change Adaptation (IPACC) project httpwwwgizdeenworldwide13314html (accessed on 22102015)
GIZ (2015c) Climate Support Programme (CSP) httpwwwgizdeenworldwide17807html (accessed on 22102015)
Hammill A et al (2013) Comparative Analysis of climate change vulnerability assessments Les-sons from Tunisia and Indonesia Competence Centre for Climate Change Deutsche Gesellschaft fuumlr Internationale Zusammenarbeit httpsgc21gizdeibtvarappwp342deP1443wp-contentuploadsfilebasevavulnerability-guides-man-uals-reportsComperative-analysis-of-climate-change-vulnerability-assessmentspdf
Hedger MM (2008) Desk Review Evaluation of Adaptation to Climate Change from a Develop-ment Perspective Institute of Development Stud-ies httpswwwclimate-evalorgsitesdefaultfileseventsalexandriaIDS_Report_on_Evaluat-ing_Adaptation_for_GE_publication_versionpdf
IIED (2015) Capacity Strengthening in Least Deve-loped Countries (LDCs) for Adaptation to Climate Change (CLACC) httpwwwiiedorgcapacity-strengthening-least-developed-countries-for-adaptation-climate-change-clacc (accessed on 22102015)
Karkoschka O et al (2013) Guidance for Integrat-ing Monitoring and Evaluation of Climate Change Adaptation into Strategies in Mongolia Deutsche Gesellschaft fuumlr Internationale Zusammenarbeit httpwwwseachangecoporgsitesdefaultfilesdocuments2013200720GIZ20-20Guid-ance20for20Integrating20M26E20of20CCA20into20Strategiespdf
Lamhauge N et al (2012) Monitoring and Evaluation for Adaptation Lessons from Development Coop-eration Agencies OECD Environment Working Paper No 38 OECD Publishing httpwwwoecd-ilibraryorg docserverdownload5kg20mj6c2bwpdfexpires=1425238023ampid=idampaccname=guestampchecksum=77BA5587F2D7AD9EF6C22B614A36C4D4
Leighton M et al (2011) Climate Change and Migra-tion Rethinking Policies for Adaptation and Disaster Risk Reduction No 152011 United National University - Institute for Environment and Human Security httpswwwehsunuedufileget8468
Leiter T (2015) Linking Monitoring and Evaluation of Adaptation to Climate Change across Scales Avenues and Practical Approaches In D Bours P Pringle amp C McGinn (Eds) Monitoring and Evalu-ation of Climate Change Adaptation A review of the landscape New Directions for Evaluation 147 117-127
OECD (2011) Handbook on the OECD-DAC Cli-mate Markers httpwwwoecdorgdacstats48785310pdf
OECD (2014) OECD DAC Statistics Aid to Climate Change Adaptation March 2014 Version 2 httpwwwoecdorgdacenvironment-developmentAdaptation-related20Aid20Flyer20-20March20201420v2pdf
Olivier J et al (2013) Adaptation made to measure A Guidebook to the Design and result-based moni-toring of climate change adaptation projects 2nd Edition Deutsche Gesellschaft fuumlr Internationale Zusammenarbeit (GIZ) GmbH httpsgc21gizdeibtvarappwp342deP1443wp-contentuploadsfilebasememe-guides-manuals-reportsGIZ-2013_Adaptation_made_to_measure_second_editionpdf
63
Prowse M et al (2010) Impact Evaluation and Intervention to address Climate Change A Scop-ing Study International Initiative for Impact Evaluation Working Paper 7 httpswwwclimate-evalorgsitesdefaultfilesevalua-tions53020Impact20Evaluation20and20Interventions20to20Address20Climate20Change20-20A20Scoping20Studypdf
Sanahuja H E (2011) A Framework for Monitoring and Evaluating Adaptation to Climate Change Community of Practice Global Environment Facility httpswwwclimate-evalorgsitesdefaultfilesstudiesClimate-Eval20Frame-work20for20Monitoring20and20Evalua-tion20of20Adaptation20to20Climate20Changepdf
Sara Orleans Reed et al (2014) Resilience projects as experiments implementing climate change resil-ience in Asian cities climate and development Published by Taylor amp Francis httpwwwtand-fonlinecomdoifull101080175655292014989190VPZRBvmG-NM
Scholze M (2013) Country Experiences with Main-streaming Adaptation ndash from Programme to National Level Webinar httpsgc21gizdeibtvarappwp342deP1443wp-contentuploadsfilebasems mainstreaming_webinareCoun-try_experiences_with_mainstreaming_adapta-tion_national_levelpdf
Schwartzendruber F (2014) Evaluation of NRM interventions linked to climate change A scoping study Draft version httpswwwclimate-evalorgsitesdefaultfilesstudiesNRM-Study-Draftpdf
Smit B amp Pilifosova O (2010) Adaptation to Climate Change in the Context of Sustainable Develop-ment and Equity httpswwwvieunuedufileget9995pdf
Smith JB Vogel J M and Cromwell J E (2009) An architecture for government action on adaptation to climate change An editorial comment Climatic Change 9553-61
UNDP (2009) Thematic Area Scaling up local and community-based actions UNDP Community Based Adaptation httpsunfcccintfilesadapta-tionapplicationpdfundp_ap_update_sep_09_cba_1_sppdf
UNDP (2011) Achievements in 2011 Strategic Initia-tive to Address Climate Change in Least Devel-oped Countries Boots on the Ground Report httpwwwundporgcontentdamundplibraryEnvironment20and20EnergyCli-mate20Change2011-Boots-on-the-Ground-Reportpdf
UNDP (2011) Brochure on Strategic Initiative to Address Climate Change in LDCs httpwwwundporgcontentdamundplibraryEnviron-ment20and20EnergyClimate20ChangeCapacity20DevelopmentFlyer20for20Boots20on20the20Ground_Final_rev20rcpdf
UNDP (2013) UNDP support to LDCs to Access Finance for Adaptation Basic Facts and Figures httpundp-almorgsitesdefaultfilesdown-loadsoverview_of_undp_ support_to_ldcs_to_access_finance_for_adaptation_-_nov_2013pdf
UNDP (2015a) Community-Based Wetland Manage-ment Project (BIRAM) httpwwwundp-almorgprojectsspa-cba-bangladesh-community-based-wetland-management-project-biram (accessed on 22102015)
UNDP (2015b) National Adaptation Plan Global Support Programme (NAP-GSP) httpwwwundp-almorgprojectsnaps-ldcs (accessed on 22102015)
UNDP (2015c) Pacific Integrated Water Resource Management (IWRM) project httpwwwtand-fonlinecomdoipdf10108019439341003786729 (accessed on 22102015)
Villanueva P S (2011) Learning to Adapt Monitor-ing and Evaluation Approaches in Climate Change Adaptation and Disaster Risk Reduction ndash Chal-lenges Gaps and Ways Forward httpr4ddfidgovukPDFOutputsClimateChangeSCR-Dis-cussionPaper9--Learning-to-ADAPTpdf
Wuumlrtenberger L (2013) GCFit GIZrsquos Global GCF Readiness Programme Deutsche Gesellschaft fuumlr Internationale Zusammenarbeit (GIZ) GmbH httpwwwcaribankorguploads201305GIZC2B4s-Global-GCF-Readiness-Programmpdf
5 A
nnex
Impa
ct E
valu
atio
n G
uide
book
for C
limat
e Ch
ange
Ada
ptat
ion
Proj
ects
64
Notes
65
Published by Deutsche Gesellschaft fuumlr Internationale Zusammenarbeit (GIZ) GmbH
Registered offices Bonn and Eschborn Germany
Global Project Effective Adaptation Finance (MampE Adapt)
BMZ Bonn Dahlmannstraszlige 4 53113 Bonn Germany Tel +49 (0) 228 99 535 - 0 Fax +49 (0) 228 99 535 - 3500
BMZ Berlin Stresemannstraszlige 94 10963 Berlin Germany Tel +49 (0) 30 18 535 - 0 Fax +49 (0) 30 18 535 - 2501
poststellebmzbundde wwwbmzde
Friedrich-Ebert-Allee 36 + 40 53113 Bonn Germany Tel +49 (0) 228 44 60 - 0 Fax +49 (0) 228 44 60 - 1766
Dag-Hammarskjoumlld-Weg 1-5 65760 Eschborn Germany Tel +49 (0) 6196 79 - 0 Fax +49 (0) 61 96 79 - 1115
climategizde wwwgizdeclimate
In cooperation with UNDP Center for Evaluation CEVAL
Autors Stefan Silvestrini Ines Bellino Susanne Vaumlth
Design and layout Ira Olaleye Eschborn Germany
Photo credits Title page copy Ranak Martin
As at September 2015
GIZ is responsible for the content of this publication
On behalf of Federal Ministry for Economic Cooperation and Development (BMZ) Special Unit lsquoClimatersquo
Addresses of the BMZ offices
- Impact Evaluation Guidebook for Climate Change Adaptation Projects
-
- Content
-
- List of figures
-
- Figure 1Flow chart for implementing an RIE
- Figure 2Illustration of the pipeline approach
- Figure 3Selection of individuals for comparison
- Figure 4Outcome scores before and after intervention
- Figure 5Generic layout of a structural equation model
- Figure 6Decision tree for selecting an evaluation design for measuring impacts at individual level
- Figure 7Decision tree for selecting an evaluation design for measuring impacts at institutional and system level
- Figure 8Distribution of sample mean values in relation to the true population mean value
- Figure 9Simplified SEM for the GIZ projectthinspthinsp33
- Figure 10Draft schedule for impact monitoring and evaluation framework
- Figure 11Calculation of the net treatment effect in an experimental or quasi-experimental design
- Figure 12PSM sequence
-
- List of tables
-
- Table 1Exemplary data collection plan
- Table 2Example table for matching on observables
- Table 3Required project characteristics and data
- Table 4Example of question types
- Table 5Exemplary to-do list for preparing a survey
- Table 6Applicability of evaluation designs
- Table 7Draft (simplified) data collection plan
- Table 8Decisive aspects for choosing co-variance or variance analysisthinsp
-
- List of abbreviations
- Glossary
-
- Executive Summary
- 1Introduction
-
- 11How to use the Guidebook
- 12How to plan and implement an RIE for CCA projects
-
- 2Evaluating climate change adaptation projects
-
- 21Types and key features of climate change adaptation projects
-
- 211Adaptation projects addressing the individual level
- 212Adaptation projects addressing the institutional level
- 213Adaptation projects addressing the systemic level
-
- 22Key challenges of climate change adaptation projects
- 23Review of current methods to evaluate the results of CCA projects
-
- 3Rigorous evaluation designs and examples of applicability in climate change adaptation projects
-
- 31Overview of evaluation designs ndash potentials and limitations for climate change adaptation projects
-
- 311Experimental and quasi-experimental designs
- 312Matching techniques
- 313Pipeline approach
- 314Regression discontinuity design
- 315Time-series designs
- 316Structural equation modelling
- 317Summary
-
- 32Providing reliable large-scale data
-
- 4Case study Urban Management of Internal Migration due to Climate Change
-
- 41Background and project objectives
- 42Practical implementation
-
- 5Annex
-
- 51Overview of current CCA related-project evaluations
- 52Calculation of net average treatment effect with double-difference approach
- 53Propensity score matching (PSM)
- 54Fixed-effects random-effects models and time-series cross-section analysis
- 55Structural equation modelling
- 56Calculating sample sizes for probability sampling
- 57Literature
-
- Publishing information
-