Imp Psc Design
107
ANALYSIS AND DESIGN OF PRESTRESSED POST- TENSIONED I TYPE GIRDER BRIDGE Dissertation Submitted in partial fulfillment of the requirement For the degree of Master of Technology (CIVIL) (Computer Aided Structural Analysis and Design) NIRMA UNIVERSITY OF SCIENCE AND TECHNOLOGY By DHAIVAT A. VASAVADA (03MCL18) Guide PROF. N. C. VYAS Civil Engineering Department Ahmedabad - 382 481 June 2005
-
Upload
touseef-ahemed-attar -
Category
Documents
-
view
31 -
download
1
Transcript of Imp Psc Design

ANALYSIS AND DESIGN OF PRESTRESSED POST-
TENSIONED I TYPE GIRDER BRIDGE
Dissertation
Submitted in partial fulfillment of the requirement
For the degree of
Master of Technology (CIVIL)
(Computer Aided Structural Analysis and Design)
NIRMA UNIVERSITY OF SCIENCE AND TECHNOLOGY
By
DHAIVAT A. VASAVADA
(03MCL18)
Guide
PROF. N. C. VYAS
Civil Engineering Department
Ahmedabad - 382 481
June 2005

i
CERTIFICATE
This is to certify that the Major Project entitled “Analysis and Design of Prestressed Post-
Tensioned I type girder Bridge” submitted by Mr. Dhaivat A. Vasavada (03MCL18),
towards the partial fulfillment of the requirements for the award of degree of Master of
Technology (CIVIL) in field of Computer Aided Structural Analysis and Design
(CASAD) of Nirma University of Science and Technology is the record of work carried out
by him under my supervision and guidance. The work submitted has in my opinion reached a
level required for being accepted for examination. The results embodied in this dissertation, to
the best of my knowledge have not been submitted to any other university or institution for
award of any degree or diploma.
Prof. N. C. Vyas
Guide, Professor, Civil Engineering Department, Institute of Technology, Nirma University Ahmedabad
Prof G. N. Patel
Head, Civil Engineering Department Institute of Technology Nirma University Ahmedabad
Dr. H. V. Trivedi Director, Institute of Technology Nirma University Ahmedabad

ii
ACKNOWLEDGEMENT
I take this golden opportunity to express my heartiest gratitude and sense of indebtedness to
my guide, Prof. N.C.Vyas sir. His polished thoughts, knowledgeable guidance and invaluable
suggestions have continuously encouraged me throughout my endeavors in framing this
thesis.
I like to give my special thanks to Dr. H. V. Trivedi, Director, Institute of Technology and
Prof G. N. Patel, Head, Civil Engineering Dept., Institute of Technology, Nirma University,
Ahmedabad for his continual kind words of encouragement and motivation throughout the
dissertation.
I am highly obliged to Shri Apurva Parikh having allowed me to study the design in his
office, which forms the foundation of my work.
Thanks are due to all staff members, colleagues who have helped me to put a brick further.
Dhaivat A. Vasavada
Roll No. 03MCL18
M. Tech

iii
Title: Analysis and Design of Prestressed Post-Tensioned I type girder
Bridge
Vasavada Dhaivat A.,03MCL18, M.tech.(CASAD), Guide : Prof. Vyas N.C.
Institute of Technology, Nirma University,Ahmedabad.
Abstract
Prestress can provide a solution to many structural problems. Prestress is a technique to create
in advance accurately known permanent forces required. Prestressing in a member replaces
structural steel in the member, which needs costly maintenance and corrodes under aggressive
atmospheric conditions. Because of these short comings of structural steel, Pre-stressed
concrete is ideal for the construction of medium and long span bridges. Pre-stressed concrete
bridges offer a high degree of freedom from cracks, low maintenance and long life. The use of
high strength concrete and high tensile steel results in slender sections, which are aesthetically
superior, coupled with overall economy. In comparison with steel bridges, pre-stressed
concrete bridges require very little maintenance and not easily damaged by fire.
In a conventional approach to the design of prestressed concrete girders, a section of the
girder and cable profile is required to be assumed. Thereafter, going through a series of
typical and rigorous calculations, stress check is made and it is established whether the section
and cable profile are suitable or not. If the design is not suitable, a revised section of girder
and/or cable profile is tried. Since the process is repetitive, it can be better achieved by a
computer software rather than repetitive hand calculation.
In this program different cross-sectional dimensions of the girder and geometry and type of
the of various types of strands, i.e. 7T13, 12T13, 19T13 etc. or any combination of these are
to be entered for the purpose of preliminary design. From the available input data the program
calculate sectional properties, Courban’s Factors, dead load analysis, live load analysis,
prestressing forces, prestress losses and check for stresses at various sections of the prestress
simply supported I- girder. The time dependent losses are considered as per IRC-18. At any
specified section, checking of final stresses is possible. If the initial data fail to comply with
iv
the required condition as per IRC, the program does not move further for the check for
ultimate shear, moment resistance of the section, design of diaphragm, end block and deck
slab.
Keywords: Prestress, I type girder, bridge, strand
Lay out of Chapters
Chapter 1
Covers the definition of prestress, methods of prestressing and application of prestressed
concrete in the field of structural engineering. Various type of bridge superstructure are
discussed at length.
Chapter 2
The literature collected for analysis and design of Prestressed Post-tensioned I type girder
bridge.
Chapter 3
Theoretical background of the study is given in this chapter. The design procedure i.e.
preliminary dimensioning, properties of section, distribution of loads, finding of bending
moment and shear, losses in prestress, checking of stresses and check for ultimate strength are
explained step by step.
Chapter 4
In this chapter longitudinal analysis of I girder is explained. It contains detailed sectional
property calculation, load calculation, cable layout and calculation for prestress losses and
finally checks for flexural stresses and shear checks.

v
Chapter 5
In this chapter design of deck slab, diaphragm and anchor block is done.
Chapter 6
This chapter describes with the help of flow chart structure of computer program made for
simplified analysis and design of prestress I type girder bridge.
Chapter 7
Conclusions of the study and future scope are explained.

vi
INDEX
Certificate i
Acknowledgement ii
Abstract iii
Index vi
List of figures x
List of tables xi
Chapter 1 Introduction 1
1.1 General 1
1.2 Methods of prestressing 1
Materials for prestressed concrete 2
1.3.1 Need of high strength concrete 2
1.3
1.3.2 Need of high strength steel 2
Prestressed versus reinforced concrete 3
1.4.1 Serviceability 3
1.4.2 Safety 4
1.4
1.4.3 Economics 4
1.5 General features of prestressed concrete bridges 5
1.6 Advantages of pre-stressed concrete bridges 5
Types of bridge superstructures 6
1.7.1 Slab type superstructure (solid or voided) 7
1.7.2 Beam and slab type superstructure 7
1.7
1.7.3 Beam and slab type superstructure 7
1.8 Scope of work 7
Chapter 2 Literature survey 9
2.1 General 9
Chapter 3 Theory
3.1 Assumptions and limitations
14
14
Design of post tensioned prestressed concrete bridge girder 14 3.2
3.2.1 Preliminary dimension of section 15

vii
3.2.2 Section properties 16
3.2.3 Calculation of loads 17
3.2.4 Determination of prestressing force and cable profile 21
3.2.5 Stages of prestressing 22
3.2.6 Losses in prestress 22
3.2.7 Shear design 24
3.2.8 End block design 25
3.3 Design checks 25
3.3.1 Check for stresses at transfer and service load 25
3.3.2 Check for shear(cl. 14 of IRC:18-2000) 26
3.3.3 Check for Moment resistance of section 28
3.3.4 Check for serviceability – maximum deflection 29
3.3.5 Check for cracking 29
Chapter 4 Longitudinal and transverse analysis of i girder section 30
4.1 General 30
4.2 Design data 31
4.3 Calculation for sectional properties 33
Load distribution factors 36 4.4
4.4.1 Live load distribution factors 36
4.5 Load calculation 38
4.5.1 Calculation of Dead loads Bending moment and
Shear force
4.5.2 Calculation of Live loads Bending moment and
Shear force
39
41
4.6 Cable numbers, their arrangement, friction and slip forces
thereafter
48
4.6.1 Cable numbers and their arrangement 49
49 4.6.2 Permissible stresses at top and bottom at transfer
and service condition (mid and end span)
4.6.3 Sectional properties of girder at STAGE I and
STAGE II
50
4.7 Calculation of losses 54

viii
4.7.1 Calculation Friction and Slip losses for each cable
(as per cl. 11.6 of IRC : 18-2000)
55
4.7.2 Summary of Force at different section after Friction
and Slip loss
59
4.7.3 Losses due to Elastic shortening, Relaxation, Creep,
Shrinkage and stresses at different section
60
Chapter 5 Design of slab, diaphragm and end block 67
5.1 Load calculation for transverse analysis of deck slab 67
5.1.1 Dead load calculation 67
5.1.2 Live load calculation for I girder deck slab 68
5.2 Design of deck slab reinforcement 70
5.2.1 Design of cantilever slab (Crash barrier side) 70
5.2.2 Design of deck slab 70
5.2.3 Distribution Reinforcement 71
5.3 Design of diaphragm of girder 72
5.3.1 Intermediate diaphragm 72
5.3.2 End diaphragm 75
5.4 Design of anchor block for I - girder 77
Chapter 6 Computer aided design of prestressed I girder 79
6.1 Introduction 79
6.2 Flow chart 80
6.3 About software 81
6.4 Program structure 81
Chapter 7 Summary and conclusions 86
7.1 Summary 86
7.2 Conclusions 86
7.3 Future scope of work 87
Appendix A : STAAD. Pro input file for analysis of diaphragm and deck slab 88
Appendix B : Drawings with detailing 90
Appendix C : MATLAB 7.0 Program 91

ix
References 129
x
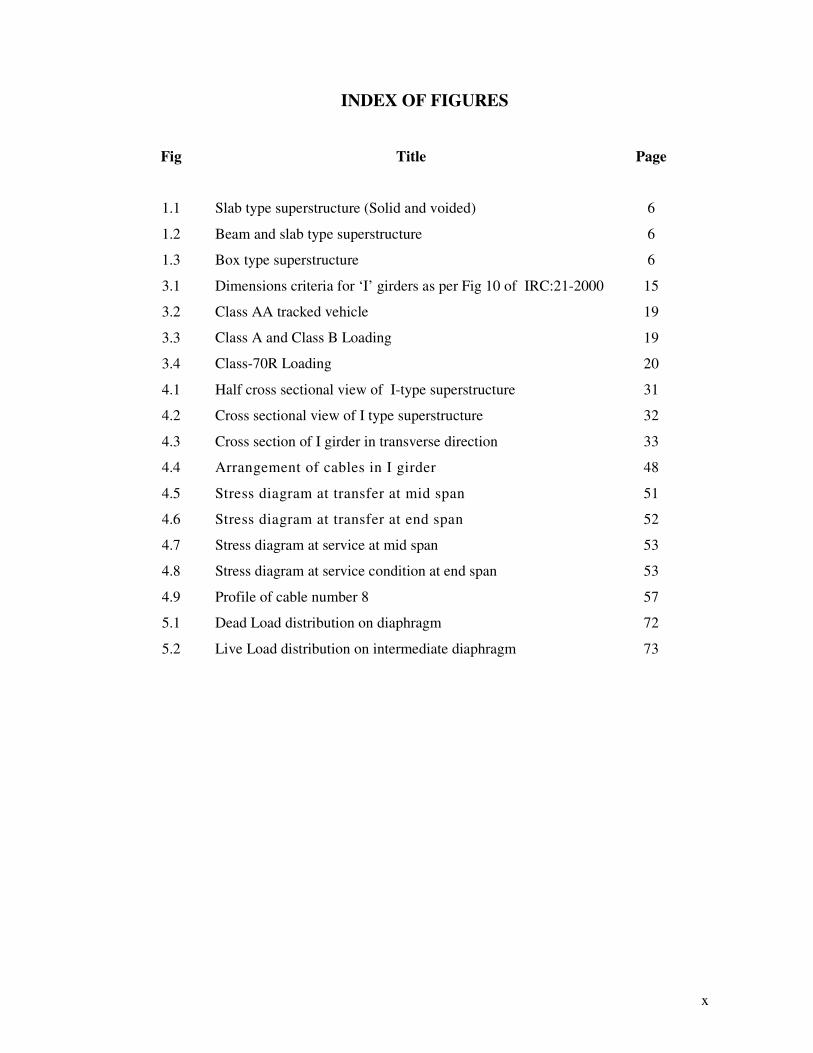
INDEX OF FIGURES
Fig Title Page
1.1 Slab type superstructure (Solid and voided) 6
1.2 Beam and slab type superstructure 6
1.3 Box type superstructure 6
3.1 Dimensions criteria for ‘I’ girders as per Fig 10 of IRC:21-2000 15
3.2 Class AA tracked vehicle 19
3.3 Class A and Class B Loading 19
3.4 Class-70R Loading 20
4.1 Half cross sectional view of I-type superstructure 31
4.2 Cross sectional view of I type superstructure 32
4.3 Cross section of I girder in transverse direction 33
4.4 Arrangement of cables in I girder 48
4.5 Stress diagram at transfer at mid span 51
4.6 Stress diagram at transfer at end span 52
4.7 Stress diagram at service at mid span 53
4.8 Stress diagram at service condition at end span 53
4.9 Profile of cable number 8 57
5.1 Dead Load distribution on diaphragm 72
5.2 Live Load distribution on intermediate diaphragm 73
xi
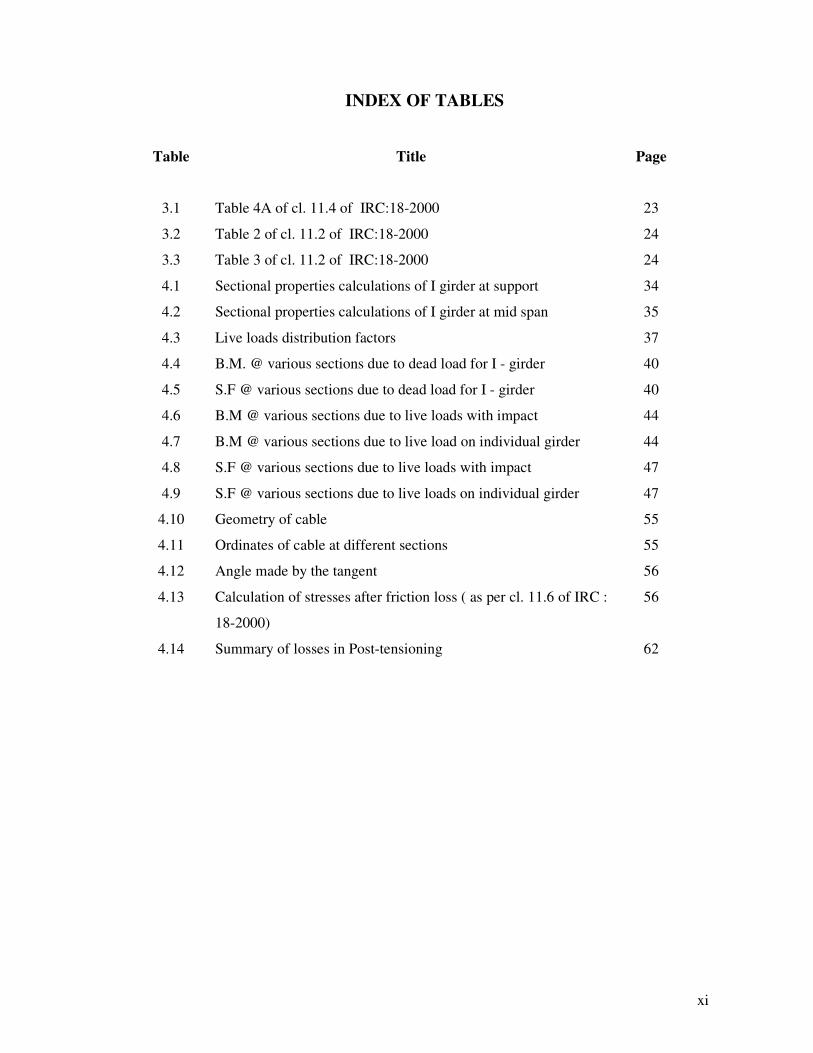
INDEX OF TABLES
Table Title Page
3.1 Table 4A of cl. 11.4 of IRC:18-2000 23
3.2 Table 2 of cl. 11.2 of IRC:18-2000 24
3.3 Table 3 of cl. 11.2 of IRC:18-2000 24
4.1 Sectional properties calculations of I girder at support 34
4.2 Sectional properties calculations of I girder at mid span 35
4.3 Live loads distribution factors 37
4.4 B.M. @ various sections due to dead load for I - girder 40
4.5 S.F @ various sections due to dead load for I - girder 40
4.6 B.M @ various sections due to live loads with impact 44
4.7 B.M @ various sections due to live load on individual girder 44
4.8 S.F @ various sections due to live loads with impact 47
4.9 S.F @ various sections due to live loads on individual girder 47
4.10 Geometry of cable 55
4.11 Ordinates of cable at different sections 55
4.12 Angle made by the tangent 56
4.13 Calculation of stresses after friction loss ( as per cl. 11.6 of IRC :
18-2000)
56
4.14 Summary of losses in Post-tensioning 62
1
CHAPTER:-1
INTRODUCTION
1.1 GENERAL
There is probably no structural problem to which prestress cannot provide a solution, and
often a revolutionary one. Prestress is more than a technique, it is a general principle, to
create in advance accurately known permanent forces acting as required. If we restrict our
areas to only Structural Engineering, prestressed concrete could provide practical answer to
many problems. Prestressed concrete girder is of special interest for long span bridges, large
auditoriums and cinema hall.
One of the best definitions of prestressed concrete is given by the ACI Committee on
prestressed concrete: “Prestressed concrete: Concrete in which there have been introduced
internal stresses of such magnitude and distribution that the stresses resulting from given
external loadings are countered to a desired degree. In reinforced-concrete members the
prestress is commonly introduced by tensioning the steel reinforcement.”
1.2 METHODS OF PRESTRESSING
Several methods and techniques of prestressing are available and most of them can be
classified within two major groups like pretensioning and post tensioning.
� Pretensioning is an act of stretching the prestressing tendons (wire, strands) to a
predetermined tension and anchoring them to fixed bulkheads or moulds. The concrete is
cast around the tendons and cured and after hardening, the tendons are released. The
prefix “pre” in Pretensioning refers to the fact that the tendons are tensioned prior to
hardening of concrete. Pretensioning is mostly used for the products of precast prestressed
concrete elements. In this way the prestress is transferred to the concrete by bond.
� In post tensioning the tendons are stressed and anchored at the ends of concrete members
after casting the member and after it has attained sufficient strength. In bonded post-
tensioned member, after stressing and anchoring, the void between each tendon and the
duct is filled with a mortar grout, which subsequently hardens. Grouting makes bond of

2
the tendon to the surrounding concrete which ensures improvement in the resistance of
member to cracking and reduction of the risks of corrosion of steel tendons. In unbonded
post-tensioned member the duct is filed with grease instead of grout and thus the bond will
be prevented throughout the length of the tendon. Here the tendon force will be applied to
the concrete only at the anchorages. Unbonded tendons are generally coated with grease
or bituminous material, wrapped with water-proof paper and placed in the forms prior to
concrete castings. In this way the prestress is transferred to the concrete by bearing.
1.3 MATERIALS FOR PRESTRESSED CONCRETE
1.3.1 Need of high strength concrete
High-strength concrete is necessary in prestressed concrete, as the material offers high
resistance in tension, shear, bond and bearing. In the zone of anchorages, the bearing stresses
being higher, high-strength concrete is always preferred to minimize costs. High strength
concrete has a high compressive strength at a reasonably early age, with comparatively higher
tensile strength than ordinary concrete, less liable to shrinkage cracks, and has a higher
modulus of elasticity and smaller ultimate creep strain, resulting in a smaller loss of prestress
in steel. Also have many desirable properties, such as durability, and impermeability and
abrasion resistance. The use of high-strength concrete results in a reduction in the cross
section dimensions of prestressed concrete structural elements. With a reduced dead-weight of
the material, longer spans become technically and economically practicable.
1.3.2 Need of high strength steel
The early attempts to use mild steel in prestressed concrete were not successful, as a working
stress of 120 N/mm2 in mild steel is more or less completely lost due to elastic deformation,
creep and shrinkage of concrete.
The normal loss of stress in steel is generally about 100 to 240 N/mm2 and it is clear that if
this loss of stress is to be a small portion of the initial stress, the stress in steel in the initial
stages must be very high, about 1200 to 2000 N/mm2. These high stress ranges are possible
only with the use of high-strength steel.

3
For that reason in prestressed concrete members, the high-tensile steel used generally consists
of wires, bars, or strands. The higher tensile strength is generally achieved by increasing the
carbon content in steel in comparison with mild steel.
1.4 PRESTRESSED VERSUS REINFORCED CONCRETE
The most outstanding difference between the two is taking advantage of materials of higher
strength for pre-stressed concrete. In order to utilize the full strength of the high-tensile steel,
it is necessary to resort to pre-stressing to pre-stretch it. Pre-stressing the steel and anchoring
eliminates cracks in concrete. Thus the entire section of the concrete becomes effective in pre-
stressed concrete, whereas only the portion of section above the neutral axis is supposed to act
in the case of reinforced concrete.
The use of curved tendons will have to carry some of the shear in a member. In addition, pre-
compression in the concrete tends to reduce the diagonal tension. Thus it is possible to use
smaller section in pre-stressed concrete to carry the same amount of external shear in a beam.
High strength concrete cannot be economically utilized in reinforced concrete construction
and it is found necessary with pre-stressed concrete. In reinforced concrete, using concrete of
high strength will result in a smaller section calling for more reinforcement and will end with
more costly design. In pre-stressed concrete, high strength concrete is required to match with
high strength steel in order to yield economical proportions. Stronger concrete is also
necessary to resist high stresses at the anchorages and to give strength to the thinner section so
frequently employed for pre-stressed concrete.
The advantages and disadvantages of pre-stressed concrete as compared to reinforced
concrete are discussed in respect to their serviceability, safety and economics.
1.4.1 Serviceability
Pre-stressed concrete structures do not crack under working loads, and whatever cracks may
be developed under over loads will be closed up as soon as the load is removed, unless the
load is excessive. Under dead load, deflection is compensating by the cambering effect of pre-
stress. Under live load, deflection is also smaller because of the effectiveness of the entire
4
uncracked concrete section, which has a moment of inertia 2 to 3 times that of the cracked
section. So far as serviceability is concerned, the only shortcoming of pre-stressed concrete is
its lack of weight.
1.4.2 Safety
When properly designed by the present conventional methods, Pre-stressed concrete
structures have overload capacities similar to and perhaps slightly higher than those of
reinforced concrete. For the usual design, they deflect appreciably before ultimate failure, thus
giving ample warning before impending collapse. The ability to resist shocks and impact
loads have been shown to be as good in pre-stressed as in reinforced concrete. The resistance
to corrosion is better than that of reinforced concrete for the same amount of cover, owing to
denser concrete and the non existence of cracks. If cracks occur, corrosion can be more
serious in pre-stressed concrete.
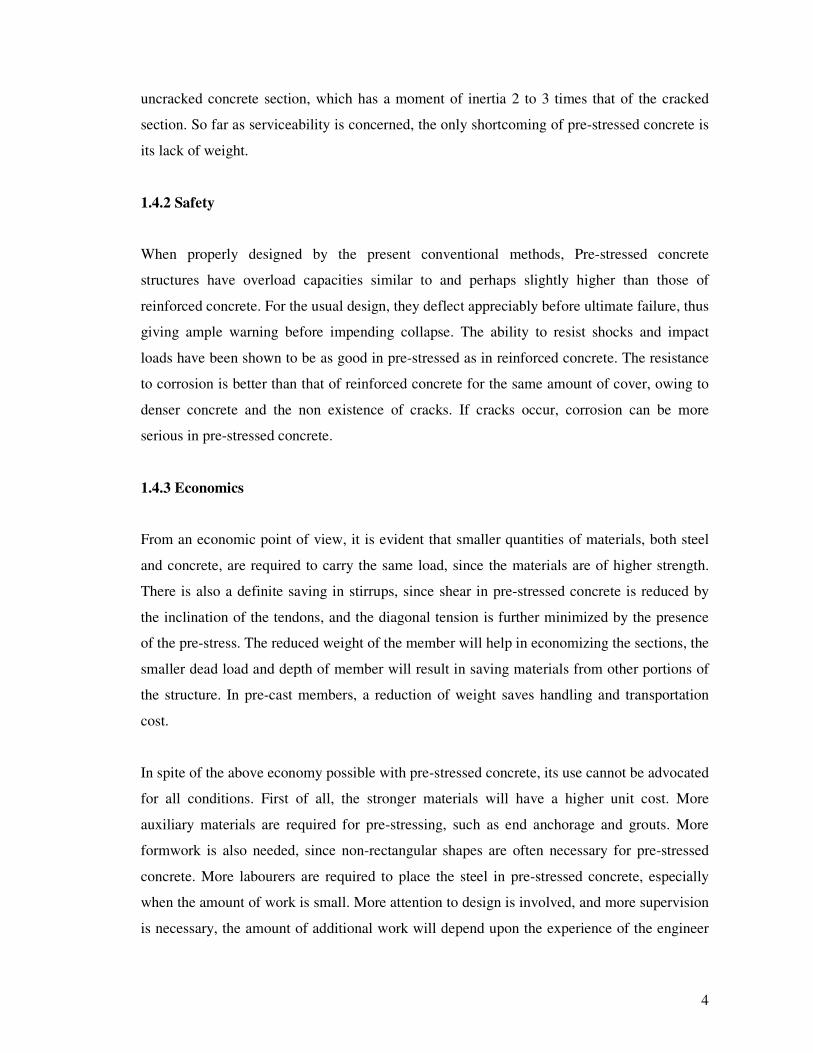
1.4.3 Economics
From an economic point of view, it is evident that smaller quantities of materials, both steel
and concrete, are required to carry the same load, since the materials are of higher strength.
There is also a definite saving in stirrups, since shear in pre-stressed concrete is reduced by
the inclination of the tendons, and the diagonal tension is further minimized by the presence
of the pre-stress. The reduced weight of the member will help in economizing the sections, the
smaller dead load and depth of member will result in saving materials from other portions of
the structure. In pre-cast members, a reduction of weight saves handling and transportation
cost.
In spite of the above economy possible with pre-stressed concrete, its use cannot be advocated
for all conditions. First of all, the stronger materials will have a higher unit cost. More
auxiliary materials are required for pre-stressing, such as end anchorage and grouts. More
formwork is also needed, since non-rectangular shapes are often necessary for pre-stressed
concrete. More labourers are required to place the steel in pre-stressed concrete, especially
when the amount of work is small. More attention to design is involved, and more supervision
is necessary, the amount of additional work will depend upon the experience of the engineer

5
and the construction crews, but it will not be serious if the same typical design is repeated
many times.
1.5 GENERAL FEATURES OF PRESTRESSED CONCRETE BRIDGES
Pre-stressed concrete is ideal for the construction of medium and long span bridges. Ever
since the development of the pre-stressed concrete, the material has found extensive
application in the construction in the long span bridges gradually replacing steel, which needs
costly maintenance due to the disadvantages of corrosion under aggressive atmospheric
conditions. Pre-stressed concrete bridges offer a high degree of freedom from cracks, low
maintenance, long life and they are particularly suitable for dynamic loads and vibrations.
Pre-stressed concrete is ideally suited for long span continuous bridges. Pre-stressed concrete
has been widely used throughout the world for simply supported, continuous, balanced
cantilever, suspension bridges in the span range from 20 to 500m.
1.6 ADVANTAGES OF PRE-STRESSED CONCRETE BRIDGES
Pre-stressed concrete made up of high strength concrete and high tensile steel has distinct
advantages when used for bridge construction. The salient benefits resulting from the use of
pre-stressed concrete in bridges are outlined as follows:-
� The use of high strength concrete and high tensile steel results in slender sections, which
are aesthetically superior, coupled with overall economy.
� Pre-stressed concrete bridges can be designed as class 1-type structures without any
tensile stresses under service loads resulting in a crack free structure.
� In comparison with steel bridges, pre-stressed concrete bridges require very little
maintenance and not easily damaged by fire.
� Pre-stressed concrete is ideally suited for composite bridge construction in which pre-cast
pre-stressed girders support the cast-in-situ slab deck. This type of construction is very
popular since it involves minimum disruption of traffic.

6
� Post-tensioned pre-stressed concrete finds extensive applications in long span continuous
girder bridges of variable cross-section resulting in sleek structures and with considerable
savings in the overall cost of the construction.
1.7 TYPES OF BRIDGE SUPERSTRUCTURES
Typical arrangements of bridge decks with post-tensioned girders suitable for simply
supported constructions are shown in Fig 1.1 to 1.3. Basically the arrangements may be one of
the following types:-
(a) (b)
Fig 1.1 Slab type superstructure (Solid and voided)
Fig 1.2 Beam and slab type superstructure
Fig 1.3 Box type superstructure
7
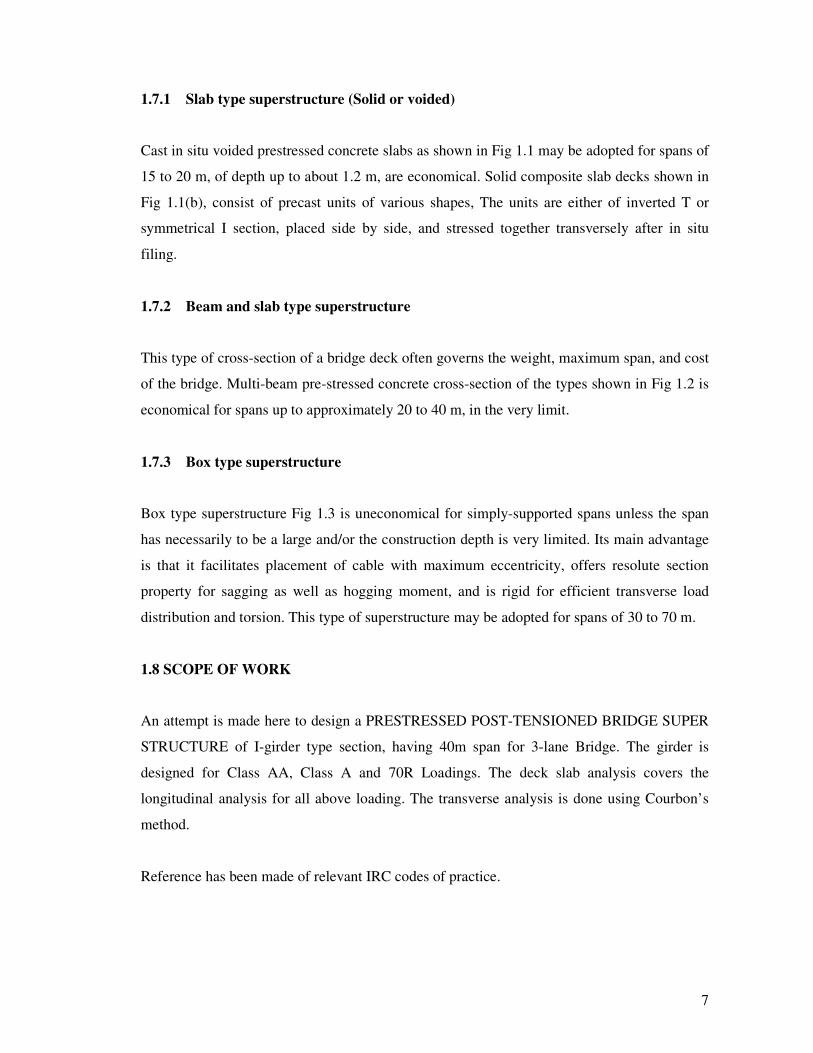
1.7.1 Slab type superstructure (Solid or voided)
Cast in situ voided prestressed concrete slabs as shown in Fig 1.1 may be adopted for spans of
15 to 20 m, of depth up to about 1.2 m, are economical. Solid composite slab decks shown in
Fig 1.1(b), consist of precast units of various shapes, The units are either of inverted T or
symmetrical I section, placed side by side, and stressed together transversely after in situ
filing.
1.7.2 Beam and slab type superstructure
This type of cross-section of a bridge deck often governs the weight, maximum span, and cost
of the bridge. Multi-beam pre-stressed concrete cross-section of the types shown in Fig 1.2 is
economical for spans up to approximately 20 to 40 m, in the very limit.
1.7.3 Box type superstructure
Box type superstructure Fig 1.3 is uneconomical for simply-supported spans unless the span
has necessarily to be a large and/or the construction depth is very limited. Its main advantage
is that it facilitates placement of cable with maximum eccentricity, offers resolute section
property for sagging as well as hogging moment, and is rigid for efficient transverse load
distribution and torsion. This type of superstructure may be adopted for spans of 30 to 70 m.
1.8 SCOPE OF WORK
An attempt is made here to design a PRESTRESSED POST-TENSIONED BRIDGE SUPER
STRUCTURE of I-girder type section, having 40m span for 3-lane Bridge. The girder is
designed for Class AA, Class A and 70R Loadings. The deck slab analysis covers the
longitudinal analysis for all above loading. The transverse analysis is done using Courbon’s
method.
Reference has been made of relevant IRC codes of practice.

8
The design is intended for simply supported ends for the following limit states:
� Limit state of serviceability for maximum compression
� Limit state of collapse : flexure
� Limit state of collapse : shear
� Limit state of serviceability : deflection
� Limit state of serviceability : cracking
Computer program is prepared for sectional property calculations, load calculations, losses,
extreme fiber stress check, shear check and design of various components like girder, deck
slab, End block and diaphragm.

9
CHAPTER:-2
LITERATURE REVIEW
2.1 GENERAL
Survey from various research papers has been carried out to support the present work.
Literature survey has been carried out for I girder bridge configuration and related girder
design aspects, effects of diaphragm in slab on girder bridge and need of computer program in
prestressed concrete girder design.
Z.Lounis, M.S.Mirza, M.Z.Cohn(1996). ”Segmental and Conventional Precast Prestressed
Concrete I-Bridge Girders”, Journal of Bridge Engineering, ASCE, Vol.2 No.3, pp. 73-82
In this paper a new set of optimum I-sections are generated using an efficient nonlinear
programming algorithm. The main results of the investigation are summarized as below:
1. The optimum girder shape is found to be a bulb-tee section for posttensioned girders and a
nearly symmetrical I-section for conventional pretensioned girders.
2. The span and girder spacing capabilities presented in this paper may be used as design
aids for developing preliminary bridge design alternatives with either post-tensioned or
precast I-girders.
3. The selection of the optimal structural system and span length will be based on the total
bridge cost including the costs of superstructure and substructure, in addition to the other
requirements such as limited superstructure depth, elimination of intermediate piers and
aesthetics.
Sami W.Tabsh, Kalpana Sahajwani(1997). ”Approximate Analysis of Irregular Slab-on-
Girder Bridges”, Journal of Bridge Engineering, ASCE, Vol.2 No.1, pp. 11-17
Thirty-one different composite steel I-beam bridges having irregular beam spacing are
analyzed in this study under the effect of live load. The bridges are analyzed by two methods,
an approximate procedure and the finite-element method. Wheel load Girder Distribution

10
Factors (GDFs) are computed for both flexure and shear in interior girders. The approximate
method is based on isolating strips of the deck slab in the transverse direction directly under
the wheel loads and treating them as beams on elastic supports. The finite-element analysis is
used to verify the accuracy of the approximate method. The results of this study indicate that
GDFs obtained by the approximate method for flexure and shear in simply supported I-beams
are very similar with results obtained using a detailed three-dimensional finite-element
analysis. On average, the approximate method yielded GDF values for simple bridges 5.7%
and 3.1% less than the finite-element results for flexure and shear, respectively. Based on this
paper, it can be concluded that the approximate method of analysis discussed in this study can
be safely used to analyze irregular I-beam bridges with unequal girder spacing if a more
detailed finite-element analysis is not available.
Tanya Green, Nur Yazdani, Lisa Spainhour(2004). “Contribution of Intermediate
Diaphragms in Enhancing Precast Bridge Girder Performance”, Journal of Performance of
Constructed Facilities, ASCE, Vol. 18 No. 3, pp. 142-146
Based upon the parametric analysis of theoretical modeling of the Florida Bulb Tee 78 precast
concrete bridge girders, the following conclusions are made in this paper:
1. The presence of intermediate diaphragms helps in the stiffening of precast bridge girders
and the reduction of maximum girder deflections. However, such reductions decrease with
increased skew angles. The addition of intermediate diaphragms has an overall effect of
reducing the deflections by about 19% for straight bridges, about 11% for 15–30° skew
bridges, and about 6% for 60° skew bridges.
2. The effects of intermediate diaphragms together with a positive temperature differential
also show beneficial stiffening of the girders. Such girder stiffening also decreases with an
increased bridge skew angle. The maximum girder
3. Deflections can be reduced by 5.9 to 14.3%, depending on the skew angle and bearing
stiffness.
4. The effects of intermediate diaphragms with negative thermal changes are also beneficial
to the girder in terms of deflection reduction, although at a lesser extent than the positive

11
thermal change cases. Increasing skew angles result in the reduction of such a stiffening
effect.
5. The increase in girder stiffness will decrease maximum girder deflections.
Based on these results, it is clear that significant benefits can be gained when considering the
presence of secondary elements and these elements positively influencing structural
performance.
R.E.Abendroth, F.W.Klaiber, M.W.Shafer(1995). ”Diaphragm Effectiveness in
Prestressed-Concrete Girder Bridges”, Journal of Structural Engineering, ASCE, Vol.121
No.9, pp. 1362-1369
Using experimental Bridge model and Finite element model of Bridge, P/C girder’s different
end condition at supports resulted in significant change in rotational end restraint. With the
help of experiment, it was concluded that the vertical load distribution was independent of the
type and location of intermediate diaphragms, while the horizontal load distribution was a
function of diaphragm type and location. The X-brace plus strut as a intermediate diaphragm
were determined to be structurally equivalent to the R/C intermediate diaphragms.
Christopher D.Eamon, Andrzej S.Nowak(2002). ”Effects of Edge-Stiffening Elements and
Diaphragms on Bridge Resistance and Load Distribution”, Journal of Bridge Engineering,
ASCE, Vol.7 No.5, pp. 258-266
The effect of secondary elements (barriers, sidewalks, and diaphragms) on the load
distribution and resistance of girder bridge structures was investigated using the finite-element
method. In the elastic range, secondary elements affect both the position of
maximum girder moment and the moment magnitude and can result in a 10 to 40% decrease
in Girder Distribution Factor (GDF) for typical cases. For the inelastic range, typical element
stiffness combinations reduce GDF by an additional 5–20%, while bridge system ultimate
capacity is increased significantly, from 1.1 to 2.2 times that of the base bridge. Based on
these results, it is clear that significant benefits can be gained when considering the presence
of secondary elements and these elements will positively influencing structural performance,
valuable for consideration of an overload.

12
R.R.Parikh, B.J.Shah, D.D.Patel(2001). “Computer Aided Design of Prestressed Concrete
Girder”, Trends in Prestressed Concrete, pp. 159-165
In this paper an attempt is made to show the various aspects of computer software package
developed by the authors to analyze and design a PSC girder for Bridge. Prestressed concrete
is now days extensively used in the construction of large span bridge structures. The analysis
and design of a prestressed concrete member is not only a tedious task but voluminous too.
The general purpose packages available for analysis and design of structures are discussed.
Use of Computer Aided Design application for prestressed concrete work will result in a
considerable saving in time, in addition to the minor change and economy.
Krishnaraju N. (2003). Prestressed Concrete, 10th
edition, Tata MacGraw-Hill
Publishing Company Limited, New Delhi.
Author covers theory and design of prestressed concrete. Explains in a very lucid language the
concepts of prestressing and salient properties of high strength concrete and steel which form
main constituents of prestressed concrete. Various prestressing systems are examined,
analysis of stresses, losses of prestressed and deflection characteristics of prestressed member
under serviceability limit states are explained. The flexural, shear and torsional resistance of
prestressed concrete members and the design of anchorage zone reinforcement are examined.
Development and application of limit state design concepts for the design of prestressed
concrete members, design of prestressed sections, pretensioned and post-tensioned flexural
members is also discussed. The book concludes with a brief introduction to the optimum
design of prestressed concrete structures.
Krishnaraju N. (2003). Design of Prestressed Concrete Bridges, 8th
edition, Tata
MacGraw-Hill Publishing Company Limited, New Delhi.
Author carried out the design of bridge superstructures such as slab bridge girder type R.C.C.
Bridge, steel concrete composite bridge, continuous bridge, rigid-frame bridges etc. The
different load distribution theories such as Courbon’s theory, Gouyon-massonet method,
Hendry-jaeger method etc. for the girder type bridge superstructures is discussed. The book
discusses different Indian standard loads, used for the design of highway bridges.

13
Y. GUYON (1963). Prestressed Concrete (Volume–I), 1st edition, Asia Publication
House.
In this book author has given fairly detailed study of some particular applications of prestress
so that it makes possible to bring out the general principles involved and to describe some
methods which can be suitably modified for other applications. Also author describes in
details importance of bond phenomena and stresses in the end zone of beam.
14
CHAPTER:-3
THEORY
3.1 ASSUMPTIONS AND LIMITATIONS
Due to limitations of the study and time constraints the following limitations are imposed on
the study and study is restricted to a certain limit –
• Horizontal deviation of cable is neglected due to negligible effect on prestressing force.
• Slip of cables is assumed 6 mm
• It is assumed that no strand will fail.
• Jacking is done from both ends simultaneously.
• Only super structure is considered for analysis and substructure is not included in study.
• Only 3-lane carriageway bridges have been included in the study.
• Structure is designed only for gravity loads and earthquake forces are not considered.
3.2 DESIGN OF POST TENSIONED PRESTRESSED CONCRETE BRIDGE
GIRDER
The design of prestressed concrete girder is carried out in the following steps:
1. Preliminary dimension of section
2. Section properties
3. Calculation of loads
4. Determination of prestressing force and cable profile
5. Stages of prestressing
6. Losses in prestress
7. Shear design
8. End block design

15
3.2.1 Preliminary dimension of section
One has to be guided by previous experience and available information to minimize the
number of trials and adjustments in the dimensions of overall depth of the beam (D),
thickness of flange (tf), width of flange (be), breadth of web (bw) and haunches to arrive at the
appropriate section. As per fig 10 of IRC: 21-2000, which is given below, dimensions must be
fixed.
Fig. 3.1 Dimensions criteria for ‘I’ girders as per Fig 10 of IRC:21-2000
Some guidelines are provided in cl. 9.3 of IRC:18-2000 as under:-
‘I’ girders:-
� The thickness of the web (bw) shall not be less than 200 mm plus the diameter of duct
holes. Where cables cross within the web, suitable increase in the thickness over the above
value shall be made.
16
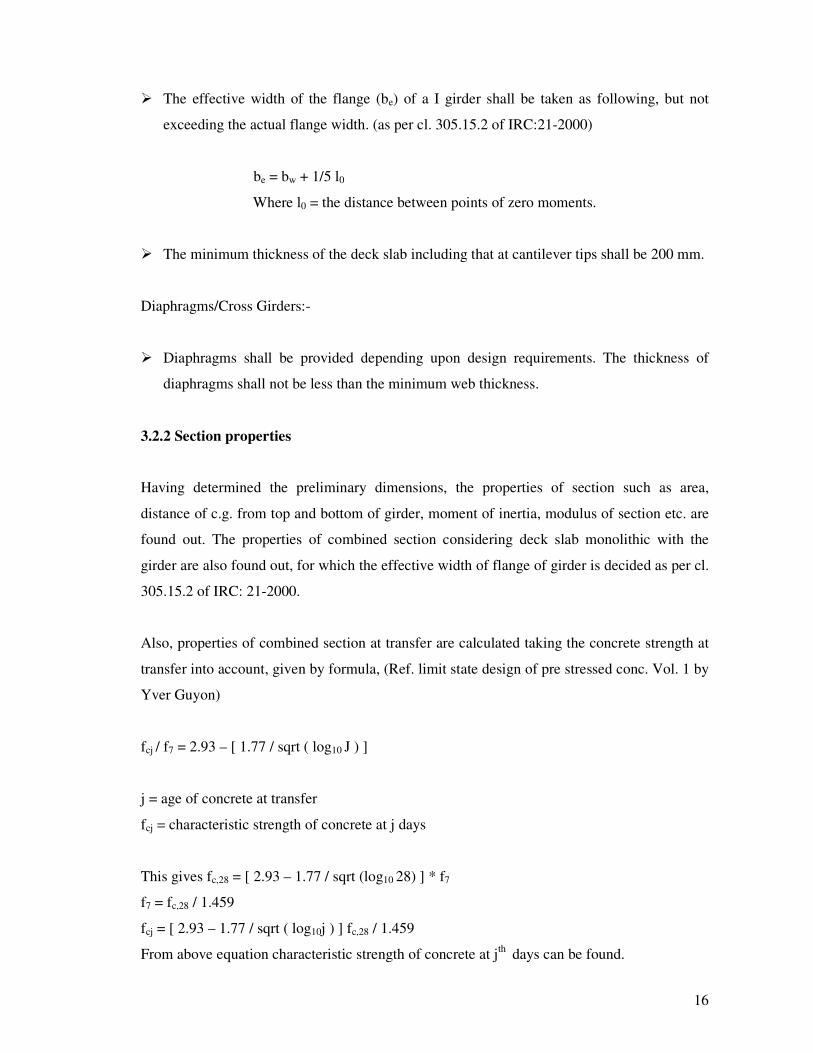
� The effective width of the flange (be) of a I girder shall be taken as following, but not
exceeding the actual flange width. (as per cl. 305.15.2 of IRC:21-2000)
be = bw + 1/5 l0
Where l0 = the distance between points of zero moments.
� The minimum thickness of the deck slab including that at cantilever tips shall be 200 mm.
Diaphragms/Cross Girders:-
� Diaphragms shall be provided depending upon design requirements. The thickness of
diaphragms shall not be less than the minimum web thickness.
3.2.2 Section properties
Having determined the preliminary dimensions, the properties of section such as area,
distance of c.g. from top and bottom of girder, moment of inertia, modulus of section etc. are
found out. The properties of combined section considering deck slab monolithic with the
girder are also found out, for which the effective width of flange of girder is decided as per cl.
305.15.2 of IRC: 21-2000.
Also, properties of combined section at transfer are calculated taking the concrete strength at
transfer into account, given by formula, (Ref. limit state design of pre stressed conc. Vol. 1 by
Yver Guyon)
fcj / f7 = 2.93 – [ 1.77 / sqrt ( log10 J ) ]
j = age of concrete at transfer
fcj = characteristic strength of concrete at j days
This gives fc,28 = [ 2.93 – 1.77 / sqrt (log10 28) ] * f7
f7 = fc,28 / 1.459
fcj = [ 2.93 – 1.77 / sqrt ( log10j ) ] fc,28 / 1.459
From above equation characteristic strength of concrete at jth days can be found.

17
3.2.3 Calculation of loads
When longitudinal beams are connected together by transverse members like deck slab, cross
girders, diaphragms, soffit slab, etc., the distribution of bending moments between
longitudinal girders shall be calculated by one of the following methods suggested by cl.
305.12.1 of IRC:21-2000.
(i) Finding the reactions on the longitudinal girders assuming the supports of the deck slab as
unyielding. This method is applicable where there are only two longitudinal girders with
no soffit slab
(ii) Distributing the loads between longitudinal girders by Courbon’s method, strictly within
its limitation, i.e., when the effective width of the deck is less than half the span and when
the stiffness of the cross girders is very much greater than that of the longitudinal girders
(iii) Distributing the loads between longitudinal girders by any rational method of grid
analysis, e.g., the method of harmonic analysis as given by Hendry and Jaeger or Morice
and Little’s version of the isotropic plate theory of Guyon and Massonet etc.
Here in this analysis and design Courbon's method is used. The basic fundamental concept of
Courbon's method is assumed the cross girder (diaphragm) to be infinitely rigid and worked
out the proportions of live loads on these girders based on that consideration. According to his
theory, no flexure of transverse deck is possible because of the presence of infinitely rigid
diaphragms, and a concentric load, instead of one pushing down only nearby girders, causes
deflection of all the girders. The equation for the distribution coefficient is described in
section 4.4.1 on page number 37.
3.2.3.1 Computation of Dead load
The dead load carried by a bridge member consists of its own weight and the portion of the
weight of the superstructure and any fixed loads supported by the member.
The following dead loads are taken into account, and the moments and shear caused by them
are found out.

18
a. Self weight of girder
b. Stiffener and diaphragms
c. Deck slab and deck shuttering
d. Wearing coat on clear road
e. Railings, kerb or crash barrier
f. Watermain
The dead load due to deck shuttering, wearing coat, railings, crash barrier, watermain are
directly assumed.
3.2.3.2 Live load
Live loads caused by vehicles, which pass over the bridge are transient in nature. These loads
cannot be estimated precisely, and the designer has a very little control over them. Once the
bridge is open to traffic cl.207 of IRC: 6-2000 gives details of loading to be accounted for the
design.
The live loads usually consist of a set of wheel loads, which are patch loads due to tyre
contact area. These patch loads may be treated as point loads acting at the center of the
contact area. This simplification is found to be acceptable in the analysis.
According to IRC classification, the main live loads for road bridges can be put into the
following four types:-
IRC Class AA Loading: - IRC Class AA loading comprises either a tracked vehicle of
700kN or vehicle of 400kN loads. Fig.3.2 shows the Class AA tracked vehicle. All
bridges located on National highways and State highways have to be designed for this
heavy loading.

19
Fig. 3.2 Class AA tracked vehicle
IRC Class A Loading: - IRC Class A loading consist of a wheel load train comprising a
truck with trailers of specified axle spacing and loads as detailed in fig. This type of
loading is adopted on all roads on which permanent bridges and culverts are constructed.
The axle loads of Class A loading is shown in fig. 3.3.
IRC Class B Loading: - Class B loading comprises a truck and truck and trailers similar to
that of Class A loading but with lesser intensity of wheel loads. The axle loads of Class B
loading is shown in fig. 3.3. This type of loading is adopted for temporary structures and
timber bridges.
Fig. 3.3 Class A and Class B Loading
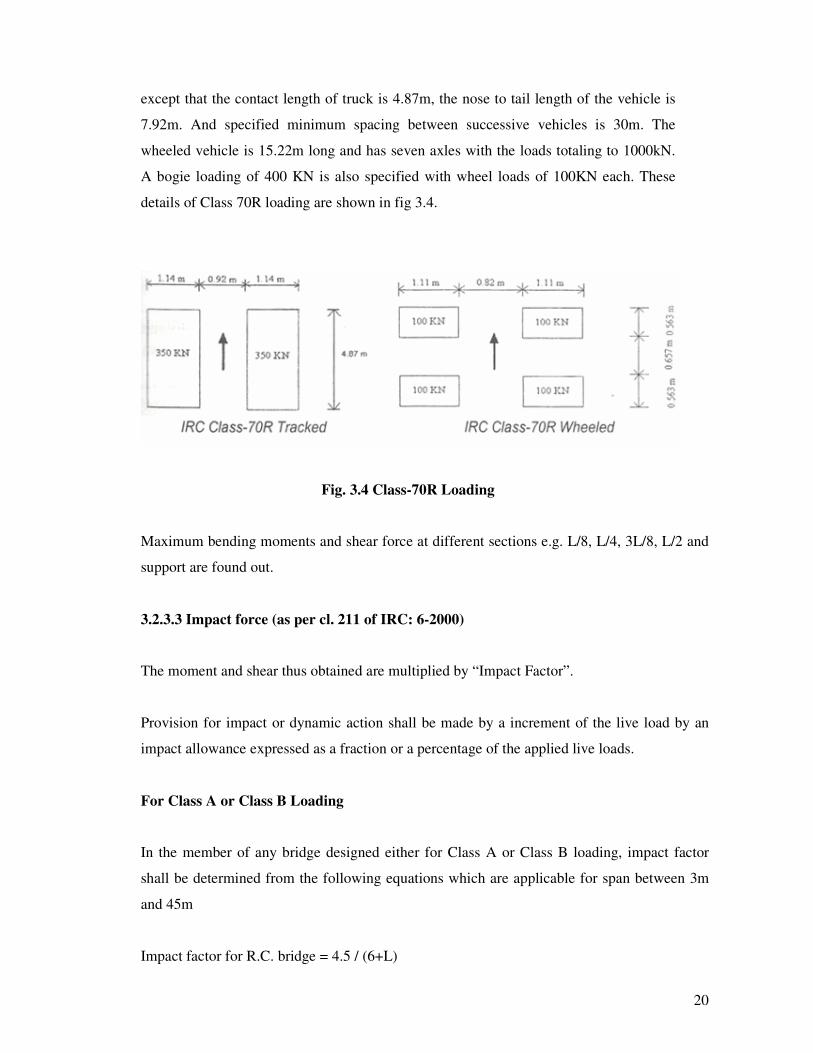
IRC Class 70R Loading: - This consists of a tracked vehicle of 700kN or a wheeled
vehicle of total load is 1000 kN. The tracked vehicle is somewhat similar to Class AA, AA Loading
20
except that the contact length of truck is 4.87m, the nose to tail length of the vehicle is
7.92m. And specified minimum spacing between successive vehicles is 30m. The
wheeled vehicle is 15.22m long and has seven axles with the loads totaling to 1000kN.
A bogie loading of 400 KN is also specified with wheel loads of 100KN each. These
details of Class 70R loading are shown in fig 3.4.
Fig. 3.4 Class-70R Loading
Maximum bending moments and shear force at different sections e.g. L/8, L/4, 3L/8, L/2 and
support are found out.
3.2.3.3 Impact force (as per cl. 211 of IRC: 6-2000)
The moment and shear thus obtained are multiplied by “Impact Factor”.
Provision for impact or dynamic action shall be made by a increment of the live load by an
impact allowance expressed as a fraction or a percentage of the applied live loads.
For Class A or Class B Loading
In the member of any bridge designed either for Class A or Class B loading, impact factor
shall be determined from the following equations which are applicable for span between 3m
and 45m
Impact factor for R.C. bridge = 4.5 / (6+L)

21
Where, L is the length of span in m.
For Class AA and Class -70R loading
The value of the impact percentage shall be taken as follows:
(a) For span less than 9m
(i) For tracked vehicles: 25% for span up to 5m linearly reducing to 10 % for span of 9m
(ii) For wheeled vehicles: 25 %
(b) For span of 9m or more
(i) For tracked vehicles: 10 % up to a span of 40m and in accordance with the curve in
Fig 5 of cl. 211 of IRC: 6-2000 for span excess of 40m.
(ii) For wheeled vehicles: 25 % for span up to 12m and in accordance with the curve in Fig 5
of cl. 211 of IRC: 6-2000 for span excess of 12m
No impact allowance shall be added to footway loading.
3.2.4 Determination of prestressing force and cable profile
As per cl. 6 of IRC: 18-2000, stage prestressing is permissible. The number of stage of
prestressing and grouting shall be reduced to the minimum, preferably not more than two.
However concrete shall have attained strength of not less than 20 Mpa before any
prestressing is applied.
If prestressing operations are carried out in two stages. In the first stage pre stressing, a
certain number of cables are stressed so that the girder is safe in taking dead load and pre
stress only.
After a reasonable period of casting of deck slab the second stage pre stressing is done. The
effect of this stage of pre stressing is shared by the girder and the deck slab, act together as a
combined section.

22
The maximum permissible jacking force is 0.75 times the maximum ultimate tensile strength
of the strand.
The positions of first and second stage cables are assumed for mid span and support sections.
The clear spacing between adjacent cables is 75 mm minimum.
3.2.5 Stages of prestressing
Design of a prestressed concrete girder is carried out under number of stages of loading
during its lifetime. However, there are two discrete stages for which the girder is mainly
designed.
(1) Service dead load + pre stress with full losses
(2) Service dead load + live load + pre stress with full losses.
The girder thus designed is further checked for ultimate loads as per IRC code provisions.
3.2.6 Losses in prestress
Decrease in prestress in steel due to friction, seating of anchorages, and elastic shortening
shall be deemed to be instantaneous, while that due to creep, shrinkage and relaxation of steel
is time dependent. Both losses shall be calculated on the following basis:
3.2.6.1 Friction Losses (cl.11.6 of IRC:18-2000)
Steel stress in prestressing tendons σpo(x) at any distance x from the jacking end can be
calculated from the formula
σpo = σpo(x) e(µθ + kx)
where, σpo = steel stress at jacking end
µ = coefficient of friction
θ = cumulative angle change in radians
k = wobble coefficient per m length of steel

23
3.2.6.2 Losses due to Elastic shortening of concrete (cl.11.1 of IRC:18-2000)
The loss due to elastic shortening of concrete shall be computed based on the sequence of
tensioning. However, for design purpose, the resultant loss of pre stress in tendons tensioned
one by one may be calculated on the basis of half the product of modular ratio and the stress
in concrete adjacent to the tendons averaged along the length.
3.2.6.3 Losses due to Relaxation of steel (cl.11.4 of IRC:18-2000)
Losses due to relaxation of steel shall be taken in accordance with the table give below.
Initial stress Relaxation loss for Normal
relaxation steel (%)
Relaxation loss for low
relaxation steel (%)
0.5fp
0.6fp
0.7fp
0.8fp
0
2.5
5.0
9.0
0
1.25
2.5
4.5
fp = minimum Ultimate Tensile Stress (UTS) of steel
Table 3.1 Table 4A of cl. 11.4 of IRC:18-2000
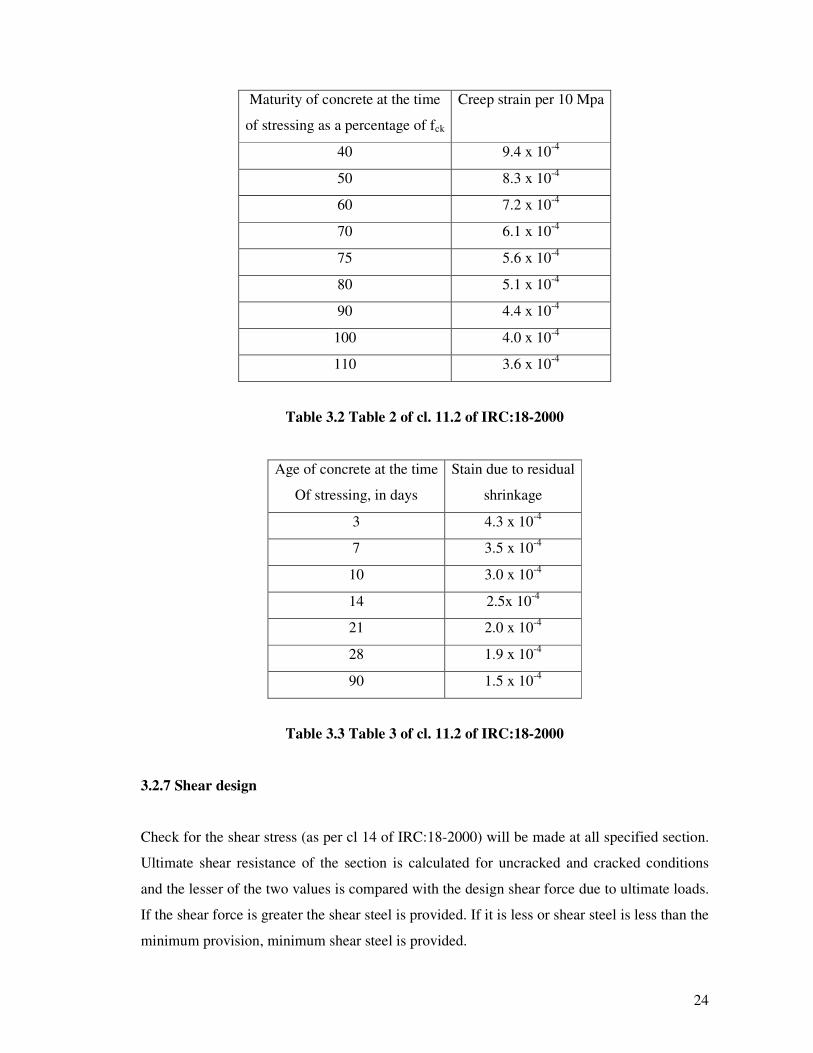
3.2.6.4 Losses due to Creep & Shrinkage of concrete (cl.11.2 & 11.3 of IRC:18-2000)
This loss in tendon, stressed at a particular age of concrete, is the product of the Residual
Shrinkage Strain or Creep Strain in concrete from that day onwards and E modulus of
elasticity of cable steel. The values of strain due to residual shrinkage and creep are given in
table 2 and table 3 of IRC:18-2000.
24
Maturity of concrete at the time
of stressing as a percentage of fck
Creep strain per 10 Mpa
40 9.4 x 10⁻⁴
50 8.3 x 10⁻⁴
60 7.2 x 10⁻⁴
70 6.1 x 10⁻⁴
75 5.6 x 10⁻⁴
80 5.1 x 10⁻⁴
90 4.4 x 10⁻⁴
100 4.0 x 10⁻⁴
110 3.6 x 10⁻⁴
Table 3.2 Table 2 of cl. 11.2 of IRC:18-2000
Age of concrete at the time
Of stressing, in days
Stain due to residual
shrinkage
3 4.3 x 10⁻⁴
7 3.5 x 10⁻⁴
10 3.0 x 10⁻⁴
14 2.5x 10⁻⁴
21 2.0 x 10⁻⁴
28 1.9 x 10⁻⁴
90 1.5 x 10⁻⁴
Table 3.3 Table 3 of cl. 11.2 of IRC:18-2000
3.2.7 Shear design
Check for the shear stress (as per cl 14 of IRC:18-2000) will be made at all specified section.
Ultimate shear resistance of the section is calculated for uncracked and cracked conditions
and the lesser of the two values is compared with the design shear force due to ultimate loads.
If the shear force is greater the shear steel is provided. If it is less or shear steel is less than the
minimum provision, minimum shear steel is provided.

25
3.2.8 End block design
Based on the size of the bearing plate, the bearing stress is calculated. Bursting force in the
end block is calculated and for that force, the required reinforcement in the anchorage zone is
provided. Checking of bearing stress behind anchorage is also carried out as per IRC-18.
3.3 DESIGN CHECKS
Once the design steps are over, the following design checks are provided.
1. Check for stresses at transfer and service load
2. Check for shear
3. Check for M.R of section
4. Check for serviceability – maximum deflection
5. Check for cracking
3.3.1 Check for stresses at transfer and service load
Design dead load bending moments (Md), live load bending moments (Ml), prestressing force
(P0) at transfer, prestressing force (Ps) at service and its eccentricity (e), then stresses are
calculated as under:
At transfer,
f(top) = P0/A - P0.e / Z + Md / Z
f(bottom) = P0/A + P0.e / Z - Md / Z
At service,
f(top) = Ps/A - Ps.e / Z - Md / Z + Ml / Z
f(bottom) = Ps/A + Ps.e / Z + Md / Z - Ml / Z
3.3.1.1 Permissible stresses in tension and compression (cl.7 of IRC:18-2000)
At full transfer temporary compressive stress in the extreme fiber of concrete (including stage
pre stressing) shall not exceed 0.5fcj, subject to a maximum of 20Mpa and the temporary

26
tensile stress in the extreme fiber of concrete shall not exceed 1/10th of the permissible
temporary compressive stress in concrete.
The compressive stress in concrete under service loads shall not exceed 0.33fck.
No tensile stress shall be permitted in the concrete during service.
Thus if, fck = 40 Mpa and transfer is at 14 days
At transfer
Maximum permissible comp. stress (temporary)
= 0.5* [2.93 – 1.77 / sqrt (log1014)] * 40 / 1.459 = 17.50 Mpa
Maximum permissible tensile stress
= 0.1* permissible compressive stress = 1.75 Mpa
At service (permanent stress)
Maximum permissible comp. stress = 0.33 * fck
= 0.33 * 40
= 13.33 Mpa
No tensile stress is permitted in the concrete during service.
3.3.2 Check for shear (cl. 14 of IRC:18-2000)
The calculations for shear are only required for the ultimate load. At any section the ultimate
shear resistance of the concrete alone, Vc shall be considered for the section both un-cracked
and cracked in flexure irrespective of the magnitude of cracking moment (Mt) and the lesser
value taken.
Ultimate loads = 1.25 G + 2.0 SG + 2.5 Q (as per cl.12 of IRC:18-2000)
Here, G = permanent dead load
SG = superimposed dead load
Q = live load including impact

27
The shear force due to upward component of pre stress is deducted from the shear calculated
on the basis of ultimate loads.
Thus net shear force (V) = shear force due to ultimate Loads – Pisinθi
Where, Pi, θi are the pre stressing force and inclination of the ith cable.
The shear resistance of concrete for a section un-cracked in flexure is given by:
Vco = 0.67 b d sqrt (ft2 + 0.8 fcp ft) (cl..14.1.2 of IRC:18-2000)
Where, b = breath of web
d = overall depth
ft = maximum principle tensile stress given by 0.24√fck
fcp= comp. stress at centroidal axis due to prestress taken as positive
The shear resistance of concrete for a section cracked in flexure is given by:
Vcr = 0.037 b db √fck + (Mt/M) V (cl.14.1.3 of IRC:18-2000)
Where,
db = distance from the extreme compression fiber to the centroid of the tendons at the section
considered
Mt = cracking moment at the section considered
= (0.37√fck + 0.8fpt)I/y in which fpt is the stress due to pre stress only at the tensile fiber
distance y from the centroid of the concrete section which has second moment of area I i.e.
fpt = (P/A) + (P.e/Zbot)
V and M = shear and corresponding moment at the section considered due to ultimate load
Vcr = should be taken as not less than 0.1bd√fck.
Shear Reinforcement design:
If V < Vc/2, No shear reinforcement need to be provided.
If Vc/2 < V < Vc, Minimum shear reinforcement is provided such that,
(Asv / Sv) * (0.87 fyv / b) = 0.4 Mpa
If V > Vc, Shear reinforcement is provided such that,

28
(Asv / Sv) = (V – Vc) / (0.87 fyv dt)
Where,
fyv = yield strength of the link/shear reinforcement <= 415 Mpa
Asv = cross sectional area of two legs of a link
Sv = link spacing along the member
dt = depth from extreme compression fiber either to the longitudinal bars or to the centroid of
the tendons whichever is greater.
3.3.3 Check for Moment resistance of section
Moment due to ultimate loads is given by:-
Mult = 1.25 G + 2.0 SG + 2.5 Q (cl.12 of IRC:18-2000)
The moment of resistance of section can be calculated as under
1) When failure of section is by failure of steel (under reinforced section):
Mrult = 0.9 db As fp
Where,
As = the area of the high tensile steel
fp = the ultimate tensile strength for steel
db = depth of girder from the max. Compression edge to the center of gravity of the steel
tendons.
2) When failure of section is by crushing of concrete:
Mrult = 0.176 b db2 fck + 2/3 * 0.8 (Bf – b) (db – t/2) t fck
Where,
b = width of web
Bf = width of top flange
t = thickness of top flange
For safety, always Murlt > Mult

29
3.3.4 Check for serviceability – maximum deflection
There is no limit state mentioned in the present IRC Code for deflection. But as per IS:1343-
1980, for type 1 structure, deflection due to the prestressing force, dead load and any
sustained imposed load may be calculated using elastic analysis.
3.3.5 Check for cracking
As per cl. 19.3.1 of IS:1343-1980, the deflection is limited to:-
1. Span/250 for all loads including the effect of temp, creep and shrinkage.
2. Span/300 or 20 mm whichever is less. Including the effects of temp, creep and
shrinkage after erection of partitions.
3. Span/300 upward deflection of prestressed concrete member.
Limit state of serviceability-cracking gives three types of prestressed concrete member.
Type 1. No tensile stress allow
Type 2. Tensile stress allow but no visible cracking.
Type 3. Cracking is allowed.
There is no tensile stress permissible therefore it is a Type 1 design.

30
CHAPTER:-4
LONGITUDINAL AND TRANSVERSE ANALYSIS OF I GIRDER
SECTION
4.1 GENERAL
This part pertains to longitudinal analysis and design of PSC I girder section having effective
span of 40 m. longitudinal analysis contains of analysis for flexure and shear covering
following steps,
Step I : The calculation for sectional properties like area, moment of inertia, sectional
modulas etc for external and internal girders for end span and mid span section.
Step II : The detailed load calculations for dead load and live load are covered. Live load
bending moment and shear force for one internal girder is calculated using Matlab 7 program
for IRC Class AA, Class A and Class 70R loading at 1/8th, 1/4th, 3/8th, and at mid span section
Step III: For load distribution between outer and inner girders, courben’s method is used. The
loading considered is IRC Class A, Class AA, and Class 70R.
Step IV: Cross section of the girder and number of cables are assumed. The cable profile
assumed is parabolic with number of cables at mid span and at end span is 8. Each cable has
13T12 strands. The prestressing force of each cable is 140 kN. The prestressing is done in two
stages. At each stage, It is checked that the stresses are within permissible limits of IRC. More
over the check for shear and check for M.R of section is also verified as per IRC.
Step V: The calculation of losses are covered under this step, the losses covered are:
1. The loss of prestress due to Elastic shortening
2. Friction and slip loss
3. Creep and Shrinkage loss
4. Loss due to Relaxation of steel

31
Step VI: This step covers:
1. Design of deck slab
2. Design of diaphragm
3. Design of Anchor (end) block
4.2 DESIGN DATA
Fig 4.1 Half cross sectional view of I-type superstructure (all dimensions are in mm)
1 Carriage way width : 11.6 m (Three Lane)
2 Walk way width : 0.745 m
3. Total carriage way width : 14.65 m
4. Depth of I girder : 2.66 m
6. Wearing coat thickness : 0.08 m
7. Carriage way Live Loading
Case 1. Class A (Wheeled Vehicle) – Two lanes
Case 2. Class AA (Tracked Vehicle) – Single train
Case 3. Class 70R (Wheeled) – Single train
8. Grade of concrete : M40
9. Grade of steel : Fe415
10. Prestressing system : FREYSINET (12T13)
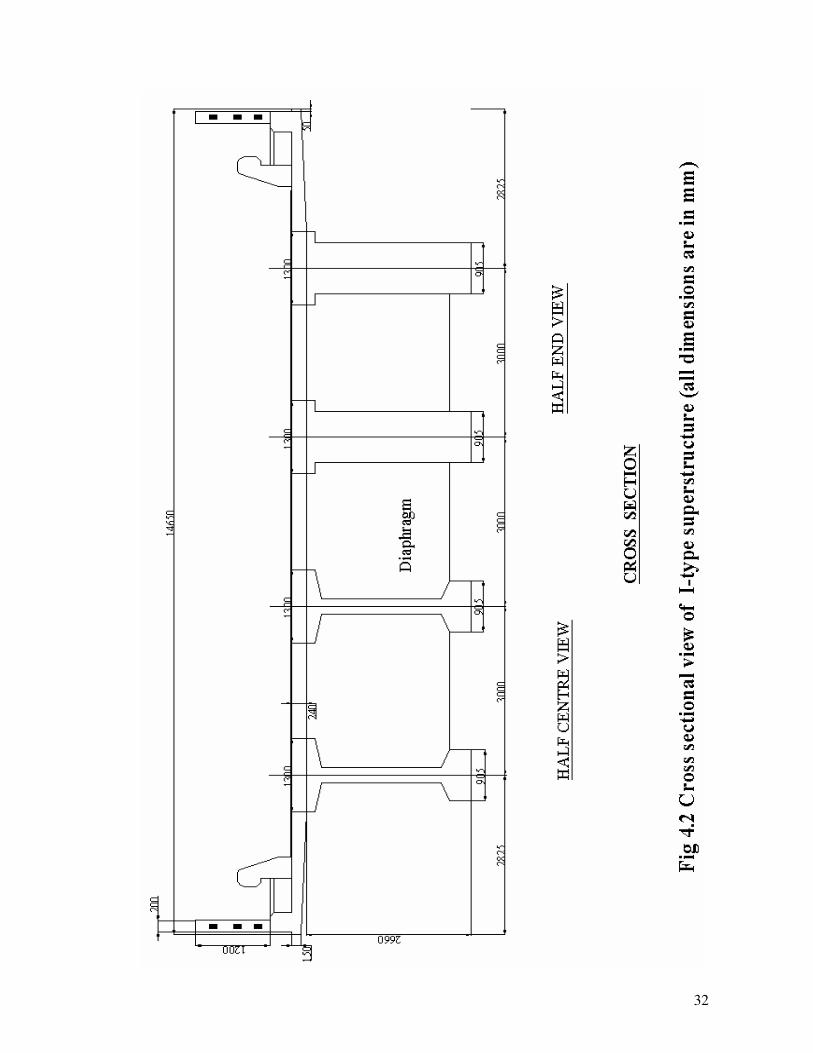
32
33
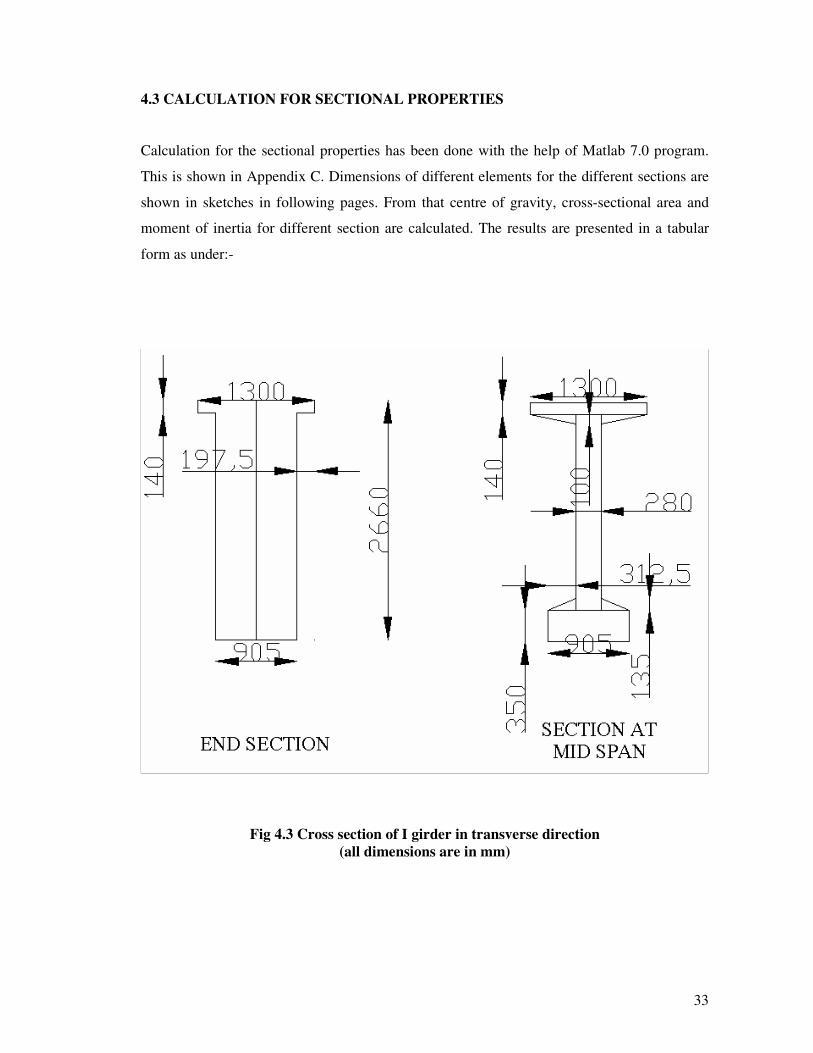
4.3 CALCULATION FOR SECTIONAL PROPERTIES
Calculation for the sectional properties has been done with the help of Matlab 7.0 program.
This is shown in Appendix C. Dimensions of different elements for the different sections are
shown in sketches in following pages. From that centre of gravity, cross-sectional area and
moment of inertia for different section are calculated. The results are presented in a tabular
form as under:-
Fig 4.3 Cross section of I girder in transverse direction
(all dimensions are in mm)

34
Table 4.1 Sectional properties calculations of I girder at support
Properties of Girder without Deck slab
AREA
m2
I
m4
Ytop
m
Ybottom
m
Ztop
m
Zbottom
m
1.74
1.00 1.19 1.47
0.84
0.68
Composite section (External girder)
AREA
m2
I
m4
Ytopslab
m
Ytopgirder
m
Ybottom
m
Ztopslab
m
Ztopgirder
m
Zbottom
m
2.71
2.07
0.96
0.80 1.93
2.15
1.95 1.07
Composite section (Internal girder)
AREA
m2
I
m4
Ytopslab
m
Ytopgirder
m
Ybottom
m
Ztopslab
m
Ztopgirder
m
Zbottom
m
2.46
1.88
1.04
0.98 1.61
1.79
1.68 1.16
35
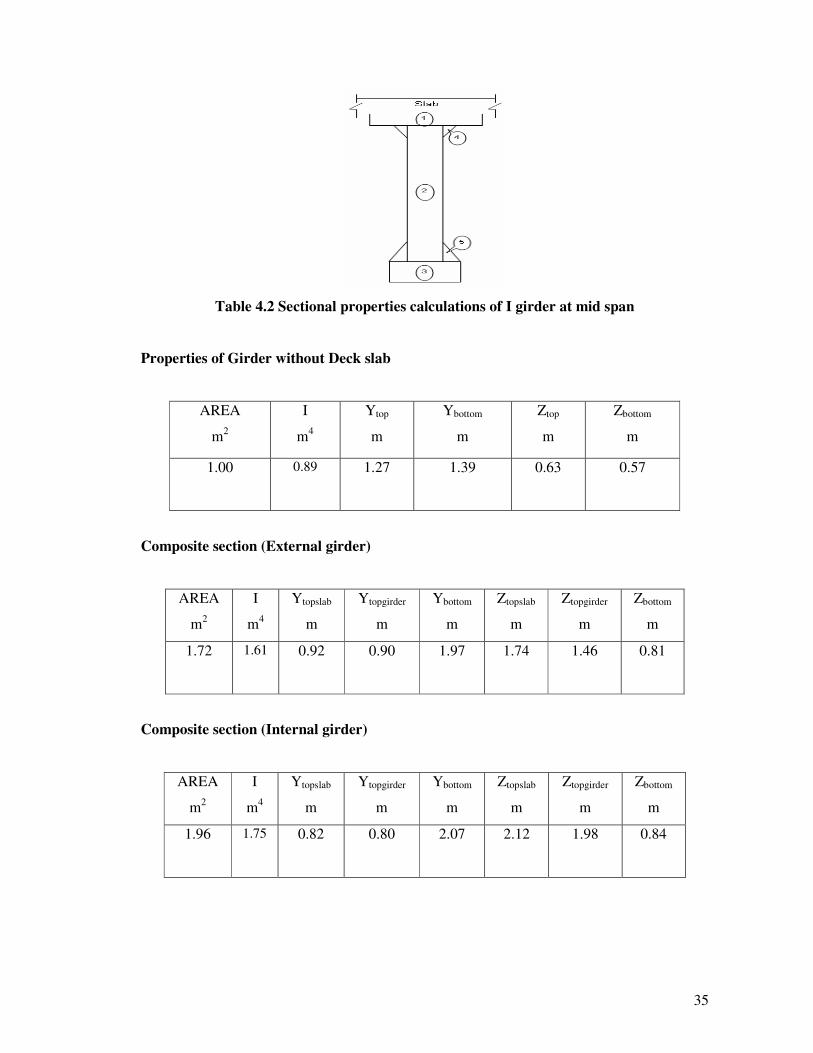
Table 4.2 Sectional properties calculations of I girder at mid span
Properties of Girder without Deck slab
AREA
m2
I
m4
Ytop
m
Ybottom
m
Ztop
m
Zbottom
m
1.00
0.89
1.27
1.39
0.63
0.57
Composite section (External girder)
AREA
m2
I
m4
Ytopslab
m
Ytopgirder
m
Ybottom
m
Ztopslab
m
Ztopgirder
m
Zbottom
m
1.72 1.61 0.92 0.90 1.97 1.74
1.46 0.81
Composite section (Internal girder)
AREA
m2
I
m4
Ytopslab
m
Ytopgirder
m
Ybottom
m
Ztopslab
m
Ztopgirder
m
Zbottom
m
1.96
1.75
0.82
0.80 2.07
2.12
1.98 0.84

4.5.1 Calculation of Dead loads Bending moment and Shear force
1. Self weight of girder
u.d.l. = area of uniform section x density of concrete
Here area of section at mid span = 1.0031 m2
u.d.l. = 1.0031 x 25 = 25.08 kN/m
area of section at support = 1.7444 m2
web widening at support = 1.7444 x 25 = 43.61 kN/m
intermediate stiffner = [ 1.3+0.650 x 2.66 - 1.0031] x 0.280 x 25
2
= 11.13 kN
end stiffner = [ 1.3 x 2.66 - 1.7444 ] x 0.3 x 25
= 12.852 kN
25.08 kN/m
0.5 1.9 0.5 1.9
5 5 5 5 5 5 5
B.M. due to self weight of girder
RA = 516.109 kN
B.M. at L/2 = 3914.027 kN.m
2. Cast in situ diaphragms and slab load
cast in situ intermediate = [ 1.775+2.1 x 2.26 + (1.775x.15)] x 0.275 x 25
diaphragm 2
= 31.93438 kN
Load on internal girder = 31.93438 kN
Load on external girder = 15.96719 kN
cast in situ end diaphragm = 1.775 x 2.41 x 0.3 x 25
= 32.08313 kN
Load on internal girder = 32.08313 kN
Load on external girder = 16.04156 kN
Cast in situ deck slab
Load on internal girder = 3 x 0.24 x 25 = 18 kN/m
Load on external girder = 4.025 x 0.24 x 25 = 24.15 kN/m
L/8 L/2L/4 3L/8
43.61 kN/m
6.426kN11.13kN 11.13kN 11.13kN 6.426kN
RA RB
11.13kN
39
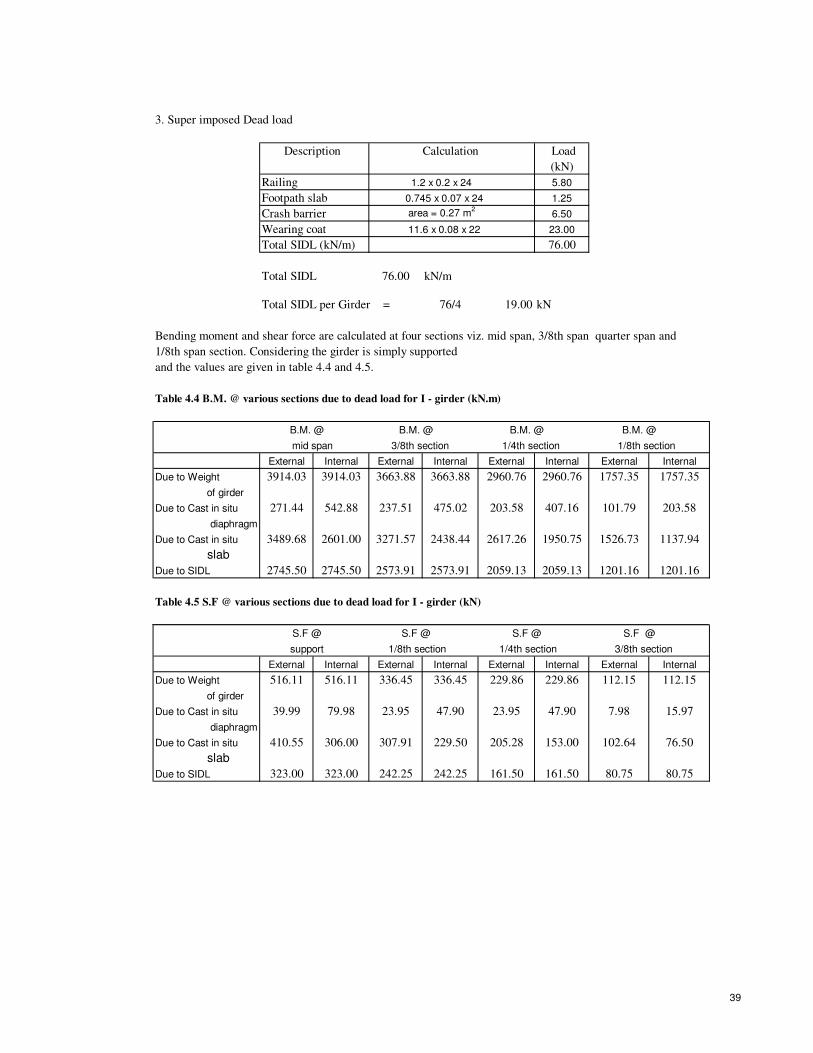
3. Super imposed Dead load
Description Calculation Load
(kN)
Railing 5.80
Footpath slab 0.745 x 0.07 x 24 1.25
Crash barrier area = 0.27 m2
6.50
Wearing coat 11.6 x 0.08 x 22 23.00
Total SIDL (kN/m) 76.00
Total SIDL 76.00 kN/m
Total SIDL per Girder = 76/4 19.00 kN
Bending moment and shear force are calculated at four sections viz. mid span, 3/8th span quarter span and
1/8th span section. Considering the girder is simply supported
and the values are given in table 4.4 and 4.5.
Table 4.4 B.M. @ various sections due to dead load for I - girder (kN.m)
B.M. @ B.M. @ B.M. @ B.M. @
mid span 3/8th section 1/4th section 1/8th section
External Internal External Internal External Internal External Internal
Due to Weight 3914.03 3914.03 3663.88 3663.88 2960.76 2960.76 1757.35 1757.35
of girder
Due to Cast in situ 271.44 542.88 237.51 475.02 203.58 407.16 101.79 203.58
diaphragm
Due to Cast in situ 3489.68 2601.00 3271.57 2438.44 2617.26 1950.75 1526.73 1137.94
slab
Due to SIDL 2745.50 2745.50 2573.91 2573.91 2059.13 2059.13 1201.16 1201.16
Table 4.5 S.F @ various sections due to dead load for I - girder (kN)
S.F @ S.F @ S.F @ S.F @
support 1/8th section 1/4th section 3/8th section
External Internal External Internal External Internal External Internal
Due to Weight 516.11 516.11 336.45 336.45 229.86 229.86 112.15 112.15
of girder
Due to Cast in situ 39.99 79.98 23.95 47.90 23.95 47.90 7.98 15.97
diaphragm
Due to Cast in situ 410.55 306.00 307.91 229.50 205.28 153.00 102.64 76.50
slab
Due to SIDL 323.00 323.00 242.25 242.25 161.50 161.50 80.75 80.75
1.2 x 0.2 x 24
39

38
4.5 LOAD CALCULATION
Dead Load
The dead load carried out by a bridge consists of its own weight, weight of diaphragm,
wearing coat, footpath, railing and crash barrier. After considering all the weights Bending
moments and Shear force at different sections has been calculated.
Live Load
Live load is taken as per cl. 207 of IRC: 6-2000. Live load Bending moment and Shear force
has been calculated by using Matlab 7.0 program. The program finds out the position of axles
for Class 70R, Class AA and Class A for maximum Bending moment and shear at different
sections.

Shear force due to Live load
At support section
a) CLASS AA (TRACKED VEHICLE)
700 kN
40
S.F = 733.5 KN
b) CLASS A TWO LANE (WHEELED VEHICLE)
1.2 4.3 3 3 3 25.5
40
S.F = 472.9 kN
c) CLASS 70R (WHEELED VEHICLE)
1.37 3.05 1.37 2.13 1.52 3.96 26.6
40
S.F = 953.7 kN
At quarter span
a) CLASS AA (TRACKED VEHICLE)
700 kN
10 3.6 26.4
S.F = 541 kN
b) CLASS A TWO LANE (WHEELED VEHICLE)
5.7 3.2 1.2 4.3 3 3 3 15.5
10 30
S.F = 381 kN
114kN 114kN 68kN 68kN 68kN 68kN
170kN 170kN 170kN 170kN 120kN 120kN 80kN
27kN 27kN 114kN 114kN 68kN 68kN 68kN 68kN
45

c) CLASS 70R (WHEELED VEHICLE)
1.37 3.05 1.371.37 2.13 1.52 3.96 16.6
10 30
S.F = 678.1 kN
At section 1/8 span
a) CLASS AA (TRACKED VEHICLE)
700 kN
5 3.6 31.4
S.F = 637.3 kN
b) CLASS A TWO LANE (WHEELED VEHICLE)
1.8 3.2 1.2 4.3 3 3 3 20.5
5 35
S.F = 397.8 kN
c) CLASS 70R (WHEELED VEHICLE)
5 1.37 3.05 1.37 2.13 1.52 3.96 21.6
5 35
S.F = 815.9 kN
At section 3/8 span
a) CLASS AA (TRACKED VEHICLE)
700 kN
15 3.6 21.4
S.F = 421.2 kN
27kN 114kN 114kN 68kN 68kN 68kN 68kN
170kN 170kN 170kN 170kN 120kN 120kN 80kN
170kN 170kN 170kN 170kN 120kN 120kN 80kN
45
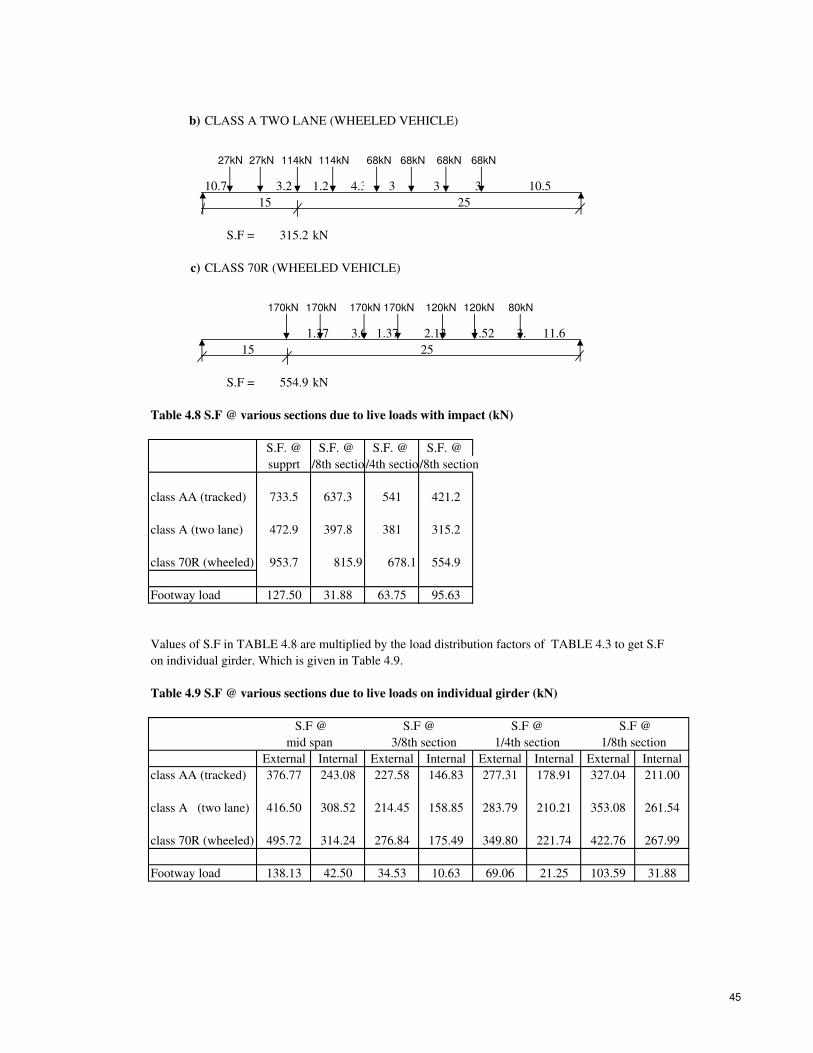
b) CLASS A TWO LANE (WHEELED VEHICLE)
10.7 3.2 1.2 4.3 3 3 3 10.5
15 25
S.F = 315.2 kN
c) CLASS 70R (WHEELED VEHICLE)
1.37 3.05 1.37 1.37 2.13 1.52 3.96 11.6
15 25
S.F = 554.9 kN
Table 4.8 S.F @ various sections due to live loads with impact (kN)
S.F. @ S.F. @ S.F. @ S.F. @
supprt 3/8th section1/4th section1/8th section
class AA (tracked) 733.5 637.3 541 421.2
class A (two lane) 472.9 397.8 381 315.2
class 70R (wheeled) 953.7 815.9 678.1 554.9
Footway load 127.50 31.88 63.75 95.63
Values of S.F in TABLE 4.8 are multiplied by the load distribution factors of TABLE 4.3 to get S.F
on individual girder. Which is given in Table 4.9.
Table 4.9 S.F @ various sections due to live loads on individual girder (kN)
S.F @ S.F @ S.F @ S.F @
mid span 3/8th section 1/4th section 1/8th section
External Internal External Internal External Internal External Internal
class AA (tracked) 376.77 243.08 227.58 146.83 277.31 178.91 327.04 211.00
class A (two lane) 416.50 308.52 214.45 158.85 283.79 210.21 353.08 261.54
class 70R (wheeled) 495.72 314.24 276.84 175.49 349.80 221.74 422.76 267.99
Footway load 138.13 42.50 34.53 10.63 69.06 21.25 103.59 31.88
27kN 27kN 114kN 114kN 68kN 68kN 68kN 68kN
170kN 170kN 170kN 170kN 120kN 120kN 80kN
45

48
4.6 CABLE NUMBERS, THEIR ARRANGEMENT, FRICTION AND SLIP FORCES
Assuming total cable numbers and their position at mid span section and in end span section
in I girder with parabolic cable profile and two stages in which cables are prestressed, then
final stresses at top and bottom at transfer and service condition are checked. If these stresses
are within the permissible limit. Detailed cable forces and losses calculation is carried out and
section is further checked for shear and M.R of the section. The details of prestressing cables
with their eccentricities given in Appendix B of Fig no 2/3.
All the cables are having parabolic, so vertical component of prestressing force will help to
counteract to some amount of shear force. The position of cables at end and at midspan is
shown in Fig no. 4.4. There are totally eight cables used. Each cable transfers prestressing
force of 140 kN.
The minimum spacing of cables has been kept 150 mm.

4.6.1 Cable numbers and their arrangement
Assuming 8 cables of 12 strands. The diameter of each strands is 12.7 mm.
Prestressing will be carried out in two stages. In the first stage first 6
cables will be prestressed and in the second stage remaning 2 cables
will prestressed.
Assumed section & cable profile is then checked at mid span and at end span for
( i ) Stresses at top and bottom ( at transfer condition )
( ii ) Stresses at top and bottom ( at service condition )
4.6.2 Permissible stresses at top and bottom at transfer
and service condition (mid and end span)
4.6.2.1 Permissible stress at transfer condition at top and bottom (mid span)
Concrete strength on 14th day is 35040 kN/m2
As per cl. 7 of IRC : 18 -2000 permissible compression for
M40 grade concrete :
= 0.50 X 35040 = 17520 kN/m2
4.6.2.2 Permissible stress at transfer condition at top
(mid and end span)
Concrete strength on 14th
day is 35040 kN/m2
As per cl. 7 of IRC : 18 -2000 permissible compression for
M40 grade concrete :
= 0.50 X 35040 = 17520 kN/m2
4.6.2.3 Permissible stress at service condition at top and bottom
(mid and end span)
As per cl. 7 of IRC : 18 - 2000 permissible compression for
M40 grade concrete :
= 0.33 X 40000 = 13200 kN/m2
49

4.6.3 Sectional properties of girder at STAGE I and STAGE II
STAGE I Section at
Support L/2
I moment of inertia (m4) 1.51 1.01
Area (m2) 2.46 1.16
Ytop (m) 1.30 1.41
Ybottom (m) 1.22 1.25
Ztop (m3) 1.16 0.71
Zbottom (m3) 1.24 0.81
Eccentricity of cables Ist stage (m) 0.37 1.03
Moment due to Self wt. of girder (kN.m) (Md) 0.00 5846.20
No. of cables STAGE I 6 6
STAGE II Section at
Composite section Support L/2
I moment of inertia (m4) 3.00 2.04
Area (m2) 3.16 1.86
Ytop (m) 1.56 1.07
Ybottom (m) 1.33 1.82
Ztop of slab (m3) 1.90 1.90
Ztop of girder (m3) 2.25 2.45
Zbottom of girder (m3) 1.53 1.11
Eccentricity of cables IInd
stage (m) -0.80 1.14
Eccentricity of cables all cables (m) 0.17 1.49
Moment due to Live Load (kN.m) (Ml) 0.00 9419.00
No. of cables STAGE II 2.00 2.00
Check for stresses at transfer condition at top (mid span)
For 12T13 strands as per cl. 8 of IRC : 18-2000
minimum breaking force/strand = 183.75 kN
0.75 X braking force = 137 kN (as IS : 6006-1965)
P1=137 X 12 X 6 = 9864 kN
49
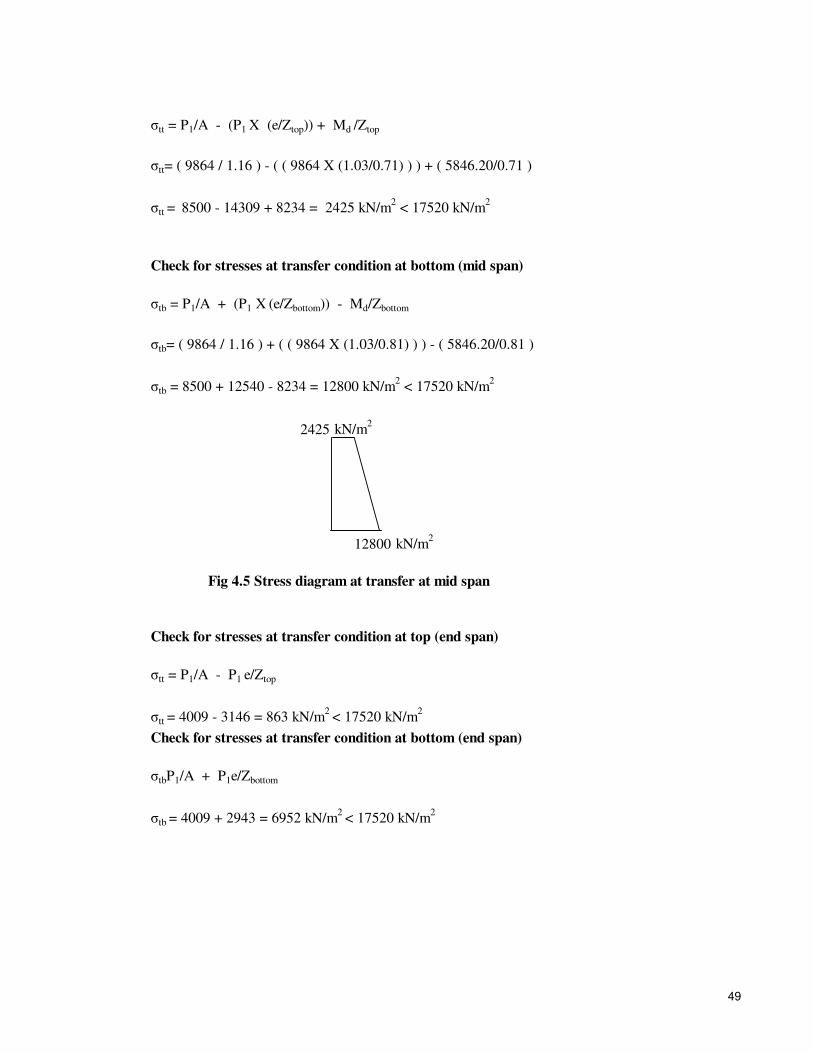
σtt = P1/A - (P1 X (e/Ztop)) + Md /Ztop
σtt= ( 9864 / 1.16 ) - ( ( 9864 X (1.03/0.71) ) ) + ( 5846.20/0.71 )
σtt = 8500 - 14309 + 8234 = 2425 kN/m2 < 17520 kN/m
2
Check for stresses at transfer condition at bottom (mid span)
σtb = P1/A + (P1 X (e/Zbottom)) - Md/Zbottom
σtb= ( 9864 / 1.16 ) + ( ( 9864 X (1.03/0.81) ) ) - ( 5846.20/0.81 )
σtb = 8500 + 12540 - 8234 = 12800 kN/m2 < 17520 kN/m2
2425 kN/m2
12800 kN/m2
Fig 4.5 Stress diagram at transfer at mid span
Check for stresses at transfer condition at top (end span)
σtt = P1/A - P1 e/Ztop
σtt = 4009 - 3146 = 863 kN/m2 < 17520 kN/m2
Check for stresses at transfer condition at bottom (end span)
σtbP1/A + P1e/Zbottom
σtb = 4009 + 2943 = 6952 kN/m2 < 17520 kN/m2
49

863 kN/m2
+
6952 kN/m2
Fig 4.6 Stress diagram at transfer at end span
Check for stresses at service condition at top (mid span)
P2 = 137 X 12 X 2 = 3288 kN
Assuming 20% loss in posttensioning for both Ist and IInd stage prestressing.
σst = 0.8P1/A + P2/A - (0.8P1 X (e/Ztop)) - P2e/Ztop + Md/Ztop + Ml/Ztop
σst= ( 0.8 X 9864 / 1.16 ) + 3288 / 1.86 - ( ( 0.8 X 9864 X (1.03 / 1.9 ) ) -
( 3288 X 1.14 / 1.9 ) + ( 5846.20 / 1.9 ) + ( 9419 / 1.9 )
σst = 6802 + 1767 - 4277 - 1972 + 3076 + 4957 = 10353 kN/m2<13200kN/m
2
Check for stresses at service condition at bottom (mid span)
σsb = 0.8 P1/A + P2/A + 0.8P1e/Zb + P2e/Zb - Md/Zb - Ml/Zb
σsb= ( 0.8 X 9864 / 1.16 ) + 3288 / 1.86 + ( ( 0.8 X 9864 X (1.03 / 1.11 ) ) +
( 3288 X 1.14 / 1.11 ) - ( 5846.20 / 1.11 ) - ( 9419 / 1.11 )
σsb =6802 +1767 + 7322 + 3376 - 5266 - 8485 =5515 kN/m2<13200kN/m2
49

10353 kN/m2
+
5515 kN/m2
Fig 4.7 Stress diagram at service at mid span
Check for stresses at service condition at top (end span)
σst= 0.8 P1/A + P2/A - 0.8P1e/Zt - P2e/Zt
σst = 3207 + 1040 - 4277 - 1972 = 2320 kN/m2
< 13200 kN/m2
Check for stresses at service condition at bottom (end span)
σsb = 0.8 P1/A + P2/A + 0.8P1e/Zb + P2e/Zb
σsb = 3207 + 1040 + 5312 + 2449 = 12008 kN/m2 < 13200 kN/m2
2320 kN/m2
+
12008 kN/m2
Fig 4.8 Stress diagram at service condition at end span
49
54
4.7 CALCULATION OF LOSSES
In this section Losses due to elastic shortening, Creep, Shrinkage and relaxation are calculated
and from that stresses at different sections are also calculated. Creep and Shrinkage co-
efficient are selected from IRC:18-2000.
Prestressing stages:
Stage 1: Nos. 1, 2, 3, 4, 5, 6 will be stressed at 14th day after casting of girder.
Stage 2: Nos. 7 and 8 will be stressed at 56th day after casting of girder or 21th days of casting of deck slab and cross girder.

4.7.1 Calculation Friction and Slip losses for each cable (as per cl. 11.6 of IRC : 18-2000)
Table 4.10 Geometry of cable (m)
Distance Distance hz. len of h=A-B 2 x h change in
Cable from from parabolic hz. len angle
bottom at bottom at profile t (radian)
end span mid span
(A) (B)
8 2.27 0.76 20.30 1.51 0.14828 0.14720
7 1.99 0.61 20.30 1.38 0.13596 0.13513
6 1.72 0.46 20.30 1.26 0.12365 0.12302
5 1.17 0.26 20.30 0.91 0.08916 0.08893
4 0.89 0.26 20.30 0.63 0.06207 0.06199
3 0.62 0.11 20.30 0.51 0.04975 0.04971
2 0.34 0.11 20.30 0.23 0.02266 0.02266
1 0.34 0.11 20.30 0.23 0.02266 0.02266
Table 4.11 Ordinates of cable at different sections (m)
Cable end c/l bearing L/8 L/4 3L/8 L/2
0 0.3 5.3 10.3 15.3 20.3
8 2.27 2.22 1.58 1.13 0.85 0.76
7 1.99 1.95 1.36 0.94 0.69 0.61
6 1.72 1.68 1.15 0.76 0.54 0.46
5 1.17 1.14 0.75 0.48 0.31 0.26
4 0.89 0.87 0.60 0.41 0.30 0.26
3 0.62 0.60 0.39 0.23 0.14 0.11
2 0.34 0.33 0.24 0.17 0.12 0.11
1 0.34 0.33 0.24 0.17 0.00 0.11
DISTANCE FROM BOTTOM AT DIFFERENT SECTIONS
55

Table 4.12 Angle made by the tangent (Radian)
Section at Section at
Cable end c/l bearing L/8 L/4 3L/8 L/2
0 0.3 5.3 10.3 15.3 20.3
8 0.15 0.15 0.11 0.07 0.04 0
7 0.14 0.13 0.10 0.07 0.03 0
6 0.12 0.12 0.09 0.06 0.03 0
5 0.09 0.09 0.07 0.04 0.02 0
4 0.06 0.06 0.05 0.03 0.02 0
3 0.05 0.05 0.04 0.02 0.01 0
2 0.02 0.02 0.02 0.01 0.01 0
1 0.02 0.02 0.02 0.01 0.01 0
Table 4.13 Calculation of stresses after friction loss ( as per cl. 11.6 of IRC : 18-2000)
Cable 8 ( The detailed calculations are shown on Page 57 )
Section Distance kL θv µθv x = kL+µθv F=ex
from
End(m)
c/cbearing 0.3 0.001 0.15 0.03652 0.038 1.04
L/8 5.3 0.024 0.11 0.02739 0.052 1.05
L/4 10.3 0.047 0.07 0.01826 0.066 1.07
3L/8 15.3 0.070 0.04 0.00913 0.080 1.08
L/2 20.3 0.093 0.00 0.00000 0.093 1.10
Cable 7
Section Distance kL θv µθv x = kL+µθv F=ex
from
End(m)
bearing 0.3 0.001 0.13 0.03 0.03 1.04
L/8 5.3 0.024 0.10 0.03 0.05 1.05
L/4 10.3 0.047 0.07 0.02 0.06 1.07
3L/8 15.3 0.070 0.03 0.01 0.08 1.08
L/2 20.3 0.093 0.00 0.00 0.09 1.10
Cable 6
Section Distance kL θv µθv x = kL+µθv F=ex
from
End(m)
bearing 0.3 0.001 0.12 0.03 0.03 1.03
L/8 5.3 0.024 0.09 0.01 0.04 1.04
L/4 10.3 0.047 0.06 0.00 0.05 1.05
3L/8 15.3 0.070 0.03 0.00 0.07 1.07
L/2 20.3 0.093 0.00 0.00 0.09 1.10
55

55

Sample Calculation
For section at L/2 (Cable 8)
Taking wobble coefficient per m length of steel (k) = 0.0046
Coefficient of friction (µ) = 0.25
Distance form end (L) = 20.3 m
kL = 0.0046 X 20.3 = 0.09338
θv = 0 (at mid span cumulative angle change will zero)
µθv = 0
x= kL + µθv = 0.09338 + 0 = 0.09338
F = ex = 1.10
stress = ( 183.75 X 0.75 / 98.7 ) = 1.38 kN/mm2
Now after friction loss
Stress = 1.38 / 1.10 = 1.26 kN/mm2 (per strand)
End section Mid section
Fig 4.9 Profile of cable number 8
Cable 5
Section Distance kL θv µθv x = kL+µθv F=ex
from
End(m)
bearing 0.3 0.001 0.09 0.02 0.02 1.02
L/8 5.3 0.023 0.07 0.02 0.04 1.04
L/4 10.3 0.046 0.04 0.01 0.06 1.06
3L/8 15.3 0.069 0.02 0.01 0.07 1.08
L/2 20.3 0.092 0.00 0.00 0.09 1.10
55

Cable 4
Section Distance kL θv µθv x = kL+µθv F=ex
from
End(m)
bearing 0.3 0.001 0.06 0.02 0.02 1.02
L/8 5.3 0.024 0.05 0.01 0.04 1.04
L/4 10.3 0.047 0.03 0.01 0.06 1.06
3L/8 15.3 0.070 0.02 0.00 0.07 1.08
L/2 20.3 0.093 0.00 0.00 0.09 1.10
Cable 3
Section Distance kL θv µθv x = kL+µθv F=ex
from
End(m)
bearing 0.3 0.001 0.05 0.01 0.01363 1.01
L/8 5.3 0.024 0.04 0.01 0.03357 1.03
L/4 10.3 0.047 0.02 0.01 0.05351 1.05
3L/8 15.3 0.070 0.01 0.00 0.07344 1.08
L/2 20.3 0.093 0.00 0.00 0.09 1.10
Cable 1 & 2
Section Distance kL θv µθv x = kL+µθv F=ex
from
End(m)
bearing 0.3 0.00 0.02 0.01 0.01 1.01
L/8 5.3 0.02 0.02 0.00 0.03 1.03
L/4 10.3 0.05 0.01 0.00 0.05 1.05
3L/8 15.3 0.07 0.01 0.00 0.07 1.07
L/2 20.3 0.09 0.00 0.00 0.09 1.10
55

4.7.2 Summary of Force at different section after Friction and Slip loss
Section at
support L/8 L/4 3L/8
Cable 8
Prestressing force (kN) 1428.20 1449.90 1471.40 1492.50
Horz.component (kN) 1412.89 1441.15 1467.45 1491.50
Vert.component (kN) 208.58 159.07 107.74 54.68
Cable 7
Prestressing force (kN) 1428.60 1451.70 1474.40 1496.80
Horz.component (kN) 1415.80 1444.38 1471.09 1495.96
Vert.component (kN) 189.08 144.86 98.45 50.09
Cable 6
Prestressing force (kn) 1429.10 1453.40 1477.30 1500.80
Horz.component (kN) 1418.43 1447.29 1474.54 1500.10
Vert.component (kN) 174.34 133.13 90.28 45.88
Cable 5
Prestressing force (kN) 1431.20 1459.00 1486.30 1513.20
Horz.component (kN) 1425.62 1455.80 1484.85 1512.83
Vert.component (kN) 126.25 96.59 65.62 33.41
Cable 4
Prestressing force (kN) 1433.30 1464.00 1494.10 1523.70
Horz.component (kN) 1430.62 1462.46 1493.40 1523.52
Vert.component (kN) 87.59 67.12 45.68 23.29
Cable 3
Prestressing force (kN) 1434.30 1466.30 1497.60 1527.50
Horz.component (kN) 1432.54 1465.29 1497.14 1527.38
Vert.component (kN) 70.97 54.43 37.06 18.90
Cable 1 & 2
Prestressing force (kN) 1437.00 1471.90 1506.00 1530.10
Horz.component (kN) 1436.64 1471.69 1505.91 1530.08
Vert.component (kN) 32.55 24.64 16.81 8.54
First stage prestressing 12T13 1,2,3,4,5,6 n1 = 6 nos
Second stage prestressing 12T13 7,8 n2 = 2 nos
Total force after friction and slip STAGE I
Prestressing force (kN) 8601.90 8786.50 8967.30 9125.40
Horz.component (kN) 8580.49 8774.23 8961.74 9123.99
Vert.component (kN) 524.27 400.55 272.27 138.57
Total force after friction and slip STAGE 2
Prestressing force (kN) 2856.80 2901.60 2945.80 2989.30
Horz.component (kN) 2828.69 2885.53 2938.54 2987.46
Vert.component (kN) 397.66 303.93 206.19 104.76
Eccentricity of group of cables from bottom of Girder
First stage (m) 0.84 0.05 0.03 0.02
Second stage (m) 2.13 1.47 1.04 0.77
For all cables (m) 1.17 0.79 0.54 0.37
55
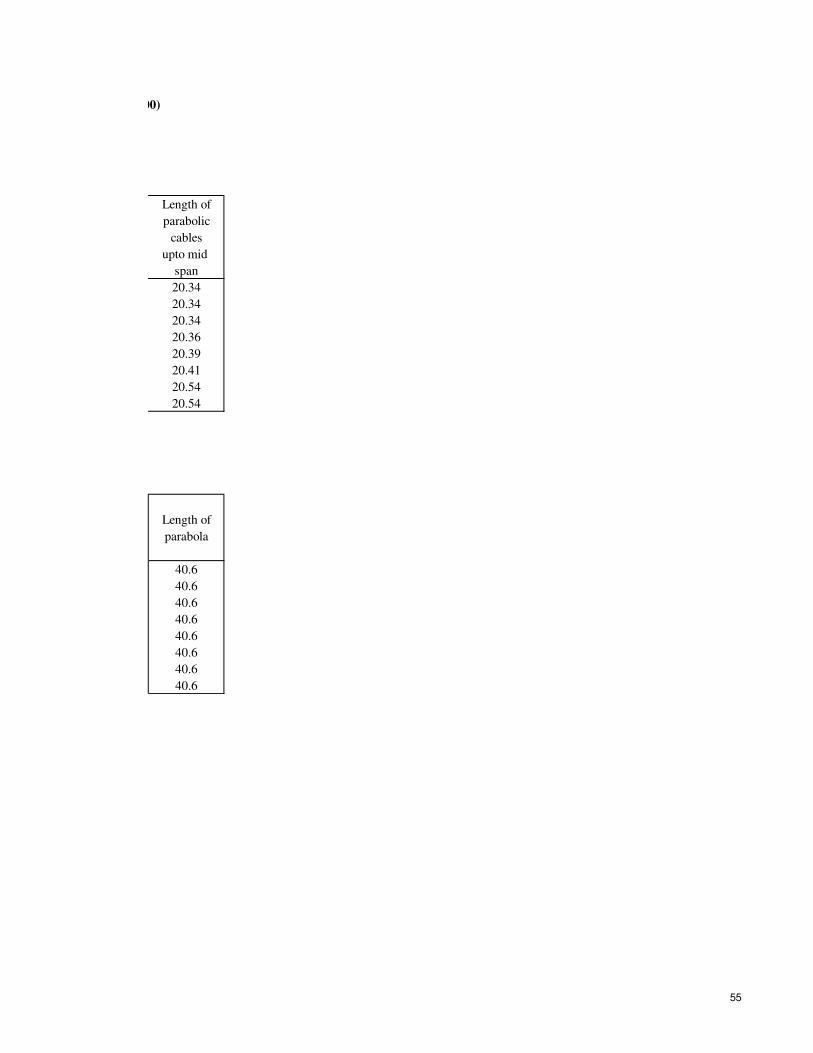
4.7.1 Calculation Friction and Slip losses for each cable (as per cl. 11.6 of IRC : 18-2000)
Length of
parabolic
cables
upto mid
span
20.34
20.34
20.34
20.36
20.39
20.41
20.54
20.54
Length of
parabola
40.6
40.6
40.6
40.6
40.6
40.6
40.6
40.6
55
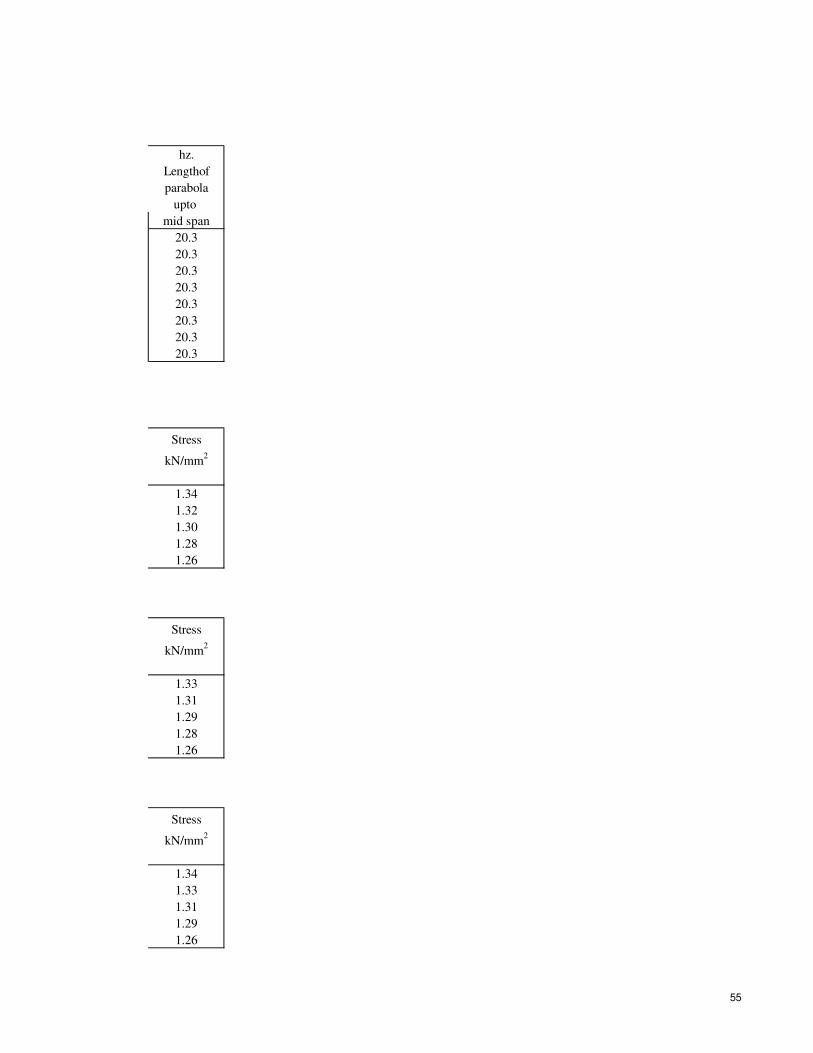
hz.
Lengthof
parabola
upto
mid span
20.3
20.3
20.3
20.3
20.3
20.3
20.3
20.3
Stress
kN/mm2
1.34
1.32
1.30
1.28
1.26
Stress
kN/mm2
1.33
1.31
1.29
1.28
1.26
Stress
kN/mm2
1.34
1.33
1.31
1.29
1.26
55

55
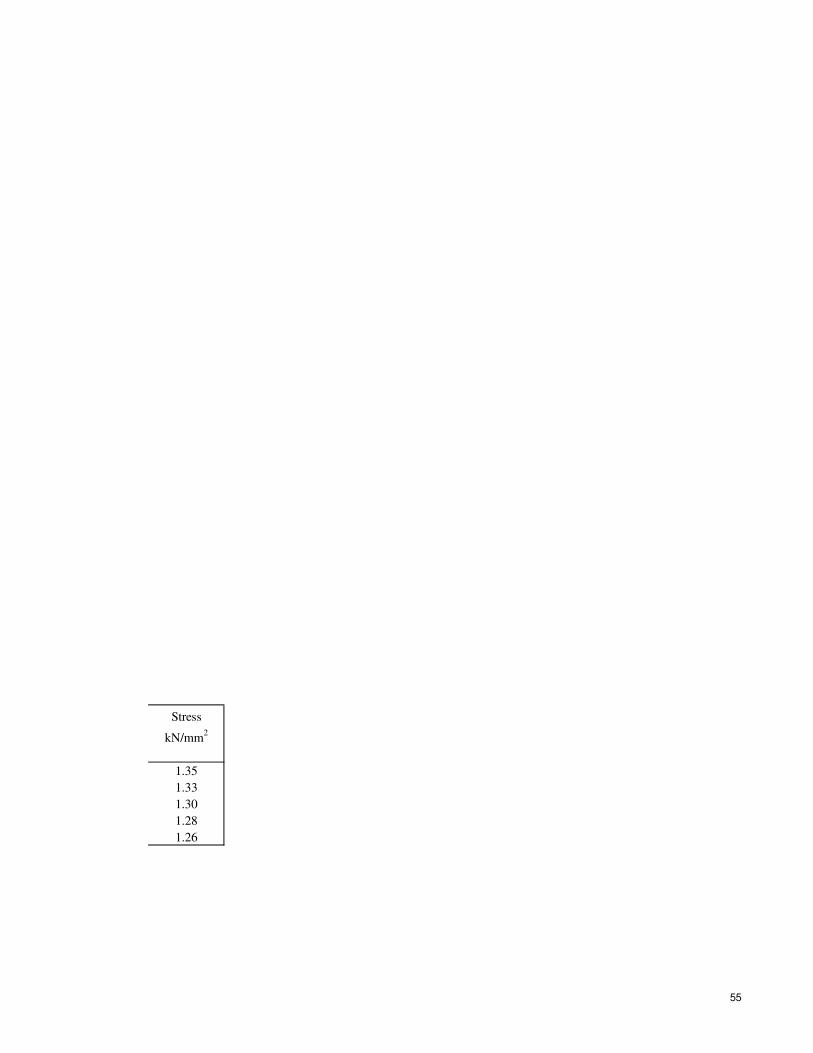
Stress
kN/mm2
1.35
1.33
1.30
1.28
1.26
55
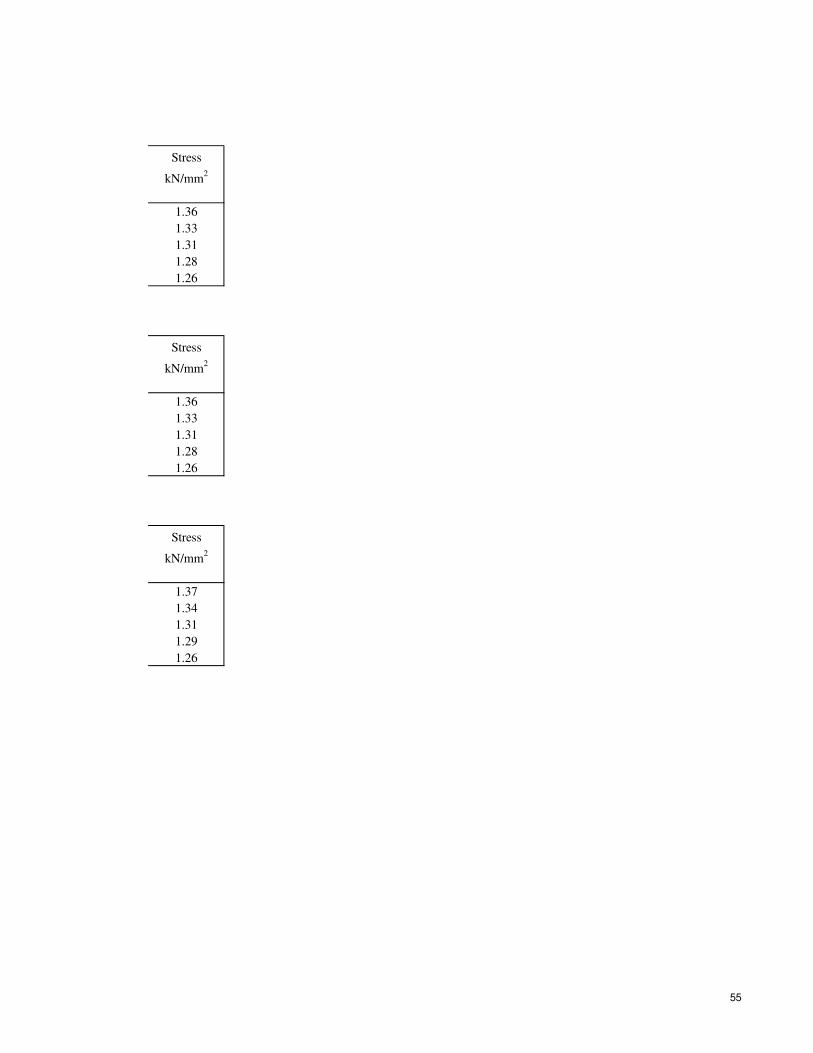
Stress
kN/mm2
1.36
1.33
1.31
1.28
1.26
Stress
kN/mm2
1.36
1.33
1.31
1.28
1.26
Stress
kN/mm2
1.37
1.34
1.31
1.29
1.26
55
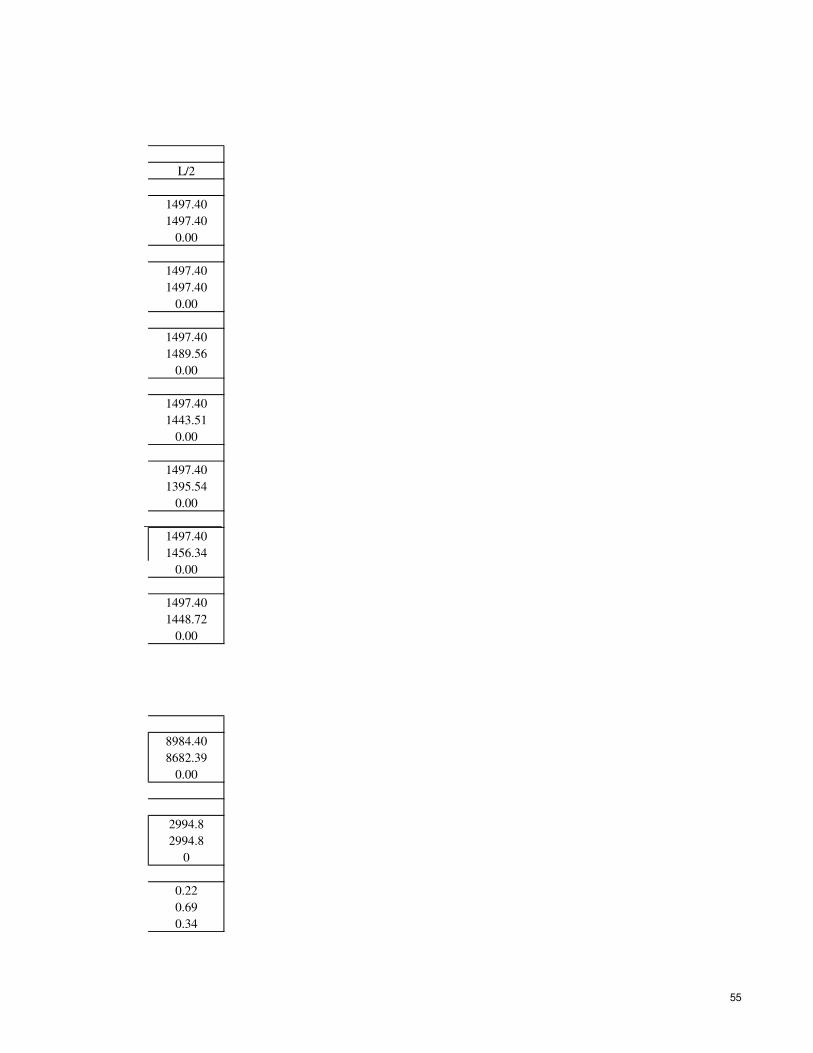
L/2
1497.40
1497.40
0.00
1497.40
1497.40
0.00
1497.40
1489.56
0.00
1497.40
1443.51
0.00
1497.40
1395.54
0.00
1497.40
1456.34
0.00
1497.40
1448.72
0.00
8984.40
8682.39
0.00
2994.8
2994.8
0
0.22
0.69
0.34
55

55

55

55

55

55

55

CHAPTER:-5
DESIGN OF SLAB, DIAPHRAGM AND END BLOCK
5.1 LOAD CALCULATION FOR TRANSVERSE ANALYSIS OF DECK SLAB
The design of deck slab is carried out for heaviest loading of IRC 70R, 40t bogi. For
maximum positive moment Class 70R, 40t bogi placed at centre of span and for
maximum negative moment Class 70R, 40t bogi placed at centre of support. Analysis
is carried out using STAAD Pro 2003. Input file for the same is shown in Appendix A.
5.1.1 Dead load calculation
1 Calculation of loads & moment at cantilever throat
530 745
80 mm thk wearing coat
240
Dead load of slab
Description Calculation Load(kN) L.A.(m) Moment
(kN.m)
Deck slab (Rect 1) 2.685 x 0.15 x 25 10.07 1.34 13.52
Deck slab (Tri) 0.5(2.175x0.09x25) 2.44 0.73 1.77
Deck slab (Rect 2) 0.510 x 0.24 x 25 3.06 0.26 0.78
Total 15.57 1.03 16.07
Super imposed dead load
Description Calculation Load(kN) L.A.(m) Moment
(kN.m)
Railing 1.2 x 0.2 x 24 5.80 2.51 14.56
Outer kerb 0.35 x 0.35 x 24 2.94 2.51 7.38
Inner kerb 0.35 x 0.225 x 24 1.90 1.57 2.97
Footpath slab 0.745 x 0.07 x 24 1.26 2.11 2.66
Wearing coat 0.08 x 1.210 x 22 2.13 0.61 1.29
Total 14.03 28.86
350
200
1200
350
2825
150
70mm thk
67

2 Calculation of load and moment for internal slab.
weight of slab = 0.24 x 25 6 kN/m
weight of wearing coat = 0.08 x 22 1.76 kN/m
Total weight = 7.76 kN/m
7.76 kN/m
3 m 3 m 3 m
From STAAD.Pro 2003 output
Max +ve moment(span moment) 5.52 kN-mMax -ve moment (support moment) 6.97 kN-m
5.1.2 Live load calculation for I girder deck slab
1. Calculation of loads & moment at cantilever throat
57kN
0.76
b1 250
plan of wheel loading
As per cl. 305.16.2 of IRC:21-2000 for cantilever solid slab
bef = 1.2a + b1
here, a = 0.76
b1 = 0.25 + (2 x 0.08) = 0.41
bef = 1.322 m
Load/m. longitudinal run, w = 57/1.322
= 43.12 kN
Class A11.4 t wheel
500 150
67
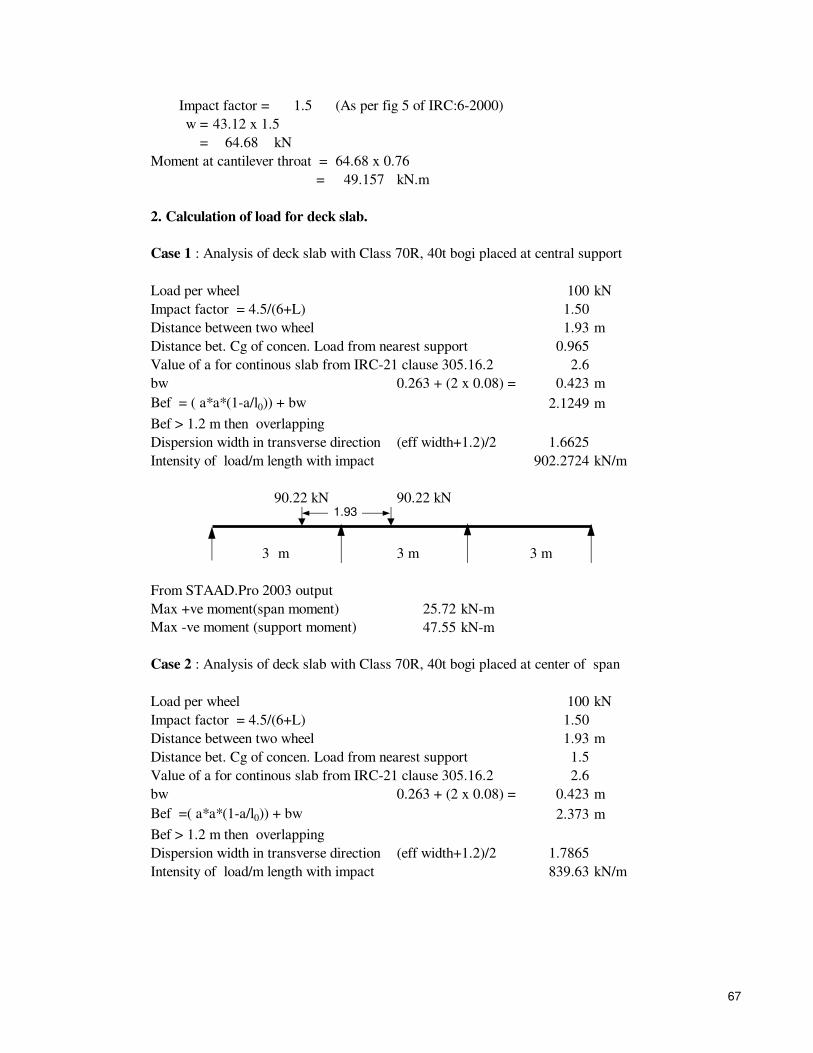
Impact factor = 1.5 (As per fig 5 of IRC:6-2000)
w = 43.12 x 1.5
= 64.68 kN
Moment at cantilever throat = 64.68 x 0.76
= 49.157 kN.m
2. Calculation of load for deck slab.
Case 1 : Analysis of deck slab with Class 70R, 40t bogi placed at central support
Load per wheel 100 kN
Impact factor = 4.5/(6+L) 1.50
Distance between two wheel 1.93 m
Distance bet. Cg of concen. Load from nearest support 0.965
Value of a for continous slab from IRC-21 clause 305.16.2 2.6
bw 0.263 + (2 x 0.08) = 0.423 m
Bef = ( a*a*(1-a/l0)) + bw 2.1249 m
Bef > 1.2 m then overlapping
Dispersion width in transverse direction (eff width+1.2)/2 1.6625
Intensity of load/m length with impact 902.2724 kN/m
90.22 kN 90.22 kN
3 m 3 m 3 m
From STAAD.Pro 2003 output
Max +ve moment(span moment) 25.72 kN-mMax -ve moment (support moment) 47.55 kN-m
Case 2 : Analysis of deck slab with Class 70R, 40t bogi placed at center of span
Load per wheel 100 kN
Impact factor = 4.5/(6+L) 1.50
Distance between two wheel 1.93 m
Distance bet. Cg of concen. Load from nearest support 1.5
Value of a for continous slab from IRC-21 clause 305.16.2 2.6
bw 0.263 + (2 x 0.08) = 0.423 m
Bef =( a*a*(1-a/l0)) + bw 2.373 m
Bef > 1.2 m then overlapping
Dispersion width in transverse direction (eff width+1.2)/2 1.7865
Intensity of load/m length with impact 839.63 kN/m
1.93
67

839.63 83.96
1.5 m 3 m 0.43 3 m 3 m
From STAAD.Pro 2003 output
Max +ve moment(span moment) 43.97 kN-mMax -ve moment (support moment) 38 kN-m
5.2 DESIGN OF DECK SLAB REINFORCEMENT
5.2.1 Design of cantilever slab (Crash barrier side)
Design moment
Dead load moment = 16.07 kN.m
Moment due to SIDL = 28.86 kN.m
Live load moment = 49.1568 kN.m
Total moment = 94.08 kN.m
Depth required = Mc
b x Q
= 94.08 x 10^6
1000 x 2.3075
= 201.919 mm
dprod = 240 - 30 - 5
= 205 mm (o.k.)
Ast required = 94.08 x 10⁶
200 x 0.8668 x 205
= 2647.25 mm2
Provide 12 f @ 150 c/c + 20 f @ 150 c/c Ast prov 2848.0 mm2
5.2.2 Design of deck slab
Max +ve moment (span moment) = 5.52 + 43.97 = 49.49 kN.m
Area of steel = Ast = M/sst*j*d 1392.562 mm2
Provide 10 f @ 200 c/c + 16 f @ 200 c/c Ast prov 1398.0 mm2
kN kN1.93
m
67
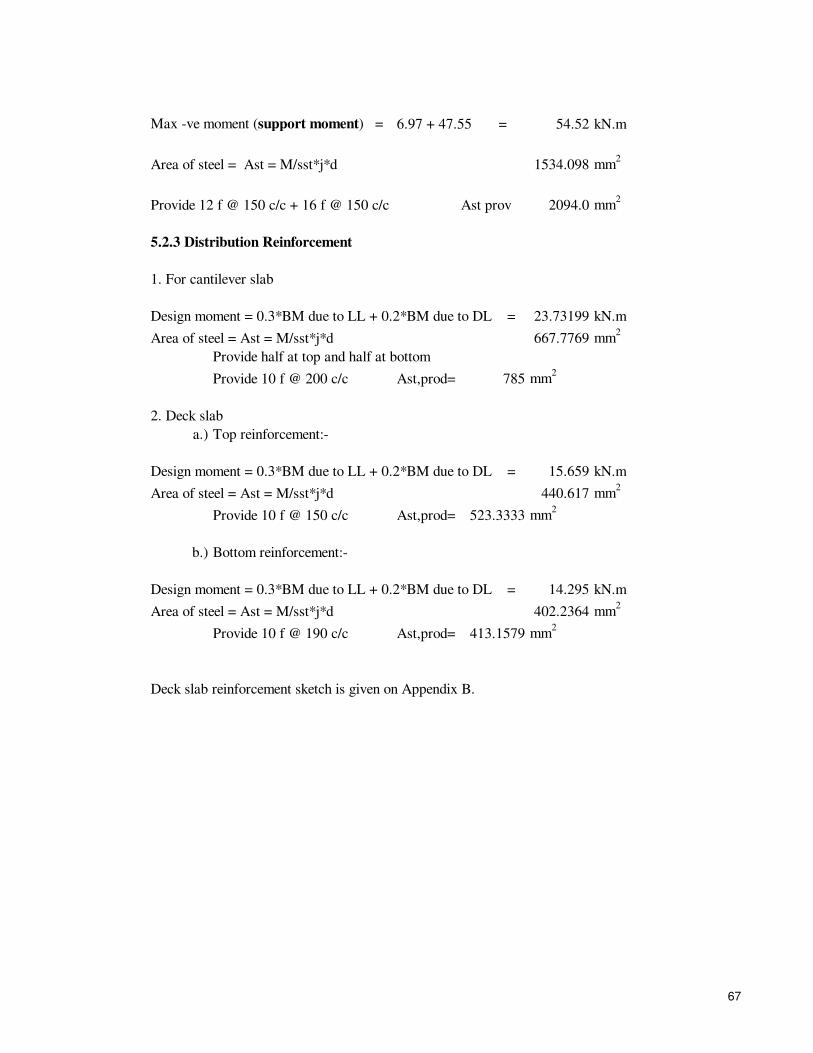
Max -ve moment (support moment) = 6.97 + 47.55 = 54.52 kN.m
Area of steel = Ast = M/sst*j*d 1534.098 mm2
Provide 12 f @ 150 c/c + 16 f @ 150 c/c Ast prov 2094.0 mm2
5.2.3 Distribution Reinforcement
1. For cantilever slab
Design moment = 0.3*BM due to LL + 0.2*BM due to DL = 23.73199 kN.m
Area of steel = Ast = M/sst*j*d 667.7769 mm2
Provide half at top and half at bottom
Provide 10 f @ 200 c/c Ast,prod= 785 mm2
2. Deck slab
a.) Top reinforcement:-
Design moment = 0.3*BM due to LL + 0.2*BM due to DL = 15.659 kN.m
Area of steel = Ast = M/sst*j*d 440.617 mm2
Provide 10 f @ 150 c/c Ast,prod= 523.3333 mm2
b.) Bottom reinforcement:-
Design moment = 0.3*BM due to LL + 0.2*BM due to DL = 14.295 kN.m
Area of steel = Ast = M/sst*j*d 402.2364 mm2
Provide 10 f @ 190 c/c Ast,prod= 413.1579 mm2
Deck slab reinforcement sketch is given on Appendix B.
67

5.3 DESIGN OF DIAPHRAGM OF GIRDER
Diaphragms are provided to strengthen the deck. Due to this no flexure of
transverse deck is possible. According to Courbon's theory a concentric load, instead
of pushing down only nearby girders, causes equal deflection of all the girders. It is
designed as the simple RCC unit. Analysis is carried out using STAAD Pro 2003.
Input file for the same is shown in Appendix A.
Thickness of End diaphragm = 0.3 m
Thickness of Intermediate diaphragm = 0.28 m
5.3.1 Intermediate diapharm
s
0.28
8.5
3 m 3 m
Fig 5.1 Dead Load distribution on diaphragm
Dead Load calculation.
Clear span of diaphragm = 3-0.28
= 2.72 m
D.L. of deck slab + wearing coat /m run
= [(0.24 x 25) + (0.080 x 22)] x [(2.72/2)+0.28]
= 12.7264 kN/m
Self weight of diaphragm = 2.41 x 0.28 x 25
= 16.87 kN/m
Total D.L. = 29.5964 kN/m
29.5964
3 m 3 m 3 m
main girder
diaphragm
kN/m
m
m
75

From STAAD.Pro 2003 output
Max +ve moment(span moment) 21.3 kN-mMax -ve moment (support moment) 26.59 kNn-m
Max S.F. due to D.L. at internal support 51.51 kN
Live load calculation
Case 1 : Class AA placed for middle support moment
diapharm
0.28
Fig 5.2 Live Load distribution on intermediate diaphragm
Load on cross beam = 350 x (8.5 - 0.9) / 8.5 = 312.941 kN
With impact (25 % higher) 1.25 = 391.18 kN
3 m 3 m 3 m
Max +ve moment(span moment) 122.56 kN-mMax -ve moment (support moment) 209.32 kN-m
Case 2 : Class AA placed at centre of span
391.18
3 m 3 m 3 m
Max +ve moment(span moment) 229.06 kN-mMax -ve moment (support moment) 113.65 kN-m
350kN 350kN
2.05
1.8
1.8
381.25381.25 kN kN
kN
2.05
75
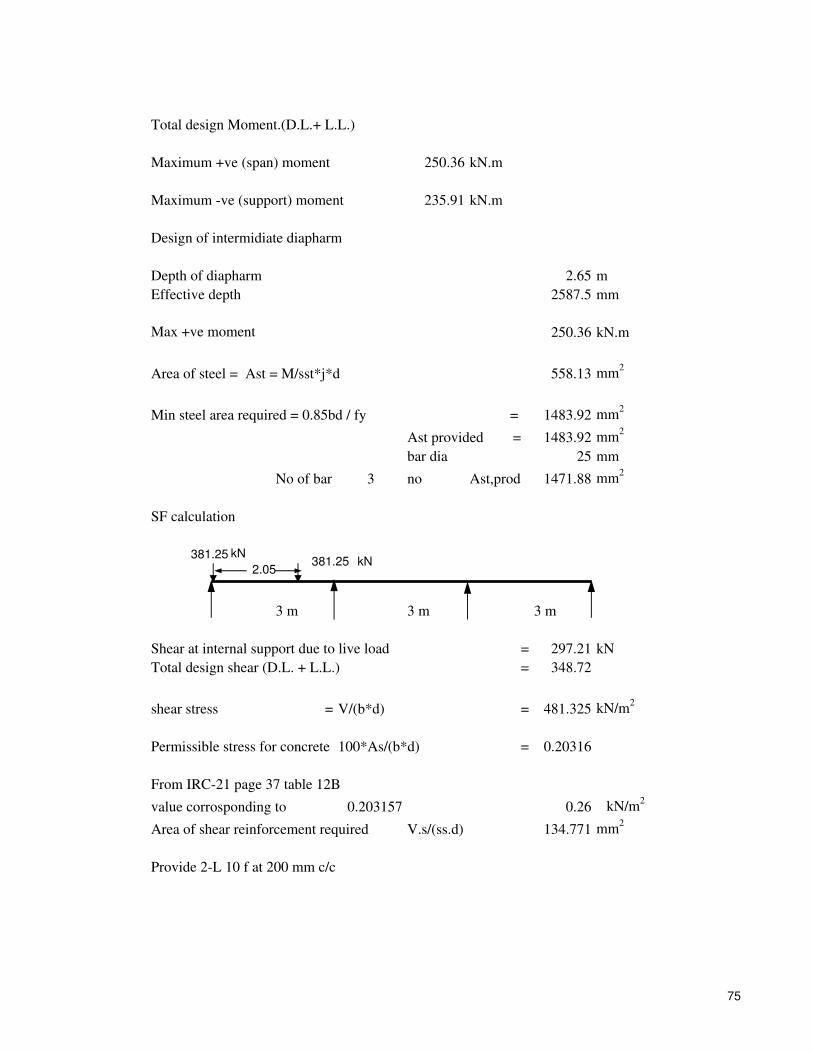
Total design Moment.(D.L.+ L.L.)
Maximum +ve (span) moment 250.36 kN.m
Maximum -ve (support) moment 235.91 kN.m
Design of intermidiate diapharm
Depth of diapharm 2.65 m
Effective depth 2587.5 mm
Max +ve moment 250.36 kN.m
Area of steel = Ast = M/sst*j*d 558.13 mm2
Min steel area required = 0.85bd / fy = 1483.92 mm2
Ast provided = 1483.92 mm2
bar dia 25 mm
No of bar 3 no Ast,prod 1471.88 mm2
SF calculation
3 m 3 m 3 m
Shear at internal support due to live load = 297.21 kN
Total design shear (D.L. + L.L.) = 348.72
shear stress = V/(b*d) = 481.325 kN/m2
Permissible stress for concrete 100*As/(b*d) = 0.20316
From IRC-21 page 37 table 12B
value corrosponding to 0.203157 0.26 kN/m2
Area of shear reinforcement required V.s/(ss.d) 134.771 mm2
Provide 2-L 10 f at 200 mm c/c
2.05kN
kN381.25381.25
75

5.3.2 End diapharm
BM calculation
Total dead wt of super structure
Weight due to SIDL 1524.00 kN
Weight due to Slab 565.00 kN
Weight due to Girder 55.00 kN
Weight due to Diapharm 56.00 kN
Total 2250.00 kN
Load @ each bearing joint 375.00 kN
2.285 3 3 2.285
From Staad.pro output,
Maximum +ve (span) moment 138.75 kNm
Maximum -ve (support) moment 947.84 kNm
Design of end diapharm
Depth of diapharm 2.65 m
Effective depth for bottom steel 2587.5 mm
Effective depth for top steel 2535 mmMax +ve moment 138.75 kN.m
Area of steel = Ast = M/sst*j*d 309.32 mm2
Min steel area required = 0.85bd / fy = 1589.91 mm2
Ast provided = 1589.91 mm2
bar dia 25 mm
No of bar 4 no Ast,prod 1962.5 mm2
Max -ve moment 947.84 kN.m
Area of steel = Ast = M/sst*j*d 2156.79 mm2
Ast provided 2156.79 mm2
Provide 4-20f + 2-25f Ast,prod 2237.25 mm2
G1 G2 G4
0.74
0.74 0.74
0.74
J1J2 J3
J7
J5 J6
0.74 0.74
G3
75
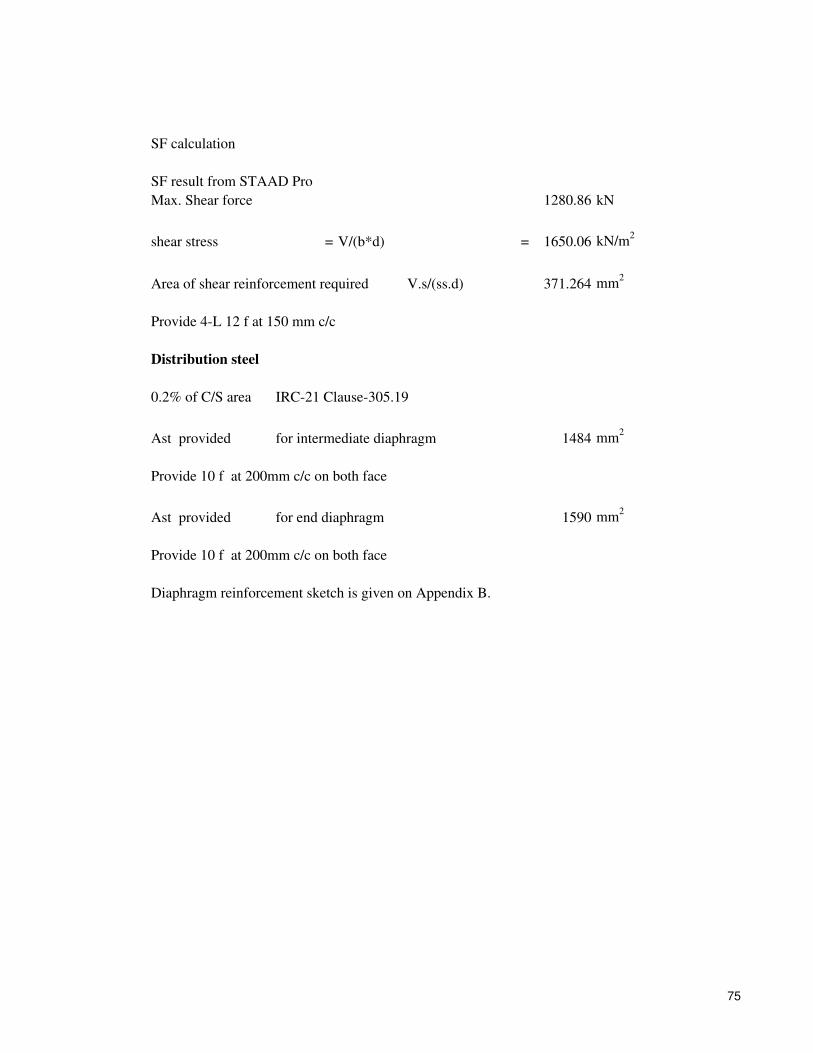
SF calculation
SF result from STAAD Pro
Max. Shear force 1280.86 kN
shear stress = V/(b*d) = 1650.06 kN/m2
Area of shear reinforcement required V.s/(ss.d) 371.264 mm2
Provide 4-L 12 f at 150 mm c/c
Distribution steel
0.2% of C/S area IRC-21 Clause-305.19
Ast provided for intermediate diaphragm 1484 mm2
Provide 10 f at 200mm c/c on both face
Ast provided for end diaphragm 1590 mm2
Provide 10 f at 200mm c/c on both face
Diaphragm reinforcement sketch is given on Appendix B.
75
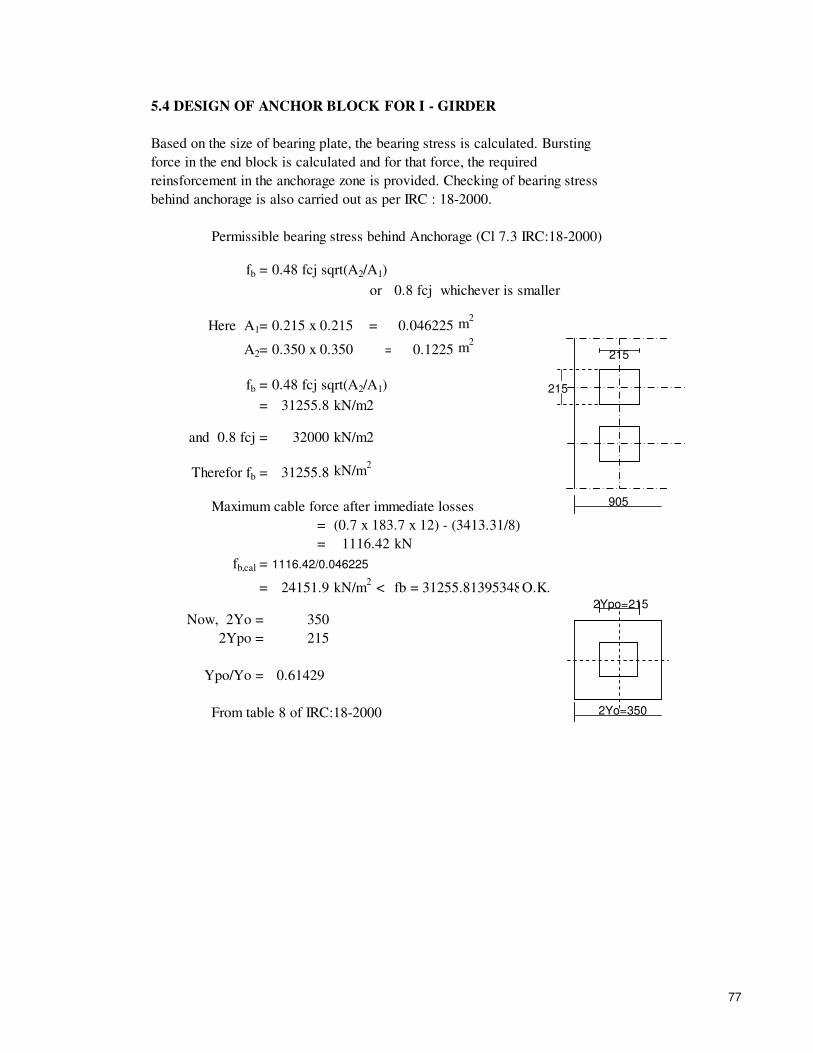
5.4 DESIGN OF ANCHOR BLOCK FOR I - GIRDER
Based on the size of bearing plate, the bearing stress is calculated. Bursting
force in the end block is calculated and for that force, the required
reinsforcement in the anchorage zone is provided. Checking of bearing stress
behind anchorage is also carried out as per IRC : 18-2000.
Permissible bearing stress behind Anchorage (Cl 7.3 IRC:18-2000)
fb = 0.48 fcj sqrt(A2/A1)
or 0.8 fcj whichever is smaller
Here A1= 0.215 x 0.215 = 0.046225 m2
A2= 0.350 x 0.350 = 0.1225 m2
fb = 0.48 fcj sqrt(A2/A1)
= 31255.8 kN/m2
and 0.8 fcj = 32000 kN/m2
Therefor fb = 31255.8 kN/m2
Maximum cable force after immediate losses
= (0.7 x 183.7 x 12) - (3413.31/8)
= 1116.42 kN
fb,cal = 1116.42/0.046225
= 24151.9 kN/m2 < fb = 31255.8139534884kN/m2O.K.
Now, 2Yo = 350
2Ypo = 215
Ypo/Yo = 0.61429
From table 8 of IRC:18-2000
215
905
215
2Yo=350
2Ypo=215
77
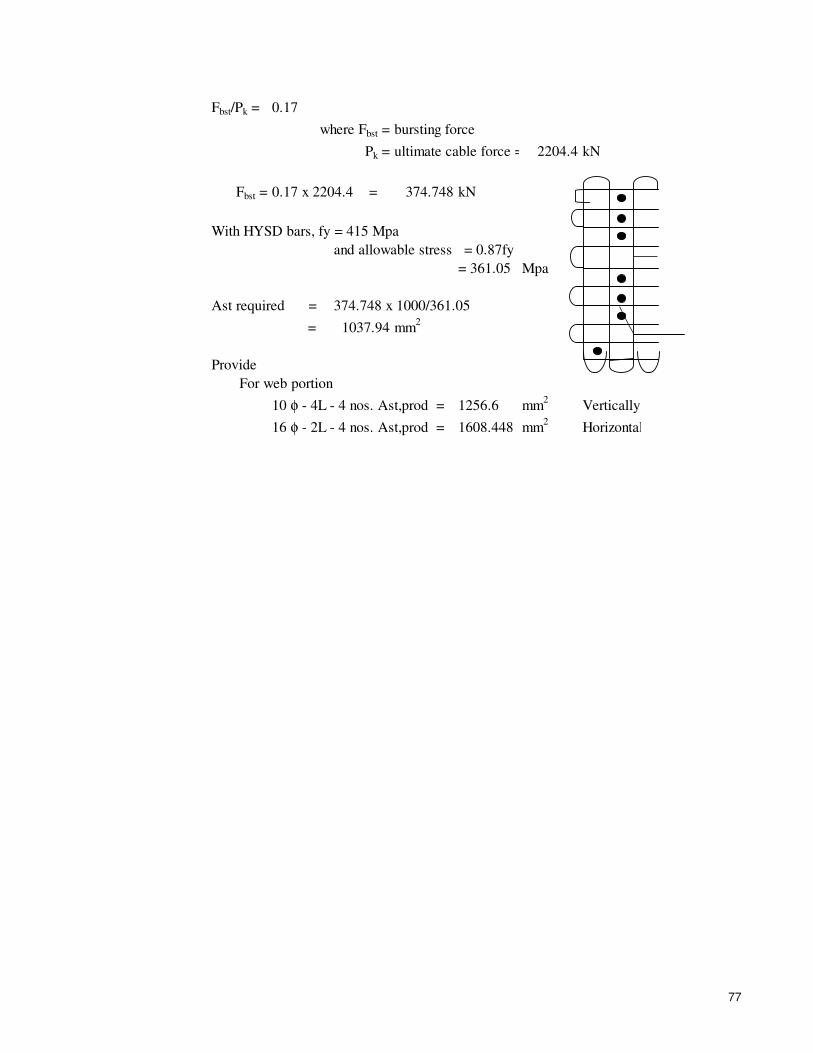
Fbst/Pk = 0.17
where Fbst = bursting force
Pk = ultimate cable force = 2204.4 kN
Fbst = 0.17 x 2204.4 = 374.748 kN
With HYSD bars, fy = 415 Mpa
and allowable stress = 0.87fy
= 361.05 Mpa
Ast required = 374.748 x 1000/361.05
= 1037.94 mm2
Provide
For web portion
10 φ - 4L - 4 nos. Ast,prod = 1256.6 mm2 Vertically
16 φ - 2L - 4 nos. Ast,prod = 1608.448 mm2 Horizontally
77

275
275
2Yo=350
2Ypo=215
77
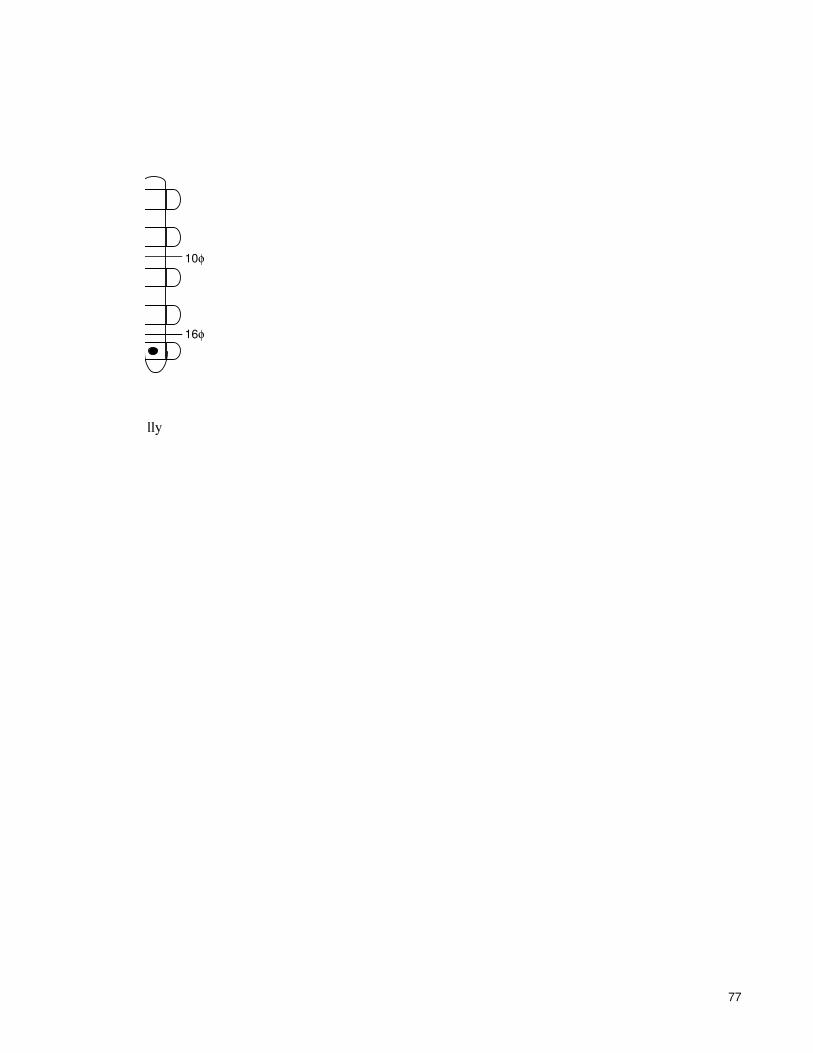
Horizontally
16φ
10φ
77

79
CHAPTER:-6
COMPUTER AIDED DESIGN OF PRESTRESSED I GIRDER
6.1 INTRODUCTION
In a conventional approach to the design of prestressed concrete girders, a section of the
girder and cable profile is required to be assumed. Thereafter, going through a series of
typical and rigorous calculations, stress check is made and it is established whether the section
and cable profile are suitable or not. If the design is not suitable, a revised section of girder
and/or cable profile is tried. Since the process is repetitive, it can be better achieved by a
computer software rather than repetitive hand calculation.
The use of this program is for the stress checking at various sections of the prestressed girder
which forms part of a composite bridge deck comprising simply supported I girders and cast
in-situ concrete slab. Cross-sectional dimensions of the girder and geometry of the choice of
various types of strands, i.e. 7T13, 12T13, 19T13 etc. or any combination of these. The time
dependent losses are considered as per IRC-18. At any specified section, checking of final
stresses is possible.
The main features of the program are as follows:-
• Program prepared in MATLAB 7 software.
• All the provisions of IRC are taken care of.
• Fully descriptive output is generated.

6.2 FLOW CHART
START
INPUT SECTIONAL PROPERTIES
AT MID SPAN SECTION,
DECK SLAB PROFILE AND LENGTH
OUTPUT SECTIONAL PROPERTIES
OF GIRDER WITHOUT DECK SLAB
AND COMPOSITE SECTION
CALCULATE COURBON FACTORS
FOR CLASS AA , CLASS A
70R VEHICLE AND DECK SLAB
CALCULATE SELFWEIGHT AND
WEIGHT OF STIFFNER, DIAPHRAGM
AND DECKSLAB
CALCULATE LIVE LOAD AND DEAD
LOAD BM FOR INNER AND OUTER
GIRDER AT DIFFERENT SECTIONS AND
DESIGN BENDING MOMENT
INPUT CABLE NUMBERS AND
ARRANGEMENT AT MID AND END SPAN
CALCULATE PRESTRESS LOSSES AND
CABLE FORCES
DESIGN OF END BLOCK, DIAPHRAGM
AND DECK SLAB
CHECK FOR M.R OF SECTION AND
SHEAR CHECK
ARE FINAL
STRESSES
WITHIN
PERMISSIBLE
LIMIT ?
END
80

81
6.3 ABOUT SOFTWARE
In this age of computers, most of the design processes are now becoming more and more
automated with computers. Day by day new invention in field of computer makes use of
computer with simple languages and simple application package development tools. The
name MATLAB stands for matrix laboratory. The main feature of MATLAB is, it is a high-
performance language for technical computing. It integrates computation, visualization, and
programming in an easy-to-use environment where problems and solutions are expressed in
familiar mathematical notation. Due to inbuilt mathematical function it is easy to
programming in this software, compiler interprets line to line and because of this type of
debugging facility it is easy for error handling. It coding is also easy. One can import and
export data to EXCEL from MATLAB and vice verse.
6.4 PROGRAM STRUCTURE
The program includes following sub-modules:
• Sectional properties
• Input geometrical Data for carriageway
• Live load Analysis
• Dead load Analysis
• Cable profile
• Computation of Friction and Slip losses
• Computation of Final Losses
• Computation of Final Stresses
• Design of End Block, Diaphragm, Deck Slab
• Check for Moment resistance of section
• Check for Shear strength
• Output
82
Sectional properties
In this, any section will be specified and the cross sectional parameters of the girders will be
given so that related cross sectional properties at specified sections can be carried out.
Input geometrical Data for carriageway and footpath
In this, geometrical data of the carriageway can be fed. So related properties can be carried
out and can be used further for design.
Dead Load Analysis
Bending moments and shear forces at various sections due to dead load i.e. self-weight of
girder, deck slab, diaphragms and SIDL are calculated in this. Variation in carriageway is
taken care but nos. of kerbs, availability of footpath, crash barrier and parapet is taken as
standard.
Live Load Analysis
Bending moments and shear forces at various sections due to live load i.e. Class AA, Class A
and Class 70R are calculated in this. Automatically wheel of these IRC train placed on girder
to obtain maximum bending moments and maximum shear forces at various sections.
Cable profile
With input of Cable arrangement at end span and at mid span, geometry of the cable in
elevation is generated for all the cables. As all the cables are parabolic it takes care of the
parabolic cable profile. Co-efficient of wobble friction, curvature friction and jacking stress
are also specified. As horizontal deviation is neglected due to very less effect on cable forces
from this, the ordinates of each cable in elevation are calculated at various sections.
83
Computation of friction and Slip Losses
In the calculation of cable forces, half the span of the girder is considered. Forces values at the
predetermined intervals are first calculate considering the effect of friction and wobble only.
It is presumed that the cable is stressed from both its ends (simultaneously and equally).
During lock-off of strands into the anchorages, the jaws move an average distance (slip). On
account of the loss of slip, the stress in the tendon at the anchorage drops from P to P0 . a
maximum slip of 6 mm is assumed. Due to reverse friction effects, the length of tendon
affected by this loss is limited to some distance. This slip ∆ is given by:-
∆ = PL / AEs
and the stress per unit length is given by ∆Es
Stress after slip is calculated so that the area of slip diagram equals to 1170 kN/mm2. The
stresses after slip and friction loss are obtained at every section. The effective force in each
cable, including horizontal and vertical components at predefined sections is calculated.
Computational of Final Losses
After calculation of the effective vertical force in the cables, stresses under the addition of
various loads and the losses taken in Stage 1 and stage 2 are calculated at various sections in
the following sequences.
• Loss due to elastic shortening of the 1st stage cables. Stresses at the c.g. of 1st stage cables
are calculated. Elastic shortening is worked out considering this loss may very linearly
from the maximum in the cable stresses first to zero in the cable stresses last. Hence, it
may be taken as half of the maximum, later being the product of strain in concrete due to a
weighted average compressive stress in concrete at the level of centroid of 1st stage cables
under the self weight of girder, initial prestress and modulus of elasticity of the cable steel.
• Loss due to relaxation of 1st stage cables. Losses are calculated as per the cl. 11.4 (Table-
4) of IRC-18-2000 based on the U.T.S after elastic shortening of cables.

84
• Loss due to creep and shrinkage between the age of concrete at 1st stage prestressing and
2nd prestressing. These losses are calculated as per the Table 2 and 3 of IRC-18-2000.
• Loss due to elastic shortening of the 2nd stage cables. Stresses at the c.g. of 2nd stage
cables are calculated. Loss due to elastic shortening of 1st stage cables as well as 2nd stage
cables is worked out.
• Loss due to relaxation of 2nd stage cables.
• Loss due to creep and shrinkage beyond the age of concrete at 2nd stage prestressing.
Computation of Final Stress
• After 1st stage prestressing
• After immediate loss
• After casting of diaphragm and deck slab
• After gradual loss-I (creep and shrinkage)
• After 2nd stage prestressing
• After immediate loss
• After SIDL
• After gradual loss-II (creep and shrinkage)
• At full live load condition
Design of End Block, Diaphragm and Deck slabs
Based on the size of the bearing plate, the bearing stress is calculated. Bursting force in the
end block is calculated and for that force, the required reinforcement in the anchorage zone is
provided. Checking of bearing stress behind anchorage is also carried out as per IRC-18 :
2000.
Design of deck slab is carried out for heaviest loading of IRC, Class 70R 40t bogi. For
maximum +ve moment Class 70R 40t bogi placed at centre of span and for maximum –ve
moment Class 70R 40t bogi placed at centre of support. Diaphragms are provided to

85
strengthen the deck. Due to this no flexure of transverse deck is possible. According to
Courbon’s theory a concentric load, instead of pushing down only nearby girders, causes
equal deflection of all the girders. It is designed as simple RCC unit.
Check for Moment resistance of section
As per the provisions made in IRC: 18, the PSC girder section is checked for the ultimate
stress.
Check for Shear Strength
Check for the shear stress will be made at all specified section. Ultimate shear resistance of
the section is calculated for uncracked and cracked conditions and the lesser of the two values
is compared with the design shear force due to ultimate loads. If the shear force is greater the
shear steel is provided. If it is less or shear steel is less than the minimum provision, minimum
shear steel is provided.

86
CHAPTER:-7
SUMMARY AND CONCLUSIONS
7.1 SUMMARY
Prestressed concrete is now a days extensively used in the construction of large span bridge
structure. The analysis and design of a prestressed concrete member is not only a tedious task
but voluminous too. Its finalization requires repeated trial and error, which requires much
time and may lead to mistakes in manual calculations. There are many general purpose
packages available for analysis and design of structures, but very few are in the field of design
of prestressed concrete structures. Computer Aided Design applications for such types of
work will result in a considerable saving in time, in addition to the refinement and economy.
With this aim, a computer program was developed in Excel and MATLAB 7.0 which design
the girder of a composite bridge deck-girder system and its various components using IRC
recommendation. The program is prepared for moving loads for the various IRC loadings. It
also finds live loads sharing for moving loads. After giving number of cables, cable profile,
losses and the final stresses are checked. As per IRC the shear and M.R check is also provided
for the girder design.
7.2 CONCLUSIONS
� Analysis and design of 3-lane, four girder and 40m span bridge superstructure is carried
out in this dissertation.
� Courbon’s method is great tool in finding out loading on girders which otherwise require
plate analysis. When all the girders have same moment of inertia the calculations are
simplified a lot. Program finds reaction factors by this method for load sharing between
internal and external longitudinal girders.
� This program makes whole analysis and design procedure of bridge superstructure
components in a simple way as per IRC provisions and thereby reduces lots of labor of a
design engineer.

87
� The moving load analysis of IRC live loads as incorporated in the program approximates
the behavior of imposed live loads much to the perfection.
� Position of live loads near crash barrier induces maximum forces in the outer girder and
thus is the worst condition for which the girders are designed.
� The tabular output of moments gives an idea about contributions of dead load, live load
and superimposed dead load the check for stresses, is verified for maximum dead load and
live load moment at mid span. As there are no tensile stresses, it is a Type 1 design.
� The prestress force and its eccentricity is the most critical part of the girder design and
even a slight variation in eccentricity produces big variation in stresses. A compromise
between stress requirements and prestressing force compatible with the assumed
dimensions of girder is truly a trial and error process requiring engineering ingenuity. The
program greatly aids in this process and saves time. Here number of cables is eight and
having parabolic cable profile which satisfies all the limit state checks as per IRC rules,
therefore it is a safe design.
7.3 FUTURE SCOPE OF WORK
� Rigorous analysis of temperature loss can be included.
� Program further can be extended for more than 3 lane bridges and analysis and design of
substructure.
129
References:-
1. IRC 6 : 2000, Standard specification & code of practice for
Road bridge – Section – II. (Load & stresses)
The Indian Road Congress.
2. IRC 18 : 2000, Design criteria for prestressed concrete road bridge
(Post-tensioned concrete)
The Indian Road Congress
3. IRC 21 : 2000, Standard specification & code of practice for
Road Bridge – Section III. (Cement concrete – Plain & Reinforced)
The Indian Road Congress
4. Standard plans for 35m span prestressed super structure with
footpaths for highway bridge ( Ministry of surface transport – Roadwing)
The Indian Road Congress
5. IS:6006- 1983, Indian standard code of Specification for uncoated
stress relieved strand for Prestressed concrete
5. IS: 1343-1980, Indian standard code of practice for prestressed
concrete ,Bureau of Indian Standards, New Delhi.
6. Guyon Y.
Limit State Design of Prestressed Concrete (Vol.II )
Applied Science Publishers Ltd. London.
7. V.K.Raina
Concrete bridge practice – Analysis & Design
Pub. Tata Macgraw hill Publishing co. Ltd, New Delhi.
130
8. N Krishna Raju
Prestressed Concrete
Pub. Tata Macgraw hill Publishing co. Ltd, New Delhi.
9. T.R.Jagadeesh and M.A Jayaram
Design of Bridge Structure
Prentice-Hall of India Private Limited, New Delhi.

88
APPENDIX:-A
STAAD.Pro INPUT FILE FOR ANALYSIS OF DIAPHRAGM AND
DECK SLAB
STAAD PLANE START JOB INFORMATION ENGINEER DATE 16-Jun-05 END JOB INFORMATION INPUT WIDTH 79 UNIT METER KN JOINT COORDINATES 1 0 0 0; 2 3 0 0; 3 6 0 0; 4 9 0 0; MEMBER INCIDENCES 1 1 2; 2 2 3; 3 3 4; DEFINE MATERIAL START ISOTROPIC CONCRETE E 2.17185e+007 POISSON 0.17 DENSITY 23.5616 ALPHA 1e-005 DAMP 0.05 END DEFINE MATERIAL CONSTANTS MATERIAL CONCRETE MEMB 1 TO 3 MEMBER PROPERTY AMERICAN 1 TO 3 PRIS YD 0.24 ZD 1 SUPPORTS LOAD 1 CASE 1 MEMBER LOAD 1 CON GY -90.22 2.035 0.5 2 CON GY -90.22 0.965 0.5 LOAD 2 CASE 2 MEMBER LOAD 1 CON GY -83.96 1.5 0.5 2 CON GY -83.96 0.43 0.5 LOAD 3 SW MEMBER LOAD 1 TO 3 UNI GY -7.76 0 3 0.5 LOAD 9 SWG MEMBER LOAD 1 TO 3 UNI GY -29.6 0 3 0.5 LOAD 10 CG2 MEMBER LOAD 1 CON GY -391.18 1.975 0.5 2 CON GY -391.18 1.025 0.5 LOAD 11 CG3 MEMBER LOAD

89
1 CON GY -381.18 1.5 0.5 LOAD 12 CG4 MEMBER LOAD 1 CON GY -381.25 0 0.5 1 CON GY -381.25 2.05 0.5 PERFORM ANALYSIS PRINT ALL PERFORM ANALYSIS PRINT ALL PERFORM ANALYSIS PRINT ALL FINISH

90
APPENDIX:-B
DRAWINGS WITH DETAILING
List of Drawings
1/1 GENERAL ARRANGEMENT DRAWING OF PSC I TYPE SUPERSTRUCTURE
2/3 DETAILS OF PRESTRESSING CABLES FOR I GIRDER
3/3 REINFORCEMENT DETAIL OF MAIN GIRDER, CROSS GIRDER, DECK SLAB
& END BLOCK FOR I GIRDER

APPENDIX:-C
MATLAB 7.0 PROGRAM
% SECTIONAL PROPERTIES %SECTIONAL PROPERTY CALCULATION OF I-GIRDER AT MID SPAN % properties input clear all; w1(1,1)=input('Enter width of part 1 '); d1(1,1)=input('Enter depth of part 1 '); w2(1,1)=input('Enter width of part 2 '); d2(1,1)=input('Enter depth of part 2 '); w3(1,1)=input('Enter width of part 3 '); d3(1,1)=input('Enter depth of part 3 '); w4(1,1)=input('Enter width of part 4 '); d4(1,1)=input('Enter depth of part 4 '); w5(1,1)=input('Enter width of part 5 '); d5(1,1)=input('Enter depth of part 5 '); % Area calculation a1(1,1)=w1(1,1)*d1(1,1); a2(1,1)=w2(1,1)*d2(1,1); a3(1,1)=w3(1,1)*d3(1,1); a4(1,1)=w4(1,1)*d4(1,1); a5(1,1)=w5(1,1)*d5(1,1); % Total area a(1,1)=a1(1,1)+a2(1,1)+a3(1,1)+a4(1,1)+a5(1,1); % CG from top cg1(1,1)=d1(1,1)/2; cg2(1,1)=d1(1,1)+(d2(1,1)/2); cg3(1,1)=d1(1,1)+d2(1,1)+(d3(1,1)/2); cg4(1,1)=d1(1,1)+(d4(1,1)/3); cg5(1,1)=d1(1,1)+d2(1,1)-(d5(1,1)/3);