Chapter 5: Immigration & Urbanization Section 1: The New Immigrants.

IZA DP No. 363
Immigration Policy and the Skills of Immigrantsto Australia, Canada, and the United StatesHeather AntecolDeborah A. Cobb-ClarkStephen J. Trejo
DI
SC
US
SI
ON
PA
PE
R S
ER
IE
S
Forschungsinstitutzur Zukunft der ArbeitInstitute for the Studyof Labor
September 2001

Immigration Policy and the Skills of Immigrants to Australia, Canada, and
the United States
Heather Antecol Department of Economics, Claremont McKenna College
Deborah A. Cobb-Clark
SPEAR Centre, RSSS, Australian National University, Canberra and IZA, Bonn
Stephen J. Trejo Department of Economics, University of Texas and IZA, Bonn
Discussion Paper No. 363 September 2001
IZA
P.O. Box 7240 D-53072 Bonn
Germany
Tel.: +49-228-3894-0 Fax: +49-228-3894-210
Email: [email protected]
This Discussion Paper is issued within the framework of IZA’s research area Internationalization of Labor Markets and European Integration. Any opinions expressed here are those of the author(s) and not those of the institute. Research disseminated by IZA may include views on policy, but the institute itself takes no institutional policy positions. The Institute for the Study of Labor (IZA) in Bonn is a local and virtual international research center and a place of communication between science, politics and business. IZA is an independent, nonprofit limited liability company (Gesellschaft mit beschränkter Haftung) supported by the Deutsche Post AG. The center is associated with the University of Bonn and offers a stimulating research environment through its research networks, research support, and visitors and doctoral programs. IZA engages in (i) original and internationally competitive research in all fields of labor economics, (ii) development of policy concepts, and (iii) dissemination of research results and concepts to the interested public. The current research program deals with (1) mobility and flexibility of labor markets, (2) internationalization of labor markets and European integration, (3) the welfare state and labor markets, (4) labor markets in transition, (5) the future of work, (6) project evaluation and (7) general labor economics. IZA Discussion Papers often represent preliminary work and are circulated to encourage discussion. Citation of such a paper should account for its provisional character.

IZA Discussion Paper No. 363 September 2001
ABSTRACT
Immigration Policy and the Skills of Immigrants to Australia, Canada, and the United States
Census data for 1990/91 indicate that Australian and Canadian immigrants have higher levels of English fluency, education, and income (relative to natives) than do U.S. immigrants. This skill deficit for U.S. immigrants arises primarily because the United States receives a much larger share of immigrants from Latin America than do the other two countries. After excluding Latin American immigrants, the observable skills of immigrants are similar in the three countries. These patterns suggest that the comparatively low overall skill level of U.S. immigrants may have more to do with geographic and historical ties to Mexico than with the fact that skill-based admissions are less important in the United States than in Australia and Canada. JEL Classification: J61, J68, J31 Keywords: Immigration, immigrant skills, immigration policy Steve Trejo Department of Economics University of Texas Austin, TX 78712-1173 USA Tel.: +1 (512) 475-8512 Fax: +1 (512) 471-3510 Email: [email protected]

�������� ���
Australia, Canada, and the United States share a common history as major
immigrant-receiving countries.1 In this paper, we compare the observable skills—language
fluency, education, and income—of immigrants to these three countries. These countries
provide fertile ground for comparative analysis because although their economies are similar
in many fundamental respects, labor market policies and institutions differ markedly, and
this institutional variation provides a promising avenue for identifying the labor market
effects of government policy. In addition, high-quality census microdata are available for
each of these countries that make it possible to conduct detailed and comparable analyses of
labor market outcomes.
The topic of immigration is especially ripe for such a comparative analysis, because
this is an area where researchers and policymakers in the United States could learn a great
deal from the experiences of Australia and Canada. Of particular interest are the attempts
Australia and Canada have made to screen for workers with special skills or high levels of
education (Boyd 1976; Price 1979; Green and Green 1995). These attempts run counter to
the family reunification emphasis of U.S. immigration policy. In the United States, concerns
have arisen over the declining education and skill levels of successive immigrant waves
(Borjas 1995). Such concerns are reflected in provisions of the Immigration Act of 1990 that
seek to increase the share of immigrants admitted on the basis of their work skills, and these
concerns have also prompted proposals to introduce more explicitly skill-based admissions
criteria like those used in Australia and Canada. Before pushing ahead with this kind of
immigration reform, however, it would be prudent to consider the consequences of such
policies in Australia and Canada.
Furthermore, even if we put aside differences in immigration policy, structural and
institutional differences in the labor markets of the three countries are likely to influence the
type of immigrants who are attracted to each destination. For a number of reasons (stronger
labor unions, higher minimum wages, national health insurance, more generous
unemployment insurance and welfare systems), workers in the lower end of the income
1 During the period 1975-80, for example, nearly two-thirds of all immigrants chose one of these three countries
as their destination (Borjas 1991). More recently, other countries have emerged as important immigrant destinations, but Australia, Canada, and the United States remain dominant receiving countries.

2
distribution are generally better off in Australia and Canada than in the United States,
especially relative to the average worker in each country (Card and Freeman 1993; Gregory
and Daly 1994). Furthermore, although all three countries have experienced widening
income inequality over the past two decades, in the United States real incomes have fallen
sharply for low-skill workers, whereas in Australia and Canada the corresponding decline in
the bottom half of the income distribution has been much more modest (Freeman and Katz
1994). A comparative analysis may therefore shed light on how ongoing changes in the U.S.
wage structure will affect the skill composition of the immigrant flows that the United States
attracts and how these immigrants are likely to fare in the U.S. labor market.
To illustrate our strategy, consider the question of which country should attract the
most skilled immigrant flow. On the one hand, the Australian and Canadian practice of
admitting a large fraction of immigrants through a “point system” that screens for labor
market skills suggests that these countries should receive a more skilled immigrant flow than
the United States. On the other hand, the theory of selective migration (Borjas 1991)
predicts that the generous redistribution systems and relatively egalitarian wage structures in
Australia and Canada work in the opposite direction by attracting less skilled immigrants
who will reside in the bottom half of the income distribution. On the surface, then, it is
difficult to determine how differences in immigration policies and government institutions
across countries should affect the selectivity of immigration flows to the three destination
countries.
To a large extent, however, the immigration point systems employed in Australia and
Canada select immigrants based on easily observed characteristics such as age, education,
language, and occupation. In terms of these characteristics, immigrants to Australia and
Canada should be more productive than those migrating to the United States. Our tests of
this hypothesis will reveal how successful immigration point systems are, in practice, at
selecting immigrants with favorable skill measures, and how much this screening process
raises the labor market productivity of immigrant workers.2
2 For several reasons, it is not a foregone conclusion that the Australian and Canadian systems lead to an
immigrant flow that is highly selective in terms of characteristics associated with labor market success. First, both systems admit many immigrants who are not screened by a points test, including applicants with immediate family who are citizens of the destination country, refugees, and the family members who accompany those admitted by a points test. Second, both systems award a significant number of points based on a “personal assessment” of the applicant by the immigration official conducting the face-to-face interview. Finally, Reitz (1998) argues that the Australian and Canadian point systems can be

3
Interestingly, the opposite pattern should emerge if we first control for the
characteristics that immigrant point systems screen on. In particular, among immigrants
with similar observable skill measures, the most productive should locate in the United
States where there is less social insurance against poor labor market outcomes but a greater
individual return to favorable outcomes. Our tests of this hypothesis will indicate to what
extent immigrant locational choices based on difficult-to-observe attributes, such as ability
and ambition, are able to undo the selectivity intended by point systems. Alternatively, a
finding that Australian and Canadian immigrants are superior to U.S. immigrants in terms of
unobservable as well as observable determinants of earnings would suggest that the
“personal assessment” portion of a point system successfully screens for some of the
difficult-to-observe attributes related to labor market productivity.
����������������� ����������������������������������
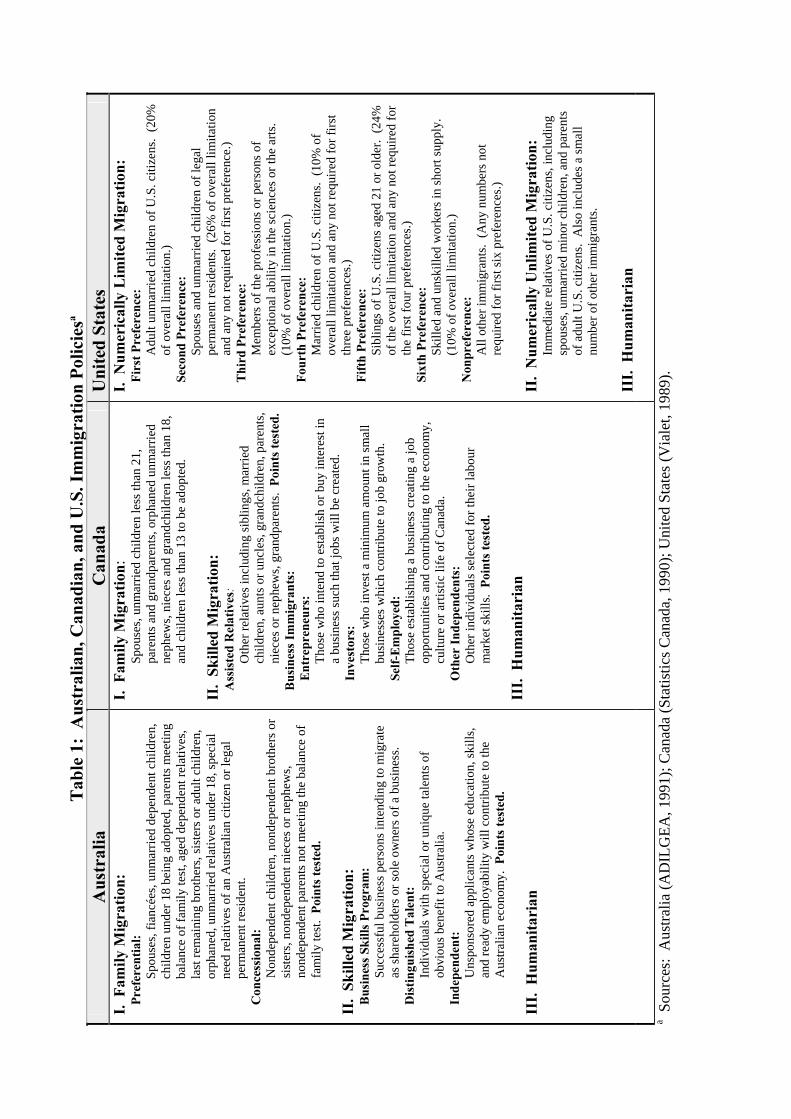
Tables 1 and 2 present an overview of the immigrant admissions policies of
Australia, Canada, and the United States as of around 1990.3 Table 1 provides a brief outline
of the main components of admissions policies in the three countries, and Table 2 reports the
percentages of immigrants who entered under various broad admission categories. Our
primary goal is to show that a much larger share of Australian and Canadian immigrants are
admitted on the basis of their labor market skills than is the case for U.S. immigrants.
In Australia and Canada, so-called “independent” migrants without relatives in the
destination country can gain admission by passing a “points test” that takes into account
factors such as the applicant’s age, education, language ability, and occupation. Some
applicants with relatives in the destination country are also evaluated by a points test, with
the number of points required for admission lowered when the family relationship is
sufficiently close.4 In addition, immigrants can be admitted because they possess special
talents or because they meet certain investment requirements and intend to establish a
passed by applicants with quite modest skill levels, and therefore these systems may provide only very weak filters for immigrant labor market skills.
3 For detailed discussions of immigration policy in these three countries, see Boyd (1976), Briggs (1984), Chiswick (1987), Borjas (1988), Vialet (1989), Cobb-Clark (1990), Reimers and Troper (1992), Green (1995), Green and Green (1995), Lack and Templeton (1995), and Reitz (1998).
4 Immigrant admissions categories in which entry is determined jointly by a points test and by family relationships include the “concessional” category in Australia and the “assisted relatives” category in Canada.

4
business in Australia or Canada. Immigrants entering Australia or Canada through any of
the avenues just described are categorized as “skilled” immigrants in Table 2, because the
human capital and potential labor market success of these applicants play a key role in their
admission. In contrast, “family” immigrants consist of those applicants admitted solely on
the basis of having an immediate relative in the destination country, and “refugees” are
immigrants fleeing political persecution who are admitted on humanitarian grounds.
U.S. admissions policy distinguishes between two types of family immigrants.
“Numerically unlimited” family immigrants are the immediate relatives of U.S. citizens who
enter without counting against the overall cap set for annual immigrant admissions.
“Numerically limited” family immigrants are the more distant relatives of U.S. citizens and
the immediate relatives of U.S. permanent residents who, in 1990, had to enter under one of
the relevant preference categories (first, second, fourth, or fifth) that regulate admissions
subject to the annual cap.5 In Table 2, we label U.S. immigrants entering under the third or
sixth preference categories as “skilled” immigrants, because only these immigrants were
admitted on the basis of their occupation or labor market skills.
The data assembled in Table 2 show that labor market skills play a much larger role
in the immigrant admission policies of Australia and Canada than that of the United States.
Around 1990, half of Australian immigrants and almost 40 percent of Canadian immigrants
were admitted because of their labor market skills, whereas less than 10 percent of U.S.
immigrants gained entry in this way.6 Conversely, two-thirds of U.S. immigrants were
admitted on the basis of their family relationships, as compared with only a quarter of
Australian immigrants and 37 percent of Canadian immigrants. The relative importance of
skilled versus family migration varies somewhat across immigrant regions of origin, but for
all source regions the share of skilled immigrants is much higher and the share of family
5 The 1990 Immigration Act altered U.S. immigration policy somewhat by introducing a three-track preference
system for family-sponsored, employment-based, and diversity immigrants (Vialet and Eig, 1990). Our data pre-date this change in policy, however.
6 In Table 2, the “skilled” category includes the immediate family members who accompany those admitted on the basis of their labor market skills. Therefore, these figures overstate the number of immigrants granted entry because of their own skills rather than family relationships, but adjusting for this feature of the reported data would not alter the conclusion that the skilled category constitutes a much larger share of immigrant admissions in Australia and Canada than in the United States. In addition, the data in Table 2 pertain only to legal admissions. The sizeable and largely unskilled flow of undocumented immigration to the United States implies that the share of all U.S. immigrants admitted because of their skills is even lower than Table 2 suggests.

5
immigrants is much lower in Australia and Canada than in the United States.
Table 2 describes immigrant admissions in the three countries as of around 1990, but
the same basic pattern existed throughout the 1970s and 1980s, when most of the immigrants
we analyze below arrived in their destinations. Since the 1965 Amendments to the
Immigration and Nationality Act, the skilled category has made up a very small percentage
of the U.S. immigration flow (Reitz 1998). Point systems for screening a substantial portion
of immigrant applicants were introduced in Canada in the late 1960s and in Australia in the
early 1970s (Green and Green 1995; Reitz 1998). Although the fraction of immigrants
admitted under a point system has varied over time, particularly for Canada, throughout this
period the percentage of admissions based on labor market criteria has remained much
higher in Australia and Canada than in the United States (Wright and Maxim 1993; Reitz
1998).
��������
We analyze individual-level data from the 1991 Australian and Canadian censuses
and the 1990 U.S. census. These censuses provide comparable data on demographic
characteristics and labor force behavior, as well as the requisite information on country of
birth and year of arrival for immigrants.7 The Australian data set constitutes a one- percent
sample of the population, the Canadian data set is a three- percent sample, and the U.S. data
set is a five- percent sample.8 These data sources supply detailed information on many
thousands of individuals in each destination country. Such large samples are essential for
empirical analyses of immigrants, because immigrants typically constitute a small fraction of
the total population, and it is important to disaggregate the immigrant population according
to variables such as year of arrival and country of origin.
We restrict our analysis to men between the ages of 25 and 59 who are not
7 In this paper, we use the term “immigrant” as synonymous with foreign-born individuals, in contrast to the
official terminology used by the U.S. Immigration and Naturalization Service in which immigrants are legal permanent residents, and other foreigners such as tourists, business travelers, and recent refugee arrivals are “nonimmigrant aliens.” The census data analyzed here cannot make such distinctions among foreign-born individuals.
8 The U.S. sample is much larger than the other two samples. To lighten the computational burden, we employ a .1 percent (or 1 in a 1000) sample of U.S. natives, but we use the full 5 percent sample of U.S. immigrants, and we use the full samples of natives and immigrants available in the Australian and Canadian data. The Australian and Canadian census data are self-weighting, whereas the 1990 U.S. census provides sampling weights that we use in all of the calculations reported in the paper.

6
institutional residents. We exclude women in order to minimize biases arising from selective
labor force participation, and we choose this age range so as to focus on men who have
completed their formal schooling and who have a strong attachment to the labor market.
Often, we compare outcomes for immigrants with those for natives who reside in the same
destination country. In this way, natives can serve as a control for cross-country differences
in social or economic conditions or in how the census data were collected. To increase
comparability of the native samples and improve their usefulness as a control group, we
exclude non-whites from the native (but not the immigrant) samples.9 Finally, residents of
the Atlantic Provinces and the Territories are excluded from the Canadian samples, because
for these individuals the information about country of birth and year of immigration is not
reported in sufficient detail.
These restrictions produce final samples of immigrant men totaling approximately
11,500 for Australia, 38,600 for Canada, and 297,000 for the United States. For each
destination country, Table 3 displays the region of birth distribution for the immigrants in
our samples who arrived within ten years of the census. The most striking difference in the
national origin composition of recent immigrants to the three countries involves Latin
America. Almost half of post-1980 immigrants to the United States hail from Central or
South America (including Mexico and the Caribbean), whereas only 14 percent of Canadian
immigrants and 2 percent of Australian immigrants come from this region. In addition, the
United States receives relatively fewer immigrants from the United Kingdom and Europe
than do the other countries: immigrants from these regions comprise 11 percent of the U.S.
immigration flow as compared to 26 percent of the Canadian flow and 33 percent of the
Australian flow.10 Another difference is that Asians make up a somewhat larger share of the
immigrant flow to Australia (36 percent) and Canada (40 percent) than to the United States
(28 percent). Lastly, note that Australia receives a sizeable number of immigrants from New
Zealand.
In the sections that follow, we examine in turn three different measures of immigrant
labor market skills: fluency in the language of the destination country, years of schooling,
9 In particular, we exclude blacks, Asians, Hispanics, and aboriginals from the native sample for each destination
country. 10 In Table 3, Europe is defined to include the former USSR.

7
and income. Our analysis will show that the national origin differences documented in
Table3 — particularly the large share of U.S. immigrants from Latin America—explain most
of the observed skill differences between immigrants to the three destination countries.
�+�,��� ��������������������%������
The Australian and U.S. censuses provide very similar measures of English language
proficiency. Respondents were first asked whether they speak a language other than English
at home, and then only those who answered affirmatively were asked how well they speak
English, with possible responses of “very well,” well,” “not well,” or “not at all.” For the
Australian and U.S. data, we define individuals as “fluent in the destination country
language” if they speak only English or else report speaking English “very well” or “well.”
Unfortunately, the language information available in the Canadian census is not directly
comparable. In the Canadian data, we define individuals as fluent in the destination country
language if they are able to conduct a conversation in either English or French.11
Given these definitions, Table 4 reports for each destination country the percent of
immigrant men who are fluent in the destination country language, by five-year arrival
cohorts.12 In all three destination countries, immigrant fluency rates rise monotonically with
the length of time since arrival. This pattern is largely due to the fact that immigrants who
do not speak the destination country language when they arrive tend to acquire fluency over
time as they adapt to their new home. We must caution, however, that differences between
immigrant arrival cohorts observed at a single point in time may reflect permanent
differences between these cohorts as well as the changes that occur for a given cohort as it
spends more time in the destination country.13
11 In their study of immigrants to Canada and the United States, Duleep and Regets (1992) use these same
definitions in an attempt to create roughly comparable measures of language fluency from the 1981 Canadian census and the 1980 U.S. census.
12 The intervals listed in Table 4 (and in subsequent tables) for the immigrant arrival cohorts are those that pertain to the Australian and Canadian data; the slightly different immigrant cohorts that pertain to the U.S. data are as follows: pre-1970, 1970-74, 1975-79, 1980-84, and 1985-90. For ease of exposition, henceforth we will refer to particular immigrant cohorts using the year intervals that pertain to the Australian and Canadian data, with the implied understanding that in the U.S. data the actual cohort intervals begin and end one year earlier.
13 By tracking cohorts of U.S. immigrants between the 1980 and 1990 censuses, Carliner (1995, 1996) and Funkhouser (1996) show that English proficiency does indeed improve markedly with duration of U.S. residence and that this improvement plays an important role in immigrant wage growth.

8
For every arrival cohort, fluency rates are lower for U.S. immigrants than for
Australian and Canadian immigrants, and the fluency deficit of U.S. immigrants is
particularly large for cohorts arriving after 1970. For example, among the most recent
immigrants (those arriving within five years of the census), only 61 percent of U.S.
immigrants are fluent, as compared to 82 percent of Australian immigrants and 91 percent of
Canadian immigrants. Even among immigrants who have spent 15-20 years in the
destination country (1971-75 arrivals), the fluency rate of U.S. immigrants (80 percent) is
well below that of Australian immigrants (93 percent) and Canadian immigrants (97
percent). Given the substantial weight that the immigration point systems used in Australia
and Canada have typically placed on language skills, these data seem to indicate that the
Australian and Canadian point systems have been effective at tilting the immigration flow
towards those proficient in the language of the destination country. In Table 4, the relative
fluency of Canadian immigrants is probably overstated because of the particular wording of
the language questions asked in the Canadian census. Recall, however, that the virtually
identical language questions asked in the Australian and U.S. censuses produce fluency
measures for these two countries that are directly comparable to each other. Moreover, the
sheer magnitude of the fluency deficit observed for U.S. immigrants suggests that at least a
portion of this deficit is real.
To learn more about the source of the fluency deficit for U.S. immigrants, Table 5
reports fluency rates separately by immigrant region of birth.14 In this table, we limit the
sample to immigrants have been in the destination country for ten years or less. The fluency
rates for Canadian immigrants are generally much higher than those observed for immigrants
in the other two countries, but once again these high rates may well be an artifact of the way
that fluency is measured in the Canadian data. More interesting and informative is the
comparison between Australia and the United States. Fluency rates are quite similar for
Australian and U.S. immigrants who come from the same source region. The last two rows
of Table 5 show that the overall fluency rate for U.S. immigrants (65 percent) falls well short
of the Australian rate (80 percent) almost entirely because the United States is home to a
14 In Table 5, we exclude immigrants from the four source regions listed in Table 3 that cannot be defined for all
three destination countries. The excluded regions are the following: United States, Other North America, Oceania/Antarctica, and Other.

9
large population of Latin American immigrants who tend to speak English poorly. When we
exclude immigrants from Central and South America, the U.S fluency rate jumps to 79
percent, whereas the Australian fluency rate rises only very slightly to 81 percent.
+�$�� ����
The second immigrant skill measure we analyze is education. Table 6 reports the
results of least squares regressions in which the dependent variable is years of schooling and
the independent variables include dummies identifying immigrants from various arrival
cohorts.15 The samples for these regressions include natives as well as immigrants. In the
columns labeled (1), no other independent variables are included in the regressions, so the
intercepts represent the average education level of natives in each destination country, and
the coefficients on the immigrant cohort dummies show the education differentials between
immigrants of each arrival cohort and natives. U.S. natives display the highest mean
education level, 13.4 years, followed by Canadian natives with 12.6 years and Australian
natives with 12.3 years.16 U.S. immigrants, however, have substantially lower levels of
educational attainment than U.S. natives, with the deficit ranging between one and two years,
depending on the arrival cohort. This contrasts with Australian and Canadian immigrants,
who tend to have more schooling than natives in their respective destinations. The education
levels of U.S. immigrants are low not just relative to U.S. natives, but also when compared
directly with those of other immigrants. For all cohorts arriving after 1970, immigrants to
Australia or Canada average at least a year more schooling than do U.S. immigrants from the
same cohort.
The columns labeled (2) in Table 6 present education regressions that also include
dummy variables identifying five-year age groups, with the dummy for ages 25-29 omitted.
In these regressions, the intercepts now represent the average education level of 25-29 year-
old natives, the immigrant cohort coefficients measure immigrant-native differences after
conditioning on age, and the coefficients on the age dummies reflect education differentials
between each age group and 25-29 year-olds. The age coefficients capture the secular rise in
15 All of the regression tables presented in the paper report robust standard errors in parentheses. 16 This pattern of education differences across the three countries is similar to what Evans, Kelley, and Wanner
(1998) and Reitz (1998) report.

10
schooling levels that took place over this period, particularly in Canada, where average
educational attainment is sharply higher for those born after 1940. Controlling for age,
however, has little effect on the estimated immigrant-native schooling differentials or on the
conclusion that the United States is less successful than Australia and Canada at attracting
well-educated immigrants.
Table 7 shows immigrant educational attainment by region of birth for post-1980/81
arrivals. The first three columns report average years of schooling for each immigrant
group. Among immigrants from a particular source region, the education level of U.S.
immigrants typically matches or exceeds that of Australian and Canadian immigrants, yet on
the whole U.S. immigrants average about a year and a half less schooling than immigrants in
the other two destination countries. As was the case with language fluency, the explanation
for this pattern is the large immigration flow from Latin America to the United States. U.S.
immigrants from Central and South America average less than ten years of schooling, and
excluding this group from the calculations causes the mean education level of U.S.
immigrants to shoot up from 11.7 years to 13.9 years. Considering only those who originate
from outside of Latin America, U.S. immigrants average half a year ���� schooling than
immigrants to Australia and Canada.
Because of differences across countries in educational practices and in the census
questions used to elicit information about educational attainment, the years of schooling
variable we have constructed may suffer from comparability problems. To a large extent,
however, we would expect such factors to impact measured schooling in similar ways for
immigrants and natives in the same destination country. It is therefore useful to examine a
measure of immigrant education that is defined relative to the education level of natives in
the destination country, because in this way we may be able to mitigate biases from country-
specific idiosyncrasies in the measurement of schooling levels. The last three columns of
Table 7 report a relative education measure, here defined as the difference in average years
of schooling between a particular immigrant group and natives in the same destination
country. Because of the relatively high education level of U.S. natives, by this measure U.S.
immigrants remain somewhat less educated than Australian and Canadian immigrants even
after we exclude those originating from Latin America. In particular, considering only
immigrants who arrived after 1980/81 and who were not born in Latin America, Australian

11
immigrants average a year more schooling than Australian natives and Canadian immigrants
average three-quarters of a year more schooling than Canadian natives. The relative
education advantage for U.S. immigrants of one-half year is smaller than the corresponding
education advantages observed for Australian and Canadian immigrants, but note that
including Latin American immigrants in the calculation results in U.S. immigrants averaging
1.68 years ���� schooling than U.S. natives. Regardless of whether immigrant education
levels are measured in absolute terms or relative to natives, the educational gap between U.S.
immigrants and immigrants in the other two destination countries arises primarily because
the United States receives a large flow of poorly-educated immigrants from Latin America.
Tables 6 and 7 provide information about average schooling levels. Immigration
point systems like those used in Australia and Canada might be particularly effective at
screening out immigrants from the bottom tail of the education distribution. In our data,
however, the patterns evident at low education levels are similar to those just described for
average education levels. For example, among immigrants arriving after 1980/81, the share
with ten or fewer years of schooling is 15.8 percent in Australia, 15.7 percent in Canada, and
29.9 percent in the United States.17 Excluding immigrants from Latin America barely affects
the Australian and Canadian calculations but drops the share for U.S. immigrants to 13.8
percent. Once immigrants from Latin America are excluded, U.S. immigrants are less likely
than Australian and Canadian immigrants to possess low levels of schooling.
+��� ���
The final immigrant skill measure we analyze is personal income. Ideally, we would
prefer to use data on earnings rather than income, but the Australian census does not
distinguish earnings from other income sources.18 To increase the correspondence between
income and earnings, we now restrict the samples to employed men.19 The Australian data
report employment during the census survey week and “usual” weekly income, whereas the
17 The corresponding shares among natives are 32.2 percent in Australia, 21.1 percent in Canada, and 8.1 percent
in the United States. 18 Earnings information is available in the Canadian and U.S. censuses, however, and for these two countries we
have replicated the analyses reported below using earnings rather than income as the dependent variable. The income and earnings regressions produce similar results.
19 In the Canadian sample, we also exclude immigrants who arrived during the census year (1991), because income data are not available for these recent arrivals.

12
Canadian and U.S. data on employment and income refer to the calendar year preceding the
census. The Canadian and U.S. income data have been converted to a weekly basis so as to
match the Australian data.20
Tables 8 and 9 present estimates from least squares regressions in which the
dependent variable is the natural logarithm of weekly personal income, and the samples pool
immigrant and native men. Two specifications are reported for each destination country. In
the first specification, the independent variables include immigrant arrival cohort dummies,
age dummies, controls for geographic location, and indicators for hours worked during the
census survey week. The coefficients of the geographic location and weekly hours of work
variables are restricted to be the same for immigrants and natives, whereas the coefficients of
the age dummies are allowed to vary by nativity. The second specification adds as
regressors years of schooling and indicators for fluency in the language of the destination
country, and here the return to education can vary by nativity.
Table 8 reports the immigrant cohort coefficients from these regressions. These
coefficients have been normalized to represent immigrant-native income differentials for
men who are aged 25-29 (in both specifications) and who have 12 years of schooling (in
specification (2)). Table 9 reports the coefficients of the age, education, and fluency
variables. Note that the interactions between nativity and age in these regressions imply that
the immigrant-native income gaps presented in Table 8 for ages 25-29 will differ at older
ages.
Figure 1 provides a convenient way of summarizing the immigrant-native income
differentials implied by these regressions. Based on the specification that does not control
for education and fluency, the top panel of Figure 1 shows the predicted log income
differentials between immigrant and native men, by destination country and immigrant
arrival cohort.21 The bottom panel of Figure 1 is the same as the top panel, except that the
20 Another difference between the income measures available for each country is that the Australian census
reports income in fourteen intervals, whereas the Canadian and U.S. censuses provide continuous measures of income. For Australia, we use the midpoints of the reported income intervals to construct the income variable employed in our regressions. For Canada and the United States, the results reported here employ a continuous income variable, but we obtain similar results when we instead group these data into intervals and assign midpoints so as to mimic the Australian data.
21 To control for age differences, both across countries and between immigrants and natives within a country, these calculations assign the same age distribution to all groups. In particular, we use the age distribution observed for our sample of U.S. immigrants: 20.2 percent are in the 25-29 age range, 20.7 percent are 30-34, 17.5 percent are 35-39, 14.8

13
bottom panel is based on the regression specification that adds controls for education and
fluency.22 In other words, the top panel of Figure 1 corresponds to specification (1) in
Tables 8 and 9, whereas the bottom panel of the figure corresponds to specification (2).
A word of caution is in order about interpreting these graphs. Because analyses of
immigrant outcomes using a single cross section of data cannot distinguish assimilation and
cohort effects, the plots do not portray the life-cycle trajectories of immigrants as they gain
experience in the destination country labor market. Instead, the graphs are only intended to
illustrate the income differences between immigrants of various arrival cohorts and natives at
a given point in time.
Figures 1 tells an interesting story. Without controlling for education and fluency,
the income disadvantage of immigrants relative to natives is most severe in the United States
and smallest in Australia, with Canada falling in between (see the top panel of Figure 1).
Once we condition on education and fluency, however, immigrant-native income
differentials for the United States shrink dramatically, with the U.S. differentials now smaller
than those observed in Canada and sometimes even Australia (see the bottom panel of Figure
1). For example, without controls for education and fluency, immigrants who have been in
the destination country for 11-15 years (i.e., 1976-80 arrivals) possess income deficits
relative to natives of 7.6 percent in Australia, 15.9 percent in Canada, and 32.3 percent in the
United States. After controlling for education and fluency, the corresponding income
deficits are 2.4 percent for Australian immigrants, 7.5 percent for Canadian immigrants, and
2.7 percent for U.S. immigrants. The comparison between the top and bottom panels of
Figure 1 suggests that the smaller income deficits (relative to natives) observed for
Australian and Canadian immigrants than for U.S. immigrants are largely explained by the
higher levels of education and fluency possessed by Australian and Canadian immigrants.
Indeed, after conditioning on these observable skill measures, the relative incomes of U.S.
immigrants compare favorably with those of Canadian immigrants for all arrival cohorts, and
they compare favorably with those of Australian immigrants for cohorts that have been in the
percent are 40-44, 11.2 percent are 45-49, 9.0 percent are 50-54, and 6.7 percent are 55-59. Because the immigrant-native income differentials estimated for each country are allowed to vary by age group, the overall differentials shown in Figure 1 depend on the particular age distribution used. However, similar patterns emerge from using the age distributions observed for any of the immigrant or native samples in our three destination countries.
22 The calculations displayed in the bottom panel of Figure 1 pertain to individuals with 12 years of education.

14
destination country for more than ten years.
In Australia, immigrant-native income differences are relatively small to begin with
and essentially disappear after controlling for education and fluency. Consistent with
previous research, the Australian data show little correlation between an immigrant’s income
and his year of arrival.23 In addition, Table 9 indicates that Australian immigrants earn the
same return to education as Australian natives, whereas the Canadian and U.S. data show the
expected pattern of a lower return to education for immigrants.24 Evidently, both in terms of
the intercept and the return to education, the wage structure is similar for immigrants and
natives in Australia.
Tables 10 and 11 and Figure 2 replicate the preceding analysis of immigrant-native
income differentials, but now using samples from each country that exclude immigrants born
in Central and South America. With respect to comparisons of the relative incomes of
immigrants in the three destination countries, notice that the ��� panel of Figure 2 resembles
the ����� panel of Figure 1. Excluding Latin American immigrants (Figure 2) dramatically
shrinks immigrant-native income differentials in the United States, resulting in income gaps
for U.S. immigrants that are smaller than those of Canadian immigrants and some groups of
Australian immigrants. With Latin American immigrants included in the samples (Figure 1),
recall that controlling for education and fluency generated this same general pattern of
results. Given our earlier findings that unskilled immigration from Latin America explains
why U.S. immigrants overall have lower levels of education and English fluency than
Australian and Canadian immigrants, it is not surprising that the impact of excluding Latin
American immigrants on immigrant-native income differentials in the three countries is
similar to the impact of controlling for education and fluency.
23 Borjas (1988) reports this result in his analysis of data from the 1981 Australian census. McDonald and
Worswick (1999) analyze microdata from the Australian Income Distribution Surveys of 1982, 1986, and 1990. They find little evidence of statistically significant cohort and assimilation effects on the earnings of Australian immigrants.
24 The standard interpretation of this pattern is that schooling acquired by immigrants in their home country transfers imperfectly to the destination country’s labor market (Chiswick 1978). The failure of the Australian data to conform to the expected pattern may be due in part to the limited information about educational attainment available in the census. Analyzing unique data with detailed information about the types of education obtained and how much of this education was obtained abroad and how much was obtained in Australia, Chapman and Iredale (1993) find that Australian immigrants are paid a higher wage premium for schooling received in Australia than for foreign schooling.
15
+����� �����
Census data for 1990/91 indicate that Australian and Canadian immigrants have
higher levels of English fluency, education, and income (relative to natives) than do U.S.
immigrants. This skill deficit for U.S. immigrants arises primarily because the United States
receives a much larger share of immigrants from Latin America than do the other two
countries.
In his analysis of earlier census data for Canada and the United States, Borjas reports
a similar finding: “Differences in the national-origin mix of immigrants arriving in Canada
and the United States since 1965 are mainly responsible for the higher average skills and
relative wages of immigrants in Canada” (Borjas 1993, p. 35). The large U.S. immigration
flow from Latin America plays a leading role in this story, although not quite as dominant a
role in Borjas’s version of the story as it does in ours.25 From his analysis, Borjas concludes
that the Canadian “point system works because it alters the national-origin mix of immigrant
flows” (Borjas 1993, p. 40).
We do not believe, however, that our analysis provides much support for the
proposition that the skills of U.S. immigrants would improve if the United States were to
adopt an immigration point system similar to those in Australia and Canada. For several
reasons, we strongly suspect that the Australian and Canadian point systems are not the
primary reason that these countries receive few Latin American immigrants relative to the
United States. First of all, the United States shares a long border and a long history with
Mexico, and these factors undoubtedly contribute to the large presence of Latin American
immigrants in the United States. Second, Australia and Canada never received many
immigrants from Latin America, even before immigration point systems were introduced in
Australia in the 1970s and Canada in the late 1960s (see Reitz 1998, Table 1.1, pp. 10-12).
Finally, much of U.S. immigration from Latin America is undocumented (Warren and Passel
1987; Woodrow and Passel 1990) and subject to limited official control (Bean, Espenshade,
White, and Dymowski 1990; Donato, Durand, and Massey 1992; Kossoudji 1992). A point
system that screens legal immigrants for skills may do little to raise the skills or restrict the
25 See footnote 10 of Borjas (1993).

16
entry of Latin American immigrants to the United States, because these immigrants seem to
find it relatively easy to enter outside of the official admissions system.

17
-����� �� Australian Department of Immigration, Local Government and Ethnic Affairs (ADILGEA)
(1991). Efficiency Audit, Department of Immigration, Local Government and Ethnic Affairs, Audit Report No. 11, 1991 - 1992. Canberra: Australian Government Printing Service.
Bean, Frank D.; Espenshade, Thomas J.; White, Michael J.; and Dymowski, Robert F.
“Post-IRCA Changes in the Volume and Composition of Undocumented Migration to the United States: An Assessment Based on Apprehensions Data.” In ��� ������������������ ��� ������������������ ��������� ������������ ����� ������ !�, edited by Frank D. Bean, Barry Edmonston, and Jeffrey S. Passel. Washington, DC: Urban Institute Press, 1990, pp. 111-58.
Borjas, George J. �������������� "������� ��� ��� ���� #���� ���$��� %�������� �� ���
����������. Kalamazoo, Mich.: W.E. Upjohn Institute for Employment Research, 1988.
______. “Immigration and Self-Selection.” In �����������&�'����&���������#�������$��,
edited by John M. Abowd and Richard B. Freeman. Chicago: University of Chicago Press, 1991, pp. 29-76.
______. “Immigration Policy, National Origin, and Immigrant Skills: A Comparison of
Canada and the United States.” In ������"������� ���'������������#�������$���������� ������������� ��������������������������������, edited by David Card and Richard B. Freeman. Chicago: University of Chicago Press, 1993, pp. 21-43.
______. “Assimilation and Changes in Cohort Quality Revisited: What Happened to
Immigrant Earnings in the 1980s?” (����������#����� ����� �, April 1995, 13(2), pp. 201-45.
Boyd, Monica. “Immigration Policies and Trends: A Comparison of Canada and the United
States.” "��������), February 1976, 18(1), pp. 83-104. Bureau of Immigration Research, Statistics Section. (1991). Settler Arrivals 1989-1990,
Statistical Report No. 3. Canberra: Australian Government Printing Service. Briggs, Vernon M., Jr. (1984). Immigration Policy and the American Labor Force.
Baltimore: The Johns Hopkins University Press. Card, David, and Freeman, Richard B., editors. ������"������� ���'������������#����
���$���� ���� �� ������������� �� ���������� ���� ���������� ������. Chicago: University of Chicago Press, 1993.
Carliner, Geoffrey. “The Language Ability of U.S. Immigrants: Assimilation and Cohort
Effects.” Working Paper 5222. Cambridge, MA: NBER, 1995.

18
______. “The Wages and Language Skills of U.S. Immigrants.” Working Paper 5763.
Cambridge, MA: NBER, 1996. Chapman, Bruce J., and Iredale, Robyn R. “Immigrant Qualifications: Recognition and
Relative Wage Outcomes.” ��������������������������*��+, Summer 1993, 27(2), pp. 359-87.
Chiswick, Barry R. “The Effect of Americanization on the Earnings of Foreign-Born Men.”
(����������%����� ���� ����), October 1978, 86(5), pp. 897-921. ______. (1987). “Immigration Policy, Source Countries, and Immigrant Skills: Australia,
Canada, and the United States” in The Economics of Immigration. Proceedings of Conference held at the Australian National University. Canberra: Australian Government Printing Service.
Cobb-Clark, Deborah A. (1990). Immigrant Selectivity: The Roles of Household Structure
and U.S. Immigration Policy. PhD dissertation, Economics Department, University of Michigan. Ann Arbor: University of Michigan.
Donato, Katharine M.; Durand, Jorge; and Massey, Douglas S. “Stemming the Tide?
Assessing the Deterrent Effects of the Immigration Reform and Control Act.” "��������), May 1992, 29(2), pp. 139-157.
Duleep, Harriet Orcutt and Mark C. Regets (1992). “Some Evidence on the Effects of
Admissions Criteria on Immigrant Assimilation” in Immigration, Language and Ethnic Issues: Canada and the United States. Barry R. Chiswick, editor. Washington: American Enterprise Institute&410 - 439.
Employment and Immigration Canada. (1992). Immigration Statistics 1991. Quebec:
Employment and Immigration Canada. Evans, M.D.R.; Kelley, Jonathan; and Wanner, Richard A. “The Consequences of Divorce
for Children’s Education: Australia, Canada, and the U.S.A., 1940-1990.” Manuscript. Canberra, Australia: Australian National University, 1998.
Freeman, Richard B., and Katz, Lawrence F. “Rising Wage Inequality: The United States
Vs. Other Advanced Countries.” In ,��$���������"��������� �����, edited by Richard B. Freeman. New York: Russell Sage Foundation, 1994, pp. 29-62.
Funkhouser, Edward. “How Much of Immigrant Wage Assimilation is Related to English
Language Acquisition?” Manuscript. Santa Barbara, CA: University of California, 1996.
Green, Alan. G. (1995). “A Comparison of Canadian and US Immigration Policy in the

19
Twentieth Century” in Diminishing Returns: The Economics of Canada's Recent Immigration Policy. D. J. DeVortez, editor. Toronto and Vancouver: C.D. Howe Institute and The Laurier Institution.
Green, Alan G. and David A. Green. (1995). “Canadian Immigration Policy: The
Effectiveness of the Point System and Other Instruments.” Canadian Journal of Economics .)(4b): 1006 - 1041.
Gregory, Robert G., and Daly, Anne E. “Welfare and Economic Progress of Indigenous
Men of Australia and the U.S., 1980-1990.” Manuscript. Canberra, Australia: Australian National University, 1994.
Jasso, Guillermina and Mark R. Rosenzweig (1995). “Do Immigrants Screened for Skills Do
Better than Family Reunification Immigrants?” International Migration Review ./(1): 85 -111.
Kossoudji, Sherrie A. “Playing Cat and Mouse at the U.S.-Mexican Border.” "��������),
May 1992, 29(2), pp. 159-80. Lack, John and Jacqueline Templeton. (1995). Bold Experiment: A Documentary History of
Australian Immigration Since 1945. Melbourne: Oxford University Press. McDonald, James T., and Worswick, Christopher. “The Earnings of Immigrant Men in
Australia: Assimilation, Cohort Effects, and Macroeconomic Conditions.” � ����� ��� ���, March 1999, 75(228), pp. 49-62.
Price, Charles. “Australia.” In '���%����� ���������������%��� ���, edited by Daniel Kubat.
New York: Center for Migration Studies, 1979, pp. 3-18. Reimers, David M., and Troper, Harold. (1992). “Canadian and American Immigration
Policy since 1945” in Immigration, Language and Ethnic Issues: Canada and the United States. Barry R. Chiswick, editor. Washington: American Enterprise Institute, 15-54.
Reitz, Jeffrey G. ,�������������,�� ������'����� ��������������� ����� ��� ��������
��������������"���������-�����������������. Boulder, Colo.: Westview Press, 1998. Statistics Canada, Housing, Family, and Social Statistics Division (1990). Immigrants in
Canada: Selected Highlights. Ottawa: Canadian Government Printing Centre. U.S. Department of Justice, Immigration and Naturalization Service. (1991). 1990 Statistical
Yearbook of the Immigration and Naturalization Service. Washington: U.S. Government Printing Office.

20
Vialet, Joyce C. (1989). Immigration: Numerical Limits and the Preference System.
Washington: Congressional Research Service, Library of Congress. Vialet, Joyce C. and Larry M. Eig. (1990). Immigration Act of 1990 (P.L. 101-649).
Washington: Congressional Research Service, Library of Congress. Warren, Robert, and Passel, Jeffrey S. 1987. “A Count of the Uncountable: Estimates of
Undocumented Aliens Counted in the 1980 United States Census.” "��������), August 1987, 24(3), pp. 375-93.
Wright, Robert E., and Maxim, Paul S. “Immigration Policy and Immigrant Quality:
Empirical Evidence from Canada.” (����������%����������� ����� �, November 1993, 6(4), pp. 337-52.
Woodrow, Karen A., and Jeffrey S Passel. “Post-IRCA Undocumented Immigration to the
United States: An Assessment Based on the June 1988 CPS.” In ��� ������������������������������������������������������������ ����������� !�, edited by Frank D. Bean, Barry Edmonston, and Jeffrey S. Passel. Washington, DC: Urban Institute Press, 1990, pp. 33-72.
������������ ������������������������������� ����������������
�� ����
������
�������������
�������
�����
�� �������
���� ��� ��������
Spo
uses
, fia
ncée
s, u
nmar
ried
dep
ende
nt c
hild
ren,
ch
ildr
en u
nder
18
bein
g ad
opte
d, p
aren
ts m
eetin
g ba
lanc
e of
fam
ily
test
, age
d de
pend
ent r
elat
ives
, la
st r
emai
ning
bro
ther
s, s
iste
rs o
r ad
ult c
hild
ren,
or
phan
ed, u
nmar
ried
rel
ativ
es u
nder
18,
spe
cial
ne
ed r
elat
ives
of
an A
ustr
alia
n ci
tize
n or
lega
l pe
rman
ent r
esid
ent.
�����������������
Non
depe
nden
t chi
ldre
n, n
onde
pend
ent b
roth
ers
or
sist
ers,
non
depe
nden
t nie
ces
or n
ephe
ws,
no
ndep
ende
nt p
aren
ts n
ot m
eeti
ng th
e ba
lanc
e of
fa
mil
y te
st. ���������������
������ �������
�� ��������
���!�������� ������ �� ��
��Su
cces
sful
bus
ines
s pe
rson
s in
tend
ing
to m
igra
te
as s
hare
hold
ers
or s
ole
owne
rs o
f a
busi
ness
. ���"��������#�����������
Indi
vidu
als
wit
h sp
ecia
l or
uniq
ue ta
lent
s of
ob
viou
s be
nefi
t to
Aus
tral
ia.
�������$��������
Uns
pons
ored
app
lica
nts
who
se e
duca
tion,
ski
lls,
and
read
y em
ploy
abil
ity w
ill c
ontr
ibut
e to
the
Aus
tral
ian
econ
omy.
���������������
������%
������ ���
�������
�����
�� �����
: Sp
ouse
s, u
nmar
ried
chi
ldre
n le
ss th
an 2
1,
pare
nts
and
gran
dpar
ents
, orp
hane
d un
mar
ried
ne
phew
s, n
iece
s an
d gr
andc
hild
ren
less
than
18,
an
d ch
ildre
n le
ss th
an 1
3 to
be
adop
ted.
������ �������
�� �������
�����������&�����'����
Oth
er r
elat
ives
incl
udin
g si
blin
gs, m
arri
ed
child
ren,
aun
ts o
r un
cles
, gra
ndch
ildre
n, p
aren
ts,
niec
es o
r ne
phew
s, g
rand
pare
nts.
���������������
���!���������
��� �������
������(�� �$ ��� ���
Tho
se w
ho in
tend
to e
stab
lish
or b
uy in
tere
st in
a
busi
ness
suc
h th
at jo
bs w
ill b
e cr
eate
d.
��������'���� ���
Tho
se w
ho in
vest
a m
inim
um a
mou
nt in
sm
all
busi
ness
es w
hich
con
trib
ute
to jo
b gr
owth
. ����������)(�$�������
Tho
se e
stab
lishi
ng a
bus
ines
s cr
eatin
g a
job
oppo
rtun
itie
s an
d co
ntri
buti
ng to
the
econ
omy,
cu
ltur
e or
art
istic
life
of
Can
ada.
������*�#� �����$���������
Oth
er in
divi
dual
s se
lect
ed f
or th
eir
labo
ur
mar
ket s
kills
. ��������������
������%
������ ���
����+
�� �������,��������
�� �������
����� ���� ��� ������
Adu
lt un
mar
ried
chi
ldre
n of
U.S
. citi
zens
. (2
0%
of o
vera
ll lim
itatio
n.)
����������� ��� ������
Spou
ses
and
unm
arri
ed c
hild
ren
of le
gal
perm
anen
t res
iden
ts.
(26%
of
over
all l
imita
tion
an
d an
y no
t req
uire
d fo
r fi
rst p
refe
renc
e.)
����#� ��� ��� ������
Mem
bers
of
the
prof
essi
ons
or p
erso
ns o
f ex
cept
iona
l abi
lity
in th
e sc
ienc
es o
r th
e ar
ts.
(10%
of
over
all l
imita
tion.
) ����� �#�� ��� ������
Mar
ried
chi
ldre
n of
U.S
. cit
izen
s. (
10%
of
over
all l
imita
tion
and
any
not
req
uire
d fo
r fi
rst
thre
e pr
efer
ence
s.)
�������#�� ��� ������
Sibl
ings
of
U.S
. cit
izen
s ag
ed 2
1 or
old
er.
(24%
of
the
over
all l
imita
tion
and
any
not
req
uire
d fo
r th
e fi
rst f
our
pref
eren
ces.
) �����-�#�� ��� ������
Skill
ed a
nd u
nski
lled
wor
kers
in s
hort
sup
ply.
(1
0% o
f ov
eral
l lim
itatio
n.)
���+��$ ��� ������
All
oth
er im
mig
rant
s. (
Any
num
bers
not
re
quir
ed f
or f
irst
six
pre
fere
nces
.)
�����+�
� ������������������
�� �������
Imm
edia
te r
elat
ives
of
U.S
. cit
izen
s, in
clud
ing
spou
ses,
unm
arri
ed m
inor
chi
ldre
n, a
nd p
aren
ts
of a
dult
U.S
. citi
zens
. A
lso
incl
udes
a s
mal
l nu
mbe
r of
oth
er im
mig
rant
s.
������%
������ ���
��
�a S
ourc
es:
Aus
tral
ia (
AD
ILG
EA
, 199
1); C
anad
a (S
tati
stic
s C
anad
a, 1
990)
; Uni
ted
Stat
es (
Via
let,
1989
).

������.����� ��������������������������,���������� ������
���&���������* ���������! �����������������������
� ���&������� ����
�( �$��
,������� �����
�� ����
�� ������/0/1�//2� ���������� 24.8% 29.0% 23.3% 15.8% 15.5% ���� ������� 51.8% 55.6% 65.0% 33.0% 76.6% ���&������ 9.9% 13.5% 5.3% 49.9% 3.8% ���+��'������� 13.6% 2.0% 6.4% 1.2% 4.1% ����������� ���������� ���� 100.0% 100.0% 100.0% 100.0% 100.0% ������������+��� ��������� ����� 121,227 50,607 38,386 4,133 4,192 � ��������//�� ���������� 37.4% 36.5% 32.7% 33.1% 22.1% ���� ������ 39.4% 46.1% 40.0% 20.3% 34.1% ���&������ 23.1% 17.5% 27.3% 46.5% 43.8% ����������� ���������� ���� 100.0% 100.0% 100.0% 100.0% 100.0% ������������+��� ��������� ����� 230,781 119,955 48,055 23,986 16,087 � ���������������//2�� ����������3+�� �������,������4� 32.7% 33.0% 13.0% 44.7% 20.7% ����������3+�� ����������������4� 35.3% 32.6% 31.4% 39.7% 47.7% ���� ������ 8.2% 8.9% 8.4% 6.2% 11.7% ���&������ 14.8% 17.1% 34.1% 4.7% 11.3% ���*�#� � 9.0% 8.4% 13.1% 4.7% 8.6% ����������� ���������� ���� 100.0% 100.0% 100.0% 100.0% 100.0% ������������+��� ��������� ����� 656,111 303,217 97,108 218,163 19,524
a Sources: Australia (Bureau of Immigration Research, 1991, Table 2); Canada
(Employment and Immigration Canada, 1992, Table IM16); United States (U.S. Department of Justice, 1991, Tables 5 and 7).
b Includes Mexico, Central America, South America, and the Caribbean. c Includes immigrants admitted under the Concessional Family Migration Program. d Immigrants for whom no visa is required, including New Zealand citizens, special
eligibility migrants, Australian children born overseas, and others. e The U.S. figures reported here exclude those formerly undocumented migrants who
were legalized under the amnesty provisions of the Immigration Reform and Control Act of 1986 (IRCA).

Table 3
Region of Birth Distributions of Post-1980/81 Immigrant Arrivals
Destination Country Region of Birth Australia Canada United States United Kingdom 18.9 4.9 2.1 Europe 13.6 21.2 8.8 Middle East 5.9 8.7 4.2 Africa 4.0 8.2 3.8 China 6.2 6.0 3.5 Hong Kong 3.0 7.1 0.6 Philippines 2.4 4.0 4.1 Southern Asia 5.9 11.1 5.1 Other Asia 18.6 11.3 14.3 Central/South America 2.3 14.0 47.1 United States 2.0 2.7 n.a. Other North America 0.7 n.a. 1.4 Oceania/Antarctica 16.4 n.a. 0.6 Other n.a. 0.8 4.5 All Regions 100.0% 100.0% 100.0% Sample Size 3,315 10,148 114,754
Note: Data are from the 1991 Australian and Canadian censuses and the 1990 U.S. census. The samples include foreign-born men ages 25-59 who immigrated during 1981-91 in the Australian and Canadian data or during 1980-90 in the U.S. data. Entries of “n.a.” indicate regions of birth that cannot be defined for a particular destination country. Columns may not sum to 100 percent because of rounding error. Sampling weights were used in the U.S. calculations.

Table 4
Percent of Immigrants Fluent in Destination Country Language, by Arrival Cohort
Destination Country Immigrant Cohort Australia Canada United States Pre-1971 Arrivals 94.9 98.8 91.0 (0.3) (0.1) (0.1)
[5,864] [17,614] [95,442]
1971-75 Arrivals 93.3 97.4 79.8
(0.7) (0.2) (0.2) [1,357] [6,371] [38,770]
1976-80 Arrivals 90.9 97.0 76.5 (0.9) (0.3) (0.2)
[972] [4,424] [48,056] 1981-85 Arrivals 86.7 95.5 69.5 (1.0) (0.3) (0.2)
[1,203] [3,562] [58,948] 1986-91 Arrivals 82.4 91.1 61.3 (0.8) (0.4) (0.2)
[2,099] [6,599] [55,808] Note: Standard errors are in parentheses, and sample sizes are in brackets. Data are from the 1991 Australian and Canadian censuses and the 1990 U.S. census. The samples include foreign-born men ages 25-59. In the Australian and U.S. data, immigrants are designated as “fluent in the destination country language” if they speak only English or else report speaking English “very well” or “well.” In the Canadian data, the corresponding measure of fluency identifies immigrants who can conduct a conversation in either English or French. The intervals listed above for the immigrant arrival cohorts are those defined in the Australian and Canadian data; the slightly different immigrant cohorts defined in the U.S. data are as follows: pre-1970, 1970-74, 1975-79, 1980-84, and 1985-90. Sampling weights were used in the U.S. calculations.

Table 5
Percent of Post-1980/81 Immigrant Arrivals Fluent in Destination Country Language, by Birthplace
Destination Country Region of Birth Australia Canada United States United Kingdom 100.0 100.0 99.7 (.) (.) (0.1) Europe 75.3 89.7 77.6 (2.0) (0.7) (0.5) Middle East 71.3 95.1 88.2 (3.2) (0.7) (0.5) Africa 100.0 99.5 94.6 (.) (0.2) (0.4) China 53.9 70.0 55.5 (3.5) (1.9) (0.9) Hong Kong 81.0 96.7 81.6 (3.9) (0.7) (1.5) Philippines 98.7 99.5 94.4 (1.3) (0.3) (0.4) Southern Asia 96.4 94.5 93.5 (1.4) (0.7) (0.4) Other Asia 66.8 88.3 64.7 (1.9) (0.9) (0.4) Central/South America 57.7 94.6 51.2 (5.9) (0.6) (0.2) All Regions Listed Above 80.4 92.4 64.8 (0.7) (0.3) (0.2) All Regions, Excluding 81.0 92.0 78.6 Central/South America (0.7) (0.3) (0.2)
Note: Standard errors are in parentheses. Data are from the 1991 Australian and Canadian censuses and the 1990 U.S. census. The samples include foreign-born men ages 25-59 who immigrated during 1981-91 in the Australian and Canadian data or during 1980-90 in the U.S. data. In the Australian and U.S. data, immigrants are designated as “fluent in the destination country language” if they speak only English or else report speaking English “very well” or “well.” In the Canadian data, the corresponding measure of fluency identifies immigrants who can conduct a conversation in either English or French. Sampling weights were used in the U.S. calculations.

Table 6
Education Regressions
Destination Country Australia Canada United States Regressor (1) (2) (1) (2) (1) (2) Intercept (Natives) 12.29 12.18 12.56 12.96 13.39 13.24 (0.02) (0.03) (0.01) (0.01) (0.01) (0.03) Immigrant Cohort: Pre-1971 Arrivals 0.07 0.09 -0.09 0.38 -0.99 -0.93 (0.04) (0.04) (0.03) (0.03) (0.02) (0.02) 1971-75 Arrivals 0.10 0.10 0.43 0.50 -2.03 -2.10 (0.07) (0.07) (0.05) (0.05) (0.03) (0.03) 1976-80 Arrivals 0.61 0.59 0.45 0.36 -1.97 -2.03 (0.07) (0.07) (0.05) (0.05) (0.03) (0.03) 1981-85 Arrivals 0.49 0.47 0.63 0.49 -1.93 -1.96 (0.07) (0.07) (0.06) (0.06) (0.02) (0.02) 1986-91 Arrivals 1.05 1.04 0.62 0.44 -1.37 -1.38 (0.06) (0.05) (0.04) (0.04) (0.03) (0.03) Age Group: 30-34 0.17 -0.02 0.17 (0.04) (0.02) (0.04) 35-39 0.24 0.03 0.43 (0.04) (0.02) (0.04) 40-44 0.22 -0.13 0.57 (0.04) (0.02) (0.04) 45-49 0.07 -0.61 0.25 (0.05) (0.03) (0.05) 50-54 0.01 -1.45 -0.25 (0.05) (0.03) (0.05) 55-59 -0.15 -2.11 -0.57 (0.06) (0.03) (0.06)
Note: The dependent variable is years of schooling. The coefficients were estimated by least squares, and standard errors are shown in parentheses. Data are from the 1991 Australian and Canadian censuses and the 1990 U.S. census. The samples include men ages 25-59, with non-whites excluded from the native but not the foreign-born samples. The sample sizes for these regressions are 31,848 for Australia, 178,257 for Canada, and 340,073 for the United States. The intervals listed above for the immigrant arrival cohorts are those defined in the Australian and Canadian data; the slightly different immigrant cohorts defined in the U.S. data are as follows: pre-1970, 1970-74, 1975-79, 1980-84, and 1985-90. The reference group for the age dummies is 25-29 year-olds. Sampling weights were used in the U.S. calculations.

Table 7
Average Education of Post-1980/81 Immigrant Arrivals, by Birthplace
Average Years of Schooling Schooling Relative to Natives Region of Birth Australia Canada U.S. Australia Canada U.S. United Kingdom 13.09 14.36 14.94 0.80 1.81 1.56 (0.09) (0.10) (0.06) (0.09) (0.10) (0.06) Europe 13.28 13.08 13.74 0.99 0.54 0.33 (0.11) (0.08) (0.04) (0.11) (0.08) (0.04) Middle East 13.47 13.79 14.10 1.17 1.25 0.72 (0.21) (0.11) (0.05) (0.21) (0.11) (0.05) Africa 13.46 13.89 14.67 1.17 1.34 1.29 (0.17) (0.10) (0.05) (0.17) (0.10) (0.05) China 13.46 12.75 13.01 1.17 0.21 -0.37 (0.16) (0.17) (0.08) (0.16) (0.17) (0.08) Hong Kong 13.51 14.35 14.03 1.21 1.80 0.64 (0.22) (0.09) (0.14) (0.22) (0.09) (0.14) Philippines 14.34 13.83 14.09 2.05 1.29 0.71 (0.13) (0.12) (0.04) (0.13) (0.12) (0.04) Southern Asia 13.96 13.03 15.21 1.66 0.49 1.82 (0.18) (0.10) (0.05) (0.18) (0.10) (0.05) Other Asia 13.07 11.94 13.12 0.78 -0.60 -0.27 (0.09) (0.11) (0.04) (0.09) (0.11) (0.04) Central/South America 13.02 12.30 9.60 0.73 -0.24 -3.79 (0.23) (0.09) (0.02) (0.22) (0.09) (0.02) All Regions Listed Above 13.31 13.13 11.70 1.01 0.59 -1.68 (0.05) (0.03) (0.01) (0.05) (0.03) (0.01) All Regions, Excluding 13.31 13.27 13.85 1.02 0.73 0.46 Central/South America (0.05) (0.04) (0.02) (0.05) (0.04) (0.02) Note: Standard errors are in parentheses. Data are from the 1991 Australian and Canadian censuses and the 1990 U.S. census. The samples include men ages 25-59, with non-whites excluded from the native but not the foreign-born samples. The foreign-born samples are limited to men who immigrated during 1981-91 in the Australian and Canadian data or during 1980-90 in the U.S. data. Sampling weights were used in the U.S. calculations.

Table 8
Income Regressions Immigrant Cohort Coefficients
Destination Country Australia Canada United States Regressor (1) (2) (1) (2) (1) (2) Immigrant Cohort: Pre-1971 Arrivals -.018 .019 .079 .039 .009 .148 (.019) (.019) (.015) (.015) (.011) (.013) 1971-75 Arrivals -.030 .018 -.030 -.044 -.165 .092 (.022) (.023) (.017) (.016) (.012) (.016) 1976-80 Arrivals -.047 -.009 -.074 -.069 -.227 .042 (.027) (.027) (.017) (.017) (.011) (.016) 1981-85 Arrivals -.062 .009 -.142 -.126 -.361 -.085 (.023) (.024) (.018) (.018) (.011) (.016) 1986-91 Arrivals -.053 .001 -.438 -.403 -.529 -.275 (.021) (.021) (.017) (.018) (.012) (.016) R2 .113 .169 .115 .160 .210 .289 Sample Size 28,101 24,996 163,988 163,974 306,915 306,915 Control Variables: Age Dummies Yes Yes Yes Yes Yes Yes Education No Yes No Yes No Yes Fluency Dummies No Yes No Yes No Yes
Note: The dependent variable is the natural logarithm of weekly personal income. The coefficients were estimated by least squares, and standard errors are shown in parentheses. Data are from the 1991 Australian and Canadian censuses and the 1990 U.S. census. The samples include men ages 25-59, with non-whites excluded from the native but not the foreign-born samples. Only employed men are included in the samples. In addition to the control variables listed above, all regressions include indicators for geographic location and hours worked during the census survey week. The coefficients of the controls for geographic location, weekly hours of work, and fluency are restricted to be the same for immigrants and natives, whereas the coefficients of the age and education variables are allowed to vary by nativity. The intervals listed above for the immigrant arrival cohorts are those defined in the Australian and Canadian data; the slightly different immigrant cohorts defined in the U.S. data are as follows: pre-1970, 1970-74, 1975-79, 1980-84, and 1985-90. The immigrant cohort coefficients reported in this table have been normalized to represent immigrant-native income differentials for men who are aged 25-29 (in both specifications) and who have 12 years of education (in specification (2)). Sampling weights were used in the U.S. calculations.

Table 9
Income Regressions Age, Education, and Fluency Coefficients
Destination Country Australia Canada United States Regressor (1) (2) (1) (2) (1) (2) Age Group: 30-34 .112 .095 .255 .237 .235 .222 (.012) (.012) (.007) (.007) (.013) (.013) 35-39 .137 .120 .374 .351 .374 .335 (.013) (.013) (.007) (.007) (.013) (.013) 40-44 .173 .169 .448 .436 .497 .441 (.014) (.014) (.007) (.007) (.014) (.013) 45-49 .168 .194 .469 .489 .555 .524 (.015) (.016) (.008) (.008) (.015) (.015) 50-54 .121 .153 .452 .520 .580 .586 (.017) (.017) (.009) (.009) (.017) (.016) 55-59 .013 .050 .424 .527 .580 .601 (.020) (.022) (.010) (.010) (.018) (.017) Immigrant×Age Group: 30-34 -.046 -.036 -.108 .010 -.059 -.061 (.023) (.023) (.017) (.018) (.014) (.014) 35-39 -.009 .010 -.104 .012 -.078 -.052 (.025) (.025) (.017) (.018) (.014) (.014) 40-44 -.013 -.006 -.084 .015 -.123 -.073 (.025) (.025) (.017) (.017) (.015) (.015) 45-49 -.070 -.053 -.089 -.012 -.172 -.113 (.027) (.028) (.018) (.018) (.017) (.016) 50-54 -.106 -.071 -.125 -.048 -.197 -.150 (.030) (.031) (.019) (.019) (.019) (.018) 55-59 .026 .056 -.160 -.096 -.220 -.153 (.033) (.037) (.021) (.021) (.019) (.019) Education .057 .065 .090 (.002) (.001) (.002) Immigrant×Education -.004 -.024 -.031 (.003) (.001) (.002) Ability to Speak English (or French in Canada):
Well or Very Well -.163 -.148 -.090 (.013) (.009) (.015) Not at All or Not Well -.415 -.187 -.269 (.033) (.030) (.015)
Note: These coefficients are from the same income regressions reported in Table 8; see the note to that table for more information. Standard errors are shown in parentheses. The reference group for the age dummies is 25-29 year-olds. The reference group for the fluency dummies is men who speak only English in the Australian and U.S. data, and men who speak only English and/or French in the Canadian data.

Table 10
Income Regressions, Excluding Immigrants from Central/South America Immigrant Cohort Coefficients
Destination Country Australia Canada United States Regressor (1) (2) (1) (2) (1) (2) Immigrant Cohort: Pre-1971 Arrivals -.020 .017 .073 .037 .078 .125 (.019) (.019) (.016) (.016) (.012) (.013) 1971-75 Arrivals -.033 .013 -.008 -.009 .003 .099 (.023) (.023) (.018) (.018) (.013) (.017) 1976-80 Arrivals -.049 -.015 -.062 -.045 -.089 .010 (.028) (.028) (.018) (.018) (.013) (.018) 1981-85 Arrivals -.063 .006 -.128 -.099 -.240 -.115 (.023) (.024) (.020) (.020) (.013) (.018) 1986-91 Arrivals -.051 .002 -.440 -.388 -.381 -.281 (.021) (.021) (.019) (.019) (.013) (.018) R2 .113 .168 .113 .159 .198 .273 Sample Size 27,959 24,892 160,147 160,133 183,193 183,193 Control Variables: Age Dummies Yes Yes Yes Yes Yes Yes Education No Yes No Yes No Yes Fluency Dummies No Yes No Yes No Yes
Note: The dependent variable is the natural logarithm of weekly personal income. The coefficients were estimated by least squares, and standard errors are shown in parentheses. Data are from the 1991 Australian and Canadian censuses and the 1990 U.S. census. The samples include men ages 25-59, with non-whites excluded from the native but not the foreign-born samples. Only employed men are included in the samples. These particular regressions exclude immigrants born in Central and South America. In addition to the control variables listed above, all regressions include indicators for geographic location and hours worked during the census survey week. The coefficients of the controls for geographic location, weekly hours of work, and fluency are restricted to be the same for immigrants and natives, whereas the coefficients of the age and education variables are allowed to vary by nativity. The intervals listed above for the immigrant arrival cohorts are those defined in the Australian and Canadian data; the slightly different immigrant cohorts defined in the U.S. data are as follows: pre-1970, 1970-74, 1975-79, 1980-84, and 1985-90. The immigrant cohort coefficients reported in this table have been normalized to represent immigrant-native income differentials for men who are aged 25-29 (in both specifications) and who have 12 years of education (in specification (2)). Sampling weights were used in the U.S. calculations.

Table 11
Income Regressions, Excluding Immigrants from Central/South America Age, Education, and Fluency Coefficients
Destination Country Australia Canada United States Regressor (1) (2) (1) (2) (1) (2) Age Group: 30-34 .112 .095 .252 .236 .235 .222 (.012) (.012) (.007) (.007) (.013) (.013) 35-39 .137 .120 .370 .350 .374 .334 (.013) (.013) (.007) (.007) (.013) (.013) 40-44 .173 .169 .445 .434 .496 .441 (.014) (.014) (.007) (.007) (.014) (.013) 45-49 .168 .194 .466 .488 .555 .524 (.015) (.016) (.008) (.008) (.015) (.015) 50-54 .121 .153 .449 .518 .580 .585 (.017) (.017) (.009) (.009) (.017) (.016) 55-59 .013 .050 .421 .525 .580 .601 (.020) (.022) (.010) (.010) (.018) (.017) Immigrant×Age Group: 30-34 -.048 -.035 -.101 .018 -.022 -.018 (.023) (.023) (.019) (.019) (.015) (.015) 35-39 -.008 .011 -.091 .029 -.010 .026 (.025) (.025) (.018) (.019) (.016) (.015) 40-44 -.007 .001 -.075 .025 -.038 .021 (.025) (.025) (.018) (.018) (.016) (.016) 45-49 -.068 -.050 -.072 .006 -.057 .004 (.027) (.028) (.019) (.019) (.018) (.018) 50-54 -.104 -.068 -.119 -.034 -.104 -.043 (.030) (.032) (.020) (.020) (.020) (.019) 55-59 .026 .058 -.153 -.080 -.137 -.051 (.033) (.037) (.022) (.022) (.021) (.020) Education .057 .064 .090 (.002) (.001) (.002) Immigrant×Education -.004 -.024 -.029 (.003) (.001) (.002) Ability to Speak English (or French in Canada):
Well or Very Well -.164 -.171 -.089 (.013) (.010) (.018) Not at All or Not Well -.425 -.222 -.236 (.034) (.032) (.023)
Note: These coefficients are from the same income regressions reported in the Table 10; see the note to that table for more information. Standard errors are shown in parentheses. The reference group for the age dummies is 25-29 year-olds. The reference group for the fluency dummies is men who speak only English in the Australian and U.S. data, and men who speak only English and/or French in the Canadian data.

��������������� ���������������� �������������������
��������������������������������������������
-0.7
-0.6
-0.5
-0.4
-0.3
-0.2
-0.1
0
0.1
0.2
0-5 6-10 11-15 16-20 21+
�����!���������������� ���������������
"��� ������������������
#����������������������������������������
-0.7
-0.6
-0.5
-0.4
-0.3
-0.2
-0.1
0
0.1
0.2
0-5 6-10 11-15 16-20 21+
�����!���������������� ���������������
"��� ������������������
��������� ����� $�!�

�������%������� ���������������� �������������������
�&�������"�������������� ���������
��������������������������������������������
-0.7
-0.6
-0.5
-0.4
-0.3
-0.2
-0.1
0
0.1
0.2
0-5 6-10 11-15 16-20 21+
�����!���������������� ���������������
"��� ������������������
#����������������������������������������
-0.7
-0.6
-0.5
-0.4
-0.3
-0.2
-0.1
0
0.1
0.2
0-5 6-10 11-15 16-20 21+
�����!���������������� ���������������
"��� ������������������
��������� ����� $�!�

IZA Discussion Papers No.
Author(s) Title
Area Date
290 D. A. Cobb-Clark M. D. Connolly C. Worswick
The Job Search and Education Investments of Immigrant Families
1 04/01
291 R. T. Riphahn Cohort Effects in the Educational Attainment of Second Generation Immigrants in Germany: An Analysis of Census Data
1 05/01
292 E. Wasmer Between-group Competition in the Labor Market and the Rising Returns to Skill: US and France 1964-2000
5 05/01
293 D. Cobb-Clark T. F. Crossley
Gender, Comparative Advantage and Labor Market Activity in Immigrant Families
1 05/01
294 Š. Jurajda Estimating the Effect of Unemployment Insurance Compensation on the Labor Market Histories of Displaced Workers
3 05/01
295 F. Duffy P. P. Walsh
Individual Pay and Outside Options: Evidence from the Polish Labour Force Survey
4 05/01
296 H. S. Nielsen M. Rosholm N. Smith L. Husted
Intergenerational Transmissions and the School-to-Work Transition of 2nd Generation Immigrants
1 05/01
297 J. C. van Ours J. Veenman
The Educational Attainment of Second Generation Immigrants in The Netherlands
1 05/01
298 P. Telhado Pereira P. Silva Martins
Returns to Education and Wage Equations 5 06/01
299 G. Brunello C. Lucifora R. Winter-Ebmer
The Wage Expectations of European College Students
5 06/01
300 A. Stutzer R. Lalive
The Role of Social Work Norms in Job Searching and Subjective Well-Being
5 06/01
301
J. R. Frick G. G. Wagner
Economic and Social Perspectives of Immigrant Children in Germany
1 06/01

302
G. S. Epstein A. Weiss
A Theory of Immigration Amnesties
1 06/01
303
G. A. Pfann B. F. Blumberg
Social Capital and the Uncertainty Reduction of Self-Employment
5 06/01
304
P. Cahuc E. Wasmer
Labour Market Efficiency, Wages and Employ-ment when Search Frictions Interact with Intra-firm Bargaining
2 06/01
305
H. Bonin
Fiskalische Effekte der Zuwanderung nach Deutschland: Eine Generationenbilanz
1 06/01
306
H. Bonin G. Abío E. Berenguer J. Gil C. Patxot
Is the Deficit under Control? A Generational Accounting Perspective on Fiscal Policy and Labour Market Trends in Spain
2 06/01
307
G. A. Pfann
Downsizing
1/5 06/01
308
G. A. Pfann D. S. Hamermesh
Two-Sided Learning, Labor Turnover and Worker Displacement
1 06/01
309
G. Brunello On the Complementarity between Education and Training in Europe
5 06/01
310
U. Sunde Human Capital Accumulation, Education and Earnings Inequality
5 06/01
311
G. Brunello Unemployment, Education and Earnings Growth
3 06/01
312
C. Furnée M. Kemler G. A. Pfann
The Value of Pain Relief
5 06/01
313
A. Ferrer-i-Carbonell B. M.S. van Praag
The Subjective Costs of Health Losses due to Chronic Diseases: An Alternative Model for Monetary Appraisal
7 06/01
314
B. M.S. van Praag A. Ferrer-i-Carbonell
Age-Differentiated QALY Losses
7 06/01
315
W. H. J. Hassink R. Schettkat
On Price-Setting for Identical Products in Markets without Formal Trade Barriers
7 06/01

316
M. Frondel C. M. Schmidt
Rejecting Capital-Skill Complementarity at all Costs
5 06/01
317
R. Winkelmann
Health Care Reform and the Number of Doctor Visits – An Econometric Analysis
7 06/01
318
M. Pannenberg G. G. Wagner
Overtime Work, Overtime Compensation and the Distribution of Economic Well-Being: Evidence for West Germany and Great Britain
1 06/01
319
R. Euwals R. Winkelmann
Why do Firms Train? Empirical Evidence on the First Labour Market Outcomes of Graduated Apprentices
1 06/01
320
R. Fahr U. Sunde
Strategic Hiring Behavior in Empirical Matching Functions
1 06/01
321
P. Telhado Pereira P. Silva Martins
Is there a Return – Risk Link in Education?
5 07/01
322
O. Hübler U. Jirjahn
Works Councils and Collective Bargaining in Germany: The Impact on Productivity and Wages
1 07/01
323
A. Frederiksen E. K. Graversen N. Smith
Overtime Work, Dual Job Holding and Taxation
1 07/01
324
M. Pflüger
Trade, Technology and Labour Markets: Empirical Controversies in the Light of the Jones Model
2 07/01
325
R. A. Hart J. R. Malley U. Woitek
Real Wages and the Cycle: The View from the Frequency Domain
1 07/01
326
J. S. Earle Á. Telegdy
Privatization and Productivity in Romanian Industry: Evidence from a Comprehensive Enterprise Panel
4 07/01
327
H. Gersbach A. Schmutzler
A Product Market Theory of Training and Turnover in Firms
5 07/01
328
F. Breyer Why Funding is not a Solution to the “Social Security Crisis”
3 07/01
329
X. Gong A. van Soest
Wage Differentials and Mobility in the Urban Labor Market: A Panel Data Analysis for Mexico
1 07/01

330
D. N. Margolis K. G. Salvanes
Do Firms Really Share Rents with Their Workers?
5 07/01
331
R. Winkelmann
Why Do Firms Recruit Internationally? Results from the IZA International Employer Survey 2000
5 07/01
332
M. Rosholm An Analysis of the Processes of Labour Market Exclusion and (Re-) Inclusion
3 07/01
333
W. Arulampalam R. A. Naylor J. P. Smith
A Hazard Model of the Probability of Medical School Dropout in the United Kingdom
5 07/01
334
P. A. Puhani
Wage Rigidities in Western Germany? Microeconometric Evidence from the 1990s
1 07/01
335
R. Fahr U. Sunde
Disaggregate Matching Functions
1 07/01
336
F. Lima P. Telhado Pereira
Careers and Wage Growth within Large Firms 5 07/01
337 F. Büchel M. Pollmann-Schult
Overeducation and Skill Endowments: The Role of School Achievement and Vocational Training Quality
5 08/01
338 C. Bell H. Gersbach
Child Labor and the Education of a Society
5 08/01
339 A. Ibourk B. Maillard S. Perelman H. R. Sneessens
The Matching Efficiency of Regional Labour Markets: A Stochastic Production Frontier Estimation, France 1990-1995
1 08/01
340 X. Wauthy Y. Zenou
How Does Imperfect Competition in the Labor Market Affect Unemployment Policies?
3 08/01
341 S. Kohns Testing for Asymmetry in British, German and US Unemployment Data
1 08/01
342 W. Schnedler
The Virtue of Being Underestimated: A Note on Discriminatory Contracts in Hidden Information Models
5 08/01
343 H. Bonin
Will it Last? An Assessment of the 2001 German Pension Reform
3 08/01
344 E. Plug P. Berkhout
Effects of Sexual Preferences on Earnings in the Netherlands
5 08/01

345 J. Hampe M. Steininger
Survival, Growth, and Interfirm Collaboration of Start-Up Companies in High-Technology Industries: A Case Study of Upper Bavaria
5 08/01
346 L. Locher
The Determination of a Migration Wave Using Ethnicity and Community Ties
1 08/01
347 M. Lofstrom F. D. Bean
Labor Market Conditions and Post-Reform Declines in Welfare Receipt Among Immigrants
3 08/01
348 S. Neuman A. Ziderman
Can Vocational Education Improve the Wages of Minorities and Disadvantaged Groups? The Case of Israel
5 08/01
349 J. T. Addison P. Portugal
Job Search Methods and Outcomes
1 08/01
350 J. T. Addison P. Portugal
Unemployment Duration: Competing and Defective Risks
1 08/01
351 J. D. Brown J. S. Earle
Gross Job Flows in Russian Industry Before and After Reforms: Has Destruction Become More Creative?
4 08/01
352 J. T. Addison J. S. Heywood X. Wei
Unions and Plant Closings in Britain: New Evidence from the 1990/98 WERS
1 08/01
353 T. Bauer S. Bender
Flexible Work Systems and the Structure of Wages: Evidence from Matched Employer-Employee Data
5 08/01
354 J. Kluve
On the Role of Counterfactuals in Inferring Causal Effects of Treatments
6 09/01
355 J. Kluve H. Lehmann C. M. Schmidt
Disentangling Treatment Effects of Polish Active Labor Market Policies: Evidence from Matched Samples
4/6 09/01
356 C. Heady T. Mitrakos P. Tsakloglou
The Distributional Impact of Social Transfers in the European Union: Evidence from the ECHP
3 09/01
357 C. Knoppik T. Beissinger
How Rigid are Nominal Wages? Evidence and Implications for Germany
1 09/01
358 T. Beissinger O. Buesse
Bismarck versus Beveridge: Which Unemploy-ment Compensation System is More Prone to Labor Market Shocks?
3 09/01
359 M. Pflüger
A Simple, Analytically Solvable Chamberlinian Agglomeration Model
2 09/01

360 J. Hansen M. Lofstrom
The Dynamics of Immigrant Welfare and Labor Market Behavior
1/3 09/01
361 M. C. Berger J. S. Earle K. Z. Sabirianova
Worker Training in a Restructuring Economy: Evidence from the Russian Transition
4 09/01
362 J. Angrist V. Lavy
New Evidence on Classroom Computers and Pupil Learning
6 09/01
363 H. Antecol D. A. Cobb-Clark S. J. Trejo
Immigration Policy and the Skills of Immigrants to Australia, Canada, and the United States
2 09/01
An updated list of IZA Discussion Papers is available on the center‘s homepage www.iza.org.