Immigration in Malaysia
273
Immigration in Malaysia: Assessment of its Economic Effects, and a Review of the Policy and System Report Completed in Collaboration with ILMIA— Ministry of Human Resources of Malaysia 2013 Human Development Social Protection and Labor Unit East Asia and Pacific Region Document of the World Bank
-
Upload
amir-asraf-yunus -
Category
Documents
-
view
109 -
download
1
Transcript of Immigration in Malaysia
Immigration in Malaysia: Assessment of its Economic Effects, and a
Review of the Policy and System
Report Completed in Collaboration with ILMIA—Ministry of Human Resources of Malaysia
2013
Human Development Social Protection and Labor Unit
East Asia and Pacific Region
Document of the World Bank

i
Contents
ABBREVIATIONS AND ACRONYMS ................................................................................. vii
ACKNOWLEDGMENTS ............................................................................................................ x
Chapter 1: Labor Immigration in Malaysia .................................................................... 1
1.1 Background ............................................................................................................ 2
1.2 Stylized Facts......................................................................................................... 3
1.2.1 Expansion of Immigration in Malaysia (1990-2010) ...................... 6
1.3 Data Section ........................................................................................................... 9
1.3.1 Labor Force Surveys .................................................................................. 10
1.3.2 Economic Census ......................................................................................... 11
1.3.3 Crime Data from the Royal Police of Malaysia (PDRM) ............... 12
1.4 Descriptive Analysis—Workers ............................................................... 12
1.5 Descriptive Analysis—Establishments ................................................. 23
Chapter 2: Economic and Social Impacts of Immigration in Malaysia ............ 39
2.1 Objective of the Chapter ............................................................................... 40
2.2 Measurement Approach—Workers (Technical) ............................ 41
2.3 Economic Impact Analysis Results—Workers ................................. 42
2.3.1 Overall Effects on Workers ...................................................................... 42
2.3.2 Effects on Workers by Main Economic Sectors ................................ 44
2.3.3 Effects on Workers by Demographic Characteristics .................... 45
2.3.4 Effect on Worker Wages........................................................................... 50
2.4 Economic Impact of Immigration on Establishments .................. 53
2.4.1 Potential Effects on Establishments ..................................................... 53
2.4.2 Measurement Approach—Establishments ........................................ 54
2.4.3 Economic Impact Analysis Results—Establishments .................... 61
2.5 Social Impact Analysis—Effect of Immigration on Crime .......... 67
Chapter 3: Simulation of Increasing the Costs to Immigration .......................... 71
3.1 Introduction to the Simulation Exercise.............................................. 72
3.1.1 Details of the Database Construction .................................................. 72
3.1.2 Details on Skill Levels ................................................................................ 75
3.1.3 Parameterization of the Model .............................................................. 77
3.1.4 Macroeconomic Assumptions ................................................................. 78
ii
3.2 Simulation Results ........................................................................................... 79
3.2.1 Effects on Growth and Investment ....................................................... 79
3.2.2 Effects on Economic Sectors ................................................................... 84
3.2.3 Effects on Unemployment and Wages of Malaysian Workers .... 86
Chapter 4: Description of the Malaysian Immigration System ........................... 89
4.1 Introduction to the Malaysian System .................................................. 90
4.1.1 Registered Foreign Workers ................................................................... 90
4.1.1.1 Expatriates .................................................................................................... 90
4.1.1.2 Migrant Workers ........................................................................................ 96
4.2 Recruitment and Renewal Procedures ................................................ 99
4.2.1 Financial Cost ............................................................................................ 102
4.2.2 Indirect Costs ............................................................................................. 104
4.2.3 Welfare of immigrants ........................................................................... 107
4.3 Governance ....................................................................................................... 110
4.3.2 Immigration Policies, Laws and Regulations ................................ 113
4.3.3 Recent Changes and Policy Reforms (2000s–Present) ............... 115
4.4 Enforcement and Regularization .......................................................... 118
4.4.1 Irregular Immigrants ............................................................................. 120
4.4.2 Ruling on Source Countries ................................................................ 128
Chapter 5: Learning from (and Benchmarking to) Relevant International Immigration Systems ......................................................................................................... 131
5.1 Introduction and Descriptive Information ..................................... 132
5.2 Framing and Designing Immigration Policies ............................... 136
5.2.1 Basic Framework ..................................................................................... 136
5.2.2 Flexibility ................................................................................................... 138
5.2.3 Consultations with Stakeholders ..................................................... 141
5.3 Demand versus Supply-Driven Systems ........................................... 142
5.3.1 Public vs. Private Recruitment .......................................................... 150
5.4 Selection of Skill Types and Quantities ............................................. 152
5.4.1 Quotas, Levies, and Dependency Ceilings ..................................... 152
5.4.2 Priority Sectors and Occupations, and Proof of Lack of Malaysians ................................................................................................................... 157
5.5 Integrating Foreign Workers into the Local Labor Force ....... 160

iii
5.6 Preventing Undocumented Immigration ......................................... 162
Chapter 6: Issues for the Government to Consider and Recommendations Going Forward ...................................................................................................................... 166
6.1 Making the Report Useful for the Government ............................. 167
6.2 Key Lessons from the Analysis ............................................................... 169
6.3 Key Institutional Issues to Consider ................................................... 172
6.4 Concluding Remarks .................................................................................... 178
References ....................................................................................................................... 179
ANNEX 1 ............................................................................................................................ 192
ANNEX 2 ............................................................................................................................ 198
ANNEX 3 ............................................................................................................................ 221
ANNEX 4 ............................................................................................................................ 223
ANNEX 5 ............................................................................................................................ 237
iv
Tables Table 1. Distribution of Workers in Management, Manufacturing Sector .................. 30 Table 2. Distribution of Workers in Management, Plantations Sector ....................... 31 Table 3. Distribution of Workers in Management, Construction Sector ..................... 33 Table 4. Distribution of Workers in Management, Accommodation Sector ............... 34 Table 5. Distribution of Workers in Management, ICT-Services Sector ...................... 35 Table 6. Impact of Immigration on Total Factor Productivity ..................................... 64 Table 7. Twenty-Three Economic Sectors ..................................................................... 75 Table 8. Twenty-One Skill Levels ................................................................................... 77 Table 9. Expatriate Workers—Short and Long Term Visa Types................................ 91 Table 10. Agencies Approving Expatriate Posts ........................................................... 93 Table 11. Recognized Skills for Short-Term Professional Employment Pass ............. 95 Table 12. Irregular Workers Identified Through Various Initiatives (1992-2011) . 123 Table 13. Singapore Foreign Workers ......................................................................... 148 Table 14. Singapore —Foreign Workers’ Levies Changes ......................................... 155 Table 15. South Korea Quota Allocations .................................................................... 156

v
Figures
Figure 1. Legal Foreign Labor, 1993-2011 (Left); Malaysian Citizens, 1990-2010 (Right) ............................................................................................................................................................. 4 Figure 2. Foreigners on Temporary Employment Passes, by Region, Various Years .. 5 Figure 3. Source Countries of Foreigners (Temporary Employment Pass), 2005-2011 ............................................................................................................................................................................ 6 Figure 4. Composition of the Labor Force in Malaysia (in millions) ................................... 7 Figure 5. Foreigners in Malaysia, 1990-2010 .............................................................................. 13 Figure 6. Foreigners as a (Percent) Share of the Labor Force, 1990-2010 .................... 14 Figure 7. Employment Rates of Migrant and Malaysian Workers by Gender ............... 15 Figure 8. Origin Countries of Foreigners ....................................................................................... 16 Figure 9. Age Distribution of Foreigners ....................................................................................... 17 Figure 10. Distribution of Foreign Workers Across States .................................................... 18 Figure 11. Share of Foreign Workers in Different States ........................................................ 19 Figure 12. Distribution of Foreign Workers Across Sectors ................................................. 20 Figure 13 Share of Foreign Workers in Different Sectors (Percent) ................................. 21 Figure 14. Education Distribution of Malaysians and Foreigners Over Time ............... 22 Figure 15. Education of Immigrants, by Economic Sector, 2010 ........................................ 23 Figure 16. Total Number of Foreigners by Year and Percentage in Manufacturing ... 24 Figure 17. Total Number of Immigrants by Year and Percentage in Agriculture and Plantations .................................................................................................................................................. 25 Figure 18. Total Number of Immigrants, by Year and Percentage, in Construction 26 Figure 19. Total Number of Immigrants, by Year and Percentage, in Accommodations Sector ........................................................................................................................ 27 Figure 20 Total Number of Immigrants, by Year and Percentage, in ICT (services).. 28 Figure 21. Total Workers and Share of the Manufacturing Workforce, by Sub-Sector, 2010 ............................................................................................................................................................... 29 Figure 22. Total Workers and Share of the Construction Workforce, by Sub-Sector, 2007 ............................................................................................................................................................... 32 Figure 23. Foreign Workers and Percentage of Foreigners in ICT Services, by Sub-Sector, 2010 ................................................................................................................................................ 35 Figure 24. Manufacturing With/Without Immigrants, by Size, in 2010 ......................... 36 Figure 25. Agriculture With/Without Immigrants, by Size, in 2010 ................................. 37 Figure 26. Construction With/Without Immigrants, by Size, in 2007 .............................. 37 Figure 27. Firms in Accommodation Sub-Sector, With/Without Immigrants, by Size, in 2010 .......................................................................................................................................................... 38 Figure 28. Services—ICT, With/Without Immigrants, by Size, in 2010 .......................... 38 Figure 29. Employment Effects of Hiring 1,000 Immigrants ................................................ 43 Figure 30. Effect of Migration by Economic Sector ................................................................... 45 Figure 31. Age-Group Effects of Migration.................................................................................... 46 Figure 32. Gender-Specific Effects of Immigration ................................................................... 47 Figure 33. Education-Specific Effects of Immigration.............................................................. 49 Figure 34. Education Elasticity Effects of Immigration .......................................................... 49 Figure 35. Gender-, Education- and Age-Specific Elasticities of Wage ............................. 51 Figure 36. Average Value-Added P/Worker, Across Sectors, in 2010 ............................. 55 Figure 37. Average Value-Added P/Worker, Manufacturing, ............................................... 57 Figure 38. Average Value-Added P/Worker, Plantations, ...................................................... 58 Figure 39. Average Value-Added P/Worker, Construction, .................................................. 59

vi
Figure 40. Average Value-Added P/Worker Services, Accommodation, ......................... 60 Figure 41. Average Value-Added P/Worker, Services—ICT, ................................................ 61 Figure 42. Impact of a 10 Percent Increase in Foreign Employment on TFP. ............... 66 Figure 43. Impact of a 10 Percent Increase in Foreign Employment on TFP in Manufacturing (50+) .............................................................................................................................. 66 Figure 44. Crime Rates of Malaysians and Foreigners ............................................................. 67 Figure 45. Impact of Immigration on Crime (for Every 100,000 Immigrants) ............. 69 Figure 46. Sectoral Growth Rates, Simulated and Actual (2005-2010) ........................... 74 Figure 47. Evolution of Labor Supply by Skill Level, Simulated and Actual (2005-2010).............................................................................................................................................................. 76 Figure 48 Panel A & B ............................................................................................................................. 82 Figure 49. GDP Growth .......................................................................................................................... 83 Figure 50. Impact of 50 Percent Increase in Levies on 2010-2020 Sectoral Growth Rates (difference) ..................................................................................................................................... 85 Figure 51. Change in Average Formal Wages of Low Skill Malaysian Workers ........... 87 Figure 52. Foreign Equilibrium Wages, Low Skill, 2013-2015 ............................................ 88 Figure 53. Permitted Foreigners in the Plantation and Agricultural Sectors ................ 98 Figure 54. Direct Recruitment of Migrant Worker Process by Employers .................. 100 Figure 55. Visa Fee and Deposit for a Foreign Worker (excluding Domestic Helpers) ....................................................................................................................................................................... 102 Figure 56. Recommended Costs for the Recruitment of Indonesian Domestic Helpers ....................................................................................................................................................................... 103 Figure 57. Institutions Governing Migrant Workers ............................................................. 111 Figure 58. Cost of Levies for Foreign Workers in the Peninsula, Sabah and Sarawak ....................................................................................................................................................................... 116 Figure 59. Changes in Foreign Worker Levy in the Peninsula from 1991 to 2011 (Sept.) ......................................................................................................................................................... 117 Figure 60. Irregular Foreigners by Citizenship ........................................................................ 125 Figure 61. Registration of Irregular Foreigners by Gender (Left) and Sector under 6P ....................................................................................................................................................................... 126 Figure 62. Flowchart for Legalization Exercise under 6P ................................................... 128 Figure 63. International Foreign Stock (as a Percentage of the Population) ............. 132 Figure 64. Fertility Rate over Time ............................................................................................... 133 Figure 65. Fertility Rate in 2011..................................................................................................... 133 Figure 66. Age Dependency Ratio (Old as Percentage of Working Population) ....... 134 Figure 67. Unemployment Rate, 2010 ......................................................................................... 134 Figure 68. Workforce with Education Level (Percent) ......................................................... 135 Figure 69. Australia—Permanent Residents by Category .................................................. 139 Figure 70. Permanent Residents by Category .......................................................................... 145

vii
ABBREVIATIONS AND ACRONYMS
AEO ASEAN BNM CEDAW CIC CIDB CCFWII CGE CLAB CSL CTFWP DIAC DOI DOL DOS EA EAP EC E&E E-LMO EN ENS EP EPF EPU ESC ETP EU
Arranged Employer Opinion Association of South-East Asian Nations Bank Negara Malaysia (Central Bank of Malaysia) Convention on Elimination of Discrimination Against Women Citizenship and Immigration Canada Construction Industry Development Board, Ministry of Works Cabinet Committee of Foreign Workers and Illegal Immigrants Computable General Equilibrium Construction Labor Exchange Centre Berhad Critical Skills List Canadian Temporary Foreign Workers Program Department of Immigration and Citizenship Department of Immigration, MOHA Department of Labor, Ministry of Human Resources Department of Statistics Employment Act East Asia and the Pacific Expatriate Committee Electric and Electronic Expedited Labor Market Opinion Employer Nomination Employer Nomination Scheme Employment Pass Employment Provident Fund Economic Planning Unit Economic Strategies Committee Economic Transformation Report European Union
FDI FSWP FOMENA GCR GDP GNI G2G ICT ILM ILMIA ILO IO IPTA
Foreign Direct Investment Federal Skilled Worker Program Foreign Workers Medical Examination Monitoring Agency Global Competitiveness Report Gross Domestic Product Gross National Income Government to Government Information and Communication Technology International Labor Migration Institute of Labor Market Information and Analysis International Labor Organization Input-Output Government Institutes of Higher Education

viii
INS IT JCS KL LFS LMO MAEI MARA MDC MIDA MFG MITI MM2H MOF MOHA MOHR MOM MOU
Immigration and Naturalization Services Information Technology Job Clearing System Kuala Lampur Labor Force Survey Labor Market Opinion Malaysian American Electronics Industry Majlis Amanah Rakyat or Council of the People Multimedia Development Corporation Malaysian Industrial Development Authority Manufacturing Ministry of International Trade and Industry Malaysia My Second Home Ministry of Finance Ministry of Home Affairs Ministry of Human Resources Ministry of Manpower Memorandum of Understanding
MPIC MSME MW MWC NERS NEP NKEA NGO NMWC
NOC
Ministry of Plantation Industries and Commodities Micro Small and Medium Enterprises Minimum Wage Minimum Wage Commission National Enforcement and Registration System New Economic Policy National Key Economic Areas Non-Governmental Organization National Minimum Wage Council National Occupation Classification
OECD OSC PATI PLKS PMR PMWC PNP PSD PSMW PPP PWD RM RN RP-T RSMS SAWP
Organization for Economic Cooperation and Development One-Stop Approval Centre Pendatang Asing Tanpa Izin Pas Lawatan Kerja Sementara Penilaian Menengah Rendah—Lower Secondary Provisional Minimum Wage Commission Provincial Nominee Program Public Services Department Provincial Minimum Wage Sub-Committee Purchasing Power Parity Person with Disabilities Malaysian Ringgit Regional Employer Nomination Residence Pass for Talent Regional Sponsored Migration Scheme Seasonal Agricultural Workers Program

ix
SC Securities Commission SME SMW SOCSO SPA SPM STPM TFP TFWP
TUA 6P UNESCO UPSR USCIS USCRI VA VOA VPTE WP WHO
Small Medium Enterprise Statutory Minimum Wage Social Security Organization Public Service Commission Sijil Pelajaran Malaysia—Upper Secondary Sijil Tinggi Persekolahan Malaysia—Post Secondary Total Factor Productivity Temporary Foreign Workers Program Trade Unions Act Comprehensive Legalization Program United Nations Educational, Scientific and Cultural Organization Ujian Penilaian Sekolah Rendah—Primary United States Citizenship and Immigration Services United States Committee on Refugees and Immigrants Value Added Visa on Arrival Visit Passes for Temporary Employment Work Permit World Health Organization
Regional Vice President: Axel van Trotsenburg
Sector Director: Xiaoqing Yu
Sector Manager: Jehan Arulpragasam
Task Team Leader: Ximena Del Carpio
x
ACKNOWLEDGMENTS
This report was prepared by a team comprising (in alphabetical order): Ximena Del Carpio (Task Team Leader), Rajeswari Karupiah, Mohamed-Ali Marouani, Caglar Ozden, Mauro Testaverde, and Mathis Wagner. Special thanks to Caglar Ozden for acting as a de-facto Co-TTL. Yuki Ikeda and Michele Zini provided inputs, and Federico Mantovanelli, Bjorn Nilsson and Ngee Yong Teo provided excellent research assistance. The team thanks Hana Polackova Brixi for her inputs and guidance during the initial stages of this project, and Frederico Gil-Sanders, David Robalino and other World Bank colleagues for their ideas and support.
The team thanks Mr. Amir Omar, Director of Institute of Labor Market Information and Analysis (ILMIA) and his excellent team in the Ministry of Human Resources of Malaysia for their hard work throughout this engagement. Thanks also to the Department of Statistics of Malaysia for assistance with all data related matters, other Government agencies represented in the steering committee for their guidance throughout consultations, and all stakeholders (employers, union representatives and business associations) for their valuable contributions throughout the drafting of this report.
The work was conducted under the general guidance of Xiaoqing Yu (Sector Director) and Jehan Arulpragasam (Sector Manager). The team is grateful for the excellent advice provided by three peer reviewers—Dilip Ratha (Team Leader for the Migration Group), Manjula Luthria (Senior Economist, MNA Social Protection and Labor) and David McKenzie (Lead Economist, Development Economics Research Group)—and for very useful comments provided by Maria Ionata, Ahmad Ahsan, Intan Nadia Jalil, and other World Bank colleagues.
We also thank Nishi Widge for editing the report and Maya Razat for providing excellent administrative support.
The findings, interpretations, and conclusions expressed in this document are those of the authors and do not necessarily reflect the views of the Executive Directors of the World Bank, the governments that they represent, or the counterparts with whom they consulted or engaged during the study process.

xi
Executive Summary INTRODUCTION The objective of the Malaysian Government with respect to immigration is threefold: first, to effectively and efficiently manage the process of admitting foreign workers and reducing overdependence on them without harming economic growth; second, to improve tracking and monitoring of foreign workers in the country to reduce the incidence of illegal immigration; and third, to make the country’s environment more conducive for foreign workers and their employers to abide by the rules. This report aims to support the Ministry of Human Resources (MOHR) in quantifying the impact of foreign labor in Malaysia in order to better identify foreign human resource needs going forward. This report also aims to help the MOHR in identifying immigration policy areas that need to be reformed in order for the Government of Malaysia to meet its three aforementioned objectives. Prior to the preparation of this report, the Government organized a Foreign Management Lab to address the growing concerns on illegal immigration, to find ways to reduce reliance on foreign workers, and to improve the overall management of foreign workers in Malaysia. The Lab relied on consulting experts and gathering their opinions as the principal method of approach. Lab recommendations covered three areas: improve control over the demand and supply of immigrants, address legislation loopholes and identify reforms to better enforce laws, and improve the monitoring of immigrants. The Lab participants
endorsed most of the recommendations and, for the most part, they are well aligned with the objectives of the Government. This report adds to the work done in the Lab and previous analysis done on immigration in Malaysia in four distinct ways: 1. It uses analytical tools to
measure the economic impact of immigration on Malaysian workers and on the productivity of firms in key economic sectors.
2. It uses quantitative simulations to estimate potential changes to a key policy in the immigration toolkit, the levy system (or the system that imposes costs on employers to hire foreign workers).
3. It undertakes an in-depth view of the Malaysian immigration policy and system, as well as that of various benchmark countries, in order to identify, in a systematic way, potential features that may be useful for Malaysia to consider.
4. It brings together the lessons from the economic analysis, simulations and the institutional analysis to make recommendations that are evidence based.
The report is broken down as follows: Chapter 1 gives an overview of foreign labor in Malaysia, including descriptive analysis from the data sources used (workers and firms). Chapter 2 measures the impact of immigration on workers and Malaysian firms using empirical tools and presents the results. Chapter 3 presents the analysis from a computable general equilibrium model, and results from various

xii
simulation exercises. Chapter 4 discusses the Malaysian immigration system in depth and provides an overview of new developments. Chapter 5 presents five distinct immigration systems from around the world that are relevant to Malaysia and its context in order to identify lessons. Chapter 6 concludes by highlighting key lessons based on the evidence presented in this report.
The main conclusions from the analysis are that, on average, immigration continues to be economically beneficial to the country’s growth and development. But the economic benefits are not equal for all segments of the Malaysian working population or across all economic sectors. Skilled and semi-skilled Malaysians benefit greatly from the presence of foreign workers; however, unskilled Malaysians experience negative impacts on their labor market outcomes. Results also show that the presence of foreign unskilled workers allows Malaysians to invest in their own education and enables them to work in relatively higher-skilled occupations identified by the Government as critical to reach its goal of becoming a high-income economy by the year 2020. On the enterprise side, the presence of foreign workers has been (and continues to be) a key factor in Malaysia’s competitiveness and economic success. This is especially the case among export-oriented companies in the manufacturing sector. Foreign labor leads to increases in productivity levels of medium and large firms in some economic sectors such as manufacturing and construction; however, the same is not true for
smaller firms and for the agriculture and plantations sector where having foreign labor limits productivity. Further analysis and access to relevant data are needed to analyze the effect of immigration on other critical service sub-sectors. Given the results from this report, we recommend that going forward, it will be critical for all stakeholders to recognize that the economic benefits from immigration to Malaysia continue to exceed the economic costs. This is especially true as most Malaysians continue to invest in education and raise their human capital levels, while low-skill intensive sectors such as agriculture and construction, and sub-sectors in manufacturing and services remain important to the country’s future growth. Thus, at this juncture, policy reforms should not seek to hinder the process of immigration by setting potentially distortive quotas, or raising levies to economically harmful levels. Instead, the Government should consider reforming its immigration system to be more responsive to market demands for foreign labor and to allow it to regularly monitor labor needs using detailed and reliable data. At the same time, the Government should consider reforming its policies and processes in recruiting, retaining, and monitoring foreign workers. Lastly, the government should consider adopting lessons from benchmark countries to strengthen its enforcement mechanisms to deter illegality. Malaysia has both the need and the means to implement such an institutional framework.

xiii
LABOR IMMIGRATION IN MALAYSIA Foreign labor in Malaysia has been recently estimated to range between 2 million to 4 million people and their regional distribution is highly imbalanced, in favor of Peninsular Malaysia. Recent figures show that there are about 1.8 million registered or regular foreign workers, and the rest (about one million to two million) are unregistered (undocumented or irregular) workers. In 2011, about 82 percent of foreigners were in the Peninsula, and the rest were in Sabah/Labuan and Sarawak. Foreign workers come to Malaysia mainly from Indonesia, Nepal and Bangladesh; but in more recent years additional workers from Myanmar and Cambodia have been arriving in larger numbers. Other countries where workers come from are the Philippines, India, Vietnam, Pakistan, Thailand, China, and Sri Lanka but their total numbers are low compared to the other leading groups. The large inflow of foreign workers into Sabah and Sarawak from neighboring countries is largely due to political and economic factors in their own countries. Sabah’s proximity with the Southern Philippine islands accounts for the concentration of Filipino foreign workers in Sabah as opposed to the rest of the country. The shared borders between Sarawak and Kalimantan in Indonesia continue to facilitate the inflow of many irregular foreign workers as well as cross-border workers who commute to work daily. The utilization of foreign labor in Sabah and Sarawak differs in
important respects from the Peninsula. For instance, in the Peninsula the largest numbers of foreigners are employed in the manufacturing sector; in Sabah and Sarawak, the plantation sector takes the lead. In recent years, foreign workers in Sabah have begun to make inroads into petty trading, domestic services, transportation, construction, and renovation works. There are some skilled foreign workers in Sabah and Sarawak as well, but they are generally medical officers, teaching professionals, and expatriates attached to the larger corporations. Skilled labor in the Peninsula, though small in proportion to the foreign labor force, is also growing in the skilled services sub-sectors. Expansion of Immigration Although the reliance on foreign workers began in the 1970s and through the 1980s to support Malaysia’s growth strategy, formal guidelines pertaining to their employment were only introduced in early 1990s. The official policy stance of the Government was to permit foreign workers as an interim solution to meet demands for low-skilled labor in certain sectors of the economy. The Government supported immigration as part of its high growth strategy while it pursued a longer-term strategy to upgrade the economy and expand the supply of skilled labor. As a result, the labor market welcomed immigrants, especially in plantations, construction sector and domestic employment. In the late 1980s, demand for low skilled foreign workers in labor-intensive manufacturing sub-sectors (namely electronics, textiles, non-metallic, and mineral industries)

xiv
grew. But concerns were raised about foreign workers’ employment in the manufacturing sector, since the view was that local labor is available and could be attracted to the sector. The main determinants of the continuing inflow of foreigners are a combination of economic, socio-cultural, and external political factors. Rapid industrialization, urbanization, strong economic growth (above five percent in the last two decades), and a relatively small population base created a situation of relatively high employment and tight labor markets. Movement of people to urban areas led to acute labor shortages in rural areas and the plantation sectors. Also, Malaysians rapidly increased their education levels and rejected jobs in agriculture and construction in favor of formal and better-remunerated employment in the public and private sectors. Higher educated women joined the labor force and needed the services of domestic household workers. Political instability in neighboring countries also created an incentive for people to come to Malaysia as asylum seekers, regular or irregular workers. Lastly, comparatively slower growth in neighboring countries, including low wages and high unemployment, makes Malaysia an appealing destination labor market. Data Used in the Report The Data used in this report come from various sources, including surveys, censuses, national accounts, national sources from other countries, and international organizations. Most of the empirical work presented in the report comes from two sources: labor force surveys (LFS) and economic census data of
establishments. For the analysis on workers (Malaysians and immigrants) the analysis uses LFS collected between 1990 and 2010. For the establishment level analysis, the analysis uses the Malaysian Economic Censuses collected by the Department of Statistics. In all economic sub-sectors analyzed (manufacturing, agriculture, plantations, construction, ICT-services, and accommodation services), except for construction, the data were collected every five years: 2000, 2005, and 2010. Given the distinct sampling methodologies used by these data sources, they each capture slightly different groups of workers. For example, the LFS does not record foreigners living in communal housing (only in individual housing) whereas establishment data do. On the other hand, establishment data do not capture informal foreigners working in unregistered firms (only formally registered firms are interviewed) whereas the LFS data partially do. We note that these sources are the best of all potentially imperfect choices available, especially compared to many other countries, and the report outlines several noteworthy shortcomings.
DESCRIPTIVE ANALYSIS Workers It is difficult to accurately measure the number of foreign workers because the data are imperfect; many foreigners are undocumented and not counted in administrative data. However, most data show that foreign labor levels continue to rise. In 1990 there were around 380,000

xv
foreign workers in Malaysia according to LFS data. The number increased to around 2.1 million in 2010. In relative terms, foreigners represented 9.5 percent of the total labor force in 2010, compared to 3.5 percent in 1990. About 55 percent of foreigners were male, a decline from 62 percent in 1998. In Figure 1, the bump in 2001 represents a change in the sampling strategy after the national census; the dotted lines represent the adjusted numbers.
Figure 1. Foreigners in Malaysia 1990-2010
Source: Author’s Calculations with DOS, Labor
Force Survey
From 1990 and through 2010, the employment rate increased from 93 to 95 percent for male and from 41 to 60 percent for female foreign workers. On the other hand, the employment rate of Malaysian male workers declined from 81 percent in 1990 to 73 percent in 2010. Employment rates for Malaysian females are even lower (47 percent), despite the fact that they have high levels of education. The presence of abundant foreign labor is often cited as a reason for low participation rates of certain groups of Malaysian
workers, especially among the youth and women. This question is investigated further in the report. Distinct from most destination countries in the world, foreign workers in Malaysia are older than workers from the Malaysian population. Worldwide, most foreigners are between the ages of 15 and 35. However, in Malaysia, the Malaysian population is young and foreigners tend to be older. Foreign labor is largely concentrated in physically demanding sectors of the economy such as agriculture and construction. Even in the services sector, foreign workers are concentrated in labor-intensive occupations. When we do find foreign workers, in capital-intensive sectors, they typically hold relatively lower-skill occupations. About 32 percent of all foreign employment is in the agricultural sector (down from 48 percent in 1990). Construction is the second largest employer of immigrants, with 14 percent of the total. These are followed by other services, which encompass a host of low skill demanding services (12 percent), wholesale retail (11 percent), and accommodation services such as hotels (seven percent). Interestingly, as a share of an entire economic sector, foreigners make up the largest share of workers in the wood-manufacturing sub-sector. With the exception of the relatively rapid decline in the share of agricultural employment, other sectors are more stable in terms of the shares that foreigners occupy. This is especially true for service sectors that employ relatively more unskilled workers and are spread
0
500,000
1,000,000
1,500,000
2,000,000
2,500,000
199
0
199
3
199
6
199
8
200
0
200
2
200
4
200
6
200
9
Total
Total(adj.)Female
Female(adj.)

xvi
across the country. Higher technology, higher skilled intensive manufacturing and service sectors are not significant employers of foreigners given that they often require specialized skills that typical foreign workers do not have. The gap in educational attainment, used as a proxy for skill level in the labor market, between foreigners and Malaysians is widening. Education levels of Malaysians continue to rise while the education level of foreigners remains low and stable over time. For instance, the share of primary (or less) educated foreigners has fluctuated between 85 and 91 percent over the twenty year period studied. Similarly, the share of university educated foreigners stayed between four and six percent. Finally, foreigners with secondary education are the only group that managed to increase their share- from 10 to 18 percent in the twenty-year period under review. Employers As the Government increased the flexibility to import labor from neighboring countries and more foreign direct investment arrived, an increasing number of foreigners came to work in the country, especially in labor-intensive sectors. Establishment data corroborate that the foreign workforce continues to rise in absolute number of workers and as a relative share of the labor force. Given the growth of the supply of foreign labor throughout most economic sectors, there is a perception by many Malaysians that foreigners are increasingly taking away their jobs, depressing local wages, and lowering labor productivity in the country. One of
the main objectives of the report is to evaluate the basis of this perception. Foreign workers tend to concentrate in low value-added activities in key sub-sectors of the economy. In manufacturing, foreign workers make up 30 percent of the workforce and their share has doubled since 2000. Parsing the data into eight sub-sectors in the manufacturing sector shows that there are large numbers of foreign workers in low value-added sub-sectors and occupations in chemical, rubber, metal machinery, precision instruments, and communications equipment manufacturing. In agriculture and plantations, foreign labor has also increased in nominal terms and as a share of the total workforce. Since most of the large firms are in plantations and they employ significantly more foreign workers relative to other agricultural enterprises, the report focuses on plantations. About 98 percent of all plantations workers are unskilled and a staggering 69 percent of the total labor force in this sector is composed of immigrants. Among the services sectors, the construction sector as a whole is expected to continue to grow, with large projects planned for the near and intermediate future. Almost half of the sector’s workforce is foreign-born, and most of them are concentrated in the building installation sub-sector. On the other hand, there are fewer foreigners in the site preparation, building completion and renting sub-sectors. Overall, the sector is largely dependent on foreign workers, most of them are low to medium-skilled, and many acquire their work

xvii
knowledge when they are hired by assisting more experienced workers. The industry faces shortages of labor on a regular basis and local recruitment is a big challenge because the sector is known for paying low wages, offering difficult working conditions, and having limited upward career potential. Thus, young Malaysians with low skills and work experience are not attracted to the sector, which makes employment of foreigners a necessity. In 2007, the last year for which establishment data are available for this sector, about 45 percent of all workers were foreigners. This is almost double the level of the estimate from 2000.
Foreigners are well represented in other services sectors; however, their presence is mostly concentrated in some sub-sectors more than others. In the ICT-services sub-sector for instance, only two percent of all workers are foreigners—the lowest among all service sub-sectors and all the sub-sectors analyzed in this report. High-skilled workers account for 82 percent of total employment in the sub-sector, which is the largest among the main economic sub-sectors. As discussed before, only a very small share of foreigners has high education levels suitable for this sub-sector. The accommodation services sub -sector is part of the tourism and hospitality category of services, which is one of the national key economic sectors or NKEAs. It has seen a rise of foreign workers as a share of the total labor force, but from a relatively low level of two to four percent. The accommodation services sub-sector had 31 percent high-skilled workers, the rest were
low-skilled. Around 200 large firms account for 55 percent of total employment in the sub-sector and slightly more than half employ foreign workers. Though the percentage of foreigners in the accommodation sub-sector remains low (less than 4 percent), there have been substantial increases over the last five years. But not all foreigners work in low value-added occupations and low technology sub-sectors; a significant share of the managerial cadre is foreign born. In manufacturing, over the years, the number of foreigners working in managerial roles increased. Of all foreign workers in high-skill manufacturing establishments (where more than 25 percent of the workforce has a post-secondary education), about 18 percent work as managers; this is also equivalent to 10 percent of all managers in these firms. In 2010, there was few foreign managerial staff (0.3 percent) in low-skill-intensity plantation establishments and high-skill-intensive establishments (2.6 percent). Of all foreign workers in plantations establishments using low technology and employing mostly low-skill workers, less than 2,000 foreign born workers held a managerial post. This is very small compared to 5,000 Malaysian workers holding managerial occupations in the sector. In construction, the share of foreign-born managers was around six percent; this is equivalent to about 1500 managers in the sector. In 2010, a quarter of all foreign-born workers in accommodation establishments employing mostly
xviii
higher skill workers worked as managers. Many of these establishments are foreign chains and tend to bring in their foreign managers to ensure homogeneity in the quality of services offered across countries. These are likely to be the largest group of skilled workers in the sector. In less skilled establishments, the percentage is lower, about 10.5 percent. However, Malaysians still hold the largest number of managerial posts in accommodation sector, with well over 12,000 Malaysians holding managerial posts throughout all types of accommodations, compared to less than 800 foreign managers. The ICT-services sub-sub-sector is a target area for the Government’s growth strategy. Thus, strong emphasis on the sub-sector has led to recent changes in its investment and immigration rules to attract foreign IT firms to invest in Malaysia and foreign IT experts to work in the sub-sector. As a result, most foreign workers in the ICT services sub-sector are typically highly skilled and viewed as knowledge workers. More specifically, among all non-Malaysian workers employed in the ICT-services sub-sector, more than half work in managerial posts; but there are only few foreigners in the sector overall. EFFECT OF IMMIGRATION ON THE MALAYSIAN ECONOMY AND SOCIETY The goal of the analysis undertaken in this part of the report is to identify how immigration affects various labor market outcomes for Malaysian workers as well as the productivity of firms in the Malaysian economy, and society as a whole. At the household level, the analysis focuses on impacts
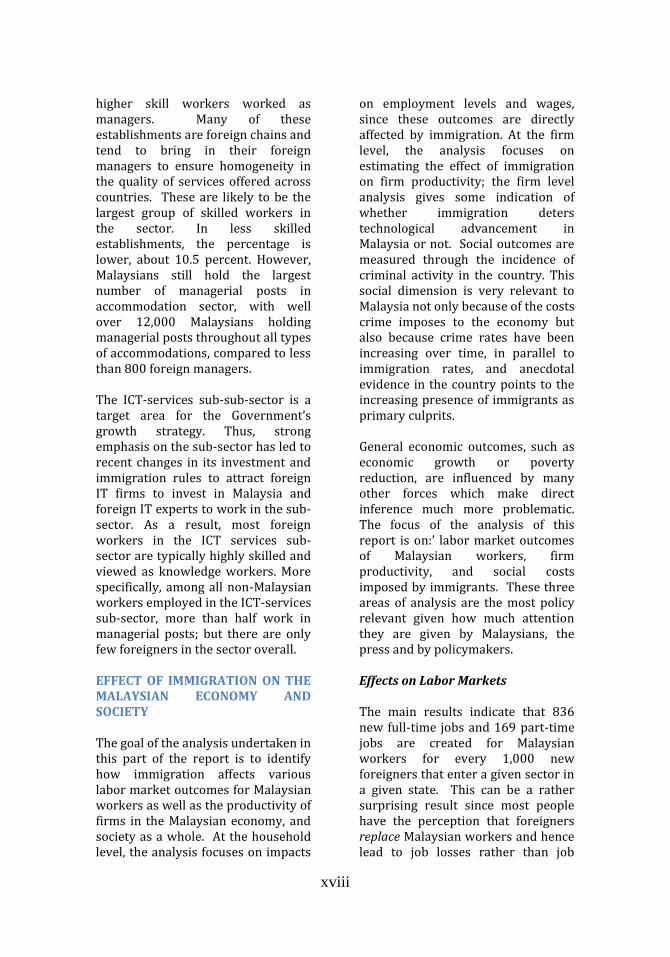
on employment levels and wages, since these outcomes are directly affected by immigration. At the firm level, the analysis focuses on estimating the effect of immigration on firm productivity; the firm level analysis gives some indication of whether immigration deters technological advancement in Malaysia or not. Social outcomes are measured through the incidence of criminal activity in the country. This social dimension is very relevant to Malaysia not only because of the costs crime imposes to the economy but also because crime rates have been increasing over time, in parallel to immigration rates, and anecdotal evidence in the country points to the increasing presence of immigrants as primary culprits. General economic outcomes, such as economic growth or poverty reduction, are influenced by many other forces which make direct inference much more problematic. The focus of the analysis of this report is on:’ labor market outcomes of Malaysian workers, firm productivity, and social costs imposed by immigrants. These three areas of analysis are the most policy relevant given how much attention they are given by Malaysians, the press and by policymakers. Effects on Labor Markets The main results indicate that 836 new full-time jobs and 169 part-time jobs are created for Malaysian workers for every 1,000 new foreigners that enter a given sector in a given state. This can be a rather surprising result since most people have the perception that foreigners replace Malaysian workers and hence lead to job losses rather than job
xix
creation for Malaysians (Figure 2). However, foreigners also generate jobs for Malaysians by reducing the costs of production, making Malaysian firms cheaper and more competitive in the global market, allowing them to expand and consequently increasing their demand for Malaysian workers. Thus, results show that the ultimate outcome for Malaysians is job creation.
Another way to report the results is by looking at the elasticity estimate. Results show that one percent increase in immigration increases full-time employment of Malaysians by one-tenth of a percent and part-time employment for Malaysians by one-third of a percent.
Figure 2. Employment Effects of Hiring 1000 Immigrants
Source: Author’s Calculations with DOS, Labor
Force Survey
The Malaysian unemployment and the labor force participation rates are the other two important labor market variables potentially impacted by immigration. Female labor force participation is quite elastic in Malaysia, and exploring whether the elasticity is partly driven by the presence of foreign labor is
important. Results show that the levels of labor force participation of Malaysians are not statistically sensitive to immigration. In other words, Malaysian workers do not decide to enter the labor force based on immigration levels. On the other hand, unemployment levels are negatively related to immigration. This effect is statistically significant but relatively small in terms of size. However, this should not be interpreted as a worrying signal given that the decline in the unemployment rate is due to the increase in the number of employed workers in the labor force, rather than the decline of the number of unemployed workers. Effects by Economic Sectors While the overall average effects of immigration are positive on the employment levels of Malaysians, the critical question is how the effect varies across different sectors of the economy. For this purpose, the economy is divided into three primary sectors (agriculture and mining, manufacturing, and services). Results show that immigration leads to increased employment of Malaysians in agriculture and services. On average 671 jobs are created in agriculture and mining, about 193 jobs in manufacturing, and 741 jobs in the services sector if an additional 1,000 foreign workers enter each of these sectors. It should be noted that the effect in manufacturing is not statistically significant while it is so in the other sectors (Figure 3). The relevant elasticites highlight a slightly different pattern in terms of
0
250
500
750
1000
Total Employment Part-TimeEmployment

xx
the effect of immigration. The resulting elasticities are 0.15 for agriculture and mining, 0.02 for manufacturing and 0.05 for services. The difference is due to the fact that services employ significantly more workers than agriculture and mining. As a result, the percentage effect of immigration on employment in services is much lower even though the absolute size of the effect is larger. Figure 3. Effect of Immigration by
Economic Sector
Source: Author’s Calculations with DOS, Labor Force Survey
Effects by Demographics—Age and Gender Another critical issue is how immigration affects workers who are at different stages of their careers—especially because wages, employment prospects, skill premiums, and other opportunities change in the workers’ lifecycles. The analysis revealed that an additional 1,000 foreign workers in an average sector had no effect on 15 to 19 year-olds while there were 207 new jobs created for 20 to 29 year olds, 303 new jobs for 30 to 44 year olds, and
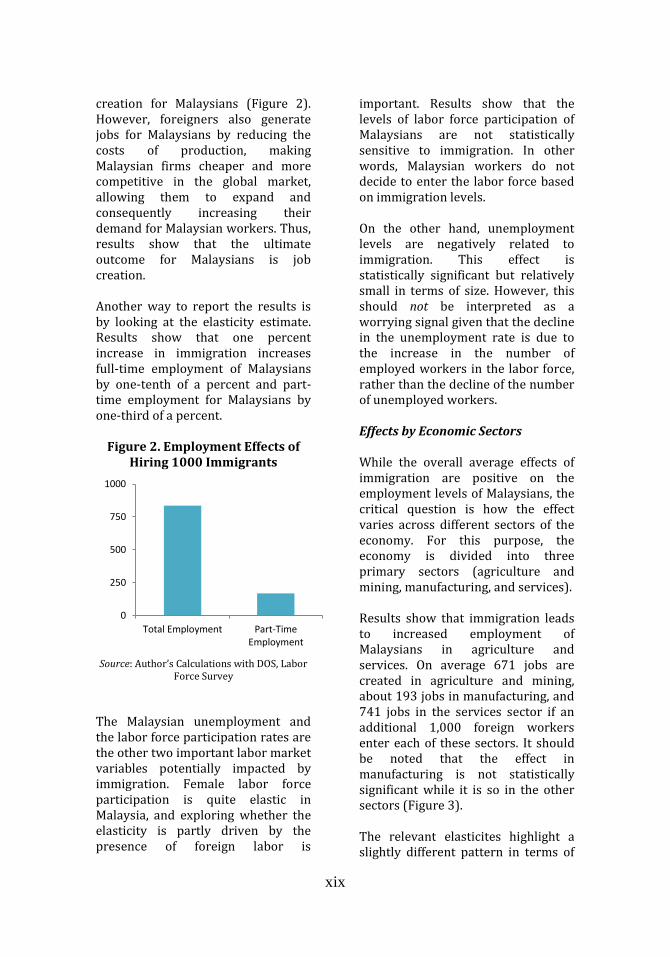
340 new jobs for those over 45 years of age. Differences are more pronounced when the size of the age group (or cohort) is adjusted by the group’s size. A 1percent increase in foreign employment in an average sector leads to 0.07 percent increase in the employment of the 20 to 29 group and a 0.15 percent increase in the employment of the 45+ year olds. The impact of immigration has a clear gender dimension. Its effect on men and women varies significantly, especially in terms of total employment. One concern is that immigration discourages women from entering the labor force. Results show that an additional 1,000 migrants in a given economic sector increases overall male employment by 604 workers but the effect on women is only an increase of 205 people. The increase in part-time employment is more even— 91 additional men versus 80 women employed (Figure 4). However, when we compare the elasticities, the gap narrows significantly. The elasticity of total male employment with respect to immigration is 0.10 and female employment is 0.07, again mainly due to the fact that female employment levels are significantly lower on average, resulting in a larger percentage gain. The differences between genders indicate more complicated forces at play and require further and more detailed analysis.
0
100
200
300
400
500
600
700
800
Agriculture &Mining
Manufacturing Services
xxi
Figure 4. Impact of Immigration on Employment
Source: Author’s Calculations with DOS, Labor
Force Survey
Impacts of immigration on women’s work vary broadly by economic sector, some more favorable than others. For instance, the impacts are very positive and significant for women working in the services sector (especially in finance, business and real estate, insurance, health, and other high value added services). On the other hand, the impacts are negative for women working in the manufacturing sector. Though the analysis does not indicate if the impacts are through substitutability of women in household activities or complementarities in the productive sector, it is clear that foreign labor has a positive effect on women’s employment in Malaysia. A caveat is that even though this channel of support to women presents another policy area worth considering, positive effects may be attenuated by other costs not considered. On aggregate, foreign labor reduces unemployment for men and women, though it is statistically significant only for men. This indicates that even
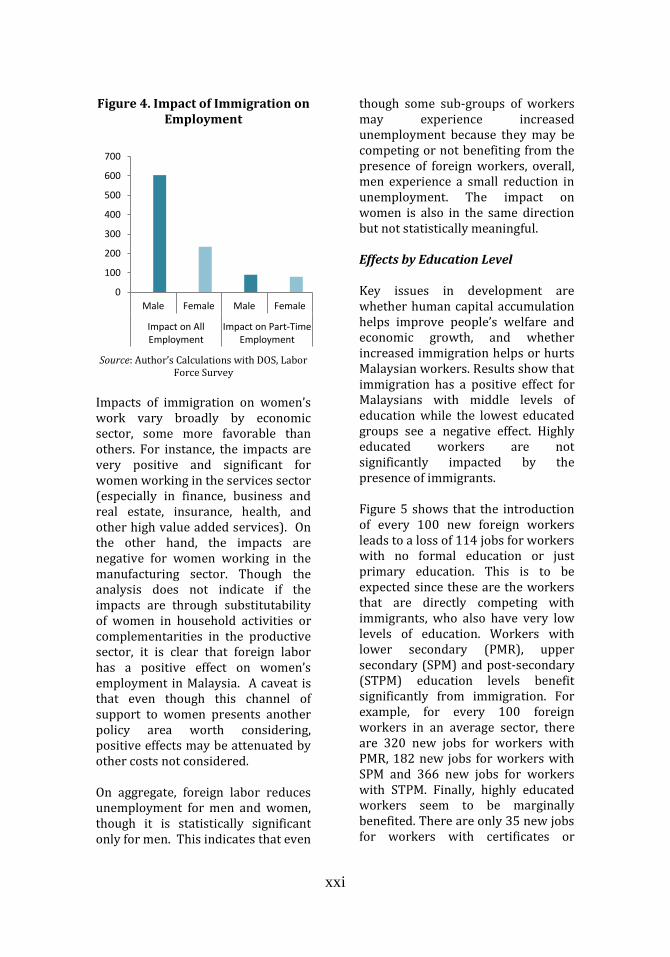
though some sub-groups of workers may experience increased unemployment because they may be competing or not benefiting from the presence of foreign workers, overall, men experience a small reduction in unemployment. The impact on women is also in the same direction but not statistically meaningful. Effects by Education Level Key issues in development are whether human capital accumulation helps improve people’s welfare and economic growth, and whether increased immigration helps or hurts Malaysian workers. Results show that immigration has a positive effect for Malaysians with middle levels of education while the lowest educated groups see a negative effect. Highly educated workers are not significantly impacted by the presence of immigrants. Figure 5 shows that the introduction of every 100 new foreign workers leads to a loss of 114 jobs for workers with no formal education or just primary education. This is to be expected since these are the workers that are directly competing with immigrants, who also have very low levels of education. Workers with lower secondary (PMR), upper secondary (SPM) and post-secondary (STPM) education levels benefit significantly from immigration. For example, for every 100 foreign workers in an average sector, there are 320 new jobs for workers with PMR, 182 new jobs for workers with SPM and 366 new jobs for workers with STPM. Finally, highly educated workers seem to be marginally benefited. There are only 35 new jobs for workers with certificates or
0
100
200
300
400
500
600
700
Male Female Male Female
Impact on AllEmployment
Impact on Part-TimeEmployment

xxii
diplomas and 20 jobs for workers with university degrees. The elasticity of employment presents the same pattern. The elasticity is negative and statistically significant (-0.22) for the lowest education group, those with either no formal employment or just primary education. This is the group that competes directly with immigrants. On the other hand, the elasticity is positive, between 0.10 and 0.14, for the next four educational groups, with a peak at the upper secondary level. The elasticity for university graduates is marginal at only 0.03.
Figure 5. Effects of Immigration by
Education Level
Source: Author’s calculations with DOS, Labor
Force Survey
Effects on Wages This section shows the effect of immigration on relative wages across industries. Estimations indicate that changes in employment caused by increases in immigration do not lead to changes in the wages of Malaysian workers. The results suggest that a sufficient number of Malaysian workers are highly mobile across industries (and possibly also regions)
so as to allow wages to rapidly equalize. Imbalances caused by immigration show up in changes in employment patterns of Malaysians, not in different wages across sectors. The increases in demand for Malaysian workers due to immigration do not result in changes in relative wages across industries. However, they do increase the overall wage level in Malaysia. Positive effects are most apparent when foreigners work in low-skilled services and agriculture. Data show that an additional 10 percent immigration to a given sector and region, increases average wages of Malaysians by roughly 0.15 percent. These modest aggregate wage gains are sensitive to where precisely foreigners decide to or are allowed to work, with the biggest gains for Malaysians arising from foreign employment in agriculture and low-skilled services. While the evidence suggests that a lot of workers are highly mobile across industries, workers cannot change their gender, their age and find it hard to change their level of education. Thus, personal characteristics—such as age, gender, and education—play a role on how much Malaysians can benefit from immigration in terms of higher wages. A 10 percent increase in immigration increases male wages by around 0.3 percent but barely has an impact on women’s wages. There are significant differences in terms of age groups as well. Young Malaysians between 15 and 19 years of age experience slightly lower wage increases from the presence of foreign labor, while 30 to 44 year olds experience the largest wage increases
-200 0 200 400
No formal/Primary
Lower Secondary(PMR)
Upper Secondary(SPM)
Post Secondary (STPM)
Certificate/ Diploma
Degree and above
xxiii
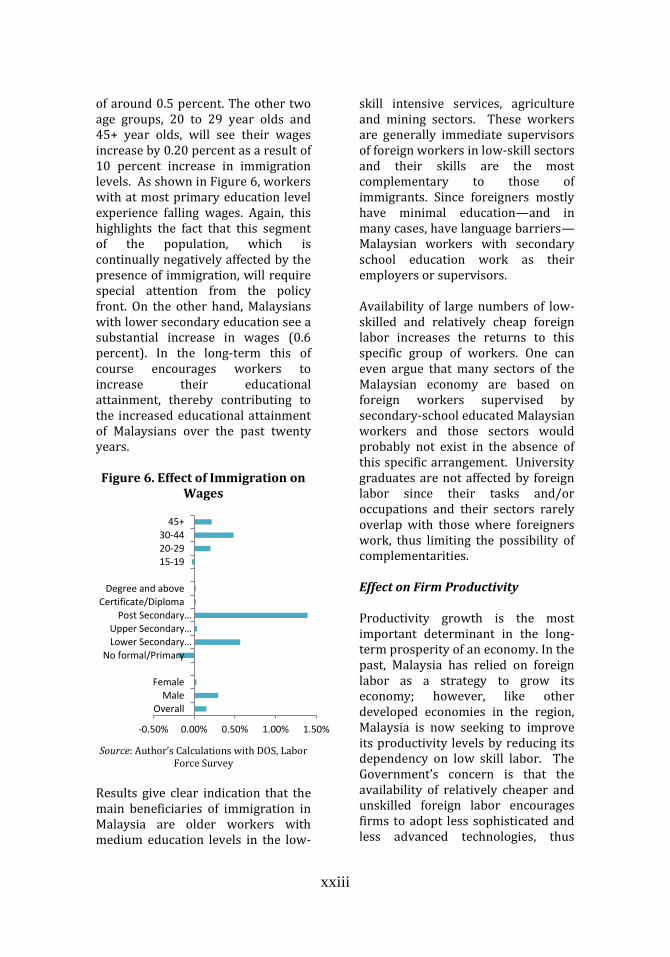
of around 0.5 percent. The other two age groups, 20 to 29 year olds and 45+ year olds, will see their wages increase by 0.20 percent as a result of 10 percent increase in immigration levels. As shown in Figure 6, workers with at most primary education level experience falling wages. Again, this highlights the fact that this segment of the population, which is continually negatively affected by the presence of immigration, will require special attention from the policy front. On the other hand, Malaysians with lower secondary education see a substantial increase in wages (0.6 percent). In the long-term this of course encourages workers to increase their educational attainment, thereby contributing to the increased educational attainment of Malaysians over the past twenty years. Figure 6. Effect of Immigration on
Wages
Source: Author’s Calculations with DOS, Labor
Force Survey
Results give clear indication that the main beneficiaries of immigration in Malaysia are older workers with medium education levels in the low-
skill intensive services, agriculture and mining sectors. These workers are generally immediate supervisors of foreign workers in low-skill sectors and their skills are the most complementary to those of immigrants. Since foreigners mostly have minimal education—and in many cases, have language barriers—Malaysian workers with secondary school education work as their employers or supervisors. Availability of large numbers of low-skilled and relatively cheap foreign labor increases the returns to this specific group of workers. One can even argue that many sectors of the Malaysian economy are based on foreign workers supervised by secondary-school educated Malaysian workers and those sectors would probably not exist in the absence of this specific arrangement. University graduates are not affected by foreign labor since their tasks and/or occupations and their sectors rarely overlap with those where foreigners work, thus limiting the possibility of complementarities. Effect on Firm Productivity Productivity growth is the most important determinant in the long-term prosperity of an economy. In the past, Malaysia has relied on foreign labor as a strategy to grow its economy; however, like other developed economies in the region, Malaysia is now seeking to improve its productivity levels by reducing its dependency on low skill labor. The Government’s concern is that the availability of relatively cheaper and unskilled foreign labor encourages firms to adopt less sophisticated and less advanced technologies, thus
-0.50% 0.00% 0.50% 1.00% 1.50%
Overall
MaleFemale
No formal/Primary
Lower Secondary…Upper Secondary…
Post Secondary…
Certificate/DiplomaDegree and above
15-19
20-2930-44
45+
xxiv
potentially harming long-term productivity growth. It is often argued that immigration has benefits and drawbacks on firm performance. Those in favor argue vehemently that foreigners catalyze efficiency across the economy through a more culturally diverse workforce that increases innovation and creative thinking, and provides a broader perspective of the world, which can enhance information about global markets and firm productivity. The drawbacks are that immigration can lead to productivity losses due to substandard human capital investments, limitations posed on worker interactions, and suboptimal investments in technology. The argument is that a large pool of largely unskilled workers allows employers to keep wages down, offer minimal training to existing workers, and have fewer incentives to improve working conditions to make jobs attractive to workers. Previous (worker level) results indicate that immigration has overall positive benefits for the Malaysian labor markets. But firm level results show a more mixed picture, indicating that foreign labor does not always lead to increases in firm productivity. Results show that for all economic sectors analyzed, the elasticity of high-skilled labor is lower than the elasticity of low-skilled labor. An exception is the ICT sub-sector where high-skilled workers had the highest elasticity. This is probably due to the fact that, unlike every other sub-sector, the vast majority of the workers in ICT are highly skilled. The same pattern is true for the manufacturing sub-sectors of
computers, machinery and chemicals, where elasticity for high-skilled workers is high. This is likely because as in ICT, the sub-sectors tend to be more skill-intensive. The elasticity of total fixed assets ranges between 0.09 (in plantations) and 0.3 (in food manufacturing) with most values within the 0.15 and .02 interval. Since firms with different sizes are likely to employ different technologies and mix of inputs, the estimation is implemented for firms of different sizes whenever possible. Results show overall positive impacts of immigration on the productivity of medium and large firms (50+ workers) in the manufacturing sector, and most of its eight sub-sectors, as well as for construction. For plantations, results are not conclusive due to the lack of statistical significance. A ten percent increase in the level of foreign workers at a representative firm increases TFP in the manufacturing sector by 6.2 percent and in construction by 1.8 percent (Figure 7). The linkages between productivity and extent of employment of foreign workers are quite different for smaller firms (between 20 and 50 workers). The effect in manufacturing is negative but has no statistical significance. On the other hand, for plantations and construction firms, the effect is clearly negative. A 10 percent increase in the employment of foreign workers reduces TFP by 18.3 percent in the plantations sector and by 5.8 percent in the construction sector.
Since there are not that many establishments in the ICT and accommodation sectors, the analysis is conducted for the whole sample of

xxv
small, medium and large firms. It should be noted that the effect on ICT-services and accommodation sectors are not statistically significant while, employment of foreigners leads to lower productivity in two sub-sectors in manufacturing (rubber, chemicals, precision instruments, communication instruments) with statistical certainty. These results could be explained by higher complementarity between foreigners and Malaysians in certain sectors than in others. Analysis focused on labor productivity (rather than TFP) in Thailand shows that impacts on firm profits are positive because firms employing foreigners save on wage costs. But impacts on firm productivity depend on the sector as well as the type of foreign worker employed; a 10 percent increase in unskilled foreigners led to five percent decrease in labor productivity whereas a 10 percent increase in skilled foreigners led to 28 percent increase in labor productivity.
Figure 7. Impact of a 10 Percent Increase in Foreign Employment
on TFP
Source: Author’s Calculations with
Establishment Surveys, various years
Effects on Crime Immigration can impact aggregate crime rates by changing the behavior of Malaysians. There is a large literature that focuses on the relationship between crime and unemployment; but results of these studies are still mixed, with no clear consensus of the relationship. For Malaysia, a recent study found that bad economic conditions cause crime in Malaysia (Habibullah and Baharom, 2009). To the extent that immigration affects Malaysians economic outcomes, it will also affect their propensity to commit crimes. Using the same rigorous econometric techniques as used for the previous analysis the analysis shows that in Malaysia the increased supply of immigrants to a state result in a fall in the number of crimes committed in that state (Figure 8). Figure 8. Impact of Immigration on
Crime (for every 100,000 immigrants)
Source: Author’s calculations with Data from the Royal Malaysian Police
This result is true for every type of crime (except for murders for which
-6%
-4%
-2%
0%
2%
4%
6%
8%
Man
ufa
ctu
rin
g(5
0+) ICT
(5+
)
Acc
om
mo
dat
ion
(5+)
Pla
nta
tio
n (
50
+)
Co
nst
ruct
ion
(5
0+) -5%
-4%
-3%
-2%
-1%
0%
Vio
len
t
Pro
per
ty
Mu
rder
Rap
e
Ro
bb
ery
Bo
dy
Inju
ry
Ho
use
bre
akin
g
Ve
hic
les
The
fts
Oth
er P
rop
ert
y th
efts
% o
f cr
ime

xxvi
results have no statistical significance). It finds that an additional 100,000 immigrants in a state of Malaysia reduces the absolute number of crimes committed in Malaysia by between 1.4 and 4.6 percent, depending on the crime, while having no effect on the number of murders. Immigration reduces both the crime rate and the absolute number of crimes committed. Results show the effect of immigration on the crime rate (crimes divide by the population aged 15 - 64) and the elasticity of the crime rate. The effect of immigration on the crime rates is even more pronounced since immigration increases the total population in a state, and therefore the number of people who may commit a crime. This report demonstrates that immigration increases economic activity from which Malaysian workers benefit. Thus, a clear reason why immigration reduces crime in Malaysia is because foreign workers in Malaysia have a positive effect on the economic outcomes of Malaysians and the economy as a whole. SIMULATION OF THE IMPACT OF POTENTIAL CHANGES TO THE COSTS OF IMMIGRATION A macro computational general equilibrium model (CGE) was built to simulate various potential effects of immigration-related policy changes. Details about the CGE model developed for this analysis are outlined in the report. The model includes twenty-three economic sectors, and they align closely with the main sectors in the Malaysian economy, including the NKEAs. There are a total of twenty-one
different skill types and these belong to three main categories of skills: lower, medium and higher skills. The principal difference between them is the level of educational attainment: secondary or lower for the lower skill category, certificate/diploma for the medium skill category, and university degree for the higher skill category. Malaysia currently relies on levies as well as quantitative limits to control the inflow of formal foreign workers into the country. The CGE model allows the simulations to investigate the effect of macroeconomic and labor market changes resulting from increasing the cost of levies. Thus, it is critical to estimate potential impacts of changing the levels using an economy-wide model that captures the interaction of both demand and supply sides of the labor market. In this sense, the CGE tool is ideal to analyze the impact of alternative scenarios. The analysis first establishes a baseline or reference scenario to which the results of three new—20, 50 and 100 percent levy increases—scenarios are compared. The reference scenario incorporates the implementation of the minimum wage at the beginning of 2013. This is can be interpreted to be what would happen in the absence of the rise in levy costs or the policy shock. The reference scenario should not be interpreted as a forecast because results are contingent on the assumptions underlying the estimation. The second variation in the simulations is based on whether the levies are collected from the employers or from the foreign workers. If the levies are collected from the employer, the total cost of employing a foreign worker is the

xxvii
sum of wage paid to the worker plus the levy paid to the Government. If the levies are collected from the foreign workers, then the wage paid to them is inclusive and the levies have to be paid out of those gross wages. Effect on Immigration, GDP and Investment The model shows that as the levies are adjusted upward, the flow of foreign workers to Malaysia is expected to decline further relative to the baseline scenario. Most foreign workers are low-skilled and would normally earn below the minimum wage if it was not imposed, as it was the case in 2012. The implementation of minimum wage is expected to have a drastic effect on the aggregate levels of foreign workers in 2013. In the first scenario, where the levies are collected from the employers, the minimum wage leads to a decline of almost 18 percent in the number of foreign workers. The model also shows that as the levies are increased by 20, 50 and 100 percent, the stock of workers declines even further. As the economy expands over time after 2013, however, the impact of levy increases and the minimum become slowly muted and as the market adjusts, the number foreign workers begins to increase in subsequent years (Figure 9). Nevertheless, the results indicate that if the objective were to adjust the inflow of legal immigration to Malaysia, higher levies could effectively achieve this, at least in the short to mid-term (Figure 9).
Figure 9. Levy Increases on Foreign Workers, Levies Collected from
Employers
Source: Author’s calculations with various
sources
The overall results are qualitatively similar but somewhat muted if the levies were to be collected from the foreign workers (Figure 10). The source of this difference lies in the new minimum wage policy. For a large portion of foreign workers the minimum wage is strictly binding. When the employers pay the levies, the total cost of employing a foreign worker, in many cases, is equal to the sum of the minimum wage and the levy. On the other hand, when the foreign worker is responsible for the payment of the levy, the total cost to the employer (apart from the initial recruitment cost) is the direct wages paid. In other words, the shift in the incidence of levy payment to the foreign worker relaxes the minimum wage constraint faced by the employer and as a result leads to higher demand for foreign workers by employers. The rest of the graphs illustrate these differences between who is responsible for the levy
0.8
0.9
1
1.1
1.2
1.3
Mill
ion
s
Reference20% Levy50% Levy100% Levy

xxviii
payment. Detailed scenarios are discussed in detail in the report.
Figure 10. Levy Increases on
Foreign Workers, Levies Collected from Employees
Source: Author’s calculations with various
sources of data
In terms of the macroeconomic effects, increasing levy costs has marginal negative impact on GDP growth; this result is true in all three scenarios analyzed, regardless of the incidence of levies. The initial impact in 2013 is a 0.5 percent drop in the GDP rate, but this is largely due to the implementation of the minimum wage law in 2013. However, the economy recovers rapidly and reaches a steady state growth rate of around 5 percent starting in 2014 (Figure 11). The levies and increases to them have negligible macroeconomic growth effect. For example, increasing the levies by 50 percent—the medium scenario—leads to a decrease of 0.05 percent in GDP growth in 2013, when levies are collected from the employer and only 0.02 percent when levies are collected from the worker.
Figure 11. GDP Contraction from Levy Increases
Source: Author’s calculations with various
sources
Figure 12. Impact of 50 Percent Levy on Sectoral Growth Rates
Source: Author’s calculations with various
sources
0.8
0.9
1
1.1
1.2
1.3
Mill
ion
s
Reference20% Levy50% Levy100% Levy
4.7%
4.8%
4.9%
5.0%
5.1%
5.2%
Reference
20% Levy
50% Levy
100% Levy
-0.04% -0.02% 0.00% 0.02% 0.04% 0.06%
Agriculture
Mining
Mfg food-bev-tob
Mfg textile
Mfg wood
Mfg paper-furn
Mfg chem-rub
Metal-machinery-equip
Mfg meas-med-com
Mfg transp equip
Utilities
Construction
Wholesale-retail
Accommodation and…
Logistics
Post and telecom
Finance
Real estate
Business services
Education
Health
Other services
Public administration
xxix
Changes to the levy costs lead to marginal negative effects on investments and sectoral growth rates. The negative effect is due to lower household income and savings, while the negative effect on some economic sectors is due to the substitution of foreigners (who generally earn lower wages than locals) for locals. When the growth rates are compared between the baseline scenario and the 50 percent levy increase scenario (for the case where workers pay the levies), the effects are very small but relatively heterogeneous (Figure 12). For example, the growth rate of the construction sector is 0.04 percent but there is a decline of 0.04 percent in the agriculture sector, where foreign labor is critical. The small change in sectoral growth rates indicate that the drastic levy increases will have marginal long term effects on the Malaysian economy. Effect on Unemployment Impacts on unemployment are also minimal; simulations predict that there will be a slight decrease in unemployment the first year after the levy rise and a slight increase in the years after. The effect on overall unemployment among Malaysians is almost zero, even in the 100 percent levy rise scenario, regardless of who pays the levy costs. Results also show that initially all unskilled and low-skilled Malaysians slightly benefit from increases in levy costs. Locals with very low skills (with no formal schooling or UPSR equivalent) benefit from the rise in foreign costs and the same is true for low skilled workers (PMR and SPM level). Positive effects on unskilled and low skilled locals result from substitution effects. But
the beneficial effect to locals is only observable in the initial year. Also, as the already low proportion of locals with low levels of skills continues to decrease over time in Malaysia, low technology firms and firms in labor intensive economic sectors will be compelled to tap into the foreign workers resource in the mid-to-longer term, rise prices, or exit the (formal) Malaysian market altogether. Thus, over time, the positive employment effects of levy cost increases will likely be attenuated over time. IMMIGRATION SYSTEMS: POLICY AND GOVERNANCE STRUCTURE Building an immigration system is a complex task and one with repercussions on multiple spheres. Malaysia is not immune to this challenge. Learning from other countries with similar contexts and benchmarking is often useful. Consequently, this report reviews details from various immigration systems: Australia, Canada, Singapore, United States, South Korea, Thailand, and Taiwan. But despite the usefulness of these lessons, each country has a different context and strategic goals. Therefore, lessons should serve as a guide but immigration policy should not be designed following a one-size-fits-all approach. The report includes a detailed description of the Malaysian immigration system, its evolutions and recent initiatives. Main Messages Learned from Other Countries Setting up statutory agencies with a clear legal mandate and strong

xxx
accountability is a fundamental step in developing an effective institutional framework. But while there is no single recipe for setting up public agencies, it is critical that the agency (or agencies) in charge operate according to long-term plans with demographic and labor market demands in perspective. It is important to allow institutional bodies in charge of immigration the flexibility to rapidly respond to sudden changes in the economic environment. Levies, fees and taxes should be used cautiously as a tool to deter inefficient use of foreign workers. These tools can be used to attract foreigners with the appropriate human capital profiles through exceptions, lowering of fees, changing their levels and other similar measures. It is also critical to take policy decisions in consultation with other stakeholders — in particular the private sector — to have the optimal number of foreigners and reduce the gap between demand and the supply of immigrants. Some countries originally developed a demand-driven immigration system, while others opted for a supply-driven system. However, over the years, countries have adjusted depending on market conditions and now they fluctuate within this spectrum. Irrespective of the system chosen, it is vital to design multiple channels of entry for migrants, each of them targeting the needs of the economy at a certain point in time, to take into account the different regional needs within a country, and to review one’s approach as needed. Generally the recruitment process in demand-driven systems is led by the
firms seeking to import skills, while supply-driven systems put more burdens on the Government. In both cases, the Government needs to actively oversee firms and private recruitment agencies to avoid the exploitation of immigrants. It is difficult to set quotas, levies, and dependency ceilings at the optimal level, with the regularity that the market needs. As a result, mistakes are bound to occur and lead to denying access to productive foreign talents. Stricter requirements to grant foreign visas (education levels, language skills, training of local workers, and so on) can be a more efficient way to regulate immigration flows. A good practice identified from other countries is to compile a list of occupations in need of foreign labor and to prioritize applications in these sectors. This exercise requires reliable data that is regularly collected and available to all Ministries and Government entities in charge of regulating immigration and reforming immigration policy. Besides providing critical information on human resource needs to relevant agencies of Government, this system can serve as a check-mechanism to avoid overuse of foreigners over locals. Currently the Government asks employers to prove that local workers could not be found to perform certain duties; but the employer’s information can be subjective. This system can bring in objectivity into the process while allowing the Government to be more proactive in meeting human resource needs. To maximize the economic benefits brought about by skilled foreign

xxxi
workers, setting up channels to transition from temporary to permanent status are important to retain the skills of migrants who have already been successfully tested in the local labor market. When it comes to undocumented foreign worker flows, country cases illustrate that it is important to: (i) have in place a clear legislation regulating the activities of relevant government agencies; (ii) have strict punishments for employers hiring undocumented workers to discourage the practice; (iii) enact laws compatible with the enforcement capacity of a country; and (iv) impose affordable costs and fees for employers and migrants to prevent undocumented migration. MAIN FINDINGS AND ISSUES FOR THE GOVERNMENT TO CONSIDER Continuing demand for unskilled foreign labor and increasing demand for foreign talent reflect the current economic profile of Malaysia as a growing country that is trying to escape the middle-income trap. Many economic sub-sectors in Malaysia continue to be heavy-employers of low-skill labor, without having a big pool of these workers available locally. At the same time, other economic sub-sectors are becoming more intense users of specialized high-end skills without having an available local critical mass of these workers. This special dilemma puts immigration policy at the forefront of the country’s growth strategy and as the analysis in this report shows. Any abrupt disruption of the foreign labor supply in the country is likely to cause unpredictable effects in many economic sectors in the economy.
1. The analysis indicates that the overall effect of presence of foreign workers is positive for Malaysia since they fill important gaps in the labor force portfolio.
The main objective of the Malaysian immigration system should be to deliver the right skill mix in a short period of time with minimum transactions (search, wait and regulatory compliance) costs for all parties involved. And the main focus of foreign worker recruitment should be on quality rather than quantity. It is important for the government to understand that there is significant variation in terms of the effects on different demographic groups and economic sub-sectors in Malaysia in order to target its assistance appropriately. Three points worth noting are: The benefits of foreign workers
are highest for Malaysians with secondary education, rather than those with less (primary) or more (tertiary) education.
Malaysians with primary
education, whose numbers and share in the labor force have declined over the last two decades and continue to do so, are likely to suffer the most from adverse effects of immigration since they compete directly with low-skill foreign workers.
Tertiary educated workers are
the least impacted by increases in immigration in the labor market. When immigration decreases by a large amount, due to a drastic rise in costs to employ immigrants, degree holders in the services sector see a slight
xxxii
increase in unemployment. Another impact from immigration for tertiary-educated Malaysians, mainly for families with children, is through the availability and affordability of domestic household services, such as childcare.
2. Consider increasing the role of
levies and decreasing the importance of quantitative restrictions in determining the foreign employment levels in each sector.
Many countries are moving away from aggregate quantity targets. The impetus is towards more finely tuned migration policies where the quantity restrictions and levies are designed for each sector and education level separately. This is very similar to the transformation observed in international trade policies where tariffs proved be more efficient and effective than quotas in reaching desired policy objectives and replaced them in almost every country. Thus, it is more beneficial for the government to adjust levy levels when it desires to influence the demand for foreign workers instead of simply modifying the quota levels. The main reason is that levies provide more flexibility to the employers in the labor markets, enabling them to design their workforce plans more effectively, without worrying about sudden shortages for foreign worker permits. Similarly, firms can meet sudden demand increases by importing foreign workers, which will allow them to increase their output and not miss revenue making opportunities.
The levy levels may be varied across economic sectors, worker skill levels and re-adjusted over time as labor market conditions change. However, a word of caution is that raising the levies too drastically and keeping them (static) at a level that is not responsive to labor market needs may lead to increases in illegal immigration. Experience from other countries shows that having undocumented immigration is a natural consequence of regimes that are not responsive to market needs. In cases when governments make legal immigration too costly given the economic context, illegal immigration is likely to rise. 3. Migration policies need to reflect
the needs of the labor market with attention to sectoral and human capital needs of the economy. This can only be done through a comprehensive labor market monitoring system.
For an effective design and implementation of a levy system, there is need for constant surveillance of labor market conditions across sectors and skill levels and continuous interaction with stakeholders. Thus, one of the proposals in this report is the design and implementation of a workforce dashboard where the government collects and processes key labor market indicators in order to respond quickly and effectively to sudden changes. Among the possible indicators are sector and skill specific wages, job openings, shortages and time it takes to fill vacancies. Related to this point is the importance of having regularly collected (and accessible) suitable labor market data. The Malaysian

xxxiii
Government should consider strengthening its effort to collect (and make available) reliable, high quality and detailed data on all workers—local and foreigners—to properly understand the effect of immigration and evaluate future policy changes. Given the extensive share of undocumented and irregular immigration in Malaysia, it is especially important for the authorities to have detailed data on the labor force that is collected on a regular basis. 4. Given continually changing
market needs and global competitiveness for talent, it is necessary for immigration systems to be closely linked to labor market needs and to be flexible to respond to changes in the environment.
It is good practice to update and introduce new channels of entry and retaining foreign workers (namely mid-to-high skill) with the needed human capital profiles so that they can be admitted efficiently and quickly and/or so that employers can offer them a path to permanent residence in Malaysia. Given the easy flow of skills across countries, a goal of Malaysia’s immigration policy should be to create the right incentives to attract foreign talent. Skilled foreigners contribute their intellectual abilities. Evidence from other countries supports this finding; it shows that foreign talent improves productivity, induces technological upgrades, and increases knowledge transfer to local workers. However, firm-level analysis indicates that the impact of immigration on firm productivity in Malaysia varies depending on the economic sub-sector and firm specific
characteristics (such as size and ratio of foreigners to locals). Thus, if Malaysia seeks to improve its productivity it should consider reforming its immigration policies to retain skilled foreigners already in the country (already trained and acclimated to the culture and work ethic) and attract new ones that fill clear skills gaps in the country. To do this, the government should consider more flexible entry regimes for critical skill need areas, and more promising long-term opportunities for existing foreigners with desirable skills/traits.

Chapter 1: Labor Immigration in Malaysia Trends and Characterization of the Migrant Workforce

2
1.1 Background
The Government of Malaysia is interested in assessing the economic impact of the foreign workforce and in making its current immigration system more effective. As informed by the Ministry of Human Resources (the counterpart for this report), the objective of the Malaysian Government, with respect to immigration, is threefold. First, the Government wants to effectively and efficiently manage the process of admitting foreign workers and reducing overdependence on foreign labor, without harming economic growth. Second, it would like to improve the tracking and monitoring of foreign workers in the country and reduce the incidence of illegal and undocumented immigration. Third, the Government wants to make the country’s environment more conducive for foreign workers and their employers to abide by the rules. This report aims to support the Ministry of Human Resources (MOHR) in quantifying the impact of foreign labor in Malaysia, in order to better identify its foreign and local human resource needs going forward. This report also aims to help the MOHR in identifying immigration policy areas that need to be reformed in order for the Government of Malaysia to meet its three aforementioned objectives. Prior to the preparation of this report, the Government organized a Foreign Management Lab to address the growing concerns on illegal immigration, to find ways to reduce reliance on foreign workers, and to improve the overall management of foreign workers in Malaysia. The Cabinet Committee on Foreign Workers and Illegal Immigrants set up the Lab, which was held in May 2010. Lab participants were asked to evaluate the costs and benefits of key economic sectors where foreigners are more commonly employed. These sectors are: manufacturing, construction, agriculture and plantation, fisheries, tourism, services, and education. The Lab methodology consisted of gathering experts (for a period of time) from most government agencies involved in the oversight of immigration in the country. Intense discussions were held on the main issues facing Malaysia in the management of immigrants. Best practices from around the world were shared and potential recommendations for the Government to consider were identified. The Lab recommendations covered three areas: improving control over the demand and supply of immigrants, addressing legislation loopholes, and identifying reforms to better enforce laws and improve the monitoring of immigrants. Most of the recommendations are well aligned with the objectives of the Government and endorsed by Lab participants. This report adds to previous analyses done on immigration in Malaysia in four distinct ways. First, it uses economic tools to measure the impact of
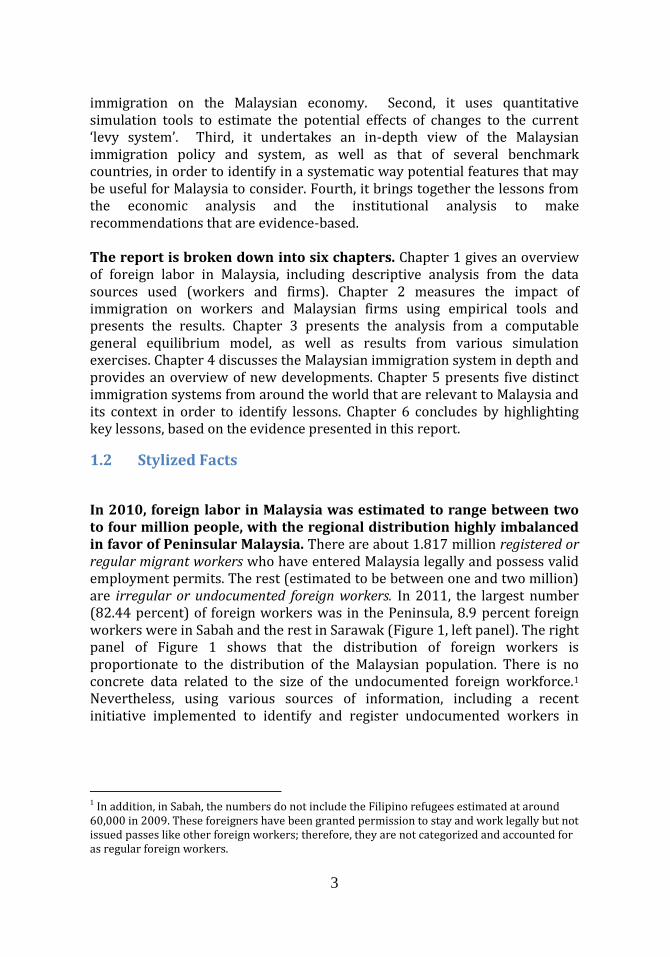
3
immigration on the Malaysian economy. Second, it uses quantitative simulation tools to estimate the potential effects of changes to the current ‘levy system’. Third, it undertakes an in-depth view of the Malaysian immigration policy and system, as well as that of several benchmark countries, in order to identify in a systematic way potential features that may be useful for Malaysia to consider. Fourth, it brings together the lessons from the economic analysis and the institutional analysis to make recommendations that are evidence-based. The report is broken down into six chapters. Chapter 1 gives an overview of foreign labor in Malaysia, including descriptive analysis from the data sources used (workers and firms). Chapter 2 measures the impact of immigration on workers and Malaysian firms using empirical tools and presents the results. Chapter 3 presents the analysis from a computable general equilibrium model, as well as results from various simulation exercises. Chapter 4 discusses the Malaysian immigration system in depth and provides an overview of new developments. Chapter 5 presents five distinct immigration systems from around the world that are relevant to Malaysia and its context in order to identify lessons. Chapter 6 concludes by highlighting key lessons, based on the evidence presented in this report.
1.2 Stylized Facts
In 2010, foreign labor in Malaysia was estimated to range between two to four million people, with the regional distribution highly imbalanced in favor of Peninsular Malaysia. There are about 1.817 million registered or regular migrant workers who have entered Malaysia legally and possess valid employment permits. The rest (estimated to be between one and two million) are irregular or undocumented foreign workers. In 2011, the largest number (82.44 percent) of foreign workers was in the Peninsula, 8.9 percent foreign workers were in Sabah and the rest in Sarawak (Figure 1, left panel). The right panel of Figure 1 shows that the distribution of foreign workers is proportionate to the distribution of the Malaysian population. There is no concrete data related to the size of the undocumented foreign workforce.1 Nevertheless, using various sources of information, including a recent initiative implemented to identify and register undocumented workers in
1 In addition, in Sabah, the numbers do not include the Filipino refugees estimated at around 60,000 in 2009. These foreigners have been granted permission to stay and work legally but not issued passes like other foreign workers; therefore, they are not categorized and accounted for as regular foreign workers.

4
Malaysia, the number of irregular workers is estimated to be as high as two million2.
Figure 1. Legal Foreign Labor, 1993-2011 (L); Malaysian Citizens, 1990-
2010 (R) By Region
Source: Department of Immigration; Aizizah Kassim and Ragayah, 2011; authors’ calculations
based on the Labor Force Survey
Sectoral employment patterns also vary between the three major regions of the country. The utilization of foreign labor in Sabah and Sarawak differs in important respects from the utilization in the Peninsula. In the Peninsula the largest numbers of foreign workers are in manufacturing, whereas in Sabah and Sarawak the plantation sector takes the lead. To date, plantation and agriculture remain the most important sectors for foreigners in Sabah (and Labuan), whereas in Sarawak plantation and manufacturing are the two main sectors (Figure 2). Foreign workers became employees of choice in plantation and agriculture in Sabah due to various reasons. For instance, Malaysian workers were not attracted to these sectors due to the remote locations, lack of facilities and low pay. Employers, on the other hand, may have been unwilling to hire Malaysian workers who were seen as less willing and committed to tasks (defined as 3D—dirty, difficult and dangerous) that are often the norm in the agricultural and plantation sectors. In recent years, foreign workers in Sabah have begun to make inroads into hawking, petty trading, domestic services, transportation, and construction/renovation works (MSN 2004). There are some skilled foreigners in Sabah and Sarawak
2 To the extent possible, this report tries to measure the effect of all foreigners, regular and
irregular, on the Malaysian population. However, given that these workers seek to evade detection, they are likely to be undercounted in formal data sources.

5
as well—generally medical officers, teaching professionals and expatriates attached to the larger corporations in these states.
Figure 2. Foreigners on Temporary Employment Passes, by Region,
Various Years
Source: Ministry of Home Affairs; Department of Immigration; and Azizah Kassim (2010).
Foreign workers come to Malaysia mainly from Indonesia, the Philippines, Nepal, and Bangladesh. However, in more recent years, workers from Myanmar and Cambodia have been arriving in large numbers. Other countries where workers come from are India, Vietnam, Pakistan, Thailand, China, and Sri Lanka, although their total numbers are low compared to the leading foreign groups (Figure 3). The total estimated number of Filipinos throughout Malaysia is not as large as expected given the proximity of the country. Nevertheless, the geographic location of Sabah and Sarawak is an important variable in that the shared land border between both states with Indonesia, and the proximity to the Philippines, results in the heavy presence of foreign workers from these countries in Borneo. The large inflow of foreign workers into Sabah and Sarawak was originally a result of settlement by people from the neighboring regions during the colonial era, and more recently, foreigners from neighboring countries have emigrated largely due to political and economic factors in their own countries. Sabah’s proximity to the Southern Philippine islands accounts for the concentration of Filipino foreign workers in the state as opposed to the rest of the country. Further, the presence of a large number of irregular foreign workers in the plantation and agricultural sectors is a factor to note in Sabah. The shared border between Sarawak and Indonesian Kalimantan continues to facilitate the inflow of many irregular foreign workers, as well as cross-border workers who commute to work daily from Kalimantan to Sarawak.
Peninsula Sabah/Labuan Sarawak
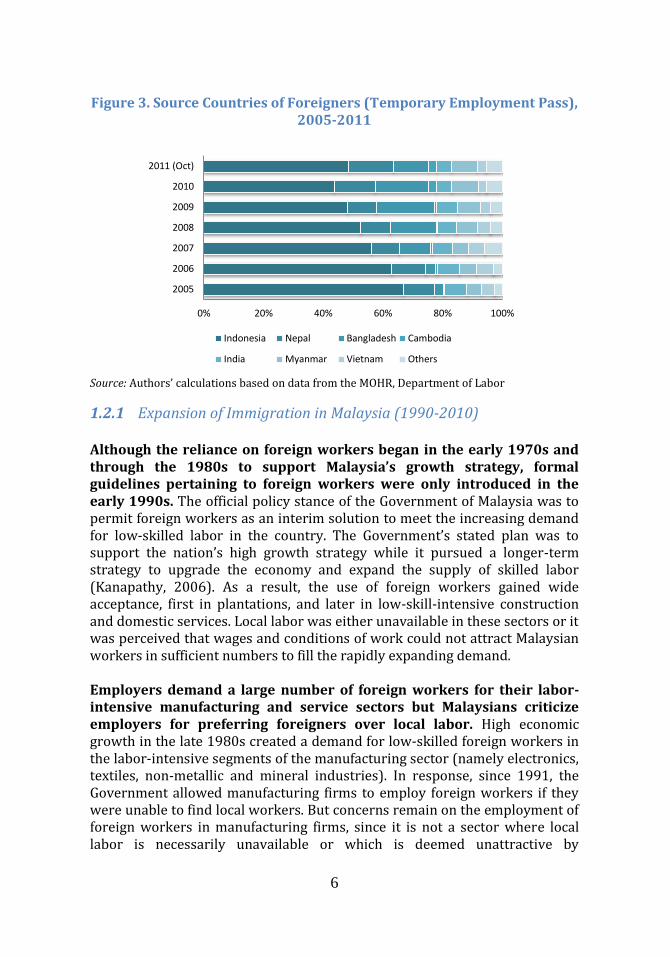
6
Figure 3. Source Countries of Foreigners (Temporary Employment Pass), 2005-2011
Source: Authors’ calculations based on data from the MOHR, Department of Labor
1.2.1 Expansion of Immigration in Malaysia (1990-2010) Although the reliance on foreign workers began in the early 1970s and through the 1980s to support Malaysia’s growth strategy, formal guidelines pertaining to foreign workers were only introduced in the early 1990s. The official policy stance of the Government of Malaysia was to permit foreign workers as an interim solution to meet the increasing demand for low-skilled labor in the country. The Government’s stated plan was to support the nation’s high growth strategy while it pursued a longer-term strategy to upgrade the economy and expand the supply of skilled labor (Kanapathy, 2006). As a result, the use of foreign workers gained wide acceptance, first in plantations, and later in low-skill-intensive construction and domestic services. Local labor was either unavailable in these sectors or it was perceived that wages and conditions of work could not attract Malaysian workers in sufficient numbers to fill the rapidly expanding demand. Employers demand a large number of foreign workers for their labor-intensive manufacturing and service sectors but Malaysians criticize employers for preferring foreigners over local labor. High economic growth in the late 1980s created a demand for low-skilled foreign workers in the labor-intensive segments of the manufacturing sector (namely electronics, textiles, non-metallic and mineral industries). In response, since 1991, the Government allowed manufacturing firms to employ foreign workers if they were unable to find local workers. But concerns remain on the employment of foreign workers in manufacturing firms, since it is not a sector where local labor is necessarily unavailable or which is deemed unattractive by
0% 20% 40% 60% 80% 100%
2005
2006
2007
2008
2009
2010
2011 (Oct)
Indonesia Nepal Bangladesh Cambodia
India Myanmar Vietnam Others
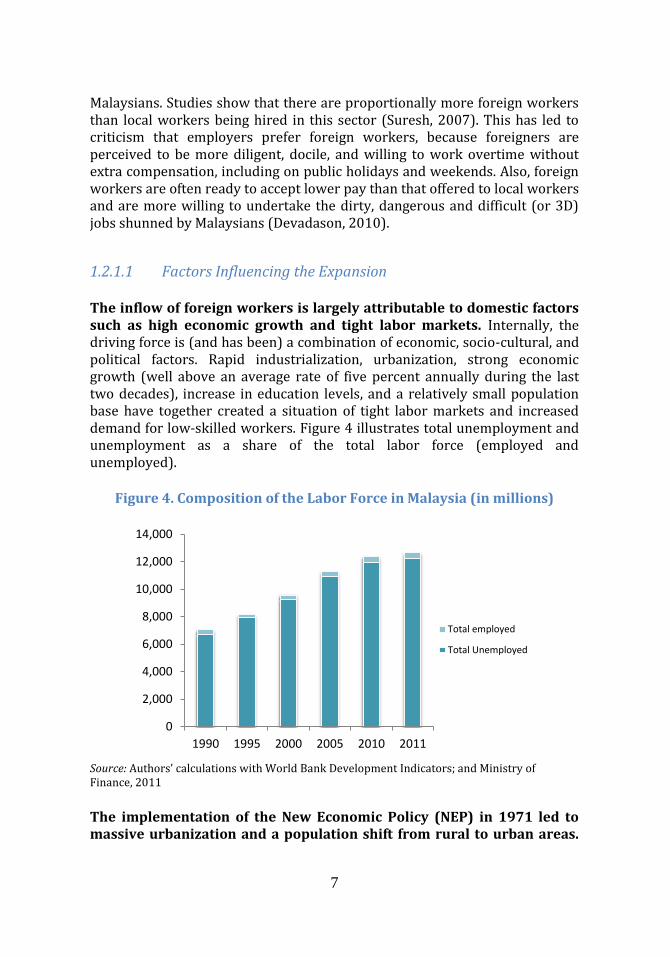
7
Malaysians. Studies show that there are proportionally more foreign workers than local workers being hired in this sector (Suresh, 2007). This has led to criticism that employers prefer foreign workers, because foreigners are perceived to be more diligent, docile, and willing to work overtime without extra compensation, including on public holidays and weekends. Also, foreign workers are often ready to accept lower pay than that offered to local workers and are more willing to undertake the dirty, dangerous and difficult (or 3D) jobs shunned by Malaysians (Devadason, 2010).
1.2.1.1 Factors Influencing the Expansion The inflow of foreign workers is largely attributable to domestic factors such as high economic growth and tight labor markets. Internally, the driving force is (and has been) a combination of economic, socio-cultural, and political factors. Rapid industrialization, urbanization, strong economic growth (well above an average rate of five percent annually during the last two decades), increase in education levels, and a relatively small population base have together created a situation of tight labor markets and increased demand for low-skilled workers. Figure 4 illustrates total unemployment and unemployment as a share of the total labor force (employed and unemployed).
Figure 4. Composition of the Labor Force in Malaysia (in millions)
Source: Authors’ calculations with World Bank Development Indicators; and Ministry of Finance, 2011
The implementation of the New Economic Policy (NEP) in 1971 led to massive urbanization and a population shift from rural to urban areas.
0
2,000
4,000
6,000
8,000
10,000
12,000
14,000
1990 1995 2000 2005 2010 2011
Total employed
Total Unemployed
8
This led to labor shortages in several key economic sectors. The NEP, put in place in part to eradicate poverty, prompted the movement of people from rural to urban areas, which led to acute labor shortages in the agriculture and plantation sectors. These shortages were largely addressed by the arrival of foreign workers from Indonesia, the Philippines and Thailand. The incidence of immigrants from other countries was low at that time. Over time, labor shortages became a concern in the construction sector and in domestic services, where increased prosperity generated increased demand for more workers. Initially, the recruitment of foreign workers was done surreptitiously as there were no legal provisions. But this changed over time. Immigration policy began to develop (heavily influenced by necessity) to allow a sufficient supply of unskilled and semi-skilled foreign workers into the country to maintain economic growth. A recent study from Mexico (Atkin, 2012) finds that the expansion of the manufacturing sector had a detrimental effect on the long-term human capital development of the country. Indeed, the increased job opportunities made available by the booming sector resulted in a rise in the school dropout rate and, in turn, in a decrease in the education level of the Mexican labor force. Unlike the Mexican experience, the expansion of the manufacturing sector in Malaysia did not result in negative outcomes in education for the local population. The biggest difference between the two countries during the expansion of the sector was the reliance on foreign workers in Malaysia. Access to foreign workers made possible the coexistence of export-led growth and continual educational improvements of the local labor force. The expansion of formal education since independence led to changes in job preferences of many Malaysians. More specifically, young Malaysian workers with formal education shunned menial jobs such as those in agriculture and construction in favor of formal and better-remunerated employment in the public and private sectors. Rapidly increasing education rates also led to a rise in the number of educated women who sought formal jobs, which in turn led to an increase in the demand for domestic workers. External economic and political factors have also contributed to an increase in the inflow of migrant workers into Malaysia. Political instability in neighboring countries created asylum seekers and refugees who ended up joining the Malaysian labor market as irregular workers. However, the main factors were the comparatively slower economic growth rates in several neighboring countries, accompanied with low wages and sometimes higher levels of unemployment that gave rise to disparities in living standards and economic structures between Malaysia and source countries. All these forces provided increased incentives for workers to emigrate out of their

9
countries and into rapidly growing, stable and nearby Malaysia. Different population dynamics in East and South-East Asia will continue to trigger immigration in the region in the next years (Walmsley et.al, 2012).
1.3 Data Section
An important caveat to the analysis presented here, and throughout the report, is that data measuring foreign labor are imperfect. Estimates vary across data sources, there are certain gaps on the same variables coming from different sources, and even though results based on these different sources are consistent, there may be errors in the extent of their precision. Accurate analysis of the effect of immigration on the economy requires reliable and detailed data on foreigners that is rarely available. Unfortunately, these data are difficult to collect and analyze, especially in destination countries where most foreigners are relatively unskilled and arrive and reside mostly without proper documentation. Malaysia is no exception to this rule. There are continuing debates on the extent and different features of the overall foreign population in Malaysia. There are various data sources and each one provides different clues on different aspects. Some of the most quoted numbers come from administrative sources and are based on the number of permits issued by the Government for migrants from different origin countries and sectors of employment. However, these statistics tend not to capture migrants who enter without proper documentation or overstay their visas and continue to reside illegally. Household surveys or censuses are more reliable as long as their sampling frames are constructed accurately and they are nationally representative. However, they might not be conducted frequently enough for useful economic and policy analysis, unlike censuses that are conducted every 10 years.
Data used in this report come from various sources, including surveys, censuses, national accounts, administrative sources, national sources from other countries, and international organizations. However, most of the empirical work presented comes from three sources: (i) Labor Force Surveys (LFS) collected regularly in Malaysia, (ii) economic census data collected every few years, and (iii) Royal Police of Malaysia. The authors of this report would like to highlight that these sources are the best of all potentially imperfect choices available. The next section highlights the main features and potential shortcomings of the two key sources.
10
1.3.1 Labor Force Surveys
The report uses Labor Force Surveys (LFS), collected between 1990 and 2010, for labor market analysis of both Malaysian and foreign workers. The Government of Malaysia has been collecting labor force data for an extended period of time and these data are useful and reliable for the purposes of this study. The surveys ask for the nationalities and countries of birth of the respondents and, as a result, they can be used to analyze the patterns and economic implications of immigration. In addition, the surveys ask many additional questions on the education levels, sectors of employment, age, wages (starting from 2007), and employment status (full-time, part-time, unemployed, among others.). These are extremely useful in econometric analysis of the labor market effects of immigration. One concern remains—the sampling is not perfect in that it fails to collect data on workers who live in communal or group housing. This tends to be the case in plantations and various low-skill intensive enterprises. Since foreigners tend to be overrepresented among the workers in these cases, and there is anecdotal evidence that they also tend to be undocumented, the data possibly undercounts these types of foreigners in the LFS. Also, despite their extremely useful overall properties, LFS might still not fully capture the extent and sectoral composition of immigration in Malaysia. This makes it all the more important that appropriate econometric techniques, capable of dealing with mis-measurement in the number of immigrants, are used when analyzing the data. Malaysia has a growing Malaysian and foreign labor force, with the vast majority employed as full-time workers. There were 10.5 million Malaysian workers in the Malaysian labor force in 2010 and 1.1 million foreign workers in the same year. Over 90 percent of all actively employed workers were working 30 hours or more (full-time) per week. Table 1 in Annex 1 provides an overview of the main characteristics of the labor force data used in the report. As shown, the number of foreign workers increased rapidly over the last twenty years, along with the Malaysian population and economy. Foreign workers captured by LFS make up slightly less than 10 percent of the total labor force and the level has stayed stable over the last decade. However, it is possible that the LFS undercount the immigrants, especially those without proper documentation; this issue is important in several other prominent foreign receiving destinations as well. The share of males among foreign workers is higher relative to the overall population of the labor force (excluding the population that decides not to seek employment, mostly female). In addition, foreign workers have a higher propensity to enter the labor force since employment is the main motivation to immigrate. Also, part-time employment is quite low among foreign workers—at around 1.4 percent for men and 2.1 percent for women.
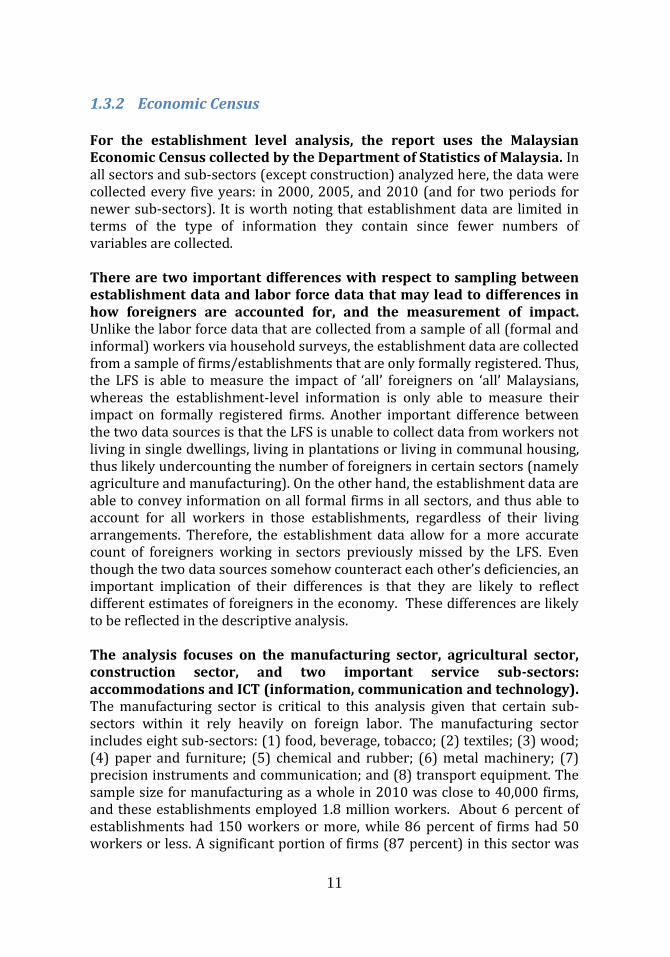
11
1.3.2 Economic Census For the establishment level analysis, the report uses the Malaysian Economic Census collected by the Department of Statistics of Malaysia. In all sectors and sub-sectors (except construction) analyzed here, the data were collected every five years: in 2000, 2005, and 2010 (and for two periods for newer sub-sectors). It is worth noting that establishment data are limited in terms of the type of information they contain since fewer numbers of variables are collected. There are two important differences with respect to sampling between establishment data and labor force data that may lead to differences in how foreigners are accounted for, and the measurement of impact. Unlike the labor force data that are collected from a sample of all (formal and informal) workers via household surveys, the establishment data are collected from a sample of firms/establishments that are only formally registered. Thus, the LFS is able to measure the impact of ‘all’ foreigners on ‘all’ Malaysians, whereas the establishment-level information is only able to measure their impact on formally registered firms. Another important difference between the two data sources is that the LFS is unable to collect data from workers not living in single dwellings, living in plantations or living in communal housing, thus likely undercounting the number of foreigners in certain sectors (namely agriculture and manufacturing). On the other hand, the establishment data are able to convey information on all formal firms in all sectors, and thus able to account for all workers in those establishments, regardless of their living arrangements. Therefore, the establishment data allow for a more accurate count of foreigners working in sectors previously missed by the LFS. Even though the two data sources somehow counteract each other’s deficiencies, an important implication of their differences is that they are likely to reflect different estimates of foreigners in the economy. These differences are likely to be reflected in the descriptive analysis. The analysis focuses on the manufacturing sector, agricultural sector, construction sector, and two important service sub-sectors: accommodations and ICT (information, communication and technology). The manufacturing sector is critical to this analysis given that certain sub-sectors within it rely heavily on foreign labor. The manufacturing sector includes eight sub-sectors: (1) food, beverage, tobacco; (2) textiles; (3) wood; (4) paper and furniture; (5) chemical and rubber; (6) metal machinery; (7) precision instruments and communication; and (8) transport equipment. The sample size for manufacturing as a whole in 2010 was close to 40,000 firms, and these establishments employed 1.8 million workers. About 6 percent of establishments had 150 workers or more, while 86 percent of firms had 50 workers or less. A significant portion of firms (87 percent) in this sector was

12
classified as low-skill intensity, meaning that the workforce was almost fully secondary school level or lower. Table 2 in Annex 1 shows various relevant summary statistics.
1.3.3 Crime Data from the Royal Police of Malaysia (PDRM) All crime statistics were obtained from the Royal Police of Malaysia or PDRM (directly and indirectly). The report makes use of data specifically outlining the types of crimes committed by foreign nationals in the last seven years, by state where the crime is committed and country of origin of the perpetrator. The report also makes use of data reported by the PDRM to the Department of Statistics, disaggregated by year, crime type, and state where the crime was committed. The crime statistics represent actual figures of criminal cases reported to and investigated by the police department. From what has been reported in other studies using this data, it is our understanding that the figures are automatically generated by the Police Reporting System (PRS). Data is collected through standard police reporting processes and documentation; it is then entered into the administrative system. PRS is linked-up throughout the country and to the Contingent and Bukit Aman headquarters. Criminal Intelligence Units (URJ) compile crime statistics periodically. Since the inception of PRS, PDRM have stopped compiling crime statistics manually. There are instances where crimes go unreported. But so long as a case is reported it is reflected in the official crime statistics. PRS is monitored daily at the district, contingent and Bukit Aman HQ levels.
1.4 Descriptive Analysis—Workers
The number of foreign workers in Malaysia has grown rapidly over the last twenty years. It is difficult to accurately measure the number of foreign laborers in Malaysia given that data are imperfect and many foreign workers are illegal and formally unaccounted for by the administrative data3. As seen in Figure 5, there were around 380,000 foreign workers in Malaysia in 1990 according to the LFS. The number increased rapidly to around 2.1 million in 2010.
3 On data use, LFS capture a large portion of the migrant population in the economy and provide a statistically acceptable source for the analysis presented in this report. More detail on the surveys used is provided in the last part of this chapter.
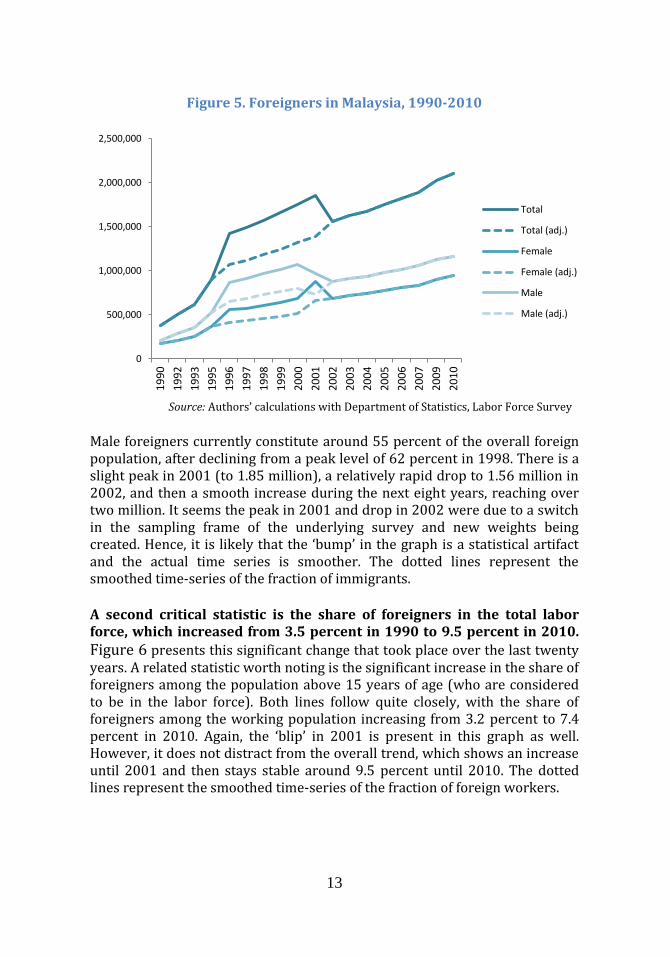
13
Figure 5. Foreigners in Malaysia, 1990-2010
Source: Authors’ calculations with Department of Statistics, Labor Force Survey
Male foreigners currently constitute around 55 percent of the overall foreign population, after declining from a peak level of 62 percent in 1998. There is a slight peak in 2001 (to 1.85 million), a relatively rapid drop to 1.56 million in 2002, and then a smooth increase during the next eight years, reaching over two million. It seems the peak in 2001 and drop in 2002 were due to a switch in the sampling frame of the underlying survey and new weights being created. Hence, it is likely that the ‘bump’ in the graph is a statistical artifact and the actual time series is smoother. The dotted lines represent the smoothed time-series of the fraction of immigrants.
A second critical statistic is the share of foreigners in the total labor force, which increased from 3.5 percent in 1990 to 9.5 percent in 2010.
Figure 6 presents this significant change that took place over the last twenty years. A related statistic worth noting is the significant increase in the share of foreigners among the population above 15 years of age (who are considered to be in the labor force). Both lines follow quite closely, with the share of foreigners among the working population increasing from 3.2 percent to 7.4 percent in 2010. Again, the ‘blip’ in 2001 is present in this graph as well. However, it does not distract from the overall trend, which shows an increase until 2001 and then stays stable around 9.5 percent until 2010. The dotted lines represent the smoothed time-series of the fraction of foreign workers.
0
500,000
1,000,000
1,500,000
2,000,000
2,500,000
19
90
19
92
19
93
19
95
19
96
19
97
19
98
19
99
20
00
20
01
20
02
20
03
20
04
20
05
20
06
20
07
20
09
20
10
Total
Total (adj.)
Female
Female (adj.)
Male
Male (adj.)

14
Figure 6. Foreigners as a (Percent) Share of the Labor Force, 1990-2010
Source: Authors’ calculations with Department of Statistics, Labor Force Survey
While their numbers were increasing, foreign workers were participating in the labor force at higher levels than Malaysians. This is to be expected since the main reason foreigners come to Malaysia is to increase their earnings, possibly to send remittances to their families back in their home countries and increase their savings. As a result, employment levels of both male and female foreigners are higher than their Malaysian counterparts as seen in Figure 7. During 1990 and through to 2010, the employment rate of male foreigners moved between a narrow range (between 93 percent and 95 percent) while it increased from 41 percent to over 60 percent for female immigrants. On the other hand, the employment rate of Malaysian males declined from 81 percent in 1990 to 73 percent in 2010. The participation of Malaysian females in the labor force is chronically low in Malaysia despite the fact that they are highly educated relative to women in other developing countries. Only between 41 percent and 46 percent of women are in the labor force. One reason for the low labor force participation of Malaysians (especially youth and women) posited by many in Malaysia is the presence of abundant and relatively inexpensive unskilled foreign workers. This question is investigated further in the next chapter of the report.
0.00
2.00
4.00
6.00
8.00
10.00
12.00
14.00
19
90
19
92
19
93
19
95
19
96
19
97
19
98
19
99
20
00
20
01
20
02
20
03
20
04
20
05
20
06
20
07
20
09
20
10
% labor force
% labor force (adj.)
% 15+
% 15+ (adj.)

15
Figure 7. Employment Rates of Migrant and Malaysian Workers by Gender
Source: Authors’ calculations with Department of Statistics, Labor Force Survey
As of 2010, Indonesians were (still) the main foreign group (55 percent), and Filipinos the second largest group in LFS (20 percent). LFS data show a slightly different breakdown of the place of origin of foreigners than the administrative data (shown in the previous section). The prominence of Indonesians among foreigners is not surprising given the reasons outlined in section 1.2.4 The pull factors have resulted in large percentages of unskilled Indonesians being present in the Malaysian labor market; they comprise between 55 percent and 60 percent of the total foreign population. For many Filipinos, migration is a common part of life and Filipino maids, seamen and nurses are prominent features of the labor markets in many OECD, Persian Gulf and East Asian countries. Malaysia receives a large number of Filipino immigrants; they make up around 20 percent of the total, working primarily in the nearby states of Sabah and Sarawak. The rest of the immigrants, between 20 percent and 25 percent of the total, come from numerous other countries and their composition has been changing over time. Historically, South Asian countries, such as India and Bangladesh, were important sources due to their excess population and cultural links. In recent years, people from other ASEAN countries—such as Vietnam, Laos, and Myanmar—became more
4 The attraction to come to Malaysia, or the pull factor, especially for Indonesians and Filipinos (mainly from Mindanao), is largely the proximity, cultural similarities and favorable economic conditions in Malaysia relative to neighboring countries.
0%
20%
40%
60%
80%
100%
Male Migrants Female Migrants
Male Natives Female natives

16
commonplace in Malaysia as regional integration strengthened, labor mobility costs lowered, and restrictions were reduced (Figure 8). Distinct from most other destination countries in the world, foreign workers in Malaysia are older than workers from the Malaysian population. This is an interesting and surprising observation because most immigrant workers around the world are between the ages of 15 and 35. The age range is low mainly because those are the ages for risk-taking and higher income potential. However, in Malaysia, the local population is young and foreigners tend to be older. For example, around 30 percent of the Malaysian population and only 20 percent of the foreign population are between 20 and 30 years of age. On the other hand, almost 40 percent of foreigners and only 25 percent of the Malaysian population are between 30 and 40 years of age, respectively. This is indicative of two potential forces at play. First, most foreign workers staying in Malaysia do so for extended periods, despite the fact that the visas issued are for relatively short terms. Second, most foreigners work in low-income and low-skilled sectors such as agriculture, and certain services such as construction. Living in Malaysia provides significant economic gains to foreigners compared to what they would earn in their home countries, working in similar physically demanding occupations. Thus, there is more of an incentive for foreigners to stay in Malaysia as they get older. Figure 9 shows a reduction in the share of young foreigners and an increase in the share of older immigrants, especially age 35 and up, over the last two decades.
Figure 8. Origin Countries of Foreigners
Source: Authors’ calculations with Department of Statistics, Labor Force Survey
0
200,000
400,000
600,000
800,000
1,000,000
1,200,000
1,400,000
Indonesia
Indonesia (adj.)
Philippines
Philippines (adj.)
Other
Other (adj.)

17
Figure 9. Age Distribution of Foreigners
Source: Authors’ calculations with Department of Statistics, Labor Force Survey
Foreign workers are concentrated in several big states and their distribution across states is stable over time. Sabah has always been the largest destination state in Malaysia for immigrants, with over 36 percent of the total foreign population residing there in 2010 (down from 44 percent in 2000). Proximity to Indonesia and the Philippines, cultural affinity, and the prominent role of agriculture in the economy of the state (especially plantations) are among the main reasons why it is an attractive destination. Selangor and Johor follow with 15 percent and 12 percent of the foreign population, respectively, in 2010 (Figure 10). As of 2010, these three states were hosts to two-thirds of all foreigners in Malaysia. Other states (or territories) with over five percent share of foreigners are Pahang, Pualu, Pinar, Sarawak, and Kuala Lumpur5.
5 For the purpose of this analysis the territory of Putrajaya, which became a Federal Territory in 2001 and is mainly inhabited by government agencies and public servants, was merged within Selangor in order to have a consistent time series. Labuan was excluded from this figure, despite the large number of immigrants, because of its small size and small population share.
0
50,000
100,000
150,000
200,000
250,000
300,000
350,000
15-19 20-24 25-29 30-34 35-39 40-44 45+
19901992199319951996199719981999200020022003200420052006200720092010

18
Figure 10. Distribution of Foreign Workers Across States
Source: Authors’ calculations with Department of Statistics, Labor Force Survey
The concentration of foreign workers in a few states is due to the concentration of types and amounts of economic opportunities available for low-skilled labor in those states. It is natural for foreigners to be attracted to states where economic opportunities abound for their skill sets. Figure 11 displays the share of the total population in a given state that is foreign-born. Foreigners make up almost 30 percent of the total population in Sabah (and 23 percent in Labuan, not shown). Their presence is less concentrated in other states. For example, migrants make up 10 percent of the population in each of the following states: Johor, Pahang , Kuala Lumpur, and Pulau Pinang. In Selangor, Melaka, Negeri Sembilan, Sarawak, and Kuala Lumpur they only make up five percent of the total population in each state. All other states have a negligible share of the foreign population, despite the fact that such shares have increased since the 1990s.
15%1%
5%
1%1%
6%
1%5%
0%11%
3%
42%
3%
5%
1%
1990Johor
Kedah
Kelantan
Melaka
Negeri Sembilan
Pahang
Pulau Pinang
Perak
Perlis
Selangor
Terengganu
Sabah
Sarawak
WP Kuala Lumpur
WP Labuan
12%2%
2% 2%
2%
5%
5%
4%
0%15%
2%
36%
6%6%
1%
2010 Johor
Kedah
Kelantan
Melaka
Negeri Sembilan
Pahang
Pulau Pinang
Perak
Perlis
Selangor
Terengganu
Sabah
Sarawak
WP Kuala Lumpur
WP Labuan

19
Figure 11. Share of Foreign Workers in Different States
Source: Authors’ calculations with Department of Statistics, Labor Force Survey
Foreign labor continues to be largely concentrated in physically demanding sectors of the economy such as agriculture, plantations and construction. About 32 percent of all foreign employment was in the agricultural and plantation sector in 2010; this percentage was down from a higher level of 35 percent and 48 percent in 2000 and 1990, respectively. The construction sector was the second largest employer of immigrants, with 14 percent of the total, in 2010 (Figure 12). It was followed by other services that encompass a host of low-skill demanding services (12 percent), wholesale retail (11 percent), and accommodation services such as hotels (seven percent). With the exception of the relatively rapid decline in the share of agricultural employment among immigrants, other sectors were more stable in terms of the share occupied by foreign workers. This was especially true for service sectors that employ relatively more unskilled workers (for instance, hotels, construction, and restaurants), and are spread across the country. High technology, high skilled manufacturing and high skilled service sectors were not big employers of foreigners given that they often require specialized skills that most foreigners tend not to possess.
0 10 20 30 40 50
Johor
Kedah
Kelantan
Melaka
Negeri Sembilan
Pahang
Pulau Pinang
Perak
Perlis
Selangor
Terengganu
Sabah
Sarawak
WP Kuala Lumpur
% in 2010
% in 2000
% in 1990

20
Figure 12. Distribution of Foreign Workers Across Sectors
Source: Authors’ calculations with Department of Statistics, Labor Force Survey
As a share of an entire economic sector, foreign workers make up the largest share of the wood-manufacturing sector, followed by other services, and agriculture. The data shown in Figure 13 provide a picture of the distribution of foreigners and their role across sectors. Foreigners had the highest share of employment in the manufacturing of wood products (37 percent in 2010, down from 46 percent in 2000), in other service sectors of the economy (27 percent in 2010), agriculture and plantations (23 percent), construction (14 percent), and manufacturing of transportation machinery and manufacturing of food products (each 11 percent). Even though agriculture, construction and other services employed most of the immigrants, it is clear that foreigners played a significant role in several relatively smaller manufacturing sectors (wood, food and transport equipment). Also, as mentioned previously, foreigners were not present in service sectors that either required high levels of human capital or where public servants were employed—for instance, finance, telecommunications, health, education, and public administration.
0% 20% 40% 60% 80% 100%
1990
2000
2010
Agriculture
Construction
Other services
Wholesale-retail
Accommodation and resturant
Mfg wood
Mfg meas-med-com
Business services
Mfg food-bev-tob
Metal-machinery-equ
Mfg chem-rub
Logistics
Mfg transp equip
Mfg paper-furn
Mfg textile
Health
Education
Public administration
Mining
Real estate
Utilities
Post and telecom
Finance
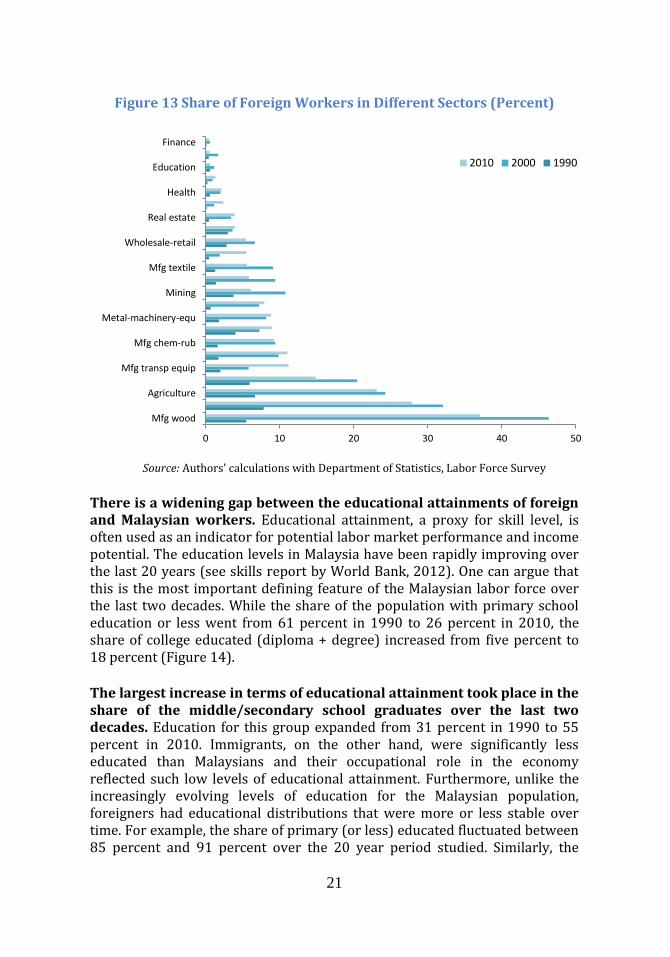
21
Figure 13 Share of Foreign Workers in Different Sectors (Percent)
Source: Authors’ calculations with Department of Statistics, Labor Force Survey
There is a widening gap between the educational attainments of foreign and Malaysian workers. Educational attainment, a proxy for skill level, is often used as an indicator for potential labor market performance and income potential. The education levels in Malaysia have been rapidly improving over the last 20 years (see skills report by World Bank, 2012). One can argue that this is the most important defining feature of the Malaysian labor force over the last two decades. While the share of the population with primary school education or less went from 61 percent in 1990 to 26 percent in 2010, the share of college educated (diploma + degree) increased from five percent to 18 percent (Figure 14).
The largest increase in terms of educational attainment took place in the share of the middle/secondary school graduates over the last two decades. Education for this group expanded from 31 percent in 1990 to 55 percent in 2010. Immigrants, on the other hand, were significantly less educated than Malaysians and their occupational role in the economy reflected such low levels of educational attainment. Furthermore, unlike the increasingly evolving levels of education for the Malaysian population, foreigners had educational distributions that were more or less stable over time. For example, the share of primary (or less) educated fluctuated between 85 percent and 91 percent over the 20 year period studied. Similarly, the
0 10 20 30 40 50
Mfg wood
Agriculture
Mfg transp equip
Mfg chem-rub
Metal-machinery-equ
Mining
Mfg textile
Wholesale-retail
Real estate
Health
Education
Finance
2010 2000 1990

22
share of university educated foreigners stayed between 4 percent and 6 percent. Finally, foreigners with secondary education were the only group that managed to increase their share of education from 10 percent to 18 percent over the 20-year period under review.
Figure 14. Education Distribution of Malaysians and Foreigners Over Time
Source: Authors’ calculations with Department of Statistics, Labor Force Survey
Labor-intensive economic sectors rely more heavily on foreign labor rather than Malaysian workers. Furthermore, even in capital-intensive sectors, foreigners typically hold low-skill occupations. Labor-intensity varies across sub-sectors in the Malaysian economy. For instance, just over half of Malaysian workers in the agriculture sector of the economy have low levels of education; this is a labor-intensive sector that relies heavily on foreign labor and only a subset of workers have mid-high levels of education (likely in management). Similarly, low-skilled service sectors such as accommodation (26 percent), construction (28 percent), logistics (21 percent), and other services (25 percent), have very high shares of workers with primary levels of education. On the other hand, sectors with higher skill intensity such as education (77 percent), finance (59 percent), health and real estate (48 percent), each have increasingly higher shares of university degree educated workers. However, foreigners in each of these sectors are much less educated than their Malaysian counterparts. For example, within the last group of high-skill services, only 13 percent to 35 percent of foreigners are college educated; this likely indicates that these workers are in the sector but hold low-level
0%
10%
20%
30%
40%
50%
60%
70%
80%
90%
100%
1990 1993 1996 1998 2000 2002 2004 2006 2009
Malaysians
Degree
Diploma/Certificate
Post secondary
Upper Secondary
Lower Secondary
No formal/Primary
Not applicable
0%
10%
20%
30%
40%
50%
60%
70%
80%
90%
100%
19
90
19
93
19
96
19
98
20
00
20
02
20
04
20
06
20
09
Immigrants
Degree
Diploma/Certificate
Post secondary
Upper Secondary
Lower Secondary
No formal/Primary
Not applicable

23
occupations (Figure 15). Similarly, even in agriculture, 79 percent of foreigners have primary education or less compared to 57 percent for Malaysians. Similar gaps exist in other sectors as well. Across the economy—including more skill intensive sectors—migrants are significantly less educated.
Figure 15. Education of Immigrants, by Economic Sector, 2010
Source: Authors’ calculations with Department of Statistics, Labor Force Survey
A clear message emerges from the preliminary description of the profiles of Malaysian and foreign workers. Foreign workers bring a different set of skills than Malaysians to the Malaysian economy; they complement Malaysian workers rather than substitute for them.
1.5 Descriptive Analysis—Establishments
Industrialization, which was accompanied by increased foreign direct investment (FDI) in labor-intensive sectors during the 1990s, prompted the need for more labor in an already tight market. The Government increased the flexibility to import labor from neighboring countries to work in the growing sectors of the economy—mainly in manufacturing (Noor et. al, 2011) but also in agriculture and construction. Over time, more foreign firms came to Malaysia to invest and more foreigners came to work in labor-intensive sectors. Currently, the services sector is the largest contributor to the country’s gross domestic product (59 percent) and labor force (52 percent), followed by the manufacturing sector (with about 27 percent of GDP
0% 20% 40% 60% 80% 100%
Agriculture
Mfg food-bev-tob
Mfg wood
Mfg chem-rub
Mfg meas-med-com
Utilities
Wholesale-retail
Logistics
Finance
Business services
Health
Public administration
Not applicable
Primary/Noformal
Secondary

24
and 28 percent of employment share). Third is the agriculture and plantation sector (seven percent of GDP and 12 percent of employment) followed by mining and construction (together they make up nine percent of GDP and seven percent of the employment share).
Establishment data from all economic sectors corroborate that the foreign workforce has increased in terms of numbers as well as a share of the labor force over the last decade. Given the growth of the supply of foreign labor throughout most economic sectors, there is a shared view by many Malaysians that foreigners are increasingly taking away their jobs, depressing local wages, and lowering labor productivity in the country. In order to ascertain whether these perceptions are true, the next two chapters seek to understand where foreigners work, what establishments are most dependent on them, and what impact they have on the economy.
Figure 16. Total Number of Foreigners by Year and Percentage in Manufacturing
Source: Authors’ calculations with Department of Statistics, Economic Census
Foreign workers comprise 30 percent of the manufacturing labor force, according to the economic census that captures all registered firms. There are almost 40,000 firms in eight manufacturing sub-sectors and they jointly employed a total of 1.8 million workers in 2010, with around 515,000 immigrants. About 2300 of the largest firms (with over 150 workers each) accounted for 67 percent of all manufacturing employment (See Table 2 in Annex 1). Figure 16 shows that the percentage of foreigners employed in Malaysian manufacturing establishments has more than doubled since the year 2000. This increase represents a significant portion of the manufacturing labor force (25 percent).
219633
366095
514284
0%
10%
20%
30%
0
100000
200000
300000
400000
500000
600000
2000 2005 2010# of foreign workers

25
Foreign labor has also increased in agriculture and plantations, in both nominal terms and as a share of the total workforce in the sector. There were 6300 firms in agriculture and plantations in 2010 and 10.8 percent were classified as large (employed over 150 workers). Since most of the large firms are in plantations and they employ significantly more foreign workers relative to other agricultural enterprises, the rest of this section of the report will focus on plantations. In 2010, there were 4,892 establishments in the plantations section of the establishment database and 13.8 percent could be classified as large. These firms employed about 66.7 percent of the 319 thousand plantations workers (See Table 3 in Annex 1). About 98 percent of plantations workers were unskilled and a staggering 69 percent of the total plantations labor force was composed of immigrants. The percentage, as a share of the labor force in the sector, had gone from 66 percent to 69 percent from 2005 to 2010 (Figure 17). The increased supply of immigrant labor likely affected plantations production and the marginal product of all types of labor in the sector, native and foreign. According to recent figures provided by the immigration department, there were about 688,000 immigrants in agriculture and plantations alone, mostly from Indonesia, Bangladesh and Nepal (PLKS Immigration Department, 2010)6.
Figure 17. Total Number of Immigrants by Year and Percentage in
Agriculture and Plantations
Source: Authors’ calculations with Department of Statistics, Economic Census
6The exact estimate of workers in agriculture is difficult to obtain from the labor force data because many of these workers live in estates and in communal housing. Establishment data, on the other hand, should be able to capture the number of immigrant workers in the sector more accurately.
142498
220207
64%
65%
66%
67%
68%
69%
70%
0
50000
100000
150000
200000
250000
2005 2010
# of foreign workers % total workforce (sec. axis)

26
Over 60 percent of all construction establishments and 80 percent of all workers focus on building construction, the sub-sector where foreign labor is most needed (Table 4 in Annex 1). The sector has been growing rapidly in Malaysia in the last decade and is expected to continue growing with large projects—the Klang Valley Mass Rapid Transit estimated at RM 50 billion, highways in the Iskandar region, Kuala Lampur (KL) financial district, a new 100-story building known as the Warisan Merdeka in the middle of KL—underway or planned. About half of the sector’s workforce is foreign-born. The sector is largely dependent on foreign workers, most of whom are low-to-medium skilled and acquire their work knowledge when they are hired by assisting more experienced workers.
Various reports show that the construction industry faces shortages of labor on a regular basis and local recruitment is a big challenge for the sector. The sector is known for paying low wages, offering difficult working conditions, and having limited upward career movement. Thus, young Malaysians, even those with low-skills and work experience, are not attracted to the sector, which makes hiring foreigners a necessity. The Ministry of Home Affairs has a significantly lower number of registered workers in the sector than what the sector actually employs. In 2007, the last year for which establishment data are available for this sector, about 45 percent of all workers in the sector were immigrants. This is almost double the number from 2000 (Figure 18).
Figure 18. Total Number of Immigrants, by Year and Percentage, in Construction
Source: Authors’ calculations with Department of Statistics, Economic Census
132204 131238 153919
265415
0%
10%
20%
30%
40%
50%
0
50000
100000
150000
200000
250000
300000
2000 2002 2004 2007
# of foreign workers % total workforce (sec. axis)
27
The two services sub-sectors—ICT and accommodations—are almost exact opposites in most respects. The ICT sector has grown rapidly, from 47,000 workers in the year 2000 to 73,000 in 2005 to 131,000 in 2010 (See Tables 5 and 6 in Annex 1). It is dominated by medium-sized (between 50 and 150 workers) and large-sized firms (over 150 workers), which accounted for 20 percent and 64 percent of total employment, respectively, in 2010. Only two percent of the workers were immigrants, which is the lowest among all sub-sectors analyzed. Conversely, high-skilled workers accounted for 82 percent of total employment, the largest number among the main economic sub-sectors. The accommodations sub-sector on the other hand, had 110,000 workers in 2010, with 31 percent high-skilled and four percent immigrants. Around 200 large firms accounted for 55 percent of total employment in the sub-sector and slightly more than half employed foreign workers. The percentage of foreigners in the accommodations sub-sector remains low (less than four percent), but there have been substantial increases over the last five years. The accommodations sub-sector is part of the tourism and hospitality category of services, which is one of the national key economic sectors or NKEAs. It has seen a rise in foreign workers as a share of the total labor force, from two percent in 2005 to four percent in 2010 (Figure 19).
Figure 19. Total Number of Immigrants, by Year and Percentage, in Accommodations Sector
Source: Authors’ calculations with Department of Statistics, Economic Census
ICT sub-sector in the services sector employed 2,500 foreign workers, representing less than two percent of the total workforce in the sub-sector. As shown in Figure 20 ICT sector has seen an increase in foreign workers in the last decade; however, the total amount of foreign labor remains low. ICT sub-sector is composed of two large groups, one largely focused on manufacturing (mainly computer and electronic equipment) and the other on the services sector, as presented here. The contribution to
2015
4189
0%
1%
2%
3%
4%
0
1000
2000
3000
4000
5000
2005 2010
# of foreign workers % total workforce (sec. axis)

28
manufacturing is around 60 percent and ICT services represent the balance (40 percent). Both computer services and telecommunication services are growing service areas in the sub-sector. The sub-sector is characterized for requiring high levels of creativity and specific skills. The main categories of workers in ICT services area are computer professionals, electronic and telecommunication engineers, and IT managers. The number of foreign workers in the sub-sector remains low, at around 2,500.
Figure 20 Total Number of Immigrants, by Year and Percentage, in ICT
(services)
Source: Authors’ calculations with Department of Statistics, Economic Census
Foreigners tend to concentrate in low value-added activities in key sub-sectors of the economy. Parsing the data into eight sub-sectors in the manufacturing sector shows that there are large numbers of foreign workers in chemical, rubber, metal machinery, precision instruments, and communications equipment manufacturing (Figure 21). Only some of these sub-sectors are NKEAs, for instance, electric and electronics (E&E) manufacturing (under precision instrument and communication). According to the Malaysia Industrial Development Authority (MIDA), in 2010, the E&E sub-sector was a leading part of the manufacturing sector, contributing to nearly one-third of the country’s total manufacturing output and to more than half of its exports (MIDA, 2010). The industry uses low-to-semi-skilled labor, many of which are immigrants, to assemble semi-conductor devices, including memory chips, microprocessors, and integrated circuits, among other labor-intensive assembling tasks (MIDA, 2007). Generally, the integration of the electronics industry from Malaysia into the global production market has been largely dependent on low-cost labor-intensive production rather than based
501
1276
2518
0.0%
0.5%
1.0%
1.5%
2.0%
2.5%
0
500
1000
1500
2000
2500
3000
2000 2005 2010
# of foreign workers % total workforce (sec. axis)

29
on innovation from research and development. Thus, even some of the more capital-intense sub-sectors still rely on large amounts of labor (Phillips and Henderson, 2009). Figure 21. Total Workers and Share of the Manufacturing Workforce, by
Sub-Sector, 2010
Source: Authors’ calculations with Department of Statistics, Economic Census
Foreign workers in the manufacturing sector tend to specialize in low-skill occupations while local workers in the sector tend to specialize in more skill-intensive tasks. As shown in the previous section of this chapter, foreigners have significantly lower levels of education than Malaysians; as a result the foreigners concentrate in low-skill industries where they can specialize in manual (likely routine) tasks and avoid competing with more skilled Malaysian workers. Some examples of sub-sectors relying on low-skill foreign labor are wood production, and chemical and rubber manufacturing. Recent studies show that there is a certain segregation of Malaysians and foreigners within establishments. Even when foreigners and Malaysians work in the same firm and sub-sector, their occupations differ because of skill differences; therefore it is not correct to assume perfect substitutability of labor between Malaysians and immigrants. For instance, foreigners in the economy specialize as roofers, drivers, machine operators, manual farm laborers, food preparers, and caretakers for children and the elderly. On the other hand, Malaysian workers in the same establishments work in occupations that require the use of communication and interaction skills more intensely, for instance, as supervisors, farm coordinators or clerks (Peri, 2012).
0%
10%
20%
30%
40%
50%
60%
0
30000
60000
90000
120000
150000
180000
Number of foreign workers % of total labor force

30
However, not all foreigners in manufacturing work in low technology sub-sectors and in low value-added occupations; many work in managerial roles. At the establishment level, most foreigners work in labor-intensive sub-sectors where mechanization is limited and where the skill levels required do not exceed secondary education. The occupations of foreigners in manufacturing are typically within the general worker category. However, many foreigners employed in manufacturing establishments and engaged in high-skill requiring activities are likely to work in managerial roles rather than in any other occupational categories. In other words, these foreigners are likely to be classified as foreign talent rather than foreign workers. Over the years, the number of foreigners working in managerial roles in the manufacturing sector has increased. In 2010 there were over half a million foreign managers in manufacturing establishments. Amongst all foreign workers in high-skill manufacturing establishments (where more than 25 percent of the workforce has a post-secondary education), about 18 percent work as managers—the equivalent of 10 percent of all managers in these firms (Table 1). Table 1. Distribution of Workers in Management, Manufacturing Sector
2000
Type of establishment
Malaysians Non-Malaysians
Total number
Avg. % of managers
Total number
Avg. % of managers
High-skill intensity
162,262 16.5% 10,704 41.1%
Low-skill intensity 1,192,902 5.2% 208,929 11.9%
2005
Type of establishment
Malaysians Non-Malaysians
Total number
Avg. % of managers
Total number
Avg. % of managers
High-skill intensity
196,042 20.2% 16,115 33.6%
Low-skill intensity 1,113,026 6.3% 349,980 7.6%
2010
Type of establishment
Malaysians Non-Malaysians
Total number
Avg. % of managers
Total number
Avg. % of managers
High-skill intensity
261,621 16.1% 30,554 17.9%
Low-skill intensity 1,036,455 6.7% 483,730 3.7% Source: Authors’ calculations with Department of Statistics, Economic Census

31
Unlike in manufacturing, in 2010, there were few foreign managerial staff in low-skill intensity plantations establishments (0.4 percent) and high-skill intensity establishments (2.1 percent). Of all foreign workers in plantations establishments using low technology and employing mostly low-skill workers, less than 2,000 workers held managerial posts. This number is very small compared to the almost 5,000 Malaysian workers holding managerial occupations in the sector (Table 2), especially when taking into account the fact that almost 70 percent of the labor force in the sector is foreign born.
Table 2. Distribution of Workers in Management, Plantations Sector
2005
Type of establishment
Malaysians Non-Malaysians
Total number
Avg. % of manager
Total number
Avg. % of manager
High skill intensity
1,470 52.6% 548 14.4percent
Low skill intensity
72,037 22.7% 141,950 0.6%
2010
Type of establishment
Malaysians Non-Malaysians
Total number
Avg. % of manager
Total number
Avg. % of manager
High skill intensity
4,980 28.8% 1,843 2.6%
Low skill intensity
94,009 18.1% 218,364 0.3%
Source: Authors’ calculations with Department of Statistics, Economic Census
Most foreign workers in the construction sector are concentrated in the building construction sub-sector. Foreigners represented 50 percent of the workforce in that sub-sector in 2007. Immigrants also occupied significant portion of the building installation sub-sector, whereas there were fewer foreign workers in the site preparation, building completion and renting sub-sectors (Figure 22). In the building construction sub-sector, the process consists of building or assembling infrastructure. Projects are typically large in scale and require multiple levels of skills.

32
Figure 22. Total Workers and Share of the Construction Workforce, by Sub-Sector, 2007
Source: Authors’ calculations with Department of Statistics, Economic Census
In 2007, the share of all foreign workers that held managerial positions was around six percent. According to the Skills Development Division of the Ministry of Human Resources, there are three categories of workers. The first group is unskilled and semi-skilled general site labor with little or no construction qualifications, the second group is the skilled on-site managers with extensive knowledge of their craft and profession, and the third group is composed of technical and managerial workers that have high levels of qualifications—such as graduate university degrees and the training to manage the construction process. Most foreign workers in the sub-sector have low-to-semi skills and acquire job experience once they enter the sector (MOHR, 2009). About 1022 foreigners were managers in construction establishments employing mostly workers with low levels of skills, and about 515 were managers in establishments employing mostly workers with secondary school levels or higher (Table 3). A quarter of all Malaysian workers employed in high-skill intensity establishments, such as engineering and surveying firms, had managerial occupations.
7705
203216
45256
9059 179
0%
10%
20%
30%
40%
50%
60%
0
50000
100000
150000
200000
250000
SitePreparation
Building ofcomplete
constructions
Buildinginstallation
Buildingcompletion
Renting ofconstruction
# of foreign workers % total workforce (sec. axis)

33
Table 3. Distribution of Workers in Management, Construction Sector
2000
Type of establishment
Malaysians Non-Malaysians
Total number
Avg. % of managers
Total number
Avg. % of managers
High-skill intensity 43,175 12.8% 14,383 4.1%
Low-skill intensity 303,642 9.2% 117,821 1.7%
2002
Type of establishment
Malaysians Non-Malaysians
Total number
Avg. % of managers
Total number
Avg. % of managers
High-skill intensity 67,891 14.8% 28,294 2.4%
Low-skill intensity 254,586 9.6% 102,944 1.4%
2004
Type of establishment
Malaysians Non-Malaysians
Total number
Avg. % of managers
Total number
Avg. % of managers
High-skill intensity 89,409 16.6% 65,250 2.0%
Low-skill intensity 206,273 10.7% 88,669 1.7%
2007
Type of establishment
Malaysians Non-Malaysians
Total number
Avg. % of managers
Total number
Avg. % of managers
High-skill intensity 20,962 24.7% 9,727 5.3%
Low-skill intensity 308,107 13.9% 255,688 0.4%
Source: Authors’ calculations with Department of Statistics, Economic Census
In 2010, a quarter of all foreign-born workers in establishments employing mostly higher-skill workers in the accommodations service sub-sector were managers. Many foreign hotel chains bring in their own foreign managers from abroad to ensure homogeneity in the quality of services offered across countries; these are likely to be the largest group of skilled workers in the sector. In less skilled establishments, the percentage is lower (about 10.5 percent). According to a document by the Skills Development Unit of the Ministry of Human Resources (MOHR, 2008), there are 13 job titles in this sub-sector and they differ by types of accommodations. For instance, the hotel and resort accommodations operate at a larger scale than motels or homestay type of accommodations. As a result, the skill levels required to work in the sub-sector vary between accommodation types and, within each accommodation type, from housekeeping staff with entry-level skills to management with higher levels of skills. From the information shown

34
in Table 4 it is clear that Malaysians still hold the largest number of managerial posts in this sub-sector.
Table 4. Distribution of Workers in Management, Accommodation Sector
Source: Authors’ calculations with Department of Statistics, Economic Census
Most foreigners working in ICT-services are concentrated in the information and computer services sub-sub-sector. The ICT sector (manufacturing and services) is one of the national key economic sectors promoted by the Malaysian government as part of its growth strategy. Strong emphasis on the sub-sector has led to recent changes by the Government in its investment and immigration rules to attract foreign IT firms to invest in Malaysia and foreign IT experts to work in the sub-sector. As a result, most foreign workers in ICT services sub-sector are typically highly skilled and viewed as knowledge workers. Incentive immigration programs by the Government for these workers have led to an increase in their presence in the sector, especially in information and computer services, where they represent almost three percent of the workforce in the sub-sub-sector; given their higher skill level they are likely classified as foreign talent rather than foreign or foreign workers. On the other hand, there are only few foreign nationals, less than one percent, in publishing, media and communication services (Figure 23).
2005
Type of
establishment
Malaysians Non-Malaysians
Total number Avg. % of manager Total number Avg. % of manager
Low skill intensity 67,779 7.5% 1,593 20.9%
High skill intensity 29,299 15.7% 422 42.7%
2010
Type of
establishment
Malaysians Non-Malaysians
Total number Avg. % of manager Total number Avg. % of manager
Low skill intensity 72,952 8.3% 3,006 10.5%
High skill intensity 33,394 16.1% 1,183 24.0%

35
Figure 23. Foreign Workers and Percentage of Foreigners in ICT Services, by Sub-Sector, 2010
Source: Authors’ calculations with Department of Statistics, Economic Census
Table 5. Distribution of Workers in Management, ICT-Services Sector
Source: Authors’ calculations with Department of Statistics, Economic Census
Among all non-Malaysian workers employed in ICT-services sub-sector, more than half work in managerial posts. However, overall, there are only a few foreigners in the sector. The national ICT emphasis has the objective of turning the country into an ICT service hub. Consequently, there has been much emphasis on promoting investments in ICT as well as emphasizing training and skill formation in local universities. As the sector continues to evolve, firms need to remain competitive by nurturing local
4671
44458
74578
7420
0%
1%
2%
3%
0
10000
20000
30000
40000
50000
60000
70000
80000
Publishing Post and telecom Info and computer Media &communication
# of foreign workers % total workforce (sec. axis)
2000
2005
2010
22,911 57.8% 117 56.0%
Type of
establishment
High skill intensity
Low skill intensity
Type of
establishment
High skill intensity
Low skill intensity
53.9%
Low skill intensity 315 33.6% 0 0.0%
1,373 25.9% 23 45.7%
44.4% 1,253 63.1%
105,698 46.5% 2,401
High skill intensity 46,829 44.2% 501 67.9%
70,647
Total number Avg. % of manager
Total number Avg. % of manager Total number Avg. % of manager
Total number Avg. % of manager Total number Avg. % of manager
Total number Avg. % of manager
Type of
establishment
Malaysians Non-Malaysians
Malaysians Non-Malaysians
Malaysians Non-Malaysians
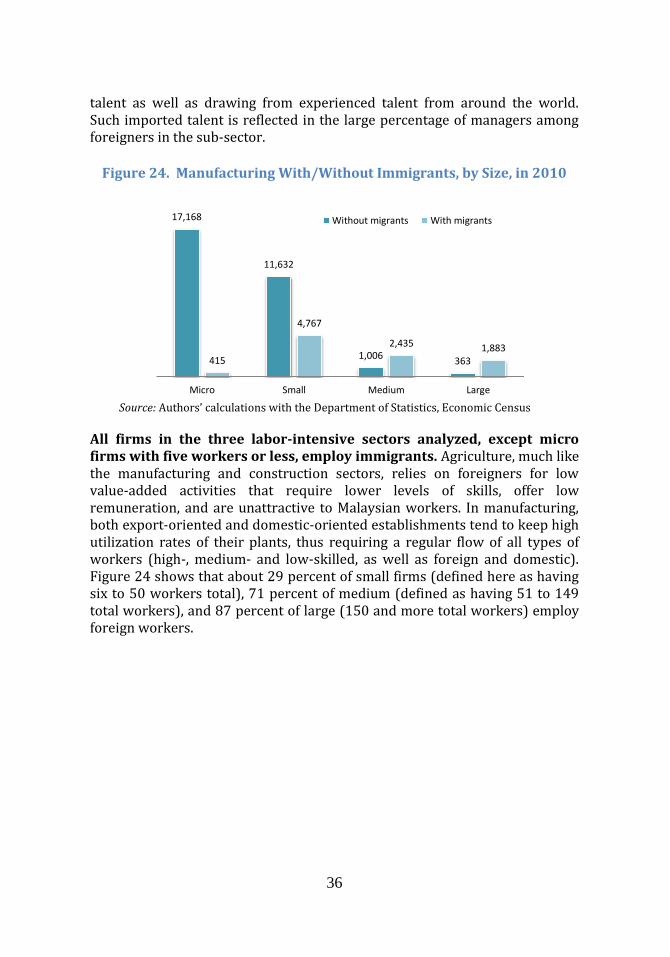
36
talent as well as drawing from experienced talent from around the world. Such imported talent is reflected in the large percentage of managers among foreigners in the sub-sector.
Figure 24. Manufacturing With/Without Immigrants, by Size, in 2010
Source: Authors’ calculations with the Department of Statistics, Economic Census
All firms in the three labor-intensive sectors analyzed, except micro firms with five workers or less, employ immigrants. Agriculture, much like the manufacturing and construction sectors, relies on foreigners for low value-added activities that require lower levels of skills, offer low remuneration, and are unattractive to Malaysian workers. In manufacturing, both export-oriented and domestic-oriented establishments tend to keep high utilization rates of their plants, thus requiring a regular flow of all types of workers (high-, medium- and low-skilled, as well as foreign and domestic). Figure 24 shows that about 29 percent of small firms (defined here as having six to 50 workers total), 71 percent of medium (defined as having 51 to 149 total workers), and 87 percent of large (150 and more total workers) employ foreign workers.
17,168
11,632
1,006 363 415
4,767
2,435 1,883
Micro Small Medium Large
Without migrants With migrants

37
Figure 25. Agriculture With/Without Immigrants, by Size, in 2010
Source: Authors’ calculations with the Department of Statistics, Economic Census
Medium- and large-size establishments in plantations, construction, ICT, and accommodation services rely heavily on foreign labor. Moreover, in plantations and construction, the widespread presence of foreign workers is also apparent in small firms. This indicates that foreign labor is used in all establishments except in family farms, family-run businesses and micro-size establishments (Figure 25 and Figure 26).
Figure 26. Construction With/Without Immigrants, by Size, in 2007
Source: Authors’ calculations with the Department of Statistics, Economic Census
1,084
690
56 9
230
1,488
667 668
Micro Small Medium Large
Without migrants With migrants
129
1,924
302 106 12
1,440
910 717
Micro Small Medium Large
Without migrants With migrants
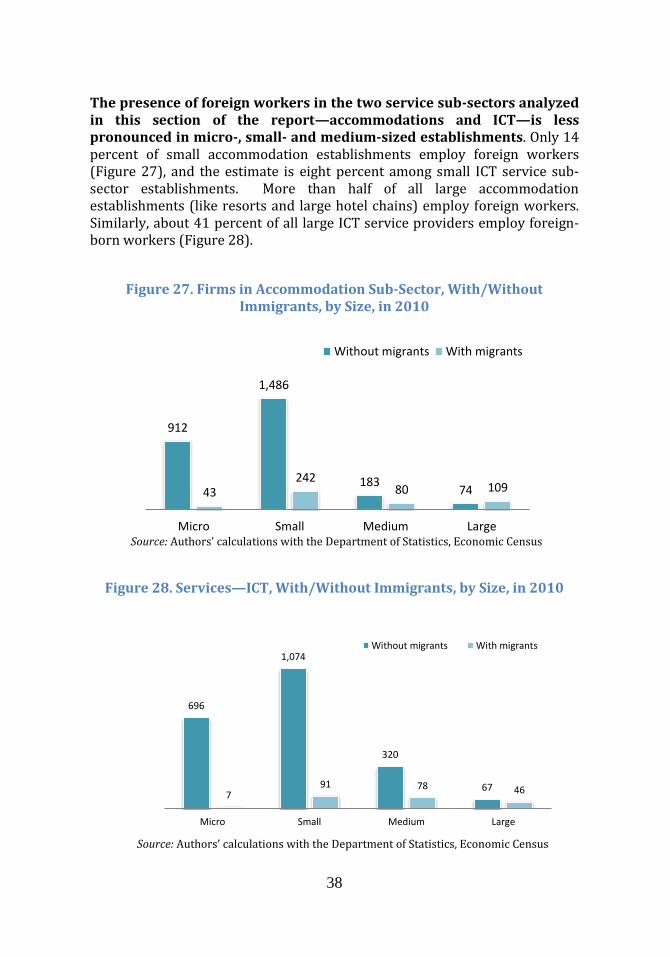
38
The presence of foreign workers in the two service sub-sectors analyzed in this section of the report—accommodations and ICT—is less pronounced in micro-, small- and medium-sized establishments. Only 14 percent of small accommodation establishments employ foreign workers (Figure 27), and the estimate is eight percent among small ICT service sub-sector establishments. More than half of all large accommodation establishments (like resorts and large hotel chains) employ foreign workers. Similarly, about 41 percent of all large ICT service providers employ foreign-born workers (Figure 28).
Figure 27. Firms in Accommodation Sub-Sector, With/Without
Immigrants, by Size, in 2010
Source: Authors’ calculations with the Department of Statistics, Economic Census
Figure 28. Services—ICT, With/Without Immigrants, by Size, in 2010
Source: Authors’ calculations with the Department of Statistics, Economic Census
912
1,486
183 74 43
242 80 109
Micro Small Medium Large
Without migrants With migrants
696
1,074
320
67 7
91 78 46
Micro Small Medium Large
Without migrants With migrants
39
Chapter 2: Economic and Social Impacts of Immigration in Malaysia
A Rigorous Measurement Exercise

40
2.1 Objective of the Chapter
High levels of immigration are found in rapidly growing industries and regions of the world where the local labor demand outstrips the local labor supply. This pattern creates a strong correlation between economic growth and high levels of employment and immigration, making it difficult to identify causation (of impact). In short, proper statistical analysis is necessary to determine whether foreigners contribute to superior economic performance or are simply attracted to growing areas and sectors. Moreover, the chapter seeks to also assess the social impacts of immigration in order to get a more balanced view of how immigrants impact Malaysia as a whole. These issues are of critical importance to the country because it experienced increasing immigration levels, robust economic growth rates, changing socio-economic characteristics, and rapidly increasing education levels over the last two decades. Immigration flows are jointly determined by the pull factors in destination countries as well as the push factors in origin countries. As mentioned in the previous chapter, rapid growth in certain sectors and regions that leads to excess labor demand and higher wages is among the main pull factors in Malaysia. In other words, economic success leads to higher demand for migrant workers. On the other hand, rapid population growth, excess labor supply, low economic growth, and dim future prospects are the key push factors in origin or sending countries like Indonesia, the Philippines and Bangladesh. The goal in this chapter is to identify the proper causal links between immigration levels and various labor market outcomes, economic productivity, and a key socio-economic dimension (namely crime). At the household level, the analysis focuses on various labor market outcomes, such as employment levels and wages, since these are the variables that are directly affected by immigration. At the firm level, the analysis focuses on estimating the effect of immigration on total factor productivity. At the community level, the analysis focuses on estimating the effect of immigration on various types of criminal activities. More general economic outcomes, such as economic growth or poverty reduction, are influenced by many other forces which make direct inference much more problematic. Since most of the debate on the effects of migration centers on labor market outcomes for Malaysians and on firms’ productivity, these effects are also the most policy relevant and, hence, the focus of this chapter. Social outcomes are measured through the incidence of criminal activity in the country. This social dimension is very relevant to Malaysia not only because of the costs crime imposes to the economy but also because crime rates have been increasing over time, in

41
parallel to immigration rates, and anecdotal evidence in the country points to the increasing presence of immigrants as primary culprits. As mentioned previously in detail, the analysis performed for this report uses the Malaysian Labor Force Surveys (LFS) for the last twenty years, the Economic Censuses during the last decade, and administrative data from the Royal Malaysia Police. The Economic Censuses can be used to analyze the impact of immigration at the firm level; they provide a different perspective relative to the analysis based on LFS. Both data sources were discussed in the previous section. The establishment data enable a more micro perspective on firm level productivity effects while the LFS allow for a more macro focus on general equilibrium effects. Since both data sources tend to be quite diverse, this dual approach is quite effective in highlighting the different mechanisms through which immigration impacts the destination country. For the measurement of crime rates, the report relies on primary and secondary data obtained from the Royal Malaysia Police and the Department of Statistics of Malaysia.
2.2 Measurement Approach—Workers (Technical)
Proper econometric analysis needs to separate the pull and push factors to identify the effects of immigration on labor market outcomes in destination countries. In other words, it is crucial to separate correlation from causation. In simple terms, the analysis relies on the use of standard econometric techniques such as regression analysis and instrumental variables in order to isolate the effect of immigration from other factors that could also affect the economic outcomes of interest, such as wages, employment and productivity. This section of the chapter explains the exact estimation process used for analyzing the impact on workers. The worker estimation regresses the relevant economic variable, (which will be denoted as yijt for simplicity) on the immigration level (denoted as mijt) as well as a range of additional explanatory variables (denoted as xijt). In this context, i denotes the economic sector, j denotes the state in Malaysia and t denotes the year. The labor market variables that are of interest are: employment, part-time employment, unemployment, labor force participation, and wages. The range of explanatory variables would normally include various years, and sector and state specific economic and social indicators. However, the richness of the data permits the use of various fixed effects to control for all of these additional factors, including other potential variables for which there are no data. This method allows us to focus on the impact of migration (in sector i in state j in year t) on

42
the labor market variables listed earlier. The simplest regression equation can be written as:
yijt = mijt + xijt + ijt
where is the main coefficient of interest and is the error term.
The econometric specification above has some drawbacks because it cannot properly isolate how the presence of foreign workers influences labor market outcomes, as opposed to how labor market conditions affect migration decisions of foreign workers. The proper method to address issues of causality (endogeneity) is to perform an instrumental variables regression where the migration variable (mijt) is first regressed on factors that are exogenous to unaccounted factors affecting the labor market
ijt). These factors are constructed from additional data sources and are based on the demographic data from the sending countries—mainly Indonesia, the Philippines and the other countries in South and East Asia—as well as time invariant sector- and region-specific labor demand levels in Malaysia. These variables, in essence, capture the push factors discussed earlier. This is done in stages. Once this first stage is completed, the regression above is performed on a modified migration variable (m*ijt) that is stripped off other effects and is thus able to capture the net effect of migration on labor market outcomes. The analysis for workers is performed on all sectors, regions and years for which data were available. This forms the benchmark against which the rest of the results are discussed. Table 1 in Annex 2 presents the main results for full time employment and Table 2 in Annex 2 presents those for part-time employment of Malaysians. The discussion focuses on the last columns that have the most complete set of fixed effects.7
2.3 Economic Impact Analysis Results—Workers
2.3.1 Overall Effects on Workers
The main result indicates that 836 new full-time jobs and 169 part-time jobs are created for Malaysian workers for every 1,000 new foreigners that enter a given sector in a given state. This can be a rather surprising result since most people have the perception that foreigners replace
7 The complete tables are at the end of the chapter and only the main results are discussed in the text.

43
Malaysian workers and hence lead to job losses rather than job creation for Malaysians. However, foreigners also generate jobs for Malaysians by reducing the costs of production, making Malaysian firms cheaper and more competitive in the global market, and allowing them to expand and consequently increase their demand for Malaysian workers as well. Thus, results show that the ultimate outcome for Malaysians is job creation (Figure 29).
Figure 29. Employment Effects of Hiring 1,000 Immigrants
Source: Authors’ calculations with the Department of Statistics, Labor Force Survey One percent increase in the number of foreign workers increases full-time employment of Malaysians by one-tenth of a percent, and part-time employment for Malaysians by one-third of a percent. Another metric to assess the linkage between immigration and labor market outcomes for Malaysians is the elasticity of that outcome with respect to number of foreign workers. The relevant elasticities can be easily calculated from the results. In the case of total employment, the elasticity is 0.09, which implies that a one percent increase in immigration level increases Malaysian employment by 0.09 percent. The same elasticity for part-time employment is 0.28, which indicates part-time employment is more sensitive to immigration level at the current levels. Foreign labor levels do not influence whether Malaysian workers enter the labor market or not. The Malaysian unemployment and the labor force participation rates are the other two important labor market variables that will be impacted by immigration of foreign workers. Other studies show that female labor force participation is quite elastic in Malaysia; it is worth exploring whether this trend is partly driven by the presence of foreign labor. Since unemployment and labor force participation are not sector-specific, the
0
250
500
750
1000
Total Employment Part-Time Employment
44
analysis is performed at the state level. Results in Table 3 in Annex 2 indicate that Malaysian labor force participation levels are not statistically sensitive to immigration. In other words, Malaysian workers do not make their decision to enter the labor force based on what the immigration levels are. On the other hand, unemployment is negatively related to immigration as expected. This effect is statistically significant but relatively small in terms of size. However, this should not be interpreted as a worrying signal given that the decline in the unemployment rate is due to the increase in the number of employed workers in the labor force, rather than the decline of the number of unemployed workers8.
2.3.2 Effects on Workers by Main Economic Sectors While the overall average effects of entry of foreign workers are positive on the employment levels of Malaysians, the critical question is how the effects vary across different sectors of the economy. For this purpose, the economy is divided into three main sectors: (i) agriculture and mining, (ii) manufacturing, and (iii) services. The methodology presented in the previous section and overall analytical approach is applied here. However, the analysis is performed separately for each sector of the economy by focusing on the total change in employment of Malaysians caused by immigration. Immigration leads to increased employment of Malaysians in the agriculture and services economic sectors. The results in Figure 30 (and Table 4 in Annex 2) suggest that on average 671 jobs are created in agriculture and mining, about 193 jobs in manufacturing, and 741 jobs in the services sector, if an additional 1,000 foreigners enter each of these sectors. It should be noted that the effect in manufacturing is not statistically significant while it is so in the other sectors. In other words, the employment of foreigners leads to increases in Malaysian employment only in agriculture and mining, and services, with statistical certainty. The relevant elasticities highlight a slightly different pattern in terms of the effect of immigration. The resulting elasticities are 0.15 for agriculture and mining, 0.02 for manufacturing and 0.05 for services. The difference is due to the fact that services employ significantly more workers than agriculture and mining. As a result, the percentage effect of immigration on employment in services is much lower even though the absolute size of the effect is larger (see also Table 5 in Annex 2).
8 Unemployment Rate=Number of Unemployed/(Number of Employed+ Number of
Unemployed)

45
Figure 30. Effect of Migration by Economic Sector
Source: Authors’ calculations with the Department of Statistics, Labor Force Survey
2.3.3 Effects on Workers by Demographic Characteristics 2.3.3.1 Effect by Age Group Immigration does not affect young workers (or the secondary and post-secondary age group) and has a positive effect on other age groups. Another critical issue is how immigration affects workers who are at different stages of their careers. Since workers’ wages, employment prospects, skill premiums, and other important variables change significantly in the workers’ lifecycles, it is important to see how the effects differ for workers in different age groups. As seen in Figure 31 (and Table 6 in Annex 2), an additional 1,000 foreign workers in an average sector have no affect on 15 to 19 year-olds, but 207 new jobs are created for 20 to 29 year olds, 303 new jobs for 30 to 44 year olds, and 340 new jobs for those over 45 years of age.
The differences are more pronounced when the size of the age groups are taken into account, especially since the younger groups are larger in size. This is best seen through elasticity calculations which are 0.07 for the 20 to 29 age group, 0.08 for the 30 to 44 age group, and 0.15 for the 45+ age group. Thus, a one percent increase in foreign employment in an average sector leads to 0.07 percent increase in the employment of the 20 to 29 group, and a 0.15 increase in the employment of the 45+ year olds.
0
100
200
300
400
500
600
700
800
Agriculture &Mining
Manufacturing Services

46
Figure 31. Age-Group Effects of Migration
Source: Authors’ calculations with the Department of Statistics, Labor Force Survey
2.3.3.2 Effect by Gender
Despite the common practice of hiring foreign workers across the economy, including as domestic workers, the impact on women’s employment is surprisingly under-investigated, and as a result often undervalued. Female labor force participation is below expected levels in Malaysia given the degree of development and human capital composition of the labor force. The effect of foreign labor in the economy is usually measured in terms of complementarity or substitutability of Malaysian workers in the production sector (Borjas, 2003; Ottaviano and Peri, 2006) and labor opportunities for Malaysians (D’Amuri and Pinotti, 2010). Few studies focus their investigation on the effect on women’s employment even though many foreigners work as domestic servants (Barone and Mocceti, 2010). To examine whether and how the inflow of foreigners affects Malaysian women’s labor participation, we use micro-level data drawn from LFS to estimate the impact of the presence of foreigners (in household work as well as other sectors in the economy) on women’s full-time work, part-time work, and unemployment. Immigration’s effect on men and women seems to vary significantly, especially in terms of total employment. One concern is that immigration discourages women from entering the labor force. In order to asses the extent of the effect of immigration, the same analysis is performed on the
-100
0
100
200
300
400
15-19 20-29 30-44 45+

47
employment levels of men and women separately as well as on gender-specific part-time employment levels, unemployment levels and labor force participation levels (Table 7 in Annex 2). Using the same comparisons, an additional 1,000 migrants in a given economic sector increases overall male employment by 604 workers but the effect on women is only an increase of 205 people. The increase in part-time employment is much more even—91 additional men versus 80 women employed. However, when we compare the elasticities, the gap narrows significantly. The elasticity of total male employment with respect to immigration is 0.10 and female employment is 0.07, again mainly due to the fact that female employment levels are significantly lower on average, resulting in a larger percentage gain (Figure 32). The differences between genders indicate more complicated forces at play which require further and more detailed analysis.
Figure 32. Gender-Specific Effects of Immigration
Source: Authors’ calculations with the Department of Statistics, Labor Force Survey
Impacts on women’s work vary broadly by economic sector, some more favorable than others. For instance, the impact is very positive and significant for women working in the services sector (especially in finance, business and real estate, insurance, health, and other high value-added services). On the other hand, the impact is negative for women working in the manufacturing sector. Although the analysis does not indicate if the impacts are through substitutability of women in household activities or complementarities in the productive sector, it is clear that foreign labor has a positive effect on women’s employment in Malaysia. A caveat is that even though this channel of support to women presents another policy area worth considering, positive effects may be attenuated by other costs not considered. On aggregate, foreign labor reduces unemployment for men and women,
0
100
200
300
400
500
600
700
Male Female Male Female
Impact on All Employment Impact on Part-Time Employment

48
though it is statistically significant only for men. This indicates that even though some sub-groups of workers may experience increased unemployment because they may be competing or not benefiting from the presence of foreign workers, overall, men experience a small reduction in unemployment. The impact on women is also in the same direction but not statistically measurable (Table 8 in Annex 2). 2.3.3.3 Effect by Education Level Malaysia’s rapid growth in the number of low-skill foreign workers throughout the economy has been accompanied by rapid increases in the number of skilled Malaysian workers. It is important to consider the impact of immigration on Malaysian workers with different education levels. One of the key issues in development is whether the human capital accumulation of the labor force helps to improve people’s welfare and economic growth and whether increased immigration helps or hurts Malaysian workers. Malaysia achieved an impressive feat in improving the educational level of its population. One can argue that parallel increases in the amount of foreigners in the Malaysian labor force and the education levels of the Malaysian population have been taking place over the last two decades. The analysis in this section measures the effect of foreign labor on Malaysian workers of distinct educational levels. Results show that immigration has a positive effect for Malaysians with middle levels of education while the lowest education groups see the opposite (negative) effect. While low-educated Malaysians are hurt and middle-educated Malaysians see clear benefits, highly educated workers are not significantly impacted by the presence of immigrants. Figure 33 presents these results clearly. Every 100 new foreign workers lead to a loss of 114 jobs for workers with no formal education or just primary education. This is to be expected since these are the workers that are directly competing with the migrant workers who also have very low levels of education. Workers with lower secondary (PMR), Upper Secondary (SPM) or post-Secondary (STPM) education levels benefit significantly from immigration. For example, for every 100 foreign workers in an average sector, there are 320 new jobs for workers with PMR, 182 new jobs for workers with SPM, and 366 new jobs for workers with STPM. Finally, highly educated workers seem to be marginally benefited. There are only 35 new jobs for workers with Certificates/Diplomas and 20 jobs for workers with university degrees.

49
Figure 33. Education-Specific Effects of Immigration
Source: Authors’ calculations with the Department of Statistics, Labor Force Survey
The elasticities of employment for workers with different education levels present the same pattern from a different perspective. The elasticity of employment is significant (-0.22) for the lowest education group, those with either or no formal employment or just primary education. On the other hand, the elasticity is between 0.10 and 0.14 for the next four groups, with a peak at the upper secondary level. The elasticity for a university graduate is marginal at only 0.03 (Figure 34 and Table 9 in Annex 2).
Figure 34. Education Elasticity Effects of Immigration
Source: Authors’ calculations with the Department of Statistics, Labor Force Survey
-200 -100 0 100 200 300 400
No formal/Primary
Lower Secondary (PMR)
Upper Secondary (SPM)
Post Secondary (STPM)
Certificate/ Diploma
Degree and above
-0.25
-0.2
-0.15
-0.1
-0.05
0
0.05
0.1
0.15
0.2
50
2.3.4 Effect on Worker Wages
A straightforward way to estimate relative wage effects is to test whether changes in employment cause changes in wages. An open question is whether immigration results in changes in relative wages across industries. The previous section’s results show that immigration to a specific sector of the economy increases the demand for Malaysian workers. This increased demand for Malaysian labor results in changes in the sectoral composition of the overall Malaysian labor force. If workers are mobile and can easily change the industry in which they work, then wages will rapidly equalize across sectors. If, in contrast, there are substantial barriers to mobility, then wages are likely to diverge as immigration results in the expansion of some sectors but not others. Estimates show that changes in employment caused by increases in immigration to a specific region and industry do not lead to changes in the wages of Malaysian workers. Recent Labor Force Surveys (2007 through to 2010) collected wage and income data from survey respondents that limit the scope of the analysis. Using these data, the estimations show that changes in employment in an industry and region, caused by immigration, did not result in significant changes in wages. The results suggest that a sufficient number of Malaysian workers are highly mobile across industries (and possibly also regions) so as to allow wages to rapidly equalize. Any imbalances caused by immigration show up in changes in the employment patterns of Malaysians, not in different wages across sectors. The increases in demand for Malaysian workers due to immigration do not result in changes in relative wages across industries. However, they do increase the overall wage level in Malaysia. Positive effects are most apparent when foreigners work in low-skilled services and agriculture. Data show that an additional 10 percent immigration to a given sector and region increases average wages of Malaysians by roughly 0.15 percent. These modest aggregate wage gains are sensitive to where precisely foreigners decide to work or are allowed to work, with the biggest gains for Malaysians arising from foreign employment in agriculture and low-skilled services. Personal characteristics—such as age, gender, and education—play a role in how much Malaysians can benefit from immigration in terms of higher wages. These results parallel the results from the previous section on increased employment levels by gender, education and age groups. While the evidence suggests that many workers are highly mobile across industries, workers cannot change their gender, their age and (easily change their) education. Thus, not all workers will be equally capable of taking advantage of
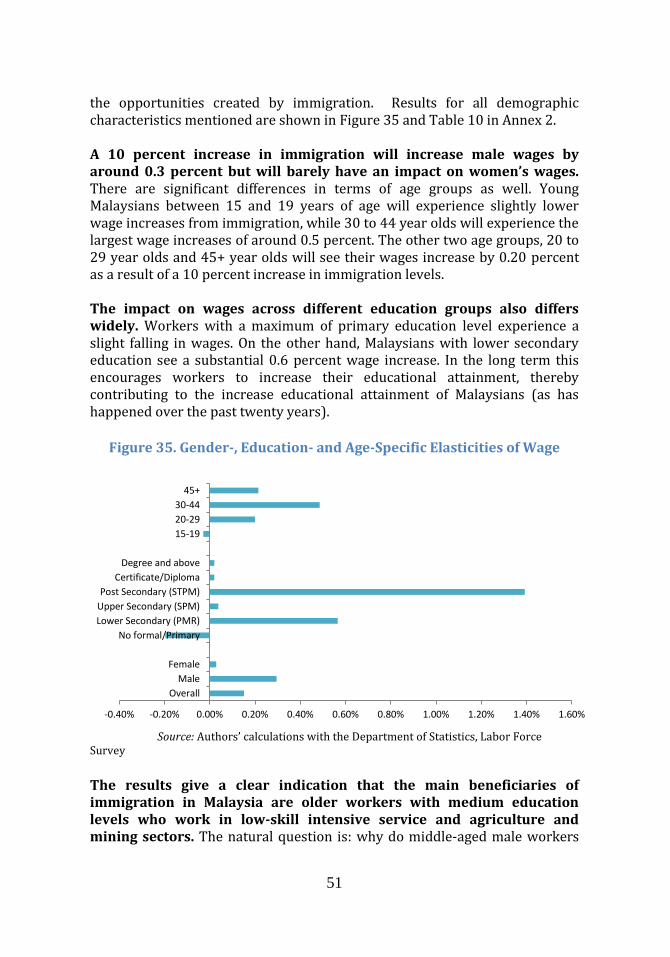
51
the opportunities created by immigration. Results for all demographic characteristics mentioned are shown in Figure 35 and Table 10 in Annex 2. A 10 percent increase in immigration will increase male wages by around 0.3 percent but will barely have an impact on women’s wages. There are significant differences in terms of age groups as well. Young Malaysians between 15 and 19 years of age will experience slightly lower wage increases from immigration, while 30 to 44 year olds will experience the largest wage increases of around 0.5 percent. The other two age groups, 20 to 29 year olds and 45+ year olds will see their wages increase by 0.20 percent as a result of a 10 percent increase in immigration levels. The impact on wages across different education groups also differs widely. Workers with a maximum of primary education level experience a slight falling in wages. On the other hand, Malaysians with lower secondary education see a substantial 0.6 percent wage increase. In the long term this encourages workers to increase their educational attainment, thereby contributing to the increase educational attainment of Malaysians (as has happened over the past twenty years).
Figure 35. Gender-, Education- and Age-Specific Elasticities of Wage
Source: Authors’ calculations with the Department of Statistics, Labor Force
Survey
The results give a clear indication that the main beneficiaries of immigration in Malaysia are older workers with medium education levels who work in low-skill intensive service and agriculture and mining sectors. The natural question is: why do middle-aged male workers
-0.40% -0.20% 0.00% 0.20% 0.40% 0.60% 0.80% 1.00% 1.20% 1.40% 1.60%
Overall
Male
Female
No formal/Primary
Lower Secondary (PMR)
Upper Secondary (SPM)
Post Secondary (STPM)
Certificate/Diploma
Degree and above
15-19
20-29
30-44
45+

52
with middle levels of education benefit the most? Data show that these workers are generally immediate supervisors of foreign workers in low-skill sectors and their skills are the most complementary to those of the immigrants. Since foreigners mostly have minimal education and, in many cases, have language barriers, Malaysian workers with secondary school education work as their employers or supervisors. The availability of large numbers of low-skilled and relatively cheap foreign labor increases the returns to this specific group of workers. One can even argue that many sectors of the Malaysian economy are based on foreign workers supervised by secondary-school educated Malaysian workers and those sectors would probably not exist in the absence of this specific arrangement. University graduates are not affected by foreign labor since their tasks and/or occupations and sectors rarely overlap with those where foreigners work, thus limiting the possibility of complementarities. There are few foreign workers in skill-intensive manufacturing and service sectors and their economic interaction is more likely to occur through the product markets rather than the labor markets. On the other hand, the lowest-skilled Malaysian workers are significantly hurt by immigration. They are the main group to face competition from foreign labor, as they are highly substitutable. Fortunately, as the data show, their numbers have decreased rapidly in Malaysia as education levels have gone up. A similar pattern is found in Thailand, where skill levels of foreigners are similar to the levels of foreigners in Malaysia (Lathapipat, 2012).
The results shown in this section highlight that Malaysia presents a success story of immigration management. The impact of immigration on employment and wages depends on the level of complementarity and substitutability between foreigners and Malaysian workers (Borjas, 2003; Borjas et al., 2008; and Dustmann et al. 2008). Malaysia has been able to avoid the negative economic outcomes from having a large foreign workforce by importing unskilled foreign workers willing to do work that most Malaysians are overqualified to do. At the same time, Malaysia has continued to focus on increasing the education of local workers, which allows it to continue developing high-skill industries and fulfilling the country’s long term goals outlined in the 10th Malaysian Plan. Thus, one can argue, Malaysia is an example of a country that is able to keep growing by maximizing its gains from immigration while improving its human capital and economic outcomes.

53
2.4 Economic Impact of Immigration on Establishments
Growing economies in Southeast Asia seek to reduce their dependency on immigration as a strategy for improving firm productivity and achieving subsequent economic growth. Productivity growth is the most important determinant in the long-term prosperity of an economy; without productivity growth living standards of workers are unlikely to improve. In the past, Malaysia has relied on foreign labor as a strategy to grow its economy. However, like other developed countries in the region, Malaysia is now seeking to improve its productivity levels by reducing its dependency on low-skill labor, namely immigrants. There is little evidence from the region to show that limiting the number of foreign workers will yield the results Malaysia is seeking. Singapore created a committee in 2009 to identify new avenues to foster national economic growth. A key recommendation from the committee was that in order to improve economic prosperity in Singapore, firms had to shift away from their dependence on low-skilled foreign labor and move towards a productivity- and skill-driven growth. As a result, in 2010, foreign worker levies were increased and further increases were announced in 2011 for the years 2012 and 2013. The Malaysian Government adopted the Singaporean policies within its own context. This resulted in the announcement of the future implementation of a multi-tiered levy system in Malaysia to reduce reliance on foreign unskilled labor to enhance productivity in the country (10th Malaysian Plan, 2010).
2.4.1 Potential Effects on Establishments Regardless of the economic sector that foreigners work in, Malaysian firms face two interrelated and interdependent choices: which technologies should they adopt and what mix of workers should they employ? The critical questions are whether the availability of relatively cheap and unskilled foreign labor encourages firms to adopt less sophisticated and less advanced technologies, and whether this harms long-term productivity growth. These questions are important in a context where the economic growth strategy for the next decade is to foster industrial transformation away from labor-heavy industries and towards more technology and knowledge-based industries. These questions are also relevant because the Government has already announced (in the 10th Malaysian Plan) the future implementation of a multi-tiered levy system to reduce reliance on foreign unskilled labor.
54
It is often argued that immigration has benefits and drawbacks with respect to firm performance. Those in favor argue vehemently that foreigners catalyze efficiency across the economy. The argument is that having a more culturally diverse workforce increases innovation and creative thinking, and provides a broader perspective of the world, which can enhance information about global markets and firm productivity. Also, a broader set of skills provides employers more flexibility in their human resource allocation and technological investments (Glaeser et. al. 2000; Alesina and La Ferrara, 2005; Berliant and Fujita, 2008; cited in Parrotta et. al. 2011). Employers benefit from having a larger pool of workers to hire from and the ability to shed workers following business cycles. This enables them to be more efficient and profitable, thus leading to productivity increases in the economy. Indeed, this is supported by recent work by Peri and Sparber (2009) and Peri (2012) for firms in the US. The main drawbacks are that immigration can lead to productivity losses due to substandard human capital investments, limitations posed on worker interactions, and suboptimal investments in technology. The argument is that a big pool of largely unskilled workers allows employers to keep wages down, offer minimal training to existing workers, and have fewer incentives to improve working conditions to make jobs attractive to workers. Also, by mixing groups from different language backgrounds (and cultures), communication is likely to be impaired and social ties and trust between co-workers is lowered; in turn, this damages cooperation among workers (Becker, 1957; Lang, 1986; Lazear, 1998 and 1999, cited in Parrotta et. al. 2011). Others argue that reliance on cheap labor can trap an economy in low-skill low-wage equilibrium and lead to productivity losses in the long-term because firms forego investing in productivity enhancing technologies. But a key question remains: how does immigration impact firm productivity? The following sections tackle this question for four important sectors (and sub-sectors) in the economy—manufacturing, plantations, construction, and services (ICT and accommodations).
2.4.2 Measurement Approach—Establishments Proper econometric analysis can help overcome potential measurement problems derived from the fact that firms’ decisions on the mix of workers needed and technology to adopt are made jointly. As mentioned, the analysis in this section uses the Economic Census to measure impacts of immigration on productivity in four economic sectors (and various sub-sectors): manufacturing, agriculture and plantations, services9, and
9 Estimations for firms are done for the years 2005 and 2010. Unfortunately, the 2000 data file does not identify the state in which firms are located, thus, it is not utilized in the analysis.
55
construction10. In addition to the number of employees by education level and citizenship status of workers, the data include the economic sector, location (state) of the firms, their total sales, their raw material purchases, and their total fixed assets (which are used as a proxy for capital stock).
This section of the chapter explains the exact estimation process used for analyzing the impact on firms. The productivity analysis starts with the goal of calculating the Total Factor Productivity (TFP), which is essentially the residual term of the production function estimated in natural logs. The production function used is of the following form:
Y=AKαHβL. The value-added (gross output minus the inputs) used is Y, K is total fixed assets, H is the total number of high-skilled (STMP or above), and L is the total number of low-skilled (below STPM) workers. Since the regressions were performed in natural logs, the exponents present the elasticities. The first set of regressions were performed separately for 2005 and 2010 for each of the eight manufacturing sectors (food/beverage/tobacco, textiles, wood, paper/furniture, chemical/rubber, metal/machinery equipment, precision instruments/computers, and transport equipment), as well as for the full agriculture and construction sectors, and each of the two services sub-sectors (accommodations and ICT) for which data were available. The unit of analysis is a firm in a given five-digit sub-sector, and the estimation takes into account (controls) industry and state differences using dummy variables. Results show that all the factors of productions (explanatory variables) are significant explanatory variables for the log of value-added. On average, establishments employing foreign workers in ICT-services and accommodations have higher value-added per worker than establishments without them. When the data are un-weighted by the number of firms (noted as uw) establishments with foreign labor in manufacturing, ICT and accommodations have higher average value-added (VA) per worker. However, when the data are weighted by the number of establishments in each category (noted as w), only establishments in ICT and accommodation (just barely) have higher VA estimates. The same is not true in the two more labor-intensive sectors where immigrant labor is also most common—agriculture/plantations and construction (Figure 36). But there are differences in value-added per worker by the size of the establishments as well. This section presents the estimated value-added per worker by each sector and size-of-establishment before delving into the regression results.
10 Estimations for this sector are done using earlier surveys, 2000-2007.
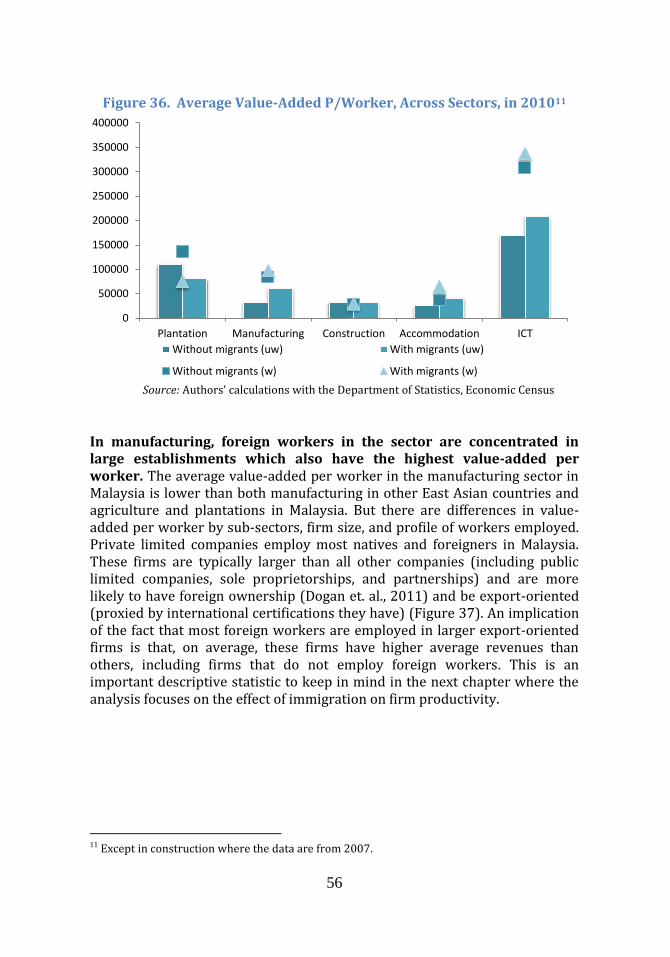
56
Figure 36. Average Value-Added P/Worker, Across Sectors, in 201011
Source: Authors’ calculations with the Department of Statistics, Economic Census
In manufacturing, foreign workers in the sector are concentrated in large establishments which also have the highest value-added per worker. The average value-added per worker in the manufacturing sector in Malaysia is lower than both manufacturing in other East Asian countries and agriculture and plantations in Malaysia. But there are differences in value-added per worker by sub-sectors, firm size, and profile of workers employed. Private limited companies employ most natives and foreigners in Malaysia. These firms are typically larger than all other companies (including public limited companies, sole proprietorships, and partnerships) and are more likely to have foreign ownership (Dogan et. al., 2011) and be export-oriented (proxied by international certifications they have) (Figure 37). An implication of the fact that most foreign workers are employed in larger export-oriented firms is that, on average, these firms have higher average revenues than others, including firms that do not employ foreign workers. This is an important descriptive statistic to keep in mind in the next chapter where the analysis focuses on the effect of immigration on firm productivity.
11 Except in construction where the data are from 2007.
0
50000
100000
150000
200000
250000
300000
350000
400000
Plantation Manufacturing Construction Accommodation ICT
Without migrants (uw) With migrants (uw)
Without migrants (w) With migrants (w)

57
Figure 37. Average Value-Added P/Worker, Manufacturing, by Workforce Composition and Firm Size, 2010
Source: Authors’ calculations with the Department of Statistics, Economic Census
Value-added per worker in the plantations sector is higher in establishments/firms without foreign workers. Interestingly, in all size firms except micro-size firms where few foreign workers are employed, the difference in value-added per worker is substantial (Figure 38). As in other countries, in Malaysia the share of agricultural employment is larger than the share of its contribution to GDP. This likely means that the sector is less productive than other sectors of the economy; having too many workers in a less productive sector can lead to productivity gaps (Vollrath, 2009). In Malaysia, this is an important issue given that the sector contributes seven percent of GDP and employs about 12 percent of all workers—a large share of these workers are foreign, with low levels of skills (unsuitable for most other sectors in the economy), and earn lower wages than other sectors. The reallocation of Malaysian workers to more productive sectors (McMillan and Rodrik, 2011) is partly due to the availability of immigrant labor. Those in favor of immigration often argue that foreign workers enable native Malaysians to work in non-agricultural sectors where their contributions can be more suited to their skills; this reallocation also leads to higher incomes. But even if the plantations sector still has some untapped potential, productivity levels are not as low as in construction or even some sub-sectors in manufacturing. A recent study by the Economic Planning Unit and the World Bank (2011) showed that productivity in the agricultural sector, especially in export oriented plantations in Malaysia, is lower than in Korea and OECD countries but not as low as in other countries in the region and compared to other sub-sectors in the Malaysian economy. This is likely due to
0
20000
40000
60000
80000
100000
120000
140000
Micro Small Medium Large
Without migrants With Migrants
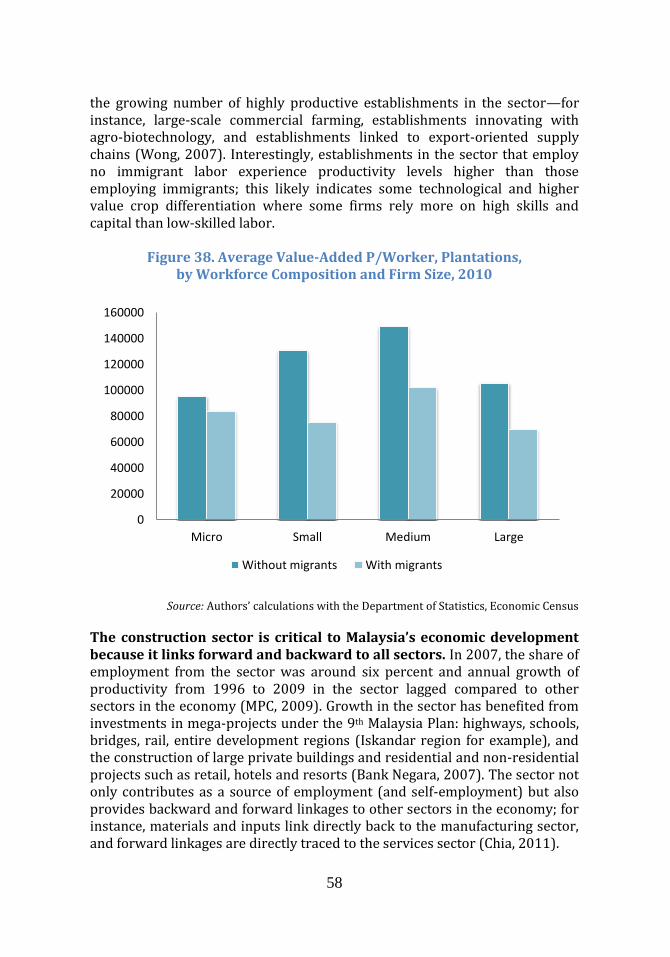
58
the growing number of highly productive establishments in the sector—for instance, large-scale commercial farming, establishments innovating with agro-biotechnology, and establishments linked to export-oriented supply chains (Wong, 2007). Interestingly, establishments in the sector that employ no immigrant labor experience productivity levels higher than those employing immigrants; this likely indicates some technological and higher value crop differentiation where some firms rely more on high skills and capital than low-skilled labor.
Figure 38. Average Value-Added P/Worker, Plantations, by Workforce Composition and Firm Size, 2010
Source: Authors’ calculations with the Department of Statistics, Economic Census
The construction sector is critical to Malaysia’s economic development because it links forward and backward to all sectors. In 2007, the share of employment from the sector was around six percent and annual growth of productivity from 1996 to 2009 in the sector lagged compared to other sectors in the economy (MPC, 2009). Growth in the sector has benefited from investments in mega-projects under the 9th Malaysia Plan: highways, schools, bridges, rail, entire development regions (Iskandar region for example), and the construction of large private buildings and residential and non-residential projects such as retail, hotels and resorts (Bank Negara, 2007). The sector not only contributes as a source of employment (and self-employment) but also provides backward and forward linkages to other sectors in the economy; for instance, materials and inputs link directly back to the manufacturing sector, and forward linkages are directly traced to the services sector (Chia, 2011).
0
20000
40000
60000
80000
100000
120000
140000
160000
Micro Small Medium Large
Without migrants With migrants
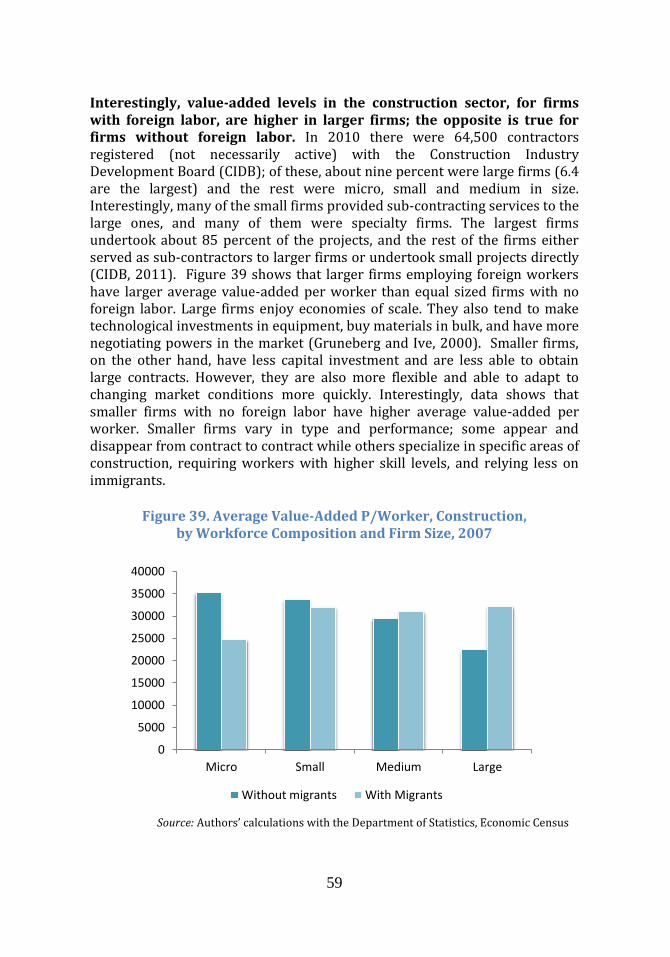
59
Interestingly, value-added levels in the construction sector, for firms with foreign labor, are higher in larger firms; the opposite is true for firms without foreign labor. In 2010 there were 64,500 contractors registered (not necessarily active) with the Construction Industry Development Board (CIDB); of these, about nine percent were large firms (6.4 are the largest) and the rest were micro, small and medium in size. Interestingly, many of the small firms provided sub-contracting services to the large ones, and many of them were specialty firms. The largest firms undertook about 85 percent of the projects, and the rest of the firms either served as sub-contractors to larger firms or undertook small projects directly (CIDB, 2011). Figure 39 shows that larger firms employing foreign workers have larger average value-added per worker than equal sized firms with no foreign labor. Large firms enjoy economies of scale. They also tend to make technological investments in equipment, buy materials in bulk, and have more negotiating powers in the market (Gruneberg and Ive, 2000). Smaller firms, on the other hand, have less capital investment and are less able to obtain large contracts. However, they are also more flexible and able to adapt to changing market conditions more quickly. Interestingly, data shows that smaller firms with no foreign labor have higher average value-added per worker. Smaller firms vary in type and performance; some appear and disappear from contract to contract while others specialize in specific areas of construction, requiring workers with higher skill levels, and relying less on immigrants.
Figure 39. Average Value-Added P/Worker, Construction,
by Workforce Composition and Firm Size, 2007
Source: Authors’ calculations with the Department of Statistics, Economic Census
0
5000
10000
15000
20000
25000
30000
35000
40000
Micro Small Medium Large
Without migrants With Migrants
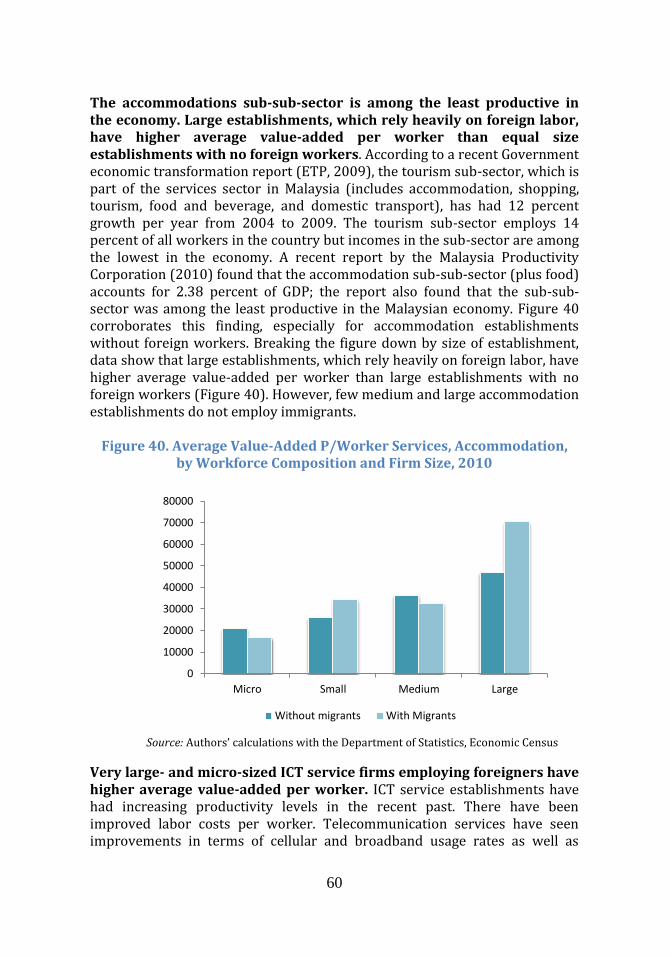
60
The accommodations sub-sub-sector is among the least productive in the economy. Large establishments, which rely heavily on foreign labor, have higher average value-added per worker than equal size establishments with no foreign workers. According to a recent Government economic transformation report (ETP, 2009), the tourism sub-sector, which is part of the services sector in Malaysia (includes accommodation, shopping, tourism, food and beverage, and domestic transport), has had 12 percent growth per year from 2004 to 2009. The tourism sub-sector employs 14 percent of all workers in the country but incomes in the sub-sector are among the lowest in the economy. A recent report by the Malaysia Productivity Corporation (2010) found that the accommodation sub-sub-sector (plus food) accounts for 2.38 percent of GDP; the report also found that the sub-sub-sector was among the least productive in the Malaysian economy. Figure 40 corroborates this finding, especially for accommodation establishments without foreign workers. Breaking the figure down by size of establishment, data show that large establishments, which rely heavily on foreign labor, have higher average value-added per worker than large establishments with no foreign workers (Figure 40). However, few medium and large accommodation establishments do not employ immigrants.
Figure 40. Average Value-Added P/Worker Services, Accommodation, by Workforce Composition and Firm Size, 2010
Source: Authors’ calculations with the Department of Statistics, Economic Census
Very large- and micro-sized ICT service firms employing foreigners have higher average value-added per worker. ICT service establishments have had increasing productivity levels in the recent past. There have been improved labor costs per worker. Telecommunication services have seen improvements in terms of cellular and broadband usage rates as well as
0
10000
20000
30000
40000
50000
60000
70000
80000
Micro Small Medium Large
Without migrants With Migrants

61
improvements in the operating business environment (MPC, 2010). The sub-sub-sector has firms of all sizes, specializing in distinct service areas. All of the firms in this sub-sub sector, however, are characterized for relying on high levels of human intellectual capital, foreign or domestic. Micro boutique ICT service firms and large firms with foreign labor have higher average value-added per worker; this is true for publishing and information and computer services as well. Medium-size firms have the opposite relation (Figure 41).
Figure 41. Average Value-Added P/Worker, Services—ICT, by Workforce Composition and Firm Size, 2010
Source: Authors’ calculations with the Department of Statistics, Economic Census
2.4.3 Economic Impact Analysis Results—Establishments Previous (worker level) results indicate that immigration has overall positive benefits for the Malaysian labor markets. However, firm-level results show a more mixed picture, indicating that foreign labor does not always lead to increases in productivity. The previous section in this chapter measures the impact of immigration on Malaysian workers and finds that certain types of workers (such as older workers with medium levels of education) benefit more from immigration than the rest. Benefits such as higher wages and employment opportunities are a macroeconomic phenomenon that requires a certain level of mobility across regions and sectors as the full benefits of immigration are realized. This section of the chapter shows that immigration affects long-term growth and development, as measured by total factor productivity (TFP), distinctly across sub-sectors12.
12 This measurement exercise needs to be performed for other service sectors that employ large numbers of foreign workers, but data were not available. For instance, the food and restaurant sector commonly employs foreigners but there were no proper data to include in this analysis.
0
100000
200000
300000
400000
500000
600000
Micro Small Medium Large
Without migrants With Migrants
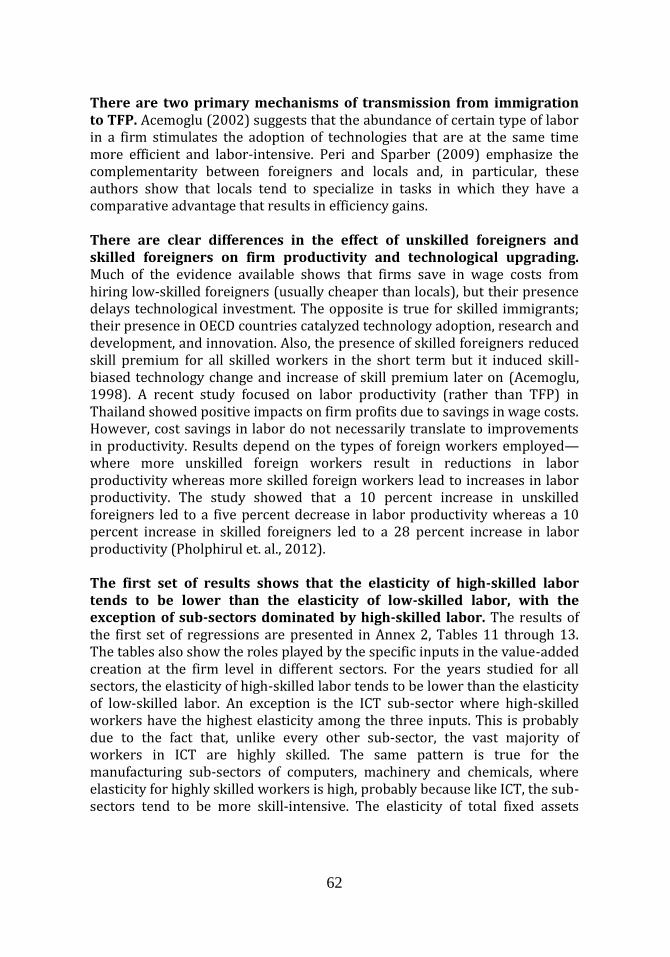
62
There are two primary mechanisms of transmission from immigration to TFP. Acemoglu (2002) suggests that the abundance of certain type of labor in a firm stimulates the adoption of technologies that are at the same time more efficient and labor-intensive. Peri and Sparber (2009) emphasize the complementarity between foreigners and locals and, in particular, these authors show that locals tend to specialize in tasks in which they have a comparative advantage that results in efficiency gains. There are clear differences in the effect of unskilled foreigners and skilled foreigners on firm productivity and technological upgrading. Much of the evidence available shows that firms save in wage costs from hiring low-skilled foreigners (usually cheaper than locals), but their presence delays technological investment. The opposite is true for skilled immigrants; their presence in OECD countries catalyzed technology adoption, research and development, and innovation. Also, the presence of skilled foreigners reduced skill premium for all skilled workers in the short term but it induced skill-biased technology change and increase of skill premium later on (Acemoglu, 1998). A recent study focused on labor productivity (rather than TFP) in Thailand showed positive impacts on firm profits due to savings in wage costs. However, cost savings in labor do not necessarily translate to improvements in productivity. Results depend on the types of foreign workers employed—where more unskilled foreign workers result in reductions in labor productivity whereas more skilled foreign workers lead to increases in labor productivity. The study showed that a 10 percent increase in unskilled foreigners led to a five percent decrease in labor productivity whereas a 10 percent increase in skilled foreigners led to a 28 percent increase in labor productivity (Pholphirul et. al., 2012). The first set of results shows that the elasticity of high-skilled labor tends to be lower than the elasticity of low-skilled labor, with the exception of sub-sectors dominated by high-skilled labor. The results of the first set of regressions are presented in Annex 2, Tables 11 through 13. The tables also show the roles played by the specific inputs in the value-added creation at the firm level in different sectors. For the years studied for all sectors, the elasticity of high-skilled labor tends to be lower than the elasticity of low-skilled labor. An exception is the ICT sub-sector where high-skilled workers have the highest elasticity among the three inputs. This is probably due to the fact that, unlike every other sub-sector, the vast majority of workers in ICT are highly skilled. The same pattern is true for the manufacturing sub-sectors of computers, machinery and chemicals, where elasticity for highly skilled workers is high, probably because like ICT, the sub-sectors tend to be more skill-intensive. The elasticity of total fixed assets

63
ranges between 0.09 (in plantations) and 0.3 (in food manufacturing), with most values within the 0.15 and .02 interval13. The correlation between immigration and productivity does not explain whether an increase in the number of foreign workers leads to changes in productivity; thus, a more complex methodological process is needed to properly measure impact. As discussed earlier, firms with lower productivity levels are often believed to hire more foreign workers, rely on cheaper labor, and decrease their production costs without investing in technology or other factors that can increase productivity. If this were true, one would expect a negative correlation to be observed between immigration and productivity. A negative correlation however, would not mean that hiring more foreigners leads to a decrease in productivity. The proper method to measure impact (rather than estimate a simple correlation) and address potential econometric issues is to perform an instrumental variables regression where the immigration variable is first regressed on factors that are exogenous to unaccounted factors affecting the labor market. These factors are constructed from additional data sources and are based on the demographic data from the sending countries—mainly Indonesia, the Philippines, and other countries in South and East Asia—as well as time invariant sectors and region specific labor demand levels in Malaysia. These variables, in essence, capture the push factors discussed earlier14. Using the process outlined above, estimations are done for the eight manufacturing sub-sectors jointly, whereas construction, plantations, ICT services, and accommodation sectors, are estimated separately. Using the results of the first set of regressions, productivity is constructed as their residual, plus the estimated coefficients for the state and 5-digit industry fixed effects. The main explanatory variable is the natural log of the number of foreign workers at the firm level, instrumented as described in the notes15. In addition, appropriate fixed effects are used to account for sector, state and time factors that influence productivity. The results are presented in Tables 14 through 18 in Annex 2.
13 The estimated elasticities tend to add up to one (approximately), indicating that the Cobb-Douglas assumption holds. 14 This is the identical instrument used in the previous section on the macro analysis with LFS. The only drawback is that the instrument is at the sector level whereas the unit of observation is at the firm level. Therefore, the standard errors are clustered appropriately. 15 Even though the results from a regular Ordinary Least Squares or OLS exercise are not reported, it is worthwhile to indicate that controlling for this endogeneity bias is important. The OLS results are in the opposite direction for many sectors.

64
Table 6. Impact of Immigration on Total Factor Productivity
(Summary Estimations)
Dependent Variable: Log TFP
Variables Manufacturi
ng (50+) Plantation (50+)
Construction (50+)
Manufacturing (20
to 50)
Plantation (20 to 50)
Construction (20 to
50)
Log number of migrants
0.619** -0.25 0.18*** -0.385 -
1.83*** -0.587*
(0.259) (0.241) (0.003) (0.482) (0.578) (0.309)
Year FE No Yes No No Yes No
State FE No Yes No No Yes No
State*Sector FE
Yes No No
Yes No No
Sector*Year FE
Yes No No
Yes No No
State*Year FE
Yes No Yes Yes No Yes
Size Control
Yes Yes Yes Yes Yes Yes
R&D Controls
Yes Yes Yes Yes Yes Yes
Observations
5716 2164 7841 5560 3395 10429
Source: Author’s calculations with the Economic Census, various years
Results show overall positive impacts of immigration on the productivity of medium and large firms (50+ workers) in the manufacturing sector, and most of its eight sub-sectors, as well as for construction. For plantations, results are not conclusive due to the lack of statistical significance. Since firms with different sizes are likely to employ different technologies and mix of inputs, the estimation is implemented separately for firms of different sizes whenever possible. The first three columns of Table 6 present a (summary) set of regression results that help shed light on the causal linkages between immigration levels and productivity levels for large and medium firms in these three sectors. A 10 percent increase in the level of foreign workers at a representative firm increases TFP in the manufacturing sector by 6.2 percent, and in construction by 1.8 percent. The linkages between productivity and extent of employment of foreign workers are quite different for smaller firms (between 20 and 50 workers). The last three columns of Table 6 present these results for the same three sectors. The effect in manufacturing is negative but has no statistical significance. On the other hand, for plantations and construction

65
firms, the effect is clearly negative. A 10 percent increase in the employment of foreign workers reduces TFP by 18.3 percent in the plantations sector and by 5.8 percent in the construction sector. There are various potential reasons for this important difference. In the case of plantations, 99 percent of medium and large plantations grow palm and rubber whereas the share of palm oil and rubber plantations among the small plantations is 67 percent. Thus, the difference can be a reflection of different agricultural methods, crops and overall agricultural climates. Furthermore, the share of the fixed capital assets in the production function is higher for smaller firms indicating they tend to substitute capital for labor. Nevertheless, the difference between smaller and larger firms in terms of the impact of foreign workers on productivity is of critical importance. The policy role for the Government at this point should be to help smaller firms increase their productivity levels through both adoption of right technologies as well as possible expansions and rationalizations in the overall sector. However, further analysis is needed to determine the exact sources of these divergences between smaller and larger firms.
Table 7. Impact of Immigration on Total Factor Productivity (Summary Estimations)
Variables ICT (5+)
Accommodation (5+)
Log number of migrants
-0.25 -0.47
(1.090) (0.507)
Year FE No Yes
State FE No Yes
State*Sector FE Yes No
Sector*Year FE Yes No
State*Year FE Yes No
Size Control Yes Yes
R&D Controls Yes Yes
Observations 1937 2137
Source: Author’s calculations with the Economic Census, various years
It should be noted that the effects of foreign worker presence on productivity in ICT and accommodation sectors are not statistically significant (Table 7). Since there are not that many establishments in the ICT and accommodation sectors, the analysis is conducted for the whole sample of small, medium and large firms. In short, the analysis indicates that employment of foreign workers leads to lower productivity in the smaller construction and plantation establishments as well as two sub-sectors in manufacturing (rubber, chemicals, precision instruments, communication
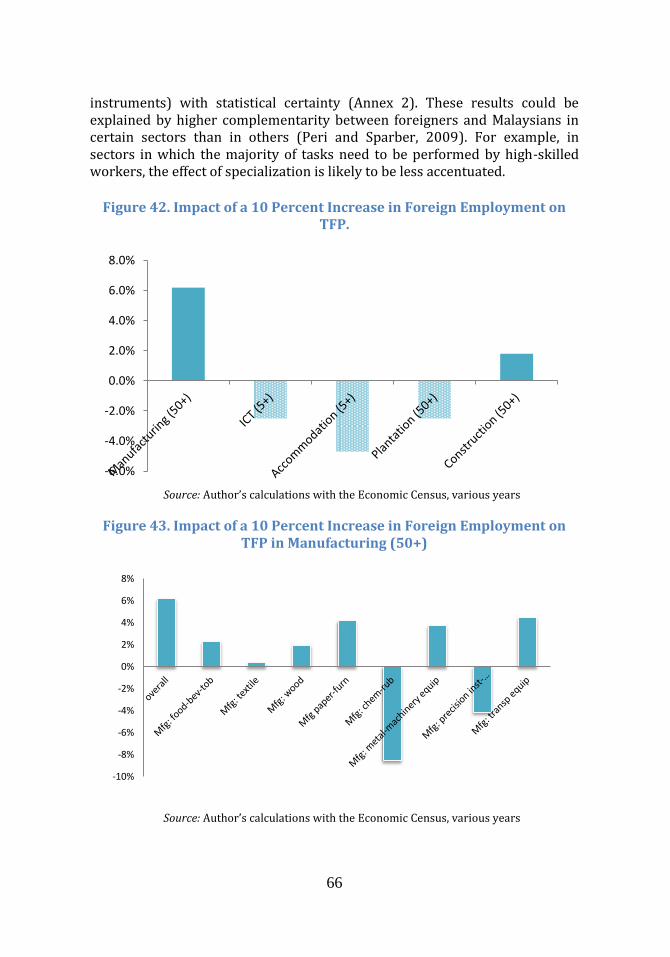
66
instruments) with statistical certainty (Annex 2). These results could be explained by higher complementarity between foreigners and Malaysians in certain sectors than in others (Peri and Sparber, 2009). For example, in sectors in which the majority of tasks need to be performed by high-skilled workers, the effect of specialization is likely to be less accentuated.
Figure 42. Impact of a 10 Percent Increase in Foreign Employment on
TFP.
Source: Author’s calculations with the Economic Census, various years
Figure 43. Impact of a 10 Percent Increase in Foreign Employment on TFP in Manufacturing (50+)
Source: Author’s calculations with the Economic Census, various years
-6.0%
-4.0%
-2.0%
0.0%
2.0%
4.0%
6.0%
8.0%
-10%
-8%
-6%
-4%
-2%
0%
2%
4%
6%
8%

67
2.5 Social Impact Analysis—Effect of Immigration on Crime
The social consequences of immigration are less understood than the economic impact. There is extensive work on the effects of immigration on the economic outcomes of locals, which for the case of Malaysia are extensively documented throughout this report. However, there is generally less evidence available measuring the social consequence of immigration inflows in a country, community or geographic area. Of particular concern in most countries is the effect immigration has on crime, as it is well documented by the ‘National Identity’ survey conducted by the International Social Survey Program. Very little work has been conducted in this area with only a handful of studies in the economics literature for the United States (Butcher and Piehl, 1998; and Borjas, Grogger and Hanson, 2010) and Italy (Bianchi, Buonanno, and Pinotti, 2012). Such thinness in the evidence presents policymakers with a challenge since they are forced to respond with limited ‘evidence-based’ information and largely based on anecdotal evidence. This section of the report attempts to shed light on this issue, in the Malaysian context, by using rigorous econometric techniques (as explained in previous sections of the report) to properly measure the effect. Many studies around the world find that there is a correlation (not causation) between immigration and higher rates of crime. Even though there are no studies in the Malaysian context that find this correlation, there is a sentiment (largely founded on personal views) that this may also be the case in Malaysia. It is clear from evidence derived from worldwide sources that crime rates vary enormously by country of origin of immigrants (Ellis, Beaver and Wright, 2009) and by distinct country contexts. In Malaysia, according to data provided for this report by the Royal Malaysian Police, the crime rate committed by immigrants is much lower than that of Malaysians. This is true for all crimes except murder (see Figure 44). Unfortunately, these statistics are typically highly unreliable due to the difficulties of assessing the nationality of criminals who are not apprehended (Ellis, Beaver and Wright, 2009). As a consequence it is common to investigate the impact of immigration on aggregate crime rates, without distinguishing between crimes committed by locals and immigrants. We follow that practice in this section of the report. Immigration can also impact aggregate crime rates by affecting the conditions and overall context (and the behaviour of) where Malaysians live and work. Employment and unemployment, income, income inequality and poverty, education, and occupation have all shown to be correlated with a person’s likelihood of committing various crimes (Eide, Rubin, and Shepherd, 2006; and Dills, Miron, and Summers, 2008). There is a large literature that

68
focuses on the relationship between crime and unemployment; but results of these studies are still mixed, with no clear consensus of the relationship. For Malaysia, a recent study found that bad economic conditions cause crime in Malaysia (Habibullah and Baharom, 2009). To the extent that immigration affects Malaysians economic outcomes, it will also affect their propensity to commit crimes.
Figure 44. Crime Rates of Malaysians and Foreigners
Source: Author’s calculations with Data from the Royal Malaysian Police
Results suggest that there is no correlation between immigration to different states of Malaysia and crime. Using data on crimes by state for the years 2003 to 2010, reported in the Department of Statistics publication series Social Statistics Bulletin based on Royal Malaysian Police data we find no correlation between immigration and crime in Malaysia. For this analysis, violent and property crimes are further disaggregated into: murder, rape, robbery, bodily injury, house breaking, vehicle thefts, and other property thefts. We correlate changes in the absolute number of crimes with changes over time in immigrant flows to states. The results clearly show that there is no correlation between immigration and crime across Malaysian states for any type of crime (see Annex 2 Panel A in Table 26). This correlation accounts for differences across states and years in the number of crimes committed, as well as state specific trends in crimes, through the inclusion of fixed effects.
-0.1%
0.1%
0.2%
0.3%
0.4%
0.5%
0.6%
0.7%
Total Malaysians Foreigners

69
Correlations can be misleading at times so assessing causality is critical for policymaking. To identify whether there is a causal effect between immigrants and crime in Malaysia we instrument for immigration flows across states. The correlation between immigration and crime is not necessarily informative about whether immigration causes changes in the number of crimes committed in a state. States likely experience changes in underlying socio-economic factors that affect both the immigration and crime rate. Without knowing what these are, we use the same empirical strategy as the one presented in Section 2.2 and instrument for immigration flows. We take advantage of the fact that workers from certain migrant source countries and of certain ages are more likely to move to certain states of Malaysia. Demographic changes in these source countries will consequently result in changes in the supply of immigrants to states in Malaysia, changes that are uncorrelated with changing socio-economic conditions in a state. Instrumental variable estimates suggest that immigration to Malaysia has a reducing effect on crime in the country. We find that changes in the supply of immigrants to a state result in a fall in the number of crimes committed in that state. This is true for every type of crime, except for murders (see Annex 2 Panel B of Table 26). We find that an additional 100,000 immigrants in a state of Malaysia reduces the absolute number of crimes committed in Malaysia by between 1.4 and 4.6 percent, depending on the crime, while having no effect on the number of murders (Figure 45).
Figure 45. Impact of Immigration on Crime (for Every 100,000 Immigrants)
Source: Author’s calculations with Data from the Royal Malaysian Police
Immigration reduces both the crime rate and the absolute number of crimes committed. Results show the effect of immigration on the crime rate (defined as crimes divided by the population aged 15-64) and the elasticity of the crime rate. The effect of immigration on the crime rates is even more
-5.00%
-4.00%
-3.00%
-2.00%
-1.00%
0.00%
% o
f cr
ime

70
pronounced since immigration increases the total population in a state, and therefore the number of people who may commit a crime. In Section 2.2 we showed that the arrival of immigrants in an industry or state results in an inflow of Malaysians as well. The implication is that there are even more substantial decreases in the crime rate. The main reason immigration reduces crime in Malaysia is because it encourages economic activity. This report demonstrates that immigration increases economic activity from which Malaysian workers benefit. This in turn is likely to decrease criminal activity, as suggested by the pioneering work of Becker (1968) and Ehrlich (1973). The evidence suggests that foreign workers in Malaysia have a positive effect on both the economic outcomes of Malaysians and a decreasing effect on the overall crime rate.
71
Chapter 3: Simulation of Increasing the Costs to Immigration
An Estimation using a Macro Computable General Equilibrium (CGE) Model

72
3.1 Introduction to the Simulation Exercise
A macro CGE model is built to simulate the potential effect of various immigration related policy changes. The analysis presented in this chapter is based on a Computable General Equilibrium (CGE) model of the Malaysian economy. We have developed a reference scenario for the Malaysian economy from 2005 to 2015, based on which policy changes can be analyzed. Our focus is on how migration policies affect immigration flows and economic growth at the sub-sectoral level. In addition, we analyze the effect on various labor market outcomes of interest across the economy and within key economic sub-sectors. The model makes it possible to estimate the trade-off between migrant and Malaysian labor demand. Complexities related to the number of skills, economic sub-sectors, and rapid transformation of the Malaysian economy makes the modeling exercise difficult. Given the large number of skill categories and economic sectors in Malaysia, it is important to verify that the predicted evolution of the main macroeconomic variables tracks closely the observed evolution of these same variables. Normally, CGE models are not used to forecast, but since the Malaysian economy has gone through a remarkable structural change in recent years—especially in terms of overall education levels and sectoral diversification—it is important to use the model to reflect this transformation in a manner that is as accurate as possible. As a result, data on exogenous variations in export demand, government consumption, debt, and other specifics had to be collected or estimated. Since the base year is 2005, and data are available through 2010, a dynamic calibration of the model is possible. The result from this exercise is that the reference scenario is reasonably in line with the Labor Force Survey (LFS) figures and the evolution of the main variables at the macro and sector levels. Thus, key policies can be studied using a macro CGE model.
3.1.1 Details of the Database Construction
Inputs to the model are collected from various data and information sources with most of them obtained from the Department of Statistics (DOS) of Malaysia and international organizations. There are at least nine distinct data sources used (see below). The Social Accounting Matrix is created from the input–output tables provided by the DOS. A social security contributions account has been added, with a fixed percentage of employer and worker contributions being drawn from labor income. Total employment is taken from the 2007 LFS, the first survey for which wages are available. It represents wage earners in each sector, with the exception of the agricultural

73
sector where employment refers to all employed due to the particular nature of this sector (hosting many informally employed workers) and health (where employment corresponds to the estimated amount of wage earners for 2005). Data Sources Used for the Macro-CGE Exercise: 1. LFS surveys from 1990s-2010. (Wage module from 2007 onwards) (DOS)
2. Household Income Survey 2007 (DOS)
3. Intake, graduates and enrolment for different educational cycles from 2009-
2010 (Form 6 missing).
4. Data from 2008 HEM model (Macro CGE model by Econtech)
5. Input-output tables 2005 (DOS).
6. Sectoral productivity growth rates (Malaysia Productivity Corporation)
7. National Accounts and Capital Stock Statistics (DOS)
8. Data on debt and debt sustainability (IMF Article IV Staff Report)
9. Others: UNESCO, Ministry of Finance, Bank Negara, WHO, the World Bank
Databank.
Investment by sectoral origin is taken from the 2005 Input-Output (IO) table and is portioned out to destination sectors. Information from a report titled “National Accounts and Capital Stock Statistics” by the DOS proved very useful for this exercise. Since the data reflect a higher aggregation than the one used for the estimation, investment is equally distributed among our sub-sectors. Ideally, an investment origin-destination matrix would have been used, but such a matrix is not available. Current results will thus fail to accurately capture some sub-sector dynamics that are due to relatively high or low investment with respect to sector size. World and local growth rates are taken from the World Bank Databank. Twenty-three economic sectors are identified for the analysis; these align closely with the main economic sectors in Malaysia, including the national key economic sectors (NKEAs). For the large majority of skill groups, economic sectors and citizenship groups, there are sufficient data for accurate estimations. Unemployment rates by skill level are obtained from LFS. All workers are assigned to 23 economic sectors and estimates are performed accordingly. To the extent possible, all NKEAs are assigned to a category where they could be identified in the analysis and further explored in the follow-up Skills Report. Sectoral dynamics between 2005 and 2010 are reflected in Figure 46; the actual evolution can be compared with the evolution obtained from the simulated (CGE) data using LFS. The 21 economic sectors are outlined in Table 7.

74
Figure 46. Sectoral Growth Rates, Simulated and Actual (2005-2010)
Note: The horizontal axis represents 23 different economic sectors Source: Author’s calculations with the DOS; LFS
Total value-added (including social security benefits) in each sector is taken from the 2005 IO table. Wage related data come from LFS 2007. In the agriculture, health and education sectors, aggregate wage bills are from the 2005 IO tables. In the remaining sectors, wage bills are taken from LFS 2007 by multiplying mean wages by skill and industry with the number of workers of that skill and industry. The difference between these and the original wage bill is imputed from capital remuneration. Thus, mean wages and wage earners are kept in accordance with LFS in all except the three sectors mentioned. For those three sectors, the standard methodology could not be used since the imputed wage bill would necessitate a negative capital remuneration. The original wage bill is kept, and wages are imputed and they are not equal to those of LFS.

75
Table 7. Twenty-Three Economic Sectors
Economic Sectors Analyzed
1 Agriculture
2 Mining M
anu
fact
uri
ng
3 Mfg food-beverage-tobacco
4 Mfg textile
5 Mfg wood
6 Mfg paper-furniture
7 Mfg chemical-rub
8 Metal-machinery-equip
9 Mfg measurement-med-com
10 Mfg transport equip
11 Utilities
12 Construction
Serv
ices
13 Wholesale-retail
14 Accommodation and restaurants
15 Logistics
16 Post and telecom
17 Finance
18 Real estate
19 Business services
20 Education
21 Health
22 Other services
23 Public administration
Note: Disaggregation is based on consultation with MOHR
3.1.2 Details on Skill Levels Data on enrollment, intake and graduates for each cycle are obtained for 2009 and 2010 from the Ministry of Higher Education, Ministry of Education, WHO and UNESCO. These data are used to calculate (for each cycle) the drop out-rates and the share of graduates who move to the next cycle. For some skills, the shares and rates obtained are clearly unreasonable, and are modified to reflect more reasonable numbers. Enrollment data for 2005 is estimated in order to reproduce 2009-2010 numbers. Mortality rates

76
by skill are obtained using age composition by skill, combined with WHO life tables. Entrants into primary school are taken from UNESCO data. These educational dynamics generate an evolution of the labor force between 2005 and 2010 that can be compared with the evolution obtained from LFS (Table 8 lists all 21 skill levels and Figure 47 shows how the simulated and actual estimates compare). Figure 47. Evolution of Labor Supply by Skill Level, Simulated and Actual
(2005-2010)
Note: The horizontal axis represents 21 different skills. Source: Author’s own calculations with the DOS; LFS
There are three main categories of skills: lower, medium and higher. The principal difference is the level of educational attainment: secondary or lower for the lower skill category, certificate/diploma for the medium skill category, and university degree for the higher skill category. The lower skill category combines workers with no formal education with education levels that impart lower generic lessons and content. Reported results often make a distinction between having no formal education and having low levels of education. Foreign workers tend to have skill levels comparable to those in the lower level category, thus making it important to separate between all lower levels of education with no formal education. The medium skill category is composed of all those workers with some technical certificate or diploma level and this category is split into eight distinct fields of study. Even though there is a category called services, some critical service degrees such as IT, mathematics, sciences, health, education, business, and law are not included in this category. Instead, it refers mostly to training for the tourism industry, customer service, sales and retail, and personal services among others. The higher skills category includes all university degree

77
holders and beyond, in similar learning areas as those in the medium category.
Table 8. Twenty-One Skill Levels
Twenty-one Skill Levels
Lower Skill
Seco
nd
ary
or
less
1 No schooling
2 UPSR/UPSA equivalent
3 PMR or equivalent
4 SPM or equivalent
5 STPM or equivalent
Medium Skill
Cer
tifi
cate
/Dip
lom
a
6 Arts & Humanities
7 Social science, business, law
8 Science, math, IT
9 Engineering
10 Agriculture
11 Health
12 Services
13 Education
Higher Skill
Un
iver
sity
Deg
ree
14 Arts & Humanities
15 Social science, business, law
16 Science, math, IT
17 Engineering
18 Agriculture
19 Health
20 Services
21 Education
Note: Disaggregation is based on consultation with MOHR
3.1.3 Parameterization of the Model The difficulty to accurately retrace Malaysia’s growth trajectory arises partly from the large number of different skill levels incorporated into the model. There have been many changes in the educational attainment levels and the fields of study being considered and used in the model over the last decade. Elasticities are calibrated in order to allow for substitution between skill levels. Furthermore, a comparison of 2005 and 2010 data on sectoral growth rates show that the public administration, health and

78
education sectors have experienced high growth. This growth pattern is likely to be the result of political decisions rather than market forces, and should as such be treated as exogenous. Variability in sectoral growth rates also arises due to relative changes in world demand for Malaysian exports. As such, the composition of Malaysian exports has also changed during our reference period. Notably, the world demand for electronic components has fallen. Thus, the export demand parameter has been modified in order to arrive at a more reasonable sectoral growth rate. Finally, the coefficient of correlation between the growth rates obtained and growth rates found in the “Annual National Accounts: Gross Domestic Product 2005-2011” report from DOS is 0.89. Investments originally proved extremely sensitive to the 2009 crisis, dropping significantly more than what data show. It seems reasonable to assume, especially since emerging markets are seen as a relatively safe investment option during the global downturn, that foreign direct investment (FDI) soared during this time. Modeling an exogenous increase of FDI for the year 2009 permitted keeping investments closer to the level presented in the National Account Statistics. Wages are calibrated to follow trends obtained from LFS data. Our wage curve parameter is calibrated in order to produce a correlation between wages and unemployment similar to those obtained from LFS data. With respect to elasticities, these are generally set high (considering the high disaggregation of skills), especially within the same educational category.
3.1.4 Macroeconomic Assumptions
With the exception of 2009, Malaysia has been on a stable growth path during the period of 1990-2010. The steady decline in the supply of low-skilled workers has been accompanied by a continuous increase in the number of foreign workers entering the labor force during the period. At the same time, production has become relatively more intensive in high-skilled labor. Total unemployment has continually decreased, with the exception of a rise in 2009 attributed to the global downturn. Investments have also increased, enabling the higher intensity in high-skilled labor. The 2009 crisis meant a decline in savings, and an increase in government spending as a share of GDP. A sharp decline in investment is avoided through an increase in foreign savings. The model includes an assumption to account for the movement restrictions that foreign workers face in Malaysia. More specifically, the model assumes that foreign workers cannot legally move freely across

79
economic sectors when they lose their jobs. Thus, the model includes a mechanism that imposes an imperfect inter-sectoral mobility for foreign workers16 which limits movement for foreign workers, even as relative wages change (rise or fall) across economic sectors. Another critical feature of the model is the imposition of the minimum wage into the reference scenario. Minimum wage of RM 900 for Peninsular Malaysia and RM 800 for Sabah and Sarawak was implemented at the beginning of 2013 and this is reflected in the reference scenario. The years prior to 2012 do not have the minimum wage in the model. Hence, sharp shifts observed in some of the macroeconomic variables are due to the effects of the minimum wage. One final assumption is about the incidence of the levies. Historically, the employers were responsible for the payment of the levies to the Government in addition to the compensation paid to foreign workers. A new decision by the cabinet changes this rule and the employers are allowed to recover the levies from the wages of the foreign workers, which, in essence, lowers the effective wage. In the absence of minimum wage, whether the levy is collected from the worker or the employer would not make a difference in terms of the actual incidence of the tax, which depends on the relative elasticities. However, this simple rule no longer applies in the presence of minimum wage if it is binding. In order to address this issue, two different scenarios are presented for many variables in the analysis. First is the scenario where the levies are collected from the employers and the second is where foreign workers pay the levies out of their wages. As will be seen, the overall difference is minimal in many cases but it is important to highlight the differences.
3.2 Simulation Results
3.2.1 Effects on Growth and Investment
Malaysia currently relies on levies as a means to control the inflow of formal immigration into the country, in addition to sectoral quotas. Levies can impact both supply and demand for foreign workers. Malaysia began imposing levies on employers in 1991 for the import of unskilled and low-skilled foreign workers17. Levy amounts have been modified (mostly
16 In technical terms, this means that the foreign worker supply now has a constant elasticity of transformation function of their supply by economic sector. Thus, the lower the elasticity, the less foreign workers are keen to seek a job in another economic sector when wages change. 17 Details of the levy system can be found in Chapter 4 of this report.

80
risen) at least four times (1995, 1998, 1999, and 2005) since their introduction. In 2011, the Government considered raising the levies by a substantial amount, but after a set of consultations it decided to increase levies by a lower than expected amount, that is, RM 50 across sectors with existing levies. Levy costs can have impacts on both demand and supply sides of the Malaysian economy. On the demand side, levies impose additional labor costs to employers. For instance, in the manufacturing and construction sectors, annual levies per low-skill foreign worker in 2010 were RM 1,200. Therefore, employment of a foreign worker in this sector costs roughly RM 100 extra per month. As levies rise, employers face increases in their labor costs and reductions in their profit margins, thus, potentially reducing foreign labor demand, especially in sectors where employers have low profit margins. The law historically stated that employers must pay levies for their foreign workers; however, a recent decision by the cabinet allows employers to charge back levy costs to the workers, thereby decreasing the take-home pay, potentially making it fall even below the minimum wage level. This practice affects the supply of foreign workers, because they will take into account the potential reduction from their pay when making a decision to emigrate and work in a particular sector. The CGE model allows for simulations to be performed in order to investigate the potential effect of rises of levy costs. The economy-wide model constructed is able to capture the interaction of both sides of the economy. It is also able to capture the responses to changes in labor prices (for example, wage related fees) prompted by rises in costs to the employers, for instance by rising levy costs. All revenues obtained by the Government from levies go into the overall budget; and these revenues are subsequently used for expenditures in worker training among other activities that favor Malaysian workers. The CGE tool is ideal to analyze the potential impact of changes to the immigration system, for instance changes in the levels of the levies applied to many sub-sectors in the Malaysian economy. The analysis first establishes a baseline scenario or reference to which the results of three new—20 percent, 50 percent, and 100 percent levy rise—scenarios are compared. This means that there is a constant reference point of analysis between various alternative scenarios. The baseline (called the reference scenario in this chapter) is what would happen in the absence of the rise in levy costs or the shock. It is important to note that the reference scenario should not be interpreted as a forecast18. In this analysis, the base year is 2012 and the baseline scenario incorporates the new minimum wage legislation that went into effect in 2013. Essentially, the simulations model the
18 Projections made for the analysis are entirely contingent on the assumptions adopted to underpin the scenarios to be modeled.
81
effect of the levy costs increase by imposing increases in the annual maintenance costs 20 percent, 50 percent and 100 percent on labor costs. The increases provide three alternative scenarios. Immigration in the baseline scenario is expected to continue to rise moderately at similar rates to the previous years. A 20 percent increase to the levy cost signifies an additional RM 240 per year or RM 20 per month. A rise of 50 percent and 100 percent on levy costs in these sectors translates to increases by RM 600 (total of RM 1,800) and RM 1,200 (a total of RM 2,400), respectively. The model shows that once levy costs are adjusted upward, legal international immigration to Malaysia is expected to fall. Indeed, Figure 48 shows that immigration to Malaysia continues to rise even after the levy increases but at a slower rate. In Panel A, it is assumed that the employers are responsible for paying for the levies in addition to the wages, whereas in Panel B foreign workers pay the levies out of their wages. The sharp decline in both scenarios is due to the implementation of the minimum wage in 2013, which is quite significant. Large portions of the foreign workers are unskilled and were paid below the minimum wage levels as of 2012. With the minimum wage set above the free market wage, demand for foreign workers drops quite a bit. For example, from 1.12 million foreign workers (in 2012, prior to the levy change), the demand goes down to 0.93 million with the implementation of minimum wage in Panel A and down to 0.96 million in Panel B when minimum wage is less binding. An additional increase of 20 percent in levies would lead the demand to decline to 0.91 million. Fifty percent or 100 percent increase in levies brings demand down to 0.89 and 0.86 million respectively (Panel A). In other words, the minimum wage lowers demand by around 17 percent while 50 percent increase in levies would lower demand only another four percent. On the other hand, when workers pay for the levies, demand decline is significantly lower (Panel B). Increase in levy levels (by 20 percent, 50 percent and 100 percent) lower demand for foreign workers only to 0.95, 0.94 and 0.93 million, respectively. With growing economy and rising price levels, minimum wage and absolute levies lose their relative importance and demand for foreign workers steadily increases. Three years after the rise of the levy costs, in 2015, the total estimated number of foreign workers will still be below the 2012 level. Without an increase in levies (reference scenario), demand for foreign workers is around 10 percent lower than the 2012 levels. With a 50 percent increase in levies, it would be around 13 percent lower (Panel A). When workers are responsible for the levies, demand is only six percent lower in 2015 relative to their 2012 levels. With a 50 percent increase in levies, demand is only lower by eight percent in 2015.
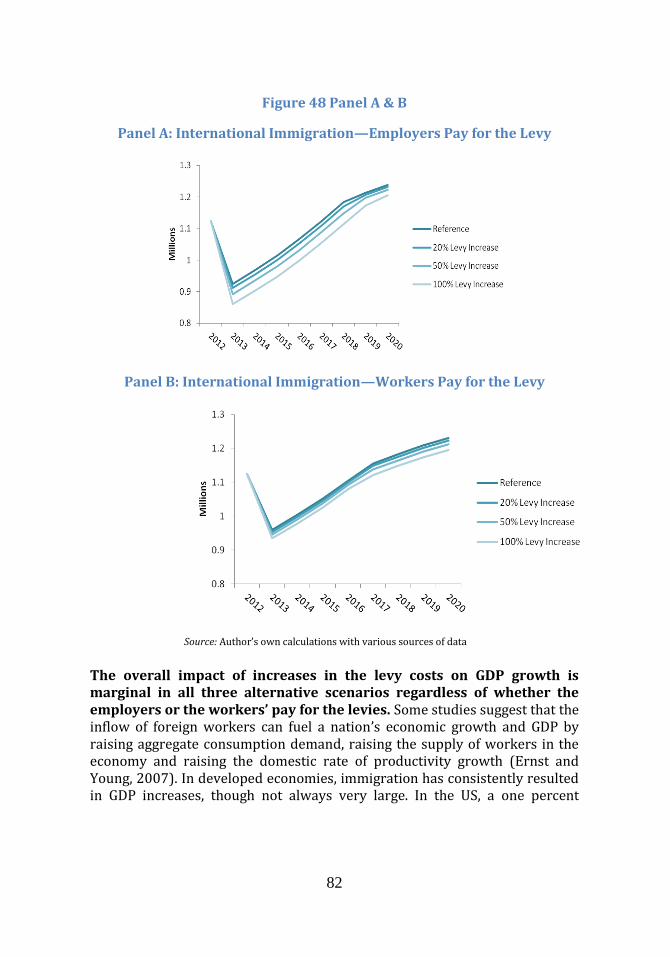
82
Figure 48 Panel A & B
Panel A: International Immigration—Employers Pay for the Levy
Panel B: International Immigration—Workers Pay for the Levy
Source: Author’s own calculations with various sources of data
The overall impact of increases in the levy costs on GDP growth is marginal in all three alternative scenarios regardless of whether the employers or the workers’ pay for the levies. Some studies suggest that the inflow of foreign workers can fuel a nation’s economic growth and GDP by raising aggregate consumption demand, raising the supply of workers in the economy and raising the domestic rate of productivity growth (Ernst and Young, 2007). In developed economies, immigration has consistently resulted in GDP increases, though not always very large. In the US, a one percent

83
increase led to a .1 percent growth in GDP (Barro and Sala-I Martin, 1992)19. Thus, a decrease in immigration is expected to have the opposite effect. In the scenarios analyzed, the result of minimum wage is an initial shock to GDP where the growth rate declines to 4.73 percent in 2013 from 5.21 percent in 2012 (Figure 49). Further 50 percent increase in levies has a very small impact on the GDP growth rate. If the employers pay the levies, the growth rate is 4.67 percent and if the workers’ pay, it is 4.75 percent. The marginally higher level of growth (when workers pay the levy) is simply due to the fact that the effect of minimum wage is slightly curbed. Starting in 2014, the growth rates stabilize at five percent in all scenarios regardless of the change in levies. In other words, the levy change has almost no effect on the GDP path regardless of incidence of levies. The impact of levy changes on investments is even smaller. There is again a small decline of around 1.5 percent in investment with implementation of minimum wage in 2013. Then the growth resumes and steadily increases. A change in levies has no discernible effect on investment relative to the reference scenario. Furthermore, whether the levies are collected from employers or workers, again, has no effect.
Figure 49. GDP Growth
Source: Author’s own calculations with various sources of data
19
A recent study for OECD (2006) finds that the effect of out-migration, or brain drain, has large
negative effects on GDP.
84
3.2.2 Effects on Economic Sectors A decrease in foreign labor is likely to result in a decrease for the demand of investment goods due to higher wage costs, lower profits and lower savings. The combination of less demand for goods and services (due to having less foreigners who consume) and less labor resources available will likely result in less use of equipment, machinery, buildings, and other productive capital. This effect is most apparent in economic sectors associated with the production and supply of physical capital resources, which are harmed by the decrease in demand for such resources. At the same time, the availability of less labor and capital leads to a decrease in goods being produced and services being offered. The balance between these two impacts determines changes in prices in the Malaysian economy. Levy prices vary dramatically across economic sub-sectors and not all sub-sectors have a levy imposed. Thus, we would expect that a uniform rise in the levies (in percentages) could potentially exacerbate existing distortive effects across sub-sectors. In the model, levies are only applied to 14 out of 23 of all sub-sectors. Impacts of a 20 percent rise are negligent across most sub-sectors, except for construction and wholesale retail trade, which see a negative impact in all three years after the levy price rises. The agricultural sector sees a very slight negative impact the first year but is able to adjust quickly after. Differences in the impacts across labor-intensive sectors can be partly explained by the starting differences in levy costs across sectors. The cost of levies on service sub-sectors is high compared to construction and manufacturing, and higher still compared to agriculture and plantations. For instance, in manufacturing and construction, levies cost RM 1,200. In service sub-sectors such as tourism, wholesale retail, cleaning, laundry, logistics, and food, they are RM 1,800. In agriculture and plantation, the initial level of levies is RM 360 and RM 540, respectively. Unlike the services and construction sectors, where a 20 percent rise signifies a RM 360 and RM 240 increase, respectively, the agricultural sector only sees a RM 72 increase. Most economic sub-sectors with levies imposed are likely to see a marginal impact from an increase of even 50 percent in levies, regardless of who is responsible for the payment. Figure 50 shows the average effects across all three years with a 50 percent increase relative to the reference scenario. The difference tends to be more positive when the workers pay for the levies since the negative effect on demand is likely to be lower. For instance, certain sub-sectors (manufacturing of wood products, food, beverage, and tobacco products, and construction) are likely to experience higher growth with levy increases, when workers pay them. On the other hand, the effect turns negative when employers pay the levies. These

85
differences are likely to be due to skill compositions, mix of Malaysian and foreign workers in these sectors as well as elasticities of substitution of workers across sectors. Similarly, the effects tend to be negative in real estate, utilities and other services. However, the most important result to remember is that all of these effects are very small, almost negligible. The largest difference observed is only 0.2 percent in the growth rate of construction, which is predicted to be 25 percent over this time period.
Figure 50. Impact of 50 Percent Increase in Levies on 2010-2020 Sectoral Growth Rates (difference)
Source: Author’s own calculations with various sources of data
86
3.2.3 Effects on Unemployment and Wages of Malaysian Workers
The impacts on unemployment are also negligible; a very slight decrease in unemployment the first year and a very slight increase the years after. The overall unemployment among Malaysians is already very low and even in the 100 percent levy rise scenario the impact is miniscule relative to the reference scenario. The econometric analysis in the previous section indicates that the relatively larger unemployment increases should be concentrated among mid-skilled workers with low-medium and medium skills, namely, workers with secondary education completed and technical certificates and diplomas. On the other hand, positive impacts on employment from a decline in the number of foreign workers should be felt more by unskilled Malaysians. Since increase in levies imply in a decline for foreign workers, the resulting effect should be a decrease in employment for mid-skill workers. This effect is likely due to the complementarity between foreigners and medium-skilled Malaysians. The previous chapter (Chapter 2) shows that foreigners generate employment for middle skill local workers and the cessation or slow-down of production and service activities where foreign labor is hard to replace reduces employment of mid-skill local workers. These workers typically work in supervisory occupations, office work and overseeing operations in establishments that employ foreigners to perform basic tasks. Simulated results show that wages of medium-skill workers are not affected by the reduction in immigrants induced by the increases in levy costs. Studies for the US and other developed economies show that a 10 percent increase in immigration led to a one percent fall in wages (Fredberg and Hunt, 2005). The empirical analysis in Chapter 2 shows that older male workers with mid-level education see their wages increase as a result of immigration. Simulation analysis in this chapter does not contradict this finding. The failure to show the same result in the CGE model results from the fact that the model does not fully account for exogenous changes in the supply of foreign workers. Among such factors are demographic shifts in the origin countries. On the other hand, workers with no formal education or primary school achievement test (Ujian Pencapaian Sekolah Rendah or UPSR) see a marginal rise in their wages. The effects of immigration in developed economies are mostly felt by unskilled or low-skilled workers (Borjas and Katz, 2005). The effect of immigration on unskilled or low-skill Malaysians is similar to the effect observed in developed economies, though the magnitudes differ. As shown in the previous chapter, Malaysian workers with low levels (at most primary completed) of education experience falling wage levels from immigration as well. Indeed, simulation analysis done here shows that the only categories of workers that experience any benefit in terms of real wage

87
increase is the group with no formal education or those with UPSR/UPSA or equivalent skill level. More specifically, when levies are increased by 50 percent and immigration levels decrease, local workers with no schooling experience a wage increase 0.30 percent relative to the reference scenario if the employers pay for the levies or 0.15 percent if the foreign workers pay for the levies. Similarly, Malaysian workers with primary school completed see a 0.15 percent increase in their wages (Figure 51).
Figure 51. Change in Average Formal Wages of Low Skill Malaysian Workers
Source: Author’s own calculations with various sources of data
Wages of foreign workers are affected by levies. Results show a significant pass-through of the added costs to foreigners through their wages. Given the wage elasticity of the supply of immigrants in Malaysia20 and the high elasticity of substitution between low-skill foreigners and low-skill locals21, there is a high pass-through of the levy increases to foreign wages. This deters foreigners from going to work in sectors most affected by levies. The rest of the adjustment happens through a decrease of immigration volumes, especially of workers with low levels of skills. Figure shows the extent of the decrease in wages that foreigners would face in each of the scenarios investigated. If the employers pay the levies, the decline in wages due to 50 percent increase in levies is almost 3.5 percent for workers with no formal schooling and between two-three percent for the majority of workers. If the employers pay the levies, the decline in wages is around 0.75 percent. Of
20 We calibrate it to 1.5 to replicate approximately the evolution of legal migration in Malaysia. 21 Estimated econometrically.
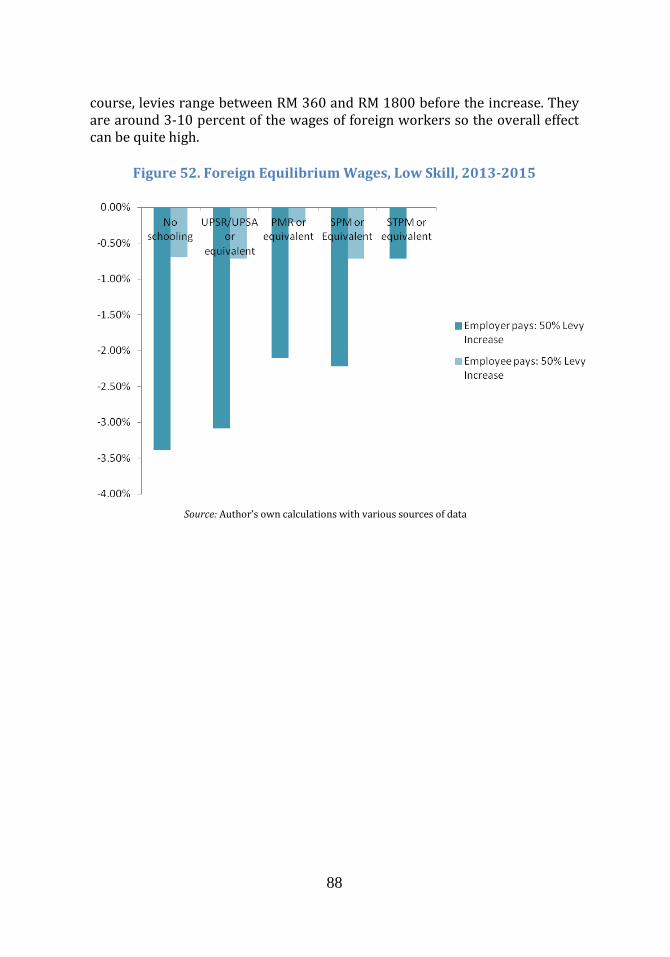
88
course, levies range between RM 360 and RM 1800 before the increase. They are around 3-10 percent of the wages of foreign workers so the overall effect can be quite high.
Figure 52. Foreign Equilibrium Wages, Low Skill, 2013-2015
Source: Author’s own calculations with various sources of data
89
Chapter 4: Description of the Malaysian Immigration System
Current Policy and Governance Structure

90
4.1 Introduction to the Malaysian System
Malaysia has been importing labor from other countries to fuel its labor-intensive industries. However, despite having an immigration system not originally designed to allow foreigners to stay permanently, the 2010 census shows that eight percent of the Malaysian population is made up of foreign nationals. Instead, the policies were designed to allow them to stay for a short duration, at the end of which, they had to return home. In practice, however, foreign workers could apply for permanent resident status after a continued minimum length of stay of five years. This flexibility was availed by many, in particular foreigners from Indonesia. As a result, the number of non-Malaysians or permanent residents of foreign origin has been rapidly increasing in the last three decades as reflected in the population census. In 2010 in Malaysia, out of a population of 28.2 million, 8.2 percent were foreign nationals. The number of non-citizens in 2000 was 5.9 percent of the total population compared to 4.3 percent in 1991 (DOS, Population Census, 1991, 2000 and 2010). Though the majority of foreigners immigrate to Malaysia in search of gainful employment, there are many who seek permanent settlement, especially in the North Borneo state of Sabah.
4.1.1 Registered Foreign Workers
There are two formally registered foreign types of workers in Malaysia—expatriates and foreign workers—governed under two very distinct sets of rules and privileges. Expatriates are defined as skilled, managerial, professional, and technical workers, and can stay in the country for long- or short-term periods; they have their own sets of rules and privileges. Foreign workers are defined as semi-skilled or unskilled migrant workers and are called migrant workers by employers and the legal system. They are brought to the country as ‘guest workers’ or ‘contract workers’ and are managed by different rules and regulations than expatriates, in so far as types of passes, tenure, levies, and rules are concerned. The official distinction between the expatriates and semi-skilled or unskilled migrant workers is based on a monthly salary cut-off point that is currently set by the authorities.
4.1.1.1 Expatriates
Expatriates are skilled, managerial, professional and technical foreign workers earning at least RM 3,000. This category of foreign workers is issued with employment passes if their employment contracts are at least for two years. The expatriates on short-term contracts of less than a year are issued visit passes for professional employment. The number of expatriates is
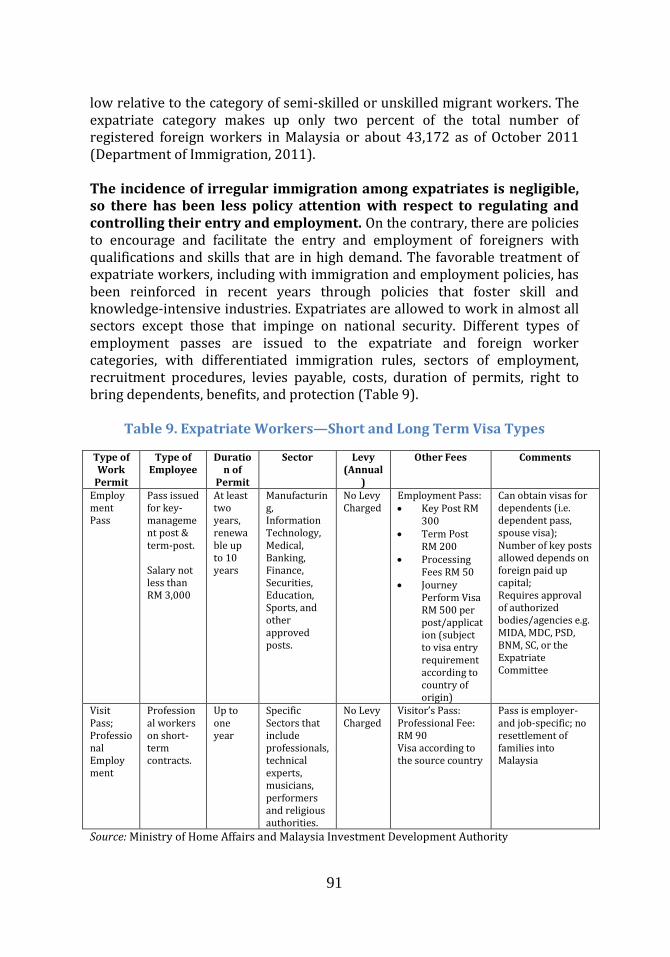
91
low relative to the category of semi-skilled or unskilled migrant workers. The expatriate category makes up only two percent of the total number of registered foreign workers in Malaysia or about 43,172 as of October 2011 (Department of Immigration, 2011).
The incidence of irregular immigration among expatriates is negligible, so there has been less policy attention with respect to regulating and controlling their entry and employment. On the contrary, there are policies to encourage and facilitate the entry and employment of foreigners with qualifications and skills that are in high demand. The favorable treatment of expatriate workers, including with immigration and employment policies, has been reinforced in recent years through policies that foster skill and knowledge-intensive industries. Expatriates are allowed to work in almost all sectors except those that impinge on national security. Different types of employment passes are issued to the expatriate and foreign worker categories, with differentiated immigration rules, sectors of employment, recruitment procedures, levies payable, costs, duration of permits, right to bring dependents, benefits, and protection (Table 9).
Table 9. Expatriate Workers—Short and Long Term Visa Types
Type of Work
Permit
Type of Employee
Duration of
Permit
Sector Levy (Annual
)
Other Fees Comments
Employment Pass
Pass issued for key-management post & term-post. Salary not less than RM 3,000
At least two years, renewable up to 10 years
Manufacturing, Information Technology, Medical, Banking, Finance, Securities, Education, Sports, and other approved posts.
No Levy Charged
Employment Pass: Key Post RM
300 Term Post
RM 200 Processing
Fees RM 50 Journey
Perform Visa RM 500 per post/application (subject to visa entry requirement according to country of origin)
Can obtain visas for dependents (i.e. dependent pass, spouse visa); Number of key posts allowed depends on foreign paid up capital; Requires approval of authorized bodies/agencies e.g. MIDA, MDC, PSD, BNM, SC, or the Expatriate Committee
Visit Pass; Professional Employment
Professional workers on short-term contracts.
Up to one year
Specific Sectors that include professionals, technical experts, musicians, performers and religious authorities.
No Levy Charged
Visitor’s Pass: Professional Fee: RM 90 Visa according to the source country
Pass is employer- and job-specific; no resettlement of families into Malaysia
Source: Ministry of Home Affairs and Malaysia Investment Development Authority
92
4.1.1.1.1 Expatriate Types and Passes Employment Pass An Employment Pass is issued to expatriates who are engaged under an employment contract with a Malaysian company for a minimum period of two years to perform managerial or professional duties or technical roles that require skills and experience. An expatriate with a salary of RM 8,000 or more per month will be eligible for an automatic approval for an expatriate position subject to application to the Department of Immigration (DOI) and subject to meeting the requisite documentation process. Foreign nationals who are eligible for expatriate positions are categorized according to their positions as one of three categories. The first category is key post; this is a high level (1st level) managerial post in a foreign-owned private company or firm operating in Malaysia. Key posts are essential for companies to safeguard their interests and investments. The expatriates are responsible for determining the companies’ policies in achieving their goals and objectives. Examples of such posts are: Executive Chairman, Chief Executive Officer, Managing Director, General Manager, Technical Director, Production Manager, Project Manager, or Factory Manager. The second category is executive post; this is an intermediate level (2nd level) managerial and professional post. These posts require academic qualifications, practical experience, skills and expertise related to their respective jobs. The expatriates are responsible for implementing the companies’ policies and supervision of staff. Examples of such posts are: management functions such as Marketing Manager, Logistics Manager, Investment Manager, and Quality Control Manager; Professionals such as Chief Engineer, Engineering Manager, Lecturer, Doctor, Architects, among others. And the third category is non-executive post; these are posts for the performance of technical jobs that require specific technical or practical skills and experience. Examples are: Welder, Mold Maker, Mold Designer, Tool and Die Maker, Manufacturing Systems Designer, Food/Nutrient Technologist, Fashion Designer, Specialist in Furniture Design and Ergonomics, Heat Setting Technician, Sewing Specialist, Craftsman/Engraving, and Product/Flavoring Specialist.

93
Table 10. Agencies Approving Expatriate Posts
Agency Position/Field Guidelines
MIDA Expatriate posts in the following fields in the private sector: Manufacturing company (new
or existing) which is involved in expansion plans
Manufacturing Related Services - Regional Office, Operational Headquarters, Overseas Mission, International Procurement Centre, etc.
Hotel & Tourism Industry Research & Development Sector
Foreign manufacturing companies - capital more than US$ 2 million:
- Approval for up to 10 expatriate posts, including five key posts.
US$ 200,000 to US$ 2 million: - Approval for up to five
expatriate posts, including at least one key post.
Less than US$ 200,000:
- Key posts can be considered where the foreign paid-up capital is at least RM 500,000.
- The number of key posts, executive posts and non-executive posts allowed depends on the merits of each case
MDC Expatriate Post and Skilled Migrant Workers in Information Technology based companies which have been granted MSC status
- Five years or more experience in ICT/Multimedia or degree or graduate diploma + two years of experience or a master degree or higher in any discipline
PSD Doctors and nurses working in government hospitals or clinics
Lecturers and tutors employed in Government Institutes of Higher Education (IPTA)
Contract Posts in Public Services
Recruitment process jobs offered by the Public Service Commission (SPA) or government related agencies
BNM Expatriate posts in the following sectors: Banking Finance Insurance
Applicants with specific specialization or expertise will be considered on a case- to-case basis
SC Expatriate posts in Securities and Share market.
Applicants with specific experience on case-to-case basis
EC Expatriate posts in private and public sectors other than those under MIDA, MDC, PSD, BNM and SC's scope
Application considered on merit of application, recommendation of the related monitoring agency and paid up capital of the company
Source: Author’s compilation from various sources
Six different government or semi-government bodies are mandated to grant approval before an expatriate may be hired. The agency that has the mandate to grant approvals to an employer is determined based on the core nature of business of the employer. For expatriate posts that are outside the

94
scope of the six agencies, the authority that can approve the employment of an expatriate is the Expatriate Committee (EC). The specific condition for approval by the EC and excluded categories (more specifically, posts that an expatriate must not be hired for) are set out in Annex 4. One of the main criteria for applying for an expatriate post is a recommendation from a monitoring agency22. The EC consists of members from various ministries that include: Ministry of Home Affairs (MOHA), Ministry of International Trade and Industry (MITI), Ministry of Domestic Trade and Consumer Affairs, Ministry of Education (MOE), Ministry of Human Resources (MOHR), Construction Industry Development Boards (CIDB), MARA (Majlis Amanah Rakyat or Council of the People). The DOI (Department of Immigration) acts as the secretariat. Table 10 outlines the key agencies, positions and guidelines set out. Expatriates enjoy benefits related to bringing spouses and allowing them to work, and subsequently remaining in the country. A spouse of an employment pass holder is allowed to take up employment while holding a Dependent Pass. In principle, permission is granted in a short period of time after submitting an application for permission to work to the DOI. Also, the person receives a ‘permission to work’ stamp upon arrival to Malaysia that is endorsed on the dependent pass holder’s passport. The rules do not apply to other family members. Expatriates can also take part in the Malaysia My Second Home Scheme (MM2H) upon the completion of the tenure of employment. This scheme allows expatriates who wish to retire in Malaysia after expiry of their employment passes to be eligible to apply to stay, subject to meeting the financial requirements imposed by the scheme. Participants aged 50 years and above who are qualified and experienced can apply to work in sectors approved by the Government as well as to invest and actively participate in business subject to existing government policies, regulations and guidelines which are in force for the related sectors. Visit Pass Visit Pass for professional employment on short-term basis—up to twelve months—is issued to skilled foreign workers who possess specialist skills. The approval for hiring of expatriate professionals in this category is at the discretion of DOI. The DOI issues a list of recognized skills for this category of foreign workers (Table 11) and given that these foreigners are in Malaysia for a short-term period they are not allowed to bring their spouses. In Sabah, expatriate worker applications must be forwarded to a
22 Approval of the expatriate post must be obtained prior to submission of the employment pass application. And there are cases where foreigners from certain countries are required to remain in their home country pending approval of the application before entering Malaysia.

95
separate committee under the purview of the State Immigration Department. As this is generally restricted to professionals and other skilled worker categories, the number of foreign workers falling under this category is much more limited.
Table 11. Recognized Skills for Short-Term Professional Employment Pass
Skill Post Expert / Volunteer
Advisor to the Government Professor/Lecturer/Speaker Researcher/Assistant Researcher Consultant/Technical Advisor Jockey Volunteer Installation and fixing of machines and equipment expert Maintenance expert of machines and equipment External Auditor Fellow Expert in any specific field approved by the Director General of DOI.
Artistes
Stage artistes - singer, musician, dancer, concert, theatre, circus, acrobatic, silat, magician and opera (Buddhist, Hindu, and others)
Non-artistes—stage management and screenplay filming activities—documentary, interview, fiction, entertainment, commercial advertisement or any other related filming activities of any foreign film production company in Malaysia.
Live performance/shows—in hotels, entertainment outlets, trade center, cultural center, stadium and other suitable places.
Promotional activities by artistes - indoor or outdoor performance, album and film promotions, and product promotion excluding alcohol and tobacco products.
Missionary (Islam)
Islamic literature Imam Preaching Arabic teacher Al-Quran teacher
Missionary / Other Religions
Gurukkals Priest Monk Dharma teacher Religious sculptors Religious musicians Granthis in temples
IT Related Positions
Technical experts
Source: MOHA

96
4.1.1.2 Migrant Workers
Semi-skilled and unskilled foreign workers constitute 98 percent of all foreign workers in the country. They are classified under this category because of their limited skills and low remuneration. Migrant workers, as low-skill foreigners are referred to in Malaysia, typically have lower levels of education (as shown in previous chapters), and by definition they earn less than RM 3,000 per month. They are issued Visit Passes for Temporary Employment (VPTE) known in Bahasa as Pas Lawatan Kerja Sementara (PLKS), which are work permits governed by multiple regulations to control and regulate their entry and employment. Foreign workers in this category work in the manufacturing, construction, agriculture, services, and domestic services sectors and they are recruited mainly from fifteen source countries: Indonesia, Thailand, Vietnam, Cambodia, Philippines, Laos, Nepal, Sri Lanka, India, Bangladesh, China, Pakistan, Turkmenistan, Kazakhstan, and Uzbekistan. Overall, this category of worker constitutes all except two percent of foreign workers in Malaysia. Semi-skilled and unskilled foreign workers in Malaysia are sourced from fifteen countries. While the Peninsula avails itself to workers from all of the 15 countries, Sabah gives preference to foreign workers from its immediate neighbors—Indonesia and Philippines. Sarawak gives preference to workers from the Indonesian Kalimantan (See Annex 5 for a detailed table). Visitor passes for temporary employment of low-skill workers have twelve months validity, are renewable up to five years, and there are age restrictions associated with these permits. This category of foreign workers is governed by strict criteria that regulate their entry, residence and employment. This is to ensure that Malaysians are not replaced by cheaper migrant labor, and to encourage employers to adopt labor saving production techniques and shift to skill and knowledge-intensive industries to reduce long-term reliance on foreign labor. Workers with this pass are not allowed to bring in their dependents legally; however, there is evidence that this rule is often violated, particularly in Sabah, where entire families immigrate (Azizah and Ragayah 2011).
4.1.1.2.1 Permission to Hire Migrant Workers by Economic Sector Foreign labor cannot be hired for any economic sector in the economy and from any country across the world. However, these rules have changed over time. Recruitment of foreign workers was first sanctioned in 1992 in five economic sectors: plantation, domestic services, general services, construction, and manufacturing. In 1996, the agricultural sector was added
97
to include private small-scale agricultural holdings, fisheries and animal husbandry. Since 2005, the manufacturing sector has remained the largest sector to employ foreign workers. The number of foreign workers in this sector peaked in 2007 at 733,372 workers and has since reduced to 672,823 in 2010. Utilization of foreign workers in plantations is second only to the manufacturing sector. In 2010, this sector employed about 266,196 foreign workers. In addition to regulations as to the source countries from which these workers could be hired for every sector, semi-skilled and unskilled foreign workers are also regulated by annual levies ranging from RM 410 to RM 1850 that were imposed on each worker until 2009, when the law changed to make employers pay for the levies.
Foreign workers from thirteen countries are permitted in the manufacturing sector; sometimes there are gender restrictions. In the manufacturing sector the following countries are permitted to work in Malaysia: Indonesia (females only), Thailand, Vietnam, Cambodia, Philippines (males only), Laos, Nepal, Sri Lanka, Myanmar, Pakistan, Turkmenistan, Kazakhstan, and Uzbekistan. The number of permits granted to hire foreign workers is determined by the following criteria: (1) export-oriented manufacturing—companies that export more than 50 percent of their output; (2) non-export oriented manufacturing—companies with total sales of RM 2 million and above, and minimum paid-up capital of RM 100,000; (3) a 2 to 1 ratio of foreign workers—for every two local workers, a company is allowed to hire one foreign worker; and (4) employers must show efforts to recruit local workers; this is done via advertisements in Job Clearing System (JCS). In the plantation sector, foreigners from fourteen countries are permitted and males are preferred to women. In the plantation and agriculture sectors foreign workers are allowed to work in crops (rubber, oil palm and cocoa), food crops, floriculture, animal husbandry, and aquaculture (Figure 53). The workers may be recruited from the Philippines (males only), Indonesia, Cambodia, Kazakhstan, Laos, Myanmar, Nepal, Thailand, Turkmenistan, Uzbekistan, India, Pakistan, Vietnam, and Sri Lanka. In the plantation sector, the Ministry of Plantation Industries and Commodities (MPIC) has specified conditions on the use of foreign labor in plantations. According to the specifications, the number of foreign workers that allowed is based on the hectares cultivated. Figure 53 shows how many hectares for every one foreigner must be cultivated for a particular crop. Apart from the hectares, a ratio is also set in approving semi-skilled and unskilled migrant workers in these sectors; in the case of oil palm the ratio was set at one local worker to two foreign workers. The respective ratios for rubber and cocoa are 1:7 and 1:3 (Suresh 2007). In the agricultural sector, the criterion depends on the types of crop and hectares planted, the number of livestock, and type of aquaculture, among other factors.

98
Figure 53. Permitted Foreigners in the Plantation and Agricultural Sectors
Source: Author’s tabulations using Suresh 2007
The services sector has higher restrictions than others. Also, the Government’s immigration policy and the number of permits fluctuates the most in this economic sector. Specific sub- sectors in which foreign workers are permitted to be hired are restaurants (general workers and cooks), cleaning companies, cargo handling at ports, welfare homes, launderettes, golf clubs (caddies), resort islands, hotels and spas, goldsmiths, hair dressing, textiles, wholesale and retail, scrap-metal, and recycling. Although there is no clear-cut policy on the number of foreign workers that an establishment may recruit, in practice it appears that the number of foreign workers permitted depends on the turnover and volume of business, size of the establishment, and proof that efforts to procure local workers have been unsuccessful. Foreign workers from all the source countries, excluding Bangladesh, are allowed in the service sector. Foreign workers in the construction sector are subject to explicit conditions that employers must fulfill. A critical condition is that the employer should be a registered contractor with the Construction Industry Development Board (CIDB) and possess a valid CIDB registration/license at the time of submission for work permit application. Also, the project value should be in accordance with the grade and specialization approved by CIDB. Approval of foreign workers is based on keeping the right ratio of local workers and foreigners (1:3) and determination of the number of workers is based on the types of projects (for example, housing, high rise buildings, infrastructure, plumbing and sanitary works, transmission lines, underground cables, and oil and gas pipelines). Foreign workers permitted to be employed
8
4
3.6
2.5
15
20
2
1
0 5 10 15 20 25
Oil Palm
Rubber
Cocoa
Jungle Plot
Teak/Sentang Plots
Jungle Nursery
Oil Palm Nursery
Other Types of Nurseries

99
in the construction sector are from all the source countries with the exception of workers from Bangladesh.
4.1.1.2.2 Policy in Sabah and Sarawak for Migrant Workers The process of hiring migrant workers in Sabah and Sarawak is similar to that of the Peninsula. However, both Sabah and Sarawak have certain prerogatives as regards to the administration of their policies pertaining to labor and immigration. An employer in Sabah wishing to employ foreign workers needs to obtain a license from the State Labor Department and a recruitment quota from the Committee for Foreign Workers in Sabah and Labuan attached with the Immigration Department. The quota is normally based on a ‘worker-per-acre’ estimate, as previously explained. Upon approval, the employer submits an application for the necessary Visit Pass (Temporary Employment) to the Immigration Department. Similarly, in the case of Sarawak, an employer wishing to hire migrant workers is also required to obtain a license and recruitment quota from the Sarawak Labor Department first, before submitting an application for a Visit Pass (Temporary Employment) to the Immigration Department. Unlike Sabah, however, Sarawak does not have an equivalent of the Federal Special Task Force (FSTF) for Sabah and Labuan, which plays a key role in the hiring process of foreign workers in the case of Sabah (MSN 2004).
In terms of tenure of employment, registered migrant workers in Sabah are subject to the national policies and immigration guidelines. However, despite having equal rules, overstay violations are a growing problem. Whilst foreign workers were allowed to work for a total of seven years previously, currently the 3 year+1 year+1year formula applies. At the same time, it must be noted that Sabah has long contended with the problem of overstaying foreign workers. The high population growth rates for Sabah in the past four decades have given rise to the strong perception that many foreigners have attained citizenship status. Due to the influx of foreigners since the late 1960s, the state recorded a 410 percent population growth in 40 years from 648,000 in 1970 to 3,309,700 in 2010 (DOS, 2010). Acknowledging this, the Malaysian Government has recently announced the formation of a Royal Commission of Inquiry (RCI) to investigate the illegal foreigners problem in Sabah. The RCI is in the final stages of drafting its terms of reference by the Attorney General’s Chambers.
4.2 Recruitment and Renewal Procedures
Formal guidelines on recruitment of foreign workers only emerged in the early 1990s. Guidelines included the introduction of the levy system for

100
foreign workers and the formation of institutional structures to deal with them. Various authorities were set up to identify, formulate guidelines and manage workers. During this time, state agencies responsible for migrant workers’ recruitment and employment were also identified. The DOI, under the Ministry of Home Affairs (MOHA), was made the lead agency to process the recruitment of foreign workers, employment of domestic helpers, and deportation of irregular migrant workers. The Ministry of Human Resources (MOHR), in particular the Department of Labor (DOL), was made responsible for matters related to the welfare and employment conditions of these migrant workers. Immigration matters for Sabah and Sarawak are within the state’s jurisdiction. Immigration policies in Malaysia were formulated initially for the Peninsula only. Sabah and Sarawak subsequently adopted these policies with some modifications. For example, the two states gave preference to their immediate neighbors, the Philippines and Indonesia, as source countries to fulfill their migrant worker requirements. Recruitment procedures have changed over time. Currently there are three methods through which foreign workers may be formally recruited. Once a foreigner is recruited there are clear pre-set steps employers/recruiters must follow, including medical examinations (Figure 54). The three methods are: (1) direct employment by a company (or individual in the case of foreign domestic helpers); (2) indirect employment by a company or individual through a recruitment agency; and (3) through outsourcing companies. When recruitment is done by the employer or by a recruitment agency, it must follow an established process. After entering the country, foreigners must get a medical examination by the Foreign Workers Medical Examination Monitoring Agency (FOMENA), and parallel to the FOMEMA examination at the point of entry, a local bank account needs to be opened for the foreign worker for payment of wages. For construction companies, a green card must be obtained for all workers on construction sites. Upon approval of the medical examination, the worker is placed with the employer who has an obligation to house the worker and provide him with accommodation and other facilities. Renewal of the Visitor Pass (Temporary Entry) is carried out yearly and foreign workers must undergo medical check-ups before their visas can be renewed. In the case of foreign domestic workers, or in certain exceptional cases, an application for renewal of VPTE may be considered beyond the five-year maximum period. In such cases, foreign workers must undergo and pass skills courses set by various government bodies relevant to their sector and pass medical examinations as part of the renewal process. The relevant bodies
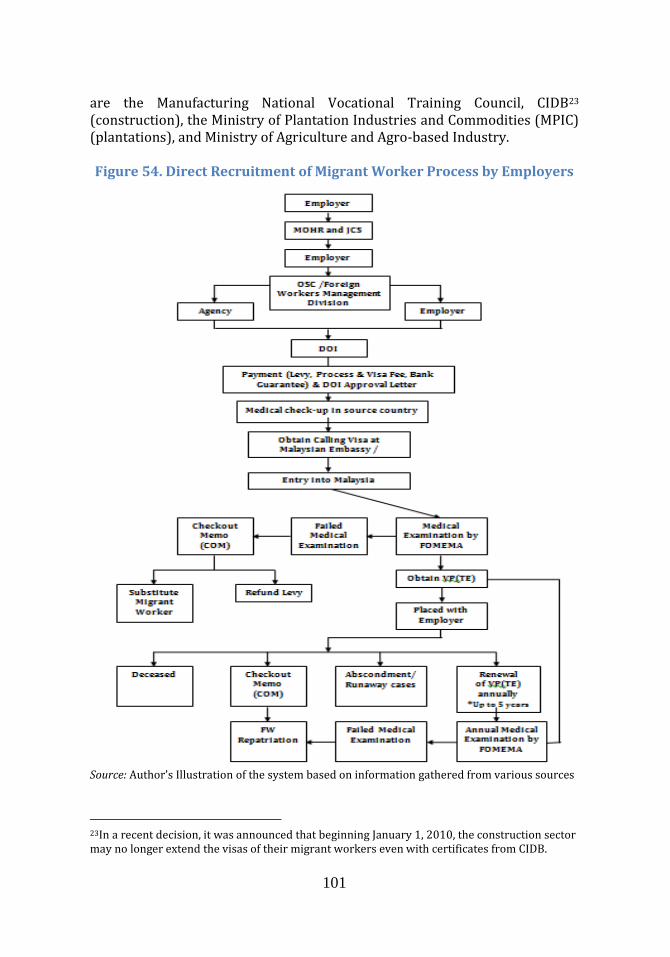
101
are the Manufacturing National Vocational Training Council, CIDB23 (construction), the Ministry of Plantation Industries and Commodities (MPIC) (plantations), and Ministry of Agriculture and Agro-based Industry. Figure 54. Direct Recruitment of Migrant Worker Process by Employers
Source: Author’s Illustration of the system based on information gathered from various sources
23In a recent decision, it was announced that beginning January 1, 2010, the construction sector may no longer extend the visas of their migrant workers even with certificates from CIDB.
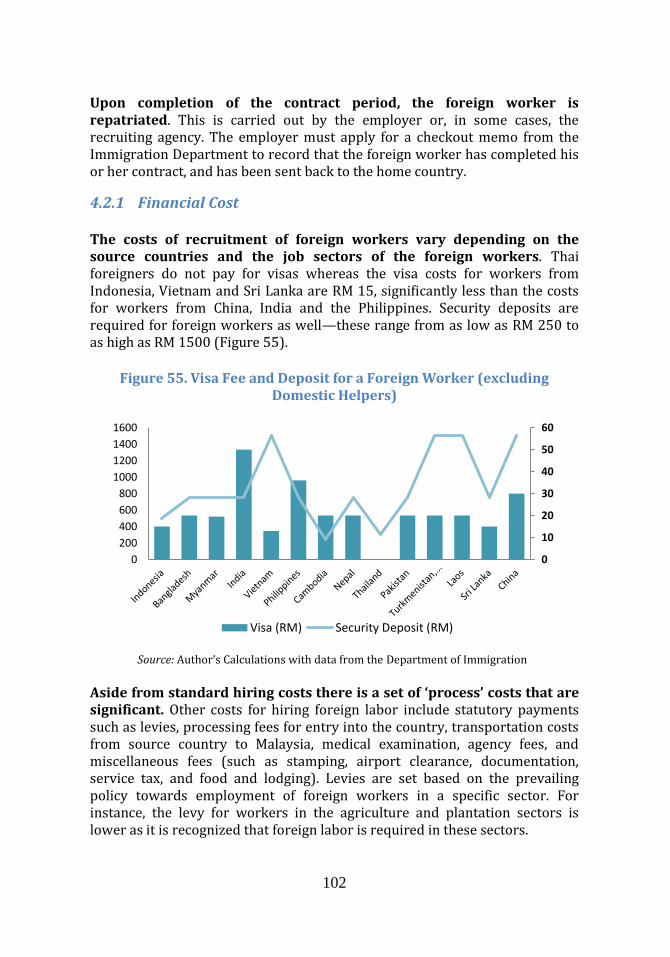
102
Upon completion of the contract period, the foreign worker is repatriated. This is carried out by the employer or, in some cases, the recruiting agency. The employer must apply for a checkout memo from the Immigration Department to record that the foreign worker has completed his or her contract, and has been sent back to the home country.
4.2.1 Financial Cost The costs of recruitment of foreign workers vary depending on the source countries and the job sectors of the foreign workers. Thai foreigners do not pay for visas whereas the visa costs for workers from Indonesia, Vietnam and Sri Lanka are RM 15, significantly less than the costs for workers from China, India and the Philippines. Security deposits are required for foreign workers as well—these range from as low as RM 250 to as high as RM 1500 (Figure 55).
Figure 55. Visa Fee and Deposit for a Foreign Worker (excluding
Domestic Helpers)
Source: Author’s Calculations with data from the Department of Immigration
Aside from standard hiring costs there is a set of ‘process’ costs that are significant. Other costs for hiring foreign labor include statutory payments such as levies, processing fees for entry into the country, transportation costs from source country to Malaysia, medical examination, agency fees, and miscellaneous fees (such as stamping, airport clearance, documentation, service tax, and food and lodging). Levies are set based on the prevailing policy towards employment of foreign workers in a specific sector. For instance, the levy for workers in the agriculture and plantation sectors is lower as it is recognized that foreign labor is required in these sectors.
0
10
20
30
40
50
60
0
200
400
600
800
1000
1200
1400
1600
Visa (RM) Security Deposit (RM)

103
Many foreigners pay fees upfront to work in Malaysia; these fees are often paid to the agents in their respective countries. It is difficult to ascertain the costs that workers pay to immigrate to Malaysia. On average, estimates of upfront fees paid by foreign workers to recruitment agencies in the source countries vary from RM 5,000 for domestic workers from Indonesia (Figure 56) to over RM 10,000 for Bangladeshis in the service sector. In cases where workers pay the full cost of recruitment they are able to receive their pay as soon as they complete a month’s work. However, for those that did not pay anything or only a paid a portion of the cost, monthly deductions are made from their salaries to cover the cost.
Figure 56. Recommended Costs for the Recruitment of Indonesian Domestic Helpers
Note: There may have been changes to the amount in the last year. Annex 4 contains a more detailed Table. Source: Adapted from the MOU between the Government of Malaysia and the Government of the Republic of Indonesia, 2006.
In some cases, bilateral memorandums of understanding signed between Malaysia and source countries provide cost guidelines for the recruitment of foreign workers. In other cases, institutions overseeing the sector provide guidelines. The recommended cost structures for the recruitment of domestic workers from Indonesia were laid out in the 2006 government-to-government (G2G) memorandum of understanding (MOU). But the costs outlined in the MOU serve as a guideline and do not bind legally. While the MOU set the total recruitment costs in Indonesia at RM 3,070, actual costs are often higher. In the case of Indonesian domestic helpers, the Malaysian employers pay an upfront fee of RM 6,415 (RM 4,000 plus RM 2,415
Transport costs total, 600
Levy, 360
Processing fee, Visa, work pass, med exam MYS, 275
Transport costs total, 120
Other processing fees, 1280
Travel, Passport Fees, Visa, 170 Government Levy,
150
Medical exam in IDN, 190
Training, orientation,
300
Accommodation (30 days), 250
Food (30 days), 250
Competency exam, 110
Insurance, 400
Fee for IDN Agency, 1,150

104
which is the cost set for Malaysia). Of this amount, RM 2,700 is ultimately borne by the Indonesian domestic helpers through salary deductions. In other words, the Malaysian employers pay the full recruitment costs in Malaysia (RM 2,415) and part of the recruitment cost in Indonesia (RM 1,300). Recruitment costs for foreign workers in the construction sector are easier to determine, as the agency overseeing it, CIDB, has set up the Construction Labor Exchange Centre Berhad (CLAB), which operates as the outsourcing company for the construction industry. The cost breakdown shows that the cost of hiring foreign workers in Malaysia is not cheap. Excluding all other costs (such as recruitment fees to agents in the home countries) an Indonesian foreign worker costs RM 1,652 to be hired. According to the Malaysian American Electronics Industry (MAEI), there is a misconception that companies pay lower salaries to the foreign workers compared with Malaysian workers. And as a result of this misconception, employers hire foreigners instead of Malaysians. In reality, however, MAEI data show that the cost of a foreign worker is actually higher than that of a local worker, after taking into account all other costs involved in the hiring of a foreign worker. According to MAEI, the average cost of hiring a local worker in the manufacturing sector is RM 1,319.97 (excluding salaries which could be the same) as compared to RM 1,652.21 for an Indonesian foreign worker. In spite of the cost, employers in the manufacturing sector prefer to employ foreign workers to ensure stability in the supply of workers; foreign workers are committed for at least two years and generally will not leave once they are well-trained.
4.2.2 Indirect Costs
4.2.2.1 Compulsory Workmen Compensation Costs It is mandatory for every employer to insure all foreign workers employed by the company. Employers must insure their foreign workers with an approved insurance scheme to cover any liability that may be incurred due to the foreign worker. This is stated in the Amended Workmen’s Compensation Act 1952 (Under Section 26(2)). Moreover, since 2011, all employers are now obligated to make sure that all foreign workers have valid health insurance; the premium can be paid by the employer or worker (except for domestic help, for which employers must pay for premiums). Any employer who fails to insure the foreign workers under the said scheme is guilty of an offence and is liable, on conviction, to a fine (not exceeding RM 20,000) or to imprisonment for a term not exceeding two years, or both. Employers are required to provide insurance coverage for each foreign worker against accidental death, temporary or permanent disablement,

105
to avoid passing on the costs to the Government. The cost of this insurance is RM 72 per worker per annum, and must be from an approved provider. Under the scheme the employer is required to pay for the workers’ medical and rehabilitation expenses. This insurance is meant to avoid passing healthcare costs of foreigners to the Government. It has been reported that an amount of RM 18 million is owed by employers to public hospitals from treatment provided to foreign workers that were not covered by health insurance (The Star, November 25, 2010). In the event of employment injury leading to permanent disablement, the compensation for a foreign worker is capped at RM 23,000, varying with the age of the worker. This differs from the permanent disability benefit of local workers who are entitled to 90 percent of their daily wages under the Social Security Organization (SOCSO) and death benefits.
4.2.2.2 Compulsory Medical Examination Mandatory health screenings of all foreign workers coming in legally to Malaysia are strictly enforced to prevent medically compromised workers from coming into the country and burdening the public health system. In 1997, the Government of Malaysia awarded the concession to Foreign Workers Medical Examination Monitoring Agency (FOMEMA), a private company, to implement, manage and supervise a nationwide mandatory health-screening program for all legal foreign workers in Malaysia. The objectives of the concession are to ensure that foreign workers are free of an identified list of communicable diseases (TB and Hepatitis B being the chief amongst them) and to ensure that Malaysian public health facilities are not burdened by foreign workers with medical conditions or diseases that require prolonged and extensive treatment. Currently, fees for the medical examinations of female migrant workers are RM 190 per person, and male workers RM 180 per worker. Medical professionals manage screenings by FOMEMA. Migrant workers are required to undergo FOMEMA’s health screening at the point of entry and annually thereafter, in order for the DOI to process/renew the VP (TE) of these workers. The system is centralized with a standardized medical examination based on a Ministry of Health approved format and criteria. The employer can choose the medical practitioner to conduct the medical examination for his migrant worker from a pool of registered doctors on FOMEMA’s panel. Medical reports from these doctors with the relevant lab results are submitted independently to FOMEMA via electronic medium. These results then form FOMEMA’s centralized database that is transmitted to the DOI and is accessible to the Ministry of Health.

106
Millions of foreign workers have been examined since the examination began, and thousands have been turned away or deported due to various medical conditions. Up to August 2003, a total of 2.7 million foreign workers had been medically examined through FOMEMA. FOMEMA’s database shows that the number of foreign workers infected with tuberculosis had increased alarmingly and amounted to 1,278 persons in 2002 compared to only 21 persons in 1997. The numbers for Hepatitis B were 4,505 persons in 2002 (1997: 124 persons). The situation in Sabah is much more serious where migrants accounted for 24.5 percent of total patients infected with tuberculosis, 49.3 percent with cholera and 35.4 percent with malaria in 2001 (Sabah Health Department). Those who failed their medical tests were deported and their work permits revoked. Due to the unreliability of medical tests carried out in the home countries, it is now mandatory for all foreign workers to undergo another medical examination within a month of arrival in Malaysia.
4.2.2.3 Employer Provident Fund (EPF) Act 1991 The EPF Scheme is not made compulsory for foreign workers; however, if workers chose to contribute the employer must make the appropriate contribution as well. If a foreign worker chooses to contribute to the scheme, he/she may do so at the minimum rate of 11 percent of his/her wages. The employer’s contribution depends on when the worker elected to contribute to the EPF; if the worker elected to do so before August 1998, the employer is required to contribute a rate that is similar to that of a local worker, namely 12 percent of the wages. Conversely, if the foreign worker elected to contribute after August 1998, the employer is required to contribute only RM 5.
4.2.2.4 Workers Minimum Standard Housing and Amenities Act 1990
The Policy adopted in 1991 on recruitment of foreign workers sets out that employers must make available clean and hygienic housing to the migrant workers they employ. The Workers Minimum Standard Housing and Amenities Act 1990 sets out the minimum standards of housing for workers in the plantation and mining industries. It requires the employers to provide housing benefits according to minimum legal specifications. For other industries, housing must be given in accordance with the standards set by the local authorities. Due to lack of effective enforcement by the Department of Labor (DOL), and since housing conditions are matters within the purview of local councils, the foreign workers’ accommodation standards tend to vary greatly. Complaints of overcrowding and lack of basic amenities are the norm in foreign worker accommodations.
107
4.2.2.5 Indirect Employment (Outsourced Companies) Companies hiring less than fifty migrant workers are required to use labor outsourcing firms to supply foreign workers. Currently, there are 241 outsourcing firms that have been licensed by MOHA. Having to use outsourcing firms imposes a new cost to employers. The main issues regarding the use of these outsourcing firms are that the control and management (as well as responsibility) of the foreign workers moves from the employers to the outsourcing firms. As such, the employers’ responsibilities to ensure that conditions of work and treatment of foreign workers are in compliance with national labor laws are watered down. The outsourcing firms on the other hand may make decisions on the instructions of the employers or act in collusion with employers in taking decisions pertaining to the employees. This problem is made more severe by ineffective monitoring procedures by DOL of the workplaces of migrant workers. For example, though Malaysia is a party to the Labor Inspection Convention, inspections of workplaces in the manufacturing sector are noted to have declined by 45 percent from 2006 to 2007 and 78 percent from 2007 to 2008. (Devadason, 2011). Such inspections of workplaces hiring foreign workers are meant to protect the safety and wellbeing of the foreign workers and to ensure compliance with national labor laws.
4.2.3 Welfare of immigrants
4.2.3.1 Workplace Injury and Protection Employers must pay Workmen’s Compensation for foreigners at a lower rate than for Malaysian workers. The latter are covered for health expenses resulting from injuries by both the Employees’ Social Security Act 1969 (SOCSO) scheme as well as Workmen’s Compensation while migrant workers are only entitled to Workmen’s Compensation; this often results in substandard treatment of migrant workers. An injured Malaysian worker may be protected under SOCSO and the compulsory insurance scheme under the Workmen’s Compensation Act 1952. With effect from September 1, 1993, the SOCSO scheme only covers Malaysians whilst foreign workers come under the Workmen’s Compensation Act. An employer is required to pay RM 72 per annum towards the insurance for each foreign worker. The lower premium provides benefits that are inferior to those provided under SOCSO scheme to local workers. For example, in the case of an injured local worker, he/she is entitled to free treatment at a SOCSO panel clinic or at any government hospital or clinic and the medical bill is settled by SOCSO. Under the Workmen’s Compensation Scheme, the employers of foreign workers are required to pay for the workers’ medical expenses. This in turn opens the foreign workers to possible abuse, as the employers may not pay for the
108
required treatment. In addition, a local injured worker who has been certified as unfit for work for at least four days is entitled to temporary disablement benefit equivalent to 80 percent of his/her wages (subject to minimum of RM 10 and maximum of RM 78 per day). Foreign workers who suffer temporary disablement are only entitled to half-monthly payments of a third of their monthly wages, or RM 165 per month, whichever is lower. Moreover, a local with permanent or total disablement is entitled to 90 percent of his daily wages subject to a minimum of RM 10 and a maximum of RM 88. If a foreign worker is permanently disabled his maximum compensation is RM 23,000. As of January 2011, the Malaysian Government made it compulsory to buy health insurance coverage for migrant workers. The objective of this policy was to improve the healthcare coverage and benefits for migrant workers apart from overcoming the problem of increasing unpaid hospital bills incurred by employers at the public funded hospitals. A report from the Prime Minister’s office states that 50 percent of the 3.1 million foreign workers are uninsured and those insured are under-covered (PEMANDU, 2012). About RM 64 million in bills incurred by foreigners at government hospitals have been unpaid over the past five years. Under the new health insurance scheme, it is mandatory for all foreign workers to have the Hospitalization and Surgical Scheme by June 2012. The annual premium of RM 120 is to be paid by employers for domestic helpers. The premiums for workers in all other sectors can be paid by either employers or employees. This scheme provides hospitalization and medical benefits at government hospitals to foreign workers with coverage of RM 10,000 per year for all injuries and sickness. A total of 25 insurance companies and two third party claims administrators are participating in this scheme.
4.2.3.2 Minimum Wage The recent introduction of the minimum wage in Malaysia makes it compulsory for employers to pay all workers, foreign and local, a minimum amount of wages for their labor. Basic allowances and all fixed cash payments payable to the worker will form part of the worker’s wage. Malaysia has gazetted its first minimum wage order for private sector employees on July 1, 2012. The minimum wage order is extended to foreign workers in all sectors with the exception of domestic workers such as maids and gardeners. Employers are given until the beginning of 2013 to comply with the requirement to pay minimum wages of RM 900 per month for Peninsula Malaysia workers and RM 800 for those in Sabah and Sarawak. Companies and employers with fewer than five workers, and designated microenterprises, will be given twelve months to comply with the requirement. Implementation of this minimum wage order must be carefully observed in order to prevent recalcitrant employers from evading the

109
minimum wage order. At the same time, the Minister of Human Resources had, on April 30, 2012, announced that a Minimum Wage Implementation Committee would be formed to finalize implementation of the new policy.
4.2.3.3 Equality in Treatment and Enforcement of Laws The laws, as written, extend equal protection and treatment to local and foreign workers; however, the application of the law remains unequal. Some of the provisions outlined in the specified labor legislations, such as the Employment Act 1955, Workmen’s Compensation Act 1952, Industrial Relations Act 1967, and Trade Unions Act 1959, though having adequate protection for local workers, do not extend the same protection to foreign workers in reality. This is in spite of the policy and the express legislative provisions that foreign workers ought to be treated alike as local workers. Foreign workers face genuine obstacles in accessing justice, for instance, in filing complaints for breach of terms and conditions of contract of employment including health and safety, unlawful deduction of wages, and issues of unfair dismissal. There is also a restriction on foreign workers’ right to freedom of association or participating in labor organizations due to the regulations set by MOHA. Malaysia is a signatory of international conventions to protect the rights of all people, including immigrants. Malaysia is a signatory to the UN Convention on Elimination of Discrimination Against Women (CEDAW), the UN Convention on the Rights of the Child (CRC), and has ratified five of the eight core ILO Conventions. Malaysia is also a member of the UN Human Rights Council. It is also a signatory to the ASEAN Declaration on the Protection and Promotion of the Rights of Migrant Workers, adopted by ASEAN in January 2007. Article 8 of the ASEAN Declaration on the Protection and Promotion of the Rights of Migrant Workers states that governments shall “promote fair and appropriate employment protection, payment of wages, and adequate access to decent working and living conditions for migrant workers.” Thus, as a signatory, Malaysia is bound to abide by these international conventions.
4.2.3.4 Training and Skills Upgrade Employers are encouraged to train their foreign workers as a means to improve productivity and potentially extend their tenure in the country. There is a greater awareness of the importance of extending skills training for migrant workers. If employers can provide evidence that their foreign workers are skilled they can extend the tenures of employment of the foreign workers beyond the ‘3+1+1’ ruling system. The extension of each foreign worker is reviewed on a case-by-case basis. Foreign workers with certain

110
skills or levels of competence can be certified by the National Vocational Training Council or by CIDB. Certified foreign workers may be allowed to work up to ten years in the construction industry.
4.2.3.5 Social Security The Employment Provident Fund (EPF) scheme is not compulsory for foreign workers although they can choose to contribute 11 percent of their wages into the scheme. As stated in the previous section, the Employee’s Provident Fund Act of 1991 provides retirement funds for workers in Malaysia. Contributions to the fund are compulsory for all local workers. The contribution rates are 12 percent of an employee’s monthly earnings to be made by the employer and 11 percent by the employee. The rate of the employer’s contribution for foreign workers since August 1, 1998 has been limited to RM 5. Thus for a foreign worker, the EPF scheme functions solely as a forced savings unlike that for a Malaysian worker. Further, a migrant is not allowed to make a nomination under the EPF Act, essentially depriving his/her dependents the right to claim the contributions made by and on behalf of the foreign worker.
4.2.3.6 Industrial Relations Act 1967 (IRA)/Trade Unions Act 1959(TUA)
The provisions of IRA and TUA make it possible for foreign workers to join labor unions and participate in their lawful activities. However, in practice this is nearly impossible. TUA requires that union officers be Malaysian citizens, which effectively disqualifies foreign workers. In addition, MOHA imposes (as a pre-condition to issue work permits to foreign workers) that they must not join any sort of association, effectively preventing membership of trade unions. Consequently, foreign workers are reluctant to participate in labor unions and their activities for fear of reprisals.
4.3 Governance
Major administrative and legal weaknesses in the implementation of the migrant workers policy led to an overhaul of the recruitment infrastructure and procedures in 2005. The overhaul led to a new set of reform measures. The Cabinet Committee on Foreign Workers (CCFW) and Illegal Workers expanded its functions. It is the main body responsible for the formulation of policy measures and monitors their implementation, their review and amendments. This committee is chaired by the Deputy Prime Minister of Malaysia and its members comprise representatives from 13 related Ministries: MOHA, MOHR, Ministry of Public Works, MITI, Ministry of
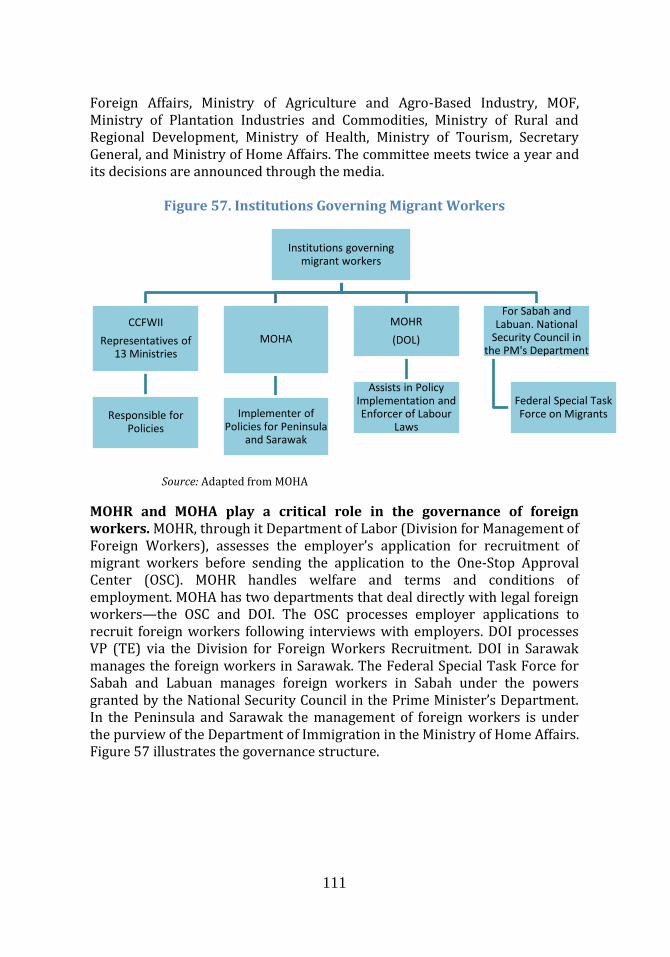
111
Foreign Affairs, Ministry of Agriculture and Agro-Based Industry, MOF, Ministry of Plantation Industries and Commodities, Ministry of Rural and Regional Development, Ministry of Health, Ministry of Tourism, Secretary General, and Ministry of Home Affairs. The committee meets twice a year and its decisions are announced through the media.
Figure 57. Institutions Governing Migrant Workers
Source: Adapted from MOHA
MOHR and MOHA play a critical role in the governance of foreign workers. MOHR, through it Department of Labor (Division for Management of Foreign Workers), assesses the employer’s application for recruitment of migrant workers before sending the application to the One-Stop Approval Center (OSC). MOHR handles welfare and terms and conditions of employment. MOHA has two departments that deal directly with legal foreign workers—the OSC and DOI. The OSC processes employer applications to recruit foreign workers following interviews with employers. DOI processes VP (TE) via the Division for Foreign Workers Recruitment. DOI in Sarawak manages the foreign workers in Sarawak. The Federal Special Task Force for Sabah and Labuan manages foreign workers in Sabah under the powers granted by the National Security Council in the Prime Minister’s Department. In the Peninsula and Sarawak the management of foreign workers is under the purview of the Department of Immigration in the Ministry of Home Affairs. Figure 57 illustrates the governance structure.
Institutions governing migrant workers
CCFWII
Representatives of 13 Ministries
Responsible for Policies
MOHA
Implementer of Policies for Peninsula
and Sarawak
MOHR
(DOL)
Assists in Policy Implementation and Enforcer of Labour
Laws
For Sabah and Labuan. National
Security Council in the PM's Department
Federal Special Task Force on Migrants

112
4.3.1.1 Foreign Worker Management Division The Foreign Worker Management Division was formed to expedite and simplify the application approval process for intake of foreign workers according to approved sectors. This unit is housed in MOHA and it is expected to facilitate the application process. The client charter of the division states that the division shall issue a decision on the application for intake of foreign workers on the same day that the completed application is received. An undersecretary of MOHA heads the Division. The Foreign Worker Management Division also acts as the secretariat of the Foreign Worker OSC agency. The division comprises several units: (1) Application and Processing Unit, (2) Policy and Bilateral Negotiation Unit, (3) Inspection and Complaint, and Outsourcing Unit, and (4) Information System and Administration Unit.
4.3.1.2 Job Clearing System (JCS) JCS was set up to ensure that employers observe state rulings that locals are not discriminated in favor of foreign workers. MOHR formulated JCS to facilitate prospective employers in seeking local workers before employing foreigners. Procedures to bring in migrant workers begin at DOL where prospective employers are required to apply for permission to recruit migrant workers. The application is processed only if there is proof that attempts were made to recruit local workers and proved unsuccessful. The application is also put through JCS and advertised in local media. If that too fails to get positive responses from the locals, permission is given to the applicant to recruit migrant workers.
4.3.1.3 Foreign Worker One Stop Approval Agency (OSC) OSC handles applications for intake of foreign workers for sectors that have been approved following an employer’s failure to secure local workers and to ensure that the optimal amount of foreigners are imported. OSC was set up in 2005, replacing a previous body with similar mandates. Through the OSC, applications for migrant workers that satisfy all the conditions stipulated by the Government are processed and decisions made within the same day. Members of the OSC Panel comprise representatives from MOHA, DOL, MITI, Ministry of Plantation Industries and Commodities, Ministry of Agriculture and Agro Industries, and (CIDB). Before submitting an application for foreign worker intake, an employer must obtain confirmation from DOL (in Peninsula Malaysia) that the employer has used the services of JCS to try to obtain local workers. OSC interviews prospective employers who have obtained the certification of approval from DOL to recruit migrant workers. The purpose is not only to simplify foreign workers recruitment procedures and reduce processing time, but also to provide a
113
second layer checking mechanism to ensure that only the optimum numbers of foreign workers are permitted. Once approved by OSC, the employer is required to make the levy payment within 48 hours, after which a conditional letter of approval is issued to the employer to recruit migrant workers.
4.3.1.4 Outsourcing Agencies Employment contracts of foreigners used to be sector and employer specific, which led to various flaws in the system; the outsourcing method was in place to address some of these flaws by allowing the movement of workers across employers and sectors. Foreign workers who became redundant due to downsizing by the employers or early completion of projects could not be transferred to other sectors facing labor shortages. They were required to return home instead; many chose to stay in Malaysia and seek other employment, thus joining the pool of irregular workers. The outsourcing method came into place. Outsourcing agencies supply and manage foreign workers. They contract out foreign workers to the end user, a company or an individual employer. This system allows indirect employment of foreign workers by a company/employer who pays the outsourcing agency for the workers’ services. The outsourcing agency is responsible for the workers’ wages, housing, other benefits and their general welfare and should the workers become temporarily unemployed, the agency must give them RM 400 a month for their upkeep. The new method of recruitment has financial benefits to employers and the economy, but it is not without critics, on the grounds of potential violation of human rights. Amnesty International found that workers brought in with promises of secure employment under outsourcing arrangements spent prolonged periods without jobs and pay. Initially, about 400 outsourcing agencies were registered but due to inactivity or abuses the number was reduced. Currently 241 outsourcing companies are licensed by MOHA. These companies are allowed to supply and manage foreign workers only for the manufacturing, plantation and agriculture sectors with effect from January 2010. Foreign worker intake applications by outsourcing companies must be based on the actual requirements of the principal companies. Foreign worker intake applications for the agriculture sector need to be accompanied by a set of necessary documents.
4.3.2 Immigration Policies, Laws and Regulations The Employment Act (EA) 1955 was amended to include provisions to protect local workers from potential effects of immigrants, and foreigners from abuse. The EA 1955 is the main legislation that applies to
114
employees in the Peninsula24 and the Federal Territory of Labuan earning a salary not exceeding RM 2,000 per month, and all manual workers as well. In 1998, the Employment (Amendment) Act 1998, introduced a new Part XII B titled ‘Employment of Foreign Employee’ in the Employment Act 1955. This amendment contains five provisions that are designed to largely protect local employees from being discriminated by employers in favor of migrant workers. At the same time, two new sections for the protection of foreign workers were added in this amendment: Section 60K “Duty to furnish information of migrant workers to the DOL” and Section 60L “Power of Director General of Labor to inquire into complaints from migrant workers”. Policies to regulate the import of labor have evolved over the years, influenced by a number of socio-economic and political factors. Among the main factors that have influenced change in the policy in Malaysia are: labor market imbalances, pressure from labor and human rights organizations, national security and foreign relations, high incidence of irregular migration, and legal and social infractions by immigrants. In general, labor migration policies aim to control and regulate the import of foreign workers, reduce clandestine or irregular migration, and protect the rights of foreign workers. Annex 4 shows the chronology of the main changes to immigration policy since 1980 until today. The management of immigration is largely influenced by objectives to control and regulate the inflow of immigrants, reduce irregular immigration, and protect Malaysians from cheap foreign labor. Some of the efforts to control foreign labor flows include the establishment of recruitment agencies and signing of bilateral agreements with specific countries. The imposition of levies and need for work permits make the hiring of foreigners more costly for employers, thus reducing incentives to over-hire immigrants. There have also been freezes or bans on specific types of workers to prevent them from competing with Malaysians. The ultimate policy to protect Malaysian workers is the ‘Malaysian First’ policy, which forces employers to make every effort to find a Malaysian for the job, prior to recruiting a foreigner to do the work. The Government has also put in place regularization programs, embarked on ‘security’ operations (an example is Ops Nyah I and II), implemented the use of biometric cards, and enhanced legal penalties for employers of irregular foreigners (Kanapathy, 2006). Authorities continue to grapple with the dual objective to encourage legal recruitment of migrant workers and reduce the number of
24 The applicable act in Sabah is the Sabah Labour Ordinance and Sarawak, Sarawak Labour Ordinance. The wage threshold in these two states is RM 2,500 per month to determine the scope of persons falling under the purview of the Employment Ordinances.

115
irregular immigrants. To achieve the first objective, CCFW developed guidelines for recruitment and employment of foreign workers which included general conditions under which foreign labor could be engaged, identified the economic sectors and jobs which may employ foreign workers, identified source countries and recruitment procedures and costs from each of these countries, outlined particulars about job tenure, and outlined the eligibility and rights and responsibilities of foreign workers and employers. Tackling the second objective of reducing the numbers of irregular foreigners proved to be more challenging. Programs such as border surveillance and control, arrests and deportation of irregular foreigners were put in place.
4.3.3 Recent Changes and Policy Reforms (2000s–Present)
4.3.3.1 Amendments to the Employment Act 1955 A Special Pass was put in place to allow foreign workers with standing complaints against their employers to stay on in Malaysia while they waited for their cases to be heard. Although the Employment Act (EA) advocates equal treatment for all workers, the enforcement of the legal rights of foreign workers is seen to be weak in Malaysia. When documented foreign workers take complaints to the Director General of DOL under Section 60L of EA, they often face harassment from their employers in the form of threats of dismissal or termination of employment. As termination of employment causes the VP (TE) to be revoked, which in turn results in the legal status of the foreign worker becoming affected. Many foreign workers are reluctant to complain against their employers even when they are made aware of their rights. The DOI put in place a provision for a Special Pass to be issued to migrant workers who have pending complaints against the employers at MOHR (either at DOL or the Industrial Relations Department) or while waiting for their cases to be heard by the relevant authorities. This Special Pass is issued on monthly increments at a fee of RM 100 per month. However, the Special Pass prohibits the workers from seeking other employment; due to this and the time taken in disposing the complaints by the authorities, the foreign workers are often left without any recourse. This does not apply to domestic workers, who are not covered by the EA.
4.3.3.2 Levy Readjustment The cost of levy was readjusted again to discourage employers from engaging migrant workers in some sectors. Since September 2011, levies for foreign workers have been increased again by RM 50, across all sectors. While the levies for other sectors remained constant, those for the services and plantation sectors were increased. The levy for services was

116
increased to RM 1,800 in 2005, except for workers in welfare homes (RM 600) and island resorts (RM 1,200). In the same year, the levy for plantation sector workers was raised to RM 540 from RM 360 (Figure 58). For domestic helpers, the increase only affected employers who engaged more than one domestic helper. They had to pay more, about RM 540, for the second and subsequent helpers hired.
Figure 58. Cost of Levies for Foreign Workers in the Peninsula, Sabah and Sarawak
Source: Adapted using data from MOHA
Foreign levies for workers in the Peninsula have increased dramatically over time. With this most recent change to the levies payable by employers, the levy system has undergone changes at least half a dozen times since it was introduced in 1991 (Figure 59). Levies in the services sector have had the highest increase, from RM 360 to RM 1850 in 2011. Both manufacturing and construction have also seen a dramatic increase over time, currently at RM 1250 compared to RM 400 in 1991. During the Asia crisis however, levies for these two sectors were higher than they are today. The increase was purposely done to deter new foreign hiring during an economically difficult time in the region.
0 500 1000 1500 2000
ManufacturingConstruction
PlantationAgricultureRestaurant
Cleaning ServicesCargo handling
LaundryCaddyBarber
Retailing and whole selling Textile Merchant
Scrap ironWelfare Homes
Resort IslandOthers (Special approval)
First Domestic HelperSecond Domestic Helper
Sabah/Sarawak New
PeninsulaMalaysia New

117
Figure 59. Changes in Foreign Worker Levy in the Peninsula from 1991 to 2011 (Sept.)
Source: Adapted using data from Devadason 2011
4.3.3.3 The Anti-Trafficking In Persons Act, 2007 The Anti-Trafficking in Persons Act, passed in Parliament in 2007, was put in place to prevent trafficking activities, protect and provide shelter for trafficked victims, and prosecute traffickers. The Malaysian Council for Anti-Trafficking in Persons is responsible for policy measures and guidelines. The implementing agencies are the Royal Malaysian Police; Customs; Malaysian Marine Enforcement Agency; Immigration Department; the Attorney General’s Office; DOL; the Ministry of Women, Family and Community Development; Ministry of Information, Communications and Culture; and NGOs. Until June 2009, the focus of anti-trafficking activities was on exploitation of women and children for sexual purposes and the trafficking of children. Attention on migrant workers began only in the second half of 2009 when the USA based USCRI (United States Committee on Refugees and Immigrants) downgraded Malaysia’s position in their ranking from Tier 2 to Tier 3 (the worst level) in its Anti Trafficking Report for 2006. Since then many preventive acts and reforms have been carried out, and attempts have also been made to rescue and provide shelter to migrant workers who have been trafficked and exploited, and to prosecute the perpetrators. However, assistance to exploited migrant workers are constrained by several factors, chief among these being the shortage of funds and infrastructural facilities (such as shelter homes), and the lack of experience and training in dealing with labor trafficking on the part of policy implementers. Most migrant
0
200
400
600
800
1000
1200
1400
1600
1800
2000
1991* 1995 1998 1999 2005 2011
Manufacturing (RM)
Construction (RM)
Agriculture (RM)
Services (RM)
Domestic Workers (RM)
Plantation (RM)

118
workers are also unaware that some of them are in fact victims of trafficking and that there is space and opportunity for remedy.
4.3.3.4 Proposed Foreign Workers Act There is no comprehensive law or agency that deals with foreign workers’ affairs. Thus, a Foreign Workers Act is being considered so that there is a singular law to establish and address all aspects relating to foreign labor. In this regard, a comprehensive law was mooted in the past by the stakeholders and was drafted by the Malaysian Government, but the draft was not shared with the public although the concept of writing a comprehensive law has broad support among NGOs, trade unions, and employers groups. However, the Minister responsible for the Law has recently (May 2012) announced that the Government is exploring the possibility of enacting a Foreign Workers Act to manage the four million migrant workers in Malaysia as they make up a large share of the country’s population and policies can no longer be made ad-hoc as and when they crop up. The Minister has proposed to study the experience of other countries. Currently, no further information is available on the proposed Act and it is unclear whether the Minister was referring to the previously drafted legislation or if the Government is tackling the proposal freshly.
4.4 Enforcement and Regularization
For the most part, MOHA is in charge of the enforcement of immigration laws. MOHA was split into the Ministry of Internal Affairs and Ministry of Internal Security in 2004. As a result, the Police and the Immigration Departments were placed in two separate ministries. This, in turn, affected the implementation of ongoing exercises to deal with enforcement because it split the Enforcement Division in the Immigration Department and the Royal Malaysian Police, two close collaborators in rooting out irregular immigrants. To address the problem, the role of the police was taken over by the volunteer people’s corps (or RELA in Malay) which was given power to carry arms (when authorized by a competent authority), to stop, search and arrest undocumented foreign workers. Initially, RELA was given cash rewards of RM 80 for every undocumented foreign worker who was apprehended. After severe criticism by various parties, including international NGOs such as Amnesty International, RELA’s powers for arresting migrant workers were disbanded temporarily. However, in a recent statement, the Secretary General of MOHA has said that four million personnel, including 2.8 million RELA members, would be mobilized by the Government to track down irregular foreigners who failed to register/legalize themselves under a new regularization program (the 6P program).

119
Apart from MOHA, MOHR and a special task force on immigration, there are specific agencies dealing with preventing (curtailing) violations and irregular immigration. A lot of resources are spent to detect, deport and punish irregular foreigners and their employers. Foreign worker detection and deportation is under the purview of the General Operation Force (border patrol), Marine Operation Force, Malaysian Maritime Enforcement Agency, Enforcement Division of DOI, Royal Malaysia Police, and the National Registration Department. Enforcement of the law has been challenging for many reasons. One such reason is that in the past employers were not punished for hiring irregular immigrants. The law has now changed, and employers are also liable. Being employed without a valid Employment Pass in Malaysia is an offence. Offenders are subject to fines ranging from RM 10,000 to RM 50,000 or imprisonment for a term not exceeding 12 months or both. More recently, employers also became liable for employing irregular workers. The law says that the company that employs foreigners without valid Employment Passes (or its representative) may be imposed an imprisonment sentence of six months to five years and whipping of not more than six strokes. Forgery or fraudulently altering the Employment Pass or related documents is an offence that, upon conviction, is liable to a fine, imprisonment and whipping. However, the Immigration Act (1959/1963), prior to its amendment in 1998 and 2002, penalized only the undocumented foreigners and not their employers, landlords, labor suppliers, or illicit recruitment agents. The penalty for illegal entry into Malaysia by non-citizens under the Immigration Act (prior to its Amendment) was a fine not exceeding RM 10,000 or jail sentence not exceeding five years or both.25 The maximum penalty was hardly ever enforced. Revisions to the Immigration Act in 2002 were done to make it more effective in curbing the inflow of irregular migrant workers; changes included harsher penalties, including monetary fines and bodily harm. The first of the amendments to the Immigration Act 1959/63 (Act 155) deals with unauthorized entry of foreign workers (introduced in 1998). The amendments increased the penalty on irregular foreigners and employers who hire them, from RM 5,000 to a maximum of RM 10,000 and imprisonment from one to five years if convicted. Under this amendment, illegal entry into Malaysia carried a maximum fine of RM 10,000 or imprisonment not exceeding five years, or both, and mandatory whipping26 not exceeding six
25For more detail see Section 6 and Section 57, Immigration Act 19959/63 & Passport Act 1966 (Act 150) as at 1991. 26In response to a Parliamentary question the Malaysian Government had revealed that 47,914 migrants were convicted between 2002 and 2008 of crimes for which caning could be imposed. Of this total, 34,923 were actually caned (Amnesty International 2010).

120
strokes (Section 6). Female foreigners who were caught were exempted from whipping. Further, those found guilty of harboring or employing irregular migrants were liable to fines of between RM 10,00 and RM 50,000 per employee and imprisonment not exceeding one year. Those found to have hired more than five irregular foreign workers were made liable for mandatory whipping and imprisonment of up to five years. Owners or tenants of buildings found guilty of the above offenses would in the first instance be liable for fines of between RM 5,000 and RM 30,000 or imprisonment not exceeding one year or both for every irregular migrant found on their premises. For repeat offences the fine is increased to between RM 10,000 and RM 60,000 or imprisonment not exceeding two years or both for every irregular migrant. Project owners are also held responsible if irregular migrants are found on their project sites irrespective of whether or not they have hired these workers. Another enforcement challenge faced by enforcement agencies is the regular violation of the restriction to bring dependents to Malaysia or get married to Malaysians. In spite of the policy restrictions to bring dependents into the country as well as the prohibition to marry Malaysians imposed by the authorities, foreign workers (in particular, Indonesians and Filipinos) sent for their family members—wives, young children, siblings, and elderly parents once they had settled in Malaysia. The family members came in legally on tourist visas and overstayed. Some would later join the labor force. Many also found spouses in Malaysia. When children were born, they were not registered for fear of being apprehended and deported. This in turn has created the problem of stateless children, especially in Sabah.
4.4.1 Irregular Immigrants In Malaysia irregular migrants are officially referred to as ‘illegal immigrants’ (Pendatang Asing TanpaIzin or PATI) or ‘illegal workers’ (Pekerja Asing Tanpa Izin) if they are in employment. The two terminologies are used interchangeably in this report. Irregular foreign workers have no legal protection under the law and if arrested, they face detention in foreign detention depots. There are 17 such depots throughout Malaysia with capacity to accommodate about 11,000 inmates. In addition, the illegal foreigners also face prosecution for violating the Immigration Act 1959/63 as well as deportation. Due to their vulnerable position, these categories of migrant workers are open to exploitation and mistreatment. The way in which irregular foreigners come into Malaysia and violate the law varies widely. The irregular foreign category comprises foreign nationals who come clandestinely without any travel documents (also referred to as the undocumented); children born to foreign nationals in

121
Malaysia and whose births have not been officially documented; foreign workers whose work passes have expired; pass abusers and contract defaulters; over-stayers, who may or may not be in the workforce; foreign nationals in possession of false documents or holding genuine documents obtained fraudulently; asylum seekers and refugees as Malaysia is not a signatory to the Geneva Convention on Refugees 1951/New York Protocol 1967; and refugees in Sabah who were granted permission for temporary stay under a special pass, the IMM13 (P) which is to be renewed annually (if the pass is not renewed, the refugees become illegal immigrants). There are at least five reasons why Indonesian workers become irregular. These have to do with costs, length of time, complexity of the process, rigidity of the system, working conditions and employer behavior, and lack of information. Some Indonesian irregular workers say that even though the regular immigration channels are generally safer, the irregular channels are more beneficial, both for themselves and the employers, as they are faster, less expensive and thus more practical. Second, since Malaysian immigration laws place the foreigners with specific employers, the irregular labor migrants using irregular channels have greater freedom to choose their employers and the type of work they do. Third, in cases when foreign workers enter Malaysia as regular migrants, improper working conditions, physical and psychological abuse or non-payment of wages leave the worker with little choice but to leave that particular employer. Thus, forcing him/her to lose his/her legal status as a regular labor immigrant, as the worker’s work permit is tied to the employer. A fourth reason is that the MOU between Indonesia and Malaysia allows for the labor immigrants’ travel documents to be kept by the employers. Leaving an employer, therefore, results in a loss of immigration status and identity documents. A fifth reason is that prospective Indonesian labor foreigners often have little access to information about immigration procedures and working conditions in Malaysia. Lack of information makes them vulnerable to deception and potential trafficking by parties in both Indonesia and Malaysia. In Sabah, where irregular labor is commonplace and increasingly perceived by locals as harmful to their welfare, the local government has embarked on various activities to reduce the quantum of irregular workers. Given the fact that many foreign workers in Sabah have their dependents with them (including stateless children), the size of the irregular foreign population in the state is critical. Consequently, the Federal Government (including Sabah) has undertaken numerous enforcement measures to address the high incidence of irregular immigrants. Activities include strict border control and checking, arrest and deportation of irregular foreigners including those who overstay or misuse their tourist visas,

122
regularization and amnesty programs, imposing of penalties for hiring or sheltering irregular migrants, and encouragement of voluntary repatriation. There are cases where more severe methods have been used to destroy foreign colonies and flush out irregular foreigners to leave the country.
4.4.1.1 Past Initiatives to Regularize Irregular Workers In the 1980s, the Malaysian Government began efforts to regularize foreign workers in Malaysia and reduce the number of irregular workers. Efforts put in place were the formation of the Committee for the Recruitment of Foreign Workers, signing of MOUs with Indonesia and the Philippines, and granting permission to employers to recruit workers from Indonesia, Bangladesh and Thailand in the agricultural and plantation sectors. These efforts were followed by legalizing existing foreign workers in the domestic, construction, services, and manufacturing sectors. In the 1990s, an operation to stop illegal entry by tightening border security with the military and marines was put in place; a second phase with a different approach was later put in place. Ops Nyah 1 used the military to curtail illegal entry, and it came into force in 1992. Ops Nyah 2 was intended to reduce illegal foreigners by detection, detention and deportation. A total of 1.2 million undocumented foreigners were identified under Ops Nyah 1 and Ops Nyah2 between 1993 and 1997. The increase in the number of irregular workers was addressed by the authorities through regularization exercises that were carried out in the Peninsula intermittently in 1996 and in Sabah in 1997. Almost one million unregistered migrants participated in the two exercises and were legalized. Previous exercises were successful in helping to register workers and charging them the necessary fees to work. But they did not provide a permanent solution to the problem of irregular foreigners in the country. Even though more illegal workers came to Malaysia after these programs were in place, the programs succeeded in registering and legalizing irregular foreigners by making them acquire travel documents from their respective embassies/consulates and providing them with VP (TE) upon payment of their levies and other fees to the DOI. In order to retain their status as legal immigrants, the newly registered foreign workers have to renew their work passes annually. Many however, fail to do so simply because they cannot afford the costs involved or live in remote areas far away from DOI. As a result, the number of unregistered foreign workers remains high. Table 12 shows the numbers of foreigners registered in each program (this includes the 6P program presented in the next section).

123
Table 12. Irregular Workers Identified Through Various Initiatives (1992-2011)
Year Ops Nyah
1
Ops Nyah 2 /Ops Tegas
Regularization Amnesty Runaways
1992 483,784
1996 554,941
1997 413,812
1998 187,486
2000 72,528
2002 439,727
Oct 2004-Feb 2005 398,758
2006 129,746 909,473
2007 175,282
2008 (31 Aug. – 31 Oct – Phase 1)*
161,747
2009 (27 July – 31 Oct Phase 2)*
151,090
2010 30,000
2011** 1,303,126
Note: * For Sabah only. **6P Amnesty figures as of August 2011 Source: Azizah Kassim and Ragayah 2011, and MOHA.
A regularization exercise was launched in Sabah in 2008. The program was started in Sabah amidst reports of the increasing number of unregistered foreigners and their attendant problems. The exercise was initially scheduled for six months, in 2008. But due to a lack of response from irregular migrants, it was extended to October 2009. Around 161,747 Indonesian and Filipino undocumented migrants (including their dependents) were regularized27. A special Immigration Court (Mahkamah PATI) was set up in 2005 to expedite deportation cases and ease the backlog of cases and overcrowding of holding centers. The authorities were unable to perform their enforcement tasks of apprehending irregular foreigners and ensuring their punishment, including deportation, due to the huge backlog of such cases in the normal courts. This in turn aggravated the issue of overcrowding in foreign worker holding centers. As a measure to reduce the delay in disposing cases involving irregular immigrants, the Government established the Special Court for Illegal Foreigners or Mahkamah PATI in late 2005. The courts
27
Unpublished data from Special Federal Task Force Kota Kinabalu, November 2009
124
started their operations within the holding centers of apprehended migrants. Sentences are passed against the migrants after summary hearings, often without legal representation.
4.4.1.2 New Initiative to Measure and Regularize Irregular Workers A new initiative known as the 6P program is the Government's latest initiative to better manage immigrants, in particular migrant workers. The number 6 represents six steps in the initiative—registration (Pendaftaran), legalization (Pemutihan), amnesty (Pengampunan), monitoring (Pemantauan), enforcement (Penguatkuasaan), and deportation (Pengusiran). Based on MOHA’s published records, a total of 2.3 million migrants had undergone biometric registration as of August 3, 2011 (1,016,908 legal foreign workers and 1,303,126 illegal immigrants). When 6P was first announced in June 2011, MOHA stated that no action would be taken against illegal foreigners who come forward to register during the first phase (known as the biometric registration period: from July 13, 2011 to August 31, 2011). The Deputy Prime Minister who is also the Chairman of Cabinet Committee of Foreign Workers and Illegal Foreigners (CCFWII) announced the 6P initiative as a ‘total package solution’ to the problem of foreign workers in the country. The exercise was aimed at finding a solution to various social, criminal and financial problems related to illegal immigration. Under the 6P initiative, illegal foreign workers are either legalized or deported without punishment. The deadline for the registration exercise under 6P was extended twice from the original October 2011 deadline until April 10, 2012. The extension of the deadline is largely attributable to the success of the outreach efforts and willingness of foreigners to come forward. As of April 2012, the Malaysian government is said to have recorded 3.1 million foreign workers in the country, of which two-thirds are illegal foreigners (The New Straits Times, 12 April 2012). Even though no official data are available, there are press reports that biometric registration was continued well into 2012 to cover certain groups of irregular migrants residing in the country, including stateless children and minors below the age of 18. Biometric fingerprinting has improved the Government’s ability to account for illegal immigrants. Previously, various stakeholders estimated the number of irregular foreigners to be between 500,000 to 1.5 million. Now, a more concrete figure of 1.3 million, based on biometric fingerprinting, has been established; almost 50 percent of the irregular foreigners are from Indonesia. These foreigners came forward in the hope of legalizing their stays. It is argued that many foreigners with families or children would likely not have participated in the 6P program due to fear of being deported if they
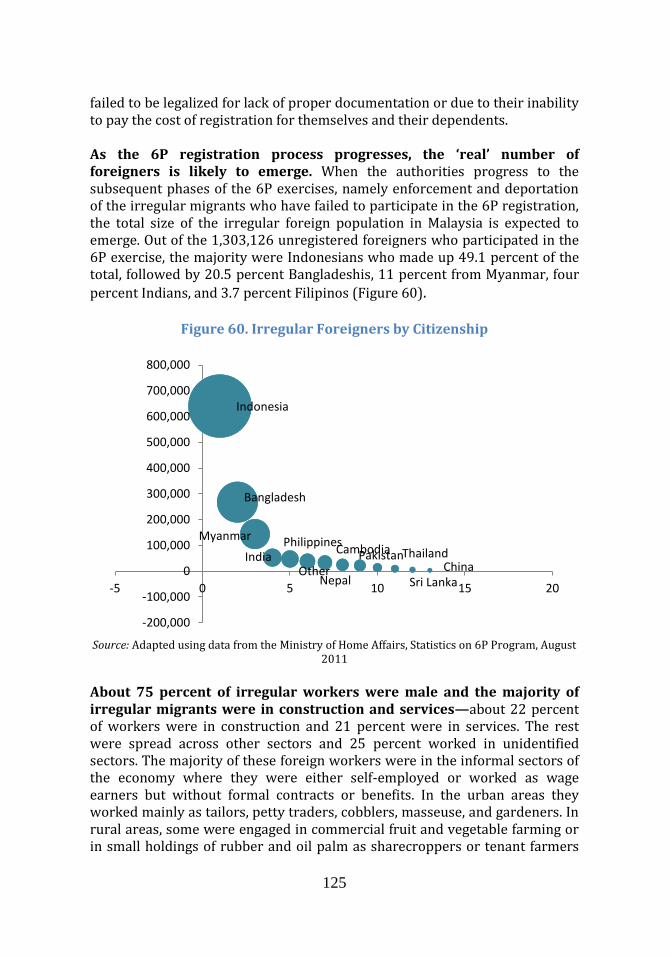
125
failed to be legalized for lack of proper documentation or due to their inability to pay the cost of registration for themselves and their dependents. As the 6P registration process progresses, the ‘real’ number of foreigners is likely to emerge. When the authorities progress to the subsequent phases of the 6P exercises, namely enforcement and deportation of the irregular migrants who have failed to participate in the 6P registration, the total size of the irregular foreign population in Malaysia is expected to emerge. Out of the 1,303,126 unregistered foreigners who participated in the 6P exercise, the majority were Indonesians who made up 49.1 percent of the total, followed by 20.5 percent Bangladeshis, 11 percent from Myanmar, four
percent Indians, and 3.7 percent Filipinos (Figure 60).
Figure 60. Irregular Foreigners by Citizenship
Source: Adapted using data from the Ministry of Home Affairs, Statistics on 6P Program, August
2011
About 75 percent of irregular workers were male and the majority of irregular migrants were in construction and services—about 22 percent of workers were in construction and 21 percent were in services. The rest were spread across other sectors and 25 percent worked in unidentified sectors. The majority of these foreign workers were in the informal sectors of the economy where they were either self-employed or worked as wage earners but without formal contracts or benefits. In the urban areas they worked mainly as tailors, petty traders, cobblers, masseuse, and gardeners. In rural areas, some were engaged in commercial fruit and vegetable farming or in small holdings of rubber and oil palm as sharecroppers or tenant farmers
Indonesia
Bangladesh
Myanmar
India Philippines
Other Nepal
Cambodia Pakistan Thailand
Sri Lanka China
-200,000
-100,000
0
100,000
200,000
300,000
400,000
500,000
600,000
700,000
800,000
-5 0 5 10 15 20
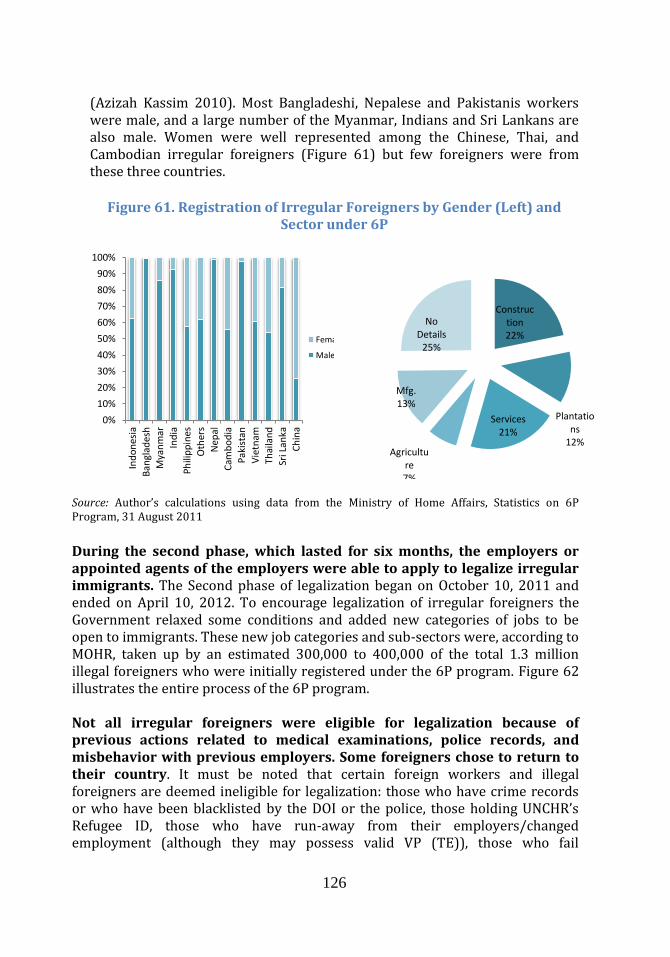
126
(Azizah Kassim 2010). Most Bangladeshi, Nepalese and Pakistanis workers were male, and a large number of the Myanmar, Indians and Sri Lankans are also male. Women were well represented among the Chinese, Thai, and Cambodian irregular foreigners (Figure 61) but few foreigners were from these three countries.
Figure 61. Registration of Irregular Foreigners by Gender (Left) and
Sector under 6P
Source: Author’s calculations using data from the Ministry of Home Affairs, Statistics on 6P Program, 31 August 2011
During the second phase, which lasted for six months, the employers or appointed agents of the employers were able to apply to legalize irregular immigrants. The Second phase of legalization began on October 10, 2011 and ended on April 10, 2012. To encourage legalization of irregular foreigners the Government relaxed some conditions and added new categories of jobs to be open to immigrants. These new job categories and sub-sectors were, according to MOHR, taken up by an estimated 300,000 to 400,000 of the total 1.3 million illegal foreigners who were initially registered under the 6P program. Figure 62 illustrates the entire process of the 6P program. Not all irregular foreigners were eligible for legalization because of previous actions related to medical examinations, police records, and misbehavior with previous employers. Some foreigners chose to return to their country. It must be noted that certain foreign workers and illegal foreigners are deemed ineligible for legalization: those who have crime records or who have been blacklisted by the DOI or the police, those holding UNCHR’s Refugee ID, those who have run-away from their employers/changed employment (although they may possess valid VP (TE)), those who fail
0%
10%
20%
30%
40%
50%
60%
70%
80%
90%
100%
Ind
on
esia
Ban
glad
esh
Mya
nm
ar
Ind
ia
Ph
ilip
pin
es
Oth
ers
Nep
al
Cam
bo
dia
Pak
ista
n
Vie
tnam
Thai
lan
d
Sri L
anka
Ch
ina
Female
Male
Construction 22%
Plantations
12%
Services 21%
Agriculture 7%
Mfg. 13%
No Details
25%
127
FOMEMA’s medical examination, and workers who wish to return to their home-countries without facing penalties for illegal entry or overstaying. Accordingly, the Government gave amnesty and enabled a total of 146,979 to return to their respective countries of origin between July 2011 and April 2012. After the conclusion of the two phases and using the biometric system, enforcement bodies began to arrest illegal foreign workers (and their employers) who are hiding, working in unapproved or informal sectors, freelancing, or are self-employed. The authorities are using the biometric system to identify where other foreigners may be located; the system not only records the workplace of foreign workers and the names of their employers, but also carries the thumb prints of legal foreign workers in the country making it easier to discern between unprocessed and processed workers. According the Secretary General of MOHA, a total of 4,156 operations involving 24,250 enforcement personnel have been recently conducted nationwide. As a result of these exercises, 13,492 irregular foreigners were arrested and action was taken against 337 errant employers. From this group, a total of 63 employers and 1,793 workers were charged in court. About 108 employers were charged with offences, and 1,809 workers were deported. Fifty-two employers and 4,479 workers are still being investigated. Some employers and workers were dismissed. Large amounts of resources are expected to be raised through the 6P program as well as curtailing of violations of the levy system. The legalization process involves multiple procedures and payment of substantial sums to MOHA in the form of the worker’s levy, medical insurance premium, FOMEMA fee for medical examination, workmen’s compensation insurance, processing fee, visa fee and VP (TE) pass fee, in addition to obtaining a Bank Guarantee to secure the Security Bond of the worker based on nationality. Also, the authorities are hopeful that the 6P will put an end to the abuse of the levy imposed on foreign workers, where there have been instances of employers hiring foreign workers purportedly for the agricultural sector due to the lower levy imposed in this sector but actually employing them in service sectors where the levy is highest. Via the 6P exercise, shown in Figure 62, the Government hopes to increase its revenue from the foreign workers’ levies. (MOF, 2012).
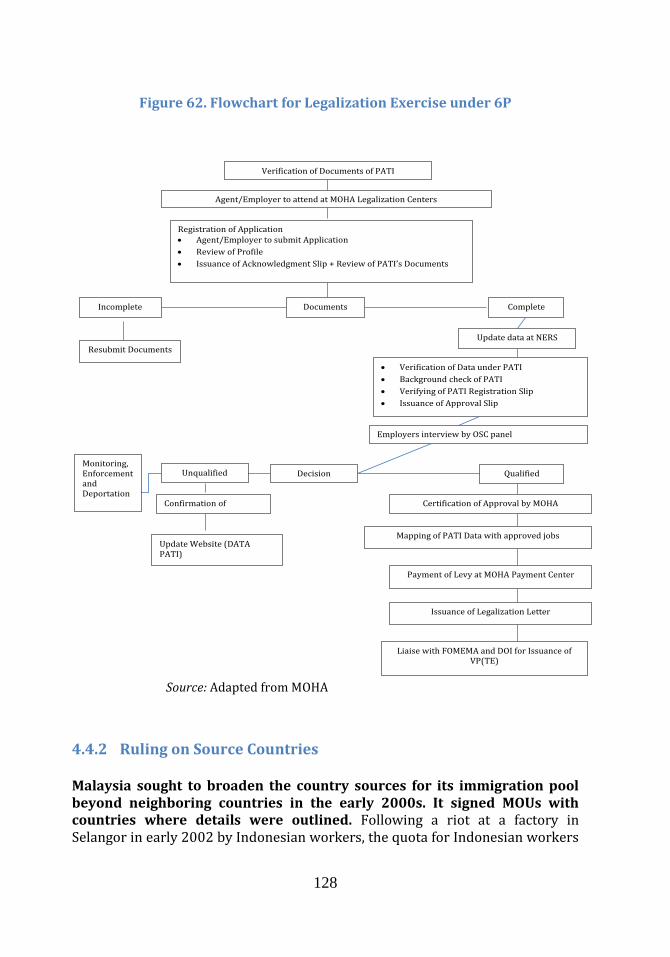
128
Figure 62. Flowchart for Legalization Exercise under 6P
Source: Adapted from MOHA
4.4.2 Ruling on Source Countries Malaysia sought to broaden the country sources for its immigration pool beyond neighboring countries in the early 2000s. It signed MOUs with countries where details were outlined. Following a riot at a factory in Selangor in early 2002 by Indonesian workers, the quota for Indonesian workers
Verification of Documents of PATI
Agent/Employer to attend at MOHA Legalization Centers
Registration of Application Agent/Employer to submit Application
Review of Profile
Issuance of Acknowledgment Slip + Review of PATI’s Documents
Documents Incomplete Complete
Resubmit Documents
Update data at NERS
Verification of Data under PATI
Background check of PATI
Verifying of PATI Registration Slip
Issuance of Approval Slip
Employers interview by OSC panel
Decision Unqualified Qualified Monitoring, Enforcement and Deportation
Confirmation of Rejection
Update Website (DATA PATI)
Certification of Approval by MOHA
Mapping of PATI Data with approved jobs
Payment of Levy at MOHA Payment Center
Issuance of Legalization Letter
Liaise with FOMEMA and DOI for Issuance of VP(TE)

129
was lowered. Recruitment of foreign workers was opened to countries outside the traditional source countries. New source countries were included—Turkmenistan, Uzbekistan, Kazakhstan, Sri Lanka, Pakistan and Nepal; government-to-government (G2G) bilateral agreements were pursued. Several MOUs were signed during this period with Sri Lanka (in August 2003), Republic of China (September 2003), Thailand (October 2003), Pakistan (October 2003), Bangladesh (October 2003), Vietnam (December 2003), and Indonesia (May 2004). In October 2007, the Government sanctioned recruitment of semi/skilled and unskilled workers from China for spa and reflexology. As a result, the number of source countries increased to fifteen and foreign workers from each country are permitted to work in certain sectors only. At present, Myanmar has been added as a source country for foreign workers in all sectors.
4.4.2.1 Ban on Visa on Arrival (VOA) for Selected Countries Abuse of tourist visas became rampant with the introduction of the Visa on Arrival (VOA) in 2007. Many abused the procedure that was designed to facilitate the entry of tourists. Several incidents involved visitors from South Asian countries, mostly from India followed by Pakistan, Bangladesh and Sri Lanka and China. In 2007, out of 146,500 tourists who arrived under VOA, about 36 percent overstayed and many sought employment. As a result, in 2008, the VOA for tourists arriving from the Indian sub-continent was halted.28
4.4.2.2 Relations with Indonesia and Bangladesh Due to media highlights of several cases of extreme exploitation and physical abuse of Indonesian domestic helpers, the Indonesian Government and Malaysia have had to negotiate various times over the last decade. Under a new MOU signed in 2006 between Malaysia and Indonesia, Malaysian employers were asked to pay RM 2,415 to a local agent for recruitment of domestic helpers, while the workers pay their agents in Indonesia a sum of RM 1,228. This MOU was criticized as it allowed Malaysian employers to retain the passports of their domestic helpers and for lack of any clear guidelines on wages or rest periods to be granted to domestic helpers. In June of 2009, Indonesia enacted a ban on sending female workers as domestic helpers to Malaysia due to more cases of violence against Indonesian domestic helpers as highlighted in the media (both in Malaysia and Indonesia). The 2009 ban has been lifted following a Letter of Intent signed between the two countries in May 2010 to resolve the issue of Indonesian domestic helpers. The Letter stipulates that Indonesian migrant domestic workers are entitled to one day off per week, periodic salary increases and the reimbursement of their transport expenses. They will also be
28Unpublished data from official sources.
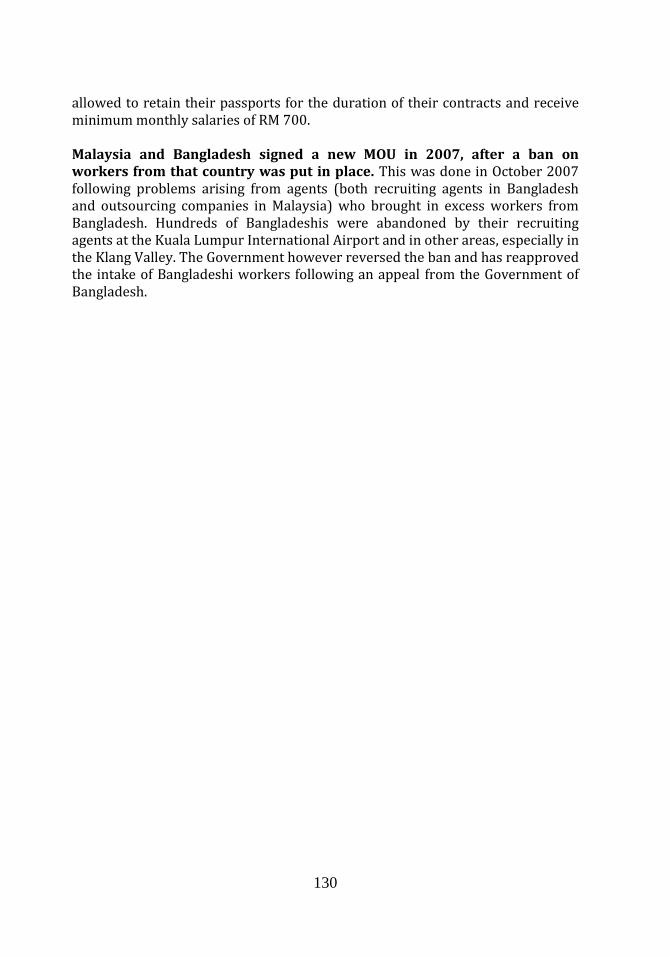
130
allowed to retain their passports for the duration of their contracts and receive minimum monthly salaries of RM 700. Malaysia and Bangladesh signed a new MOU in 2007, after a ban on workers from that country was put in place. This was done in October 2007 following problems arising from agents (both recruiting agents in Bangladesh and outsourcing companies in Malaysia) who brought in excess workers from Bangladesh. Hundreds of Bangladeshis were abandoned by their recruiting agents at the Kuala Lumpur International Airport and in other areas, especially in the Klang Valley. The Government however reversed the ban and has reapproved the intake of Bangladeshi workers following an appeal from the Government of Bangladesh.

131
Chapter 5: Learning from (and Benchmarking to) Relevant International Immigration Systems
Lessons from Countries with Similar Concerns
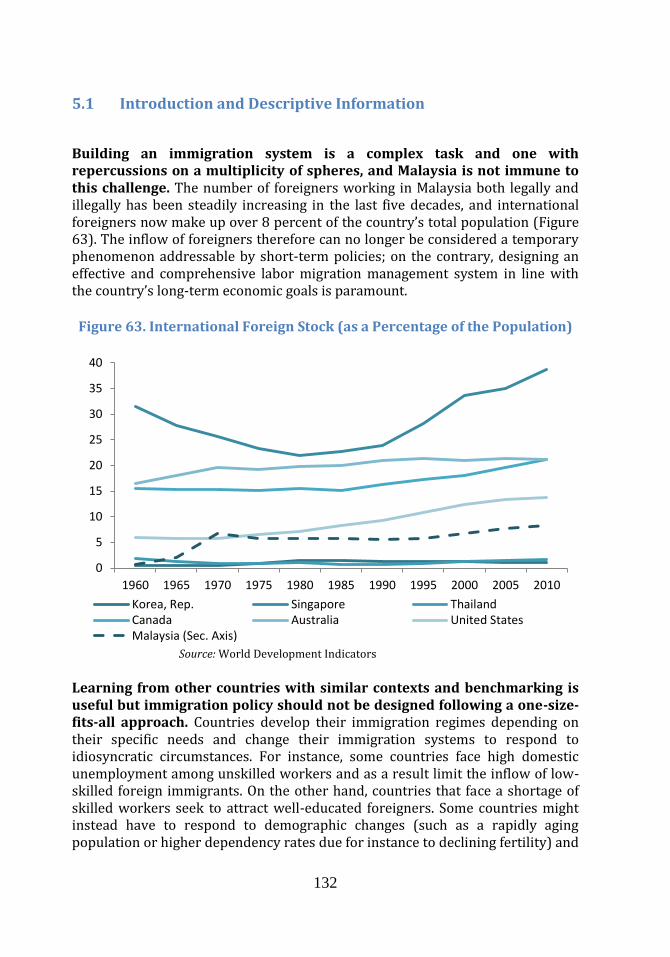
132
5.1 Introduction and Descriptive Information
Building an immigration system is a complex task and one with repercussions on a multiplicity of spheres, and Malaysia is not immune to this challenge. The number of foreigners working in Malaysia both legally and illegally has been steadily increasing in the last five decades, and international foreigners now make up over 8 percent of the country’s total population (Figure 63). The inflow of foreigners therefore can no longer be considered a temporary phenomenon addressable by short-term policies; on the contrary, designing an effective and comprehensive labor migration management system in line with the country’s long-term economic goals is paramount.
Figure 63. International Foreign Stock (as a Percentage of the Population)
Source: World Development Indicators
Learning from other countries with similar contexts and benchmarking is useful but immigration policy should not be designed following a one-size-fits-all approach. Countries develop their immigration regimes depending on their specific needs and change their immigration systems to respond to idiosyncratic circumstances. For instance, some countries face high domestic unemployment among unskilled workers and as a result limit the inflow of low-skilled foreign immigrants. On the other hand, countries that face a shortage of skilled workers seek to attract well-educated foreigners. Some countries might instead have to respond to demographic changes (such as a rapidly aging population or higher dependency rates due for instance to declining fertility) and
0
5
10
15
20
25
30
35
40
1960 1965 1970 1975 1980 1985 1990 1995 2000 2005 2010
Korea, Rep. Singapore ThailandCanada Australia United StatesMalaysia (Sec. Axis)

133
might want to incentivize immigration to increase the size of their working-age population. The kind of policy response will of course be different depending on the problem at hand. This chapter provides some examples from a sample of countries that either have well-established immigration systems and/or have faced a recent surge in the inflow of immigrants. These countries are highlighted in Figure 63. The age structure of the population is an important determinant of migration policies. In ageing societies, immigration may slow down the decline of the working age population and prevent undesirable consequences of such a trend. While all of the countries analyzed in this chapter have completed or at least started their demographic transition (and Figure 66), the absolute level of dependency varies a lot, from about 10 percent to 15 percent in Singapore, Thailand and Korea, to about 20 percent in Australia, Canada and the USA (Figure 66). Especially in Singapore, as expressed by the Minister Mentor Lee Kuan Yew in a recent article in Forbes, these trends are reasons for concern (Forbes, 7 May 2012). Figure 64. Fertility Rate over Time Figure 65. Fertility Rate in 2011
Source: World Development Indicators
0
2
4
6
8
Korea, Rep. Singapore
Thailand Canada
0 1 2 3
Korea, Rep.
Singapore
Thailand
Canada
Australia
United States
Malaysia

134
Figure 66. Age Dependency Ratio (Old as Percentage of Working Population)
Source: World Development Indicators
A deep understanding of labor market dynamics needs to be taken into account when modifying immigration policies. Unemployment levels are informative of the labor needs of the economy, while the educational composition of the labor force conveys information about skills shortages. Unemployment is significantly different among the chosen countries, ranging from virtually full employment in Thailand to over nine percent unemployment in the USA (Figure 67). On the other hand, in Malaysia, only slightly more than 20 percent of workers have tertiary education; while in the USA 60 percent of the workforce has at least college level education (Figure 68).
The patterns discussed so far suggest that the policies implemented in these countries will expectedly have both similarities and fundamental differences. By analyzing and comparing the policies adopted in this sample of countries, it is possible to identify the main challenges that Malaysia may soon face as it develops a new immigration system, and try to foresee the long-term risks as the country tries to climb the income ladder. In the next sections of this chapter the main features and strengths of different immigration systems are outlined.
0
5
10
15
20
25
1961 1966 1971 1976 1981 1986 1991 1996 2001 2006 2011
Korea, Rep. Singapore ThailandCanada Australia United States
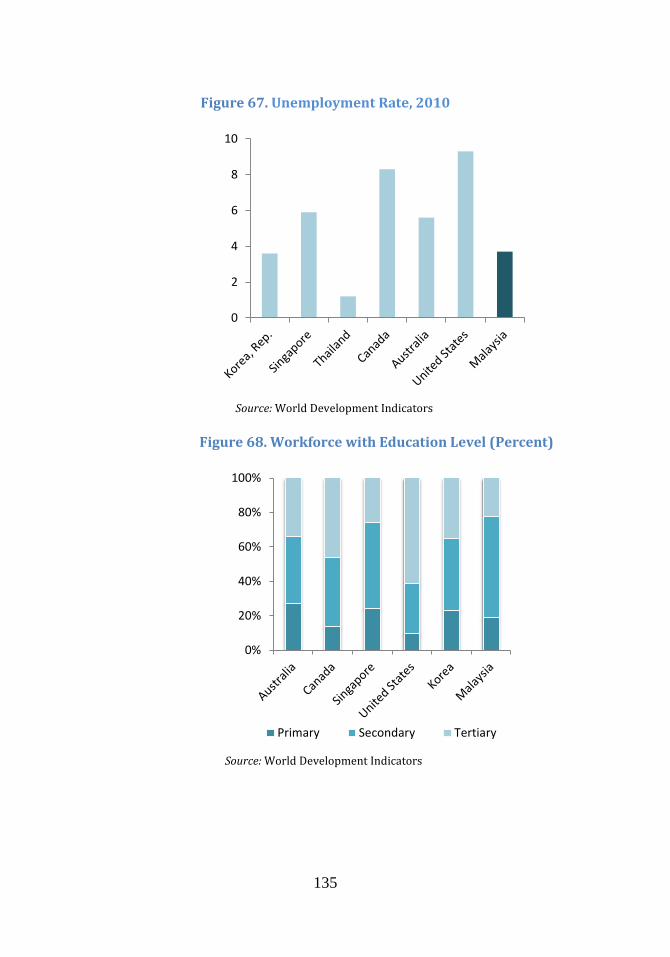
135
Figure 67. Unemployment Rate, 2010
Source: World Development Indicators
Figure 68. Workforce with Education Level (Percent)
Source: World Development Indicators
0
2
4
6
8
10
0%
20%
40%
60%
80%
100%
Primary Secondary Tertiary
136
5.2 Framing and Designing Immigration Policies
5.2.1 Basic Framework
Messages: (1) Setting up statutory agencies with a clear legal mandate and
strong accountability is fundamental; and (2) While there is no single recipe
for setting up public agencies, migration institutions should operate
according to long-term plans with demographic and labor market demands
in perspective.
In Malaysia, while certain bodies have been set up for the recruitment and management of migrant workers, including the CCFWII and the OSC, there is no single comprehensive national database on migrant workers in the country that is accessible to all agencies to enable better control and protection. In addition, the scarce coordination between the two government agencies dealing with migration affairs, namely MOHA and MOHR, has been the cause of inefficiencies and delays in the process of foreign workers recruitment. The lack of information sharing between these two Ministries as well as the fact that they do not jointly report to the CCFWII represent a problem in the Malaysian migration management system This could be easily solved with the creation of a joint Immigration Task Force that regularly updates the CCFWII on the work of the two agencies in the reference period. In general, the roles and responsibilities of each public agency involved in the management of migrant workers should be complementary and better coordinated, and more resources should be channeled to ensuring that the various agencies implement and enforce policies more effectively and efficiently. In the case of the implementation of the 6P, Malaysia has shown that a better coordination between MOHA and MOHR is possible. The positive results of this joint effort suggest that the country could sensibly benefit from an increased interaction between these two agencies. Migration quotas in Australia are publicly and clearly announced every year as part of the federal budget process. These figures only pose a limit on visa issued for permanent residence and are highly responsive to economic conditions. In order to be accountable to the Parliament, DIAC now announces its strategic plans, which set out the direction and the goals of the Department for the coming three years, and is required to produce an Annual Report that

137
presents the performance of the Department in relation to the services provided during the year and to the budget allocated. 29 Unlike Australia, the Canadian Constitution requires federal and provincial governments to share responsibility for immigration matters. Each year the Ministry in charge has to submit an intake range to the Parliament. At the federal level, Citizenship and Immigration Canada (CIC) manages the overall immigration policies in the country by defining foreign categories, determining immigration levels, and enforcing policies. However, the Minister of Citizenship and Immigration (the head of the CIC) can enter agreements with provinces and territories in recognition of their different needs in terms of immigration policies30. As in the Australian case, the structure of the Canadian immigration system aims to import the skills needed for the country’s economic growth, to foster family reunification, and to comply with the country’s humanitarian obligations. In line with national economic objectives stated in the Economic Plan of the country, the migration system is periodically reviewed to ensure that the policies are relevant. Similar to Australia, the Canadian Minister of Immigration is required to submit an annual report to the Parliament describing the activities and priorities of its Department and announcing the yearly planned intake range, which in 2011 was set at 245,000 to 260,000 foreigners for the eleventh consecutive year31. In Singapore, the agency responsible for immigration is the Ministry of Manpower (MoM). This choice reflects that in this country immigration is seen as a tool to achieve the country’s economic objectives. Each of the three main services delivered by MoM, namely planning, enforcement and attraction of foreign talents, is under the administration of a separate division. The Work Pass Division is in charge of designing and overseeing migration policy, the Foreign Manpower Management Division deals with enforcement and migrants’ wellbeing, while the main objective of the International Manpower Division is the attraction of foreign talents32. The entry of foreign workers is controlled by a work pass system that classifies foreign nationals on the basis of their salary and education. In order to control the influx of low-skilled workers, the Employment of Foreign Workers Act includes a provision that allows the Minister to set a levy on foreign workers. Just as in Canada and Australia, the Singaporean MoM issues an annual report that includes a discussion of the activities related to foreign manpower management (MoM, Annual Report 2010).
29 The last annual report can be found at: http://www.immi.gov.au/about/reports/annual/2010-11/html/ 30 For more information on the Department, please visit CIC website: http://www.cic.gc.ca/english/ 31 The full report can be found at: http://www.cic.gc.ca/english/pdf/pub/annual-report-2011.pdf 32 Please visit the MoM website for more information about the competencies and the structure of the Ministry: http://www.mom.gov.sg/aboutus/Pages/overview.aspx

138
In the United States, immigration is a federal responsibility, with the Congress limiting the number of foreigners admitted into the United States on a yearly basis as foreigners or refugees. As of 2002, following a major reorganization implemented by Congress through the Homeland Security Act, the overall responsibility of immigration was assigned to the Department of Homeland Security, with the U.S. Citizenship and Immigration Services (USCIS) taking over all the functions of the former Immigration and Naturalization Services (INS), including naturalization, asylum and adjustments of status33. However, ‘importing’ foreign workers into the U.S. is a process that involves several actors; employers need to first obtain an authorization from the Department of Labor and can only consequently apply for a visa with the USCIS. Visas are issued only by the Department of State, which is the body (along with the Attorney General) responsible for verifying whether a visa application conforms to the Immigration and Nationality Act (Lee et al., 2004). In Thailand, immigration is seen as a threat to national security; therefore, policies are based on control of inflows rather than management. The National Security Council (NSC) is the main body in charge of immigration issues. At the same time, immigration is seen as a temporary phenomenon as opposed to a permanent one, as testified by the extensive use of Cabinet resolutions to regulate immigration instead of relying on an organic policy framework. Migration responsibilities are split among a number of different agencies such as the above mentioned NSC (which is also in charge of illegal immigration), the Office of Foreign Workers Administration, the Ministry of Labor (which is mainly responsible for processing work permit applications and helping employers address their labor needs), and the Immigration Office (which is in charge of suppression duties) (IOM, 2011).
5.2.2 Flexibility
Messages: (1) It is important to allow institutional bodies in charge of
immigration the flexibility to rapidly respond to sudden changes in the
economic environment; (2) Levies, fees and taxes can be used not only to
detract foreigners but also attract them through exceptions, lowering of fees,
and other similar measures.
Malaysia adopts an annual levy system and quotas at the sectorial and sub-sectorial level to control migration inflows. As seen in the previous chapter, quantity and price restrictions have changed periodically since 1992 in response
33 For detailed information about DHS and USCIS please visit: http://www.dhs.gov/ and http://www.uscis.gov/portal/site/uscis

139
to market demand. However, these instruments have not always been introduced with the right timing due to the delays resulting from the scarce communication between MOHA, MOHR and the CCFWII. In addition, in some cases levy levels have been set without taking into account the market needs. This is the case of the imposition of a levy on the recruitment of foreign domestic workers. Such choice goes in the opposite direction with respect to the goal of the country of increasing its chronically low female labor force participation rate. In Australia, migration inflows can be adjusted by the Minister-in-charge to satisfy labor market needs. The Minister can set specific priority processing arrangements for visa requests linked to certain areas, industries, or skill-areas. For instance, migrants potentially working in scarcely populated areas or those who already have an employer are currently given higher priority processing. Similarly, the point system (according to which potential foreigners are scored depending on their level of education, professional skills, and so on) allows the Government to retain some flexibility to increase or decrease the number of workers entering the country depending on market conditions. The Minister can in fact simply change the threshold at which foreigners qualify for a visa. Finally, the Minister has also the freedom to cap the number of foreigners (DIAC website, Fact Sheet no. 21). The main message is that the Australian Government holds close control in order to respond to significant changes in the Australian labor market and the ensuing skills shortage in the country; this has been the approach especially since the late 1990s when the focus shifted towards skilled migration (Figure 69).
Figure 69. Australia—Permanent Residents by Category
Source: J Phillips and H Spinks (2012), Skilled migration: temporary and permanent flows to Australia, Parliament of Australia background note. Data sources: ABS 2007, Australian Social Trends; DIAC 2009 and 2011.

140
In Canada, the Immigration and Refugee Protection Act enables the Minister to take measures aimed at making the immigration program responsive to the market needs. Indeed, as in the Australian case, the Minister can impose a cap on the different program categories and issue ministerial instructions specifying the conditions under which applications can be considered34. Over the years, the Singaporean system has also adjusted with market conditions by using the immigration levy system. The immigration levy system has evolved dramatically since it was first put in place; when it was first implemented in 1980 the system was primarily aimed at discouraging the employment of foreign labor. However, as overseas workers proved to be a central driver of national economic growth, Singapore started the development of a new immigration policy focused on maximizing the potential benefit resulting from immigration (that is, lowered the levies for foreigners with certain skills). Following the economic recession in 1985, the country introduced a new two-tier levy system as well as sector-specific dependency ceilings that limited the number of foreigners a business could hire (Wong, 1997). It is critical to be able to insert immigration concerns into changes in the country’s economic plan and make rapid changes to adjust to unusual circumstances. In response to the challenges posed by the global financial crisis in 2009, the First Minister formed the Economic Strategies Committee (ESC) with the mandate of identifying new avenues to foster national economic growth. Formed by members of the Government as well as by representative of the private sectors, labor movement and academia, ESC stressed the importance of shifting towards a productivity- and skill-driven growth economy, thus reducing dependency on low-skilled foreign labor (Economic Strategies Committee, 2008). As a result of these recommendations, in 2010 foreign worker levies were increased and further increases were announced in 2011 for the years 2012 and 2013 (MoM media release, 21 February 2011). South Korea has a very flexible approach with sector-specific quotas revised regularly whereas the United States has a more rigid approach. The same principle applies to South Korea and Taiwan, where sector-specific quotas are revised on a yearly basis or on a regular basis depending on the demands of the private sector. On the other hand, the United States provides an example in the opposite direction, as permanent and temporary visas are simply capped by quotas not responsive to economic needs (Lee et al, 2004).
34 An online version of the Act can be found at: http://laws-lois.justice.gc.ca/PDF/I-2.5.pdf
141
5.2.3 Consultations with Stakeholders
Message: (1) It is critical to take policy decisions in consultation with other
stakeholders, in particular the private sector; (2) such consultations should
be clearly structured so as to allow stakeholders to see whether their inputs
have been taken into account when the discussed policy is implemented.
In Malaysia, consultations with stakeholders do not take place on a regular basis or effectively shape the Government’s decisions. In general, MOHR is the migration agency that mostly interacts with stakeholders in Malaysia. However, it is not clear how the inputs given by stakeholders in these occasions are then taken into account by DOI (MOHA) when deciding whether to admit foreign workers and by CCFWII when designing migration policies. For example, employer groups, trade unions and NGOs gave their inputs in drafting the proposed Foreign Workers Act mentioned in Chapter 4. However, this law was never enacted. Consultations with various stakeholders play an important role in shaping Australian migration policy. In 2008, the Government commissioned an independent review of the temporary visa program and later established the Skilled Migration Consultative Panel to seek advice on how to address some of the issues raised in the review (DIAC media release, 8 July 2008). The subsequent changes to the temporary visa regulation were the results of these consultations (DIAC media release, 1 April 2009). In addition, DIAC encourages feedback from the Australian public by releasing discussion papers on proposed policy reviews to the migration system35. Finally, the independent Australian Workforce and Productivity Agency (formerly known as Skills Australia) releases every year a list of occupations open to migrants in consultations with unions and industries, the Department of Education, Employment and Workplace relations36. The Canadian Government oversees permanent and temporary skilled migration flows by encouraging agencies to work in close collaboration with each other and engage in extensive consultations with key stakeholders. CIC consults with other departments of the Canadian Government (Human Resources Development Canada), while a separate body (Canada Border Services Agency) overseen by the Minister of Public Safety, is in charge of border control and public safety. In its continued effort to improve its immigration policy system, CIC explicitly recognizes the importance of public and stakeholder consultations and constantly seeks feedback from unions, employers and experts
35 DIAC website: http://www.immi.gov.au/media/publications/discussion-papers/ 36 Firms can give their input by submitting the following form: htt//www.awpa.gov.au/publications/documents/ProformaforSOL2013Submission.pdf

142
in setting annual immigration levels. Reports summarizing the outcomes of these consultations are then made public37.
Singapore encourages public consultations on immigration policy and acts based on its consultation outcomes. For instance, as a result of consultations with industry representatives, from July 2012 the Ministry of Manpower will extend the maximum employment period for low-skilled foreign workers (from six to 10 years), recognizing the potential gains in productivity deriving from the retention of the skills acquired by such workers throughout their employment history in Singapore (MoM Media Release, 26 March 2012).
5.3 Demand versus Supply-Driven Systems
Messages: (1) Some countries originally developed a demand-driven immigration system, while others opted for a supply-driven on; however,
over the years countries have adjusted depending on market conditions, and now they fluctuate within this spectrum; and (2) Irrespective of the system chosen, it is vital to design multiple channels of entry for migrants, each of them targeting the needs of the economy at a certain point in time, to take into account the different regional needs within a country, and to review
one’s approach as needed.
A supply-driven immigration system is better suited to select foreigners with the skills needed in the medium- to long-term. In such a system, foreigners can enter a host country without pre-arranged employment. However, many countries set the criteria to select applicants to maximize the probability of selecting ‘good quality’ migrants. For instance, countries normally put a premium on young age, high levels of education, language skills and ‘adaptability’; all variables that are associated with long term ‘economic success.’ Admission is normally granted on a permanent basis and the total annual intake is limited by quotas set by central authorities. On the other hand, a demand-driven system tends to select foreigners with the skills needed in the short- to medium-term. In a demand-driven system, migrants normally enter the hosting country with pre-arranged employment, with employers required to obtain permission from the government beforehand (and most likely to show that no Malaysian worker can fill a given vacancy). The conditions to ‘import’ a low-skilled worker are normally more stringent than those for skilled labor, and admission is granted on both permanent and temporary basis; the overall intake is also controlled by quotas or other instruments.
37 Consultations, CIC website: http://www.cic.gc.ca/english/department/consultations/index.asp
143
Malaysia adopts a demand-driven system, even if supply-driven components have been recently introduced to attract foreign talent. The previous chapter shows that the Malaysian immigration regime was not set up to allow foreign workers to stay in the long-term. For this reason, migrant workers are issued work passes that allow them to work in Malaysia for a limited amount of time depending on their skills and education levels. However, in the last few years the Department of Immigration has introduced a point test that stresses age, education, work experience, language skills, and ties with Malaysians as important criteria to be granted permanent residence. Nevertheless, foreign workers granted passes under this channel are a small minority. The Australian immigration system was set up as a supply-driven system although recent economic changes have resulted in a hybrid set-up that combines demand and supply-driven components. The traditional and supply-driven component of the Australian system can be identified in the General Skilled Migration program; foreign workers entering Australia under this channel are not sponsored by an employer but rather are selected through a methodology that allocates points on the basis of education, employment history, language skills and other characteristics seen as favoring adaptability to the local labor market. Applicants whose score is equal or above a predetermined threshold are eligible for a visa (See Annex 5 Table 1). The Minister can adjust the weight assigned to certain characteristics and the ‘threshold score’ in response to the country’s needs. The main objective of the point test is to supply the skills a country needs in the medium- to long-term. However, while transparent, consistent and efficient, this system risks delivering an unbalanced skill mix if the criteria chosen to allocate points do not reflect the market demand. Australia faced these problems as the global crises unraveled, when the Minister of Immigration and Citizenship announced a review of the point test motivated by the fact that “the current points test puts an overseas student with a short-term vocational qualification gained in Australia ahead of a Harvard-educated environmental scientist” (DIAC Media Release, 8 February 2010). After consultations with several departments, trade unions and industry representatives, as of July 2011, a new point test with stricter eligibility requirements was introduced (increasing the English language requirements, previous employment requirements, and more stringent age criteria). The modification of the point system was not the only measure undertaken to improve the supply component of the country’s migration program; the Government also established a body to identify the skills needed. Observing that “in the three years, starting 2007-08 the former Government’s Skilled Migration Programs delivered 28,800 accountants, 6,500 cooks and 2,800 hairdressers” and “over the same three years the program delivered just 800 bricklayers, 600 plumbers and 300 carpenters” the Minister announced that “in consultation with the States and Territories the Rudd Government has developed

144
a Critical Skills List (CSL) […] focused on medical and key IT professionals, engineers and construction trades” (DIAC Media Release, 2008). In 2008 a new independent statutory body, Skills Australia38, was also established with the objective of advising the Government on workforce skills and development needs, and to develop a new Skilled Occupation List with the collaboration of industry skills councils and trade unions39. Along with the changes to the point system, Australian immigration policy has undergone a shift towards a demand-based approach. Greater priority is now given to foreign workers with pre-arranged employment, as represented by the Permanent Employer Sponsored Visa Program. In December 2008 the Minister of Immigration and Citizenship announced “the need for a shift in the focus of the program towards ‘demand driven’ outcomes, in the form of employer and government-sponsored skilled migrants, to ensure the program was better targeted on the skills needed in the economy” (DIAC Media Release, 2008). As a result, in the Migration Program 2009-10 61.6 percent of the skill stream outcome was represented by the sponsored group. In 2010/11, additional 9,150 places were allocated to the employer-sponsored stream, while the quota for independent migrants was reduced by 3,600 places. In the same token, in 2011/12 and 2012/13 the majority of the intake within the skilled stream was allocated to migrants with pre-arranged employment (DIAC, Migration Program Statistics), whose applications are also processed with higher priority. A new set of reforms to the permanent employer sponsored program was recently introduced with the purpose of simplifying recruitment of foreign labor and streamlining the application process. The current tripartite classification will be replaced with a new bipartite system comprising the Employer Nomination (EN) and the Regional Employer Nomination (RN) Schemes, each of them subdivided into: (i) Temporary Residence Transition stream; (ii) Direct Entry stream; and (iii) Agreement stream (DIAC Media Release, 9 March 2012). The recruitment of foreign workers under the ENS Direct Entry is a two-stage process; the program benefits Australian citizens through a commitment by employers to provide them with training in exchange for foreign visas. In the first stage, employers lodge a nomination which will be approved only if the availability of the position is full-time for at least two years, if the employer commits to providing training to Australians, and the nominated occupation is on the new consolidated sponsored occupation list and pays a salary that is at least the specified minimum salary for that occupation. The process moves to the second stage only if the nomination is approved. In that
38 Now replaced by the Australian Workforce and Productivity Agency. 39 The Skills Australia Act 2008 can be found at: http://www.comlaw.gov.au/Details/C2008A00010

145
case, a nominee must lodge an application that will lead to the granting of a visa if the potential migrant provides a positive skill assessment and meets the defined requirements. A very similar process is the basis of recruitment under the RSMS Direct Entry. The main differences with the corresponding ENS scheme are the occupations that employers are allowed to nominate and the qualification level required of workers. Of a different nature are the rules governing the Agreement stream. Defined as “a formal arrangement negotiated between an employer and the Australian Government […] where genuine skills shortage exists and there are no suitably qualified or experienced Australians readily available” (DIAC Media Release, 9 March 2012), each agreement sets its own skills, work experience, English language, and age requirements. Both temporary and permanent visas are granted under this category. The Canadian immigration system, similarly to the Australian one, has traditionally been a supply-driven one, although in recent years elements of demand-driven models have been introduced. The evolution of annual intake by category shows that the program has been predominantly driven by economic factors in the last decades, with skilled foreigners accounting for 67 percent of total admission in 2011 and for only 37 percent in 1991 (Figure 70). The majority of spots under the economic stream are reserved for Federal Skilled Worker Program (FSWP). Foreigners entering under this channel are selected on the basis of point tests, which targets foreigners with the potential to become ‘economically independent in Canada’ (CIC, 2011). Concerns that the criteria adopted was leading to poor labor market performance of new entrants, led to changes in the point system in 2002. Among the major changes, the introduction of a work experience minimum requirement40 and a greater focus on characteristics demonstrated to predict economic success led to an improvement in migrants’ performance.
Figure 70. Permanent Residents by Category
Source: CIC
40 An applicant needs to have at least one-year work experience in the last 10 years of Skill type 0, Skill Level A, or B under National Occupation Classification (NOC) in order to apply as a skilled worker under FSWP.

146
Certain features of the Canadian system cause inferior results compared to its Australian counterpart. As already seen, Australia identifies a set of minimum requirements such as age, language skills and work experience thus ensuring that only migrants with the desired mix of skills are considered for selection through the point system. In contrast, in Canada the requirement is reduced to only one year of work experience, implying that candidates with no language competencies could be granted visas if they perform well against other factors. In addition, while in Australia applicants are required to hold a skill assessment issued by a relevant Australian authority, in Canada credential assessment is not mandatory and province-specific (Richardson and Lerster, 2004).
The Minister of Citizenship and Immigration has now the power to issue instructions to immigration officers giving directions on the type of applications to process. Since the introduction of amendments to the Immigration and Refugees Act in 2008, the Canadian system has become more responsive to labor market’s needs. As of 2008, applications are processed only if the primary applicant has either at least one-year experience in 38 special priority occupations41, has legally lived in Canada for one year as a temporary foreign worker or international student, or has a job offer from a Canadian employer. The Ministerial Instructions launched in 2010 and 2011 imposed a limit on the number of new applications42. In the Annual Report 2011, the Minister announced that “the year 2011 marks a significant milestone when we cut the backlog of old applications in half two years ahead of schedule. In 2010, we also capped the number of new applications we accept in the federal skilled worker category. This approach has enabled us to better match the supply of applications with our processing capacity and economic needs” (CIC, Annual Report 2011).
The system grants provinces and territories to the authority to nominate overseas workers in response to their short-term economic needs, with each province or territory designing its own programs and selection criteria. This allows sparsely populated areas to set less stringent criteria to grant immigration visas to incentivize inflows of migrants. For instance, under the Provincial Nominee Program (PNP), a foreign worker is nominated by a province for a work permit based on criteria set by the province itself. This program aims to distribute the human capital gained through immigration outside of the major foreign hubs of Toronto, Vancouver, and Montréal by addressing labor or skills shortages in individual provinces. In 2002, only 1.5
41 Occupations belong to sectors under high-demand such as health, skilled trades, finance, and resource extraction. 42 Annual cap was set at 20,000 for new applications and 1,000 for each eligible occupation in 2010. Figures cut in 2011.

147
percent of all economic-stream foreigners were provincial nominees, but that number jumped to 15 percent in 2008 (Challinor, 2003).
The Canadian Temporary Foreign Workers Program (TFWP) is entirely demand driven; employers start the process by identifying potential overseas candidates to fill positions in their business. In most of the cases, the next step is to request permission to hire a foreign worker in the form of a Labor Market Opinion (LMO) (CIC website). The Human Resource and Skills Development Council (HRDC) is in charge of assessing applications and issuing LMOs on the basis of the potential gains for the Canadian economy. For this reason, criteria such as the effort made by an employer to recruit Canadians and the potential transfer of skills from migrant to Malaysian workers are considered when deciding on the application outcome. In case of a positive LMO, the foreign workers are allowed to proceed and apply to Citizenship and Immigration Canada (CIC) for a work permit. In order to limit the influx of this category of workers, employers are asked to meet stricter provisions, such as: covering recruitment and airfare costs, ensuring that suitable accommodation is available, providing medical coverage until the employee is covered under a provincial plan, and specifying in the contract that wages will be adjusted according to the market rate after one year if deemed necessary. In addition, employers need to show better effort in recruiting local workers (CIC website).
The Government introduced stricter assessment for the genuineness of the job offer, harsher sanctions for employers who do not respect the conditions specified in the job offer and four-year maximum stay. Exploitation of the temporary permit system led the Government to introduce stricter guidelines for employers who violate the conditions specified for certain classes of temporary migrants (CIC website). At the same time, the LMO system is criticized for its long processing times that limit the program’s ability to promptly address labor market needs. In response to this and recognizing the severity of labor shortages in some areas such as British Columbia and Alberta, a new project know was Expedited-Labor Market Opinion (E-LMO) was introduced to provide a fast track process for application in a number of high-demand occupations (Sas, 2008).
Similar to the TFWP, the process of an Arranged Employer Opinion (AEO) begins with an employer making a job offer to a foreign worker and requesting an AEO from the Human Resources and Skills Development Council. The wages and working conditions of the foreign worker must match those of a Canadian employee in a similar position, though the employer does not need to conduct a search to determine if a Canadian is available for the job. There are some concerns about fraud and exploitation through false job claims, but federal skilled workers with AEOs tend to outperform those without AEOs in obtaining and retaining jobs and in terms of earned income. While AEOs operate more like the US system of high-skill immigration and are perceived as a

148
potential solution to the problem of brain waste, the FSWP is more focused on sustainability and long-term integration into Canadian society, and tends to attract foreigners who are more adaptable to the changing labor market (Challinor, 2003).
Another option that allows the inflow of less skilled workers is the Seasonal Agricultural Workers Program (SAWP). Under SAWP agricultural producers are allowed to address their seasonal needs by hiring foreign workers from countries that have signed a bilateral agreement with the Canadian government43. Sending countries’ governments play a crucial role in controlling this type of migration flows, since they are in charge of recruiting agricultural workers and providing them with assistance once in Canada. The threshold criteria employers have to satisfy are similar to those imposed by the low-skilled stream of the TFWP, with the addition of the provision of free housing, payment of any visa-related costs and demonstration of significant effort to find a Canadian worker to fill the position. Workers under SAWP are allowed to stay in Canada for a maximum of 8 months (CIC website).
Singapore’s demand-driven migration management is based on a system of temporary work passes that classify workers according to their education and salary. Employment Passes (EPs) are issued to highly skilled workers, while “S passes” and “Work Permits” (WPs) are for mid-level and low-skilled foreigners, respectively. Given the strong economic focus of this regime, only workers with pre-arranged employment are eligible to obtain a pass (Rahaman, 2006). As of June 2012, more than 1.2 million foreigners were working in Singapore, a vast majority of them being Work Pass holders (Table 13). The process to obtain all kind of passes has to be initiated by firms as opposed to by individuals.
Table 13. Singapore Foreign Workers
Pass Type Dec-07 Dec-08 Dec-09 Dec-10 Dec-11 Jun-12
Employment Pass (EP) 99,200 113,400 114,300 143,300 175,400 174,700
S Pass 44,500 74,300 82,800 98,700 113,900 128,100
Work Permit (Total) 757,10
0 870,000 856,300 871,200 908,600 931,200 - Work Permit
(Foreign Domestic Worker) 183,20
0 191,400 196,000 201,400 206,300 208,400 - Work Permit (Construction)
180,000 229,900 245,700 248,100 264,500 277,600
Total Foreign Workforce 900,80
0 1,057,70
0 1,053,50
0 1,113,20
0 1,197,90
0 1,234,100
Total Foreign Workforce (excluding Foreign Domestic
Workers)
717,600
866,300 857,400 911,800 991,600 1,025,700
Source: MoM
43 Jamaica, Barbados, Trinidad and Tobago, Antigua, Grenada, St. Kitts, St. Lucia, St. Vand Montserrat, and Mexico.

149
Employment Passes, which are employer specific, are designed to target managerial and professional foreign workers with job offers from Singaporean employers. Depending on monthly earnings and qualifications, professional foreigners can be issued different types of permits. Eligibility requirements are defined so as to ”ensure that as salaries of locals rise as they gain in experience and progress in their careers, they will not be disadvantaged by EP holders coming in at lower wages” (MoM Media Release, 16 August 2011). EPs are issued for a maximum of five years but are renewable indefinitely, are not subject to any levy or dependency ceiling (that is, a cap in the proportion of EP holders over the total workforce of a given firm), have no limits on the number of dependents that a worker can bring into the country, and family members are also allowed to seek employment (MoM website). S Passes were designed to fill the gap between EPs and WPs, a gap that was making it difficult for Singaporean firms to hire middle-level workers and was giving rise to a shortage of skills in some sectors. S Passes are in fact specifically targeted at specialized workers and technicians with middle-level skills; the number of S Passes in any given firm cannot be greater than 25 percent of the firm’s workforce. S Passes are employer specific, are issued for a maximum of two years and are also renewable indefinitely, but are subject to the payment of sector specific levies, have to comply with sector specific dependency ceilings, and allow workers to bring dependents into Singapore only above a certain salary threshold. However, children of any S Pass holder are allowed to study in the country if they pass entry tests (MoM website). Work Permits (R1 and R2) are reserved for low-skilled and unskilled foreigners. A WP cannot be extended for more than 10 or 18 years depending on the qualifications of the worker in question (more qualified workers are considered more productive and hence are allowed to stay longer). WP holders cannot obtain passes for dependents and are not allowed to marry a Singaporean national or to fall pregnant whilst in the country. WPs are employer specific and their issuance is linked to the payment of a sector-specific levy and is regulated by sector-specific dependency ceilings; in order to apply for a WP a firm has to first be categorized in a specific sector depending on their main business activity. The prospective worker cannot be in Singapore while his WP application is at least approved, and employers are required to pay a hefty deposit (about US$ 5000 per worker) that will be reimbursed only after the WP holder is repatriated at the end of the pass period and to arrange a medical examination for the incoming worker. The levies charged to employers to issue WPs are used as a price mechanism to control the inflow of low-skilled and unskilled foreigners: levies are set at a lower level for foreigners with certain occupation-specific qualifications (deemed critical for the country’s economy), while the price is higher for foreign workers when the percentage of WP holders relative to total labor force is above a certain threshold (MoM website).

150
The United States also follows a demand driven approach to immigration policy, although strict quotas on the number of temporary visas that can be granted in a given year apply to both high-skilled and low-skilled occupations. Firms wanting to temporarily hire high-skilled migrants need to apply to the H1-B visa program, the number of which has been capped at 65,000 per year since 2004, no matter what the economic situation in the country is, after reaching almost 200,000 in the early 2000s. From 2005, an additional 20,000 H1-B visas have been made available for workers holding advanced degrees. The number of applications greatly exceeds the quotas every year (Peri, 2012). H1-B Visas are restricted to specialty occupations and there usually no need to show that American workers are not available to fill a given vacancy (unless a firm already has more than 15 percent of its workforce as migrants). The duration of an H1-B is up to three years, renewable for a further three and workers are then subject to a one year period outside of the US; however H1-B holders can bring dependents into the country although they are not eligible for work (USCIS website). Temporary unskilled workers can be ‘imported’ after applying and being granted an H2-A or an H2-B visa. These visas are for agricultural and non-agricultural sectors, respectively. Temporary workers in agriculture (H2-A Visa holders) are not subject to a cap, although employers need to provide workers with housing, cover their airfare costs to the country and back, and transportation to work, and show that a strong effort to find local workers has been made. The maximum length of an H2-A visa is one year renewable up to three years in total (USCIS website). Temporary non-agricultural H2-B visas are limit to 66,000 per year; workers are linked to an employer (that needs to prove that no American worker wants the job) and cannot switch job, dependents are allowed into the country but cannot be employed (USCIS website). Permanent workers can get access to the United States by being granted a ‘green card.’ The number of such permits is capped at 140,000 per year irrespective of market needs, although preferred categories of workers are specified (each with a specific number of visas allocated and different restrictions in terms of sponsorship, skills, labor certification, etc.) (USCIS). South Korea, Taiwan and Thailand are other examples of demand-driven systems (Lee et al, 2004).
5.3.1 Public vs. Private Recruitment Message: generally the recruitment process in demand-driven systems is led
by the firms seeking to import skills, while supply-driven systems put more
burdens on the government. In both cases, the government needs to actively
151
oversee firms and private recruitment agencies to avoid immigrants’
exploitation.
In Malaysia, foreign workers are mainly recruited through private agencies. However, stricter rules have been introduced in response to increasing cases of immigrants’ exploitation. As shown in the previous chapter, with the introduction of outsourcing agencies the responsibility to guarantee certain standards of treatment to foreign workers has moved from employers to the private agencies. As a consequence several foreign workers experienced a deterioration of their working conditions. The effectiveness of the Anti-Trafficking in Person Act, introduced in 2007 to prevent such trend, has been limited by the scarcity of resources available for its enforcement. In Singapore for instance, the Employment Agencies Act establishes that foreign workers can be imported and managed through licensed Employment Agencies strictly regulated by the government. Those applying for a license to operate Employment Agencies need to have legal residency in Singapore, need to deposit US$ 200,000 as a security guarantee, and cannot have any previous court convictions. Permits are granted by the Commissioner of Labor for one year and are renewable, and the agencies need to comply with the Employment Agency Licensing conditions to continue to operate. According to these conditions, licensees have to provide decent accommodation, food, and medical treatment for workers as required, and to generally take care of immigrants’ wellbeing. Failing to comply with these requests will result in immediate revocation of the license to operate an Employment Agency (MoM). The Republic of South Korea provides an example of a demand driven system in which the recruitment process is government-led. As said, any employer wanting to import foreign labor has to first offer the job to a local worker through an Employment Security Center of the Ministry of Labor. If no domestic candidate can be identified, then the Employment Security Center itself then recommends a list of foreigners that fit the job description and the employer selects the foreigner from this group. The Center then certifies that the need to import a worker is real and issues the work permit. In other words, the process is state-dominated (Kee, 2009). In Taiwan, foreign workers are recruited by a group of private firms. While employers are supposed to apply for migrant permits on behalf of the potential worker; however, in practice, firms rely on private recruiters and select workers from a list of foreigners and the private recruiter then deals with the paperwork and the application process in exchange for a fee. Migrant workers are often exploited in the process as they often have to pay very high brokerage fees to private recruiters, ranging from US$ 3,500 to over US$ 4,500 (Kung, 2010).
152
In Australia, the system to recruit foreign workers follows the co-existence of a demand and a supply driven system of migration. While in the supply-driven system workers start the application process, the demand-driven component requires employers to start the recruitment process of foreign workers. As of July 2012, foreign workers without pre-arranged employment, will not be able to apply for a General Skilled Migration work permit but, rather, will be required to use Skills Select, an online system that allows foreign workers interested in moving to Australia to submit their curriculum and express interest in job opportunities in the country. The Australian government then screens the expressions of interests and invites selected applicants to submit a full application for an foreign visa (that is then granted depending on the point system). Skills Select essentially allows the government to control the supply of skills that is trying to access the country and to fine-tune it to labor market conditions; however, Skills Select also serves as a clearing house, allowing employers to contact directly suitable and interested candidates, thereby reducing recruitment times and the simplifying the overall migration process. Employers still remain free to use agencies to find skilled candidates, and all migration agents need to be registered with the Department of Immigration and Citizenship44. In Canada, the demand driven component of the immigration system requires employers to find foreign workers and to apply for a visa on their behalf. Employers can look for workers alone or use the help of recruitment agencies, which are strictly regulated by the Government to avoid the exploitation of foreigners entering Canada45.
5.4 Selection of Skill Types and Quantities
5.4.1 Quotas, Levies, and Dependency Ceilings
Message: it is difficult to set quotas, levies, and dependency ceilings at the optimal level and mistakes can result in denying access to productive foreign
talents; stricter requirements to grant foreign visas (education levels, language skills, training of local workers, and so on) are then a more
efficient way to regulate immigration flows.
In Malaysia the lack of a consistent approach to set up levy and quota levels over time has resulted in uncontrolled increases in the hiring costs of foreign workers. The analysis in Chapter 4 shows that in some cases firms incur
44 More info on SkillSelect can be found at: http://www.immi.gov.au/skills/skillselect/mo 45 The Immigration Consultants of Canada Regulatory Council (ICCRC) is in charge of these duties: http://www.iccrc-crcic.ca/home.cfm
153
higher hiring costs for foreign workers than for local workers. The 10th Malaysian plan announced the future implementation of a multi-tiered levy system to better control the influx of foreign unskilled labor. Nevertheless, the new system has not been implemented yet. Australia does not limit the number of foreign workers entering the country on a temporary basis and as such the flows are determined by labor market demands; but over-time rules have become stricter and more specific. In the mid-2000s concerns arose that a ‘lax’ temporary visa regime would result in cheap (and possibly exploited) labor entering the country and undercutting Malaysian workers. To address these concerns, following the advice of a commission of experts, the Australian government introduced some changes to the temporary visa regime and strengthened the English language requirements for foreign workers, imposed a market based minimum salary for temporary workers (higher than the pre-existing minimum salary), started asking employers for their commitment to hire local workers and not to discriminate among workers, and specified local workers’ training requirements that employers were to adhere to (Phillips and Spink, 2012). In Singapore, as a way to reduce the demand of foreign workers and to narrow the wage gap between local and international workers, the government imposes a levy for each worker ‘imported’ in the country. The levy system was set up in 1980 in response to a surge in foreign workers in the construction sector and was expanded in 1982. In 1987, the Singaporean government also introduced a set of dependency ceilings to further regulate the inflow of foreign workers. The ceilings set the maximum number of foreign workers that firms can hire for every local worker (Wong, 1997). Dependency ceilings have varied considerably over time in response to economic conditions; for instance, in the mid-2000s, faced with a strong economy, Singapore raised the ceilings from 50 to 60 percent in the manufacturing sector, and from 30 to 40 percent in the service sector (Rahaman, 2006). In 2007 and 2008, with the economy stronger than ever and record-low unemployment, some ceilings were raised further; the manufacturing limit went up from 60 to 65 percent, while in the service sector the ceiling increased to 50 percent. In the marine sector five foreign workers could be employed every local worker (up from three foreigners per local), and in the construction sector the ratio went from 5 to 1 to 7 to 1. The ceiling for S Pass holders (semi-skilled foreign workers) was also raised from 15 percent to 25 percent (MoM Media Release, 28 November 2007). Since the early 1990s a two-tier levy system has been in place that rewards skills and penalizes excess dependence on immigrants. The levy imposed on high-demand and critical skills is lower than that imposed on workers being hired by firms that have a percentage of foreign workers higher than a certain ceiling (Wong, 1997). In 2010, in the aftermath of a recession and against the
154
backdrop of a 7.5 percent yearly increase in foreign manpower in the country, the Government launched an attempt to achieve long-term productivity-led growth in the country and the Ministry of Manpower raised the foreign-workers levies. For instance, to raise productivity and the quality of foreign workers in the hospitality sector, the levy for passes in the hotel, retail, and food industry was raised by 100 to 260 dollars (MoM Media Release, 23 February 2010). The Government has continued to lower the incentives for firms to import foreign workers in the aim of reducing Singapore’s dependency on foreign skills and forcing firms to be more selective in the workers that they selected from abroad. This is especially true as the economy began recovering and more passes were being requested. To focus on quality rather than quantity of workers entering the country, in early 2012 the Government further tightened the requirements linked to the issuing of EPs by increasing the educational qualification needed and the qualifying salaries (MoM Media Release, 16 August 2011). At the same time, dependency ceilings were lowered across the board and for different skill levels, and a further increase in the levies was announced for 2013. Dependency rates in the service sector for unskilled workers were reduced from 50 to 45 percent, in the manufacturing sector from 65 to 60 percent, and the ceiling for semi-skilled workers was lowered to 20 percent in all sectors, from 25 percent (Table 14). As of 2013 a levy on unskilled workers from China or ‘non-traditional-sources’ countries in the construction sector of US$ 650 will be introduced, and the amount is set to increase to US$ 750 as of July 2013 (MoM Media Release, 21 February 2011).
South Korea adjusts the quotas for foreign workers depending on overall economic conditions. For instance, before the global economic slowdown, the quota for ‘imported workers’ had steadily increased from over 34,000 in 2006 to almost 50,000 in 2007, to over 70,000 in 2008. In 2009, in the wake of the financial crises, the government was however compelled to lower the cap to 34,000; at the time of the decision, a survey of domestic workers showed that about 18 percent of respondent blamed migrant workers for the loss of jobs in the construction sector and 40 percent believed that worsening labor conditions and lower perceived incomes were due to migrants (MoEL FAQ, 23 March 2009). In 2010, in the attempt of ‘protect the jobs of local workers’, the Government announced a further cut in the quota for foreign workers from 34,000 to 24,000; however, shortly after this decision, to accommodate the requests of many SMEs (that had been reporting labor shortages) and given the rapid improvement in overall economic conditions, the government backtracked and re-raised the ceiling to 34,000 workers per year (MoEL website). In 2011 the quota was raised once more and reached 48,000 workers reflecting improved economic conditions, and increase in the demand for foreign workers and following a crackdown on illegal immigrants.
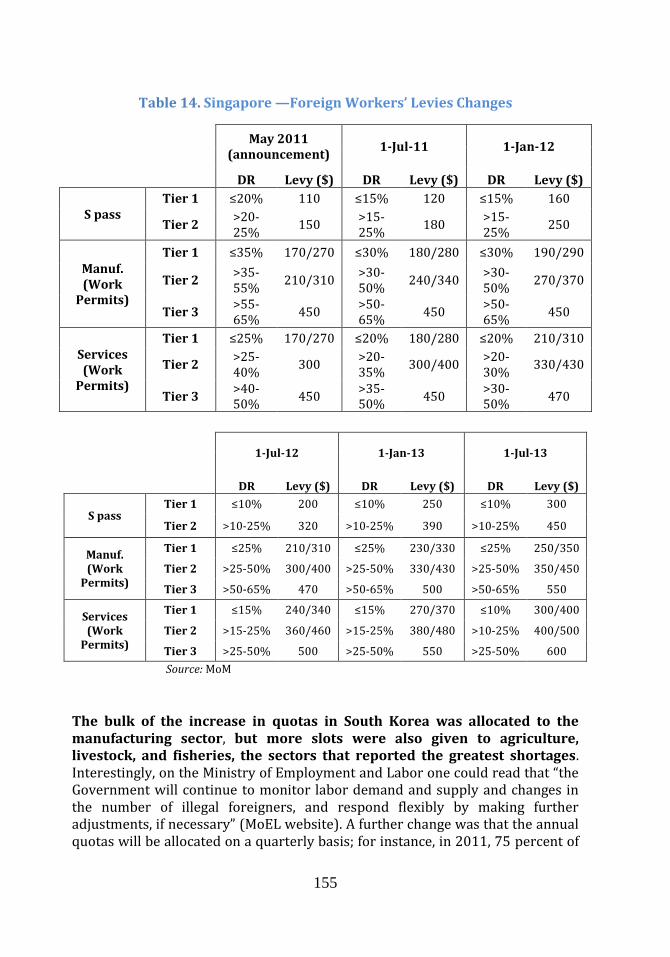
155
Table 14. Singapore —Foreign Workers’ Levies Changes
May 2011
(announcement) 1-Jul-11 1-Jan-12
DR Levy ($) DR Levy ($) DR Levy ($)
S pass Tier 1 ≤20% 110 ≤15% 120 ≤15% 160
Tier 2 >20-25%
150 >15-25%
180 >15-25%
250
Manuf. (Work
Permits)
Tier 1 ≤35% 170/270 ≤30% 180/280 ≤30% 190/290
Tier 2 >35-55%
210/310 >30-50%
240/340 >30-50%
270/370
Tier 3 >55-65%
450 >50-65%
450 >50-65%
450
Services (Work
Permits)
Tier 1 ≤25% 170/270 ≤20% 180/280 ≤20% 210/310
Tier 2 >25-40%
300 >20-35%
300/400 >20-30%
330/430
Tier 3 >40-50%
450 >35-50%
450 >30-50%
470
1-Jul-12 1-Jan-13 1-Jul-13
DR Levy ($) DR Levy ($) DR Levy ($)
S pass Tier 1 ≤10% 200 ≤10% 250 ≤10% 300
Tier 2 >10-25% 320 >10-25% 390 >10-25% 450
Manuf. (Work
Permits)
Tier 1 ≤25% 210/310 ≤25% 230/330 ≤25% 250/350
Tier 2 >25-50% 300/400 >25-50% 330/430 >25-50% 350/450
Tier 3 >50-65% 470 >50-65% 500 >50-65% 550
Services (Work
Permits)
Tier 1 ≤15% 240/340 ≤15% 270/370 ≤10% 300/400
Tier 2 >15-25% 360/460 >15-25% 380/480 >10-25% 400/500
Tier 3 >25-50% 500 >25-50% 550 >25-50% 600
Source: MoM
The bulk of the increase in quotas in South Korea was allocated to the manufacturing sector, but more slots were also given to agriculture, livestock, and fisheries, the sectors that reported the greatest shortages. Interestingly, on the Ministry of Employment and Labor one could read that “the Government will continue to monitor labor demand and supply and changes in the number of illegal foreigners, and respond flexibly by making further adjustments, if necessary” (MoEL website). A further change was that the annual quotas will be allocated on a quarterly basis; for instance, in 2011, 75 percent of

156
the permits for foreign workers were allocated in the first semester of the year as the demand is concentrated in this period. The timing of the permits’ allocation can be adjusted to meet the economic conditions of the country and the market for skills. Quotas fluctuate rapidly in South Korea and requirements are regularly adjusted; however, priority is given to foreign workers willing to exit and reenter the country. The quotas were changed once more in 2012 and increased from 48,000 to 57,000, to reflect the fact the demand for foreign workers was bound to increase following the expiration of a large number of permits issued in the previous years (Table 15). In fact, 11,000 of the total allocation has been reserved for foreigners whose permit was expiring after more than four years and 10 months and that were willing to exit the country and reenter Korea, “especially hardworking” foreigners, and those that passed a Korean language test. Interestingly, the quotas were still allocated differently by semester, with more than 60 percent of the total permits being handed out in the first 6 months of 2012 to satisfy demand from private firms. At the same time, the dependency ceiling in the manufacturing sector was also increased by 20 percent (MoEL website).
Table 15. South Korea Quota Allocations
Sector 2009 2010 2011 2012
Total 34,000 34,000 48,000 57,000
Manufacturing 23,000 28,100 40,000 49,000
Construction 2,000 1,600 1,600 1,600
Service 6,000 100 150 150
Agriculture & livestock 2,000 3,100 4,500 4,500
Fisheries 1,000 1,100 1,750 1,750 Source: Ministry of Employment and Labor website:
http://www.moel.go.kr/english/dont_miss/faq_view.jsp?&idx=130
http://www.moel.go.kr/english/topic/employment_policy_view.jsp?idx=705
http://www.moel.go.kr/english/topic/employment_policy_view.jsp?idx=890
The United States offers an example of a system that does not allow the ‘import’ of workers with the skills with the potential to add the greatest added value for the country. The main reason for this policy failure is that the number of visas that can be grated to skilled workers on any given year is delinked from the labor markets. Despite the contribution that skilled migrants have made to the US economy throughout the history of the country, the number of work permits for foreign workers has been arbitrarily fixed at 65,000 since 2004 and the cap has failed to change despite the changing economic conditions.
157
For instance, the demand for visas for high-skilled workers (H-1B) exceeds the total allocation almost instantaneously and in several occasions the permits had to be allocated using a lottery system among potential employers. This of course lowers the chance of the prized visas being handed out to the most deserving workers or that the skills in the highest demand are brought into the country. The number of visas is not influenced by growth patterns in the US and the ceiling is set at a much lower level than necessary; indicatively, in 2011, in the midst of the recession, the demand for H-1B visas far exceeded the 65,000 cap (Council on Foreign Relations, 2009).
In Taiwan, the number of migrants accepted into the country is controlled by a quota system. However, if the worker leaves the firm that brought him or her into the country (or he/she simply disappears), the firm loses its quota. This gives a strong incentive to firms to control their workers, with firms often resorting to confiscating immigrant’s passports, limiting foreigner’s social activities over weekends, forcing upon them ‘saving plans’ (that is, deducting a part of the workers’ salary every month and eventually returning the amount at the end of the contract or on the departure day of the immigrant). Such strategies often result in significant violations of the workers’ rights on behalf of the employers and probably lower the incentive of high skilled workers to relocate to the country. Furthermore, employers importing workers into the country have to pay a ‘security fee’ to the Government levy on foreign visas, ranging from US$ 200 to US$ 1,000 per month depending on the sector of employment (Council of Labor Affairs website); at the same time, migrant workers wanting to enter the country have to pay a brokers’ fee of anywhere between US$ 3,500 and US$ 4,500 to get their foreign visa, yet another form of exploitation of foreign workers (Kung, 2010).
5.4.2 Priority Sectors and Occupations, and Proof of Lack of Malaysians Message: it is good practice to compile a list of occupations in need of foreign labor and to prioritize applications in these sectors. This exercise requires reliable data that is regularly collected and available to all Ministries and Government entities in charge of regulating immigration and reforming
immigration policy. Most countries develop a list of occupations that tend not to be filled by local workers or identify sectors where skill shortages are severe or projected to be significant over the coming years. These lists are then often used to grant foreign visas or to prioritize applications. Besides providing critical information on human resource needs to relevant agencies of Government, this system can serve as a check-mechanism to avoid overuse of foreigners over locals. Currently the Government of Malaysia asks employers to prove that local workers could not be

158
found to perform certain duties; but the employer’s information is likely to be subjective to their situation. This system can bring in objectivity into the process while allowing the Government to be more proactive in meeting human resource needs. Malaysia introduced several reforms aimed at creating a more efficient system for managing foreign workers. Particular efforts have been made to reduce the time for administrative processing of various procedures. However, there is still room for improvement. As discussed in the previous chapter, the introduction of the Job Clearing System represents an efficient way to ensure that local workers are not discriminated in favor of foreign workers. In addition, with the creation of the One Stop Approval Agency in 2005, the processing time to recruit foreign workers has been considerably reduced. However, a large and, sometimes, unclear number of restrictions on the requirements necessary to hire foreign workers (sector, sub-sector, size of the firm, nationality of the foreign workers, among others) still make the process not transparent and difficult to predict for the employers willing to employ foreign workers. The Government of Australia established an independent agency to assist on the issue of skills development. In 2008 the agency Skills Australia (now replaced by the Australian Workforce and Productivity Agency) was set up to advice the Ministry for Tertiary Education, Skills, Science and Research on the issue of skill development. The agency, with the collaboration of the Department of Education, Employment and Workplace Relations and in consultation with the private sector, the trade unions, and different trade organizations, develops on a yearly basis the country’s Skills Occupation List, which lists the sectors in critical need of foreign workers. The list is the passed on to the Ministry of Immigration and Citizenship and used to influence the number of migrants accepted every year into the country in each sector46. The Foreign Manpower Policy Committee in Korea sets the quota by sector. The Foreign Manpower Policy Committee chaired by the Minister of the Prime Minister’s Office sets the quotas for the country and for each sector in particular, prioritizing the areas in which skills shortages are deemed to be the greatest. However, to raise the cost for employers of hiring foreign workers, firms wanting to ‘import’ foreign labor must first offer the jobs to a Korean national through an Employment Security Center. The Employment Security Center has the duty to advertise the vacancy publicly and, if it fails to find any suitable domestic workers it can recommend to the employer a number of foreigners that can fill the vacancy (MoeL website).
46 The Skills Australia Act 2008 can be found at: http://www.comlaw.gov.au/Details/C2008A00010

159
In the United States, foreign visas are also issued conditional on approval from the Department of Labor and certain skills or occupations are prioritized. For instance, priority workers are ‘persons with extraordinary ability’ in sciences, arts, education, business or athletics, outstanding professors, and managers or executives of multinational companies. Foreign investors, people with advanced degrees, workers with special skills are also given priority and given special consideration for foreign status in the United States (USCIS website). In the late 1990s and early 2000s the IT sector was a main driver of the increase in the allocation of H-1B visas in the country, reflecting the importance of the technology sector and the ensuing economic growth (Martin and Lindsay Lowell, 2008). Similarly to Korea, in most cases employers applying for an H-1B visa on behalf of their potential employee are requested to prove that no domestic worker can fulfill the duties of the job in question; firms need to advertise the vacancy on local newspapers, collect applications and eventually justify why a certain foreign candidate is the best and uniquely suited to take on a given role (DOL website). Many developed countries have been attracting foreign students as a way of increasing long term and more permanent skilled migration. The United States also tried to follow suit. Even though the US remains the largest recipient of foreign students, the number has been declining after September 11, 2001. As such, since the mid-2000s, the Department of State has been focusing once again student visa issuing and enrollment rates of foreign students have started increasing again, surpassing pre-September 11 levels in 2007 and reaching a record 624,000 in 2007/08. Furthermore, the Department of Homeland Security introduced a special work authorization visa (Optional Practical Training) according to which students graduating in science, technology, engineering or mathematics can work in their field in the country for 12 to 29 months upon graduation. This work program is aimed at increasing the chance of high-skilled young workers finding employment in the United States and remaining in the country for prolonged periods (Council on Foreign Relations, 2009). Canada has been prioritizing certain occupations since the introduction of the amendments to the Immigration and Refugees Act in 2008. As the government attempted to increase the focus on the economic component of migration inflows, greater emphasis was put on rapid integration of migrants into the local workforce and on a list of ‘designated’ occupations that displayed significant skills shortages in certain provinces around the country. Visa applications from workers willing to work in the designated occupations were given extra points and processed with higher priority. For on the other hand, when employers start the process of requesting visas for immigrants, proof that local workers cannot fill the vacancies in question is often requested (CIC, Annual Report 2011).

160
5.5 Integrating Foreign Workers into the Local Labor Force
Message: to maximize the economic benefit brought about by skilled foreign
workers, setting up channels to transition from a temporary to a permanent
status is important to retain the skills of migrants who have already been
successfully tested in the local labor market.
Malaysia has recently introduced new passes to allow foreign skilled workers to remain in the country. Since 2011, high skilled workers can apply for the Residence Pass for Talent (RP-T), a 10 year work visa that gives expatriates the opportunity to work in Malaysia without needing to renew the status every time they change employers. In addition, work passes can be extended on a case-by-case basis, depending on the skill level of the foreign worker (as discussed in the previous chapter, the National Vocational Training Council or the CIBD can issue special certificates that attest workers’ ability and then can be used to obtain an extension of their permits). In Australia the government recognizes the importance of temporary workers for the economy and has been focusing on integrating foreigners into society and on maximizing the chances of their economic success. Foreign workers are not required to reapply for a visa if they change employer and are granted the same rights as local workers (DIAC website). As of July 2012, the ‘Temporary Residence Transition Stream’ was introduced, an initiative that fast-tracks the process of obtaining permanent residency for foreign workers on temporary visas (DIAC Media Release, March 9, 2012). At the same time, to give a further incentive to foreign workers to move to the country and to stay permanently, applicants for temporary or permanent visas are allowed to request visas for their family members as well, including work and study authorizations. The government also stresses the importance of family reunification by setting aside a significant proportion of its foreign visas to family members of both Australian citizens and permanent residents (DIAC website, Fact Sheet no. 29). Canada makes has a policy to integrate foreigners into society. This is a policy objective clearly stated in the country’s Immigration and Refugee Protection Act. To this end, Citizenship and Immigration Canada implements a Settlement Program that provides services to incoming foreigners (such as language courses) and the country maintains a generous regime when it comes to family reunification and path to permanent residency and citizenship (CIC, Annual Report 2011). Furthermore, through the Canadian Experience Class program, skilled foreigners who have already been tested in the Canadian labor market for at least two years can apply to become permanent residents; the
161
applicants need to pass a language test, have relevant work experience in the country, or have studied in a higher education institution in Canada, or both, and need to be skilled enough to work in managerial, professional, or technical positions, or in the skilled trades. Family members can be included in the application (CIC website). Finally, permanent residents over the age of 18 and that pass a citizenship and a language exams can obtain full Canadian citizenships after residing in the country for at least three out of the four years preceding the application. Citizens’ rights include that of holding a passport, the right to leave and return to the country, the right to vote and to hold office (Border connections website). In the United States, after five years as a permanent resident, foreign workers can apply for citizenship. The period is reduced to three years if the worker is married to a U.S. national (USCIS website). In Singapore, foreign workers on a skilled or semiskilled pass can apply for a dependents pass for their spouses of unmarried children younger than 21. Dependents of Employment Permit holders (P, Q or S category) are normally allowed to work in the country conditional on gaining authorization from the Ministry of Manpower (MoM website). Alternatively, for domestic partners or common law spouses, and daughters, stepchildren, disabled children, parents and parents in law of EPs or S Passes can apply for a “Long Term Social Visit Pass” that can also include work authorization (MoM website). Skilled and semi-skilled workers on P or S permits can furthermore qualify for permanent residency after at least 6 months working in the country (and need to prove so with pay slips); however the criteria to be granted a permanent resident permit are not made public and remain somewhat unclear, lowering the level of transparency around the whole process (Guide me Singapore website). After two to six years of permanent residency (depending on the skill level), foreigners of at least 21 years of age can apply for full citizenship (Immigration And Citizenship Authority website).
South Korea allows foreign workers ending their term to reenter to work in the same place of business they left without facing tests or having to train. The country allows foreign workers that have been working in the country for four years and 10 months have to leave for at least three months, after which they are allowed to return and resume work in the same place (or with a different employer) without undergoing the Korean language test or any further employment training (MoEL website). Three to five years after gaining a permanent residency permit, foreign workers can apply for naturalization (Hi Korea website). Taiwan practically prohibits temporary foreign workers from obtaining permanent resident status in the country. Migrant workers are controlled by

162
a strict quota system and are allowed to work in Taiwan only for a limited amount of time, after which they are forced to leave for at least a day in order not to be able to apply for permanent residency. Furthermore, after nine years working in the country, foreign workers are not allowed to reenter Taiwan for another temporary work contract. Family reunification is not allowed and foreign unskilled workers are forbidden from marrying Taiwanese people or from bringing dependents in the country, while their period in the country does not count towards naturalization. The strictness of the Taiwanese system emerged as a result of the fact that the Taiwanese welfare system was not set up with the challenges that an ageing society presents. Presently, foreign workers are then needed to fill the needs of the country’s welfare system and to take care of the elderly and disabled. Low-skilled workers are simply seen are complementary to the country’s labor force for the roles that cannot be fulfilled by locals and are considered society’s guests. However, foreign workers are granted very few rights and are often treated like second-rate individuals; many migrants work more than 12 hours per day, have very limited mobility (for instance have to reside in dorms provided by employers and cannot change employer), are not allowed to form unions, and many are subject to maltreatment and abuses (Kung, 2010).
5.6 Preventing Undocumented Immigration
Messages: When it comes to undocumented immigration, country cases
illustrate that it is important to: (1) Have in place a clear legislation
regulating the activities of migration agencies; (2) Have strict punishments
for employers hiring undocumented workers to discourage the practice; (3)
Enact laws compatible with the enforcement capacity of a country; and (4)
Impose affordable costs and fees for employers and migrants to prevent
undocumented migration
In Malaysia, the high volume of undocumented migrants over the years has pushed the government to take measures to address this phenomenon. As already pointed out, the enacting of the Anti-Trafficking in Person Act as well as the introduction of stricter conditions for private agencies to be licensed by the MOHA only partially addressed the issue. The Malaysian government is aware of the importance of this problem and in the last years imposed harsher penalties for both employers and employees involved in irregular migration. The implementation of the 6P Program represents another step taken to fight undocumented migration. However, whether the program will provide a
163
permanent or temporary solution to the problem can only be established after some years from its completion. The evidence seems to suggest that as long as recruitment costs will be high for employers and immigration fees high for foreign workers economic incentives will lead to illegal migration as a natural outcome. In Australia, an increased inflow of illegal foreigners led to the government toughening civil sanctions on employers. These are imposed both on individuals and firms hiring paperless workers and updating the system allowing firms to check the visa status of the foreign workers that they are about to hire. In parallel an awareness campaign was launched in the country to educate the population on the legal changes made (DIAC Media Release, 3 August 2012). In Singapore, to lower the incentives to hire illegal immigrants, employers became solely responsible for checking the legality of their workers. Illegal foreigners have been entering Singapore since the 1970s. The government became worried about the issue only in the late 1980s when the economic boom resulted in a huge increase in the demand for foreign workers that could not be accommodated by the permit system; as such the inflow of illegal workers increased dramatically and shortly thereafter the government cracked down on illegal immigration by both increasing the number of arrests and, after amending the Illegal Immigration Act in 1988, by toughening the punishment for illegal workers caught in the country. In 1995, alerted by the increasing number of illegal foreigners in the country and by the number of over-stayers, the government amended the Illegal Immigration Act once more; contractors and employers found employing illegal workers became responsible for the violations and could no longer blame sub-contractors or deny knowledge of the worker’s illegal status. To lower the incentives to hire illegal immigrants, employers became solely responsible for checking the legality of their workers and prosecutors were not required to prove that the employer knew about workers’ illegal status any longer; employers found hiring illegal workers faced hefty fines and jail time. In 1998, the punishment for illegal immigration and for employing illegal workers were toughened further; the maximum punishment for illegal entry was revised upwards and traffickers could now be imprisoned for up to 24 months; employing illegal foreigners cost US$ 20,000 in fines, up from 10,000$ before the changes, and firms’ managers could be held personally responsible for the crime. Despite the attempts to crack-down on illegal immigration, the continued presence of illegal workers in Singapore can be seen as a result of employers trying to avoid paying the heavy levies associated with the application for a workers’ permit (Wong, 1997). In South Korea one of the reasons for high levels of illegal immigration is the stringent dependency ceilings, especially for small firms. South Korea also faces significant issues of illegal migration. In the early 2000s, illegal
164
workers reached 80 percent of total workers; following an amnesty program and the introduction of the Employment Permit Scheme, the number decreased dramatically and reached about 355 of the workforce, but the trend eventually reversed and settled at over 50 percent in 2007. Among the reason for such high levels of illegal migration seems to be that the dependency ceilings for firms employing foreign workers are often too stringent especially for small firms; the law stipulates in fact that firms with less than 50 employees cannot hire more than half of their workforce from abroad (Hur and Lee, 2008). Furthermore, the regulations around the hiring of foreign workers are sees as too complicated and costly, and firms often find it more profitable to offer jobs to those overstaying their visa or entering the country illegally. Worryingly, as illegal workers are not protected by the law like documented workers, and given that illegal foreigners rarely report abuse with the police for fear of deportation, the risk of exploitation is high and social integration becomes more difficult (Kee, 2009). The United States exemplifies the potential consequences of setting up an immigration system that does not respond to market needs and is too stringent with respect to importing foreign workers. Even though migration systems should not be entirely based on economic considerations, simply ignoring the market forces that drive migration flows can have perverse consequences and generate spillovers; the huge inflow of illegal foreigners in the U.S. is a fitting example. The fact that over 800,000 (mostly unskilled) workers are estimated to make their way illegally into the United States every year is in fact a consequence of the fact that life in the country on one hand appealing to many in other countries, but also that employers need cheaper and low-skilled labor and will fulfill their needs resorting to illegal markets if the legal one will not respond to their demands (Council on Foreign Relations, 2009). The reasons behind this huge flow of illegal foreigners into the United States are multiple: The allocation for green cards for unskilled workers and their families is a
mere 10,000 per year, a fraction of the total demand. Similarly, the allocation for H-2A visas (temporary work visas for the agricultural sector, hence for mostly unskilled labor) is limited and too small to meet seasonal demands, and the application process is seen as costly, complex, burdensome, and managed inconsistently. Only about 75,000 out of a 2.5 million workforce in the agricultural sector are in fact admitted into the country through the H-2A program (Council on Foreign Relations, 2009).
The system for family-based migration is slow and inefficient. For instance, the process to bring a sibling from the Philippines into the U.S. can last more than 20 years, while an adult child from Mexico waits more than 15 years. Even children and spouses of legal workers in the U.S. can end up waiting more than five years to access the U.S. Such delays hardly provide an
165
incentive for families to try and enter the United States legally and together and thereby foster illegal immigration (Council on Foreign Relations, 2009).
Attempts to set up temporary working programs for unskilled workers (especially from Mexico) that would otherwise enter the U.S. illegally have mostly failed. Programs such as the ones enacted under President George Bush in 2006 and 2007 aimed at attracting low-skilled workers into the country and expanding temporary workforce, and would have allowed the U.S. government to monitor the inflow of migrants; however, enforcing minimum wage legislation, ensuring foreign workers’ rights and workplace standards have been the main reasons behind the failures of many of these programs (Council on Foreign Relations, 2009).
Since 1986, when the US government halfheartedly passed and implemented the Immigration Reform and Control Act that extended an amnesty to illegal foreigners already in the country while toughening the enforcement measures against the employment of undocumented workers, no serious legislation discouraging employers from hiring illegal labor has been passed. The 1986 legislation was never properly enforced for both political and technological reasons, and in recent year the situation has gotten worse. Employers have no way to determine the real status of a worker and those hiring illegal foreigners are rarely fined, and the penalties are low anyhow; as such, there is no real disincentive for firms to use illegal labor. Furthermore, the legislation did not include new provisions to grant foreigners temporary work permits. If anything, the 1986 half-baked attempt to contain illegal migration accelerated the inflow of undocumented workers (Council on Foreign Relations, 2009).
The analysis suggests that the U.S. government should consider lowering the incentive for employers to hire foreign illegal workers (by raising fines and enforcing the existing legislation), while making it easier for firms to verify the legal status of workers that there are about to hire (by strengthening the E-Verify system). Of course, making the overall system more responsive to market needs would be highly desirable although the political capital to do so might be lacking.

166
Chapter 6: Issues for the Government to Consider and Recommendations Going Forward

167
6.1 Making the Report Useful for the Government
Malaysia’s rapid economic growth accompanied by labor market shortages for unskilled workers continues to attract foreigners from neighboring countries. The differences in growth differentials and overall educational gaps between the labor forces of Malaysia and its more populous neighbors, such as Indonesia and the Philippines, are the key pull and push factors that fuel the current migration patterns. Appropriate policies need to be designed with these fundamental gaps in mind. Demand for foreign unskilled labor in Malaysia has amplified several long-term trends that also contributed to the rapid economic growth. The first one is the rapid advance in the education level and skill upgrading of the Malaysian labor force. This is very clearly visible in LFS data through the decline in the ratio of the population with primary schooling (or less) and the accompanying increase in the higher secondary and tertiary educated groups in the labor force. The second force is the continuing importance of certain natural resources and labor-intensive sectors such as agriculture, manufacturing of wood products, as well as domestic service sectors such as construction. The former group led the export boom and integration of the Malaysian economy into the global economy. Even though its share in exports has declined rapidly and been replaced with more high-tech sectors, it is still important within the economy and employs a sizeable portion of the domestic labor force along with immigrants. Service sectors, such as construction, are important parts of the dynamic domestic economy that has visibly shaped the landscape of the country. The end result is the employment of large numbers of foreign workers in the Malaysian labor force, estimated to be around two million even though more accurate and detailed data are clearly needed. The economic analysis in the earlier chapters of this report focuses on understanding the impact of immigration on the labor markets and firm productivity, and measuring the impact of changes to the immigration system on these outcomes. Data used in these sections come from official administrative records, LFS and firm-level economic censuses. These data are used with different econometric and computation general equilibrium techniques to identify the impact of immigration on the Malaysian economy, and more specifically on the domestic labor market. These numerical and statistical analyses are then combined with policy analysis to provide a comprehensive picture. The main conclusions from the analysis are that, on average, immigration continues to be economically beneficial to the country’s economy. But the economic benefits are not equal for all segments of the Malaysian working
168
population or across all economic sectors. Skilled and semi-skilled Malaysians benefit greatly from the presence of foreign workers; however, unskilled Malaysians experience negative impacts on their labor market outcomes. Results also show that the presence of foreign unskilled workers allows Malaysians to invest in their own education and enables them to work in higher skill occupations identified by the Government as critical to reaching its goal of becoming a high-income economy by the year 2020. On the enterprise side, the presence of foreign workers has been (and continues to be) a key factor in Malaysia’s competitiveness and economic success, especially among export-oriented companies in the manufacturing sector. Foreign labor continues to translate into increased productivity in key economic sectors such as manufacturing and construction; however, the same is not true in all segments of the agricultural sector. Firm size seems to matter when it comes to benefiting from foreign labor in terms of increased productivity. Further analysis (and access to data) is needed to understand the effect on key service sub-sectors. Given the results from this report, we recommend that going forward, it will be critical for all stakeholders to recognize that the economic benefits from immigration to Malaysia continue to exceed the economic costs. This is especially true as most Malaysians continue to raise their education levels and labor-intensive sectors such as agriculture and construction (and sub-sectors in manufacturing and services) remain important to the country’s future growth. Thus, at this juncture, policy reforms should not seek to hinder the process of foreign workers admissions by setting potentially distortive quotas, or raising levies to economically harmful levels. Instead, the Government should consider reforming its immigration system to be more responsive to market demands for foreign labor and to allow it to regularly monitor labor needs using detailed and reliable data. At the same time, the Government should consider reforming its policies and processes in recruiting, retaining, and monitoring foreign workers. Lastly, the Government should consider adopting lessons from benchmark countries to strengthen its enforcement mechanisms to deter illegality. This is especially critical in light of the implementation of the minimum wage laws. A large number of foreign workers were paid below minimum wage levels prior to its implementation. The incentives for employers to evade minimum wages by employing foreign workers informally or illegally will only have increased with the minimum wage laws. Malaysia has both the need and the means to implement such an institutional framework.

169
6.2 Key Lessons from the Analysis
Continued demand for unskilled foreign labor and increasing demand for foreign talent reflects the current Malaysian economic situation of being a growing middle-income economy trying to escape the middle-income trap. The main lesson from this analysis is that Malaysia is presently facing a special dilemma. On the one hand Malaysia is a heavy user of low-skill labor, which is quite limited or no longer available within the native labor force. There are many sectors that are critical for the national economy and are dependent on availability of relatively unskilled labor. On the other hand, Malaysia is becoming an increasing user of specialized high-end skills without currently having an available critical mass nationally. Given these characteristics the country will continue to rely on foreign labor at both ends—unskilled and skilled—in the foreseeable future. Therefore, an abrupt disruption of foreign unskilled labor supply could cause unpredictable effects in the domestic economy. Given that the unemployment levels are extremely low and the vast majority of Malaysian workers do not compete with foreign workers, it is unlikely that there will be any benefits to domestic workers from a decline in immigration levels. Thus, the Government is highly encouraged to review its immigration program and design highly nuanced policies to accommodate the economy’s particular shortages by sector and human capital categories. Several traditional sub-sectors have not been able to (or cannot) mechanize and are still dependent on low cost labor to operate and stay competitive. At the same time, Malaysian workers have been increasing their skill and human capital levels and there is currently a low supply of unskilled Malaysians willing (or able) to work in certain sub-sectors and occupations. These labor-intensive traditional sub-sectors (food services, construction, export-oriented manufacturing of wood and textiles, and agriculture) are still critical to the Malaysian economy. The analysis indicates that a large number of these firms, and possibly their whole sub-sector, would simply cease to exist without the cost advantages provided by low-skilled foreign labor. Therefore, given the types of activities and markets that these companies operate in (low value-added) they will continue to rely heavily on low-skill (low cost) foreign labor in the foreseeable future. There are also skills gaps on the higher end of the spectrum. Since it takes a long period for the education and training systems to produce new core skills, it is likely that the country will have to rely on foreign workers to fill these occupational gaps to avoid having labor bottlenecks. Without foreign labor, these sectors would simply disappear and lead to unemployment of significant number of mid-skilled Malaysian workers in the short- to medium-term.
170
The analyses presented in this report indicate that the overall effect of employment of foreign workers is positive for Malaysia since they fill important gaps in the overall labor force. However, there is significant variation on who benefits, in terms of economic sub-sectors, education levels of Malaysians and age groups. The benefits of immigration are highest for Malaysians with secondary education, rather than those with less (primary) or more (tertiary) education. Workers with secondary education are likely to work as supervisors of unskilled foreigners and generate the highest level of complementarities. Since this is the largest group of the Malaysian labor force, the overall effects are positive. Another positive aspect worth noting is that immigration benefits older (mid-30s to early 40s) workers, a segment of the population that is relatively difficult to retrain and re-enter the labor force after unemployment spells. Thus, a sudden decline in the numbers of foreign workers is likely to hurt middle-aged, secondary educated and mostly male workers the hardest. Any sudden intervention in terms of immigration policies needs to take this into account. Malaysians with primary education, whose numbers and share in the labor force have continued to decline rapidly over the last two decades, are likely to suffer the most from adverse effects of immigration since they compete directly with low-skill foreign workers. The negative effects of foreign labor on unskilled and low-skilled Malaysians are an important fact worth pointing out, especially because this group will continue to be vulnerable to competition from foreign workers in terms of employment and wages. Thus, from a policy perspective, it is crucial for the current educational system to target primary and secondary school dropouts and to provide them with second opportunity avenues to reintegrate into the educational system. Thus, the best policy to protect low-skilled Malaysian workers is to provide training so they can acquire more human capital, especially in fields of study that are in high demand in the economy, and where low- or mid-skill foreign labor seem to be unsuitable. Among these are certain service sectors such as healthcare, retail and business services. Tertiary educated workers are the least impacted by increases in immigration in the labor market. When immigration decreases by a large amount, due to a drastic rise in costs to employ immigrants, degree holders in the services sector see a slight increase in unemployment. There is a certain level of distance between high-skilled (tertiary educated), medium-skilled (diploma holder and secondary), and low-skilled (primary) workers. Tertiary educated workers are less likely to be working in the same sectors/firms as less educated foreign workers. As such, there are fewer

171
potential complementarities and externalities—positive or negative—transmitted. Of course, literature indicates that highly skilled professionals are consumers of the services and products produced by low-skilled workers and benefit from their presence in the labor market. However, this report does not address the impact of foreign workers on the consumers, though this is an important issue that deserves future attention. Another positive impact of immigration for tertiary educated Malaysian, mainly for families with children, is the availability and affordability of domestic household services, such as childcare. The availability of household help is an important determinant of labor force participation decisions of tertiary educated women who make up half of the recent university graduates in Malaysia. Results show that immigration in Malaysia helps increase women’s labor force participation full-time (and less so for part-time) work. But impacts vary broadly by economic sector; for instance, the impacts are very positive and significant for women working in the services sector (especially in finance, business and real estate, insurance, health, and other high value-added services). This factor is likely to increase in importance as time passes since women currently make up a majority of students enrolled in universities. The inability to effectively integrate a large portion of the tertiary educated workers into the labor force would significantly dampen the long-term growth prospects of Malaysia. The impact is negative for women working in the manufacturing sector. Though the analysis does not indicate if the impacts are through substitutability of women in household activities or complementarities in the productive sector, it is clear that foreign labor has a positive effect on women’s employment in Malaysia. A caveat is that even though this channel of support to women presents another policy area worth considering, positive effects may be attenuated by other costs not considered. Thus, from a policy perspective, the Government has to weigh the costs and benefits of promoting the use of domestic help as an avenue to get women back in the labor force. Firm-level data indicate that the impact of immigration on firm productivity depends on the economic sub-sector, as well as certain firm characteristics such as size and ratio of foreigners to locals. Immigration has a positive effect on some economic sub-sectors in manufacturing, and in construction. However, it has a negative effect on the small firms in some sectors, notably plantations and construction, the two largest users of foreign labor. There is no measurable effect on ICT-services and accommodations. Differentiated effects across sectors are largely due to the size and types of firms in the sector (SMEs, multinational, export-oriented, etc.), the

172
tasks that foreigners are asked to perform, the complementarity between foreigners and local workers, and the complementarity between foreigners and the production process (for example, technology, mechanization, and literacy needs). It is important to note that technological progress and low-skilled foreign workers do not, in general, hamper productivity improvements, as there is significant variation across sectors and regions. In agricultural firms where the share of foreign workers is the highest, immigration leads to lower productivity only in the small firms. On the other hand, in manufacturing sectors and various service sectors immigration is related to improved productivity, especially in larger firms that are able to take advantage of complementarities. Even though there is evidence on positive linkages to technological progress, there is need for better data collection at the firm level to measure these more precisely. A critical lesson (related to measuring impact) to emerge in this analysis is the importance of investing in the collection of reliable, high quality and detailed data on all workers—local and foreigners—to properly understand the effect of immigration and evaluate future policy changes. Given the extensive share of undocumented and irregular immigration in Malaysia, it is especially important for the authorities to have detailed data on the labor force, which is collected on a regular basis. It is also very critical for the authorities, especially for the MOHR and MOHA to have these data in the context of a nationally (or state level) representative LFS, and that the data include information on wages, place of origin, education levels, sectors of employment, and other personal characteristics of all Malaysian and migrant workers. The Malaysian LFS and Economic Censuses are extremely valuable sources that proved to be useful and quite impressive than comparable data sources in other countries. However, there are still shortcomings that need to be addressed in the future data collection rounds and inconsistencies between them that need to be reconciled through more comprehensive and integrated collection programs. Going forward, it will be very important that utmost effort is spent to guarantee that all immigrants, especially irregular and undocumented immigrants, are properly represented in LFS data. These data will be critical sources for the evaluation of new immigration policies planned or currently being implemented.
6.3 Key Institutional Issues to Consider
Given continually changing market needs and global competitiveness, it is necessary for migration systems to be closely linked to labor market needs and to be flexible to respond to changes in the environment. Moreover, policies need to reflect the needs of the labor market with attention to sectoral and human capital needs of the economy.
173
It is good practice to update and introduce new channels of entry so that foreign workers with the needed human capital profiles can be admitted efficiently and quickly. The experiences of Australia, Canada and Singapore (see Chapter 5) evidence the importance of having regular consultations with key stakeholders to maintain close linkages between immigration policies and market needs. Interviews with Malaysian stakeholders revealed that consultations with policymakers on matters related to immigration policy are ad-hoc and do not effectively inform the Government of market demands. Migration programs should be fine-tuned towards the specific needs of the modern economy and respond swiftly as the underlying labor demand/supply conditions change. For example, instead of issuing a total number of visas for manufacturing, each subsector may receive different number of visas for different education and even occupation categories. Naturally, these need to be determined in coordination with the employers of such workers, while paying close attention to labor market developments and making sure domestic workers are not disadvantaged. Any efficient immigration system should deliver the right skill mix in a short period of time with minimum transactions (search, wait and regulatory compliance) costs for all parties involved. Foreign worker recruitment should be based on quality rather than quantity. Systems that work well have a recruitment process of foreign workers that is: (i) based on streamlined procedures that reduce waiting costs for the employers, and (ii) transparent and predictable to allow for the employers to plan and foresee the outcome of applications. Australia has shown continuous efforts to ensure this. In Malaysia efforts have been made to introduce greater efficiency into the system for managing migrant workers, particularly in reducing the time for administrative processing of various procedures. Such efforts are beneficial and should continue. Unskilled foreigners contribute their physical labor whereas skilled foreigners contribute their intellectual abilities. In fact, studies from other countries show that skilled foreigners (or talent) improve productivity, induce technological upgrades, and increase knowledge transfer to local workers. Thus, if Malaysia seeks to improve its productivity it should consider reforming its policies to retain skilled foreigners already in the country and attract new ones to Malaysia. To do this, the Government should consider more flexible entry regimes and more promising long-term opportunities. Many countries are moving away from aggregate quantity targets. The impetus is towards more finely tuned migration policies where the quantity restrictions and levies are designed for each sector and education level

174
separately. But such a system requires more precise measurement of labor market needs and regular updating of key indicators. These are necessary to avoid additional distortions, creating bottlenecks in the economy, and harming key economic sectors. Imposing a cap on the number of foreigners to be admitted is a difficult task that involves numerous risks (as clearly seen from the US experience). On the contrary, it is necessary to identify the skills (education, language, occupation, among other human capital dimensions) needed in the economy while imposing criteria to assess whether labor shortages are genuine. Then it becomes possible to ensure that Malaysian workers are not harmed by the recruitment of foreign workers and the needs of the employers are met. In Malaysia, the difficulty in finding optimal levels for both quotas and levies show that there is room for improvement. In addition to caps on the number of visas issued, it is more efficient to implement different levy levels for each sector/occupation to finely manage and direct the inflow of immigrants. For example, levy levels can be set at lower levels in sectors and regions where domestic labor supply is limited and foreign workers are absolutely needed for the survival of the firms. The use of levies more extensively and precisely is very similar to the transformation that has been observed in international trade policies over the last six decades. Tariffs proved more efficient and effective than quotas and other quantitative restrictions in reaching desired policy objectives. As a result, tariffs replaced quotas in almost every country in almost every product category. The main areas where quotas are prominent are agriculture where there is a large literature on the resulting distortions and inefficiencies. It can be more effective and efficient for the Government to adjust levy levels compared to adjusting quotas that can only be implemented with a lag. Levy levels can be set in the form of tax-type fees that would be paid to the Government along with all the other taxes on a regular basis. On the other hand, quotas need to be set for certain period of time (for example X number of permits in sector Y during this year) and it would be difficult and inflexible to decrease their numbers. Levies also provide more flexibility to the employers, allowing them to plan ahead for their workforce needs more effectively and flexibly. Firms would not worry about sudden shortages for foreign worker permits or be left without workers. Firms can meet sudden demand spikes for their products by increasing their labor shortage by importing workers on short notice. If there were quotas, availability of permits could impose severe constraints.

175
Another tool that is being used in other countries, such as Singapore and in the Persian Gulf, is to adjust the quantity restrictions and levies based on the type or size of the firms. The levies are increased as the ratio of the foreign workers on the payroll of the firms increases, which forces firms to adjust their overall workforce composition carefully. These adjustments, again, can be based on the sector, size and location of the firms and can change over time, based on the underlying macroeconomic and global conditions. It is, of course, extremely important to make sure that the bureaucratic burdens created by a differentiated system do not overwhelm the Government agencies and firms while implementing such relatively complicated schemes. The institutional chapters of this report highlight how difficult and potentially costly it is to implement a multi-tiered system in Malaysia, especially for smaller firms that have already lower value-added and productivity levels. One option is to impose the multi-tiered regime where the levies are imposed on firms above a certain size or in a given sector. Again, the trade-off between economic efficiency and bureaucratic implementation costs needs to be carefully evaluated and the programs need to be designed along the principles discussed in the policy sections as reviewed below. Another word of caution is on sudden levy changes and keeping them at a level that is not responsive to labor market needs and demand constraints. Too high levels might lead to increases in undocumented and informal immigration. This is especially critical at this point in Malaysia since the implementation of the new minimum wage law is likely to increase the payment to foreign workers from their previous levels. As such, incentives for hiring of undocumented foreign workers without proper reporting and taxation are likely to increase. Thus, it is also important to increase enforcement and surveillance activities along with these types of policy changes. Given the easy flows of skills across countries, a goal of Malaysia’s immigration policy should be to create the right incentives to attract foreign talent. Limiting the length of employment permits could deter skilled workers from choosing Malaysia as a destination country. Australia and Canada have been particularly proactive in this respect and as described in Section 5.5 have designed channels of transition from short to longer stays and eventually permanent residence. Malaysia has taken steps in this direction by introducing the Residence Pass for Talent (RP-T), a ten-year work visa that gives expatriates the opportunity to work in Malaysia without needing to renew the status every time they change employers. In addition, foreign workers can obtain Permanent Residence if they pass a point-based system that stresses age, education, work experience, language skills, and ties with Malaysians as important requirements.

176
Like expatriates, less skilled foreigners will have a positive impact on the Malaysian economy since they complement Malaysian workers. Migrant workers are employed for five-year periods, after which they are meant to go back to their home countries. Foreign workers come to Malaysia and are essentially trained in Malaysia; after a defined period they are sent back to their home countries and can go to other countries to contribute their new skills and work for higher pay. In this situation, Malaysia bears the costs of training such workers, but reaps limited benefits. This policy should be reviewed for low-skill, low-paying 3D jobs, which are viewed as undesirable by local Malaysians, and there should be an acknowledgment that such jobs are likely to continue to be dominated by foreign workers since locals do not want to do such jobs. As discussed in Chapter 5, Singapore tried to overcome this problem by extending the maximum employed period for low-skilled workers from six to ten years. Experience from other countries shows that having undocumented immigration is a natural consequence of regimes that are not responsive to market needs. Central governments need to play an active role to limit irregular immigration as well as prevent foreigners from being exploited. In particular, international comparison shows the importance of: (i) regulating and checking the activity of private agencies, (ii) setting restrictions compatible with the enforcement capacity of the country, and (iii) not imposing costs that are too high or procedures that are too costly to comply with for the employers. In Malaysia, the costs involved to both foreign workers and employers in some cases have risen to excessive levels, pushing up the number of irregular workers and hurting smaller (and possibly more dynamic) firms that would naturally be the main beneficiaries of lower wages. Some source country agent fees for Indonesian domestic workers have risen as high as RM 6,000-8,000, which has pushed up costs to employers in the receiving country. Some employers pass these costs on to the foreign workers, and ultimately the foreign workers end up with a much reduced take-home pay from having to bear such costs in addition to the costs already incurred from source country agents and other intermediaries. Tightening of already existing regulations on this matter would not only protect foreign workers under the law and reduce human rights violations, but also help improve the public relation of Malaysia in the international arena as an enforcer of its laws and protector of human rights.
177
A key challenge in the implementation of any immigration policy reform in Malaysia is to address the large number of illegal and undocumented immigrants. Many large destination countries, from the United States to EU members, suffer from porous borders where mostly unskilled migrants enter in order to avoid visa restrictions and work in the underground economy without proper documentation. As long as wage gaps persist, it is difficult to avoid such economic pressures without extensive and expensive surveillance systems. Only countries with natural barriers to entry, such as Australia or the Persian Gulf countries, can properly manage to limit undocumented migration. The best policy option is to remove the economic incentives for illegal immigration through both increased opportunities for legal migration and higher punishment for illegal migration. Furthermore, moving all undocumented workers from underground to formal employment has important benefits for the overall economy in terms of tax collection, minimum wage enforcement, and other regulations. A finely tuned immigration program that expands quantities of foreigners in sectors/regions/education categories/occupations where local labor shortages are the largest and demand for foreign workers are the strongest is a critical step forward. Furthermore, imposing differential levy levels will also enable foreign workers and domestic employers to make the necessary trade-offs and encourage formal and legal immigration. In terms of the penalties, it is critical to realize that both the employer and foreign worker benefit from undocumented migration. Hence, it is important to curb both the demand and supply through the necessary policies, which need to be designed with the underlying special conditions of each sector and region in mind. In terms of the economic conditions in each sector, the analyses in this report indicate that the smaller firms with low value-added and productivity already employ few migrant workers, which indicate the penalties should be more targeted for larger firms. Furthermore, penalties should be more severe in sectors and regions where the supply of domestic workers with the necessary human capital requirements is adequate. All of the economic analysis in this report and the conclusions indicate that Malaysia is in a rather enviable position. Foreign workers, though they compose a large portion of the labor force, are an asset to the overall growth prospects rather than an impediment. They complement the domestic labor force which has made important advances in educational and skill levels in a short period of time and has a continuing positive trajectory. The Government is aware of the education and human resources issues with a long-term horizon and is ready to implement necessary policies. Without migrant workers many critical manufacturing and service sectors would disappear, along with many mid-level

178
jobs for middle-aged domestic workers with secondary education for whom adjustment is rather difficult.
6.4 Concluding Remarks
Based on the analysis in this report and the evidence studied from other countries, the authors conclude that it is critical for all to recognize that immigration still presents Malaysia with more economic benefits than economic costs. Thus, going forward, the crucial issue for the country will be to revamp its immigration policy and overall system to be more effective in meeting the country’s economic needs. The new system should take into account lessons from other countries and absorb those lessons that will make it more efficient and allow it to be more flexible to meet the demands of the economy as it continues to grow. Moreover, the new immigration policy should aim to have various mechanisms to interact with key stakeholders, exchange ideas, design new initiatives, and implement policy reforms based on detailed data and reliable evidence. Based on the review of the Malaysian system the authors opine that the country has both the need and the means to implement such an institutional framework.
179
REFERENCES
Abubakar, S. Y., 2002. Migrant Labour in Malaysia: Impact and Implications of the Asian Financial Crisis. EADN Regional Project on the Social Impact of the Asian Financial Crisis working paper. Acemoglu, D. 1998. Why do new technologies complement skills? Directed technical change and wage inequality. Quarterly Journal of Economics 113(4): 1055-1089. Acemoglu, D. 2002. “Directed Technical Change,” Review of Economic Studies 69:4 (2002), 781–810. Amarjit K. and I. Metcalfe, eds. 2006. Mobility, Labour Migration and Border Controls in Asia. Great Britain: Antony Rowe. Amarjit K., 2007. Migration matters in the Asia-Pacific Region: immigration frameworks, knowledge workers and national policies, International Journal on Multicultural Societies, Vol. 9, No.2, pp 135-157 Amarjit K., 2008. UNEAC Asia Papers No 22. International Migration and Governance in Malaysia: Policy and Performance Amnesty International. 2010. Trapped: The Exploitation of Migrant Workers in Malaysia. Amnesty International Publications 2010. Atkin, D. G,. 2012. Endogenous Skill Acquisition and Export Manufacturing in Mexico, NBER Working Paper No. 18266. Azizah K., 2005, Security and Social Implications of Cross-National Migration in Malaysia in Mohamad Jawhar Hassan, ed.2005. Pacifying the Pacific. ISIS. Kuala Lumpur. Azizah K., 2008. Managing Strangers in Our Midst: A Critical Analysis of Malaysia’s Migrant workers’ Policy. Paper presented at the MSC6 (6th Annual Conference of the Malaysian Social Science Association) Kuching, Sarawak, August. Azizah K., 2010. Institutions and Governance Regime: Managing Foreign Workers
in Malaysia. World Bank.
Azizah K. and Ragayah Haji Mat Zin. 2011. Policy on Irregular Migrants in Malaysia: An Analysis of its Implementation and Effectiveness. Discussion Paper Series No. 2011-34. Philippine Institute for Development Studies.
180
Barro, R.J. and X. Sala-I-Martin, 1992. Economic Growth, Mcgraw-Hill: New York. Battistella, G., 2002. “Unauthorized Migrants as Global Workers in the Asean Region’. Southeast Asian Studies, Vol. 40, No 3, December 2002 Becker, Gary S. (1968). “Crime and Punishment: An Economic Approach.” Journal of Political Economy, 76, 169–217. Bianchi, M., P. Buonanno and P. Pinotti. 2012. Do Immigrants Cause Crime? Journal of the European Economic Association, Vol. 10(6), pp. 1318-1347, December. Borjas, George J., Jeffrey Grogger, and Gordon H. Hanson (2010). “Immigration and the Economic Status of African-American Men.” Economica, 77, 255–282. Butcher, Kristin F. and Anne M. Piehl (1998). “Cross-city Evidence on the Relationship between Immigration and Crime.” Journal of Policy Analysis and Management, 17, 457–493. Borjas G.J. 2003. The Labor Demand Curve Is Downward Sloping: Reexamining The Impact Of Immigration On The Labor Market, The Quarterly Journal of Economics, MIT Press, vol. 118(4), pages 1335-1374, November. Borjas, G.J. and L. Katz, 2005. The Evolution of The Mexican-Born Workforce In The United States, NBER Working Paper No.11281. Borjas G.J., Grogger J. and Hanson G.H., 2011. Substitution between Immigrants, Malaysians, and Skill Groups, NBER Working Paper No. 17461. CIDB. 2011. Annual Report 2009. Kuala Lumpur, Construction Industry Development Board, Malaysia. Chew Sang Hai. 2004. Foreign Construction Workers: Why We Need Them? In Public Responses to Migrant workers in Sabah edited by Azizah Kassim, pp.47-54. Kota Kinabalu; Universiti Malaysia Sabah. Chia, F. C., 2011. Economic fluctuations and productivity in the Malaysia Construction sector. PhD thesis, Queensland University of Technology. Dills, Angela K., Jeffrey A. Miron, and Garrett Summers (2008). “What do Economists Know about Crime?” NBER Working Paper No. 13759.
181
Dustmann C., Frattini T. and Preston I., 2008. The Effect of Immigration along the Distribution of Wages, CReAM Discussion Paper Series 0803, Centre for Research and Analysis of Migration (CReAM), Department of Economics, University College London. Ehrlich, Isaac. (1973). “Participation in Illegitimate Activities: A Theoretical and Empirical Investigation.” Journal of Political Economy, 81, 521–65. Eide, Erling, Paul H. Rubin, and Joanna M. Shepherd (2006). Economics of Crime, Now Publishers, Hanover, MA. Ellis, Lee, Kevin M. Beaver, and John Paul Wright. 2009. Handbook of Crime Correlates. San Diego, CA: Academic Press Economic Transformation Program. 2011. A Roadmap for Malaysia: Chapter 10: Revving up the Tourism Industry. EPU and World Bank, 2011. “Moving Up the Value Chain: A Study of Malaysia’s Solar and Medical Devices Industries”. Ford, M., 2006, The Regulation of Indonesian Migration to Malaysia. In Amarjit Kaur and Ian Metcalfe (eds.) Mobility, Labour Migration and Border Controls in Asia, Palgrave Macmillian, New York, p228-247. Grunneberg, S. and G. Ive. 2000. The Economics of the Modern Construction Sector. McMillan Press, UK. Habibullah, Muzafar Shah, and A.H. Baharom, 2009. "Crime and economic conditions in Malaysia", International Journal of Social Economics, Vol. 36 Iss: 11, pp.1071 – 1081 Hassan, K. H. and C. M. George. 2010. ‘External Migration of Labour Force and Access to Justice: Malaysian Law in the context of ILO Standards’ Hur, J. and K. Lee, 2008. Demographic Change and International Labor Mobility in Korea. Paper prepared for the PECC-ABAC Conference on “Demographic Change and International Labor Mobility in the Asia Pacific Region: Implications for Business and Cooperation”. Available at: http://www.pecc.org/resources/doc_view/682-demographic-change-and-international-labor-mobility-in-korea International Federation of Human Rights (FIDH) and Suara Rakyat Malaysia (SUARAM), 2008. “Undocumented migrants and refugees in Malaysia: Raids,
182
detention and Discrimination”. http;//fidh/undocumented-migrants-and-refugees. Accessed on 18 March 2012 IOM. International Organisation for Migration, 2010, Labour Migration from Indonesia: An overview of Indonesian Migration to Selected Destinations in Asia and the Middle East. IOM, International Organization for Migration, 2011. Thailand Migration Report 2011. Bangkok: IOM, 2011. Kanapathy, V., 2006. ‘Migrant Workers in Malaysia: An Overview’. Workshop on an East Asian Cooperation Framework for Migrant Labour 2006. Kee, T.S., 2009. Foreign workers’ policies and issues in South Korea: Focus on the workers from the South East Asian Region. Proceedings of the Sixth Biennial Conference of the Korean Studies Association of Australasia. Available at: http://sydney.edu.au/arts/korean/downloads/KSAA2009/Global_Korea_Proceedings_545-557_Tan.pdf Kung, L., 2010. Taiwan’s Labor Migration Policy and the Impact of the Financial Crisis on Migrant Workers. Paper prepared for the Migration Information System in Asia – Phase 2. Available at: http://smc.org.ph/misa/uploads/country_reports/1285920042.pdf Malaysia Productivity Corporation. 2009. Productivity Report 2008. Lathapipat D., 2012. The Effects of Immigration in the Thai Wage structure. In Richard H. Adams and Ahmad Ahsan (eds.) Managing International Migration for Development in East Asia, World Bank, Washington DC. Lee, J.H., Lee, K. and K. Yoo, 2004. A Comparative Study on Labour Migration Management in Selected Countries. Seoul: Korea Labour Institute. Martin, S. and B. Lindsay Lowell, 2008. United States. Paper prepared for the PECC-ABAC Conference on “Demographic Change and International Labor Mobility in the Asia Pacific Region: Implications for Business and Cooperation”. Available at: http://www.pecc.org/resources/doc_view/688-international-labor-mobility-united-states-case-study McMillan, M. S. and D. Rodrik. 2011. Globalization, Structural Change and Productivity Growth, NBERWorking Paper No. 17143.

183
MSN. 2004. ‘Impact of Foreign Workers on the Malaysian Economy: Final Report Volume I and II.’ MSN Management Consultancy Services Sdn.Bhd. for the National Economic Action Council, 2004. Ozden, C. and M. Schiff, 2005. International Migration, Remittances and Brain Drain, World Bank Report: Washington. Peri, G., and C. Sparber, 2009. Task Specialization, Immigration and Wages, American Economic Journal: Applied Economics 1:3, 135–169. Peri, G., 2012a. The Effect of Immigration on Productivity: Evidence from US States, The Review of Economics and Statistics, 94(1): 348–358 Peri, G., 2012b. Rationalizing U.S. Immigration Policy: Reforms for Simplicity, Fairness, and Economic Growth, Discussion Paper 2012-01, the Hamilton Project, Brookings Institution. Phillips, R. and J. Henderson, 2009. Global production networks and industrial upgrading. Negative lessons from Malaysian electronics, Journal für Entwicklungspolitik 25(2): 38-61. Phillips, J. and H. Spink, 2012. Skilled migration: Temporary and Permanent Flows to Australia. Parliament of Australia. Parliamentary Library Background Note. Available at: http://parlinfo.aph.gov.au/parlInfo/download/library/prspub/1601351/upload_binary/1601351.pdf;fileType=application/pdf Pholphirul, P. and P. Rukumnuaykit, and J. Kamlai. 2012. Do Foreigners Improve Thailand’s Competitiveness. Working Paper included in the “Managing Cross-Border Labor Mobility, World Bank East Asia and Pacific Unit. Pouliakas, K., D. Roberts, E. Balamou, and D. Psaltopoulos. 2008. Modelling The Effects Of Immigration On Regional Economic Performance And The Wage Distribution: A CGE Analysis Of Three EU Regions. University Of Aberdeen Business School, University Of Patras, IZA. PwC, 2012, International Assignments Services, Immigration Guide, Malaysia. Rahaman, M., 2006. Foreign Manpower in Singapore: Classes, Policies and Management, Asia Research Institute Working Paper Series No. 57, Asia Research Institute, National University of Singapore.

184
Ramasamy, P., 2004, International Migration and Conflict: Foreign Labour in Malaysia. In Aris Ananta and Evi NurvidyaArifin (eds.) International Migration in Southeast Asia, Institute of Southeast Asia Studies, Singapore, p 273-295. Richardson, S. and L. Lerster, 2004. A Comparison of Australian and Canadian Immigration Policies and Labour Market Outcomes, Report to the Department of Immigration and Multicultural and Indigenous Affairs, Canberra. Available at: http://www.immi.gov.au/media/publications/pdf/comparison_immigration_policies.pdf Robertson P. Jr, Phillip. 2009. ‘Migrant Workers in Malaysia – Issues, Concerns and Points for Action’ Fair Labour Association. Sas, C., 2008. Canada’s movement of temporary workers: our approach to temporary immigration within the overall immigration program. Paper prepared for the PECC-ABAC Conference on “Demographic Change and International Labor Mobility in the Asia Pacific Region: Implications for Business and Cooperation”. Available at: http://www.pecc.org/resources/doc_view/684-canadas-movement-of-temporary-workers Suresh Narayanan and Yew-Wah Lai. 2005.‘The Causes and Consequences of Foreign Labour in the Construction Sector in Malaysia’. International Migration, Vol. 43 Issue 5, p31-57. Suresh Narayanan and Yew-Wah Lai. 2007. ‘Strategies to Reduce the Dependence of the Malaysian Economy on Foreign Labour’. Usains Holding Sdn Bhd, Universiti Sains Malaysia. Vollrath, D., 2009. How Important are Dual Economy Effects for Aggregate Productivity, Journal of Development Economics, 88(2), 325–334. Walmsley,T., Aguilar A. and Ahmed S.A. 2012. Labor Migration and Economic Growth in East and South-East Asia. In Richard H. Adams and Ahmad Ahsan (eds.) Managing International Migration for Development in East Asia,World Bank, Washington DC. Wong, L., 2007. Development of Malaysia’s Agricultural Sector: Agriculture an Engine of Growth. Working Paper from ISIS. Presented at the ISEAS Conference in Singapore.
185
World Bank 2012. Malaysia Economic Monitor: Modern Jobs, April 2012, World
Bank.
Wong, D., 1997. Transience and settlement: Singapore’s foreign labor policy, Asian and Pacific Migration Journal, 6(2), 135-167. Wong, D., 2006. ‘The Recruitment of Foreign Labour in Malaysia: From Migration System to Guest Worker Regime’. In: Kaur, Amarjit and Ian Metcalfe, eds. 2006. Mobility, Labour Migration and Border Controls in Asia. Great Britain: Antony Rowe, pp. 213-227.
OTHERS Akta Imigresen 1959/63 (Akta 155) & Peraturan-Peraturan Dan Akta Pasport 1966 (Akta 150) Hingga Mei 2003. International Law Book Services, Wisma ILBS, Bandar Damansara Perdana, Selangor. Asiaone Business. 27 Aug 2011. “Bosses say no to higher levy for foreign workers” http://buisness.asiaone.com/business/news/story/A1story Border Connections, Canadian Citizenship, http://www.borderconnections.com/canadian-citizenship.html Bank Negara Malaysia. 2007. Annual Report 2006. Kuala Lumpur, Malaysia. Buku Panduan Dasar, Prosedur Dan Syarat-syarat PenggajianPekerjaAsing Di Malaysia.Jabatan Tenaga Kerja Semenanjung Malaysia, Kementerian Sumber Manusia, Putrajaya, 2006. Challinor, A.E., 2003. “Canada's Immigration Policy: a Focus on Human Capital”, Migration Information Source, http://www.migrationinformation.org/feature/print.cfm?ID=853 CIC, Canada Immigration and Citizenship, Evaluation of the Federal Skilled Worker Program (August 2010), http://www.cic.gc.ca/english/pdf/research-stats/FSW2010.pdf CIC, Canada Immigration and Citizenship ,Annual Report to Parliament on Immigration 2011. Available at: http://www.cic.gc.ca/english/pdf/pub/annual-report-2011.pdf
186
CIC, Canada Immigration and Citizenship, Canadian Experience Class, http://www.cic.gc.ca/english/immigrate/cec/index.asp CIC, Canada Immigration and Citizenship, Consultations, http://www.cic.gc.ca/english/department/consultations/index.asp CIC, Canada Immigration and Citizenship, Occupations Requiring Lower Levels of Formal Training, http://www.hrsdc.gc.ca/eng/workplaceskills/foreign_workers/ei_tfw/orllft_tfw.shtml CIC, Canada Immigration and Citizenship, Seasonal Agricultural Workers, http://www.hrsdc.gc.ca/eng/workplaceskills/foreign_workers/ei_tfw/saw_tfw.shtml CIC, Canada Immigration and Citizenship, Working temporarily in Canada: Jobs that require a work permit but no labour market opinion, http://www.cic.gc.ca/english/work/apply-who-permit.asp CIDB. 2007. Construction Industry Master plan 2015. Construction Industry Development Board, Malaysia. CLA, Council of Labor Affairs, Payment Amount of Employment Security Fees, http://www.cla.gov.tw/cgi-bin/siteMaker/SM_theme?page=48f85129 Council on Foreign Relations, 2009. U.S Immigration Policy, Independent Task Force Report No. 63. Available at: http://www.cfr.org/immigration/us-immigration-policy/p20030 Devadason, Evelyn S., and Wai Meng Chan. 2011. "A Critical Appraisal of Policies and Laws Regulating Migrant Workers in Malaysia." : n. pag. Web. <http://www.wbiconpro.com/210-DEVADASON.pdf>.Accessed on 16 March 2012. Devadason, Evelyn S. 2011. Policy chaos over migrant workers in Malaysia, http://www.eastasisforum.org/2011/01/11/policy-chaos-over-migration. Accessed on 19 March 2012. DIAC, Department of Immigration and Citizenship, The Department of Immigration and Citizenship, fact sheet no. 3, DIAC, viewed 20 January 2012, http://www.immi.gov.au/media/fact-sheets/03department.htm
187
DIAC, Department of Immigration and Citizenship, Managing the Migration Program, fact sheet no. 21, DIAC, viewed 20 January 2012, http://www.immi.gov.au/media/fact-sheets/21managing.htm DIAC, Department of Immigration and Citizenship, Overview of Skilled Migration to Australia, fact sheet no. 24, DIAC, viewed 20 January 2012, http://www.immi.gov.au/media/fact-sheets/24overview_skilled.htm DIAC, Department of Immigration and Citizenship, Overview of Family Stream Migration, fact sheet no. 29, DIAC, viewed 20 January 2012, http://www.immi.gov.au/media/fact-sheets/29overview_family.htm DIAC, Department of Immigration and Citizenship, Discussion paper, http://www.immi.gov.au/media/publications/discussion-papers/ DIAC, Department of Immigration and Citizenship, 1 July 2011 - Points Test for Certain Skilled Migration Visas, http://www.immi.gov.au/skilled/general-skilled-migration/pdf/points-test.pdf DIAC, Department of Immigration and Citizenship, Migration Program Statistics, http://www.immi.gov.au/media/statistics/statistical-info/visa-grants/migrant.htm DIAC, Department of Immigration and Citizenship, Nation Building, Annual Report 2010-11. Available at: http://www.immi.gov.au/about/reports/annual/2010-11/pdf/2010-11-diac-annual-report.pdf DIAC, Department of Immigration and Citizenship, SkillSelect, http://www.immi.gov.au/skills/skillselect/ DIAC, Department of Immigration and Citizenship, Temporary Business (Long Stay) (subclass 45) visa, Booklet. Available at: http://www.immi.gov.au/allforms/booklets/books9.pdf DIAC, Department of Immigration and Citizenship, Visa Subclass 457 Integrity Review: Final Report, http://www.minister.immi.gov.au/media/media-releases/2008/457-integrity-review-report.pdf DIAC, Department of Immigration and Citizenship, “Changes to the 2008-09 Skilled Migration Program”, Media Release (Canberra 2008), http://www.minister.immi.gov.au/media/media-releases/2008/changes-to-2008-09-skilled-migration-program.pdf
188
DIAC, Department of Immigration and Citizenship, “Panel of experts to advise on changes to 457 visa program”, Media Release (Canberra, 8 July 2008), http://www.minister.immi.gov.au/media/media-releases/2008/ce08064.htm DIAC, Department of Immigration and Citizenship, “Government announces changes to 457 visa program”, Media Release (Canberra, 1 April 2009), http://www.minister.immi.gov.au/media/media-releases/2009/ce09034.htm DIAC, Department of Immigration and Citizenship, “Migration reforms to deliver Australia's skills needs”, Media Release (Canberra, 8 February 2010), http://www.minister.immi.gov.au/media/media-releases/2010/ce10006.htm DIAC, Department of Immigration and Citizenship, “Reforms to the Permanent Employer Sponsored Visa Program”, Media Release (Canberra, 9 March 2012), http://www.immi.gov.au/skilled/skilled-workers/_pdf/perm-sponsored-reforms.pdf DOL, Department of Labor, Work Authorization for non-U.S. Citizens: Workers in Professional and Specialty Occupations (H-1B, H-1B1, and E-3 Visas), http://www.dol.gov/compliance/guide/h1b.htm Economic Strategies Committee, 2008, The Report of the Economic Strategies Committee: High Skilled People, Innovative Economy, Distinctive Global City, available at: http://app.mof.gov.sg/data/cmsresource/ESCpercent20Report/ESCpercent20Fullpercent20Report.pdf Ernst and Young, 2007. Migration and the UK Economy, Ernst and Young Item Club, December. Forbes, 7 May 2012. "Warning Bell for Developed Countries: Declining Birth Rates", available at: http://www.forbes.com/forbes/2012/0507/current-events-population-global-declining-birth-rates-lee-kuan-yew.html Guide me Singapore, Singapore Permanent Residence Schemes, http://www.guidemesingapore.com/relocation/pr/singapore-permanent-residence-schemes Hansard. 2012. Parliament of Malaysia. Senate House. Question and Answers. Hi Korea, Naturalization (General, Simplified, Special), http://www.hikorea.go.kr/pt/InfoDetailR_kr.pt?catSeq=&categoryId=2&parentId=399&showMenuId=377
189
ICA, Immigration and Citizenship Authority, Citizenship Application, http://www.ica.gov.sg/page.aspx?pageid=132 Immigration and Refugee Protection Act (S.C. 2001, c. 27.), CIC, Bill C-11-Immigration and Refugee Protection Act: http://laws-lois.justice.gc.ca/PDF/I-2.5.pdf MoEL, Ministry of Employment and Labor, “Quota of this year for foreign workers”, FAQ (Singapore, 23 March 2009), http://www.moel.go.kr/english/dont_miss/faq_view.jsp?&idx=130 MoEL, Ministry of Employment and Labor, “Hard-working foreign workers can be reemployed in Korea after 3-month stay in their home countries”, Economic Policy, http://www.moel.go.kr/english/topic/employment_policy_view.jsp?idx=896 MoEL, Ministry of Employment and Labor, “48,000 foreign workers to be introduced in 2011”, Employment Policy, http://www.moel.go.kr/english/topic/employment_policy_view.jsp?idx=705 MOF, Ministry of Finance, Malaysia Economic Report 2009-10, Kuala Lumpur. MOF, Ministry of Finance, Malaysia Economic Report 2010-11, Kuala Lumpur. MoM, Ministry of Manpower, Working, Annual Report 2010, Singapore. Available at: http://www.mom.gov.sg/publish/momportal/en/press_room/annual_reports/working_2010/flipviewerxpress.html MoM, Ministry of Manpower, “Foreign Worker Levy Changes”, Press Release (Singapore, 21 February 2011), http://www.mom.gov.sg/newsroom/Pages/PressReleasesDetail.aspx?listid=349 MoM, Ministry of Manpower, “Enhancements to the Employment Pass Framework ”, Press Release (Singapore, 16 August 2011), http://www.mom.gov.sg/newsroom/Pages/PressReleasesDetail.aspx?listid=377 MoM, Ministry of Manpower, “Greater Flexibility for Businesses to Optimise their Foreign Manpower”, Press Release (Singapore, 26 March 2012), http://www.mom.gov.sg/newsroom/Pages/PressReleasesDetail.aspx?listid=415 MoM, Ministry of Manpower, Dependant's Pass - Before you apply, http://www.mom.gov.sg/foreign-manpower/passes-visas/dependant-pass/before-you-apply/Pages/default.aspx

190
MoM, Ministry of Manpower, Employment Pass - Before you apply, http://www.mom.gov.sg/foreign-manpower/passes-visas/employment-pass/before-you-apply/Pages/default.aspx MoM, Ministry of Manpower, Licensing requirements, http://www.mom.gov.sg/foreign-manpower/employment-agencies/legislation-licensing-criteria/Pages/default.aspx MoM, Ministry of Manpower, Long Term Visit Pass - Before you apply, , http://www.mom.gov.sg/foreign-manpower/passes-visas/long-term-visit/before-you-apply/Pages/default.aspx MoM, Ministry of Manpower, S Pass - Before you apply, http://www.mom.gov.sg/foreign-manpower/passes-visas/s-pass/before-you-apply/Pages/default.aspx MoM, Ministry of Manpower, Work Permit - Before you apply, http://www.mom.gov.sg/foreign-manpower/passes-visas/work-permit-fw/before-you-apply/Pages/overview.aspx MoM, Ministry of Manpower, “MOM Unveils New Package of Foreign Workforce Measures”, Press Release (Singapore, 28 November 2007), http://www.mom.gov.sg/newsroom/Pages/PressReleasesDetail.aspx?listid=142 MoM, Ministry of Manpower, “Changes To Foreign Worker Levy For Sustainable Growth”, Press Release (Singapore, 23 February 2010), http://www.mom.gov.sg/Documents/press-releases/2010/FAQspercent20forpercent20foreignpercent20workerpercent20levypercent20changes.pdf Tindak Malaysia. 2011. SCORE will turn Sarawak into another Sabah. http//:tindakmalaysia.com/threads/4064-sarawak-score-will . Accessed on 4 June 2012 USCIS, U.S. Citizenship and Immigration Services, H-1B Specialty Occupations, DOD Cooperative Research and Development Project Workers, and Fashion Models, http://www.uscis.gov/portal/site/uscis/menuitem.eb1d4c2a3e5b9ac89243c6a7543f6d1a/?vgnextoid=73566811264a3210VgnVCM100000b92ca60aRCRD&vgnextchannel=73566811264a3210VgnVCM100000b92ca60aRCRD USCIS, U.S. Citizenship and Immigration Services, H-2B Temporary Non-Agricultural Workers, http://www.uscis.gov/portal/site/uscis/menuitem.eb1d4c2a3e5b9ac89243c6a
191
7543f6d1a/?vgnextoid=d1d333e559274210VgnVCM100000082ca60aRCRD&vgnextchannel=d1d333e559274210VgnVCM100000082ca60aRCRD USCIS, U.S. Citizenship and Immigration Services, Path to US citizenship, http://www.uscis.gov/portal/site/uscis/menuitem.eb1d4c2a3e5b9ac89243c6a7543f6d1a/?vgnextoid=86bd6811264a3210VgnVCM100000b92ca60aRCRD&vgnextchannel=86bd6811264a3210VgnVCM100000b92ca60aRCRD USCIS, U.S. Citizenship and Immigration Services, Permanent Workers, http://www.uscis.gov/portal/site/uscis/menuitem.eb1d4c2a3e5b9ac89243c6a7543f6d1a/?vgnextoid=cdfd2f8b69583210VgnVCM100000082ca60aRCRD&vgnextchannel=cdfd2f8b69583210VgnVCM100000082ca60aRCRD
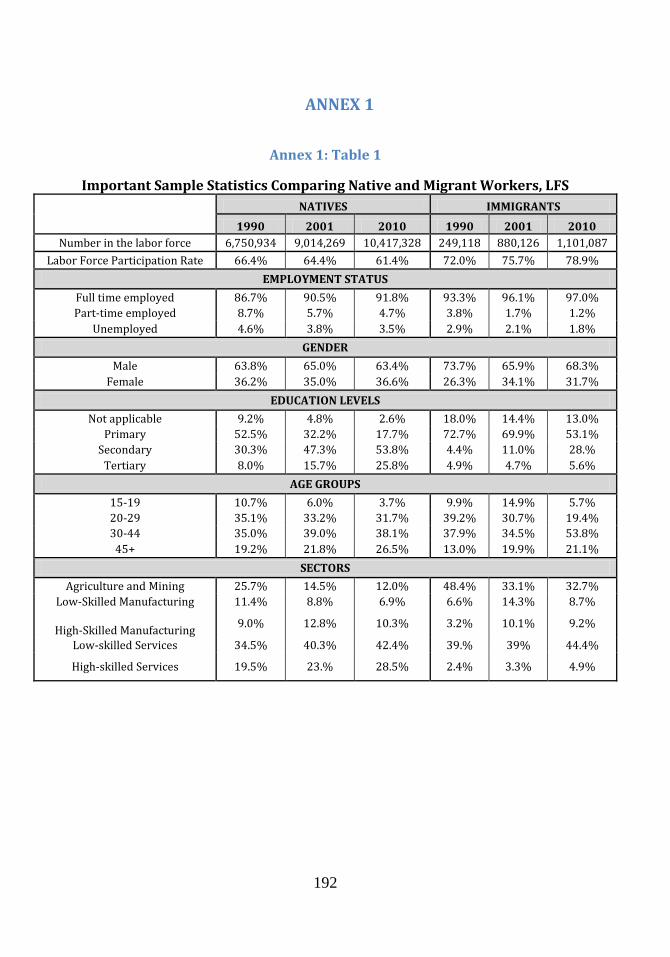
192
ANNEX 1
Annex 1: Table 1
Important Sample Statistics Comparing Native and Migrant Workers, LFS
NATIVES IMMIGRANTS
1990 2001 2010 1990 2001 2010
Number in the labor force 6,750,934 9,014,269 10,417,328 249,118 880,126 1,101,087
Labor Force Participation Rate 66.4% 64.4% 61.4% 72.0% 75.7% 78.9%
EMPLOYMENT STATUS
Full time employed 86.7% 90.5% 91.8% 93.3% 96.1% 97.0%
Part-time employed 8.7% 5.7% 4.7% 3.8% 1.7% 1.2%
Unemployed 4.6% 3.8% 3.5% 2.9% 2.1% 1.8%
GENDER
Male 63.8% 65.0% 63.4% 73.7% 65.9% 68.3%
Female 36.2% 35.0% 36.6% 26.3% 34.1% 31.7%
EDUCATION LEVELS
Not applicable 9.2% 4.8% 2.6% 18.0% 14.4% 13.0%
Primary 52.5% 32.2% 17.7% 72.7% 69.9% 53.1%
Secondary 30.3% 47.3% 53.8% 4.4% 11.0% 28.%
Tertiary 8.0% 15.7% 25.8% 4.9% 4.7% 5.6%
AGE GROUPS
15-19 10.7% 6.0% 3.7% 9.9% 14.9% 5.7%
20-29 35.1% 33.2% 31.7% 39.2% 30.7% 19.4%
30-44 35.0% 39.0% 38.1% 37.9% 34.5% 53.8%
45+ 19.2% 21.8% 26.5% 13.0% 19.9% 21.1%
SECTORS
Agriculture and Mining 25.7% 14.5% 12.0% 48.4% 33.1% 32.7%
Low-Skilled Manufacturing 11.4% 8.8% 6.9% 6.6% 14.3% 8.7%
High-Skilled Manufacturing 9.0% 12.8% 10.3% 3.2% 10.1% 9.2%
Low-skilled Services 34.5% 40.3% 42.4% 39.% 39% 44.4%
High-skilled Services 19.5% 23.% 28.5% 2.4% 3.3% 4.9%

193
Annex 1: Table 2
Important Sample Statistics of Establishments in Manufacturing
2000 2005 2010 2000 2005 2010
Total 100% 100% 100% 100% 100% 100%
Total 100% 100% 100% 100% 100% 100%
Total 100% 100% 100% 100% 100% 100%
Total 100% 100% 100% 100% 100% 100%
Total 100% 100% 100% 100% 100% 100%
Establishments Workers
Number 28,25720,455 39,669 1,574,797 1,675,163 1,812,360
7.1%
Mfg: wood
Mfg paper-furn
Mfg: chem-rub
Mfg: metal-machinery
Mfg: precision inst-com
6.5%
16.7%
8.8% 9.7% 11.6%
4.6% 5.8%
17.0%
2.5%
23.7% 26.4% 8.4% 5.7%
2.0% 2.2% 3.6%
Mfg: food-bev-tob
Mfg: textile
Mfg: transp equip
16.5% 16.1% 15.9%
1.4%
68.2%
27.1% 36.2% 44.3%
10.1% 7.4% 5.7%
High
Low
14.5%
85.5% 83.9%
Micro (<5)
Large (150+)
0.9%
70.9%
2.3%
67.0%
11.0% 12.7% 16.1%
89.0% 87.3%
12.7%
17.7% 16.7%
Legal status (%)
Private Limited Company
Individual Proprietorship
Public Limited Company
6.6%
93.4%
8.3%
91.7%
0.1%
89.0%
4.8%
0.0%
0.2%
43.9%
0.8%
0.1%
0.2%
40.4% 89.0%
3.9%
0.0%
0.0%
Sub-sectors (%)
Size (% in terms of workers)
Skill intensity (%)
87.9%
6.7%
0.1%
N/aN/a N/a N/a 44.9%87.0%
13.0%
No
Small (>=5 and <=50 )
15.7%
20.4%
4.7%
5.4%
16.6%
14.2%
18.4%
3.6%
3.9%
16.8%
12.6%
19.2%
3.0%
8.1%
10.4%
18.0%
15.0%
27.8%
7.9%
12.1%
19.9%
16.0%
22.8%
6.2%
12.0%
20.8%
18.8%
19.0%
Accreditation (%)
Medium (>5 and <=150)
47.7%
15.1% 12.0%
44.4% 41.3%
8.7%
10.9%
17.3%
0.1%
0.1%
44.8%
10.2%
0.0%
50.5%
8.5%
0.5%
0.1%
0.0%
Yes N/a N/a N/a N/a 55.1%
14.0%
Partnership
Co-operative
Public Corporation
Others
36.1%
12.0%
49.8%
1.6%
0.3%
0.0%
3.1% 3.8% 4.9%
2.0% 2.2% 2.1%
0.1% 0.0% 0.0%
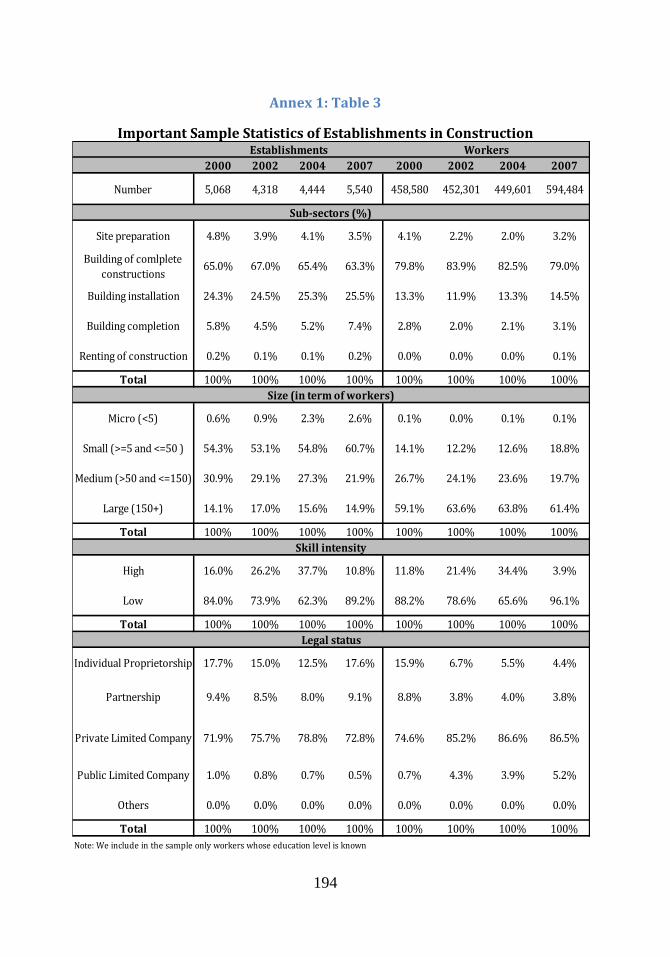
194
Annex 1: Table 3
Important Sample Statistics of Establishments in Construction
2000 2002 2004 2007 2000 2002 2004 2007
Total 100% 100% 100% 100% 100% 100% 100% 100%
Total 100% 100% 100% 100% 100% 100% 100% 100%
Total 100% 100% 100% 100% 100% 100% 100% 100%
Total 100% 100% 100% 100% 100% 100% 100% 100%
Building completion 5.8% 4.5% 5.2% 7.4% 2.8% 2.0% 2.1% 3.1%
Sub-sectors (%)
Site preparation 4.8% 4.1% 3.5% 4.1% 2.0% 3.2%
Establishments Workers
Number 5,068 4,444 5,540 458,580 449,601 594,484
3.9% 2.2%
4,318 452,301
79.0%
Building installation 24.3% 25.3% 25.5% 13.3% 13.3% 14.5%
Building of comlplete
constructions65.0% 65.4% 63.3% 79.8% 82.5%67.0%
24.5%
83.9%
11.9%
Size (in term of workers)
Micro (<5) 0.6% 2.3% 2.6% 0.1% 0.1% 0.1%
0.1%Renting of construction 0.2% 0.1% 0.2% 0.0% 0.0%0.1%
0.9%
0.0%
0.0%
18.8%
Medium (>50 and <=150) 30.9% 27.3% 21.9% 26.7% 23.6% 19.7%
Small (>=5 and <=50 ) 54.3% 54.8% 60.7% 14.1% 12.6%53.1%
29.1%
12.2%
24.1%
61.4%
Skill intensity
High 16.0% 37.7% 10.8% 11.8% 34.4% 3.9%
Large (150+) 14.1% 15.6% 14.9% 59.1% 63.8%17.0% 63.6%
26.2% 21.4%
96.1%
Legal status
Individual Proprietorship 17.7% 12.5% 17.6% 15.9% 5.5% 4.4%
Low 84.0% 62.3% 89.2% 88.2% 65.6%
15.0% 6.7%
73.9% 78.6%
3.8%
Private Limited Company 71.9% 78.8% 72.8% 74.6% 86.6% 86.5%
Partnership 9.4% 8.0% 9.1% 8.8% 4.0%8.5%
75.7%
3.8%
85.2%
5.2%
Others 0.0% 0.0% 0.0% 0.0% 0.0% 0.0%
Public Limited Company 1.0% 0.7% 0.5% 0.7% 3.9%0.8%
0.0%
4.3%
0.0%
Note: We include in the sample only workers whose education level is known
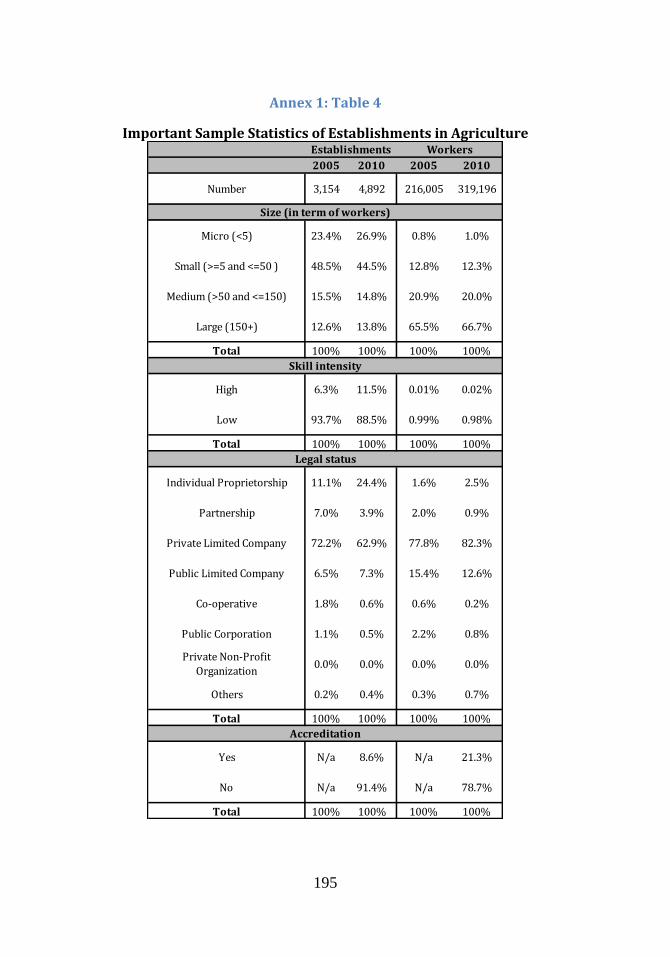
195
Annex 1: Table 4
Important Sample Statistics of Establishments in Agriculture
2005 2010 2005 2010
Total 100% 100% 100% 100%
Total 100% 100% 100% 100%
Total 100% 100% 100% 100%
Total 100% 100% 100% 100%
Yes N/a 8.6% N/a 21.3%
No N/a 91.4% N/a 78.7%
Accreditation
Public Corporation 1.1% 0.5% 2.2% 0.8%
Private Non-Profit
Organization0.0% 0.0% 0.0% 0.0%
Others 0.2% 0.4% 0.3% 0.7%
Public Limited Company 6.5% 7.3% 15.4% 12.6%
Co-operative 1.8% 0.6% 0.6% 0.2%
Partnership 7.0% 3.9% 2.0% 0.9%
Private Limited Company 72.2% 62.9% 77.8% 82.3%
Legal status
Individual Proprietorship 11.1% 24.4% 1.6% 2.5%
High 6.3% 11.5% 0.01% 0.02%
Low 93.7% 88.5% 0.99% 0.98%
Skill intensity
Small (>=5 and <=50 ) 48.5% 44.5% 12.8% 12.3%
Medium (>50 and <=150) 15.5% 14.8% 20.9% 20.0%
Large (150+) 12.6% 13.8% 65.5% 66.7%
Size (in term of workers)
Micro (<5) 23.4% 26.9% 0.8% 1.0%
Establishments Workers
Number 3,154 4,892 216,005 319,196
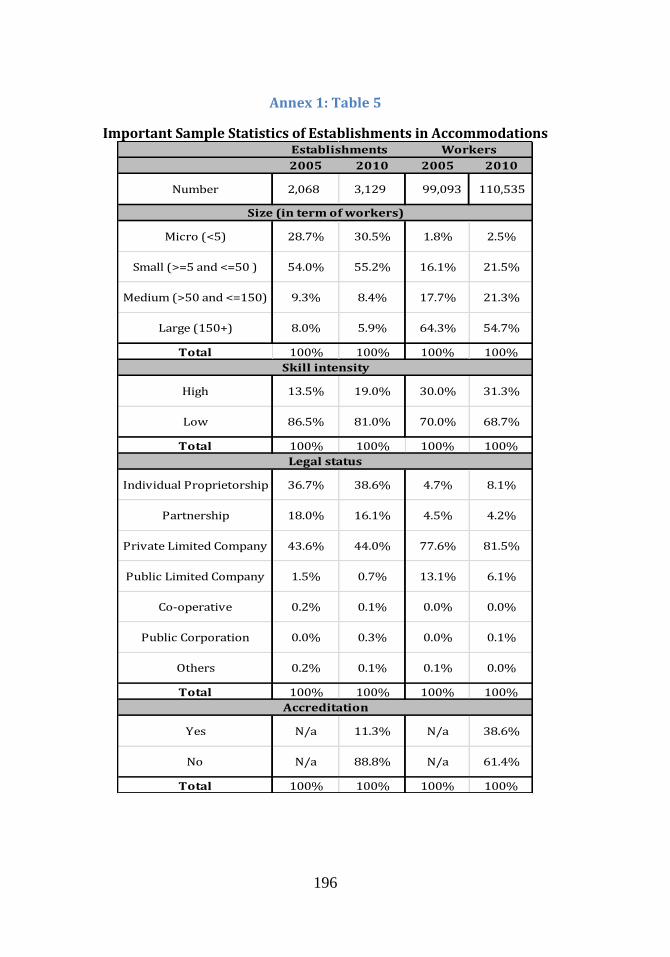
196
Annex 1: Table 5
Important Sample Statistics of Establishments in Accommodations
2005 2010 2005 2010
Total 100% 100% 100% 100%
Total 100% 100% 100% 100%
Total 100% 100% 100% 100%
Total 100% 100% 100% 100%
Establishments Workers
Number 2,068 3,129 99,093 110,535
Small (>=5 and <=50 ) 54.0% 55.2% 16.1%
Size (in term of workers)
Micro (<5) 28.7% 30.5% 1.8% 2.5%
21.5%
Medium (>50 and <=150) 9.3% 8.4% 17.7% 21.3%
54.7%
Skill intensity
High 13.5% 19.0% 30.0% 31.3%
Large (150+) 8.0% 5.9% 64.3%
68.7%
Legal status
Individual Proprietorship 36.7% 38.6% 4.7% 8.1%
Low 86.5% 81.0% 70.0%
4.2%
Private Limited Company 43.6% 44.0% 77.6% 81.5%
Partnership 18.0% 16.1% 4.5%
6.1%
Co-operative 0.2% 0.1% 0.0% 0.0%
Public Limited Company 1.5% 0.7% 13.1%
0.1%
Others 0.2% 0.1% 0.1% 0.0%
Public Corporation 0.0% 0.3% 0.0%
Accreditation
Yes N/a 11.3% N/a 38.6%
61.4%No N/a 88.8% N/a
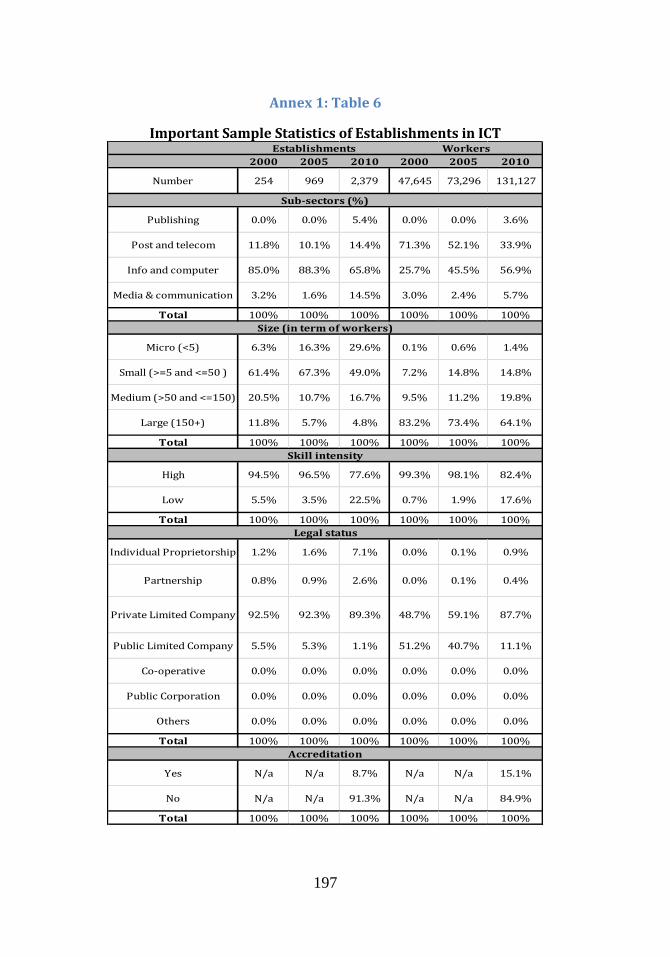
197
Annex 1: Table 6
Important Sample Statistics of Establishments in ICT
2000 2005 2010 2000 2005 2010
Total 100% 100% 100% 100% 100% 100%
Total 100% 100% 100% 100% 100% 100%
Total 100% 100% 100% 100% 100% 100%
Total 100% 100% 100% 100% 100% 100%
Total 100% 100% 100% 100% 100% 100%
Sub-sectors (%)
Publishing 0.0% 0.0% 5.4% 0.0% 0.0% 3.6%
Establishments Workers
Number 254 969 2,379 47,645 73,296 131,127
33.9%
Info and computer 85.0% 88.3% 65.8% 25.7% 45.5% 56.9%
Post and telecom 11.8% 10.1% 14.4% 71.3% 52.1%
Size (in term of workers)
Micro (<5) 6.3% 16.3% 29.6% 0.1% 0.6% 1.4%
5.7%Media & communication 3.2% 1.6% 14.5% 3.0% 2.4%
14.8%
Medium (>50 and <=150) 20.5% 10.7% 16.7% 9.5% 11.2% 19.8%
Small (>=5 and <=50 ) 61.4% 67.3% 49.0% 7.2% 14.8%
64.1%
Skill intensity
High 94.5% 96.5% 77.6% 99.3% 98.1% 82.4%
Large (150+) 11.8% 5.7% 4.8% 83.2% 73.4%
17.6%
Legal status
Individual Proprietorship 1.2% 1.6% 7.1% 0.0% 0.1% 0.9%
Low 5.5% 3.5% 22.5% 0.7% 1.9%
0.4%
Private Limited Company 92.5% 92.3% 89.3% 48.7% 59.1% 87.7%
Partnership 0.8% 0.9% 2.6% 0.0% 0.1%
11.1%
Co-operative 0.0% 0.0% 0.0% 0.0% 0.0% 0.0%
Public Limited Company 5.5% 5.3% 1.1% 51.2% 40.7%
0.0%
Others 0.0% 0.0% 0.0% 0.0% 0.0% 0.0%
Public Corporation 0.0% 0.0% 0.0% 0.0% 0.0%
84.9%No N/a N/a 91.3% N/a N/a
Accreditation
Yes N/a N/a 8.7% N/a N/a 15.1%
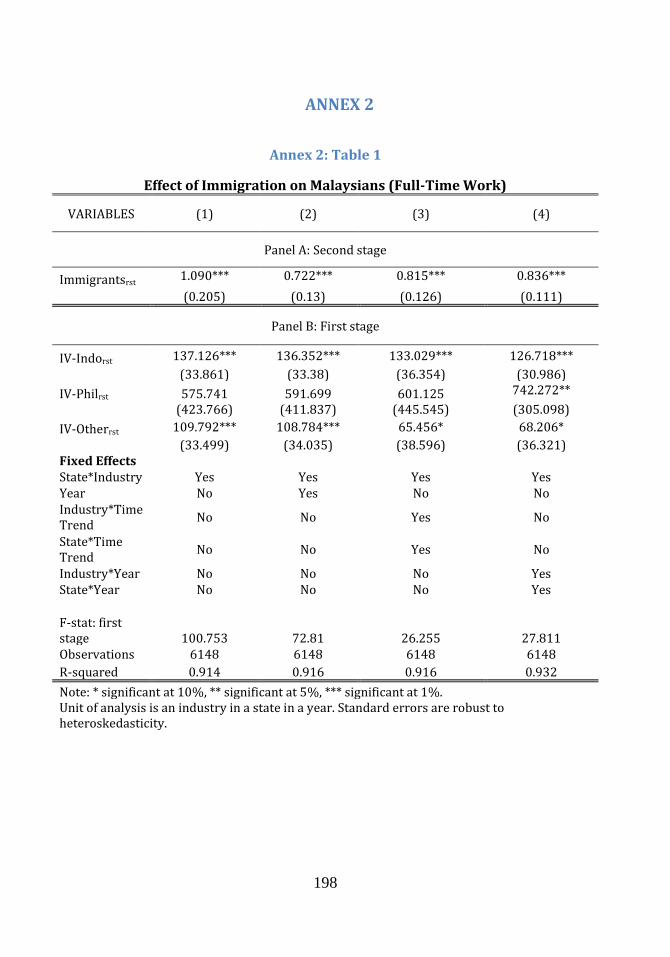
198
ANNEX 2
Annex 2: Table 1
Effect of Immigration on Malaysians (Full-Time Work)
VARIABLES (1) (2) (3) (4)
Panel A: Second stage
Immigrantsrst 1.090*** 0.722*** 0.815*** 0.836***
(0.205) (0.13) (0.126) (0.111)
Panel B: First stage
IV-Indorst 137.126*** 136.352*** 133.029*** 126.718***
(33.861) (33.38) (36.354) (30.986)
IV-Philrst 575.741 591.699 601.125 742.272**
(423.766) (411.837) (445.545) (305.098)
IV-Otherrst 109.792*** 108.784*** 65.456* 68.206*
(33.499) (34.035) (38.596) (36.321) Fixed Effects
State*Industry Yes Yes Yes Yes Year No Yes No No Industry*Time Trend
No No Yes No
State*Time Trend
No No Yes No
Industry*Year No No No Yes State*Year No No No Yes
F-stat: first stage 100.753 72.81 26.255 27.811 Observations 6148 6148 6148 6148
R-squared 0.914 0.916 0.916 0.932
Note: * significant at 10%, ** significant at 5%, *** significant at 1%. Unit of analysis is an industry in a state in a year. Standard errors are robust to
heteroskedasticity.
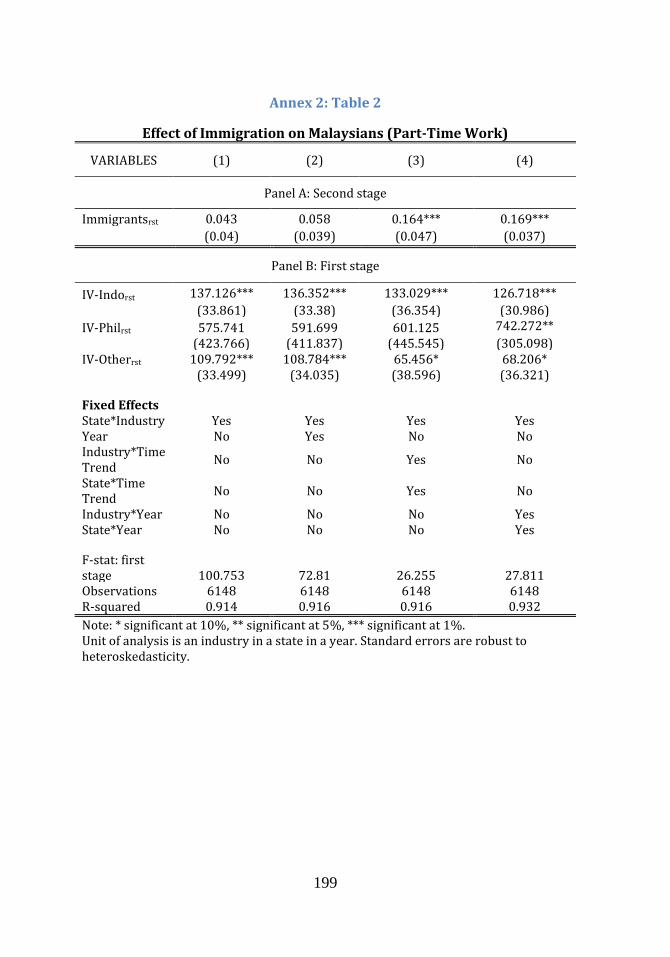
199
Annex 2: Table 2
Effect of Immigration on Malaysians (Part-Time Work)
VARIABLES (1) (2) (3) (4)
Panel A: Second stage
Immigrantsrst 0.043 0.058 0.164*** 0.169*** (0.04) (0.039) (0.047) (0.037)
Panel B: First stage
IV-Indorst 137.126*** 136.352*** 133.029*** 126.718***
(33.861) (33.38) (36.354) (30.986)
IV-Philrst 575.741 591.699 601.125 742.272**
(423.766) (411.837) (445.545) (305.098) IV-Otherrst 109.792*** 108.784*** 65.456* 68.206* (33.499) (34.035) (38.596) (36.321)
Fixed Effects State*Industry Yes Yes Yes Yes
Year No Yes No No Industry*Time Trend
No No Yes No
State*Time Trend
No No Yes No
Industry*Year No No No Yes State*Year No No No Yes
F-stat: first stage 100.753 72.81 26.255 27.811 Observations 6148 6148 6148 6148 R-squared 0.914 0.916 0.916 0.932
Note: * significant at 10%, ** significant at 5%, *** significant at 1%. Unit of analysis is an industry in a state in a year. Standard errors are robust to
heteroskedasticity.

200
Annex 2: Table 3
Effect of Immigration on Unemployment and Labor Force Participation Native Unemployment Rate Native Labor Force Participation
VARIABLES (1) (2) (3) (4) (5) (6)
Immigrantsrst -0.003 -0.0009
-0.008***
-0.034***
0.001 0.004
(0.003) (0.003) (0.003) (0.011) (0.007) (0.004)
Fixed Effects
State Yes Yes Yes Yes Yes Yes Year No Yes No No Yes No State*Time Trend
No No Yes No No Yes
F-stat: first stage 51.997 43.843 7.964 51.997 43.843 7.964 Observations 270 270 270 270 270 270 R-squared 0.927 0.939 0.958 0.927 0.76 0.833
Note: * significant at 10%, ** significant at 5%, *** significant at 1%. Unit of analysis is a state in a year. Standard errors are robust to heteroskedasticity
Annex 2: Table 4
Effect of Immigration on Employment by Economic Sector, Approach 1
VARIABLES Agriculture and mining
Manufacturing Service
Immigrantsrst 0.430*** 0.208 0.679*** (0.159) (0.372) (0.218)
Fixed Effects State*Industry Yes Yes Yes
Industry*Time Trend
Yes Yes Yes
State*Time Trend Yes Yes Yes
F-stat: first stage 7.95 2.19 46.11 Observations 539 2130 3479
Note: * significant at 10%, ** significant at 5%, *** significant at 1%. Unit of analysis is an industry in a state in a year. Standard errors are robust heteroskedasticity.
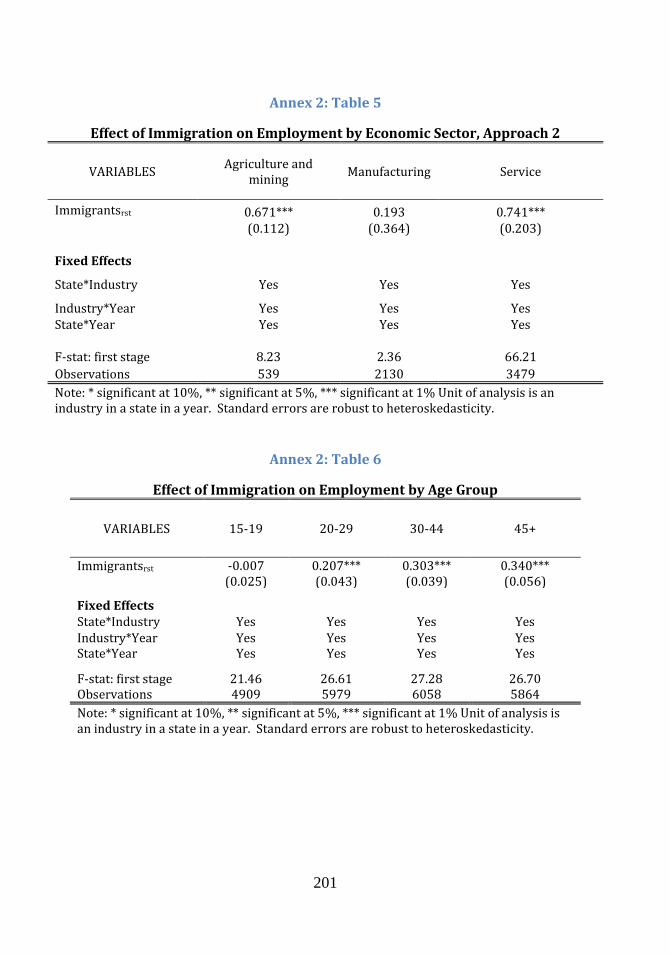
201
Annex 2: Table 5
Effect of Immigration on Employment by Economic Sector, Approach 2
VARIABLES Agriculture and
mining Manufacturing Service
Immigrantsrst 0.671*** 0.193 0.741*** (0.112) (0.364) (0.203)
Fixed Effects
State*Industry Yes Yes Yes
Industry*Year Yes Yes Yes State*Year Yes Yes Yes
F-stat: first stage 8.23 2.36 66.21
Observations 539 2130 3479
Note: * significant at 10%, ** significant at 5%, *** significant at 1% Unit of analysis is an industry in a state in a year. Standard errors are robust to heteroskedasticity.
Annex 2: Table 6
Effect of Immigration on Employment by Age Group
VARIABLES 15-19 20-29 30-44 45+
Immigrantsrst -0.007 0.207*** 0.303*** 0.340*** (0.025) (0.043) (0.039) (0.056)
Fixed Effects State*Industry Yes Yes Yes Yes
Industry*Year Yes Yes Yes Yes State*Year Yes Yes Yes Yes
F-stat: first stage 21.46 26.61 27.28 26.70 Observations 4909 5979 6058 5864
Note: * significant at 10%, ** significant at 5%, *** significant at 1% Unit of analysis is an industry in a state in a year. Standard errors are robust to heteroskedasticity.

202
Annex 2: Table 7
Effect of Immigration on Employment by Gender, Approach 1
Employed Natives Employed Natives (part-time)
VARIABLES Male Female Male Female
Immigrantsrst 0.604*** 0.235*** 0.091*** 0.080*** (0.088) (0.046) (0.024) (0.015)
Fixed Effects
State*Industry Yes Yes Yes Yes
Industry*Year Yes Yes Yes Yes State*Year Yes Yes Yes Yes
F-stat: first stage 27.73 26.34 27.73 26.34 Observations 6122 5885 6122 5885
Note: * significant at 10%, ** significant at 5%, *** significant at 1%. Unit of analysis is an industry in a state in a year. Standard errors are robust to heteroskedasticity.
Annex 2: Table 8
Effect of Immigration on Employment by Gender, Approach 2
Native Unemployment Rate Native Labor Force Participation
VARIABLES Male Female Male Female
Immigrantsrt -0.007** -0.009 0.001 0.001
(0.004) (0.004) (0.001) (0.001)
Fixed Effects State Yes Yes Yes Yes
State*Time Trend
Yes Yes Yes Yes
F-stat: first stage 7.96 7.96 7.96 7.96 Observations 270 270 270 270
Note: * significant at 10%, ** significant at 5%, *** significant at 1%. Unit of analysis is an industry in a state in a year. Standard errors are robust to heteroskedasticity.

203
Annex 2: Table 9
Effect of Immigration on Employment by Education Level
VARIABLES No
formal/Primary
Lower Seconda
ry (PMR)
Upper Seconda
ry (SPM)
Post Seconda
ry (STPM)
Certificate/Diploma
Degree and above
Immigrants
rst -0.114** 0.320*** 0.182*** 0.366*** 0.035*** 0.020
(0.056) (0.100) (0.033) (0.087) (0.011) (0.01
3)
Fixed Effects
State*Industry
Yes Yes Yes Yes Yes Yes
Industry*Year
Yes Yes Yes Yes Yes Yes
State*Year Yes Yes Yes Yes Yes Yes
F-stat: first stage 20.92 26.89 25.40 25.78 16.72 11.13 Observations 4030 5866 5753 6013 4998 4916
Note: * significant at 10%, ** significant at 5%, *** significant at 1%. Unit of analysis is an industry in a state in a year. Standard errors are robust to heteroskedasticity.

204
Annex 2: Table 10
Impact of Immigration on Log Wages of Malaysians
VARIABLES (1) (2) (3) (4)
Native Emloymentrst 0.0000037*** 0.0000009 0.0000005 -0.0000002
(0.0000009) (0.0000009) (0.0000029) (0.0000007)
Fixed Effects
State*Industry Yes Yes Yes Yes
Year No Yes No No
Industry*Time Trend No No Yes No
State*Time Trend No No Yes No
Industry*Year No No No Yes
State*Year No No No Yes
F-stat: 1st stage 2.05 11.63 4.05 5.94
Observations 110,662 110,662 110,662 110,662
Note: The dependent variable is log wages and the independent variable native employment, such that the reported coefficient (multiplied by the level of employment) is one over the elasticity of labor supply. * significant at 10%, ** significant at 5%, *** significant at 1%. Individual observations are weighted by sampling weights. Standard errors are clustered at the industry, state and year level. We use instruments separately by country of origin (Indonesia, Philippines and other) and 7 age groups for a total of 21 instruments. All specifications include individual characteristics: education fixed effects, polynomials potential experience (equals age – years of education – 6), marital status and the month of the survey; all the variables are interacted with a gender dummy.

205
Annex 2: Table 11
Impact of Immigration on Manufacturing Firm (50+ employees) (Log) Value Added.
Variables Food Text Wood Paper Chem Mach Computer Transp
Panel A: Year 2005
Log High Skilled labor
0.253*** 0.197*** 0.185*** 0.203*** 0.314*** 0.369*** 0.403*** 0.262***
(0.037) (0.047) (0.033) (0.023) (0.023) (0.028) (0.043) (0.062)
Log Low Skilled labor
0.612*** 0.684*** 0.852*** 0.643*** 0.471*** 0.456*** 0.473*** 0.689***
(0.052) (0.065) (0.057) (0.044) (0.047) (0.046) (0.046) (0.086)
Log Total Fixed Asset
0.304*** 0.157*** 0.157*** 0.206*** 0.294*** 0.234*** 0.227*** 0.205***
(0.026) (0.023) (0.027) (0.021) (0.023) (0.023) (0.032) (0.043)
5-digit-Sector FE
Yes Yes Yes Yes Yes Yes Yes Yes
State FE Yes Yes Yes Yes Yes Yes Yes Yes
Observations 826 329 515 895 1357 832 577 201
R-squared 0.727 0.767 0.743 0.732 0.752 0.765 0.819 0.824
Panel B: Year 2010
Log High Skilled labor
0.23*** 0.183*** 0.251*** 0.245*** 0.281*** 0.312*** 0.394*** 0.304***
(0.029) (0.049) (0.053) (0.026) (0.023) (0.027) (0.047) (0.05)
Log Low Skilled labor
0.584*** 0.664*** 0.844*** 0.628*** 0.485*** 0.478*** 0.424** * 0.567***
(0.052) (0.071) (0.065) (0.042) (0.031) (0.037) (0.066) (0.059)
Log Total Fixed Asset
0.279*** 0.184*** 0.1*** 0.188*** 0.308*** 0.243*** 0.258*** 0.222***
(0.022) (0.026) (0.025) (0.02) (0.018) (0.017) (0.032) (0.031)
5-digit-Sector FE
Yes Yes Yes Yes Yes Yes Yes Yes
State FE Yes Yes Yes Yes Yes Yes Yes Yes
Observations 907 250 424 819 1445 1084 557 258
R-squared 0.712 0.826 0.703 0.763 0.758 0.729 0.779 0.836

206
Annex 2: Table 12
Impact of Immigration on Manufacturing Firm (20-50 employees) (Log) Value Added.
Variables Food Text Wood Paper Chem Mach Computer Transp
Panel A: Year 2005
Log High Skilled labor
0.262*** 0.306*** 0.174*** 0.313*** 0.380*** 0.258*** 0.345*** 0.379***
(0.055) (0.056) (0.087) (0.035) (0.041) (0.033) (0.086) (0.105)
Log Low Skilled labor
1.012*** 0.636*** 0.650*** 0.709*** 0.523*** 0.375*** 0.309** 0.467*
(0.113) (0.145) (0.158) (0.092) (0.094) (0.143) (0.156) (0.248)
Log Total Fixed Asset
0.160*** 0.149*** 0.098*** 0.175*** 0.214*** 0.206*** 0.189*** 0.165***
(0.025) (0.020) (0.032) (0.024) (0.026) (0.022) (0.039) (0.043)
5-digit-Sector FE
Yes Yes Yes Yes Yes Yes Yes Yes
State FE Yes Yes Yes Yes Yes Yes Yes Yes
Observations 693 310 283 731 887 797 175 115
R-squared 0.618 0.539 0.221 0.479 0.451 0.401 0.502 0.508
Panel B: Year 2010
Log High Skilled labor
0.277*** 0.243*** 0.224*** 0.295*** 0.324*** 0.320*** 0.383*** 0.265***
(0.046) (0.054) (0.069) (0.031) (0.033) (0.032) (0.090) (0.080)
Log Low Skilled labor
0.494*** 0.494*** 0.875*** 0.606*** 0.526*** 0.579*** 0.520** * 0.112
(0.117) (0.137) (0.178) (0.086) (0.076) (0.072) (0.204) (0.183)
Log Total Fixed Asset
0.216*** 0.134*** 0.158*** 0.140*** 0.211*** 0.190*** 0.139*** 0.209***
(0.024) (0.021) (0.031) (0.015) (0.018) (0.013) (0.042) (0.033)
5-digit-Sector FE
Yes Yes Yes Yes Yes Yes Yes Yes
State FE Yes Yes Yes Yes Yes Yes Yes Yes
Observations 743 288 305 791 996 1000 180 153
R-squared 0.55 0.511 0.324 0.345 0.402 0.48 0.381 0.513

207
Annex 2: Table 13
Impact of Immigration on Construction Firms (50+ employees) (Log) Value Added
Variables 2000 2002 2004 2007
Log High Skilled labor
0.26*** 0.31*** 0.32*** 0.25***
(0.012) (0.010) (0.010) (0.015)
Log Low Skilled labor
0.67*** 0.55*** 0.53*** 0.76***
(0.020) (0.017) (0.0171) (0.014)
Log Total Fixed Asset
0.13*** 0.13*** 0.11*** 0.10***
(0.010) (0.010) (0.011) (0.010)
3-digit-Sector FE Yes Yes Yes Yes
State FE Yes Yes Yes Yes
Observations 1984 1944 1896 2017
R-squared 0.73 0.73 0.64 0.81
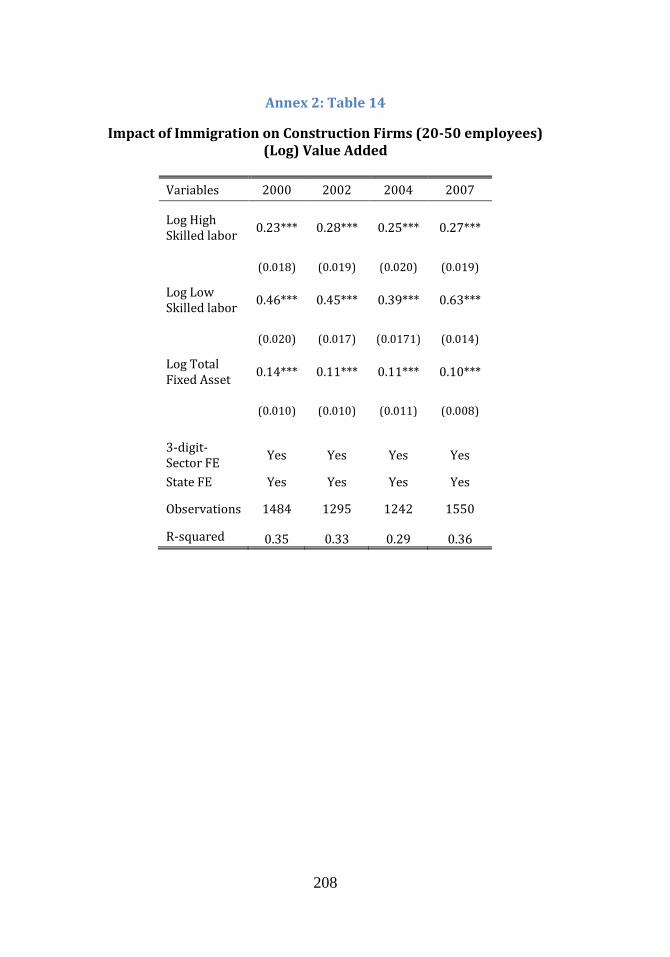
208
Annex 2: Table 14
Impact of Immigration on Construction Firms (20-50 employees) (Log) Value Added
Variables 2000 2002 2004 2007
Log High Skilled labor
0.23*** 0.28*** 0.25*** 0.27***
(0.018) (0.019) (0.020) (0.019)
Log Low Skilled labor
0.46*** 0.45*** 0.39*** 0.63***
(0.020) (0.017) (0.0171) (0.014)
Log Total Fixed Asset
0.14*** 0.11*** 0.11*** 0.10***
(0.010) (0.010) (0.011) (0.008)
3-digit-Sector FE
Yes Yes Yes Yes
State FE Yes Yes Yes Yes
Observations 1484 1295 1242 1550
R-squared 0.35 0.33 0.29 0.36
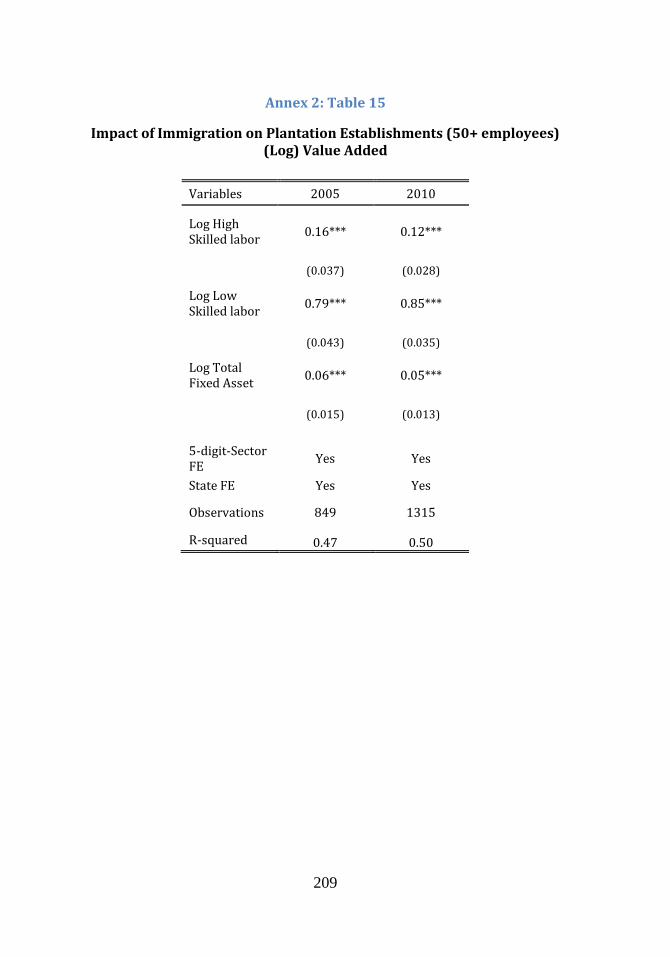
209
Annex 2: Table 15
Impact of Immigration on Plantation Establishments (50+ employees) (Log) Value Added
Variables 2005 2010
Log High Skilled labor
0.16*** 0.12***
(0.037) (0.028)
Log Low Skilled labor
0.79*** 0.85***
(0.043) (0.035)
Log Total Fixed Asset
0.06*** 0.05***
(0.015) (0.013)
5-digit-Sector FE
Yes Yes
State FE Yes Yes
Observations 849 1315
R-squared 0.47 0.50

210
Annex 2: Table 16
Impact of Immigration on Plantation Establishments (20-50 employees) (Log) Value Added
Variables 2005 2010
Log High Skilled labor
0.31*** 0.25***
(0.072) (0.049)
Log Low Skilled labor
0.82*** 0.63***
(0.153) (0.157)
Log Total Fixed Asset
0.14*** 0.16***
(0.026) (0.023)
5-digit-Sector FE
Yes Yes
State FE Yes Yes
Observations 508 714
R-squared 0.59 0.63

211
Annex 2: Table 17
Impact of Immigration on Plantation Establishments (5+ employees) (Log) Value Added
ICT Accommodation
Variables All years pooled
2005 2010
Log High Skilled labor
0.604*** 0.29*** 0.31***
(0.023) (0.024) (0.023)
Log Low Skilled labor
0.293*** 0.79*** 0.74***
(0.016) (0.030) (0.033)
Log Total Fixed Asset
0.283*** 0.13*** 0.12***
(0.014) (0.009) (0.008)
5-digit-Sector FE
Yes Yes Yes
Year FE Yes
State FE Yes Yes Yes
Observations 2701 1389 2046
R-squared 0.79 0.89 0.84

212
Annex 2: Table 18
Impact of Immigration on Manufacturing Firm (50+ Employees) (Log) TFP
Variables (1) (2) (3) (4) (5) (6) (7) (8)
Panel A: OLS Regressions
Log number of migrants
-0.038***
-0.039***
-0.039***
-0.039***
-0.039***
-0.05*** -
0.041*** -0.049***
(0.006) (0.006) (0.005) (0.005) (0.005) (0.006) (0.005) (0.006)
Year FE No Yes Yes No No No No No
State*Sector FE
No No Yes Yes Yes Yes Yes Yes
Sector*Year FE
No No No Yes Yes Yes Yes Yes
State*Year FE No No No No Yes Yes Yes Yes
Size Control No No No No No Yes No Yes
R&D Controls No No No No No No Yes Yes
Observations 11276 11276 11276 11276 11276 11276 11276 11276
Panel B: IV regression
Log number of migrants
0.03 0.028 0.511*** 0.64*** 0.64*** 0.591** 0.623*** 0.619**
(0.049) (0.051) (0.117) (0.214) (0.208) (0.256) (0.203) (0.259)
Year FE No Yes Yes No No No No No
State*Sector FE
No No Yes Yes Yes Yes Yes Yes
Sector*Year FE
No No No Yes Yes Yes Yes Yes
State*Year FE No No No No Yes Yes Yes Yes
Size Control No No No No No Yes No Yes
R&D Controls No No No No No No Yes Yes
Observations 11276 11276 11276 11276 11276 11276 11276 11276

213
Annex 2: Table 19
Impact of Immigration on Manufacturing Firm (20-50 Employees) (Log) TFP
Variables (1) (2) (3) (4) (5) (6) (7) (8)
Panel A: OLS Regressions
Log number of migrants
-0.003 -0.002 -
0.016** -
0.016** -
0.018** -
0.026*** -
0.016** -
0.023***
(0.011) (0.010) (0.008) (0.008) (0.008) (0.008) (0.008) (0.008)
Year FE No Yes Yes No No No No No
State*Sector FE
No No Yes Yes Yes Yes Yes Yes
Sector*Year FE
No No No Yes Yes Yes Yes Yes
State*Year FE
No No No No Yes Yes Yes Yes
Size Control No No No No No Yes No Yes
R&D Controls
No No No No No No Yes Yes
Observations 8447 8447 8447 8447 8447 8447 8447 8447
Panel B: IV regression
Log number of migrants
0.205* 0.228* 0.393 0.818 -0.045 -0.398 0.000 -0.385
(0.113) (0.118) (0.901) (0.941) (0.413) (0.467) (0.427) (0.482)
Year FE No Yes Yes No No No No No
State*Sector FE
No No Yes Yes Yes Yes Yes Yes
Sector*Year FE
No No No Yes Yes Yes Yes Yes
State*Year FE
No No No No Yes Yes Yes Yes
Size Control No No No No No Yes No Yes
R&D Controls
No No No No No No Yes Yes
Observations 8447 8447 8447 8447 8447 8447 8447 8447
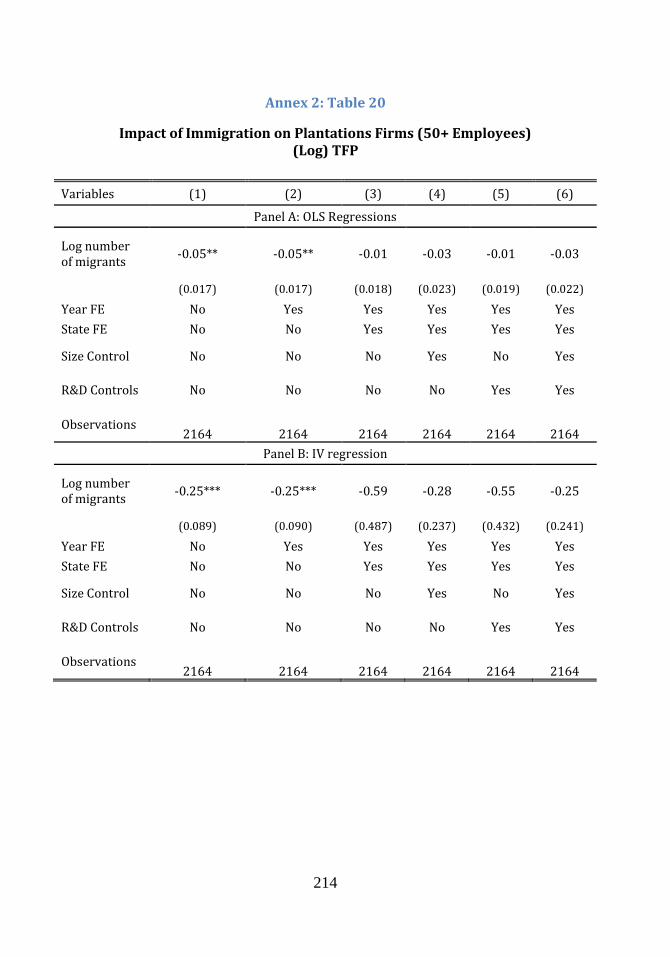
214
Annex 2: Table 20
Impact of Immigration on Plantations Firms (50+ Employees) (Log) TFP
Variables (1) (2) (3) (4) (5) (6)
Panel A: OLS Regressions
Log number of migrants
-0.05** -0.05** -0.01 -0.03 -0.01 -0.03
(0.017) (0.017) (0.018) (0.023) (0.019) (0.022)
Year FE No Yes Yes Yes Yes Yes
State FE No No Yes Yes Yes Yes
Size Control No No No Yes No Yes
R&D Controls No No No No Yes Yes
Observations 2164 2164 2164 2164 2164 2164
Panel B: IV regression
Log number of migrants
-0.25*** -0.25*** -0.59 -0.28 -0.55 -0.25
(0.089) (0.090) (0.487) (0.237) (0.432) (0.241)
Year FE No Yes Yes Yes Yes Yes
State FE No No Yes Yes Yes Yes
Size Control No No No Yes No Yes
R&D Controls No No No No Yes Yes
Observations 2164 2164 2164 2164 2164 2164

215
Annex 2: Table 21
Impact of Immigration on Plantation Firms (20-50 Employees) (Log) TFP
Variables (1) (2) (3) (4) (5) (6)
Panel A: OLS Regressions
Log number of migrants
-0.11*** -0.12*** -0.08*** -0.11*** -0.08*** -0.11***
(0.028) (0.029) (0.028) (0.028) (0.028) (0.029)
Year FE No Yes Yes Yes Yes Yes
State FE No No Yes Yes Yes Yes
Size Control No No No Yes No Yes
R&D Controls
No No No No Yes Yes
Observations 1222 1222 1222 1222 1222 1222
Panel B: IV regression
Log number of migrants
-0.37*** -0.36*** -2.03*** -1.83*** -2.09*** -1.83***
(0.119) (0.076) (0.855) (0.597) (0.860) (0.578)
Year FE No Yes Yes Yes Yes Yes
State FE No No Yes Yes Yes Yes
Size Control No No No Yes No Yes
R&D Controls
No No No No Yes Yes
Observations 1222 1222 1222 1222 1222 1222
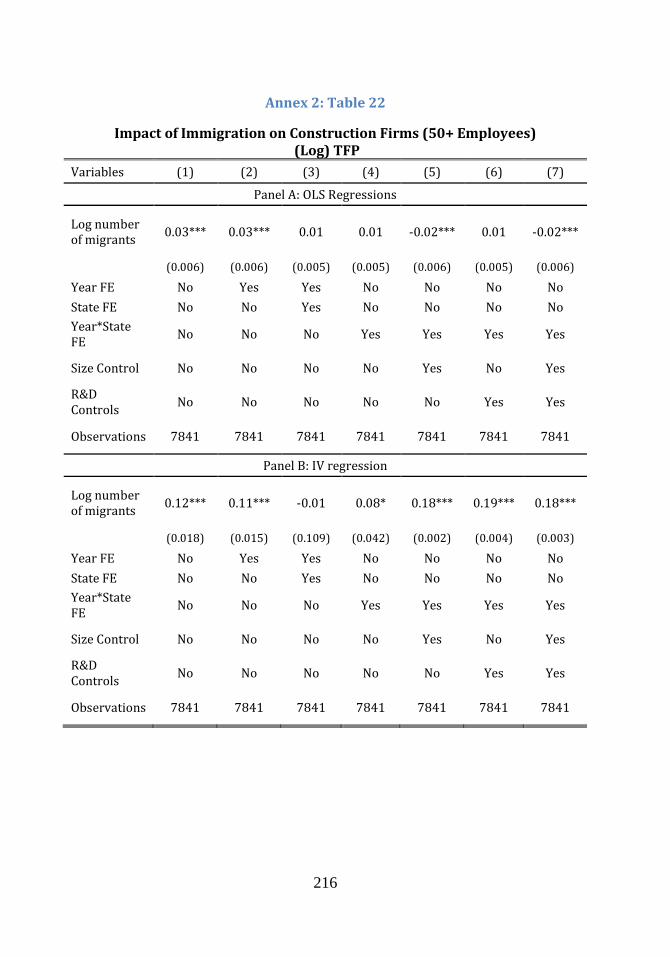
216
Annex 2: Table 22
Impact of Immigration on Construction Firms (50+ Employees) (Log) TFP
Variables (1) (2) (3) (4) (5) (6) (7)
Panel A: OLS Regressions
Log number of migrants
0.03*** 0.03*** 0.01 0.01 -0.02*** 0.01 -0.02***
(0.006) (0.006) (0.005) (0.005) (0.006) (0.005) (0.006)
Year FE No Yes Yes No No No No
State FE No No Yes No No No No
Year*State FE
No No No Yes Yes Yes Yes
Size Control No No No No Yes No Yes
R&D Controls
No No No No No Yes Yes
Observations 7841 7841 7841 7841 7841 7841 7841
Panel B: IV regression
Log number of migrants
0.12*** 0.11*** -0.01 0.08* 0.18*** 0.19*** 0.18***
(0.018) (0.015) (0.109) (0.042) (0.002) (0.004) (0.003)
Year FE No Yes Yes No No No No
State FE No No Yes No No No No
Year*State FE
No No No Yes Yes Yes Yes
Size Control No No No No Yes No Yes
R&D Controls
No No No No No Yes Yes
Observations 7841 7841 7841 7841 7841 7841 7841

217
Annex 2: Table 23
Impact of Immigration on Construction Firms (20-50 Employees) (Log) TFP
Variables (1) (2) (3) (4) (5) (6) (7)
Panel A: OLS Regressions
Log number of migrants
0.019* 0.018* -0.011 -0.012 -0.027*** -0.012 -0.027***
(0.009) (0.009) (0.007) (0.007) (0.007) (0.007) (0.007)
Year FE No Yes Yes No No No No
State FE No No Yes No No No No
Year*State FE
No No No Yes Yes Yes Yes
Size Control No No No No Yes No Yes
R&D Controls
No No No No No Yes Yes
Observations 5571 5571 5571 5571 5571 5571 5571
Panel B: IV regression
Log number of migrants
0.167*** 0.165*** -0.263 -0.299** -0.580* 0.302** -0.587*
(0.043) (0.043) (0.208) (0.126) (0.303) (0.127) (0.309)
Year FE No Yes Yes No No No No
State FE No No Yes No No No No
Year*State FE
No No No Yes Yes Yes Yes
Size Control No No No No Yes No Yes
R&D Controls
No No No No No Yes Yes
Observations 5571 5571 5571 5571 5571 5571 5571

218
Annex 2: Table 24
Impact of Immigration on Accommodation firms (5+ Employees) (Log) TFP
Variables (1) (2) (3) (4) (5) (6)
Panel A: OLS Regressions
Log number of migrants
0.07*** 0.06*** 0.02 -0.01 0.02 -0.01
(0.017) (0.014) (0.015) (0.014) (0.014) (0.014)
Year FE No Yes Yes Yes Yes Yes
State FE No No Yes Yes Yes Yes
Size Control No No No Yes No Yes
R&D Controls
No No No No Yes Yes
Observations 3435 3435 3435 3435 3435 3435
Panel B: IV regression
Log number of migrants
1.75*** 1.76*** 0.46 -0.49 0.35 -0.47
(0.601) (0.643) (0.606) (0.522) (0.594) (0.507)
Year FE No Yes Yes Yes Yes Yes
State FE No No Yes Yes Yes Yes
Size Control No No No Yes No Yes
R&D Controls
No No No No Yes Yes
Observations 3435 3435 3435 3435 3435 3435

219
Annex 2: Table 25
Impact of Immigration on ICT firms (5+ Employees) (Log) TFP
Variables (1) (2) (3) (4) (5) (6) (7) (8)
Panel A: OLS Regressions
Log number of migrants
0.08** 0.11*** 0.09*** 0.09*** 0.08** 0.04 0.08** 0.04
(0.030) (0.032) (0.032) (0.032) (0.031) (0.046) (0.031) (0.046)
Year FE No Yes Yes No No No No No State*Sector FE
No No Yes Yes Yes Yes Yes Yes
Sector*Year FE
No No No Yes Yes Yes Yes Yes
State*Year FE
No No No No Yes Yes Yes Yes
Size Control No No No No No Yes No Yes R&D Controls
No No No No No No Yes Yes
Observations 2701 2701 2701 2701 2701 2701 2701 2701 Panel B: IV Regressions
Log number of migrants
-0.38 -0.08 1.77 2.17** -0.29 -0.27 -0.50 -0.25
(0.840) (0.719) (2.590) (1.030) (0.710) (1.100) (0.706) (1.090)
Year FE No Yes Yes No No No No No State*Sector FE
No No Yes Yes Yes Yes Yes Yes
Sector*Year FE
No No No Yes Yes Yes Yes Yes
State*Year FE
No No No No Yes Yes Yes Yes
Size Control No No No No No Yes No Yes R&D Controls
No No No No No No Yes Yes
Observations 2701 2701 2701 2701 2701 2701 2701 2701
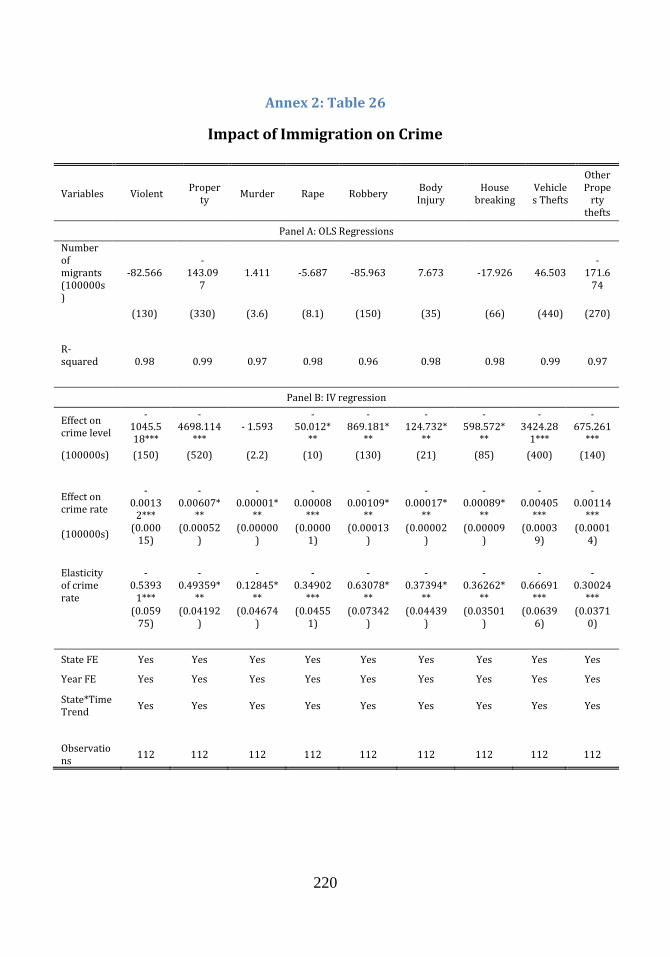
220
Annex 2: Table 26
Impact of Immigration on Crime
Variables Violent Proper
ty Murder Rape Robbery
Body Injury
House breaking
Vehicles Thefts
Other Prope
rty thefts
Panel A: OLS Regressions
Number of migrants (100000s)
-82.566 -
143.097
1.411 -5.687 -85.963 7.673 -17.926 46.503 -
171.674
(130) (330) (3.6) (8.1) (150) (35) (66) (440) (270)
R-squared 0.98 0.99 0.97 0.98 0.96 0.98 0.98 0.99 0.97
Panel B: IV regression
Effect on crime level
-1045.518***
-4698.114
*** - 1.593
- 50.012*
**
-869.181*
**
-124.732*
**
-598.572*
**
-3424.28
1***
-675.261
***
(100000s) (150) (520) (2.2) (10) (130) (21) (85) (400) (140)
Effect on crime rate
-0.0013
2***
-0.00607*
**
-0.00001*
**
-0.00008
***
-0.00109*
**
-0.00017*
**
-0.00089*
**
-0.00405
***
-0.00114
***
(100000s) (0.000
15) (0.00052
) (0.00000
) (0.0000
1) (0.00013
) (0.00002
) (0.00009
) (0.0003
9) (0.0001
4)
Elasticity of crime rate
-0.5393
1***
-0.49359*
**
-0.12845*
**
-0.34902
***
-0.63078*
**
-0.37394*
**
-0.36262*
**
-0.66691
***
-0.30024
***
(0.059
75) (0.04192
) (0.04674
) (0.0455
1) (0.07342
) (0.04439
) (0.03501
) (0.0639
6) (0.0371
0)
State FE Yes Yes Yes Yes Yes Yes Yes Yes Yes
Year FE Yes Yes Yes Yes Yes Yes Yes Yes Yes
State*Time Trend
Yes Yes Yes Yes Yes Yes Yes Yes Yes
Observations
112 112 112 112 112 112 112 112 112

221
ANNEX 3
Annex 3: Table 1 Macro Results: Employer Pays
Reference Scenario
Macro Results 2012 2013 2014 2015
GDP Growth 5.21% 4.72% 5.05% 5.05%
Government Deficit -0.063 -0.076 -0.090 -0.108
International migration (millions) 1.125 0.925 0.968 1.015
Total investment (billion RM) 0.177 0.175 0.179 0.186
Loc. labor demand variation 7.682 7.882 8.076 8.264
Total Unemployment 2.64% 2.55% 2.45% 2.33%
20% levy increase
Macro Results 2013 2014 2015
GDP Growth -0.02% 0.00% 0.00%
Government Deficit -0.12% -0.11% -0.10%
International migration -1.40% -1.39% -1.35%
Total investment 0.02% 0.03% 0.03%
Loc. labor demand variation 0.00% 0.00% 0.00%
Total Unemployment 0.00% 0.00% 0.00%
50% levy increase
Macro Results 2013 2014 2015
GDP Growth -0.05% 0.01% 0.00%
Government Deficit -0.29% -0.28% -0.25%
International migration -3.51% -3.42% -3.35%
Total investment 0.05% 0.06% 0.06%
Loc. labor demand variation 0.00% 0.00% 0.00%
Total Unemployment 0.00% 0.00% 0.00%
100% levy increase
Macro Results 2013 2014 2015
GDP Growth -0.09% 0.01% 0.01%
Government Deficit -0.56% -0.52% -0.47%
International migration -6.86% -6.76% -6.59%
Total investment 0.09% 0.12% 0.12%
Loc. labor demand variation 0.00% 0.00% 0.00%
Total Unemployment 0.00% 0.00% 0.00%
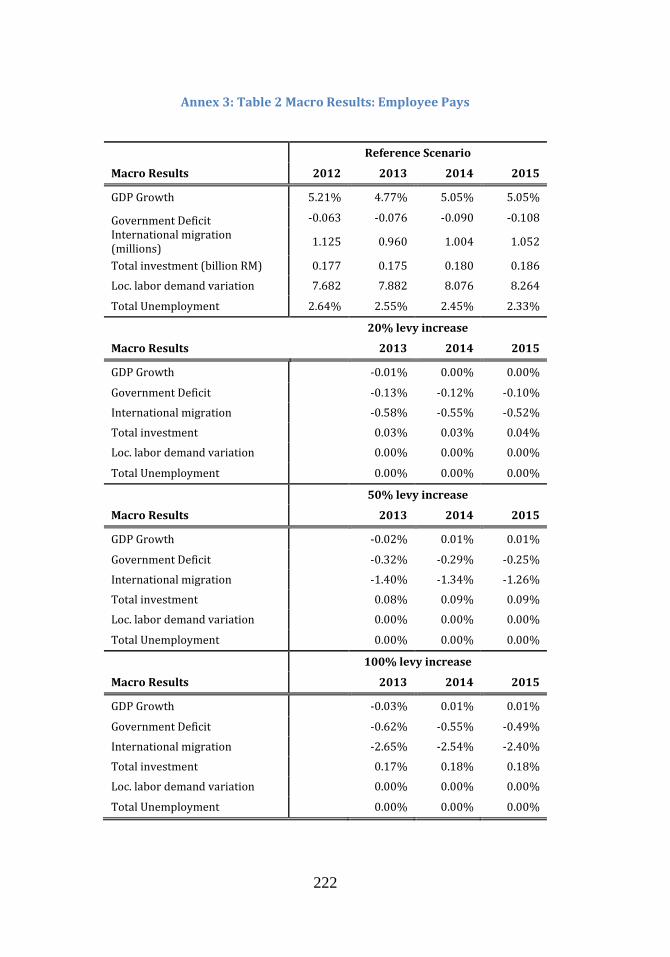
222
Annex 3: Table 2 Macro Results: Employee Pays
Reference Scenario
Macro Results 2012 2013 2014 2015
GDP Growth 5.21% 4.77% 5.05% 5.05%
Government Deficit -0.063 -0.076 -0.090 -0.108
International migration (millions)
1.125 0.960 1.004 1.052
Total investment (billion RM) 0.177 0.175 0.180 0.186
Loc. labor demand variation 7.682 7.882 8.076 8.264
Total Unemployment 2.64% 2.55% 2.45% 2.33%
20% levy increase
Macro Results 2013 2014 2015
GDP Growth -0.01% 0.00% 0.00%
Government Deficit -0.13% -0.12% -0.10%
International migration -0.58% -0.55% -0.52%
Total investment 0.03% 0.03% 0.04%
Loc. labor demand variation 0.00% 0.00% 0.00%
Total Unemployment 0.00% 0.00% 0.00%
50% levy increase
Macro Results 2013 2014 2015
GDP Growth -0.02% 0.01% 0.01%
Government Deficit -0.32% -0.29% -0.25%
International migration -1.40% -1.34% -1.26%
Total investment 0.08% 0.09% 0.09%
Loc. labor demand variation 0.00% 0.00% 0.00%
Total Unemployment 0.00% 0.00% 0.00%
100% levy increase
Macro Results 2013 2014 2015
GDP Growth -0.03% 0.01% 0.01%
Government Deficit -0.62% -0.55% -0.49%
International migration -2.65% -2.54% -2.40%
Total investment 0.17% 0.18% 0.18%
Loc. labor demand variation 0.00% 0.00% 0.00%
Total Unemployment 0.00% 0.00% 0.00%

223
ANNEX 4
Annex 4: Issue 1 Expatriates Conditions for Approval and Excluded Categories
Conditions of Application through the Expatriate Committee (EC). Application for Expatriates is based on the following criteria: a) Minimum Paid-up Capital: The minimum paid-up capital for a Private Limited Company/Public Listed Company effective January 1, 2009 is as follows:
No Equity Capital
1. 100% Locally Owned RM 250,000.00
2. Local and Foreign Owned RM 350,000.00
3. 100% Foreign Owned RM 500,000.00
b) Recommendation from Monitoring Agencies
No. Ministry/Agency Related Fields
1. Ministry of Higher Education/Ministry of Education
Lecturer, tutor and teacher
2. Ministry of Health Medical Doctor, Nurse and Traditional Medical Practitioner
3. Football Association of Malaysia Footballer
4. National Sports Council Athlete and Coach
5. Civil Aviation Department, Malaysia Pilot and Civil Aviator
6. Ministry of Tourism Tourism agencies
7. Malaysian Professional Golf Associates
Golf Related Activities
8. Biotechnology Corporation of Malaysia
Bio-technology related activities.
c) Registration with the Monitoring Agencies
Construction Industry Development Board (CIDB)—For companies that run activities related to construction and maintenances
Ministry of Domestic Trade, Co-operatives and Consumerism (MDTCC)—For companies that have foreign equity involvement in wholesaling, marketing and retailing (including restaurants) and direct selling.
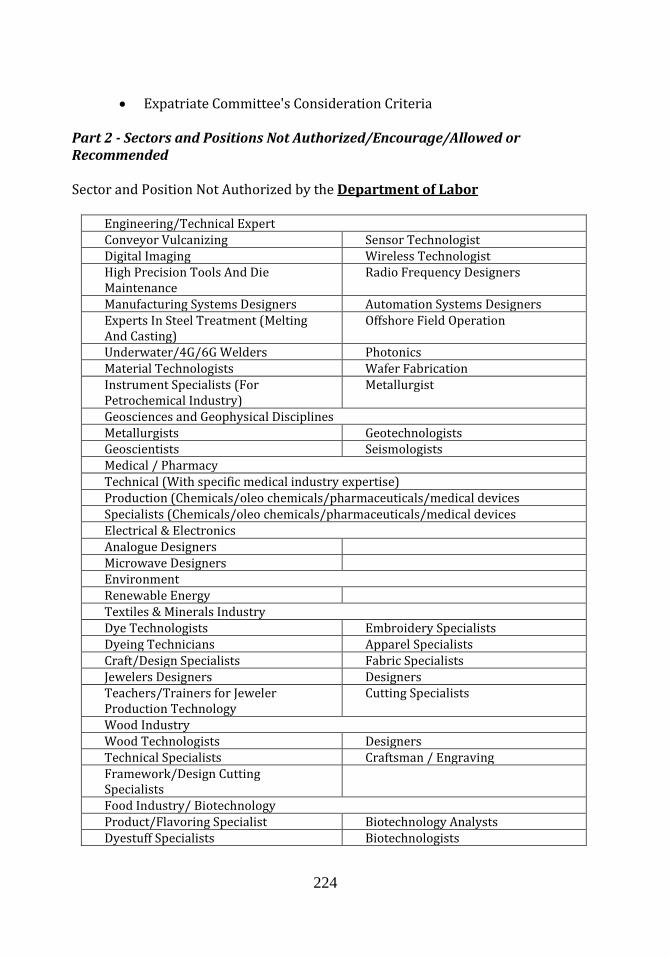
224
Expatriate Committee's Consideration Criteria Part 2 - Sectors and Positions Not Authorized/Encourage/Allowed or Recommended Sector and Position Not Authorized by the Department of Labor
Engineering/Technical Expert Conveyor Vulcanizing Sensor Technologist Digital Imaging Wireless Technologist High Precision Tools And Die Maintenance
Radio Frequency Designers
Manufacturing Systems Designers Automation Systems Designers Experts In Steel Treatment (Melting And Casting)
Offshore Field Operation
Underwater/4G/6G Welders Photonics Material Technologists Wafer Fabrication Instrument Specialists (For Petrochemical Industry)
Metallurgist
Geosciences and Geophysical Disciplines Metallurgists Geotechnologists Geoscientists Seismologists Medical / Pharmacy Technical (With specific medical industry expertise) Production (Chemicals/oleo chemicals/pharmaceuticals/medical devices Specialists (Chemicals/oleo chemicals/pharmaceuticals/medical devices Electrical & Electronics Analogue Designers Microwave Designers Environment Renewable Energy Textiles & Minerals Industry Dye Technologists Embroidery Specialists Dyeing Technicians Apparel Specialists Craft/Design Specialists Fabric Specialists Jewelers Designers Designers Teachers/Trainers for Jeweler Production Technology
Cutting Specialists
Wood Industry Wood Technologists Designers Technical Specialists Craftsman / Engraving Framework/Design Cutting Specialists
Food Industry/ Biotechnology Product/Flavoring Specialist Biotechnology Analysts Dyestuff Specialists Biotechnologists

225
Tea/Food Tasters Food/Nutrient Technologists Disease Control/Quarantine Genetic Engineering Specialists
List of sectors that are not allowed/encouraged to apply for expatriate posts under the jurisdiction of the Ministry of Domestic Trade, Co-operatives and Consumerism
No. Type of Business 1. Supermarket / minimarket 2. Retail store 3. General furniture business 4. Frame making business 5. Small scale textile business 6. Computer retail business, including computer accessories 7. Barber shop that does not require foreign expertise 8. Launderette 9. Restaurant that is not exclusive (in terms of layout and menu) 10. Prepaid card business 11. Cyber café 12. Vehicle , motor, glass and aluminum small-scale workshops 13. Herbal Product Business
List of sectors that are not allowed/encouraged to apply for expatriate posts under the jurisdiction of the Construction Industry Development Board Malaysia (CIDB)
No.
Post
(Mechanical & Electrical) 1. Electrical Charge man 2. Electrical Wireman 3. Telephone & Telegraph Installer 4. Tools & Air-Conditioning System Including Ducting Installer 5. Elevator & escalator Assembler and Tester Earth Moving Plant Operator 6. Excavator Operator 7. Shovel Operator 8. Dozer Operator 9. Motor Grader Operator 10. Scrapper Operator 11. Roller Compactor Operator 12. Backhoe Loader Operator 13. Lorry driver 14. Forklift Operator 15. Wheel Loader Operator Crane Operator
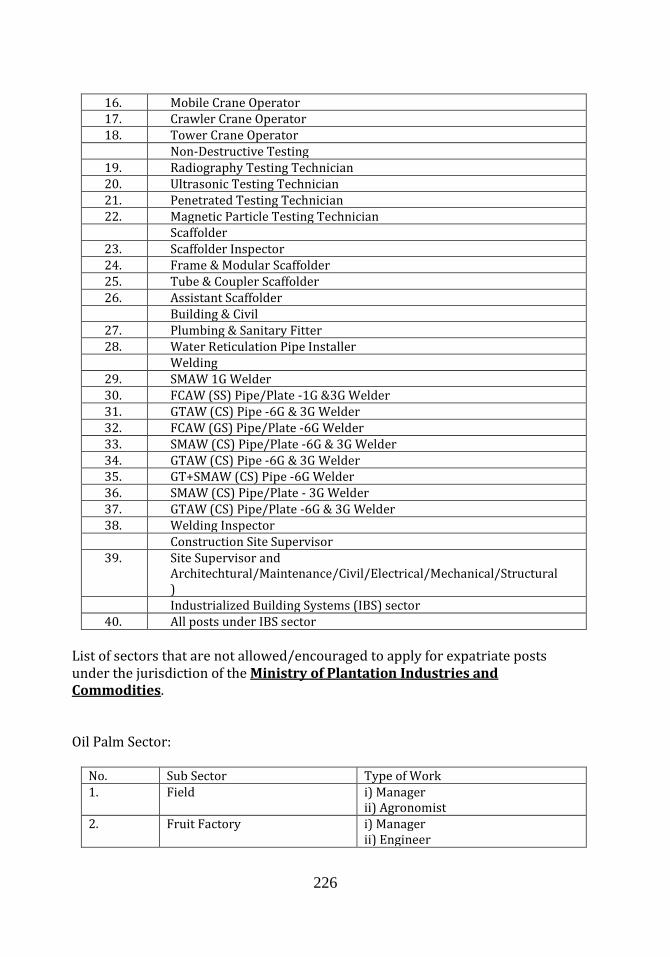
226
16. Mobile Crane Operator 17. Crawler Crane Operator 18. Tower Crane Operator Non-Destructive Testing 19. Radiography Testing Technician 20. Ultrasonic Testing Technician 21. Penetrated Testing Technician 22. Magnetic Particle Testing Technician Scaffolder 23. Scaffolder Inspector 24. Frame & Modular Scaffolder 25. Tube & Coupler Scaffolder 26. Assistant Scaffolder Building & Civil 27. Plumbing & Sanitary Fitter 28. Water Reticulation Pipe Installer Welding 29. SMAW 1G Welder 30. FCAW (SS) Pipe/Plate -1G &3G Welder 31. GTAW (CS) Pipe -6G & 3G Welder 32. FCAW (GS) Pipe/Plate -6G Welder 33. SMAW (CS) Pipe/Plate -6G & 3G Welder 34. GTAW (CS) Pipe -6G & 3G Welder 35. GT+SMAW (CS) Pipe -6G Welder 36. SMAW (CS) Pipe/Plate - 3G Welder 37. GTAW (CS) Pipe/Plate -6G & 3G Welder 38. Welding Inspector Construction Site Supervisor 39. Site Supervisor and
Architechtural/Maintenance/Civil/Electrical/Mechanical/Structural)
Industrialized Building Systems (IBS) sector 40. All posts under IBS sector
List of sectors that are not allowed/encouraged to apply for expatriate posts under the jurisdiction of the Ministry of Plantation Industries and Commodities. Oil Palm Sector:
No. Sub Sector Type of Work 1. Field i) Manager
ii) Agronomist 2. Fruit Factory i) Manager
ii) Engineer
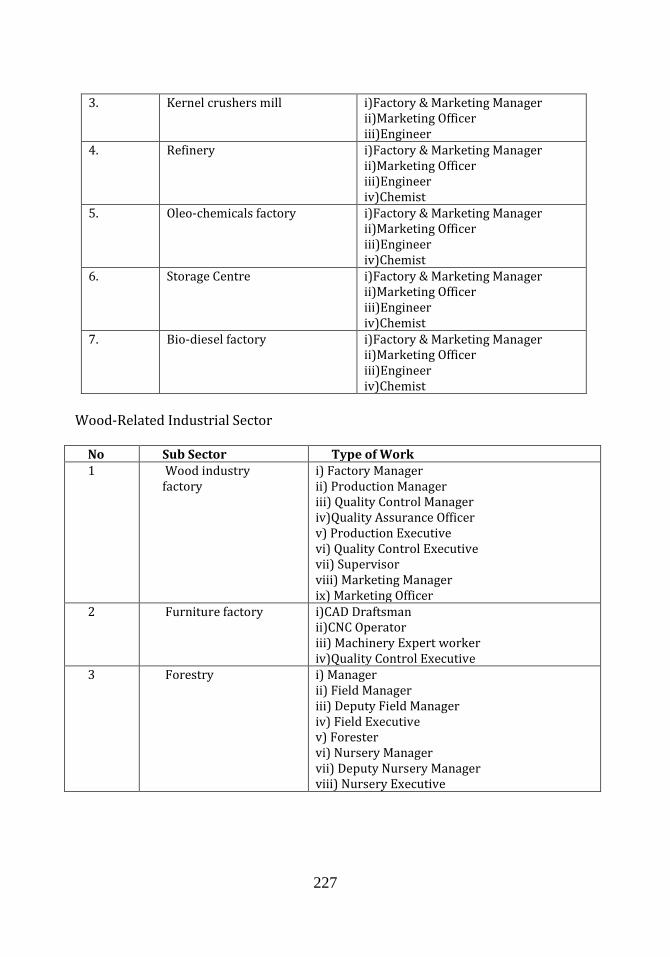
227
3. Kernel crushers mill i)Factory & Marketing Manager ii)Marketing Officer iii)Engineer
4. Refinery i)Factory & Marketing Manager ii)Marketing Officer iii)Engineer iv)Chemist
5. Oleo-chemicals factory i)Factory & Marketing Manager ii)Marketing Officer iii)Engineer iv)Chemist
6. Storage Centre i)Factory & Marketing Manager ii)Marketing Officer iii)Engineer iv)Chemist
7. Bio-diesel factory i)Factory & Marketing Manager ii)Marketing Officer iii)Engineer iv)Chemist
Wood-Related Industrial Sector
No Sub Sector Type of Work 1 Wood industry
factory i) Factory Manager ii) Production Manager iii) Quality Control Manager iv)Quality Assurance Officer v) Production Executive vi) Quality Control Executive vii) Supervisor viii) Marketing Manager ix) Marketing Officer
2 Furniture factory i)CAD Draftsman ii)CNC Operator iii) Machinery Expert worker iv)Quality Control Executive
3 Forestry i) Manager ii) Field Manager iii) Deputy Field Manager iv) Field Executive v) Forester vi) Nursery Manager vii) Deputy Nursery Manager viii) Nursery Executive
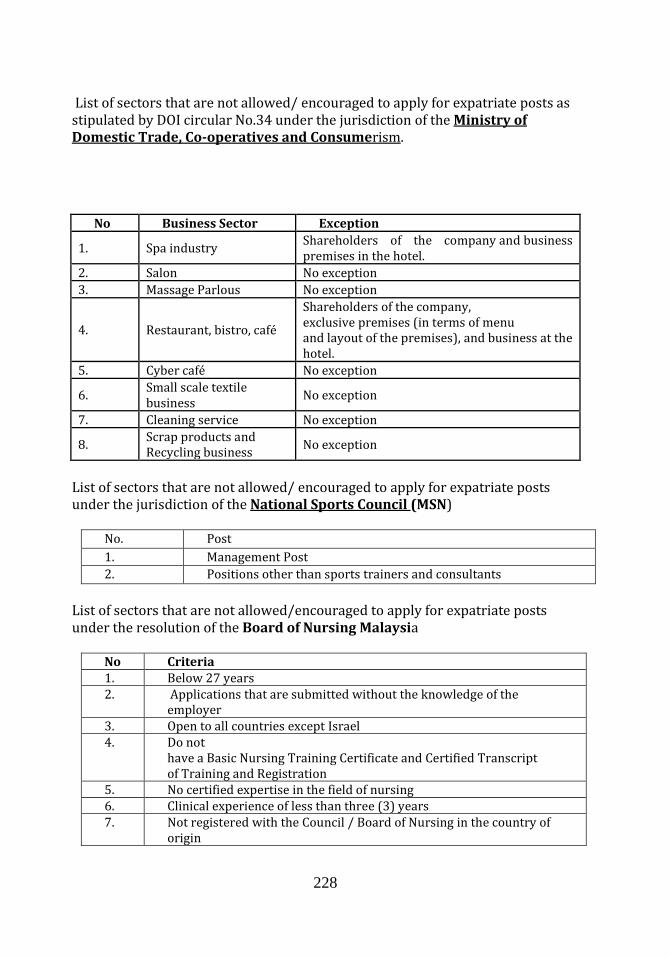
228
List of sectors that are not allowed/ encouraged to apply for expatriate posts as stipulated by DOI circular No.34 under the jurisdiction of the Ministry of Domestic Trade, Co-operatives and Consumerism.
No Business Sector Exception
1. Spa industry Shareholders of the company and business premises in the hotel.
2. Salon No exception
3. Massage Parlous No exception
4. Restaurant, bistro, café
Shareholders of the company, exclusive premises (in terms of menu and layout of the premises), and business at the hotel.
5. Cyber café No exception
6. Small scale textile business
No exception
7. Cleaning service No exception
8. Scrap products and Recycling business
No exception
List of sectors that are not allowed/ encouraged to apply for expatriate posts under the jurisdiction of the National Sports Council (MSN)
No. Post
1. Management Post
2. Positions other than sports trainers and consultants
List of sectors that are not allowed/encouraged to apply for expatriate posts under the resolution of the Board of Nursing Malaysia
No Criteria 1. Below 27 years 2. Applications that are submitted without the knowledge of the
employer 3. Open to all countries except Israel 4. Do not
have a Basic Nursing Training Certificate and Certified Transcript of Training and Registration
5. No certified expertise in the field of nursing 6. Clinical experience of less than three (3) years 7. Not registered with the Council / Board of Nursing in the country of
origin

229
8. Top post such as Institution Head, Director of Nursing, Nursing Manager
9. Midwifery Sector (Obstetrics)
Source for all data in Appendix 1: MOHA
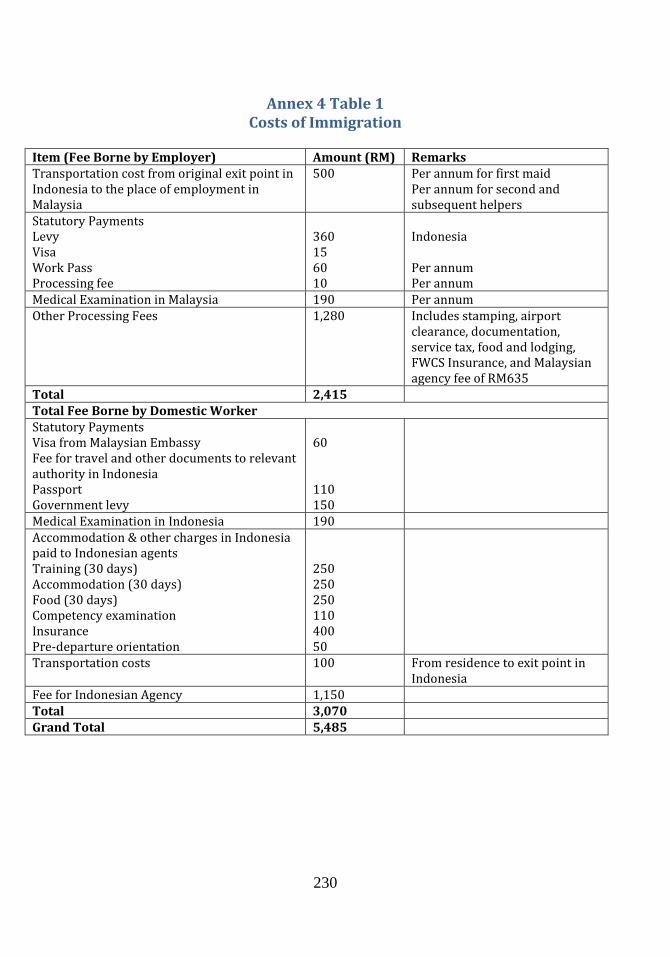
230
Annex 4 Table 1 Costs of Immigration
Item (Fee Borne by Employer) Amount (RM) Remarks Transportation cost from original exit point in Indonesia to the place of employment in Malaysia
500 Per annum for first maid Per annum for second and subsequent helpers
Statutory Payments Levy Visa Work Pass Processing fee
360 15 60 10
Indonesia Per annum Per annum
Medical Examination in Malaysia 190 Per annum Other Processing Fees 1,280 Includes stamping, airport
clearance, documentation, service tax, food and lodging, FWCS Insurance, and Malaysian agency fee of RM635
Total 2,415 Total Fee Borne by Domestic Worker Statutory Payments Visa from Malaysian Embassy Fee for travel and other documents to relevant authority in Indonesia Passport Government levy
60 110 150
Medical Examination in Indonesia 190 Accommodation & other charges in Indonesia paid to Indonesian agents Training (30 days) Accommodation (30 days) Food (30 days) Competency examination Insurance Pre-departure orientation
250 250 250 110 400 50
Transportation costs 100 From residence to exit point in Indonesia
Fee for Indonesian Agency 1,150 Total 3,070 Grand Total 5,485

231
Annex 4: Issue 2 Immigration Offences relating to Migrant Workers
Immigration Act 1959/63: Section 6(3) – Non possession of valid Entry Permit Any person who contravenes section 6(1) shall be guilty of an offence and shall, on conviction, be liable to a fine not exceeding RM 10,000 or to imprisonment for a term not exceeding five years or to both, and shall also be liable to whipping of not more than six strokes. Amended Section 15(4) –Unlawful entry or presence in Malaysia. A person shall not remain in Malaysia after the expiration of the period of any Pass relating to or issued to him. Any per son who without reasonable cause contravenes this section shall be guilty of an offence and shall, on conviction, be liable to a fine of not less than RM 10,000 or to imprisonment for a term not exceeding five years or to both. Section 55B(1) – Employing a person who is not in possession of a valid Pass Any person who employs one or more persons, other than a citizen or holder of an Entry Permit,, who is not in possession of a valid Pass shall be guilty of an offence and shall, on conviction, be liable to a fine of not less than RM 10,000 but not more than RM 50,000 or to imprisonment for a term not exceeding 12 months or to both for each such employee. Section 55B (3) – Employing a person who is not in possession of a valid Pass Where, in the case of an offence under section 55B (1), it is proved to the satisfaction of the court that the person has at the same time employed more than five such employees that person shall, on conviction be liable to imprisonment for a term of not less than six months but not more than five years and shall also be liable to whipping of not more than five years and shall also be liable to whipping of not more than six strokes. Section 55B (5) – Employing a person who is not in possession of a valid Pass. Where the offence under subsection (1) has been committed by a body corporate, any person who at the time of the commission of the offence was a member of the board of directors, a manager, a secretary or a person holding an office or a position similar to that of a manager or secretary of the body corporate shall be guilty of that offence and shall be liable to the same punishment to which the body corporate is liable under subsection (1) or (3).

232
Section 55 D – Forgery or alteration of endorsement or document. Any person who makes, forges or alters an endorsement or a document to be used as a Visa, Permit, Pass or Certificate under this Act shall be guilty of an offence against this Act and shall, on conviction, be liable to affine of not less than RM 30,000 but not more than RM 100,000 and to imprisonment for a term of not less than five years but not more than 10 years and shall also be punished with whipping of not more than six strokes. Section 56(1)(d) & Section 56(1)– Offence of Harbouring A person who harbors any person whom he knows or has reasonable grounds for believing to have acted in contravention of this Act. Section 56 (bb) – in the case under paragraph (d), be liable to a fine of not less than RM 10,000 and not more than RM 50,000 for each person harbored and where it is proved to the satisfaction of the where it is proved to the satisfaction of the court that the person has at the same time harbored more than five such persons that person shall be liable to imprisonment for a term of not less than six months but not more than five years and shall also be liable to whipping of not more than six strokes. Section 56(1)(l) & Section 56(1)(l) (aa) – Possessing or Using Forged Documents Any person who uses or without lawful authority has in his possession any forged, unlawfully altered or irregular entry Permit, Pass or other documents issued under this Act so issued on which any endorsement has been forged or unlawfully altered, shall be guilty of an offence and shall, on conviction, except for an offence under paragraph (d), be liable to a fine not exceeding RM10,000 or to imprisonment for a term not exceeding five years. Immigration Regulations 1963- Regulation 39(b) Any person who without reasonable cause: contravenes or fails to comply with any condition imposed in respect of, or instruction endorsed on, any Pass, Permit, or Boundary Pass, shall be guilty of an offence against these Regulations and shall be liable on conviction to a term of imprisonment not exceeding six months or to a fine not exceeding RM1,000 or to both such imprisonment and fine.

233
Annex 4: Table 2 Chronology of Events/Changes Related to Migrant Workers (1980 – 2010)
Year Policy/Regulation 1980s
1982 Formation of Committee for the Recruitment of Foreign Workers. 1984 Medan Agreement with Indonesia – for agriculture and plantation and domestic workers.
Signing of the MOU between Malaysia and the Philippines – for domestic workers;
1985-86
Permission given for employers to recruit workers from Bangladesh and Thailand for the plantation and construction sectors; Signing of MOU between Malaysia and The Philippines for Domestic Workers
1987 Legalized the use of Indonesian workers in the plantation sector. 1989 Regularization program
1990s Jan 1990
Freeze on labor importation from Indonesia.
1991 Oct 1991 Dec 1991
Formation of Cabinet Committee on Foreign Workers. Introduction of an annual migrant-worker levy, which varies by sector and skill category general, semi-skilled and unskilled). Agriculture (RM360, RM540 and RM720); Construction (RM420, RM600 and RM900); Manufacturing (RM420, RM600 and RM900); Services (RM360, RM540 and RM720). Launching of Ops Nyah I (Operation Expunge I - to stop illegal infiltration). Launching of Ops Nyah II (Operation Expunge II - to weed out illegal immigrants).
Jun 1992 Jul 1992
Permission given for employers to recruit workers from Indonesia, Thailand, Philippines, Bangladesh and Pakistan for manufacturing and services sectors.
Apr 1993-Jan 94
Ban on unskilled worker recruitment. Ban lifted for manufacturing sector. Ban re-implemented on unskilled and semi-skilled workers for all sectors.
Oct 1995 Dec 1995
Special Task Force on Foreign Labor (the sole agency for recruitment - a one-stop-agency to deal with the processing of immigrants). All levies increased by 100 percent except for agriculture and domestic service. It was raised to RM1200 for construction and manufacturing and RM720 for services
Jan 1996 Apr 1996 Aug 96- Jan 97
Freeze on the importation of skilled and unskilled labor except for critical sectors in manufacturing and recreation/ tourist industries. Hari Raya Amnesty for Indonesian illegal workers. Freeze on labor importation (employers were instructed to recruit directly from the immigration detention depots) - eventually cancelled the exercise due to the lukewarm response from employers.
Mac 1997 Aug 1997
Task Force disbanded - functions taken over by the Foreign Workers Division of the Immigration Department. Ban on new recruitment on migrant workers due to the AFC. Second regularization exercise for illegal migrants from Indonesia, Thailand, the Philippines, Bangladesh and Pakistan.
Jan 1998
Annual levy per worker raised to RM1500 for the construction, manufacturing and services sector. It was maintained at RM360 for the plantation and domestic services sector. Mandatory contribution to EPF (12 percent and 11 percent of monthly wages by

234
1998 Jul 1998 Aug 1998 Oct 1998 Nov – Dec 1998
employers and employees respectively). Compulsory workmen compensation scheme introduced for foreign workers. Employers to pay annual contribution. Compulsory medical examination of foreign workers through inception of FOMEMA Amendment to The Immigration Act 1998, introducing whipping as punishment for illegal entry or irregular employment. Ban on the renewal of work permits for the services sector lifted. Amendment to the Employment Act 1955, to introduce a new part XII B dealing with foreign workers Ban on new recruitment lifted - 120,000 new work permits approved for migrant workers in plantation and construction sectors. Freeze on the importation of migrant workers lifted.
Feb 1999 Oct 1999
Levies are lowered for all categories (from RM1500 to RM1200), except domestic workers. New hiring’s of mostly Indonesian workers. Recruitment of Sri Lankans in the manufacturing sector.
2000s 2001 May 2001 Oct 2001
Mandatory contribution to EPF revoked. Ban on intake of Bangladeshis - following clashes with locals. Maximum limit of temporary work pass limited from 5 years to 3 years
2002 Mac – Jul 2002 Jul 2002
Maximum work permit extended to a 3+1+1 ruling (except for domestic services). Ban on new recruitment of Indonesian workers in all sectors, except for domestic services. Increase in the number of source countries to reduce dependency on Indonesian workers. Amnesty program Recruitment of Cambodians in the agri-plantation, manufacturing and construction sectors.
Jan 2003 Apr 2003 Sept 2003 Dec 2003
Restrictions lifted on Indonesian workers in the manufacturing and construction sectors. Freeze on hiring of migrant workers from SARs related countries. Signing of MOU between Malaysia and China - for workers in ceramics and furniture. Amendment to Immigration Act 2002 - higher penalty for illegal immigration. Mandatory whipping of up to six strokes of the cane for irregular migrants and their employers.
Mac 2004 Oct 2004
Signing of the MOU between Malaysia and Vietnam. New requirement - migrant workers to attend classes on Malaysian language and culture. Illegal workers allowed to return on nationwide amnesty.
2005 Mac 2005 Aug 2005
Permission granted to migrant workers whose contracts have expired to change employers within the same economic sector as long as their work permits are still valid. Signing of the MOU between Malaysia and Pakistan. RELA, or the People’s Volunteer Corps given power to arrest unauthorized migrants until mid-2009 - provided opportunities for extortion. Levies are revised: RM 1200 (RM960) for manufacturing and construction Peninsula (East Malaysia); RM540 for plantations; and RM 1800 (RM1440) for non-domestic services in

235
Peninsula (East Malaysia). 2006 Nov 2006
MOHA licensed 270 outsourcing companies to recruit mainly South Asian migrants. Electronic Labor Exchange (ELX) created at the MOHR - mandatory for employers in plantation, construction, manufacturing and services to advertise vacancies in the ELX before they can apply to bring in migrant workers. Signing of the MOU between Malaysia and Indonesia - Malaysian employers are asked to pay RM 2,415 to a local agent while the domestic worker has to pay her Indonesia –based agent RM 1,228.
2007 Jul 2007 Oct 2007
New outsourcing system that does not attach workers permits to a particular employer -dilutes the control of the government. Major operation to round up an estimated 500,000 irregular migrants. Ban on the recruitment of Bangladeshi workers because of problems arising from agents (both recruiting agencies in their home country and outsourcing companies in Malaysia).
Jan 2008
Unskilled migrant workers will not have their work permits extended if they have been in the country for five years or more.
2009 Jan 2009 Apr 2009 Oct 2009 Jul 2009
Freeze on the issuance of new licenses for labor outsourcing companies. Freeze on labor importation for the manufacturing sector. Cost of levy to be borne by employers, instead of workers. Protests by migrant workers that employers continued deducting wages to cover the levy charges. Freeze on the importation of migrant workers lifted for specific industries.
2010 (Current) May 2010 Nov 2010
Signing of a Letter of Intent between Indonesia and Malaysia – Malaysian employers to pay RM 700 a month, not to hold passports, and provide one day off a week. Compulsory medical insurance policy for migrant workers (excluding domestic maids) Effective Jan 2011 - annual premium of RM120 per worker. Stopped renewal of work permits for Bangladeshi migrants.
July 2011
Introduction of 6P – Comprehensive Legalization Program for Illegal Foreigners or the 6P program
Aug 1 - 31, 2011 Sept 2011 to 10 April 2012
Registration of migrants using Biometric system. Total of 2.32 million migrants have registered including 1.3 irregular migrants. Legalization and Amnesty exercise. 480,995 irregular migrants legalized under 6P involving 91,064 employers. A total of 146,979 irregular were given amnesty and chose to return to their respective countries of origin.
10 April 2012 to Present
Monitoring, Enforcement and Deportation. A total of 4,156 migrant workers monitoring operations, involving 24,520 enforcement personnel, were conducted nationwide during the 6P program, during which 89,278 irregular migrants were verified. Of these, 13,492 irregular migrants were arrested and action has been taken against 337 errant employers.
Source: Devadason, (2011) updated to current date
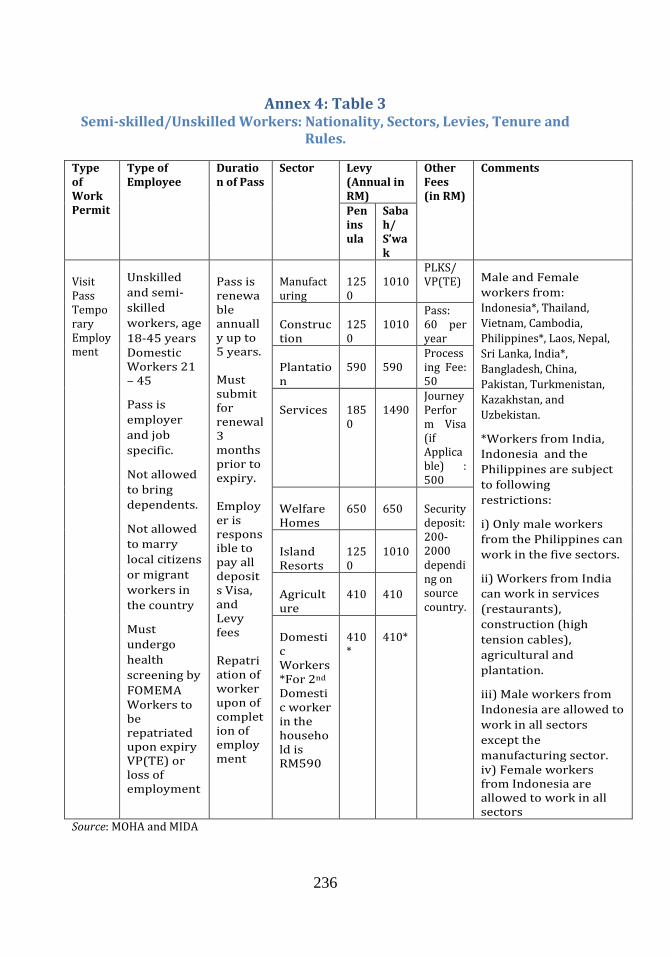
236
Annex 4: Table 3 Semi-skilled/Unskilled Workers: Nationality, Sectors, Levies, Tenure and
Rules.
Type of Work Permit
Type of Employee
Duration of Pass
Sector Levy (Annual in RM)
Other Fees (in RM)
Comments
Peninsula
Sabah/ S’wak
Visit Pass Temporary Employment
Unskilled
and semi-
skilled
workers, age
18-45 years Domestic Workers 21 – 45
Pass is
employer
and job
specific.
Not allowed
to bring
dependents.
Not allowed
to marry
local citizens
or migrant
workers in
the country
Must
undergo
health
screening by
FOMEMA Workers to be repatriated upon expiry VP(TE) or loss of employment
Pass is renewable annually up to 5 years. Must submit for renewal 3 months prior to expiry. Employer is responsible to pay all deposits Visa, and Levy fees Repatriation of worker upon of completion of employment
Manufacturing
1250
1010
PLKS/ VP(TE) Male and Female
workers from:
Indonesia*, Thailand,
Vietnam, Cambodia,
Philippines*, Laos, Nepal,
Sri Lanka, India*,
Bangladesh, China,
Pakistan, Turkmenistan,
Kazakhstan, and
Uzbekistan.
*Workers from India,
Indonesia and the
Philippines are subject
to following
restrictions:
i) Only male workers
from the Philippines can
work in the five sectors.
ii) Workers from India
can work in services
(restaurants),
construction (high
tension cables),
agricultural and
plantation.
iii) Male workers from
Indonesia are allowed to
work in all sectors
except the
manufacturing sector. iv) Female workers from Indonesia are allowed to work in all sectors
Construction
1250
1010
Pass: 60 per year
Plantation
590
590
Processing Fee: 50
Services
1850
1490
Journey Perform Visa (if Applicable) : 500
Welfare Homes
650
650
Security deposit: 200-2000 depending on source country.
Island Resorts
1250
1010
Agriculture
410
410
Domestic Workers *For 2nd Domestic worker in the household is RM590
410*
410*
Source: MOHA and MIDA

237
ANNEX 5
Annex 5: Table 1 Point Test: Australia
Factor Description Points
Age, at time of invitation
18-24 25
25-32 30
33-39 25
40-44 15
45-49 0
English language competency level at time of
invitation
Competent English - IELTS 6 / OET B 0
Proficient English - IELTS 7 / OET B 10
Superior English - IELTS 8 / OET A 20
Overseas skilled employment in nominated
skilled occupation or a closely related skilled
occupation, at time of invitation
At least three but less than five years (of past 10 years) 5
At least five but less than eight years (of past 10 years) 10
At least eight and up to 10 years (of past 10 years) 15
Australian skilled employment in nominated
skilled occupation or a closely related skilled
occupation, at time of invitation
At least one but less than three years (of past 10 years) 5
At least three but less than five years (of past 10 years) 10
At least five but less than eight years (of past 10 years) 15
At least eight and up to 10 years (of past 10 years) 20
Educational qualification, at time of invitation Doctorate from an Australian educational institutions or
other Doctorate of a recognized standard
20
At least a Bachelor Degree, including Bachelor degree
with Honors or Masters, from an Australian educational
institutions or other Doctorate of a recognized standard
15
Diploma completed in Australia, trade qualification
completed in Australia, or qualification or award of
recognized standard
10
Other factors, at time of invitation
Credentialed community past 10 years) 5
Study in regional Australia or in a low population growth
metropolitan area (excluding distance education) 5
Partner skill qualifications
5
Professional Year Completion, for a period of at least 12
months in the four year period immediately before the
day on which the invitation was issued
5
Australian study qualifications, at time of
invitation
One or more degrees, diplomas or trade qualifications
awarded by an Australian educational institution and
meet Australian Study Requirement
5
Nomination/Sponsorship, at time of invitation
Nomination by State or Territory government (visa
subclass 190 only)
educational institutions or other Doctorate of a
recognized standard
5
Nomination by State or Territory government or
sponsorship by an eligible family member, for residing
and working in a specified/designated area (visa subclass
190 only)
5
Source: DIAC

238
Annex 5: Table 2 Point Test: Canada
Factor Description Points
Age
17 2 18 4 19 6 20 8
21–49 10 50 8 51 6 52 4 53 2
54+ 0 First Language
per ability (Speaking, Listening,
Reading, and Writing)
High proficiency (per ability): IELTS 7.0-9.0 4
Moderate proficiency (per ability): IELTS 5.0-6.9 2
Basic proficiency (per ability): IELTS 4.0-4.9 1 (max 2)
No proficiency: IELTS less than 4.0 0
Second Language per ability (Speaking, Listening,
Reading, and Writing)
High proficiency (per ability): TEF level 5-6 2
Moderate proficiency (per ability): TEF level 4 2
Basic proficiency (per ability): TEF level 3 1 (max 2)
No proficiency: TEF level 0-2 0
Experience
1 year 15 2 years 17 3 years 19 4 years 21
Education
Have a masters or PhD and at least 17 years of full-time or equivalent study.
25
Have two or more university degrees at the bachelor’s level and at least 15 years of full-time or full-time equivalent study.
22
Have a three-year diploma, trade certificate or apprenticeship and at least 15 years of full-time or full-time equivalent study.
22
Have a university degree of two years or more at the bachelor’s level and at least 14 years of full-time or full-time equivalent study.
20
Have a two-year diploma, trade certificate or apprenticeship and at least 14 years of full-time or full-time equivalent study.
20
Have a one-year university degree at the bachelor’s level and at least 13 years of full-time or full-time equivalent study.
15
Have a one-year diploma, trade certificate or apprenticeship and at least 13 years of full-time or full-time equivalent study.
15
Have a one-year diploma, trade certificate or apprenticeship and at least 12 years of full-time or full-time equivalent study.
12
You completed high school. 5 Pre-arranged employment
HRSDC, NAFTA, CCFTA, GATS, Postgraduate work permit, or Arranged Employment Opinion (AEO)
10
Adaptability
A spouse/common-law partner who would be awarded 25 points 5 A spouse/common-law partner who would be awarded 20 or 22 points 4
A spouse/common-law partner who would be awarded 12 or 15 3

239
points
Minimum one year of full-time authorized work in Canada 5 Minimum two years of full-time authorized post-secondary study in Canada 5 Points received under the Arranged Employment Factor 5 Family relationship in Canada 5
Source: Border Connections: http://www.borderconnections.com/faq.html#funds