Immigration and Labor Productivity: New Empirical Evidence ...ftp.iza.org/dp7297.pdf · Immigration...
26
DISCUSSION PAPER SERIES Forschungsinstitut zur Zukunft der Arbeit Institute for the Study of Labor Immigration and Labor Productivity: New Empirical Evidence for Spain IZA DP No. 7297 March 2013 Catia Nicodemo
Transcript of Immigration and Labor Productivity: New Empirical Evidence ...ftp.iza.org/dp7297.pdf · Immigration...

DI
SC
US
SI
ON
P
AP
ER
S
ER
IE
S
Forschungsinstitut zur Zukunft der ArbeitInstitute for the Study of Labor
Immigration and Labor Productivity:New Empirical Evidence for Spain
IZA DP No. 7297
March 2013
Catia Nicodemo
Immigration and Labor Productivity: New Empirical Evidence for Spain
Catia Nicodemo University of Oxford,
CHSEO and IZA
Discussion Paper No. 7297 March 2013
IZA
P.O. Box 7240 53072 Bonn
Germany
Phone: +49-228-3894-0 Fax: +49-228-3894-180
E-mail: [email protected]
Any opinions expressed here are those of the author(s) and not those of IZA. Research published in this series may include views on policy, but the institute itself takes no institutional policy positions. The IZA research network is committed to the IZA Guiding Principles of Research Integrity. The Institute for the Study of Labor (IZA) in Bonn is a local and virtual international research center and a place of communication between science, politics and business. IZA is an independent nonprofit organization supported by Deutsche Post Foundation. The center is associated with the University of Bonn and offers a stimulating research environment through its international network, workshops and conferences, data service, project support, research visits and doctoral program. IZA engages in (i) original and internationally competitive research in all fields of labor economics, (ii) development of policy concepts, and (iii) dissemination of research results and concepts to the interested public. IZA Discussion Papers often represent preliminary work and are circulated to encourage discussion. Citation of such a paper should account for its provisional character. A revised version may be available directly from the author.
IZA Discussion Paper No. 7297 March 2013
ABSTRACT
Immigration and Labor Productivity: New Empirical Evidence for Spain*
The purpose of this paper of this paper is to explore the immigration and productivity in Spain. We estimate the effect of immigration on labor productivity from 2004 until 2008 for Spain. Using firms (SABI) and individuals data (Social Security Records) we calculate the effect by sector and municipality for the two big Spanish provinces that have received most immigrants in the last decade: Barcelona and Madrid. After controlling for endogeneity of immigration, the results demonstrate that immigration have a negative effect on productivity. Education and occupation are both variables with a positive effect on productivity, while permanent, public or full time contracts do not have any effect. Type of immigration, Europeans 15 (more skill) versus no European, is not relevant in explain the negative productivity. This fact is due that firms are very heterogenous across them and use their employees under their real production potential. JEL Classification: F22, J61, R11 Keywords: immigration, labor productivity, Spain, MCVL, SABI Corresponding author: Catia Nicodemo Department of Economics Oxford University Nuffield College New Road, OX4 1NF, Oxford United Kingdom E-mail: [email protected]
* Financial support from the Fundacion Ramon Areces (Ayuda Investigacion 2010) is gratefully acknowledged.
Introduction
In the last years some OECD countries such as Spain, Italy, Greece and UK, have exper-
imented a huge flow of immigration with a strong impact on many different levels: aging,
labor market, welfare, education, pension system .... In particular, the labor market (the
supply side, the productivity and the skill composition) of the host country is the most
affected, due to the immigration is composed of young people who leave their country in
search of a job. In addition, most of the immigrants are low-skilled, a quite cheap fac-
tor of production, and in competition with native workers with some qualification. As a
consequence, immigration has an effect on the composition of the workforce and on labor
productivity.
Looking at the productivity, since the 90’s in most European countries has fallen, especially
in countries that have received the highest flow of immigrants, e.g. Italy or Spain (See
Izquierdo et al, 2010). Most of these countries have received a low skill immigration that
work in intensive labor sectors with below of average productivity, so of part of this decline
in productivity is due to this transitory negative composition effect. More specifically, we
observe that the lowest increase in productivity is experimented by the regions where more
jobs are created and received more immigrants. A possible explanation is that the supply
of immigrants can reduces the employment costs in that region, so the work factor becomes
more intensive in such particular economy, and the productivity decreases accordingly.
Furthermore, immigration flows are unequally distributed among countries and cities.
Usually, to build stronger networks and increase their chances of finding employment,
immigrants concentrate in municipalities and places with high economic activity.
Several studies have analyzed how such differential in flows of immigrants have affected
different aspects of state economies such as labor markets (recently Borjas 2006, Card 2001,
2007, 2009, Peri and Sparber 2009), industrial specialization (Card and Lewis 2007) and
innovative capacity (Gauthier-Loiselle and Hunt 2008). Most of these studies conclude that
immigrants are complementary to native workers, and that the increase in the available
workforce has little effect on wages and income. However, the effects of immigration at
the industry level are largely unexplored, as indeed is its impact on productivity.
This study sets out to identify the effect of immigration on labour productivity across
Spanish municipalities. Specifically, we analyse the impact of immigration on the produc-
tivity of firms at municipality and sector levels for two big provinces of Spain: Barcelona
and Madrid.
2
In absolute numbers of foreign population, Spain ranks third among OECD countries af-
ter USA and Germany. Spain has receive from 2000 until 2008 more than five millions of
immigrants (see Figure 1). However, the distribution of immigrants is not homogeneous
across cities and regions in Spain. As we can see in Figure 2, the immigration is concen-
trated along the East coast, and Madrid and Barcelona are the cities that more immigrants
have hosted, exposing them not only a significant social transformation (language, culture,
etc.), but also with a large effect to the labor workforce and so far to the firms that use
immigrants as employees.
Literature on productivity and immigration in Spain is limited. Earlier research on immi-
gration in Spain has focused on wages and inequality rather than on productivity, see for
example Ortega and Gonzales (2010), Carrasco et al. (2008), Amuedo- Dorantes and De
la Rica (2008). Using several sources of data, these studies try to estimate the shock of
immigration on the wages of natives of Spain. Ortega and Gonzales (2010) study the labor
market effects of the large immigration wave in Spain between 2001 and 2006, exploiting
the large variation in the size of immigration flows across Spain’s regions. They find that
the relatively unskilled migration inflows did not affect the wages or employment rates of
unskilled workers in the receiving regions. Regions that received a large inflow of unskilled
immigrants increased the intensity of use of them, compared with other regions. Carrasco
et al. (2008) use the skill correlations approach introduced by Borjas (2003), find that
growth in the foreign-born share across skill cells is negatively correlated with growth
in employment rates and wages. Their conclusion is that there is no robust evidence of
negative labor market effects of immigration. Amuedo- Dorantes and De la Rica (2008)
show that immigration led Spain-born workers to shift occupations, toward less exposed,
more communication- intensive occupations.
There have been few investigation of productivity and immigration for Spain. Concretely,
we can find the research of Blasco and Carrizosa (2009)) who look at the effect of immi-
gration on firms activity using the Spanish Mercantile Registry of manufacturing firms for
the years 2001 to 2005. They analyse the effect of immigration flows on the growth and
the efficiency of firms in Spanish cities. They show that the increasing pressure caused by
immigrants had a positive effect on the evolution of wages and labour productivity, and a
negative effect on the job evolution on firms. Despite that, they concentrate their analysis
only on manufacturing firms and do not control for other factors that have an influence
on the workforce composition such as skills, occupation, immigration countries, etc. Kan-
gasniemi et al (2009) explore the economic consequences of immigration on productivity
performance at a sectoral level for Spain and the UK. They found that migration has had
3
very different implications for Spain and the UK, migrants being more productive than
natives in the UK but less productive than natives in Spain from 2000 to 2005. Lacuesta
et al. (2011) compute the measure of the labour quality of natives and immigrants, and
find that immigration has a slight negative composition effect on labour productivity in
Spain. Furthermore, Izquierdo et al. (2010) use a general equilibrium overlapping genera-
tions model to measure the aggregate effects of immigration on productivity in Spain, and
conclude that immigration has a negative impact on it. This could be explained by the
fact that immigrants are usually employed in labour intensive sectors with a low average
productivity.
However, most of these studies look at the labour productivity at an aggregate region level
and do not control for the endogeneity of immigrants. As we have told above, immigrants
are not distributed homogeneously across regions, and prefer to live where the employment
rate is high and where other similar immigrants live. This involves a source of endogeneity
when the immigration is taken into account in the estimation of labor productivity.
With this study, we added an empirical evidence at studies before, considering information
at individual and firm level, on labor productivity in Spain using two sources of data set:
SABI and Social Security Records (Muestra continua de vidas laborales (MCVL) from
2004 until 2008. In the SABI dataset we can find information across firms in Spain, while
the MCVL provides us with information across individuals. Both sources of data allow
us to analyse the effects of immigration on Spanish firms, taking into account also the
endogeneity of the localization of the immigration. This is the first study for Spain that
use the an instrument to correct for the erogeneity of immigrants.
Using data in a longitudinal way we estimate the relation of sectoral gross value added
(GVA) for each employee through a two stages least square (2SLS) model panel data,
controlling for the local share of immigrant population in each municipality. To measure
productivity at regional and sectoral levels, GVA is divided by the number of people
employed, which is also referred to as labour productivity. In addition, we relate this
output with wages across municipalities and sectors.
Our results find that labor productivity decreases across years while wages increase, im-
migration has a negative effect on the value added of Spanish firms. In conclusion, the
arrival of new immigrants has increased the labour force and firms have modified their
behavior in response to this new stock of workforce.
The study is divided into three sections. In the first section we offer a brief introduction
about the immigration in Spain and the data we have used in our research. In the second
4
one we show the estimation strategy and present our findings. The final section concludes
and discusses these results.
Immigration in Spain and Data description
Spain has achieved over six million foreign-born residents in these last ten years, that
correspond to 14% of the total population as we can see in Figure 1. Four million come
outside the European Union and 2.3 million (5.1%) are from another EU Member State
(Ine 2011). Of these, well over one million and a half come from Latin America (Ecuador,
Colombia, Bolivia, Argentina and Brazil), more 700,000 are Moroccan, while immigrants
from European Union are especially from Romania, United Kingdom, Germany, Italy and
Bulgaria. Most immigrants are concentrated in a few Spanish regions that absorb about
83.5 percent of the immigrant population. As we can observe in Figure 2 the immigration
vary a lot across municipality in each region, Barcelona and Madrid are the province that
more immigrants attracts in Spain.
To design our study, we use two sources of data: the SABI and the Social Security Records
(Muestra Continua de Vidas Laborales; hereafter MCVL).
The SABI dataset is the Spanish branch of the AMADEUS database. This database
contains accounts and useful information for over 1.2 million Spanish companies. The
database contains 27 indicators related to: firm characteristics (number of firms, entry, exit
and survival), employment (number of employees and hours worked), productivity (labour
productivity, total factor productivity) and other characteristics like export ratio and
concentration rates. In particular, we consider where firms are located, sector, number of
employees, labour cost for employee and the GVA from 2004 to 2008. We have eliminated
firms that report zero workers and negative or missing labour productivity. In total we
have more that 200,000 firms per year. We avoid to analyse the period after 2008 because it
is difficult to distinguish the effects of immigration from the effects of the strong economic
crisis after 2008.
From the MCVL we consider data from 2000 until to 2008. The data come from the registry
of the Social Security System (SSS) for active people in the labour market. This database
provides information about all the historical relationships of 4% of totaly individuals within
the Social Security System (in terms of work and unemployment benefits), and represents
more than 1 million people in the Social Security System in Spain. The MCVL started
in 2004, and workers are a random sample of those affiliated with the Social Security
5
System in the year when the survey was conducted and reproduces the labour history of
the affiliated people starting with their first job.
The MCVL is an appropriate database to study the labour market in Spain and, in fact, has
several advantages over the Labour Force Survey (LFS) and the Wage Structure Survey
(WSS), because it provides more exhaustive information on the labour trajectories of
workers. In addition, the MCVL has information regarding the type of contract, sector of
activity, qualification, earnings, date when entering or leaving the job market, part-time or
full-time status and firm size. Moreover, the database contains information on nationality,
country of birth, residence, date of birth, and level of education. The MCVL also gives
details about the establishment (location, number of workers and industry) in which a
worker is hired. By arranging the available items we may easily detect the labor force
composition, in particular, we may extract information about qualified and non-qualified
employees, like immigration, type of job, part-time or full time contract, and permanent
and public contract at municipality and sector level. We adopt a definition of ”qualified”
employee for any employee who is hired at the highest professional categories.
To build our sample we have merged the wave of 2010 with the wave from 2009 until 2005,
and since we know all the work history of workers we go back until 2000. Consider years
before to 2000 increase the risk of attrition, due that the database is not representative at
these years but only for the years where extraction is done.
We have deleted people that not report a labor relation with the SSS (3023 observations
deleted). We have kept people who report a wage in the month of May and, if the individual
reported more than one job, we have taken the greatest earn. We only consider people
from 15 to 65 years old out of a total of more than 300,000 individuals. From MCVL we
consider the average at municipality and sector levels of the following variables: monthly
wage, age, level of education (primary, secondary and tertiary), high, middle high, middle
and low skills, permanent contract, public service and fulltime contract. We consider
the sum of immigrants, taking into account the immigration from the European Union
(EU15) and from the Rest of the Countries at industry and municipality level. After that,
we merge this sample with the SABI sample at firm level by municipality and sector.
The municipalities account around 40,000 individuals and the sectors are regrouped in
the main specification(agriculture, industry, building...). In total we have more than 30
municipalities and 13 sectors for Madrid and Barcelona.
In Table 1 we report the summary statistics of the years considered in our sample. Real
labour productivity increased a little bit from 2004 to 2006 to decrease again later. Labour
6
productivity grew significantly less in the Spanish economy than in other OECD economies
in the period 1996-2007. In recent years, labour productivity growth has accelerated, but
this recovery is likely due to cyclical and temporary factors. This could be explained by
the fact that Spain has invested more on labour intensive sectors, such as construction or
tourism, where productivity is below the average. As we report in Figure 3, the labour
productivity across sectors is very low with not much difference among them, however the
service and industry sectors created more value added per unit of labour with respect to
the other sectors.
The economic theory holds that at the aggregate level the growth of real wages are deter-
mined by labor productivity growth. Typically it is assumed that the firm’s capital stock
is constant in the short run, such that the profit-maximising behaviour determines the
optimal level of production at which a marginal worker’s contribution to profit is equal to
his wage. If we look at the monthly real wage in Table 1 we can see how it increased while
productivity decreased across years. In addition, looking at Figure 4, the difference across
sectors and qualifications in Spanish wages are quite low and the wage has increased for all
qualifications and sectors. Furthermore, another evidence is added: the cost of employees
has increased a lot in Spain in this period, especially in sectors with low productivity such
as reported in Figure 5. This increase is in part due to the employment created in this pe-
riod (see Figure 6). Annual employment growth in Spain averaged 3.15 percentage points
from 1994 to 2007, with a productivity stagnation. Several studies have documented the
negative trade-off between employment and productivity growth (see Gordon, 2008). One
possible explanation for this negative relationship between productivity and employment
can be attributed to a positive shock in the labour force participation that Spain has
experienced in this period: immigration.
In the rest of Table 1 we present the summary of the rest of the variables considered for
the study. Industry, building and hotels, are the main sectors, half of individuals have
middle or low skills, while the age of worker is reduced across years due to the entry of
young people in the labor market. As we can see also 90% of the firms in Spain a very
small, this is another problem to face to increase the competitive and the productivity in
this country.
This is a first picture of labor productivity and immigration in Spain. Productivity de-
creases while the cost of labour force increase.
7
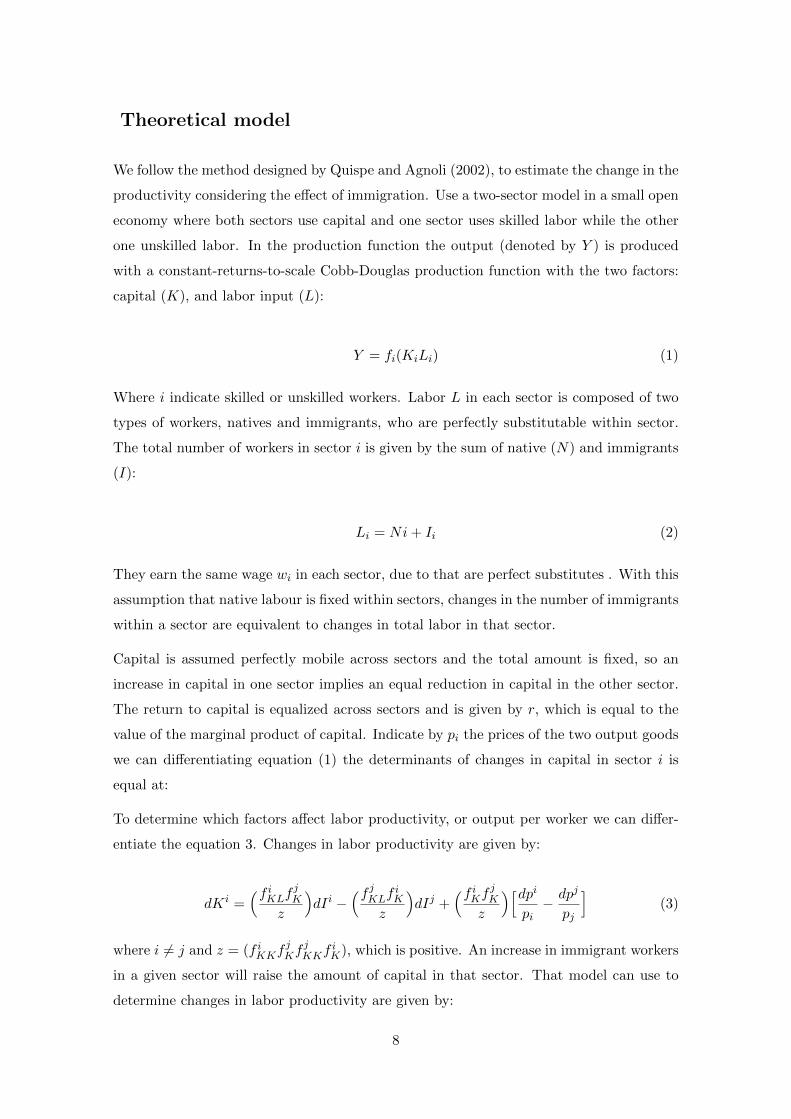
Theoretical model
We follow the method designed by Quispe and Agnoli (2002), to estimate the change in the
productivity considering the effect of immigration. Use a two-sector model in a small open
economy where both sectors use capital and one sector uses skilled labor while the other
one unskilled labor. In the production function the output (denoted by Y ) is produced
with a constant-returns-to-scale Cobb-Douglas production function with the two factors:
capital (K), and labor input (L):
Y = fi(KiLi) (1)
Where i indicate skilled or unskilled workers. Labor L in each sector is composed of two
types of workers, natives and immigrants, who are perfectly substitutable within sector.
The total number of workers in sector i is given by the sum of native (N) and immigrants
(I):
Li = Ni+ Ii (2)
They earn the same wage wi in each sector, due to that are perfect substitutes . With this
assumption that native labour is fixed within sectors, changes in the number of immigrants
within a sector are equivalent to changes in total labor in that sector.
Capital is assumed perfectly mobile across sectors and the total amount is fixed, so an
increase in capital in one sector implies an equal reduction in capital in the other sector.
The return to capital is equalized across sectors and is given by r, which is equal to the
value of the marginal product of capital. Indicate by pi the prices of the two output goods
we can differentiating equation (1) the determinants of changes in capital in sector i is
equal at:
To determine which factors affect labor productivity, or output per worker we can differ-
entiate the equation 3. Changes in labor productivity are given by:
dKi =(f iKLf
jK
z
)dIi −
(f jKLfiK
z
)dIj +
(f iKf jKz
)[dpipi− dpj
pj
](3)
where i 6= j and z = (f iKKfjKf
jKKf
iK), which is positive. An increase in immigrant workers
in a given sector will raise the amount of capital in that sector. That model can use to
determine changes in labor productivity are given by:
8

d(Y i
Li
)=
1
Li
[(f iK)2f iKz
(dpipi− dpj
pj
)+(f iL
(f iKL)f jKfiK
z
) YLidIi −
((f iK)2f jKL
z
)dIj]
(4)
The first term shows that an increase in the relative output price increase the productivity.
The second term instead indicates the effect that immigration inflows in a sector have on
productivity in that sector. The sign of the effect is ambiguous and depends on the rela-
tionship between output, labor, and capital. The last term gives the effect of immigration
inflows to sector j. An increases of these inflows reduce the labor productivity in sector
i. Changes in labor productivity in a sector depend by changes in relative prices and
by immigration inflows to each sector. However the model has some limitations such as
treating the number of natives within skill groups as fixed , see Quispe and Agnoli (2002)
for more details.
Empirical Methodology and Results
The focus of this paper is on the change of labour market productivity when a great inflow
of immigrants enter in the Spanish sectors. To simply the model we use a reduce form to
estimate it following the empirical strategy:
ln(Limjt) = Ximjtβ + lnImmNimjtλ+ ϕt + ϕi+ ϕj∗m (5)
This empirical strategy examines the impact caused by the inflow of immigration on the
labour productivity in Spain in a longitudinal way. Our analysis is the estimation of a
series of regression models that share the same left side variables but differ in the controls
variable that we have used. For our empirical analysis we consider the Gross value added
(GVA) divide by the number of workers. Gross value added (GVA) is the output minus
intermediate consumption. A common definition of productivity is a ratio of a volume
measure of output to a volume measure of input use (OECD, 2001). A volume measure
GVA is the preferred measure for output. GVA is preferable to GDP at the regional level
because it excludes taxes or subsidies on products that are difficult to attribute to local
units. To measure productivity at municipality and sectoral levels, GVA is divided by the
number of people employed, which is also referred to as labor productivity. Where L is
the the labor productivity of Spanish firm i in the municipality m andd sector j, in time
t. While X is a set of covariates such as age, size of firm , education, occupation. We
account for time dummies (ϕt) to control business cycle effect, firm fixed effects ϕi and
9
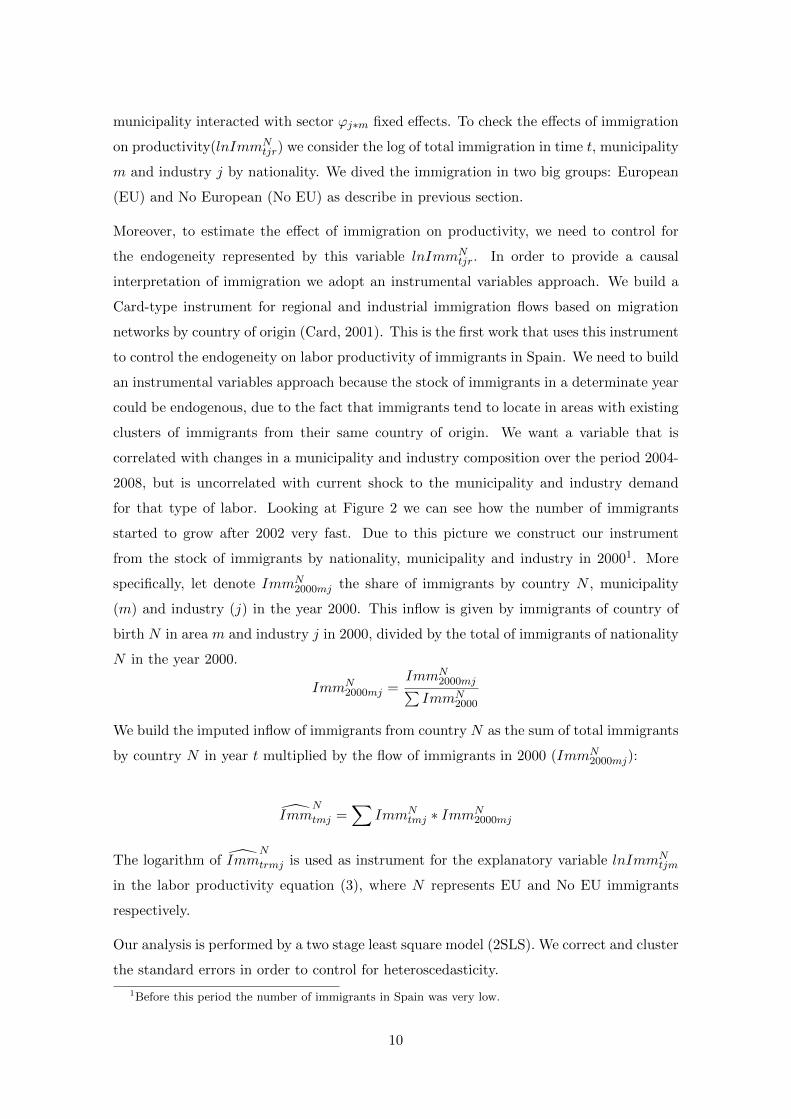
municipality interacted with sector ϕj∗m fixed effects. To check the effects of immigration
on productivity(lnImmNtjr) we consider the log of total immigration in time t, municipality
m and industry j by nationality. We dived the immigration in two big groups: European
(EU) and No European (No EU) as describe in previous section.
Moreover, to estimate the effect of immigration on productivity, we need to control for
the endogeneity represented by this variable lnImmNtjr. In order to provide a causal
interpretation of immigration we adopt an instrumental variables approach. We build a
Card-type instrument for regional and industrial immigration flows based on migration
networks by country of origin (Card, 2001). This is the first work that uses this instrument
to control the endogeneity on labor productivity of immigrants in Spain. We need to build
an instrumental variables approach because the stock of immigrants in a determinate year
could be endogenous, due to the fact that immigrants tend to locate in areas with existing
clusters of immigrants from their same country of origin. We want a variable that is
correlated with changes in a municipality and industry composition over the period 2004-
2008, but is uncorrelated with current shock to the municipality and industry demand
for that type of labor. Looking at Figure 2 we can see how the number of immigrants
started to grow after 2002 very fast. Due to this picture we construct our instrument
from the stock of immigrants by nationality, municipality and industry in 20001. More
specifically, let denote ImmN2000mj the share of immigrants by country N , municipality
(m) and industry (j) in the year 2000. This inflow is given by immigrants of country of
birth N in area m and industry j in 2000, divided by the total of immigrants of nationality
N in the year 2000.
ImmN2000mj =
ImmN2000mj∑
ImmN2000
We build the imputed inflow of immigrants from country N as the sum of total immigrants
by country N in year t multiplied by the flow of immigrants in 2000 (ImmN2000mj):
ImmN
tmj =∑
ImmNtmj ∗ ImmN
2000mj
The logarithm of ImmN
trmj is used as instrument for the explanatory variable lnImmNtjm
in the labor productivity equation (3), where N represents EU and No EU immigrants
respectively.
Our analysis is performed by a two stage least square model (2SLS). We correct and cluster
the standard errors in order to control for heteroscedasticity.
1Before this period the number of immigrants in Spain was very low.
10
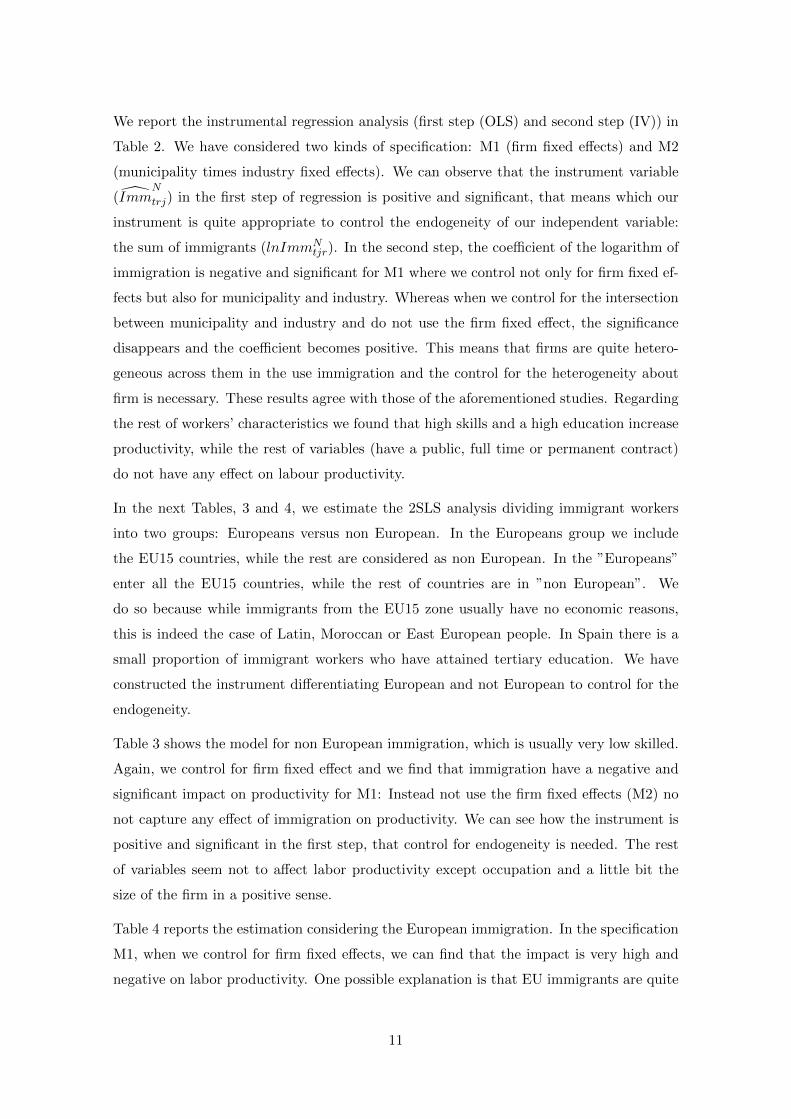
We report the instrumental regression analysis (first step (OLS) and second step (IV)) in
Table 2. We have considered two kinds of specification: M1 (firm fixed effects) and M2
(municipality times industry fixed effects). We can observe that the instrument variable
(ImmN
trj) in the first step of regression is positive and significant, that means which our
instrument is quite appropriate to control the endogeneity of our independent variable:
the sum of immigrants (lnImmNtjr). In the second step, the coefficient of the logarithm of
immigration is negative and significant for M1 where we control not only for firm fixed ef-
fects but also for municipality and industry. Whereas when we control for the intersection
between municipality and industry and do not use the firm fixed effect, the significance
disappears and the coefficient becomes positive. This means that firms are quite hetero-
geneous across them in the use immigration and the control for the heterogeneity about
firm is necessary. These results agree with those of the aforementioned studies. Regarding
the rest of workers’ characteristics we found that high skills and a high education increase
productivity, while the rest of variables (have a public, full time or permanent contract)
do not have any effect on labour productivity.
In the next Tables, 3 and 4, we estimate the 2SLS analysis dividing immigrant workers
into two groups: Europeans versus non European. In the Europeans group we include
the EU15 countries, while the rest are considered as non European. In the ”Europeans”
enter all the EU15 countries, while the rest of countries are in ”non European”. We
do so because while immigrants from the EU15 zone usually have no economic reasons,
this is indeed the case of Latin, Moroccan or East European people. In Spain there is a
small proportion of immigrant workers who have attained tertiary education. We have
constructed the instrument differentiating European and not European to control for the
endogeneity.
Table 3 shows the model for non European immigration, which is usually very low skilled.
Again, we control for firm fixed effect and we find that immigration have a negative and
significant impact on productivity for M1: Instead not use the firm fixed effects (M2) no
not capture any effect of immigration on productivity. We can see how the instrument is
positive and significant in the first step, that control for endogeneity is needed. The rest
of variables seem not to affect labor productivity except occupation and a little bit the
size of the firm in a positive sense.
Table 4 reports the estimation considering the European immigration. In the specification
M1, when we control for firm fixed effects, we can find that the impact is very high and
negative on labor productivity. One possible explanation is that EU immigrants are quite
11
high skilled but they work in occupation low than their productivity level. This is also
found by Lacuesta et all (2011), the quality of workers and their occupation seems essential
for increasing labor productivity.
Conclusion
This paper has brought a new evidence about the immigration on the Spanish labour
market. In particular it has attempted to broaden the understanding the role of immi-
grants and other variable on firms output. The results show that migration is playing an
increasingly important role in the economic performance of Spain, but, at the same time,
it explains a great part of the poor evolution of labor productivity. Using a new data
source to the most frequently used, we find that immigration has a negative impact on
labour productivity. The type of immigration (EU versus no EU) into Spain are not the
question due to that there is no difference across these two groups on labor productivity.
What is really matter is the way in which firms employ these workers. Spain needs to
regain its lost productivity in recent years compared to other European countries such
as France or Germany. Immigration has been the main contributor to the growth of the
labour force during the last decade in Spain, and it can alleviate the consequences of aging
and shortages in some types of job, although they have a negative effect on productivity
and growth. However, the results show that firms are quite heterogeneous among them in
the use of workers, which is also reflected in labor productivity.
Increasing innovation, restoring the industry sector, improving education and skills are
duties that Spain needs to implement in order to maintain a rapid overall productivity
growth.
12
References
Alonso-Borrego, C. (2010). Firm behavior, market deregulation and productivity in Spain.
Documentos de trabajo n.o 1035. Banco de Espana-Eurosystem.
Amuedo-Dorantes, C. and S. De La Rica (2008). Labour Market Assimilation of Recent
Immigrants in Spain. British Journal of Industrial Relations 45(2), 25784.
Bentolila, S., J.J. Dolado and J.F. Jimeno (2009). The Spanish productivity puzzle:
immigration and other factors. Presentation prepared for the LSE-CIEES Workshop on
The Spanish Economy after the Crisis: Towards a New Growth Model, Madrid, 24-26
June 2009.
Mercedes Carrizosa and Agusti Blasco, (2009). Immigration and Firm Performance: a
city level approach. Investigaciones Regionales Monografico
Borjas, G.J. (1987): Immigrants, Minorities, and Labor Market Competition, Industrial
and Labor Relations Review, 40: 382-392.
Borjas, G.J. (1994): The Economics of Immigration, Journal of Economic Literature, 32:
1667-1717.
Borjas, G.J. (2003): The Labor Demand Curve Is Downward Sloping: Reexamining the
Impact of Immigration on the Labor Market, Quarterly Journal of Economics, 118: 1335-
1374.
Borjas, G.J. (2006): The impact of immigration on the labor market, Harvard University,
mimeo.
Cabral, L. and Mata, J. (2003): On the Evolution of the Firm Size Distribution: Facts
and Theory, American Economic Review, 93(4): 1075- 1090.
Calvo, J.L. (2006): Testing Gibrats Law for Small, Young and Innovating Firms, Small
Business Economics, 26: 117-123.
Card, D. (2001): How Immigration Affects U.S. Cities, Centre for Research and Analisis
of Migration, CDP No. 11/07.
13
Carrasco, R., Jimeno, J.F. and C. Ortega, 2007: El efecto de la inmigracion sobre las
condiciones de los trabajadores autoctonos en el mercado de trabajo. Evidencia para
Espana in Dolado, J.J. and P. Vazquez, eds.
Celentani, M., Garcıa-Posada, M. and F. Gomez (2012). The Spanish Businnes Bankruptcy
Puzzle. Mimeo.
Ciccone, A. and Hall, R.E. (1996): Productivity and the Density of Economic Activity”,
American Economic Review, 86, 54-70.
Corry, D. Valero, A. and J. Van Reenen (2011). UK Economic Performance Since 1997:
Growth, Productivity and Jobs. CEP Special Report. Paper No’ CEPSP24. The London
School of Economics.
Dolado, J. J., Felgueroso, F. and Jimeno, J. F. (1999). Los problemas del mercado de
trabajo juvenil en Espana: empleo, formacion y salarios mınimos. Ekonomiaz 43. 13657.
Dolado, J.J. and R. M. Stucchi (2008). Do Temporary Contracts Affect TFP? Evidence
from Spanish Manufacturing Firms. IZA Discussion Papers 3832, Institute for the Study
of Labour (IZA).
Duranton, G. and Puga, D. (2001): Nursery cities: Urban diversity, process innovation
and the life cycle of products, American Economic Review, 91(5): 14541477.
Duranton, G. and Storper, M. (2006): Agglomeration and growth: a dialogue between
economists and geographers, Journal of Economic Geography, 6: 1-7. 32
Dustmann, C. and Glitz, A. (2005): The impact of immigration on the British labour
market, Economic Journal, 115(507): 324-341.
Fernandez, C. and O. Ortega (2008). Labour Market Assimilation of Immigrants in Spain:
Employment at the Expense of Bad Job-Matches? Spanish Economic Review 10, 83107.
Gonzalez, L. and F. Ortega. Immigration and Housing Booms: Evidence from Spain.
CReAM Discussion Paper Series 0919, Department of Economics, University College Lon-
don, 2009.
14

Gordon, R. J. (2004). Why was Europe Left at the Station When America’s Productivity
Locomotive Departed? NBER Working Paper No. W10661.
Grossman, S. (1982): A Transactions Based Model of the Monetary Transmission Mech-
anism: Part II, NBER Working Paper No. 974.
Hoogstra, G.J. and van Dijk, J. (2004): Explaining Firm Employment Growth: Does
Location Matter?, Small Business Economics, 22: 179-192. 33
Jovanovic, B. (1982): Selection and Evolution of Industry, Econometrica, 50: 649-670.
Izquierdo M., Jimeno, J. and J. Rojas (2010). On the aggregate effects of immigration in
Spain. SERIEs, Journal of the Spanish Economic Association, 1(4). 409-432.
Kangesniemi et al. (2007) The Economic Impact of Migration: Productivity Analysis
for Spain and the UK, paper presented at EU KLEMS Conference, Brussels. National
Institute of Economic and Social Research, UK and University of Valencia, Spain
Lacuesta, A., Puente, S. and P. Cuadrado (2009). Una aproximacion a la medicion de la
calidad del factor trabajo en Espana. Boletın Economico 1. Banco de Espana.
Lacuesta, A., Puente, S. and P. Cuadrado (2011). Omitted variables in the measurement
of a labour quality index: the case of Spain. Review of Income and Wealth 57 (1). March.
OECD (2001). Productivity growth in ICT-producing and ICT-using industries – a source
of growth differentials in the OECD? Working Party on Statistics (Paris, OECD, 27-28
February and 1 March 2001)
OECD (2003). ICT and economic growth. Evidence from OECD countries, industries and
firms. OECD Publishing. Paris.
OECD (2010), OECD Economic Surveys: Spain 2010, OECD Publishing, Paris.
QUISPE-AGNOLI, M. and ZAVODNY, M. (2002): The Effect of Immigration on Output
Mix, Capital, and Productivity Federal Reserve Bank of Atlanta Economic Review, First
Quarter
15
Ottaviano, G.I.P and Peri, G. (2005): Cities and cultures, Journal of Urban Economics,
58: 304-337.
Ottaviano, G.I.P. and Peri, G. (2006): The economic value of cultural diversity: evidence
from US cities, Journal of Economic Geography, 6: 9-44.
Peri, P. and Sparber, Ch. (2008): Task Specialization, Immigration, and Wages, Centre
for Research and Analysis of Migration, Discussion Paper No. 02/08
Sanroma, E., Ramos, R. and H. Simon (2008). The Portability of Human Capital and
Immigrant Assimilation: Evidence for Spain. IZA Discussion Paper 3649.
Rajan, R. and L. Zingales (1998). Power in a theory of the firm. The Quarterly Journal
of Economics 113(2). 387-432.
16

Figure 1: Immigration Distribution across years
Source: Ine 2010
Figure 2: Immigration Distribution across Spanish cities
Source: Ine 2011
17

Figure 3: Real Monthly Wage average across Sector by year
Source: MCVL 2010
18
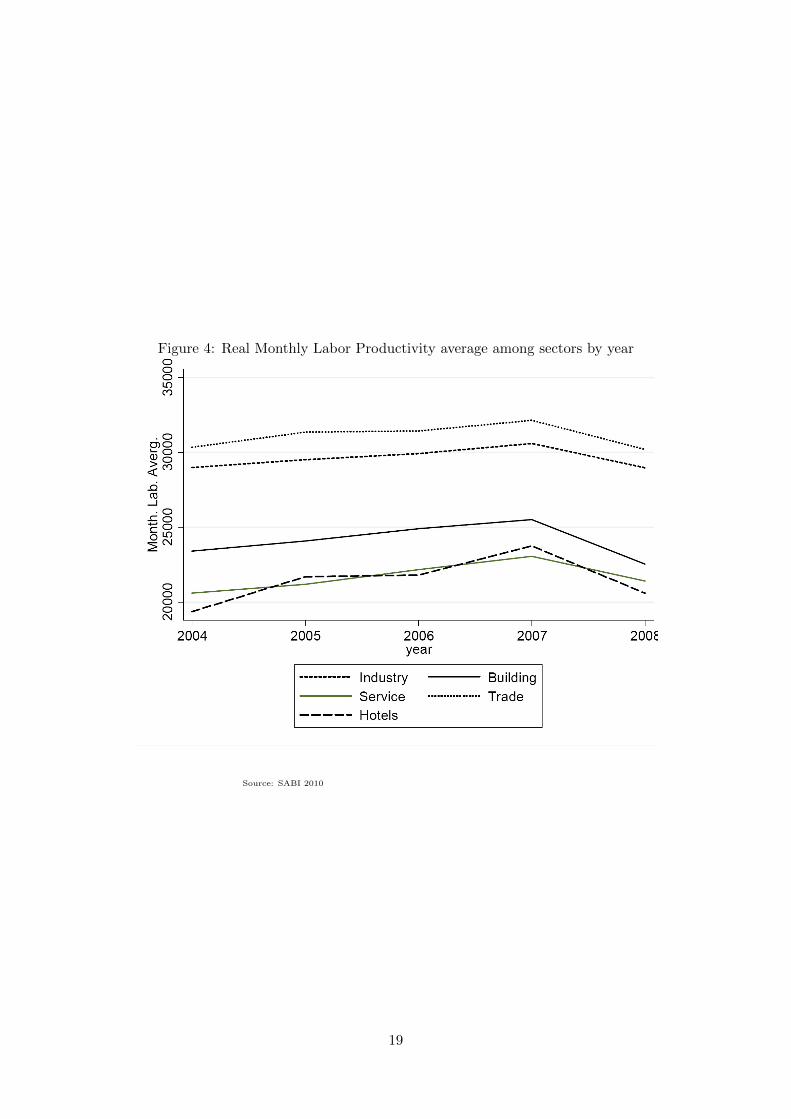
Figure 4: Real Monthly Labor Productivity average among sectors by year
Source: SABI 2010
19
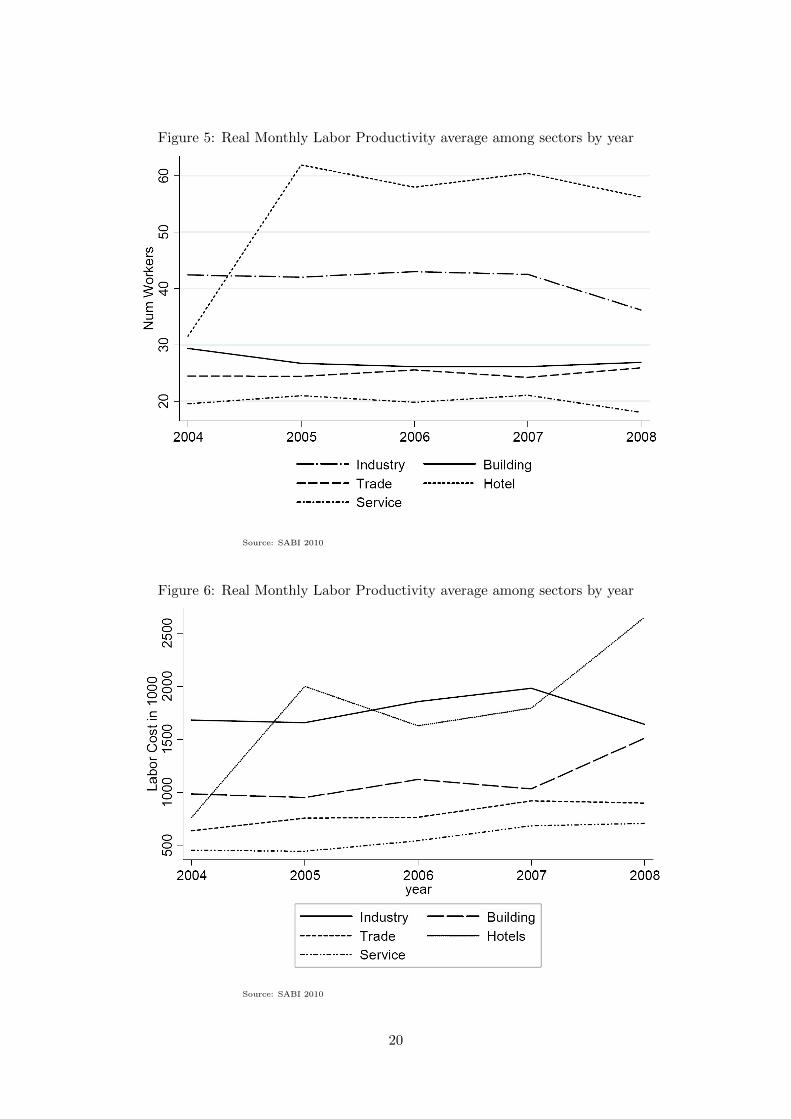
Figure 5: Real Monthly Labor Productivity average among sectors by year
Source: SABI 2010
Figure 6: Real Monthly Labor Productivity average among sectors by year
Source: SABI 2010
20
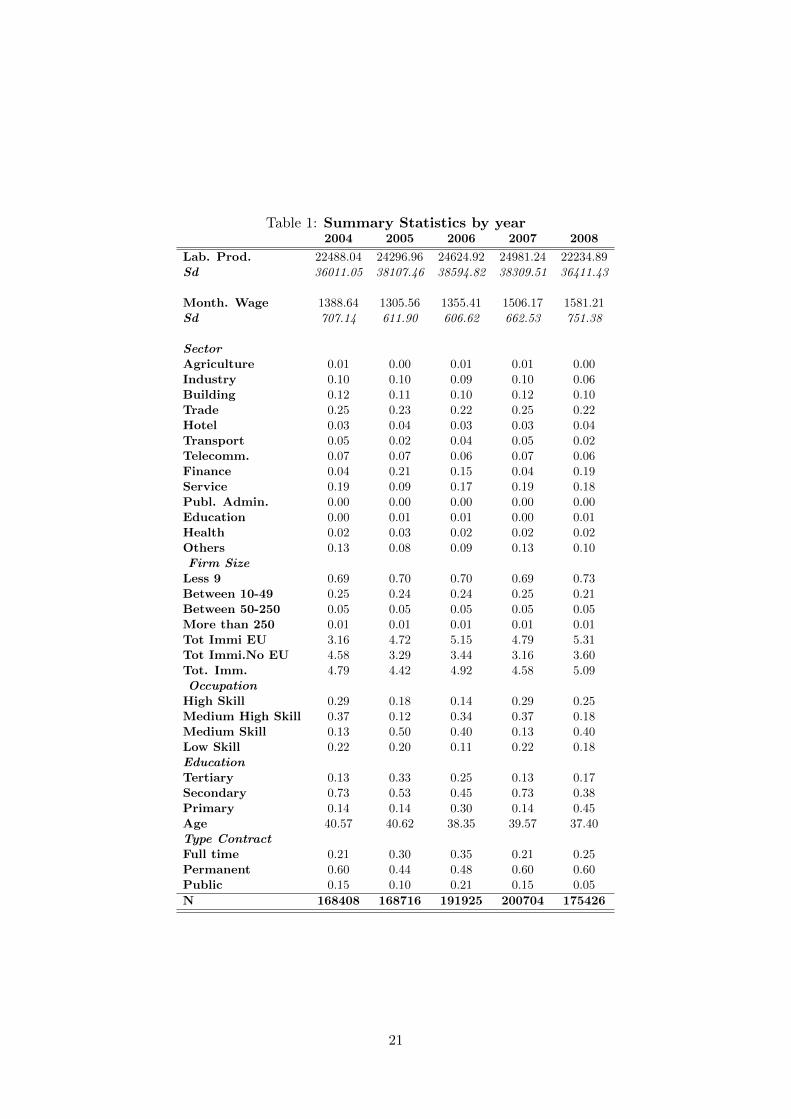
Table 1: Summary Statistics by year2004 2005 2006 2007 2008
Lab. Prod. 22488.04 24296.96 24624.92 24981.24 22234.89Sd 36011.05 38107.46 38594.82 38309.51 36411.43
Month. Wage 1388.64 1305.56 1355.41 1506.17 1581.21Sd 707.14 611.90 606.62 662.53 751.38
SectorAgriculture 0.01 0.00 0.01 0.01 0.00Industry 0.10 0.10 0.09 0.10 0.06Building 0.12 0.11 0.10 0.12 0.10Trade 0.25 0.23 0.22 0.25 0.22Hotel 0.03 0.04 0.03 0.03 0.04Transport 0.05 0.02 0.04 0.05 0.02Telecomm. 0.07 0.07 0.06 0.07 0.06Finance 0.04 0.21 0.15 0.04 0.19Service 0.19 0.09 0.17 0.19 0.18Publ. Admin. 0.00 0.00 0.00 0.00 0.00Education 0.00 0.01 0.01 0.00 0.01Health 0.02 0.03 0.02 0.02 0.02Others 0.13 0.08 0.09 0.13 0.10Firm SizeLess 9 0.69 0.70 0.70 0.69 0.73Between 10-49 0.25 0.24 0.24 0.25 0.21Between 50-250 0.05 0.05 0.05 0.05 0.05More than 250 0.01 0.01 0.01 0.01 0.01Tot Immi EU 3.16 4.72 5.15 4.79 5.31Tot Immi.No EU 4.58 3.29 3.44 3.16 3.60Tot. Imm. 4.79 4.42 4.92 4.58 5.09OccupationHigh Skill 0.29 0.18 0.14 0.29 0.25Medium High Skill 0.37 0.12 0.34 0.37 0.18Medium Skill 0.13 0.50 0.40 0.13 0.40Low Skill 0.22 0.20 0.11 0.22 0.18EducationTertiary 0.13 0.33 0.25 0.13 0.17Secondary 0.73 0.53 0.45 0.73 0.38Primary 0.14 0.14 0.30 0.14 0.45Age 40.57 40.62 38.35 39.57 37.40Type ContractFull time 0.21 0.30 0.35 0.21 0.25Permanent 0.60 0.44 0.48 0.60 0.60Public 0.15 0.10 0.21 0.15 0.05
N 168408 168716 191925 200704 175426
21
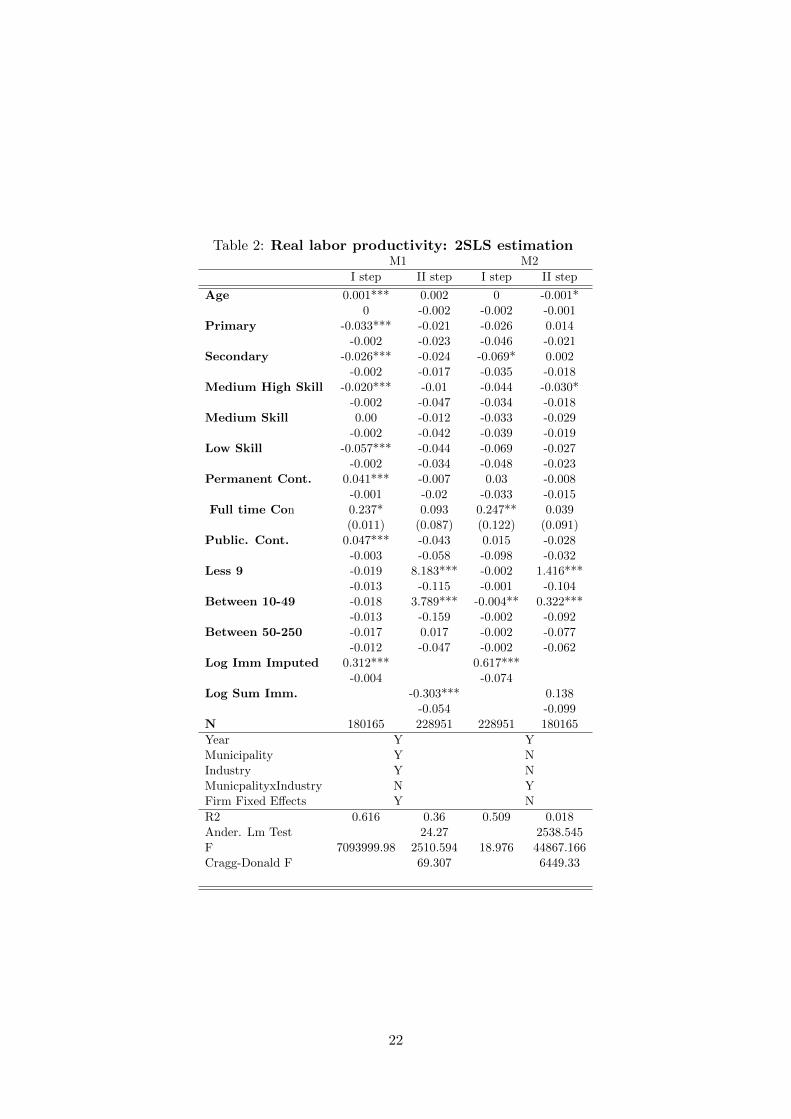
Table 2: Real labor productivity: 2SLS estimationM1 M2
I step II step I step II step
Age 0.001*** 0.002 0 -0.001*0 -0.002 -0.002 -0.001
Primary -0.033*** -0.021 -0.026 0.014-0.002 -0.023 -0.046 -0.021
Secondary -0.026*** -0.024 -0.069* 0.002-0.002 -0.017 -0.035 -0.018
Medium High Skill -0.020*** -0.01 -0.044 -0.030*-0.002 -0.047 -0.034 -0.018
Medium Skill 0.00 -0.012 -0.033 -0.029-0.002 -0.042 -0.039 -0.019
Low Skill -0.057*** -0.044 -0.069 -0.027-0.002 -0.034 -0.048 -0.023
Permanent Cont. 0.041*** -0.007 0.03 -0.008-0.001 -0.02 -0.033 -0.015
Full time Con 0.237* 0.093 0.247** 0.039(0.011) (0.087) (0.122) (0.091)
Public. Cont. 0.047*** -0.043 0.015 -0.028-0.003 -0.058 -0.098 -0.032
Less 9 -0.019 8.183*** -0.002 1.416***-0.013 -0.115 -0.001 -0.104
Between 10-49 -0.018 3.789*** -0.004** 0.322***-0.013 -0.159 -0.002 -0.092
Between 50-250 -0.017 0.017 -0.002 -0.077-0.012 -0.047 -0.002 -0.062
Log Imm Imputed 0.312*** 0.617***-0.004 -0.074
Log Sum Imm. -0.303*** 0.138-0.054 -0.099
N 180165 228951 228951 180165
Year Y YMunicipality Y NIndustry Y NMunicpalityxIndustry N YFirm Fixed Effects Y N
R2 0.616 0.36 0.509 0.018Ander. Lm Test 24.27 2538.545F 7093999.98 2510.594 18.976 44867.166Cragg-Donald F 69.307 6449.33
22
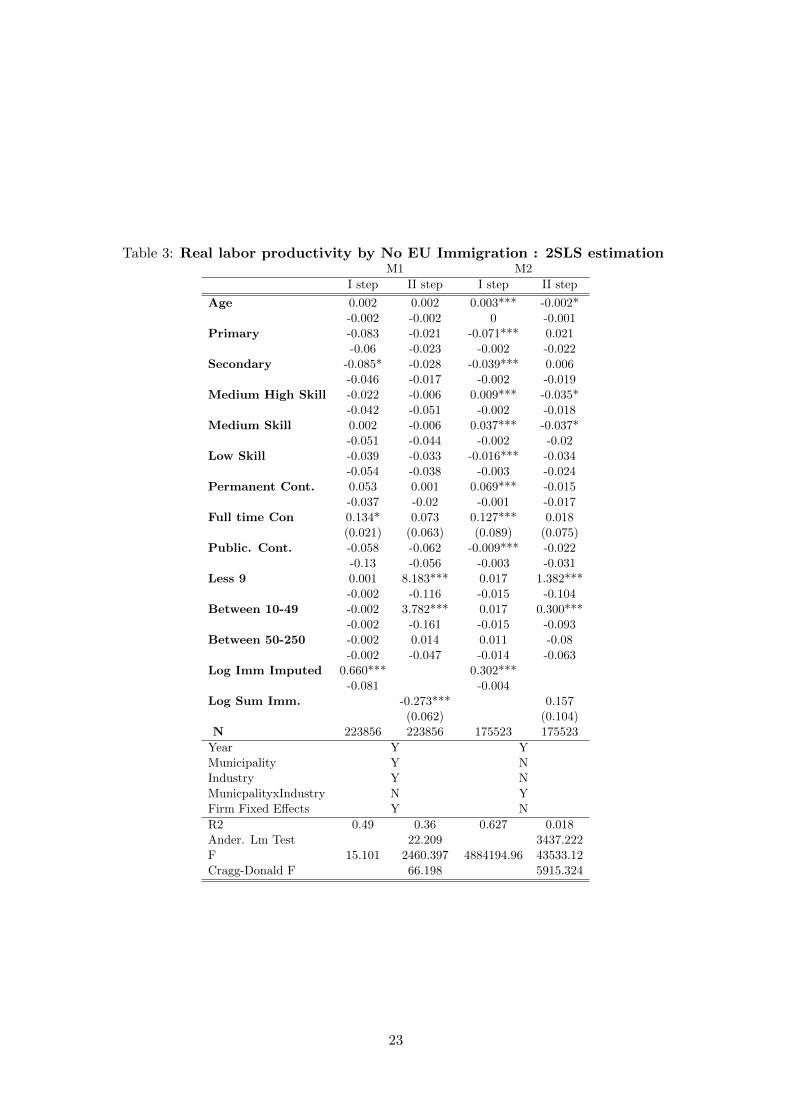
Table 3: Real labor productivity by No EU Immigration : 2SLS estimationM1 M2
I step II step I step II step
Age 0.002 0.002 0.003*** -0.002*-0.002 -0.002 0 -0.001
Primary -0.083 -0.021 -0.071*** 0.021-0.06 -0.023 -0.002 -0.022
Secondary -0.085* -0.028 -0.039*** 0.006-0.046 -0.017 -0.002 -0.019
Medium High Skill -0.022 -0.006 0.009*** -0.035*-0.042 -0.051 -0.002 -0.018
Medium Skill 0.002 -0.006 0.037*** -0.037*-0.051 -0.044 -0.002 -0.02
Low Skill -0.039 -0.033 -0.016*** -0.034-0.054 -0.038 -0.003 -0.024
Permanent Cont. 0.053 0.001 0.069*** -0.015-0.037 -0.02 -0.001 -0.017
Full time Con 0.134* 0.073 0.127*** 0.018(0.021) (0.063) (0.089) (0.075)
Public. Cont. -0.058 -0.062 -0.009*** -0.022-0.13 -0.056 -0.003 -0.031
Less 9 0.001 8.183*** 0.017 1.382***-0.002 -0.116 -0.015 -0.104
Between 10-49 -0.002 3.782*** 0.017 0.300***-0.002 -0.161 -0.015 -0.093
Between 50-250 -0.002 0.014 0.011 -0.08-0.002 -0.047 -0.014 -0.063
Log Imm Imputed 0.660*** 0.302***-0.081 -0.004
Log Sum Imm. -0.273*** 0.157(0.062) (0.104)
N 223856 223856 175523 175523
Year Y YMunicipality Y NIndustry Y NMunicpalityxIndustry N YFirm Fixed Effects Y N
R2 0.49 0.36 0.627 0.018Ander. Lm Test 22.209 3437.222F 15.101 2460.397 4884194.96 43533.12Cragg-Donald F 66.198 5915.324
23

Table 4: Real labor market probability by EU Immigration : 2SLS estimationM1 M2
I step II step I step II step
Age -0.001 0.001 -0.001 0-0.002 -0.002 -0.002 -0.002
Primary 0.018 -0.016 0.018 0.01-0.053 -0.04 -0.053 -0.024
Secondary 0.034 -0.019 0.034 -0.026-0.048 -0.033 -0.048 -0.044
Medium High Skill 0 -0.035 0 -0.027-0.037 -0.047 -0.037 -0.028
Medium Skill -0.011 -0.048 -0.011 -0.011-0.034 -0.05 -0.034 -0.04
Low Skill -0.061 -0.090** -0.061 0.035-0.039 -0.043 -0.039 -0.125
Permanent Cont. 0 -0.015 0 0.011-0.025 -0.028 -0.025 -0.017
Full time Con 0.154 0.023 0.215* 0.085(0.071) (0.043) (0.049) (0.035)
Public. Cont. 0.005 -0.064 0.005 -0.011-0.038 -0.085 -0.038 -0.034
Less 9 -0.003* 8.183*** -0.003* 1.424***-0.002 -0.119 -0.002 -0.126
Between 10-49 -0.003** 3.748*** -0.003** 0.316***-0.002 -0.165 -0.002 -0.113
Between 50-250 -0.003* 0.005 -0.003* -0.064-0.002 -0.046 -0.002 -0.083
Log Imm Imputed 0.847*** 0.847***-0.105 -0.105
Log Sum Imm. -0.778*** 0.73-0.15 -1.346
N 212652 212652 212652 165549
Year Y YMunicipality Y NIndustry Y NMunicpalityxIndustry N YFirm Fixed Effects Y N
R2 0.318 0.362 0.318 0.015Ander. Lm Test 18.644 73.95F 16.684 3354.43 16.684 41623.01Cragg-Donald F 66.198 5915.324
24