Lesson 5 physiological and psychological charactertistics of responses to stress

International Journal of
Environmental Research
and Public Health
Article
Immediate Psychological Responses and AssociatedFactors during the Initial Stage of the 2019Coronavirus Disease (COVID-19) Epidemic amongthe General Population in China
Cuiyan Wang 1 , Riyu Pan 1, Xiaoyang Wan 1, Yilin Tan 1, Linkang Xu 1, Cyrus S. Ho 2,3 andRoger C. Ho 1,3,4,*
1 Institute of Cognitive Neuroscience, Faculty of Education, Huaibei Normal University,Huaibei 235000, China; [email protected] (C.W.); [email protected] (R.P.); [email protected] (X.W.);[email protected] (Y.T.); [email protected] (L.X.)
2 Department of Psychological Medicine, National University Health System, Kent Ridge 119228, Singapore;[email protected]
3 Department of Psychological Medicine, Yong Loo Lin School of Medicine, National University of Singapore,Kent Ridge 119228, Singapore
4 Institute of Health Innovation and Technology (iHealthtech), National University of Singapore,Kent Ridge 119077, Singapore
* Correspondence: [email protected]
Received: 14 February 2020; Accepted: 3 March 2020; Published: 6 March 2020�����������������
Abstract: Background: The 2019 coronavirus disease (COVID-19) epidemic is a public health emergencyof international concern and poses a challenge to psychological resilience. Research data are neededto develop evidence-driven strategies to reduce adverse psychological impacts and psychiatricsymptoms during the epidemic. The aim of this study was to survey the general public in Chinato better understand their levels of psychological impact, anxiety, depression, and stress during theinitial stage of the COVID-19 outbreak. The data will be used for future reference. Methods: From31 January to 2 February 2020, we conducted an online survey using snowball sampling techniques.The online survey collected information on demographic data, physical symptoms in the past 14 days,contact history with COVID-19, knowledge and concerns about COVID-19, precautionary measuresagainst COVID-19, and additional information required with respect to COVID-19. Psychologicalimpact was assessed by the Impact of Event Scale-Revised (IES-R), and mental health status wasassessed by the Depression, Anxiety and Stress Scale (DASS-21). Results: This study included 1210respondents from 194 cities in China. In total, 53.8% of respondents rated the psychological impact ofthe outbreak as moderate or severe; 16.5% reported moderate to severe depressive symptoms; 28.8%reported moderate to severe anxiety symptoms; and 8.1% reported moderate to severe stress levels.Most respondents spent 20–24 h per day at home (84.7%); were worried about their family memberscontracting COVID-19 (75.2%); and were satisfied with the amount of health information available(75.1%). Female gender, student status, specific physical symptoms (e.g., myalgia, dizziness, coryza),and poor self-rated health status were significantly associated with a greater psychological impact ofthe outbreak and higher levels of stress, anxiety, and depression (p < 0.05). Specific up-to-date andaccurate health information (e.g., treatment, local outbreak situation) and particular precautionarymeasures (e.g., hand hygiene, wearing a mask) were associated with a lower psychological impactof the outbreak and lower levels of stress, anxiety, and depression (p < 0.05). Conclusions: Duringthe initial phase of the COVID-19 outbreak in China, more than half of the respondents rated thepsychological impact as moderate-to-severe, and about one-third reported moderate-to-severe anxiety.Our findings identify factors associated with a lower level of psychological impact and better mentalhealth status that can be used to formulate psychological interventions to improve the mental healthof vulnerable groups during the COVID-19 epidemic.
Int. J. Environ. Res. Public Health 2020, 17, 1729; doi:10.3390/ijerph17051729 www.mdpi.com/journal/ijerph
Int. J. Environ. Res. Public Health 2020, 17, 1729 2 of 25
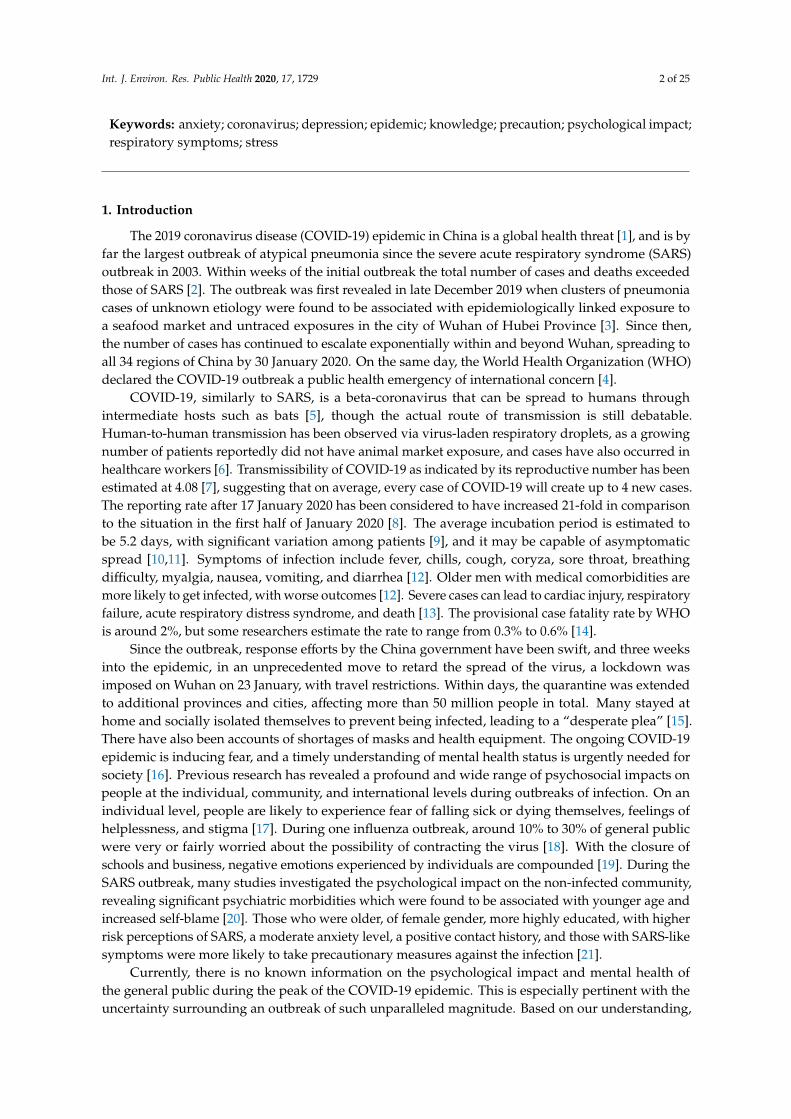
Keywords: anxiety; coronavirus; depression; epidemic; knowledge; precaution; psychological impact;respiratory symptoms; stress
1. Introduction
The 2019 coronavirus disease (COVID-19) epidemic in China is a global health threat [1], and is byfar the largest outbreak of atypical pneumonia since the severe acute respiratory syndrome (SARS)outbreak in 2003. Within weeks of the initial outbreak the total number of cases and deaths exceededthose of SARS [2]. The outbreak was first revealed in late December 2019 when clusters of pneumoniacases of unknown etiology were found to be associated with epidemiologically linked exposure toa seafood market and untraced exposures in the city of Wuhan of Hubei Province [3]. Since then,the number of cases has continued to escalate exponentially within and beyond Wuhan, spreading toall 34 regions of China by 30 January 2020. On the same day, the World Health Organization (WHO)declared the COVID-19 outbreak a public health emergency of international concern [4].
COVID-19, similarly to SARS, is a beta-coronavirus that can be spread to humans throughintermediate hosts such as bats [5], though the actual route of transmission is still debatable.Human-to-human transmission has been observed via virus-laden respiratory droplets, as a growingnumber of patients reportedly did not have animal market exposure, and cases have also occurred inhealthcare workers [6]. Transmissibility of COVID-19 as indicated by its reproductive number has beenestimated at 4.08 [7], suggesting that on average, every case of COVID-19 will create up to 4 new cases.The reporting rate after 17 January 2020 has been considered to have increased 21-fold in comparisonto the situation in the first half of January 2020 [8]. The average incubation period is estimated tobe 5.2 days, with significant variation among patients [9], and it may be capable of asymptomaticspread [10,11]. Symptoms of infection include fever, chills, cough, coryza, sore throat, breathingdifficulty, myalgia, nausea, vomiting, and diarrhea [12]. Older men with medical comorbidities aremore likely to get infected, with worse outcomes [12]. Severe cases can lead to cardiac injury, respiratoryfailure, acute respiratory distress syndrome, and death [13]. The provisional case fatality rate by WHOis around 2%, but some researchers estimate the rate to range from 0.3% to 0.6% [14].
Since the outbreak, response efforts by the China government have been swift, and three weeksinto the epidemic, in an unprecedented move to retard the spread of the virus, a lockdown wasimposed on Wuhan on 23 January, with travel restrictions. Within days, the quarantine was extendedto additional provinces and cities, affecting more than 50 million people in total. Many stayed athome and socially isolated themselves to prevent being infected, leading to a “desperate plea” [15].There have also been accounts of shortages of masks and health equipment. The ongoing COVID-19epidemic is inducing fear, and a timely understanding of mental health status is urgently needed forsociety [16]. Previous research has revealed a profound and wide range of psychosocial impacts onpeople at the individual, community, and international levels during outbreaks of infection. On anindividual level, people are likely to experience fear of falling sick or dying themselves, feelings ofhelplessness, and stigma [17]. During one influenza outbreak, around 10% to 30% of general publicwere very or fairly worried about the possibility of contracting the virus [18]. With the closure ofschools and business, negative emotions experienced by individuals are compounded [19]. During theSARS outbreak, many studies investigated the psychological impact on the non-infected community,revealing significant psychiatric morbidities which were found to be associated with younger age andincreased self-blame [20]. Those who were older, of female gender, more highly educated, with higherrisk perceptions of SARS, a moderate anxiety level, a positive contact history, and those with SARS-likesymptoms were more likely to take precautionary measures against the infection [21].
Currently, there is no known information on the psychological impact and mental health ofthe general public during the peak of the COVID-19 epidemic. This is especially pertinent with theuncertainty surrounding an outbreak of such unparalleled magnitude. Based on our understanding,

Int. J. Environ. Res. Public Health 2020, 17, 1729 3 of 25
most of the research related to this outbreak focuses on identifying the epidemiology and clinicalcharacteristics of infected patients [6,12], the genomic characterization of the virus [22], and challengesfor global health governance [23]. However, there are no research articles examining the psychologicalimpact on COVID-19 on the general population in China.
Therefore, this present study represents the first psychological impact and mental health surveyconducted in the general population in China within the first two weeks of the COVID-19 outbreak.This study aims to establish the prevalence of psychiatric symptoms and identify risk and protectivefactors contributing to psychological stress. This may assist government agencies and healthcareprofessionals in safeguarding the psychological wellbeing of the community in the face of COVID-19outbreak expansion in China and different parts of the world.
2. Methods
2.1. Setting and Participants
We adopted a cross-sectional survey design to assess the public’s immediate psychologicalresponse during the epidemic of COVID-19 by using an anonymous online questionnaire. A snowballsampling strategy, focused on recruiting the general public living in mainland China during theepidemic of COVID-19, was utilized. The online survey was first disseminated to university studentsand they were encouraged to pass it on to others.
2.2. Procedure
As the Chinese Government recommended the public to minimize face-to-face interaction andisolate themselves at home, potential respondents were electronically invited by existing studyrespondents. They completed the questionnaires in Chinese through an online survey platform(‘SurveyStar’, Changsha Ranxing Science and Technology, Shanghai, China). Expedited ethicsapproval was obtained from the Institutional Review Board of the Huaibei Normal University(HBU-IRB-2020-001), which conformed to the principles embodied in the Declaration of Helsinki.Information about this study was posted on a dedicated university website. All respondents providedinformed consent. Data collection took place over three days (31 January–2 February 2020) after theWHO declared the COVID-19 outbreak as a public health emergency of international concern.
2.3. Survey Development
Previous surveys on the psychological impacts of SARS and influenza outbreaks werereviewed [18,21,24]. Authors included additional questions related to the COVID-19 outbreak.The structured questionnaire consisted of questions that covered several areas: (1) demographic data;(2) physical symptoms in the past 14 days; (3) contact history with COVID-19 in the past 14 days;(4) knowledge and concerns about COVID-19; (5) precautionary measures against COVID-19 in thepast 14 days; (6) additional information required with respect to COVID-19; (7) the psychologicalimpact of the COVID-19 outbreak; and (8) mental health status.
Sociodemographic data were collected on gender, age, education, residential location in the past14 days, marital status, employment status, monthly income, parental status, and household size.Physical symptom variables in the past 14 days included fever, chills, headache, myalgia, cough,difficulty in breathing, dizziness, coryza, sore throat, and persistent fever, as well as persistent feverand cough or difficulty breathing. Respondents were asked to rate their physical health status andstate any history of chronic medical illness. Health service utilization variables in the past 14 daysincluded consultation with a doctor in the clinic, admission to the hospital, being quarantined by ahealth authority, and being tested for COVID-19. Contact history variables included close contactwith an individual with confirmed COVID-19, indirect contact with an individual with confirmedCOVID-19, and contact with an individual with suspected COVID-19 or infected materials.

Int. J. Environ. Res. Public Health 2020, 17, 1729 4 of 25
Knowledge about COVID-19 variables included knowledge about the routes of transmission,level of confidence in diagnosis, level of satisfaction of health information about COVID-19, the trendof new cases and death, and potential treatment for COVID-19 infection. Respondents were asked toindicate their source of information. The actual number of confirmed cases of COVID-19 and deaths inthe city on the day of the survey were collected. Concern about COVID-19 variables included self andother family members contracting COVID-19 and the chance of surviving if infected.
Precautionary measures against COVID-19 variables included avoidance of sharing of utensils(e.g., chopsticks) during meals, covering mouth when coughing and sneezing, washing hands withsoap, washing hands immediately after coughing, sneezing, or rubbing the nose, washing hands aftertouching contaminated objects, and wearing a mask regardless of the presence or absence of symptoms.The respondents were asked the average number of hours staying at home per day to avoid COVID-19.Respondents were also asked whether they felt too much -unnecessary worry had been made about theCOVID-19 epidemic. Additional health information about COVID-19 needed by respondents includedmore information about symptoms after contraction of COVID-19, routes of transmission, treatment,prevention of the spread of COVID-19, local outbreaks, travel advice, and other measures imposed byother countries.
The psychological impact of COVID-19 was measured using the Impact of Event Scale-Revised(IES-R). The IES-R is a self-administered questionnaire that has been well-validated in the Chinesepopulation for determining the extent of psychological impact after exposure to a public health crisiswithin one week of exposure [25]. This 22-item questionnaire is composed of three subscales and aimsto measure the mean avoidance, intrusion, and hyperarousal [26]. The total IES-R score was dividedinto 0–23 (normal), 24–32 (mild psychological impact), 33–36 (moderate psychological impact), and >37(severe psychological impact) [27].
Mental health status was measured using the Depression, Anxiety and Stress Scale (DASS-21)and calculations of scores were based on the previous study [28]. Questions 3, 5, 10, 13, 16, 17 and21formed the depression subscale. The total depression subscale score was divided into normal(0–9), mild depression (10–12), moderate depression (13–20), severe depression (21–27), and extremelysevere depression (28–42). Questions 2, 4, 7, 9, 15, 19, and 20 formed the anxiety subscale. The totalanxiety subscale score was divided into normal (0–6), mild anxiety (7–9), moderate anxiety (10–14),severe anxiety (15–19), and extremely severe anxiety (20–42). Questions 1, 6, 8, 11, 12, 14, and 18formed the stress subscale. The total stress subscale score was divided into normal (0–10), mild stress(11–18), moderate stress (19–26), severe stress (27–34), and extremely severe stress (35–42). The DASShas been demonstrated to be a reliable and valid measure in assessing mental health in the Chinesepopulation [29,30]. The DASS was previously used in research related to SARS [31].
2.4. Statistical Analysis
Descriptive statistics were calculated for sociodemographic characteristics, physical symptoms andhealth service utilization variables, contact history variables, knowledge and concern-related variables,precautionary measure variables, and additional health information variables. Percentages of responsewere calculated according to the number of respondents per response with respect to the number oftotal responses of a question. The scores of the IES-R and DASS subscales were expressed as meanand standard deviation. We used linear regressions to calculate the univariate associations betweensociodemographic characteristics, physical symptom and health service utilization variables, contacthistory variables, knowledge and concern variables, precautionary measure variables, additionalhealth information variables, and the IES-S score as well as the subscales of the DASS. All tests weretwo-tailed, with a significance level of p < 0.05. Statistical analysis was performed using SPSS Statistic21.0 (IBM SPSS Statistics, New York, United States).

Int. J. Environ. Res. Public Health 2020, 17, 1729 5 of 25
3. Results
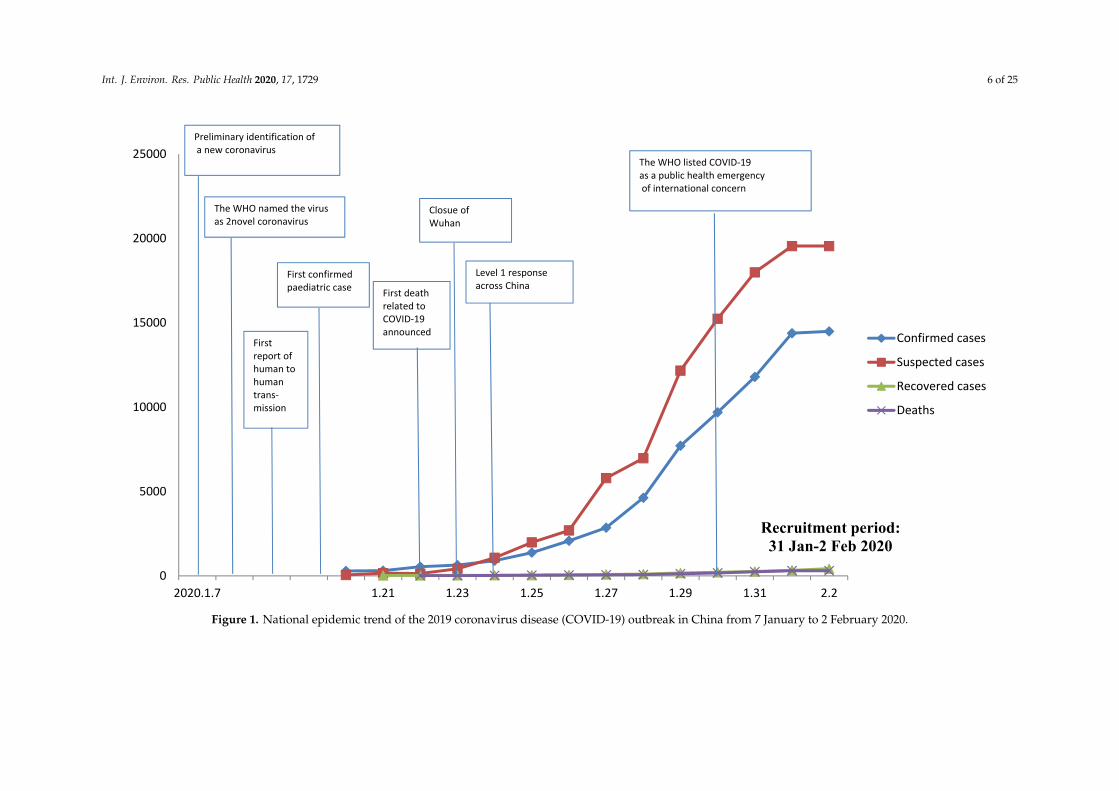
3.1. Development of the COVID-19 Epidemic from January 7 to February 2 2020
Figure 1 shows the development trend of the COVID-19 epidemic in China in January andFebruary 2020. Since China first announced the national epidemic data on 20 January 2020, the numberof confirmed cases, suspected cases, recovered individuals, and deaths related to COVID-19 infectionhave continued to escalate, with a sharp increase in the number of suspected cases after 26 January2020. Both children and the elderly have been particularly vulnerable to the virus, with the youngestconfirmed case being that of a 9-month-old infant.
3.2. Survey Respondents
We received responses from 1304 respondents, and 102 respondents did not complete thequestionnaires. Eventually, we included 1210 respondents from 194 cities in China who had completedthe questionnaires (completion rate: 92.79%). Overall, 1120 respondents submitted the questionnaireson the first day (31 January), 86 respondents submitted the questionnaires on the second day (1 February),and only 4 respondents submitted the questionnaires on the third day (2 February).
The psychological impact of COVID-19 outbreak, measured using the IES-R scale, revealed asample mean score of 32.98 (SD = 15.42). Of all respondents, 296 (24.5%) reported minimal psychologicalimpact (score < 23); 263 (21.7%) rated mild psychological impact (scores 24–32); and 651 (53.8%) reporteda moderate or severe psychological impact (score > 33). Respondents’ depression, anxiety and stresslevels, measured using the DASS 21-item scale, revealed a sample mean score of 20.16 (SD = 20.42). Forthe depression subscale, 843 (69.7%) were considered to have a normal score (score: 0–9); 167 (13.8%)were considered to suffer from mild depression (score: 10–12); 148 (12.2%) were considered to sufferfrom moderate depression (score: 13–20); and 52 (4.3%) were considered to suffer from severe andextremely severe depression (score: 21–42). For the anxiety subscale, 770 (63.6%) were considered tohave a normal score (score: 0–6); 91 (7.5%) were considered to suffer from mild anxiety (score: 7–9); 247(20.4%) were considered to suffer from moderate anxiety (score: 10–14); and 102 (8.4%) were consideredto suffer from severe and extremely severe anxiety (score: 15–42). For the stress subscale, 821 (67.9%)were considered to have a normal score (score: 0–10); 292 (24.1%) were considered to suffer from mildstress (score: 11–18); 66 (5.5%) were considered to suffer from moderate stress (score: 19–26); and 31(2.6%) were considered to suffer from severe and extremely severe stress (score: 27–42).
3.3. Sociodemographic Variables and Psychological Impact
Sociodemographic characteristics are presented in Table 1. The majority of respondents werewomen (67.3%), aged 21.4 to 30.8 years (53.1%), married (76.4%), with a household size of 3–5 people(80.7%), with children (67.4%), students (52.8%), and well educated (87.9% ≥ bachelor’s degree).Male gender was significantly associated with lower scores in the IES-R (B = −0.20, 95% ConfidenceInterval (95% CI) −0.35 to −0.05) but higher scores in the DASS stress subscale (B = 0.10, 95% CI:0.02 to 0.19), DASS anxiety subscale (B = 0.19 95% CI: 0.05 to 0.33), and DASS depression subscale(B = 0.12, 95% CI: 0.01 to 0.23). Student status was significantly associated with higher IES-R (B = 0.20,95% CI: 0.05 to 0.35), DASS stress subscale (B = 0.11, 95% CI: 0.02 to 0.19), and DASS anxiety subscale(B = 0.16, 95% CI: 0.02 to 0.30) scores as compared to those who were employed. Uneducated statuswas significantly associated with higher DASS depression subscale scores (B = 1.81, 95% CI: 0.46 to3.16). Other sociodemographic variables including age, parental status, marital status, and householdsize were not associated with IES-R and DASS subscale scores.
Int. J. Environ. Res. Public Health 2020, 17, 1729 6 of 25
Int. J. Environ. Res. Public Health 2020, 17, x 6 of 27
Int. J. Environ. Res. Public Health 2020, 17, x; doi: www.mdpi.com/journal/ijerph
Figure 1. National epidemic trend of the 2019 coronavirus disease (COVID-19) outbreak in China from 7 January to 2 February 2020.
0
5000
10000
15000
20000
25000
2020.1.7 1.21 1.23 1.25 1.27 1.29 1.31 2.2
Recruitment period:31 Jan-2 Feb 2020
Confirmed cases
Suspected cases
Recovered cases
Deaths
Preliminary identification of a new coronavirus
The WHO named the virus as 2novel coronavirus
Firstreport of human to human trans-mission
First confirmed paediatric case First death
related to COVID-19announced
Closue of Wuhan
Level 1 response across China
The WHO listed COVID-19as a public health emergencyof international concern
Figure 1. National epidemic trend of the 2019 coronavirus disease (COVID-19) outbreak in China from 7 January to 2 February 2020.

Int. J. Environ. Res. Public Health 2020, 17, 1729 7 of 25
Table 1. Association between demographic variables and the psychological impact of the 2019 coronavirus disease (COVID-19) outbreak as well as adverse mentalhealth status during the epidemic (n = 1210).
Variables N (%)
Impact of event Stress Anxiety Depression
R-Squared(R2)
AdjustedR-Squared
(AR2)
Beta (95%ConfidenceInterval) B(95% CI)
R2 AR2 B (95%CI) R2 AR2 B (95% CI) R2 AR2 B (95% CI)
Gender
Male 396 (32.7)0.005 0.005
−0.20 *(−0.35 to −0.05) 0.004 0.004
0.10 *(0.02 to 0.19) 0.006 0.005
0.19 ** (0.05 to 0.33)0.004 0.003
0.12 * (0.01 to 0.23)
Female 814 (67.3) Reference Reference Reference Reference
Age (Years)
(12–21.4) 344 (28.4)
0.009 0.006
0.21(−0.20 to 0.62)
0.011 0.007
0.08(−0.16 to 0.32)
0.007 0.004
0.10 (−0.28 to 0.48)
0.013 0.009
0.06 (−0.25 to 0.37)
(21.4–30.8) 643 (53.1) 0.09(−0.31 to 0.50)
0.12(−0.12 to 0.36) 0.07 (−0.31 to 0.44) 0.18 (−0.12 to 0.47)
(30.8–40.2) 94 (7.8) −0.17(−0.64 to 0.29)
−0.07(−0.35 to 0.20) −0.16 (−0.59 to 0.27) −0.06
(−0.41 to 0.28)
(40.2–49.6) 90 (7.4) −0.16(−0.63 to 0.30)
−0.12(−0.39 to 0.16) −0.23 (−0.67 to 0.20) −0.16
(−0.51 to 0.19)(49.6–59) 39 (3.2) Reference Reference Reference Reference
Status as a parentHas a child 16 years
or under 234 (19.3)0.001 <0.001
0.04(−0.16 to 0.25) 0.002 <0.001 −0.02
(−0.14 to 0.10) 0.003 0.001 0.08 (−0.11 to 0.27) 0.002 0.001 0.05 (−0.10 to 0.20)
Has a child olderthan 16 years 581 (48.1) −0.06
(−0.22 to 0.10)−0.07
(−0.17 to 0.02) −0.08 (−0.23 to 0.07) −0.06(−0.18 to 0.06)
No children 395 (32.6) Reference Reference Reference Reference
Marital status
Single 273 (22.6)
0.002 −0.001
−0.04(−1.46 to 1.38)
0.003 0.001
0.02(−0.81 to 0.86)
0.003 <0.001
0.71 (−0.61 to 2.03)
0.003 <0.001
0.45 (−0.60 to 1.51)
Married 925 (76.4) 0.09(−1.33 to 1.50)
0.12(−0.71 to 0.96) 0.80 (−0.51 to 2.12) 0.56 (−0.50 to 1.61)
Divorced/separated 9 (0.7) 0.11(−1.52 to 1.74)
<0.001(−0.96 to 0.96) 0.44 (−1.07 to 1.96) 0.44 (−0.77 to 1.66)
Widowed 3 (0.2) Reference Reference Reference Reference
Household size
Six people or more 171 (14.1)
0.002 <0.001
0.38(−0.39 to 1.14)
0.002 <0.001
−0.23(−0.68 to 0.22)
<0.001 −0.002
−0.17 (−0.87 to 0.54)
0.002 <0.001
−0.19(−0.76 to 0.38)
Three to five people 976 (80.7) 0.25(−0.49 to 0.99)
−0.20(−0.63 to 0.24) −0.12 (−0.81 to 0.57) −0.09
(−0.64 to 0.47)
Two people 52 (4.3) 0.41(−0.40 to 1.22)
−0.33(−0.81 to 0.15) −0.18 (−0.93 to 0.58) −0.21
(−0.82 to 0.39)One person 11 (0.9) Reference Reference Reference Reference

Int. J. Environ. Res. Public Health 2020, 17, 1729 8 of 25
Table 1. Cont.
Variables N (%)
Impact of event Stress Anxiety Depression
R-Squared(R2)
AdjustedR-Squared
(AR2)
Beta (95%ConfidenceInterval) B(95% CI)
R2 AR2 B (95%CI) R2 AR2 B (95% CI) R2 AR2 B (95% CI)
Employment status
Unemployed 67 (5.5)
0.009 0.006
0.13(−0.19 to 0.45)
0.007 0.004
0.12(−0.07 to 0.31)
0.007 0.003
0.21 (−0.09 to 0.51)
0.005 0.001
0.16 (−0.08 to 0.40)
Farmers 24 (2) −0.08(−0.59 to 0.43)
0.003(−0.30 to 0.30) 0.07 (−0.41 to 0.54) −0.07
(−0.45 to 0.31)
Retired 7 (0.6) −0.76(−1.69 to 0.17)
−0.37(−0.92 to 0.18) −0.54 (−1.41 to 0.32) −0.48
(−1.18 to 0.21)
Student 639 (52.8) 0.20 *(0.05 to 0.35)
0.11 *(0.02 to 0.19) 0.16 * (0.02 to 0.30) 0.08 *
(−0.03 to 0.19)Employed 473 (39.1) Reference Reference Reference Reference
Educationalattainment
None 2 (0.2)
0.008 0.003
−0.07(−1.88 to 1.74)
0.004 −0.001
0.76(−0.30 to 1.83)
0.004 −0.001
1.02 (−0.66 to 2.71)
0.008 0.003
1.81 **(0.46 to 3.16)
Primary school 8 (0.7) −1.07*(−2.09 to −0.06)
−0.11(−0.71 to 0.49) −0.10 (−1.05 to 0.84) −0.07
(−0.82 to 0.69)Lower secondary
school 55 (4.5) 0.21(−0.42 to 0.84)
0.20(−0.17 to 0.57) 0.38 (−0.21 to 0.96) 0.41 (−0.06 to 0.88)
Upper secondaryschool 81 (6.7) 0.01
(−0.59 to 0.61)0.16
(−0.20 to 0.51) 0.36 (−0.19 to 0.92) 0.34 (−0.11 to 0.79)
University—Bachelors 805 (66.5) 0.19(−0.35 to 0.73)
0.21(−0.11 to 0.53) 0.32 (−0.18 to 0.82) 0.35 (−0.05 to 0.75)
University—Masters 238 (19.7) 0.14(−0.42 to 0.69)
0.18(−0.15 to 0.51) 0.24 (−0.28 to 0.76) 0.33 (−0.09 to 0.74)
University—Doctorate 21 (1.7) Reference Reference Reference Reference
* p < 0.05; ** p < 0.01.

Int. J. Environ. Res. Public Health 2020, 17, 1729 9 of 25
3.4. Symptoms and Psychological Impact
For physical symptoms, Table 2 shows that 0.5% of the sample reported a fever of 38 ◦C forat least one day within the previous two weeks. Some respondents reported a range of physicalsymptoms, most frequently coryza (16.9%), cough (13.9%), sore throat (11.5%), headache (9.7%),myalgia (7.9%), dizziness (7.3%), chills (3.5%), fever (0.5%), and breathing difficulty (0.4%). Around0.3% of respondents reported a dyad of symptoms such as fever with cough or fever with breathingdifficulty. Overall, 793 respondents reported no symptoms (60.81%); 182 respondents reported onesymptom (15.04%); 114 respondents reported two symptoms (9.42%); and 68 respondents reportedthree symptoms (5.62%). Linear regression showed that chills, myalgia, cough, dizziness, coryza,and sore throat were significantly associated with higher IES-R, DASS stress subscale, DASS anxietysubscale, and DASS depression subscale scores, while breathing difficulty was associated with onlyDASS anxiety and depression subscale scores. In contrast, the presence of a dyad of symptoms such asfever with cough or breathing difficulty was not associated with IES-R, DASS stress subscale, DASSanxiety subscale, and DASS depression subscale scores.
3.5. Health Status and Psychological Impact
In the prior two weeks, 3.5% of respondents had consulted a doctor in the clinic; 0.3% had beenadmitted to the hospital; 0.9% had been tested for COVID-19; 2.1% had been under quarantine by ahealth authority; and 68.3% reported good or very good health status. Around 93.6% of respondents didnot suffer from any chronic illness, and 92.4% were covered by medical insurance. Clinic consultations(B = 0.38, 95% CI: 0.02 to 0.73) and hospitalizations (B = 1.23, 95 % CI: 0.09 to 2.36) were significantlyassociated with higher DASS anxiety subscale score. Poor or very poor self-rated health status wassignificantly associated with a greater psychological impact of the outbreak (B = 0.76, 95% CI: 0.02 to1.49), and higher DASS stress subscale (B = 0.45, 95% CI: 0.02 to 0.88), DASS anxiety subscale (B = 0.90,95% CI: 0.22 to 1.58), and DASS depression subscale (B = 0.65, 95% CI: 0.10 to 1.20) scores as comparedto those with very good or good self-rated health status. History of chronic illness was significantlyassociated with higher IES-R, DASS stress subscale, DASS anxiety subscale, and DASS depressionsubscale scores.

Int. J. Environ. Res. Public Health 2020, 17, 1729 10 of 25
Table 2. Association between physical health status in the past 14 days and the psychological impact of the 2019 coronavirus disease (COVID-19) outbreak as well asadverse mental health status during the epidemic (n = 1210).
Variable n (%)Impact of Event Stress Anxiety Depression
R2 AR2 B (95% CI) R2 AR2 B (95% CI) R2 AR2 B (95% CI) R2 AR2 B (95% CI)
Persistent fever (>38◦Cfor at least 1 day)
Yes 6 (0.5)<0.001 −0.001
−0.23 (−1.23 to 0.78)0.001 0.001
0.40 (−0.19 to 0.99)0.006 0.005
1.23 * (0.30 to 2.15)0.005 0.005
0.98 * (0.23 to 1.72)No 1204 (99.5) Reference Reference Reference Reference
ChillsYes 42 (3.5)
0.005 0.0040.46 * (0.08 to 0.84)
0.012 0.0110.44 *** (0.22 to 0.67)
0.009 0.0080.60 **(0.24 to 0.96)
0.007 0.0060.41 **(0.13 to 0.70)
No 1168 (96.5) Reference Reference Reference Reference
HeadacheYes 117 (9.7)
0.008 0.0070.37 ** (0.13 to 0.61)
0.002 0.0010.12 (−0.02 to 0.26)
0.008 0.0080.36 ** (0.14 to 0.58)
0.005 0.0040.23 * (0.05 to 0.40)
No 1093 (90.3) Reference Reference Reference Reference
MyalgiaYes 95 (7.9)
0.019 0.0180.63 ***(0.37 to 0.89)
0.025 0.0240.43 ***(0.28 to 0.59)
0.025 0.0250.69 *** (0.45 to 0.93)
0.021 0.020.50 *** (0.31 to 0.69)
No 1115(92.1) Reference Reference Reference Reference
CoughYes 168 (13.9)
0.009 0.0080.33 ** (0.13 to 0.54)
0.008 0.0070.19 ** (0.07 to 0.31)
0.007 0.0060.29 ** (0.10 to 0.47)
0.006 0.0050.21 **(0.06 to 0.36)
No 1042 (86.1) Reference Reference Reference Reference
Breathing difficultyYes 5 (0.4)
0.002 0.0010.88 (−0.22 to 1.97)
0.002 0.0020.57 (−0.07 to 1.22)
0.008 0.0071.63 ** (0.61 to 2.64)
0.008 0.0071.28 ** (0.46 to 2.09)
No 1205 (99.6) Reference Reference Reference Reference
DizzinessYes 88 (7.3)
0.013 0.0120.54 *** (0.27 to 0.81)
0.014 0.0130.33 *** (0.17 to 0.49)
0.020 0.0190.63 *** (0.38 to 0.88)
0.014 0.0130.42 *** (0.22 to 0.62)
No 1122 (92.7) Reference Reference Reference Reference
CoryzaYes 205 (16.9)
0.014 0.0130.39 *** (0.20 to 0.58)
0.016 0.0150.25 *** (0.14 to 0.36)
0.022 0.0210.46 ***(0.28 to 0.63)
0.018 0.0170.33 *** (0.19 to 0.47)
No 1005 (83.1) Reference Reference Reference Reference
Sore throatYes 139 (11.5)
0.007 0.0070.34 ** (0.12 to 0.56)
0.005 0.0040.16 *(0.03 to 0.29)
0.009 0.0080.35 ** (0.14 to 0.55)
0.004 0.0030.17 * (0.01 to 0.34)
No 1071 (88.5) Reference Reference Reference Reference
Persistent fever andcough or difficulty
breathingYes 4 (0.3)
<0.001 −0.001−0.23 (−1.45 to 1.00)
0.001 <0.0010.32 (−0.40 to 1.04)
0.002 0.0020.98 (−0.16 to 2.11)
<0.001 −0.0010.22 (−0.69 to 1.13)
No 1206 (99.7) Reference Reference Reference Reference

Int. J. Environ. Res. Public Health 2020, 17, 1729 11 of 25
Table 2. Cont.
Variable n (%)Impact of Event Stress Anxiety Depression
R2 AR2 B (95% CI) R2 AR2 B (95% CI) R2 AR2 B (95% CI) R2 AR2 B (95% CI)
Consultation withdoctor in the clinic in
the past 14 daysYes 42 (3.5)
<0.001 −0.001−0.06 (−0.44 to 0.32)
0.002 0.0010.17 (−0.06 to 0.40)
0.004 0.0030.38 * (0.02 to 0.73)
0.002 0.0010.22 (−0.07 to 0.50)
No 1168 (96.5) Reference Reference Reference Reference
Recent hospitalizationin the past 14 days
Yes 4 (0.3)0.001 <0.001
0.78 (−0.45 to 2.00)0.001 <0.001
0.32 (−0.40 to 1.04)0.004 0.003
1.23 * (0.09 to 2.36)<0.001 −0.001
−0.28 (−1.19 to 0.63)No 1206 (99.7) Reference Reference Reference Reference
Recent testing forCOVID-19 in the past
14 daysYes 11 (0.9)
<0.001 −0.001−0.18 (−0.92 to 0.56)
<0.001 −0.001−0.07 (−0.51 to 0.37)
<0.001 <0.0010.22 (−0.47 to 0.91)
<0.001 −0.0010.02 (−0.54 to 0.57)
No 1199 (99.1) Reference Reference Reference Reference
Recent quarantine inthe past 14 days
Yes 26 (2.1)0.001 0.001
0.32 (−0.16 to 0.81)<0.001 −0.001
−0.01 (−0.30 to 0.28)<0.001 −0.001
0.03 (−0.42 to 0.48)<0.001 −0.001
−0.11 (−0.47 to 0.25)No 1184 (97.9) Reference Reference Reference Reference
Current self-ratinghealth status
Poor/Very poor 11 (1)0.021 0.018
0.76 * (0.02 to 1.49)0.034 0.032
0.45 * (0.02 to 0.88)0.034 0.032
0.90 * (0.22 to 1.58)0.030 0.027
0.65 * (0.1 to 1.20)Average 372 (30.8) 0.37 *** (0.21 to 0.52) 0.19 *** (0.11 to 0.28) 0.41 *** (0.27 to 0.55) 0.26 *** (0.15 to 0.38)
Good/Very good 827 (68.3) Reference Reference Reference Reference
Chronic illnessYes 78 (6.4)
0.003 0.0030.29 * (0.01 to 0.58)
0.006 0.0050.24 ** (0.07 to 0.41)
0.011 0.0100.48 *** (0.22 to 0.75)
0.010 0.0090.38 *** (0.17 to 0.59)
No 1132 (93.6) Reference Reference Reference Reference
Medical insurancecoverage
Yes 1118 (92.4)<0.001 <0.001
0.09 (−0.18 to 0.36)<0.001 −0.001
−0.003 (−0.16 to0.15) <0.001 −0.001
−0.04 (−0.29 to 0.21)<0.001 −0.001
0.02 (−0.18 to 0.22)
No 92 (7.6) Reference Reference Reference Reference
* p < 0.05; ** p < 0.01; *** p < 0.001.
Int. J. Environ. Res. Public Health 2020, 17, 1729 12 of 25
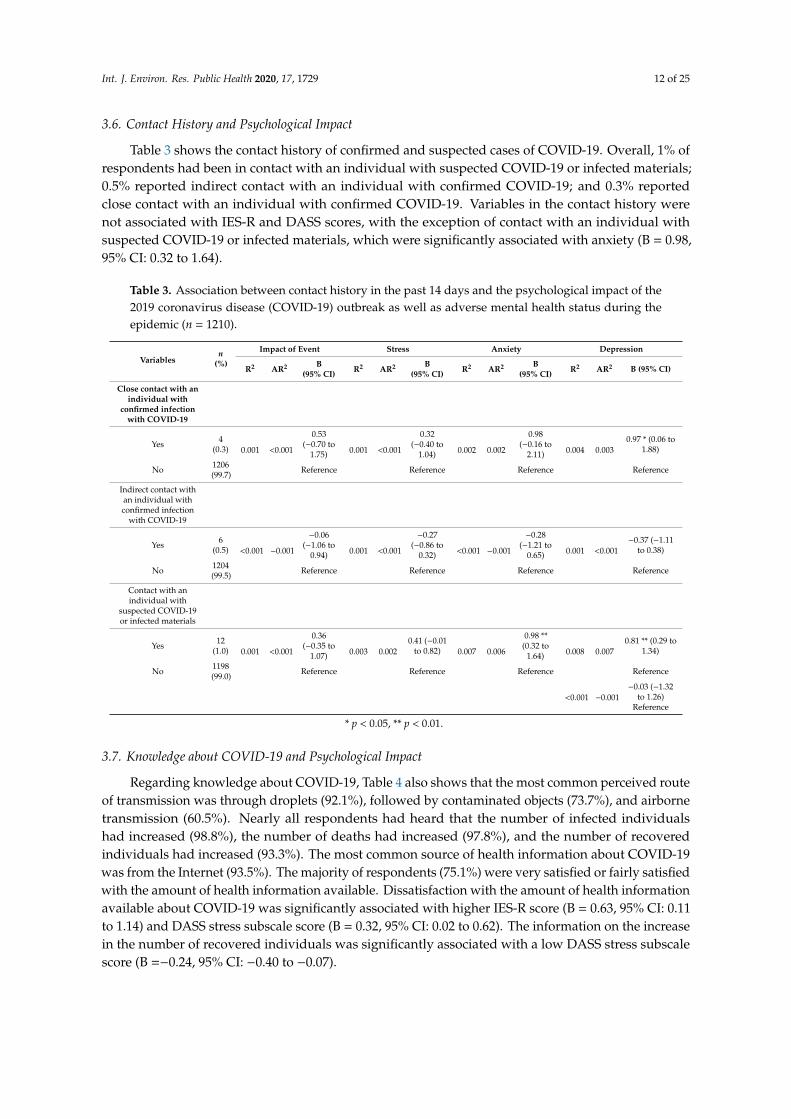
3.6. Contact History and Psychological Impact
Table 3 shows the contact history of confirmed and suspected cases of COVID-19. Overall, 1% ofrespondents had been in contact with an individual with suspected COVID-19 or infected materials;0.5% reported indirect contact with an individual with confirmed COVID-19; and 0.3% reportedclose contact with an individual with confirmed COVID-19. Variables in the contact history werenot associated with IES-R and DASS scores, with the exception of contact with an individual withsuspected COVID-19 or infected materials, which were significantly associated with anxiety (B = 0.98,95% CI: 0.32 to 1.64).
Table 3. Association between contact history in the past 14 days and the psychological impact of the2019 coronavirus disease (COVID-19) outbreak as well as adverse mental health status during theepidemic (n = 1210).
Variablesn
(%)
Impact of Event Stress Anxiety Depression
R2 AR2 B(95% CI) R2 AR2 B
(95% CI) R2 AR2 B(95% CI) R2 AR2 B (95% CI)
Close contact with anindividual with
confirmed infectionwith COVID-19
Yes 4(0.3) 0.001 <0.001
0.53(−0.70 to
1.75) 0.001 <0.001
0.32(−0.40 to
1.04) 0.002 0.002
0.98(−0.16 to
2.11) 0.004 0.0030.97 * (0.06 to
1.88)
No 1206(99.7) Reference Reference Reference Reference
Indirect contact withan individual withconfirmed infection
with COVID-19
Yes 6(0.5) <0.001 −0.001
−0.06(−1.06 to
0.94) 0.001 <0.001
−0.27(−0.86 to
0.32) <0.001 −0.001
−0.28(−1.21 to
0.65) 0.001 <0.001−0.37 (−1.11
to 0.38)
No 1204(99.5) Reference Reference Reference Reference
Contact with anindividual with
suspected COVID-19or infected materials
Yes 12(1.0) 0.001 <0.001
0.36(−0.35 to
1.07) 0.003 0.0020.41 (−0.01
to 0.82) 0.007 0.006
0.98 **(0.32 to
1.64) 0.008 0.0070.81 ** (0.29 to
1.34)
No 1198(99.0) Reference Reference Reference Reference
<0.001 −0.001−0.03 (−1.32
to 1.26)Reference
* p < 0.05, ** p < 0.01.
3.7. Knowledge about COVID-19 and Psychological Impact
Regarding knowledge about COVID-19, Table 4 also shows that the most common perceived routeof transmission was through droplets (92.1%), followed by contaminated objects (73.7%), and airbornetransmission (60.5%). Nearly all respondents had heard that the number of infected individualshad increased (98.8%), the number of deaths had increased (97.8%), and the number of recoveredindividuals had increased (93.3%). The most common source of health information about COVID-19was from the Internet (93.5%). The majority of respondents (75.1%) were very satisfied or fairly satisfiedwith the amount of health information available. Dissatisfaction with the amount of health informationavailable about COVID-19 was significantly associated with higher IES-R score (B = 0.63, 95% CI: 0.11to 1.14) and DASS stress subscale score (B = 0.32, 95% CI: 0.02 to 0.62). The information on the increasein the number of recovered individuals was significantly associated with a low DASS stress subscalescore (B =−0.24, 95% CI: −0.40 to −0.07).

Int. J. Environ. Res. Public Health 2020, 17, 1729 13 of 25
Table 4. Association between knowledge and concerns about the 2019 coronavirus disease (COVID-19) and the psychological impact of outbreak as well as adversemental health status during the epidemic (n = 1210).
Variables n (%)Impact of Event Stress Anxiety Depression
R2 AR2 B (95% CI) R2 AR2 B (95% CI) R2 AR2 B (95% CI) R2 AR2 B (95% CI)
Knowledge of COVID-19Route of transmission
DropletsAgree 1115 (92.1)
0.002 0.0010.21 (−0.07 to 0.49)
0.003 0.0010.15 (−0.01 to 0.32)
0.001 <0.0010.17 (−0.09 to 0.43)
0.005 0.0040.27 * (0.06 to 0.48)
Disagree 13 (1.1) 0.48 (−0.25 to 1.21) 0.09 (−0.34 to 0.52) 0.22 (−0.45 to 0.90) 0.18 (−0.36 to0.72)Do not know 82 (6.8) Reference Reference Reference Reference
Contact via contaminated objects
Agree 892 (73.7)<0.001 −0.001
0.04 (−0.15 to 0.22)0.003 0.001
−0.02 (−0.13 to 0.09)0.002 0.001
−0.07 (−0.24 to 0.10)0.001 −0.001
0.02 (−0.12 to 0.15)Disagree 94 (7.8) −0.04 (−0.34 to 0.26) −0.16 (−0.34 to 0.02) −0.23 (−0.51 to 0.05) −0.10 (−0.33 to 0.12)
Do not know 224 (18.5) Reference Reference Reference Reference
Airborne
Agree 732 (60.5)0.002 <0.001
0.11 (−0.07 to 0.29)0.001 −0.001
0.04 (−0.07 to 0.14)0.002 <0.001
0.12 (−0.05 to 0.28)0.001 <0.001
0.08 (−0.05 to 0.22)Disagree 225 (18.6) 0.17 (−0.05 to 0.40) −0.002 (−0.13 to 0.13) 0.04 (−0.17 to 0.25) 0.03 (−0.14 to 0.20)
Do not know 253 (20.9) Reference Reference Reference Reference
Have you heard that the number of infected COVID-19 individuals has increased?
Heard 1195 (98.8)0.001 <0.001
0.40 (−0.24 to 1.03)<0.001 −0.001
0.10 (−0.27 to 0.47)<0.001 −0.001
−0.16 (−0.75 to 0.43)<0.001 −0.001
−0.14 (−0.61 to 0.34)Not heard 15 (1.2) Reference Reference Reference Reference
Have you heard that the number of COVID-19 deaths has increased?
Heard 1183 (97.8)0.001 <0.001
0.21 (−0.27 to 0.69) 0.001 <0.001 0.18 (−0.10 to 0.46)<0.001 −0.001
0.04 (−0.40 to 0.48)<0.001 −0.001
0.09 (−0.27 to 0.44)Not heard 27 (2.2) Reference Reference Reference Reference
Have you heard that the number of individuals that have recovered from COVID-19 infection has increased?
Heard 1129 (93.3)0.001 0.001
−0.19 (−0.47 to 0.09)0.007 0.006
−0.24 ** (−0.40 to −0.07)0.003 0.002
−0.25 (−0.51 to 0.01)0.004 0.003
−0.24 * (−0.45 to −0.03)Not heard 81 (6.7) Reference Reference Reference Reference
The main source of health information
Internet 1131 (93.5)
0.003 <0.001
−0.46 (−1.46 to 0.54)
0.007 0.004
−0.25 (−0.83 to0.34 )
0.010 0.006
−0.57 (−1.50 to 0.35)
0.007 0.004
0.19 (−0.55 to 0.94)Television 62 (5.1) −0.22 (−1.26 to 0.83) −0.07 (−0.68 to 0.54) −0.35 (−1.32 to 0.62) 0.31 (−0.47 to 1.09)
Radio 1 (0.1) 0.83 (−1.81 to 3.47) 1.33 (−0.22 to 2.89) 2.67 * (0.22 to 5.11) 2.67 ** (0.70 to 4.63)Family members 10 (0.8) −0.47 (−1.73 to 0.80) −0.27 (−1.01 to 0.48) −0.33 (−1.50 to 0.84) −0.03(−0.97 to 0.91)
Other sources 6 (0.5) Reference Reference Reference Reference
Satisfaction with the amount of health information available about COVID-19
Very satisfied 485 (40.1)
0.018 0.014
0.02 (−0.34 to 0.37)
0.014 0.011
−0.09 (−0.30 to 0.13)
0.013 0.010
−0.20 (−0.53 to 0.14)
0.014 0.011
−0.12 (−0.38 to 0.15)Somewhatsatisfied 423 (35.0) 0.23 (−0.13 to 0.59) 0.03 (−0.19 to 0.24) −0.02 (−0.36 to 0.31) −0.001 (−0.27 to 0.27)Not very satisfied 211 (17.4) 0.39 * (0.01 to 0.77) 0.09 (−0.14 to 0.31) 0.05 (−0.31 to 0.40) 0.08 (−0.21 to 0.36)Not satisfied at all 40 (3.3) 0.63 * (0.11 to 1.14) 0.32 * (0.02 to 0.62) 0.41 (−0.07 to 0.88) 0.43 * (0.04 to 0.81)
Do not know 51 (4.2) Reference Reference Reference ReferenceConcerns about COVID-19

Int. J. Environ. Res. Public Health 2020, 17, 1729 14 of 25
Table 4. Cont.
Variables n (%)Impact of Event Stress Anxiety Depression
R2 AR2 B (95% CI) R2 AR2 B (95% CI) R2 AR2 B (95% CI) R2 AR2 B (95% CI)
Level of confidence in own doctor’s ability to diagnose or recognize
Very confident 563 (46.5)
0.025 0.022
−0.2 (−0.66 to 0.27)
0.021 0.017
0.05 (−0.23 to 0.32)
0.024 0.021
0.02 (−0.42 to 0.45)
0.021 0.018
0.02 (−0.33 to 0.37)Somewhat confident 561 (46.4) 0.19 (−0.28 to 0.66) 0.16 (−0.12 to 0.44) 0.22 (−0.22 to 0.65) 0.09 (−0.26 to 0.44)Not very confident 50 (4.1) 0.19 (−0.39 to 0.76) 0.18 (−0.16 to 0.52) 0.38 (−0.15 to 0.91) 0.10 (−0.33 to 0.52)Not at all confident 8 (0.7) 0.66 (−0.31 to 1.63) 1.18 *** (0.61 to 1.75) 1.86 *** (0.96 to 2.76) 1.66 ***(0.94 to 2.38)
Do not know 28 (2.3) Reference Reference Reference Reference
Likelihood of contracting COVID−19 during the current outbreak
Very likely 135 (11.2)
0.019 0.016
−0.33 * (−0.61 to−0.05)
0.008 0.005
0.05 (−0.11 to 0.22)
0.009 0.005
0.07 (−0.20 to 0.33)
0.007 0.004
0.15 (−0.06 to 0.36)
Somewhat likely 358 (29.6) 0.15 (−0.09 to 0.38) 0.06 (−0.08 to 0.20) −0.02 (−0.23 to 0.20) 0.04 (−0.14 to 0.21)Not very likely 437 (36.1) 0.14 (−0.09 to 0.36) −0.002 (−0.14 to 0.13) −0.05 (−0.26 to 0.16) 0.03 (−0.14 to 0.20)Not likely at all 121 (10.0) −0.23(−0.52 to 0.06) −0.18 * (−0.35 to −0.01) −0.36 * (−0.63to−0.09) −0.19 (−0.41 to 0.03)
Do not know 159 (13.1) Reference Reference Reference Reference
Likelihood of surviving if infected with COVID-19
Very likely 278 (23.0)
0.014 0.011
−0.19 (−0.41 to 0.03)
0.009 0.006
−0.02 (−0.15 to 0.11)
0.006 0.002
−0.06 (−0.27 to 0.14)
0.007 0.003
0.01 (−0.15 to 0.17)Somewhat likely 559 (46.2) 0.12 (−0.07 to 0.31) 0.01 (−0.10 to 0.13) −0.03 (−0.21 to 0.15) −0.01 (−0.15 to 0.14)Not very likely 124 (10.2) 0.23 (−0.04 to 0.50) 0.18 * (0.02 to 0.34) 0.18 (−0.08 to 0.43) 0.15 (−0.06 to 0.35)Not likely at all 20 (1.7) 0.42 (−0.15 to 0.99) 0.34 * (0.01 to 0.68) 0.42 (−0.11 to 0.95) 0.49 * (0.07 to 0.92)
Do not know 229 (18.9) Reference Reference Reference Reference
Concerns about other family members getting COVID−19 infection
Very worried 417 (34.5)
0.017 0.014
0.75(−0.03 to 1.53)
0.007 0.004
0.50*(0.04 to 0.96)
0.006 0.003
0.59(−0.13 to 1.32)
0.005 0.001
0.29(−0.30 to 0.87)Somewhat worried 492 (40.7) 0.67 (−0.10 to 1.45) 0.40 (−0.05 to 0.86) 0.43 (−0.30 to 1.15) 0.20 (−0.38 to 0.78)Not very worried 221 (18.3) 0.44 (−0.34 to 1.23) 0.43 (−0.04 to 0.89) 0.44 (−0.30 to 1.17) 0.26 (−0.33 to 0.85)Not worried at all 70 (5.8) 0.19 (−0.64 to 1.01) 0.33 (−0.16 to 0.81) 0.36 (−0.41 to 1.13) 0.04 (−0.57 to 0.66)
Do not have family members 10 (0.8) Reference Reference Reference Reference
Concerns about a child younger than 16 years getting COVID-19 infection
Very worried 309 (25.5)
0.006 0.003
0.25 * (0.05 to 0.44)
0.001 −0.003
0.05 (−0.07 to 0.16)
0.007 0.004
0.24 ** (0.07 to 0.42)
0.002 −0.001
0.09 (−0.05 to 0.24)Somewhat worried 307 (25.4) 0.13 (−0.06 to 0.32) 0.03 (−0.09 to 0.14) 0.21 * (0.03 to 0.39) 0.08 (−0.06 to 0.23)Not very worried 151 (12.5) 0.10 (−0.14 to 0.34) 0.04 (−0.10 to 0.18) 0.21 (−0.01 to 0.43) 0.08 (−0.09 to 0.26)Not worried at all 102 (8.4) −0.02 (−0.30 to 0.26) 0.004 (−0.16 to 0.17) 0.14 (−0.12 to 0.40) 0.03 (−0.18 to 0.23)
Do not have children 341 (28.2) Reference Reference Reference Reference
* p < 0.05; ** p < 0.01; *** p < 0.001.

Int. J. Environ. Res. Public Health 2020, 17, 1729 15 of 25
3.8. Concerns about COVID -19 and Psychological Impact
Regarding concerns about COVID-19, about 75.2% of respondents were very worried or somewhatworried about other family members getting COVID-19. In contrast, 50.9% of respondents were veryworried or somewhat worried about a child younger than 16 years getting COVID-19. About 46.5% ofthe respondents expressed a high level of confidence in their doctor’s ability to diagnose or recognizeCOVID-19; and 46.1% believed the risk of contracting COVID-19 during the current outbreak wasunlikely or not likely at all. The majority of respondents (69.2%) believed that they would be verylikely or somewhat likely to survive COVID-19 if infected.
Those who had no confidence in their own doctor’s ability to diagnose or recognize COVID-19were significantly more likely to have higher scores in the DASS stress subscale (B = 1.18, 95% CI:0.61–1.75), DASS anxiety subscale (B = 1.86, 95% CI: 0.96 to 2.76), and DASS depression subscale(B = 1.66, 95% CI:0.94 to 2.38). A higher perceived likelihood of contracting COVID-19 during thecurrent outbreak was significantly associated with lower IES-R score (B = −0.33, 95% CI: −0.61 to−0.05). In contrast, low perceived likelihood of contracting COVID-19 during the current outbreakwas significantly associated with low DASS stress subscale (B = −0.18, 95% CI: −0.35 to −0.01) andlow DASS anxiety subscale (B = −0.36, 95% CI: −0.63 to −0.09) scores. A low perceived likelihoodof surviving COVID-19 if infected was significantly associated with high DASS stress subscale score(B = 0.34, 95% CI: 0.01 to 0.68).
High levels of concern about other family members getting COVID-19 were significantly associatedwith higher DASS stress subscale scores (B = 0.50, 95% CI: 0.04 to 0.96). Similarly, high levels of concernabout a child younger than 16 years getting COVID-19 were significantly associated with higher IES-Rscores (B = 0.25, 95% CI: 0.05 to 0.44) and DASS anxiety subscale scores (B = 0.24, 95% CI: 0.07 to 0.42).
3.9. Precautionary Measures and Psychological Impact
Table 5 shows the precautionary measures adopted by the respondents in the past 14 days, whichwere most frequently always washing hands after touching contaminated objects (66.6%), alwayswearing a mask regardless of the presence or absence of symptoms (59.8%), always covering mouthwhen coughing and sneezing (57.4%), always washing hands with soap (56.5%), always washing handsimmediately after coughing, sneezing, or rubbing nose (41%), and always avoiding sharing utensils(e.g., chopsticks) during meals (40.5%). Linear regression analysis showed that avoiding the sharingof utensils (e.g., chopsticks) during meals was significantly associated with lower scores in the IES-R(B= −0.29, 95% CI: −0.50 to −0.09) and the DASS stress (B = −0.18, 95% CI: −0.31 to −0.06), anxiety(B = −0.36, 95% CI: −0.55 to −0.17), and depression subscales (B = −0.31, 95% CI: −0.46 to −0.15).Similarly, washing hands immediately after coughing, sneezing, or rubbing the nose was significantlyassociated with lower scores in the IES-R (B = −0.47, 95% CI: −0.77 to −0.17) and the DASS stress(B = −0.31, 95% CI: −0.49 to −0.13), anxiety (B = −0.63, 95 CI: −0.91 to −0.35), and depression subscales(B = −0.38, 95% CI: −0.6 to −0.16). Washing hands with soap was significantly associated with lowerscores in the DASS stress (B =−0.34, 95% CI: −0.60 to −0.09), anxiety (B = −0.54, 95% CI: −0.94 to−0.14), and depression subscales (B = −0.39, 95% CI: −0.71 to −0.07). Infrequency of wearing masksregardless of the presence or absence of symptoms was significantly associated with higher IES-Rscores (B = 0.52, 95% CI: 0.04 to 1.01). High frequency of wearing masks regardless of the presence orabsence of symptoms was significantly associated with lower scores in the DASS anxiety (B = −0.43,95% CI: −0.81 to −0.06) and depression subscales (B = −0.37, 95% CI: −0.67 to −0.07). Washing handsafter touching contaminated objects was significantly associated with lower DASS depression scores(B = −0.53, 95% CI: −0.96 to −0.10). The majority of respondents stayed at home for 20–24 h per day(84.7%) to avoid COVID-19.

Int. J. Environ. Res. Public Health 2020, 17, 1729 16 of 25
Table 5. Association between precautionary measures in the past 14 days and the psychological impact of the 2019 coronavirus disease (COVID-19) outbreak as well asadverse mental health status during the epidemic (n = 1210).
Variables n (%)Impact of Event Stress Anxiety Depression
R2 AR2 B (95% CI) R2 AR2 B (95% CI) R2 AR2 B (95% CI) R2 AR2 B (95% CI)
Covering mouth when coughing and sneezing
Always 694 (57.4)
0.009 0.006
0.02 (−0.34 to 0.37)
0.003 <0.001
0.02 (−0.19 to 0.23)
0.007 0.004
−0.19 (−0.52 to 0.14)
0.001 −0.002
−0.09 (−0.35 to 0.18)Most ofthe time 282 (23.3) 0.18 (−0.19 to 0.55) 0.09 (−0.13 to 0.31) −0.09 (−0.43 to 0.26) −0.04 (−0.32 to 0.24)
Sometime 106 (8.8) 0.40 (−0.02 to 0.82) 0.12 (−0.13 to 0.36) 0.09 (−0.30 to 0.47) 0.02 (−0.30 to 0.33)Occasionally 77 (6.3) 0.18 (−0.26 to 0.62) −0.03 (−0.29 to 0.23) −0.32 (−0.73 to 0.09) −0.02 (−0.35 to 0.31)
Never 51 (4.2) Reference Reference Reference Reference
Avoiding sharing of utensils (e.g., chopsticks) during meals
Always 490 (40.5)
0.041 0.037
−0.29 ** (−0.50 to −0.09)
0.017 0.013
−0.18 ** (−0.31 to −0.06)
0.017 0.013
−0.36 *** (−0.55 to−0.17)
0.016 0.013
−0.31 *** (−0.46 to−0.15)
Most ofthe time 207 (17.1) 0.17 (−0.07 to 0.40) 0.01 (−0.13 to 0.16) −0.03 (−0.26 to 0.19) −0.07 (−0.25 to 0.11)
Sometime 162 (13.4) 0.23 (−0.02 to 0.49) −0.02 (−0.17 to 0.14) −0.13 (−0.37 to 0.11) −0.20 * (−0.39 to −0.003)Occasionally 156 (12.9) 0.36 ** (0.10 to 0.62) 0.03 (−0.12 to 0.18) −0.14 (−0.38 to 0.11) −0.12 (−0.32 to 0.07)
Never 195 (16.1) Reference Reference Reference Reference
Washing hands with soap and water
Always 684 (56.5)
0.029 0.026
−0.42 (−0.85 to 0.01)
0.011 0.007
−0.34 ** (−0.60 to −0.09)
0.015 0.012
−0.54 ** (−0.94 to −0.14)
0.011 0.007
−0.39 * (−0.71 to −0.07)Most ofthe time 266 (22) −0.12 (−0.56 to 0.33) −0.29 * (−0.56 to −0.03) −0.40 (−0.81 to 0.02) −0.27 (−0.60 to 0.07)
Sometime 127 (10.5) 0.07 (−0.40 to 0.54) −0.22 (−0.50 to 0.07) −0.23 (−0.67 to 0.21) −0.25 (−0.61 to 0.10)Occasionally 100 (8.3) 0.13 (−0.35 to 0.62) −0.17 (−0.46 to 0.12) −0.21 (−0.67 to 0.24) −0.15 (−0.51 to 0.22)
Never 33 (2.7) Reference Reference Reference Reference
Washing hands immediately after coughing, rubbing nose, or sneezing
Always 496 (41)
0.042 0.039
−0.47 ** (−0.77 to −0.17)
0.02 0.016
−0.31 ** (−0.49 to −0.13)
0.22 0.019
−0.63 *** (−0.91 to−0.35)
0.021 0.018
−0.38 ** (−0.60 to −0.16)
Most ofthe time 227 (18.8) −0.003 (−0.32 to 0.32) −0.17 (−0.36 to 0.02) −0.44 ** (−0.74 to −0.14) −0.26 * (−0.50 to −0.02)
Sometime 227 (18.8) 0.02 (−0.30 to 0.34) −0.12 (−0.32 to 0.07) −0.41 ** (−0.71 to −0.11) −0.18 (−0.42 to 0.06)Occasionally 185 (15.2) 0.14 (−0.19 to 0.47) −0.08 (−0.28 to 0.12) −0.29 (−0.60 to 0.02) −0.04 (−0.29 to 0.20)
Never 75 (6.2) Reference Reference Reference Reference
Wearing mask regardless of the presence or absence of symptoms
Always 723 (59.8)
0.026 0.023
−0.19 (−0.59 to 0.21)
0.009 0.006
−0.21 (−0.45 to 0.02)
0.01 0.006
−0.43 * (−0.81 to −0.06)
0.015 0.012
−0.37 * (−0.67 to −0.07)Most ofthe time 263 (21.7) 0.12 (−0.30 to 0.53) −0.09 (−0.34 to 0.16) −0.27 (−0.66 to 0.12) −0.21 (−0.52 to 0.10)
Sometime 116 (9.6) 0.16 (−0.29 to 0.61) −0.08 (−0.35 to 0.19) −0.25 (−0.67 to 0.17) −0.25 (−0.59 to 0.08)Occasionally 69 (5.7) 0.52 * (0.04 to 1.01) −0.04 (−0.33 to 0.24) −0.14 (−0.60 to 0.31) 0.006 (−0.36 to 0.37)
Never 39(3.2) Reference Reference Reference Reference

Int. J. Environ. Res. Public Health 2020, 17, 1729 17 of 25
Table 5. Cont.
Variables n (%)Impact of Event Stress Anxiety Depression
R2 AR2 B (95% CI) R2 AR2 B (95% CI) R2 AR2 B (95% CI) R2 AR2 B (95% CI)
Washing hands after touching contaminated objects
Always 806 (66.6)
0.018 0.014
−0.11 (−0.69 to 0.47)
0.007 0.003
−0.21 (−0.56 to 0.13)
0.014 0.011
−0.52 (−1.06 to 0.02)
0.012 0.008
−0.53 * (−0.96 to −0.10)Most ofthe time 283 (23.4) 0.19 (−0.40 to 0.78) −0.15 (−0.49 to 0.21) −0.37 (−0.92 to 0.18) −0.41 (−0.85 to 0.03)
Sometime 66 (5.4) 0.40 (−0.25 to 1.04) −0.01 (−0.39 to 0.38) −0.03 (−0.63 to 0.58) −0.27 (−0.76 to 0.21)Occasional 37 (3.1) 0.31 (−0.39 to 1.00) −0.07 (−0.48 to 0.34) −0.22 (−0.87 to 0.43) 0.24 (−0.76 to 0.28)
Never 18 (1.5) Reference Reference Reference Reference
Feeling that too much unnecessary worry has been made about the COVID-19 outbreak
Always 156 (12.9)
0.019 0.016
−0.47 *** (−0.69 to −0.25)
0.002 −0.001
−0.08 (−0.21 to 0.05)
0.003 <0.001
0.12 (−0.09 to 0.33)
0.005 0.002
0.12 (−0.04 to 0.29)Most ofthe time 108 (8.9) −0.19 (−0.44 to 0.07) −0.05 (−0.20 to 0.11) 0.20 (−0.04 to 0.44) 0.20 * (0.003 to 0.39)
Sometime 242 (20) −0.03 (−0.21 to 0.16) −0.01 (−0.12 to 0.10) 0.07 (−0.10 to 0.25) 0.01 (−0.13 to 0.15)Occasionally 166 (13.7) 0.13 (−0.09 to 0.34) 0.03 (−0.10 to 0.16) 0.12 (−0.08 to 0.33) 0.10 (−0.07 to 0.26)
Never 538 (44.5) Reference Reference Reference Reference
Average number of hours staying at home per day to avoid COVID−19
[0–9] 39 (3.2)0.001 <0.001
−0.15 (−0.55 to 0.25)0.002 <0.001
−0.16 (−0.39 to 0.08)0.001 0.001
−0.15 (−0.52 to 0.22)0.002 0.001
−0.21 (−0.51 to 0.08)[10–19] 146 (12.1) 0.11 (−0.10 to 0.33) −0.03 (−0.16 to 0.10) −0.06 (−0.26 to 0.14) −0.08 (−0.24 to 0.08)[20–24] 1025 (84.7) Reference Reference Reference Reference
* p < 0.05; ** p < 0.01; *** p < 0.001.

Int. J. Environ. Res. Public Health 2020, 17, 1729 18 of 25
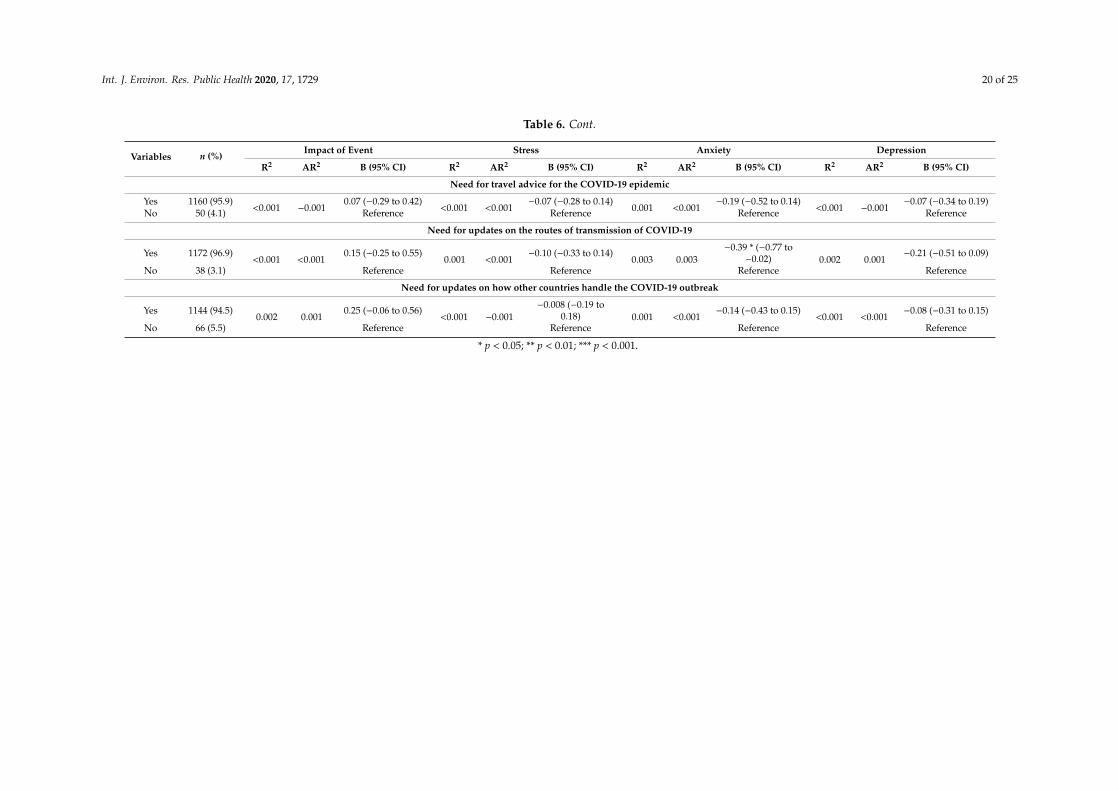
3.10. Additional Health Information Required and Psychological Impact
Table 6 shows additional health information required by respondents. Nearly all respondentsdesired additional information about COVID-19, most frequently with respect to the route oftransmission (96.9%), the availability and effectiveness of medicines/vaccines (96.8%), travel advice(95.9%), overseas experience in handling COVID-19 (94.5%), the number of infected cases and locations(94.1%), advice on prevention of the COVID-19(93.7%), more tailored information (e.g., for peoplewith chronic illnesses) (93.6%), outbreaks in the local area (92.7%), and details on symptoms ofCOVID-19 infection (91.6%). About 96.9% of respondents preferred regular updates for the latestinformation and these were found to be significantly associated with lower DASS anxiety subscalescores (B = −0.62, 95% CI: −1.00 to −0.24). Additional information on the availability and effectivenessof medicines/vaccines (B = −0.63, 95% CI: −0.99 to −0.26), the number of infections and locations(B = −0.30, 95% CI: −0.57 to −0.02), and the routes of transmission (B = −0.39, 95% CI: −0.77 to −0.02)were significantly associated with lower scores in DASS anxiety subscale. Additional information onavailability and effectiveness of medicines/vaccines was significantly associated with lower scores inthe DASS depression subscale (B = −0.35, 95% CI: −0.65 to −0.06).

Int. J. Environ. Res. Public Health 2020, 17, 1729 19 of 25
Table 6. Association between additional health information required by participants and the psychological impact of the 2019 coronavirus disease (COVID-19)outbreak as well as adverse mental health status during the epidemic (n = 1210).
Variables n (%)Impact of Event Stress Anxiety Depression
R2 AR2 B (95% CI) R2 AR2 B (95% CI) R2 AR2 B (95% CI) R2 AR2 B (95% CI)
Need for further health information about the COVID-19 infection
Yes 1048 (86.6)0.010 0.009
0.36 ** (0.15 to 0.57)0.003 0.002
0.12 * (0.00 to 0.24)0.002 0.001
0.16 (−0.03 to 0.35)0.001 <0.001
0. 1 (−0.06 to 0.25)No 162 (13.4) Reference Reference Reference Reference
Need for details on symptoms of the COVID−19 infection
Yes 1108 (91.6)0.006 0.005
0.34 ** (0.09 to 0.59)<0.001 −0.001
−0.02 (−0.17 to 0.13)0.001 <0.001
−0.12 (−0.36 to 0.11)0.001 <0.001
−0.11 (−0.30 to 0.08)No 102 (8.4) Reference Reference Reference Reference
Need for advice on prevention of the COVID−19 infection
Yes 1134 (93.7)0.010 0.009
0.52 *** (0.23 to 0.81)0.001 0.001
0.11 (−0.06 to 0.28)0.001 <0.001
0.13 (−0.14 to 0.40)<0.001 −0.001
0.05 (−0.17 to 0.26)No 76 (6.3) Reference Reference Reference Reference
Need for advice on treatment of the COVID−19 infection
Yes 1000 (82.6)0.003 0.003
0.19 * (0.006 to 0.38)<0.001 −0.001
0.03 (−0.08 to 0.14)<0.001 −0.001
0.03 (−0.14 to 0.20)<0.001 <0.001
−0.05 (−0.18 to 0.09)No 210 (17.4) Reference Reference Reference Reference
Need for regular updates for latest information about the COVID−19 infection
Yes 1173 (96.9)<0.001 −0.001
−0.03 (−0.44 to 0.38)0.001 <0.001
−0.11 (−0.35 to 0.13)0.008 0.008
−0.62 ** (−1.00 to−0.24) 0.003 0.002
−0.29 (−0.59 to 0.01)
No 37 (3.1) Reference Reference Reference Reference
Need for the latest updates for outbreaks of the COVID−19 infection in the local area
Yes 1122 (92.7)<0.001 −0.001
0.06 (−0.21 to 0.33)<0.001 −0.001
0.01 (−0.15 to 0.17)0.001 <0.001
−0.10 (−0.36 to 0.15)0.001 <0.001
0.09 (−0.11 to 0.30)No 88 (7.3) Reference Reference Reference Reference
Need for advice for people who may need more tailored information, such as those with pre-existing illness
Yes 1133 (93.6)0.001 0.001
0.19 (−0.10 to 0.48)<0.001 −0.001
0.004 (−0.17 to 0.17)0.001 <0.001
−0.14 (−0.41 to 0.13)<0.001 −0.001
−0.02 (−0.23 to 0.20)No 77 (6.4) Reference Reference Reference Reference
Need for information on the availability and effectiveness of medicines/vaccines for the COVID−19 infection
Yes 1171 (96.8)0.001 <0.001
0.19 (−0.21 to 0.59)0.002 0.001
−0.16 (−0.40 to 0.07)0.009 0.008
−0.63 ** (−0.99 to−0.26) 0.005 0.004
−0.35 * (−0.65 to−0.06)
No 39 (3.2) Reference Reference Reference Reference
Need for the latest updates on the number of people infected by COVID-19 and their location
Yes 1139 (94.1)0.001 <0.001
0.17 (−0.13 to 0.47)0.001 <0.001
−0.09 (−0.27 to 0.08)0.004 0.003
−0.30 * (−0.57 to−0.02) 0.001 <0.001
−0.13 (−0.35 to 0.10)
No 71 (5.9) Reference Reference Reference Reference
Int. J. Environ. Res. Public Health 2020, 17, 1729 20 of 25
Table 6. Cont.
Variables n (%)Impact of Event Stress Anxiety Depression
R2 AR2 B (95% CI) R2 AR2 B (95% CI) R2 AR2 B (95% CI) R2 AR2 B (95% CI)
Need for travel advice for the COVID-19 epidemic
Yes 1160 (95.9)<0.001 −0.001
0.07 (−0.29 to 0.42)<0.001 <0.001
−0.07 (−0.28 to 0.14)0.001 <0.001
−0.19 (−0.52 to 0.14)<0.001 −0.001
−0.07 (−0.34 to 0.19)No 50 (4.1) Reference Reference Reference Reference
Need for updates on the routes of transmission of COVID-19
Yes 1172 (96.9)<0.001 <0.001
0.15 (−0.25 to 0.55)0.001 <0.001
−0.10 (−0.33 to 0.14)0.003 0.003
−0.39 * (−0.77 to−0.02) 0.002 0.001
−0.21 (−0.51 to 0.09)
No 38 (3.1) Reference Reference Reference Reference
Need for updates on how other countries handle the COVID-19 outbreak
Yes 1144 (94.5)0.002 0.001
0.25 (−0.06 to 0.56)<0.001 −0.001
−0.008 (−0.19 to0.18) 0.001 <0.001
−0.14 (−0.43 to 0.15)<0.001 <0.001
−0.08 (−0.31 to 0.15)
No 66 (5.5) Reference Reference Reference Reference
* p < 0.05; ** p < 0.01; *** p < 0.001.

Int. J. Environ. Res. Public Health 2020, 17, 1729 21 of 25
4. Discussion
Our findings suggest that with respect to the initial psychological responses of the general publicfrom 31 January to 2 February 2020, just two weeks into the country’s outbreak of COVID-19 andone day after WHO declared public health emergency of international concern, 53.8% of respondentsrated the psychological impact of outbreak as moderate or severe; 16.5% of respondents reportedmoderate to severe depressive symptoms; 28.8% of respondents reported moderate to severe anxietysymptoms; and 8.1% reported moderate to severe stress levels. The prevalence of moderate or severepsychological impact as measured by IES-R was higher than the prevalence of depression, anxiety, andstress as measured by the DASS-21. The difference between IES-R and DASS-21 is due to the fact thatthe IES-R assesses the psychological impact after an event. In this study, respondents might refer theCOVID-19 outbreak as the event while the DASS-21 did not specify any such event.
In this study, the majority of respondents spent 20–24 h per day at home (84.7%), did notreport any physical symptoms (60.81%), and presented with good self-rated health status (68.3%).In this study, very few respondents had a direct or indirect contact history with individuals withconfirmed or suspected COVID-19, or had undergone medical consultations related to COVID-19(≤1%). The majority of respondents (>70%) were worried about their family members contractingCOVID-19, but they believed that they would survive if infected.
Overall, the Internet (93.5%) was the primary health information channel for the general publicduring the initial stage of COVID-19 epidemic in China. Nearly all respondents (>90%) requestedregular updates on the latest information on the route of transmission, availability and effectivenessof medicines/vaccines, travel advice, overseas experience in handling COVID-19, number of casesand location, advice on prevention, more tailored information (e.g., for people with chronic illnesses),information on outbreaks in the local area, and details on symptoms. The majority of respondents(>70%) were satisfied with the amount of health information available. More than half of therespondents washed their hands with soaps after touching contaminated objects, covered their mouthwhen coughing or sneezing, and wore masks regardless of the presence or absence of symptoms asprecaution strategies.
As the COVID-19 epidemic continues to spread, our findings will provide vital guidance for thedevelopment of a psychological support strategy and areas to prioritize in China and other places whichare affected by the epidemic. As the epidemic is ongoing, it is important to prepare health care systemsand the general public to be medically and psychologically ready if widespread transmission occursoutside China [32]. Our findings have clinical and policy implications. First, health authorities need toidentify high-risk groups based on sociodemographic information for early psychological interventions.Our sociodemographic data suggest that females suffered a greater psychological impact of the outbreakas well as higher levels of stress, anxiety, and depression. This finding corresponds to previouslyextensive epidemiological studies which found that women were at higher risk of depression [33].Students were also found to experience a psychological impact of the outbreak and higher levels ofstress, anxiety, and depression. As the total number of people infected by COVID-19 currently surpassesthose stricken by the 2003 SARS-CoV epidemic, major cities in China have shut down schools at alllevels indefinitely. The uncertainty and potential negative impact on academic progression could havean adverse effect on the mental health of students. During the epidemic, education authorities need todevelop online portals and web-based applications to deliver lectures or other teaching activities [34].As young people are more receptive towards smartphone applications [35], health authorities couldconsider providing online or smartphone-based psychoeducation and psychological interventions(e.g., cognitive behavior therapy, CBT) to reduce risk of virus transmission by face-to-face therapy.Online platforms could also provide a support network for those people spending most of their timeat home during the epidemic. We found that the general public with no formal education had agreater likelihood of depression during the epidemic. Local agencies need to provide information in adiagrammatic or audio format in simple languages to support those with no educational backgroundduring the epidemic.

Int. J. Environ. Res. Public Health 2020, 17, 1729 22 of 25
Second, health authorities need to identify the immediate psychological needs of the generalpopulation presenting with physical symptoms during the epidemic. Our results revealed that thegeneral population presenting with specific symptoms including chills, coryza, cough, dizziness,myalgia, and sore throat, as well as those with poor self-rated health status and history of chronicillnesses, experienced a psychological impact of the outbreak and higher levels of stress, anxiety, anddepression. After presentation to the clinic or hospital with the above physical symptoms, patients maybe sent home, quarantined, or admitted for further investigation. Health professionals should take theopportunity to provide resources for psychological support and interventions for those who presentwith the above symptoms, especially during hospitalization. Taking a family history is essential, andhealth professionals should enquire about the level of concern for other family members, especiallychildren, of contracting COVID-19, as these concerns are associated with stress and anxiety, respectively.
Third, government and health authorities need to provide accurate health information during theepidemic to reduce the impact of rumors [23]. Higher satisfaction with the health information receivedwas associated with a lower psychological impact of the outbreak and lower levels of stress, anxiety,and depression. The content of health information provided during the epidemic needs to be based onevidence to avoid adverse psychological reactions. Our results showed that up-to-date and accuratehealth information, especially on the number of recovered individuals, was associated with lowerstress levels. Additional information on medicines or vaccines, routes of transmission, and updates onthe number of infected cases and location (e.g., real-time, online tracking map) were associated withlower levels of anxiety.
Fourth, the content of psychological interventions (for example CBT) needs to be modified tosuit the needs of the general population during the epidemic. CBT should preferably be deliveredonline or via telephone to avoid the spread of infection. As online CBT does not require the presence ofmental health professionals (e.g., psychologists), this will be helpful to the general public in China asthere is a shortage of psychologists. Based on our findings, cognitive therapy can provide informationor evidence to enhance confidence in the doctor’s ability to diagnose COVID-19. Cognitive therapycan challenge cognitive bias when recipients overestimate the risk of contracting and dying fromCOVID-19. As the majority of the general population in this study was homebound for 20–24 h perday during the epidemic, behavior therapy could focus on relaxation exercises to counteract anxietyand activity scheduling (e.g., home-based exercise and entertainment) to counteract depression inthe home environment. Self-administered acupressure and emotional freedom techniques derivedfrom key principles within traditional Chinese medicine are potential interventions which may benefitthe mental health of general public during the COVID-19 outbreak. Further research Is required toevaluate the effectiveness of these interventions.
Fifth, our findings suggest that the precautionary measures adopted to prevent the spread ofCOVID-19 could have had protective psychological effects during the early stage of the epidemic.During the 2003 SARS-CoV epidemic, researchers found that moderate levels of anxiety were associatedwith higher uptake of preventive measures by respondents [21]. Our findings showed the oppositetrend. Specific precautionary measures including avoidance of sharing utensils (e.g., chopsticks), handhygiene, and wearing masks regardless of the presence or absence of symptoms were associated withlower levels of psychological impact, depression, anxiety, and stress. The experiences of the 2003SARS-CoV epidemic could have changed the perception of the general public towards precautionarymeasures and have led to a positive effect on the initial psychological responses to the COVID-19epidemic by giving respondents confidence and sense of control in prevention. As the Chineseprefer to use chopsticks to pick up food commonly shared on a plate during mealtime as part oftheir culture, it is not unexpected that avoidance of sharing utensils (e.g., chopsticks) during mealsis significantly associated with less psychological impact and lower levels of anxiety, depression,and stress. During the initial stage of the COVID-19 epidemic, health authorities outside China haddifferent recommendations for mask usage due to a global shortage of masks. While some healthauthorities urged citizens not to wear masks if they were well (e.g., Singapore), other health authorities

Int. J. Environ. Res. Public Health 2020, 17, 1729 23 of 25
urged their citizens to always have masks and hand sanitizers ready (e.g., Malaysia, Vietnam) [36].The official guidance from the World Health Organization (WHO) advises that healthy people shouldonly wear masks if they are taking care of a person with suspected COVID-19 infection or if peopleare coughing and sneezing [37]. Our study found that wearing masks, regardless of the presence orabsence of symptoms, was associated with lower levels of anxiety and depression. Although the WHOemphasizes that masks are effective only when used in combination with frequent hand-cleaning withalcohol-based hand rub or soap and water, wearing a mask regardless of the presence or absence ofsymptoms could offer potential psychological benefits by offering a sense of security. This findingwas anticipated because wearing face masks is a common practice when people are sick or to counterurban pollution or haze in parts of Asia, including China [38]. Governments and health authoritiesshould ensure there are infrastructures to produce and provide an adequate supply of masks, soaps,alcohol-based hand rubs, and other personal hygiene products during the COVID-19 epidemic.
This study has several limitations. Given the limited resources available and time-sensitivityof the COVID-19 outbreak, we adopted the snowball sampling strategy. The snowballing samplingstrategy was not based on a random selection of the sample, and the study population did not reflectthe actual pattern of the general population. Furthermore, it would be ideal to conduct a prospectivestudy on the same group of participants after a period. Due to ethical requirements on anonymityand confidentiality, we were not allowed to collect contact details and personal information from therespondents. As a result, we could not conduct a prospective study that would provide a concretefinding to support the need for a focused public health initiative. There was an oversampling of aparticular network of peers (e.g., students), leading to selection bias. As a result, the conclusion wasless generalizable to the entire population, particularly less educated people. Another limitation isthat self-reported levels of psychological impact, anxiety, depression and stress may not always bealigned with assessment by mental health professionals. Similarly, respondents might have providedsocially desirable responses in terms of the satisfaction with the health information received andprecautionary measures. Lastly, the number of respondents with contact history and who had soughtmedical consultations was very small. Our findings could not be generalized to confirmed or suspectedcases of COVID-19. Notwithstanding the above limitations, this study provides invaluable informationon the initial psychological responses 2 weeks after the outbreak of COVID-19 from respondents across194 cities in China. Our results could be used as a historical reference. Most importantly, our findingsdirectly inform the development of psychological interventions that can minimize psychologicalimpact, anxiety, depression, and stress during the outbreak of COVID-19 and provide a baseline forevaluating prevention, control, and treatment efforts throughout the remainder of the COVID-19epidemic, which is still ongoing at the time of preparing this manuscript.
5. Conclusions
During the initial phase of COVID-19 outbreak in China, more than half of the respondents ratedtheir psychological impact as moderate-to-severe, and about one-third reported moderate-to-severeanxiety. Female gender, student status, and specific physical symptoms were associated with a greaterpsychological impact of the outbreak and higher levels of stress, anxiety, and depression. Specificup-to-date and accurate health information and certain precautionary measures were associated witha lower psychological impact of the outbreak and lower levels of stress, anxiety, and depression.Our findings can be used to formulate psychological interventions to improve mental health andpsychological resilience during the COVID-19 epidemic.
Author Contributions: Conceptualization, C.W., R.P., and R.H.; methodology, C.W., R.P., and R.H.; validation,C.W., R.P., and L.X.; resources, C.W.; data curation, X.W., Y.T., and L.X.; formal analysis, C.W., R.P., X.W., Y.T.,and L.X.; writing—original draft preparation, C.W., R.P., C.S.H., and R.C.H.; writing—review and editing, C.W.,C.S.H., and R.C.H.; visualization, X.W., Y.T., and L.X.; supervision, C.W., R.P., and R.C.H.; project administration,C.W.; All authors have read and agreed to the published version of the manuscript.
Funding: There was no funding for this study.

Int. J. Environ. Res. Public Health 2020, 17, 1729 24 of 25
Conflicts of Interest: The authors declare no conflict of interest.
References
1. Wang, C. A novel coronavirus outbreak of global health concern. Lancet 2020, 395, 470–473. [CrossRef]2. Hawryluck, L. SARS control and psychological effects of quarantine, Toronto, Canada. Emerg. Infect. Dis.
2004, 10, 1206–1212. [CrossRef] [PubMed]3. Nishiura, H. The Extent of Transmission of Novel Coronavirus in Wuhan, China, 2020. J. Clin. Med. 2020, 9,
330. [CrossRef] [PubMed]4. Mahase, E. China coronavirus: WHO declares international emergency as death toll exceeds 200. BMJ Clin.
Res. Ed. 2020, 368, m408. [CrossRef] [PubMed]5. Paules, C.I.; Marston, H.D.; Fauci, A.S. Coronavirus Infections-More Than Just the Common Cold. JAMA
2020. [CrossRef]6. Huang, C. Clinical features of patients infected with 2019 novel coronavirus in Wuhan, China. Lancet 2020,
395, 497–506. [CrossRef]7. Cao, Z. Estimating the effective reproduction number of the 2019-nCoV in China. medRxiv 2020. [CrossRef]8. Zhao, S. Estimating the Unreported Number of Novel Coronavirus (2019-nCoV) Cases in China in the First
Half of January 2020: A Data-Driven Modelling Analysis of the Early Outbreak. J. Clin. Med. 2020, 9, 388.[CrossRef]
9. Li, Q. Early Transmission Dynamics in Wuhan, China, of Novel Coronavirus-Infected Pneumonia. N. Engl.J. Med. 2020. [CrossRef]
10. Rothe, C. Transmission of 2019-nCoV Infection from an Asymptomatic Contact in Germany. N. Engl. J. Med.2020. [CrossRef]
11. Ryu, S.; Chun, B.C. Korean Society of Epidemiology-nCo, an interim review of the epidemiologicalcharacteristics of 2019 novel coronavirus. Epidemiol. Health 2020, 42, e2020006. [CrossRef] [PubMed]
12. Chen, N. Epidemiological and clinical characteristics of 99 cases of 2019 novel coronavirus pneumonia inWuhan, China: A descriptive study. Lancet 2020, 395, 507–513. [CrossRef]
13. Holshue, M.L. First Case of 2019 Novel Coronavirus in the United States. N. Engl. J. Med. 2020. [CrossRef][PubMed]
14. Nishiura, H. The Rate of Underascertainment of Novel Coronavirus (2019-nCoV) Infection: Estimation UsingJapanese Passengers Data on Evacuation Flights. J. Clin. Med. 2020, 9, 419. [CrossRef]
15. Horton, R. Offline: 2019-nCoV—“A desperate plea”. Lancet 2020, 395, 400. [CrossRef]16. Xiang, Y.-T. Timely mental health care for the 2019 novel coronavirus outbreak is urgently needed. Lancet
Psychiatry 2020, 7, 228–229. [CrossRef]17. Hall, R.C.W.; Chapman, M.J. The 1995 Kikwit Ebola outbreak: Lessons hospitals and physicians can apply to
future viral epidemics. Gen. Hosp. Psychiatry 2008, 30, 446–452. [CrossRef]18. Rubin, G.J.; Potts, H.W.W.; Michie, S. The impact of communications about swine flu (influenza A H1N1v)
on public responses to the outbreak: Results from 36 national telephone surveys in the UK. Health Technol.Assess. 2010, 14, 183–266. [CrossRef]
19. Van Bortel, T. Psychosocial effects of an Ebola outbreak at individual, community and international levels.Bull. World Health Organ. 2016, 94, 210–214. [CrossRef]
20. Sim, K. Psychosocial and coping responses within the community health care setting towards a nationaloutbreak of an infectious disease. J. Psychosom. Res. 2010, 68, 195–202. [CrossRef]
21. Leung, G.M. The impact of community psychological responses on outbreak control for severe acuterespiratory syndrome in Hong Kong. J. Epidemiol. Community Health 2003, 57, 857–863. [CrossRef] [PubMed]
22. Lu, R. Genomic characterisation and epidemiology of 2019 novel coronavirus: Implications for virus originsand receptor binding. Lancet 2020. [CrossRef]
23. Rubin, G.J.; Wessely, S. The psychological effects of quarantining a city. BMJ Clin. Res. Ed. 2020, 368, m313.[CrossRef] [PubMed]
24. Leung, G.M. Community psycho-behavioural surveillance and related impact on outbreak control in HongKong and Singapore during the SARS epidemic. Hong Kong Med. J. 2009, 15 (Suppl. S9), 30–34.
25. Zhang, M.W. Usage of social media and smartphone application in assessment of physical and psychologicalwell-being of individuals in times of a major air pollution crisis. JMIR mHealth uHealth 2014, 2, e16. [CrossRef]

Int. J. Environ. Res. Public Health 2020, 17, 1729 25 of 25
26. Zhang, M.W.B. Methodology of developing a smartphone application for crisis research and its clinicalapplication. Technol. Health Care Off. J. Eur. Soc. Eng. Med. 2014, 22, 547–559. [CrossRef]
27. Creamer, M.; Bell, R.; Failla, S. Psychometric properties of the Impact of Event Scale-Revised. Behav. Res.Ther. 2003, 41, 1489–1496. [CrossRef]
28. Le, T.A. Multi-level predictors of psychological problems among methadone maintenance treatment patientsin difference types of settings in Vietnam. Subst. Abus. Treat. Prev. Policy 2019, 14, 39. [CrossRef]
29. Ho, C.S.H. Relationship of Anxiety and Depression with Respiratory Symptoms: Comparison betweenDepressed and Non-Depressed Smokers in Singapore. Int. J. Environ. Res. Public Health 2019, 16, 163.[CrossRef]
30. Quek, T.C. Misophonia in Singaporean Psychiatric Patients: A Cross-Sectional Study. Int. J. Environ. Res.Public Health 2018, 15, 1410. [CrossRef]
31. McAlonan, G.M. Immediate and sustained psychological impact of an emerging infectious disease outbreakon health care workers. Canadian journal of psychiatry. Revue Canadienne De Psychiatrie 2007, 52, 241–247.[PubMed]
32. Patel, A.; Jernigan, D.B. Initial Public Health Response and Interim Clinical Guidance for the 2019 NovelCoronavirus Outbreak—United States, 31 December 2019–4 February 2020. MMWR Morb. Mortal. Wkly. Rep.2020, 69, 140–146. [CrossRef] [PubMed]
33. Lim, G.Y. Prevalence of Depression in the Community from 30 Countries between 1994 and 2014. Sci. Rep.2018, 8, 2861. [CrossRef] [PubMed]
34. Zhang, M.W.B.; Ho, C.S.H.; Ho, R.C.M. Methodology of development and students’ perceptions of apsychiatry educational smartphone application. Technol. Health Care Off. J. Eur. Soc. Eng. Med. 2014, 22,847–855. [CrossRef]
35. Do, T.T.T. Receptiveness and preferences of health-related smartphone applications among Vietnamese youthand young adults. BMC Public Health 2018, 18, 764. [CrossRef]
36. Geddie, J.S.J. To Mask or Not to Mask: Confusion Spreads over Coronavirus Protection. 31 January2020. Available online: https://uk.reuters.com/article/us-china-health-masks-safety/to-mask-or-not-to-mask-confusion-spreads-over-coronavirus-protection-idUKKBN1ZU0PH (accessed on 8 February 2020).
37. Organisation, W.H. Novel Coronavirus (2019-nCoV) Advice for the Public: When and How to Use Masks.2020. Available online: https://www.who.int/emergencies/diseases/novel-coronavirus-2019/advice-for-public/when-and-how-to-use-masks (accessed on 8 February 2020).
38. Ho, R.C. Impact of 2013 south Asian haze crisis: Study of physical and psychological symptoms andperceived dangerousness of pollution level. BMC Psychiatry 2014, 14, 81. [CrossRef]
© 2020 by the authors. Licensee MDPI, Basel, Switzerland. This article is an open accessarticle distributed under the terms and conditions of the Creative Commons Attribution(CC BY) license (http://creativecommons.org/licenses/by/4.0/).