IMI Work Package 5: Report 2:b:iv Benefit - Risk Wave 2 ... · () under Grant Agreement n° 115004,...
96
Pharmacoepidemiological Research on Outcomes of Therapeutics by a European ConsorTium Version one dates 08 Mars 2013 Date of any subsequent amendments below Person making amendments Brief description of amendments Christine Hallgreen, Rianne van den Ham, Simon Ashworth, Alain Micaleff, Richard Hermann, Steve Hobbiger, Davide Luciani, Shahrul Mt-Isa,, Andrew Thomson, Nan Wang, Tjeerd van Staa , Lesley Wise, On behalf of PROTECT Work Package 5 participants Disclaimer: The processes described and conclusions drawn from the work presented herein relate solely to the testing of methodologies and representations for the evaluation of benefit and risk of medicines. This report neither replaces nor is intended to replace or comment on any regulatory decisions made by national regulatory agencies, nor the European Medicines Agency Acknowledgements: The research leading to these results was conducted as part of the PROTECT consortium (Pharmacoepidemiological Research on Outcomes of Therapeutics by a European ConsorTium, www.imi- protect.eu) which is a public-private partnership coordinated by the European Medicines Agency. The PROTECT project has received support from the Innovative Medicines Initiative Joint Undertaking (www.imi.europa.eu) under Grant Agreement n° 115004, resources of which are composed of financial contribution from the European Union's Seventh Framework Programme (FP7/2007-2013) and EFPIA companies’ in kind contribution IMI Work Package 5: Report 2:b:iv Benefit - Risk Wave 2 Case Study Report: Warfarin 08/03/2013
Transcript of IMI Work Package 5: Report 2:b:iv Benefit - Risk Wave 2 ... · () under Grant Agreement n° 115004,...
Pharmacoepidemiological Research on Outcomes of Therapeutics by a European ConsorTium
Version one dates 08 Mars
2013
Date of any subsequent
amendments below Person making amendments
Brief description of
amendments
Christine Hallgreen, Rianne van den Ham, Simon Ashworth, Alain Micaleff, Richard Hermann, Steve Hobbiger,
Davide Luciani, Shahrul Mt-Isa,, Andrew Thomson, Nan Wang, Tjeerd van Staa , Lesley Wise,
On behalf of PROTECT Work Package 5 participants
Disclaimer: The processes described and conclusions drawn from the work presented herein relate solely to
the testing of methodologies and representations for the evaluation of benefit and risk of medicines. This
report neither replaces nor is intended to replace or comment on any regulatory decisions made by national
regulatory agencies, nor the European Medicines Agency
Acknowledgements: The research leading to these results was conducted as part of the PROTECT consortium
(Pharmacoepidemiological Research on Outcomes of Therapeutics by a European ConsorTium, www.imi-
protect.eu) which is a public-private partnership coordinated by the European Medicines Agency.
The PROTECT project has received support from the Innovative Medicines Initiative Joint Undertaking
(www.imi.europa.eu) under Grant Agreement n° 115004, resources of which are composed of financial
contribution from the European Union's Seventh Framework Programme (FP7/2007-2013) and EFPIA
companies’ in kind contribution
IMI Work Package 5: Report 2:b:iv Benefit - Risk
Wave 2 Case Study Report: Warfarin
08/03/2013

Pharmacoepidemiological Research on Outcomes of Therapeutics by a European ConsorTium
Pharmacoepidemiological Research on Outcomes of Therapeutics by a European ConsorTium
3
Contents
Contents ............................................................................................................................................................................ 3
Abbreviations ................................................................................................................................................................ 6
1 Introduction ................................................................................................................................................................... 6
1.1 Atrial fibrillation disease background ..................................................................................................................... 6
1.2 Available treatment options ................................................................................................................................... 6
1.3 Benefit-risk methodologies ..................................................................................................................................... 8
1.3.1 BRAT ................................................................................................................................................................. 8
1.3.2 SMAA ................................................................................................................................................................ 8
1.4 Aims and objectives ................................................................................................................................................ 8
2 Work stream 1: Warfarin versus placebo/control ....................................................................................................... 10
2.1 Introduction .......................................................................................................................................................... 10
2.2 Decision context .................................................................................................................................................... 10
2.3 Identify outcomes ................................................................................................................................................. 10
2.4 Identify and extract data sources ......................................................................................................................... 12
2.5 Customise framework ........................................................................................................................................... 15
2.6 Assess outcome importance ................................................................................................................................. 16
2.7 Quantify and interpret key benefit-risk metrics ................................................................................................... 16
2.7.1 Exploring the benefit-risk balance using SMAA ............................................................................................. 19
2.8 Uncertainty ........................................................................................................................................................... 22
2.9 Decision and communication of benefit-risk assessment .................................................................................... 26
2.10 Discussion ............................................................................................................................................................ 27
3 Section 3: Work stream 2 – Warfarin versus Active Comparators .............................................................................. 28
3.1 Introduction .......................................................................................................................................................... 28
3.2 Decision context .................................................................................................................................................... 28
3.3 Identify outcomes ................................................................................................................................................. 29
3.4 Identify and extract data sources ......................................................................................................................... 29
3.5 Customise framework ........................................................................................................................................... 30
3.6 Assess outcome importance ................................................................................................................................. 31
3.7 Quantify and interpret key benefit-risk metric ..................................................................................................... 32
3.7.1 Warfarin versus Dabigatran ........................................................................................................................... 32
3.7.2 Warfarin versus Apixaban .............................................................................................................................. 34
Pharmacoepidemiological Research on Outcomes of Therapeutics by a European ConsorTium
4
3.7.3 Warfarin versus rivaroxaban .......................................................................................................................... 36
3.8 Uncertainty ........................................................................................................................................................... 36
3.9 Decision and communication of benefit-risk assessment .................................................................................... 38
3.10 Discussion ............................................................................................................................................................ 38
4 Section 4: Individual benefit risk assessments for warfarin using patient level data .................................................. 39
4.1 Introduction .......................................................................................................................................................... 39
4.2 Methods ................................................................................................................................................................ 39
4.2.1 Data source .................................................................................................................................................... 39
4.2.2 Study design ................................................................................................................................................... 40
4.2.3 Study population ............................................................................................................................................ 40
4.2.4 Outcomes ....................................................................................................................................................... 40
4.2.5 Individual benefit-risk balance ....................................................................................................................... 40
4.3 Results ................................................................................................................................................................... 42
4.4 Conclusion ............................................................................................................................................................. 51
4.5 Discussion .............................................................................................................................................................. 51
5 Section 5 ....................................................................................................................................................................... 55
5.1 Overall Discussion ................................................................................................................................................. 55
6 References.................................................................................................................................................................... 57
7 Appendices ................................................................................................................................................................... 64
7.1 Appendix 1: WS1 Literature search Strategy ........................................................................................................ 64
7.1.1 Search algorithm ............................................................................................................................................ 65
7.2 Appendix 2: Summary of randomised clinical trials .............................................................................................. 66
7.2.1 AFASAK ........................................................................................................................................................... 66
7.2.2 CAFA ............................................................................................................................................................... 67
7.2.3 EAFT................................................................................................................................................................ 68
7.2.4 SPAF................................................................................................................................................................ 69
7.2.5 BAATA............................................................................................................................................................. 70
7.2.6 SPINAF ............................................................................................................................................................ 71
7.2.7 RE-LY ............................................................................................................................................................... 73
7.2.8 ROCKET-AF ..................................................................................................................................................... 74
7.2.9 ARISTOTLE ...................................................................................................................................................... 75
7.3 Appendix 3: Iterative process to define value tree/effect table ........................................................................... 77
7.3.1 First iteration .................................................................................................................................................. 77
Pharmacoepidemiological Research on Outcomes of Therapeutics by a European ConsorTium
5
7.3.2 Second iteration ............................................................................................................................................. 79
7.4 Appendix 4: SMAA analysis using JSMAA software .............................................................................................. 88
7.4.1 Data ................................................................................................................................................................ 88
7.4.2 Value function ................................................................................................................................................ 89
7.4.3 Weights .......................................................................................................................................................... 91
7.4.4 Results ............................................................................................................................................................ 92
Pharmacoepidemiological Research on Outcomes of Therapeutics by a European ConsorTium
6
Abbreviations
CPRD Clinical Practice Research Datalink
HES Hospital Episodes Statistics
RCT Randomised clinical trial
TIA Transient ischaemic attack
AF Atrial Fibrillation
CI Cumulative Incidence
RR Relative Rate
AFASAK
BAATAF Boston Area Anticoagulation Trial for Atrial Fibrillation
CAFA Canadian Atrial Fibrillation Anticoagulation
SPIN I Stroke Prevention in Atrial Fibrillation
SPINAF Stroke Prevention in Nonrheumatic Atrial Fibrillation
EAFT European Atrial Fibrillation Trial
1 Introduction
1.1 Atrial fibrillation disease background Atrial fibrillation has a prevalence ranging from 0.1% in those under 55 years of age, 3.8% in those over the age of
60, and 9.0% in those over the age of 80 years (1). Patients with atrial fibrillation often have blood clot formation
within the heart atrium, due to abnormal blood flow through the heart. These blood clots can produce emboli
resulting in ischaemic stroke, which are often associated with death or severe disability (2,3). It is estimated that the
incidence of ischaemic stroke in patients with atrial fibrillation is 3–5% per year, rising to 12–15% in patients with
additional risk factors for stroke, including hypertension, diabetes, recent onset cardiac failure, or a prior transient
ischaemic attack (TIA) (4) .
In patients who have experienced an ischaemic stroke, 15% to 25% have atrial fibrillation (5). Those with untreated
atrial fibrillation who have experienced a prior stroke are at considerable risk of additional ischemic strokes, with an
average recurrent stroke rate of 13% per year (6).
1.2 Available treatment options Prevention of stroke (primary prevention) or prevention of a recurrent stroke (secondary prevention), in patients
with atrial fibrillation is through the use of drugs, such as anticoagulants, that interfere with the ability of the blood
to produce a clot. The principle being that disruption of the clotting pathways will lead to a delay, or reduction in
clot formation within the atria of the heart, thereby preventing cerebral emboli. Reducing the ability of the blood to
Pharmacoepidemiological Research on Outcomes of Therapeutics by a European ConsorTium
7
clot however carries a risk of bleeding, including cerebral haemorrhage. Anti-platelet drugs, such as aspirin, have
been historically used, but have been shown to be of less value than anticoagulants (7).
Warfarin is the most common anticoagulant currently used to prevent stroke in patients with atrial fibrillation.
Warfarin was originally approved for this indication over 50 years ago. The active substance (dicoumarol) was first
identified in farm animals which had eaten Sweet-Clover contaminated hay, and then experienced fatal
haemorrhages. To this day, warfarin is still used as a rat poison.
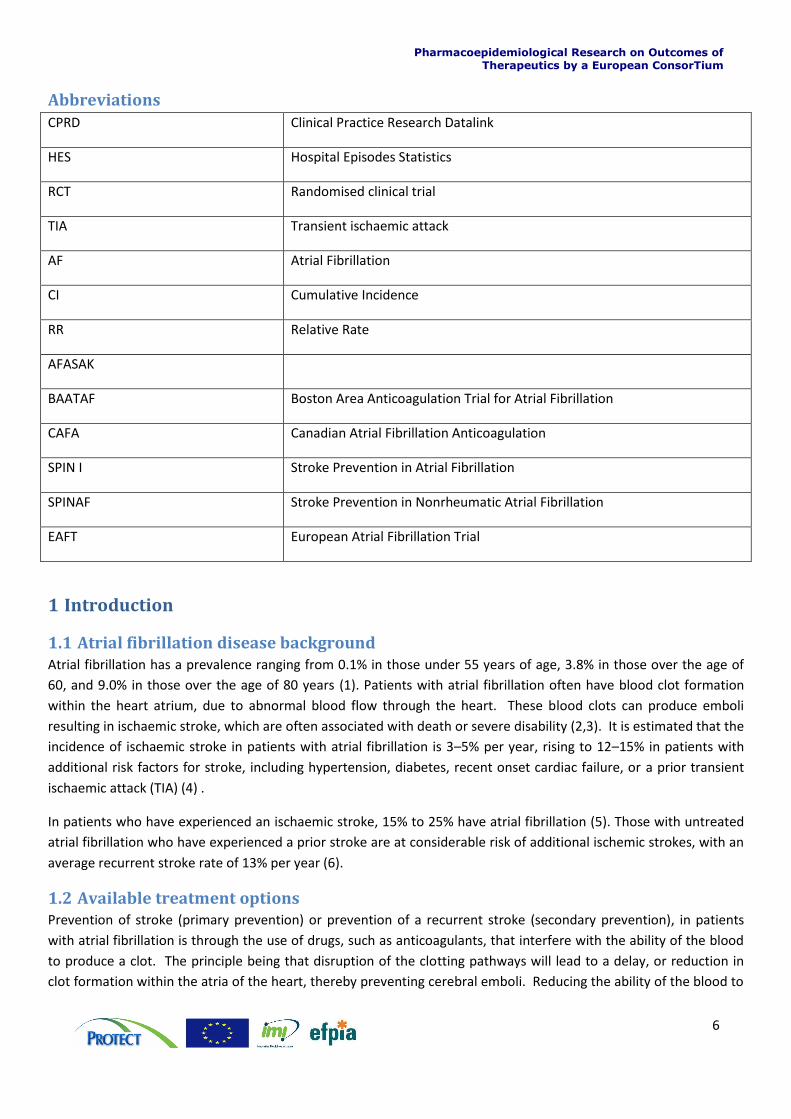
Warfarin affects blood coagulation by inhibiting the enzyme ‘vitamin K epoxide reductase’, which results in a
reduction of several blood coagulation proteins, particularly prothrombin and factor VII, leading to a prolongation in
the production of a thrombin clot (figure 1). As there is a dose response on the enzyme inhibition, larger doses of
warfarin will lead to a greater reduction in Vitamin K dependent coagulation proteins, and a greater prolongation in
the production of a thrombin clot. Unfortunately because there are many factors that influence the effect of
warfarin, including other medications, herbal supplements, diet, physical health, age and individual variations in liver
metabolism, the daily dose of warfarin has to be determined by an individual’s response. In addition, once a daily
dose is determined, this will need to be continually monitored, as the dose may need to be increased or decreased
over time. This monitoring requires regular interactions between patients and health care professional and regular
blood tests. Some patients have more consistent dosing requirements than others.
Figure 1: Schematic overview of the mechanism of warfarin’s anticoagulation effect
Pharmacoepidemiological Research on Outcomes of Therapeutics by a European ConsorTium
8
Therapeutic guidelines recommend that patients with atrial fibrillation on warfarin have an INR (International
Normalised Ratio) kept between 2-3 (7,8). This effectively means that the patient’s blood will take 2-3 times longer
to form a thrombin clot. Patients with atrial fibrillation with an INR less than 2 are still at risk of ischemic stroke,
whereas the risk of bleeding increases as the INR increases (9). The most significant of these bleeds are intracranial
haemorrhages, of which the majority (70%) are intracerebral haematomas. A significant proportion (60%) of these
anticoagulant associated intracerebral haematomas are fatal, which is a higher fatality rate to that seen with
ischemic stroke (10).
Despite having been available for over 50 years, and the clinical and patient inconvenience of the associated
monitoring, it has only been in the last few years that alternatives to warfarin for the prevention of ischemic stroke
in patients with atrial fibrillation have become available. These new oral drugs also interfere with clotting enzymes
(such as thrombin or factor-Xa inhibitors), but as this inhibition is more specific, and as they are not affected by
Vitamin K, or other factors that influence the effect of warfarin, they do not require routine monitoring.
1.3 Benefit-risk methodologies
1.3.1 BRAT
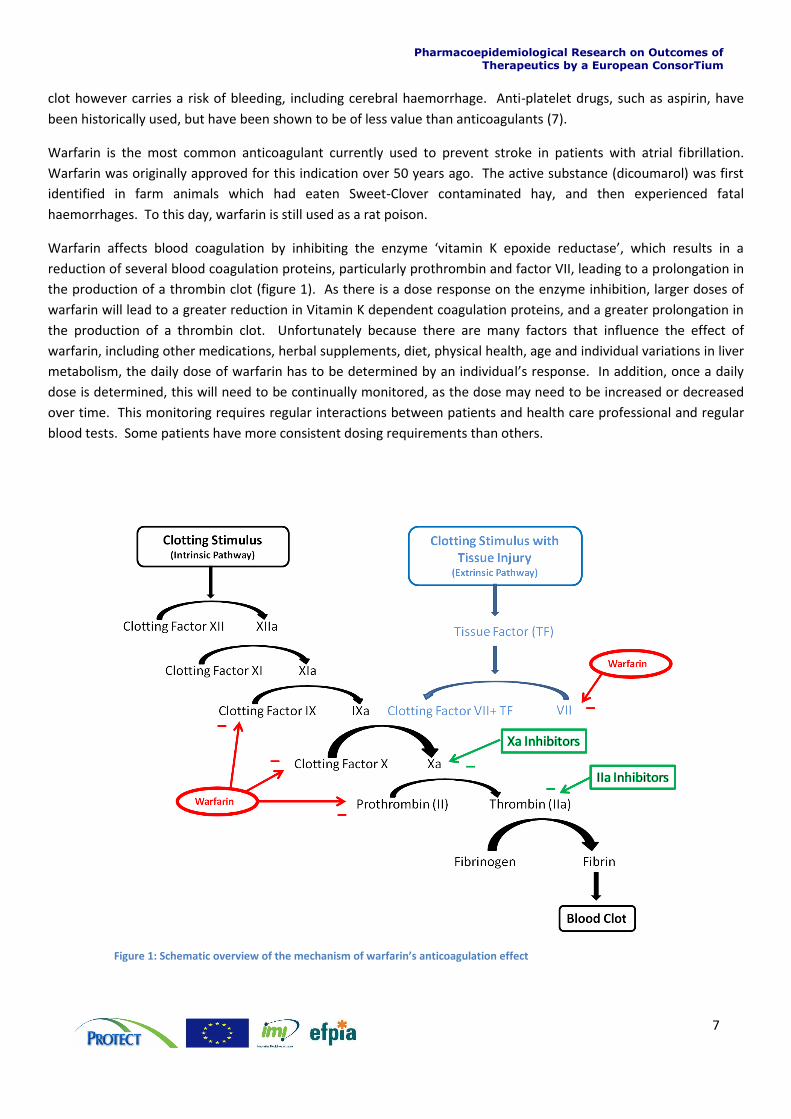
The BRAT framework was developed by Pharmaceutical Research and Manufactures of America (PhRMA) benefit-
risk action team (BRAT). BRAT provides a guideline on organising, understanding and summarising evidence of
benefits and risks. The framework consists of 6 steps (see figure 2). For more information on the BRAT framework
we refer to the PROTECT WP5 Benefit-risk Integration and Representation, A systematic review and classification of
Methodologies for Benefit-risk Decision-Making in Medicines (11).
Figure 2: The 6 steps of the BRAT framework
1.3.2 SMAA
Stochastic Multi-criteria (-objective) Acceptability Analysis (SMAA) can be seen as an extension of Multi-criteria
Decision Analysis (MCDA). As in MCDA, SMAA provides integrated benefit-risk weighted utility scores (overall
benefit-risk score) for each alternative and ranks the different options. Understanding the principles of SMAA
requires mathematical understanding of stochastic phenomena and uncertainty. The SMAA model for this case study
will be implemented in the open-source software JSMAA. For more information on SMAA we refer to the PROTECT
WP5 Benefit-risk Integration and Representation, A systematic review and classification of Methodologies for
Benefit-risk Decision-Making in Medicines (11).
1.4 Aims and objectives This case study aims to investigate the difficulties that may be encountered when undertaking a benefit-risk
assessment for an older medicinal product with well-established use. To assess the difficulties of doing a benefit-risk
Pharmacoepidemiological Research on Outcomes of Therapeutics by a European ConsorTium
9
assessment for an older medicine, we applied the BRAT framework (see section 1.3.1 BRAT) to a case study assessing
the benefit-risk balance of warfarin for the treatment of atrial fibrillation.
We illustrated how formal benefit-risk methodologies can be applied to older medicinal products where clinical trial
data to current standards may not be available. Methods to deal with the issues of the timing of benefit and risk
events are also investigated. The timing issue is common in benefit-risk assessment of medicines, for example the
time horizon to achieve a benefit (e.g. avoidance of ischaemic stroke) is much longer than the time horizon for a
patient to experience some of the unfavourable outcomes such as bleeding. We also investigate where there is a
need for a regular healthcare intervention to ensure that benefit-risk balance remains positive by measuring the
impact on anticoagulation.
The benefit-risk assessment of warfarin was carried out in three stages, with increasing complexity: work stream 1
(Section 2 Work stream 1: Warfarin versus placebo/control), work stream 2 (In work stream 1 the benefit-risk
assessment of warfarin versus control was done based on data from 5 older randomised trials. The availability of
data did play a role in the definition of benefit-risk criteria and the value tree (see Appendix 3: Iterative process to
define value tree/effect table). A consequence of this was a grouping of endpoints into broader defined benefit-risk
criteria and difficulties in trading off benefit and risk criteria. The quantitative analysis was used to test the effect of
different weights for the risk criteria ‘major haemorrhage’ and to take into account the large uncertainty related to
the small sample size of the RCTs.
The weighting of benefit-risk criteria was done based on information available in the literature. However, such
information might not always be available, in this case it is also important to emphasise that the assessment of
outcome importance and weight elicitation should always represent the decision maker’s opinion.
Observational studies were used to evaluate if the benefit-risk balance based on data from RCTs could be considered
valid in the actual practice. This analysis showed a fairly good agreement between what was observed in the RCTs
and in the observational studies, but also flagged that some groups (e.g. high age > 80 years) might have a less
favourable benefit-risk from taking warfarin. This will be investigated further in WS3. Additionally, it should be
emphasised that the observational studies evaluated in this study do not represent an exhaustive review of studies
from the published literature.

Pharmacoepidemiological Research on Outcomes of Therapeutics by a European ConsorTium
10
Section 3: Work stream 2 – Warfarin versus Active Comparators) and work stream 3 (
Pharmacoepidemiological Research on Outcomes of Therapeutics by a European ConsorTium
11
Section 4: Individual benefit risk assessments for warfarin using patient level data).
Work stream 1: In this initial stage a benefit-risk assessment of warfarin in atrial fibrillation versus the alternative of
no treatment/placebo was carried out. Then an assessment of whether observational studies of warfarin treatment
in atrial fibrillation were compatible with the data from the randomised clinical trials used in the initial assessment
was done.
Work stream 2: Changes in the benefit-risk profile over time was considered by using the data from 3 recent clinical
trial programmes for a new class of anticoagulant. Firstly we assessed whether the benefit-risk for warfarin versus
the newer products was positive, and then assessed whether the warfarin clinical trial data from these new trials
were compatible with the data in the first assessment.
Work stream 3: The final part of the assessment used individual patient level data to identify the benefit-risk profile
for the product based on patient demographics.
Pharmacoepidemiological Research on Outcomes of Therapeutics by a European ConsorTium
12
2 Work stream 1: Warfarin versus placebo/control
2.1 Introduction This section discusses the first work stream in the warfarin case study where the benefit-risk balance of warfarin is
assessed and compared to that of placebo or control. The benefit-risk assessment is structured according to the
BRAT framework as described in Section Error! Reference source not found..
The benefit-risk assessment of warfarin in atrial fibrillation versus the alternative of no treatment/placebo is
presented here. We also explore the differences it would make to the benefit-risk balance when using data from
observational studies compared to using data from randomised clinical trials.
2.2 Decision context The benefit-risk assessment of warfarin will in this WS1 be against no treatment/placebo (hereafter referred to as
control). The assessment will be for the primary prevention of ischaemic stroke for patients with non-valvular atrial
fibrillation.
Patients with artificial heart valves were not included in this assessment as they have an even higher rate of
ischaemic stroke, as a consequence of their valve as well as any concurrent atrial fibrillation and require a higher INR
(2.5-3.5). A separate benefit-risk assessment would be required in this population.
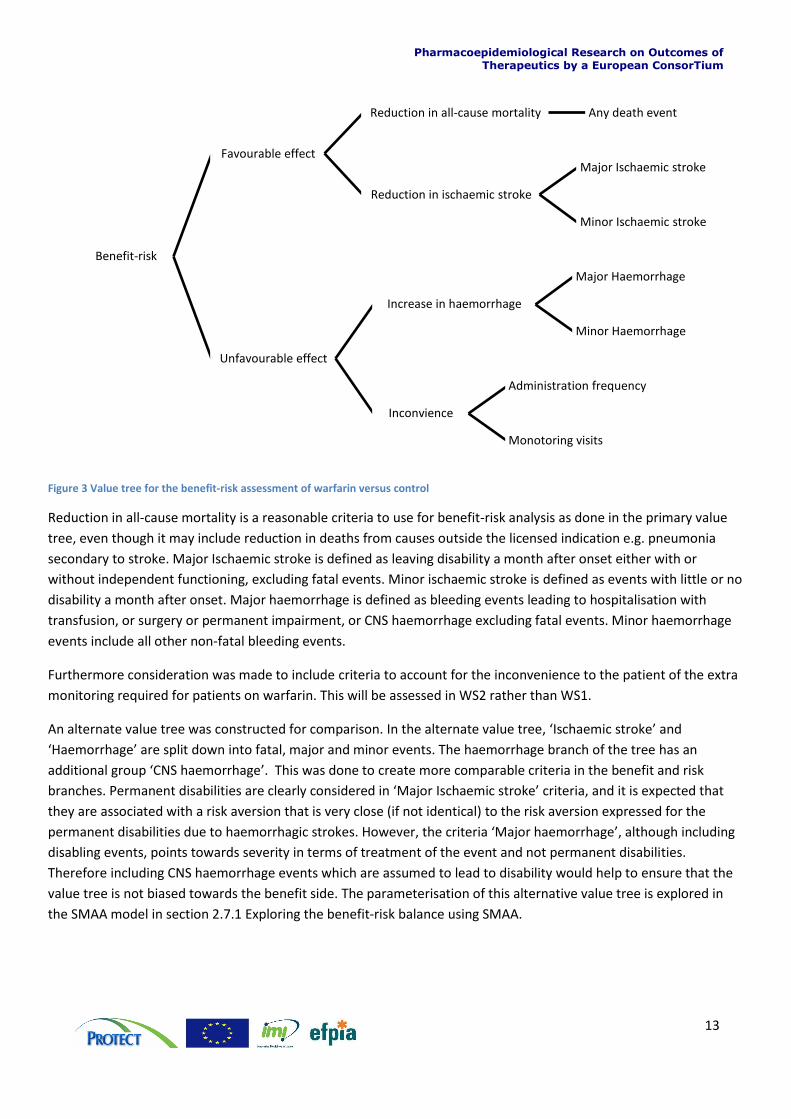
2.3 Identify outcomes The building of the value tree and identification of outcomes was an iterative process, where the value tree was
customised over several iterations in order to take into account problems with data availability, double counting,
and criteria comparability; this process in documented in Appendix 3: Iterative process to define value tree/effect
tableError! Reference source not found.. In the figure below the value tree which was used as the base for the
forthcoming analysis is shown. An alternate value tree was also defined (see figure 4).
Pharmacoepidemiological Research on Outcomes of Therapeutics by a European ConsorTium
13
Figure 3 Value tree for the benefit-risk assessment of warfarin versus control
Reduction in all-cause mortality is a reasonable criteria to use for benefit-risk analysis as done in the primary value
tree, even though it may include reduction in deaths from causes outside the licensed indication e.g. pneumonia
secondary to stroke. Major Ischaemic stroke is defined as leaving disability a month after onset either with or
without independent functioning, excluding fatal events. Minor ischaemic stroke is defined as events with little or no
disability a month after onset. Major haemorrhage is defined as bleeding events leading to hospitalisation with
transfusion, or surgery or permanent impairment, or CNS haemorrhage excluding fatal events. Minor haemorrhage
events include all other non-fatal bleeding events.
Furthermore consideration was made to include criteria to account for the inconvenience to the patient of the extra
monitoring required for patients on warfarin. This will be assessed in WS2 rather than WS1.
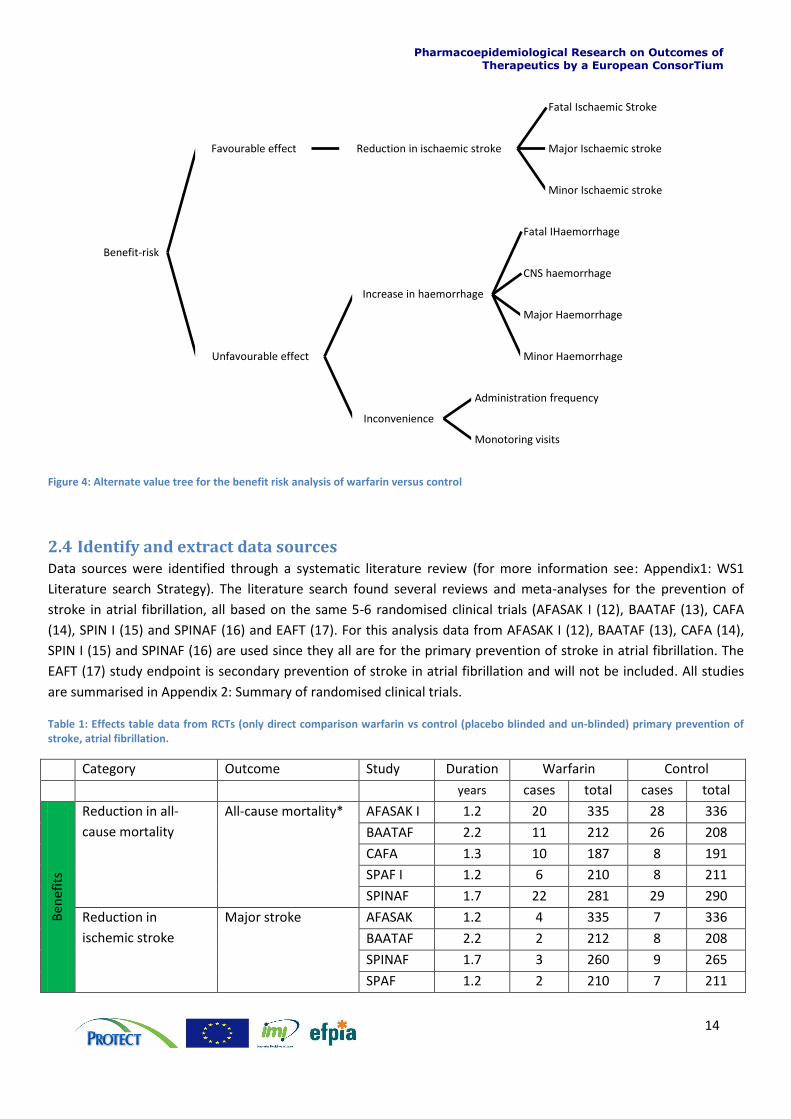
An alternate value tree was constructed for comparison. In the alternate value tree, ‘Ischaemic stroke’ and
‘Haemorrhage’ are split down into fatal, major and minor events. The haemorrhage branch of the tree has an
additional group ‘CNS haemorrhage’. This was done to create more comparable criteria in the benefit and risk
branches. Permanent disabilities are clearly considered in ‘Major Ischaemic stroke’ criteria, and it is expected that
they are associated with a risk aversion that is very close (if not identical) to the risk aversion expressed for the
permanent disabilities due to haemorrhagic strokes. However, the criteria ‘Major haemorrhage’, although including
disabling events, points towards severity in terms of treatment of the event and not permanent disabilities.
Therefore including CNS haemorrhage events which are assumed to lead to disability would help to ensure that the
value tree is not biased towards the benefit side. The parameterisation of this alternative value tree is explored in
the SMAA model in section 2.7.1 Exploring the benefit-risk balance using SMAA.
Benefit-risk
Favourable effect
Reduction in all-cause mortality Any death event
Reduction in ischaemic stroke
Major Ischaemic stroke
Minor Ischaemic stroke
Unfavourable effect
Increase in haemorrhage
Major Haemorrhage
Minor Haemorrhage
Inconvience
Administration frequency
Monotoring visits
Pharmacoepidemiological Research on Outcomes of Therapeutics by a European ConsorTium
14
Figure 4: Alternate value tree for the benefit risk analysis of warfarin versus control
2.4 Identify and extract data sources Data sources were identified through a systematic literature review (for more information see: Appendix1: WS1
Literature search Strategy). The literature search found several reviews and meta-analyses for the prevention of
stroke in atrial fibrillation, all based on the same 5-6 randomised clinical trials (AFASAK I (12), BAATAF (13), CAFA
(14), SPIN I (15) and SPINAF (16) and EAFT (17). For this analysis data from AFASAK I (12), BAATAF (13), CAFA (14),
SPIN I (15) and SPINAF (16) are used since they all are for the primary prevention of stroke in atrial fibrillation. The
EAFT (17) study endpoint is secondary prevention of stroke in atrial fibrillation and will not be included. All studies
are summarised in Appendix 2: Summary of randomised clinical trials.
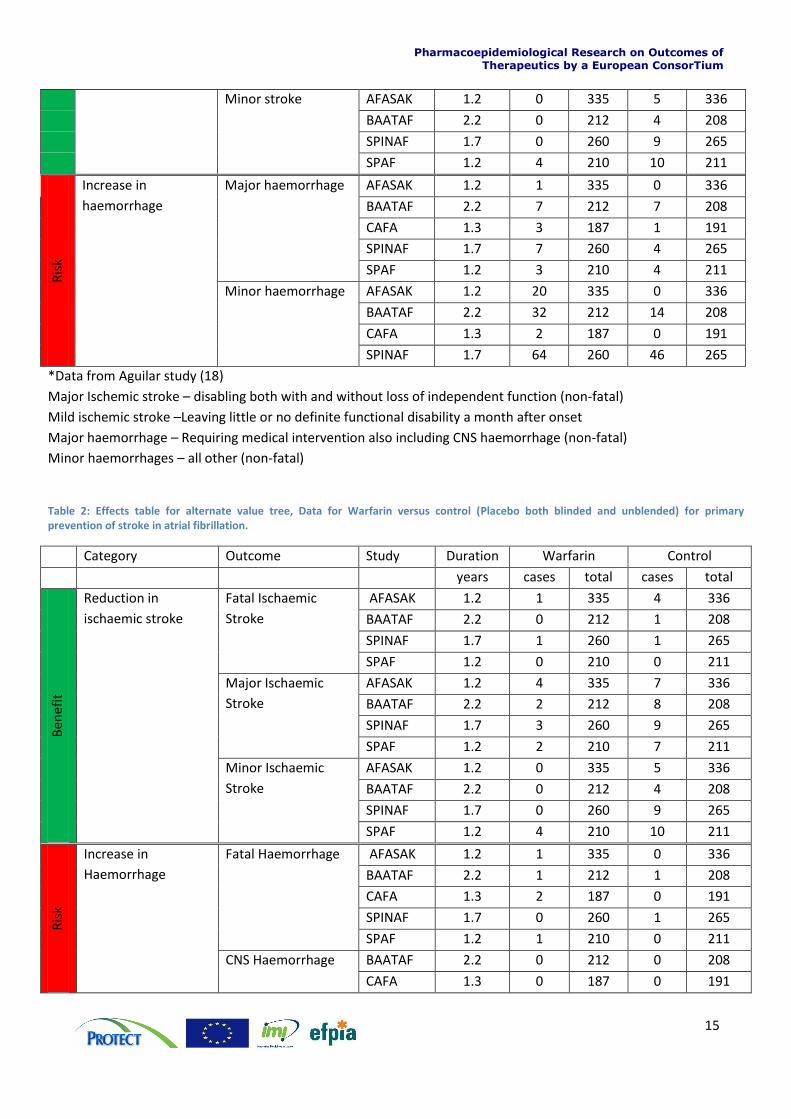
Table 1: Effects table data from RCTs (only direct comparison warfarin vs control (placebo blinded and un-blinded) primary prevention of stroke, atrial fibrillation.
Category Outcome Study Duration Warfarin Control
years cases total cases total
Ben
efit
s
Reduction in all-
cause mortality
All-cause mortality* AFASAK I 1.2 20 335 28 336
BAATAF 2.2 11 212 26 208
CAFA 1.3 10 187 8 191
SPAF I 1.2 6 210 8 211
SPINAF 1.7 22 281 29 290
Reduction in
ischemic stroke
Major stroke AFASAK 1.2 4 335 7 336
BAATAF 2.2 2 212 8 208
SPINAF 1.7 3 260 9 265
SPAF 1.2 2 210 7 211
Benefit-risk
Favourable effect Reduction in ischaemic stroke
Fatal Ischaemic Stroke
Major Ischaemic stroke
Minor Ischaemic stroke
Unfavourable effect
Increase in haemorrhage
Fatal IHaemorrhage
CNS haemorrhage
Major Haemorrhage
Minor Haemorrhage
Inconvenience
Administration frequency
Monotoring visits
Pharmacoepidemiological Research on Outcomes of Therapeutics by a European ConsorTium
15
Minor stroke AFASAK 1.2 0 335 5 336
BAATAF 2.2 0 212 4 208
SPINAF 1.7 0 260 9 265
SPAF 1.2 4 210 10 211
Ris
k
Increase in
haemorrhage
Major haemorrhage AFASAK 1.2 1 335 0 336
BAATAF 2.2 7 212 7 208
CAFA 1.3 3 187 1 191
SPINAF 1.7 7 260 4 265
SPAF 1.2 3 210 4 211
Minor haemorrhage AFASAK 1.2 20 335 0 336
BAATAF 2.2 32 212 14 208
CAFA 1.3 2 187 0 191
SPINAF 1.7 64 260 46 265
*Data from Aguilar study (18)
Major Ischemic stroke – disabling both with and without loss of independent function (non-fatal)
Mild ischemic stroke –Leaving little or no definite functional disability a month after onset
Major haemorrhage – Requiring medical intervention also including CNS haemorrhage (non-fatal)
Minor haemorrhages – all other (non-fatal)
Table 2: Effects table for alternate value tree, Data for Warfarin versus control (Placebo both blinded and unblended) for primary prevention of stroke in atrial fibrillation.
Category Outcome Study Duration Warfarin Control
years cases total cases total
Ben
efit
Reduction in
ischaemic stroke
Fatal Ischaemic
Stroke
AFASAK 1.2 1 335 4 336
BAATAF 2.2 0 212 1 208
SPINAF 1.7 1 260 1 265
SPAF 1.2 0 210 0 211
Major Ischaemic
Stroke
AFASAK 1.2 4 335 7 336
BAATAF 2.2 2 212 8 208
SPINAF 1.7 3 260 9 265
SPAF 1.2 2 210 7 211
Minor Ischaemic
Stroke
AFASAK 1.2 0 335 5 336
BAATAF 2.2 0 212 4 208
SPINAF 1.7 0 260 9 265
SPAF 1.2 4 210 10 211
Ris
k
Increase in
Haemorrhage
Fatal Haemorrhage AFASAK 1.2 1 335 0 336
BAATAF 2.2 1 212 1 208
CAFA 1.3 2 187 0 191
SPINAF 1.7 0 260 1 265
SPAF 1.2 1 210 0 211
CNS Haemorrhage BAATAF 2.2 0 212 0 208
CAFA 1.3 0 187 0 191
Pharmacoepidemiological Research on Outcomes of Therapeutics by a European ConsorTium
16
SPINAF 1.7 1 260 0 265
SPAF 1.2 1 210 2 211
Major Haemorrhage BAATAF 2.2 7 212 7 208
CAFA N/A 3 187 2 191
SPINAF 1.7 6 260 3 265
SPAF 1.2 2 210 2 211
Minor Haemorrhage AFASAK I 1.2 20 335 0 336
BAATAF 2.2 32 212 14 208
SPINAF 1.7 64 260 46 265
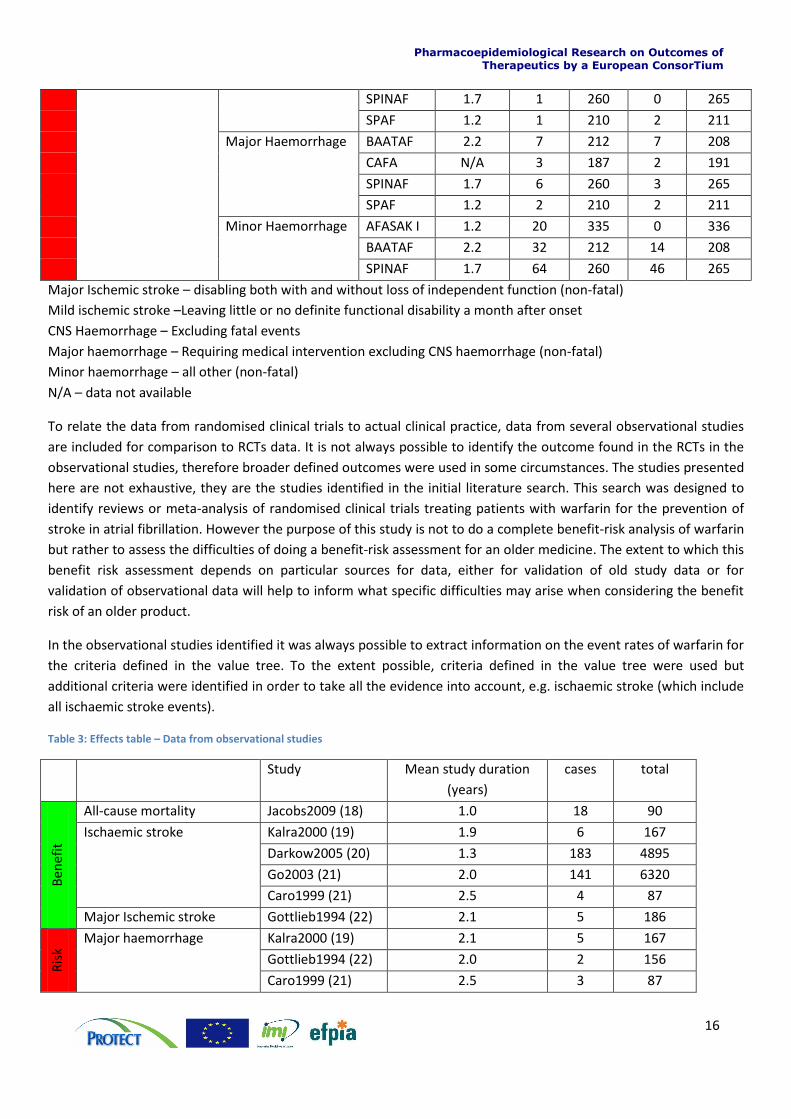
Major Ischemic stroke – disabling both with and without loss of independent function (non-fatal)
Mild ischemic stroke –Leaving little or no definite functional disability a month after onset
CNS Haemorrhage – Excluding fatal events
Major haemorrhage – Requiring medical intervention excluding CNS haemorrhage (non-fatal)
Minor haemorrhage – all other (non-fatal)
N/A – data not available
To relate the data from randomised clinical trials to actual clinical practice, data from several observational studies
are included for comparison to RCTs data. It is not always possible to identify the outcome found in the RCTs in the
observational studies, therefore broader defined outcomes were used in some circumstances. The studies presented
here are not exhaustive, they are the studies identified in the initial literature search. This search was designed to
identify reviews or meta-analysis of randomised clinical trials treating patients with warfarin for the prevention of
stroke in atrial fibrillation. However the purpose of this study is not to do a complete benefit-risk analysis of warfarin
but rather to assess the difficulties of doing a benefit-risk assessment for an older medicine. The extent to which this
benefit risk assessment depends on particular sources for data, either for validation of old study data or for
validation of observational data will help to inform what specific difficulties may arise when considering the benefit
risk of an older product.
In the observational studies identified it was always possible to extract information on the event rates of warfarin for
the criteria defined in the value tree. To the extent possible, criteria defined in the value tree were used but
additional criteria were identified in order to take all the evidence into account, e.g. ischaemic stroke (which include
all ischaemic stroke events).
Table 3: Effects table – Data from observational studies
Study Mean study duration
(years)
cases total
Ben
efit
All-cause mortality Jacobs2009 (18) 1.0 18 90
Ischaemic stroke Kalra2000 (19) 1.9 6 167
Darkow2005 (20) 1.3 183 4895
Go2003 (21) 2.0 141 6320
Caro1999 (21) 2.5 4 87
Major Ischemic stroke Gottlieb1994 (22) 2.1 5 186
Ris
k
Major haemorrhage Kalra2000 (19) 2.1 5 167
Gottlieb1994 (22) 2.0 2 156
Caro1999 (21) 2.5 3 87
Pharmacoepidemiological Research on Outcomes of Therapeutics by a European ConsorTium
17
Hykel2007<80 (23) 0.8 12 319
Hykel2007≥80 (23) 0.7 14 153
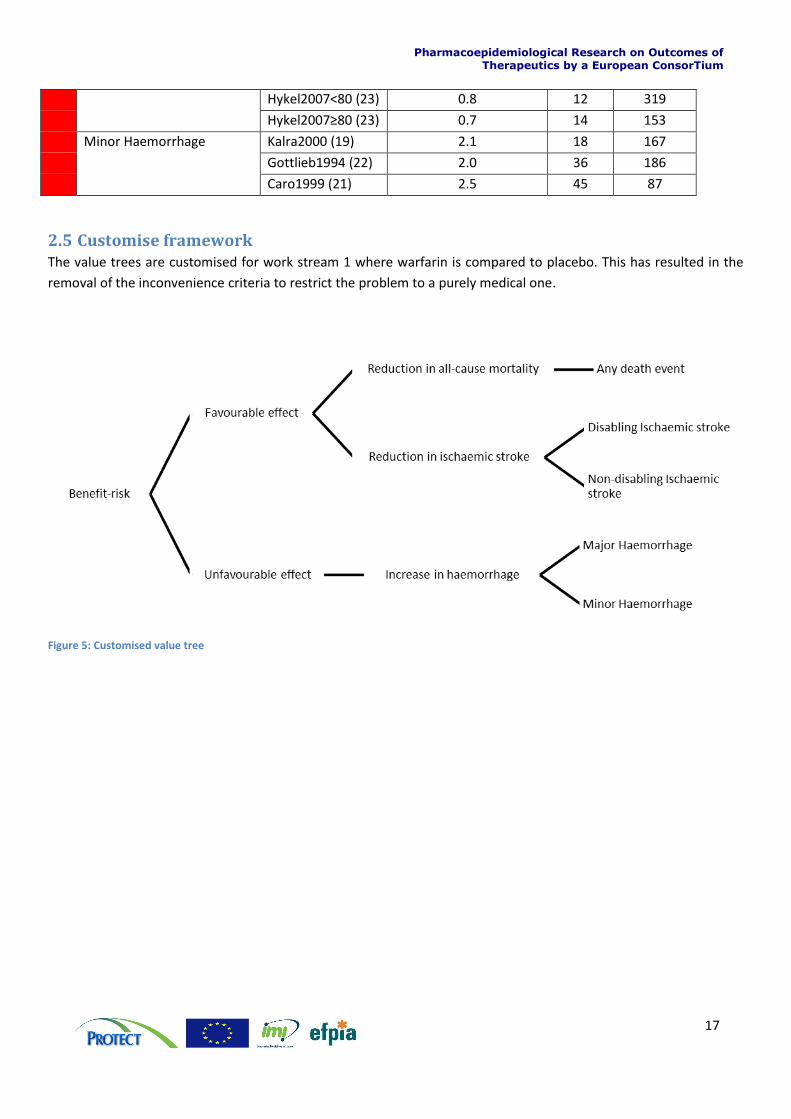
Minor Haemorrhage Kalra2000 (19) 2.1 18 167
Gottlieb1994 (22) 2.0 36 186
Caro1999 (21) 2.5 45 87
2.5 Customise framework The value trees are customised for work stream 1 where warfarin is compared to placebo. This has resulted in the
removal of the inconvenience criteria to restrict the problem to a purely medical one.
Figure 5: Customised value tree
Pharmacoepidemiological Research on Outcomes of Therapeutics by a European ConsorTium
18
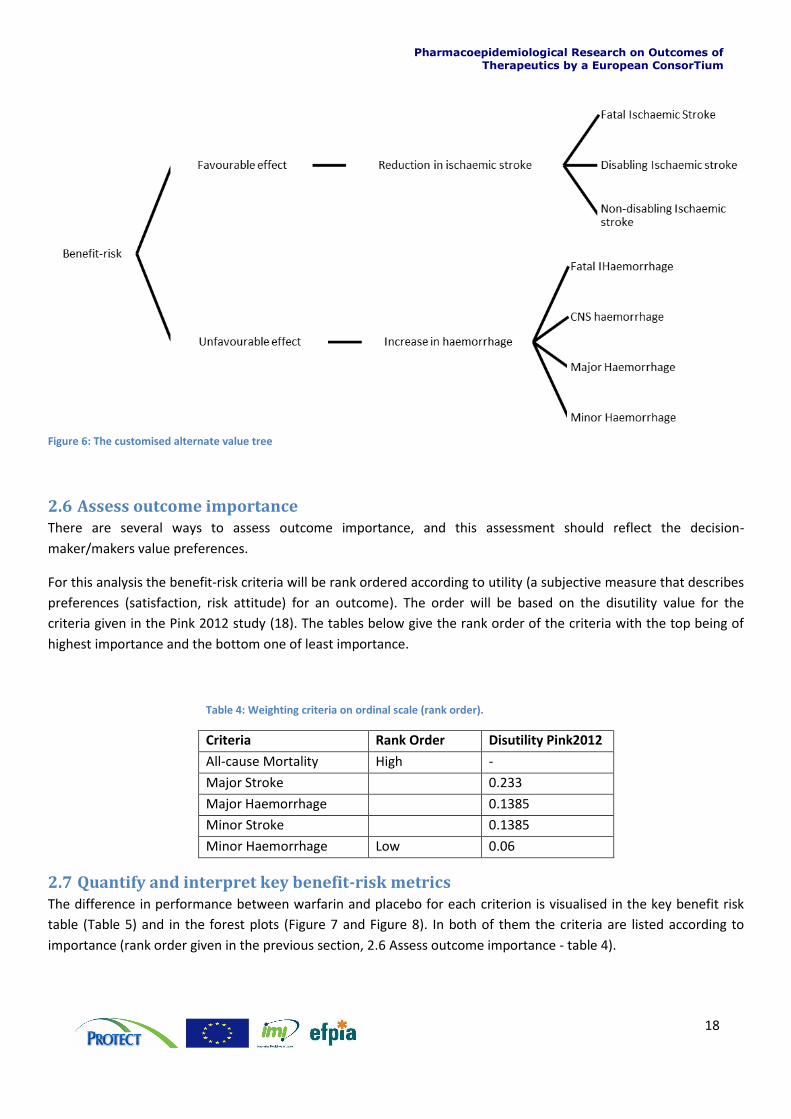
Figure 6: The customised alternate value tree
2.6 Assess outcome importance There are several ways to assess outcome importance, and this assessment should reflect the decision-
maker/makers value preferences.
For this analysis the benefit-risk criteria will be rank ordered according to utility (a subjective measure that describes
preferences (satisfaction, risk attitude) for an outcome). The order will be based on the disutility value for the
criteria given in the Pink 2012 study (18). The tables below give the rank order of the criteria with the top being of
highest importance and the bottom one of least importance.
Table 4: Weighting criteria on ordinal scale (rank order).
Criteria Rank Order Disutility Pink2012
All-cause Mortality High -
Major Stroke 0.233
Major Haemorrhage 0.1385
Minor Stroke 0.1385
Minor Haemorrhage Low 0.06
2.7 Quantify and interpret key benefit-risk metrics The difference in performance between warfarin and placebo for each criterion is visualised in the key benefit risk
table (Table 5) and in the forest plots (Figure 7 and Figure 8). In both of them the criteria are listed according to
importance (rank order given in the previous section, 2.6 Assess outcome importance - table 4).
Pharmacoepidemiological Research on Outcomes of Therapeutics by a European ConsorTium
19
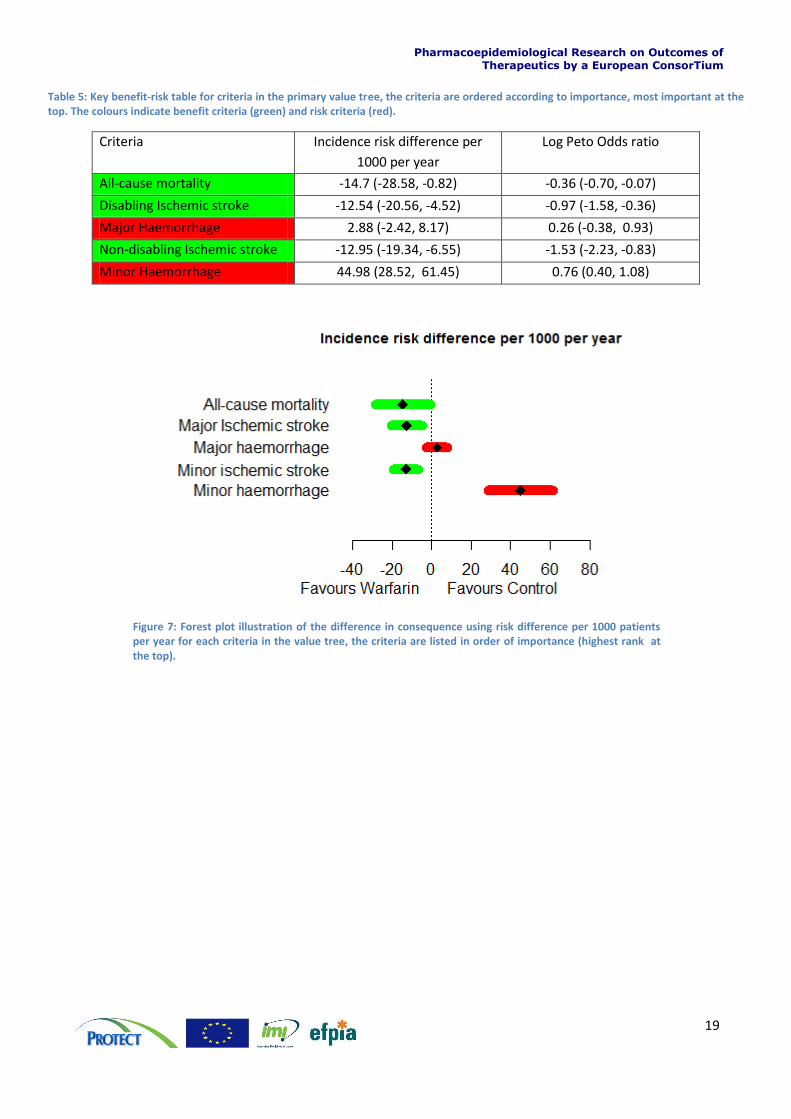
Table 5: Key benefit-risk table for criteria in the primary value tree, the criteria are ordered according to importance, most important at the top. The colours indicate benefit criteria (green) and risk criteria (red).
Criteria Incidence risk difference per
1000 per year
Log Peto Odds ratio
All-cause mortality -14.7 (-28.58, -0.82) -0.36 (-0.70, -0.07)
Disabling Ischemic stroke -12.54 (-20.56, -4.52) -0.97 (-1.58, -0.36)
Major Haemorrhage 2.88 (-2.42, 8.17) 0.26 (-0.38, 0.93)
Non-disabling Ischemic stroke -12.95 (-19.34, -6.55) -1.53 (-2.23, -0.83)
Minor Haemorrhage 44.98 (28.52, 61.45) 0.76 (0.40, 1.08)
Figure 7: Forest plot illustration of the difference in consequence using risk difference per 1000 patients per year for each criteria in the value tree, the criteria are listed in order of importance (highest rank at the top).
Pharmacoepidemiological Research on Outcomes of Therapeutics by a European ConsorTium
20
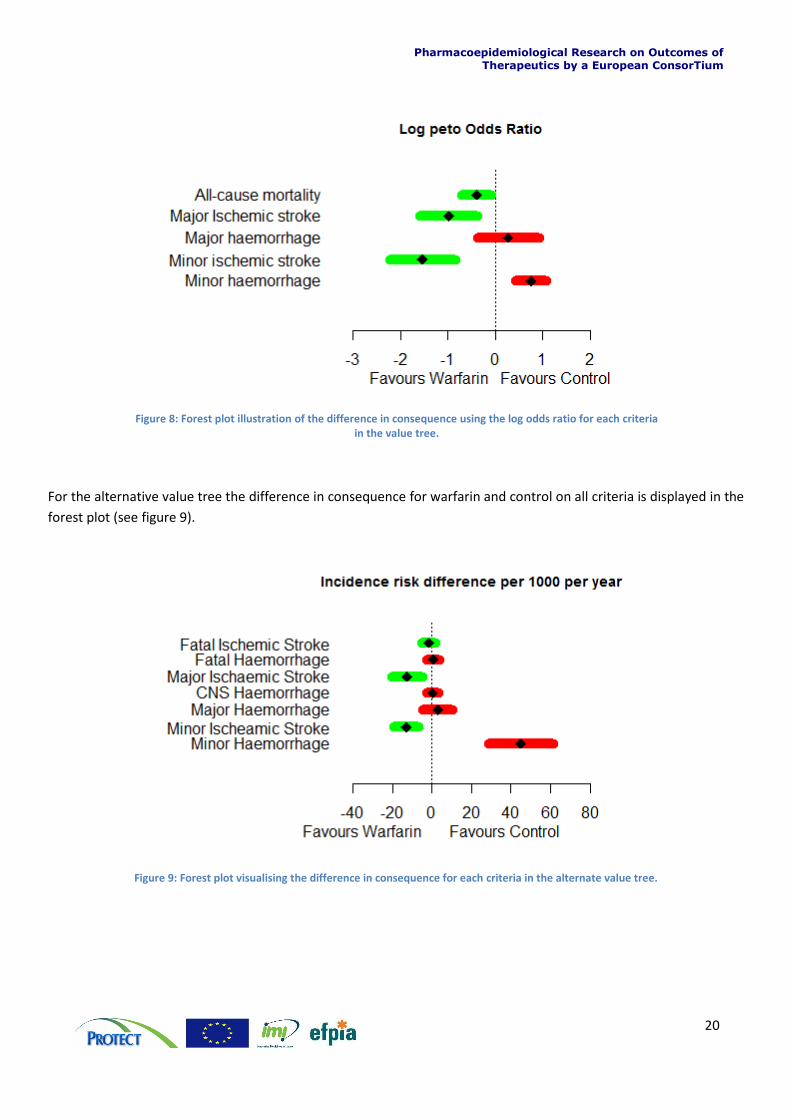
Figure 8: Forest plot illustration of the difference in consequence using the log odds ratio for each criteria in the value tree.
For the alternative value tree the difference in consequence for warfarin and control on all criteria is displayed in the
forest plot (see figure 9).
Figure 9: Forest plot visualising the difference in consequence for each criteria in the alternate value tree.
Pharmacoepidemiological Research on Outcomes of Therapeutics by a European ConsorTium
21
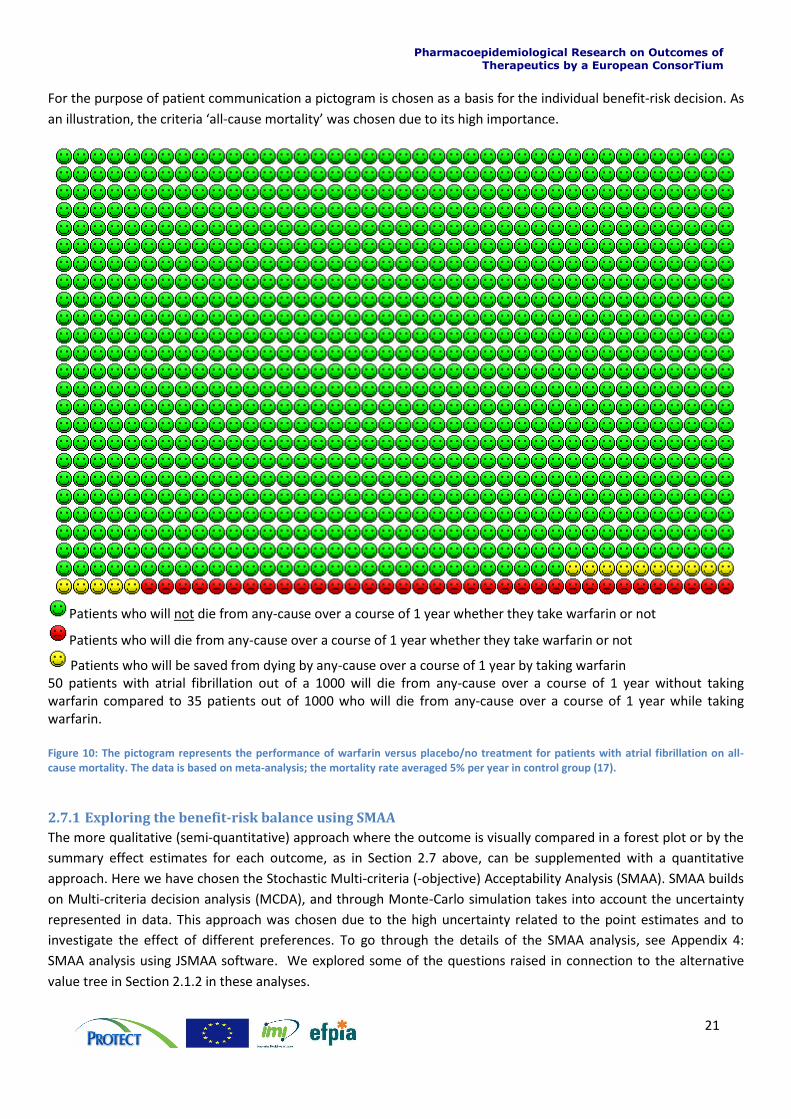
For the purpose of patient communication a pictogram is chosen as a basis for the individual benefit-risk decision. As
an illustration, the criteria ‘all-cause mortality’ was chosen due to its high importance.
Patients who will not die from any-cause over a course of 1 year whether they take warfarin or not
Patients who will die from any-cause over a course of 1 year whether they take warfarin or not
Patients who will be saved from dying by any-cause over a course of 1 year by taking warfarin 50 patients with atrial fibrillation out of a 1000 will die from any-cause over a course of 1 year without taking warfarin compared to 35 patients out of 1000 who will die from any-cause over a course of 1 year while taking warfarin. Figure 10: The pictogram represents the performance of warfarin versus placebo/no treatment for patients with atrial fibrillation on all-cause mortality. The data is based on meta-analysis; the mortality rate averaged 5% per year in control group (17).
2.7.1 Exploring the benefit-risk balance using SMAA
The more qualitative (semi-quantitative) approach where the outcome is visually compared in a forest plot or by the
summary effect estimates for each outcome, as in Section 2.7 above, can be supplemented with a quantitative
approach. Here we have chosen the Stochastic Multi-criteria (-objective) Acceptability Analysis (SMAA). SMAA builds
on Multi-criteria decision analysis (MCDA), and through Monte-Carlo simulation takes into account the uncertainty
represented in data. This approach was chosen due to the high uncertainty related to the point estimates and to
investigate the effect of different preferences. To go through the details of the SMAA analysis, see Appendix 4:
SMAA analysis using JSMAA software. We explored some of the questions raised in connection to the alternative
value tree in Section 2.1.2 in these analyses.
Pharmacoepidemiological Research on Outcomes of Therapeutics by a European ConsorTium
22
The SMAA method has the advantage that the analysis can be carried out with missing and unknown weights, and
weighting on an ordinal and a cardinal scale. The criterion “Major Haemorrhage” was not consistently defined across
studies, and may or may not be disabling. Consequently, preferences assigned to the criterion may have greater
uncertainty. The SMAA analysis can give us a better understanding of the impact of different preferences and their
uncertainties on the benefit-risk balance. Two different weight scenarios were explored:
Scenario A: The weight on each criterion corresponds to the disutility assigned in the Pink paper from 2012
(24). The criteria “all-cause mortality” was not reported in the Pink 2012 analysis (24), and for this scenario
we assume a value of 0.4. (See table 6)
Scenario B: Criteria “Disabling Ischaemic Stroke” and “Major Haemorrhage” are assumed to carry the same
weight. This is equivalent to assuming all “Major Haemorrhage” events are disabling (See table 7).
Since the weights from the literature disregard value functions for individual’s disutility, they essentially already
implicitly accounted for both weights and utilities. The value functions and data to be used in our SMAA model may
be different to the ones accounted for in the literature, and therefore we need to ‘normalise’ the disutility values so
that the total adds up to 1. This ensures that the weights and utilities in the final SMAA model match to the ones
from the literature. To further explore the typical preference profile of a decision-maker in relation to treatment
options, we conduct an analysis using missing weights assuming that these weights are uniformly distributed
between values of 0 and 1.
Normalising weights for use in SMAA model
Scenario A: The weights are elicited directly based on the relative relationship of the disabilities described in the Pink
2012 study (18). The disutility for ‘all-cause mortality’ was not given in the Pink 2012 study (18), and here it is
assigned the disutility value of 0.4. The normalised disutility values that act as a constraint to the SMAA model are
given in Table 6.
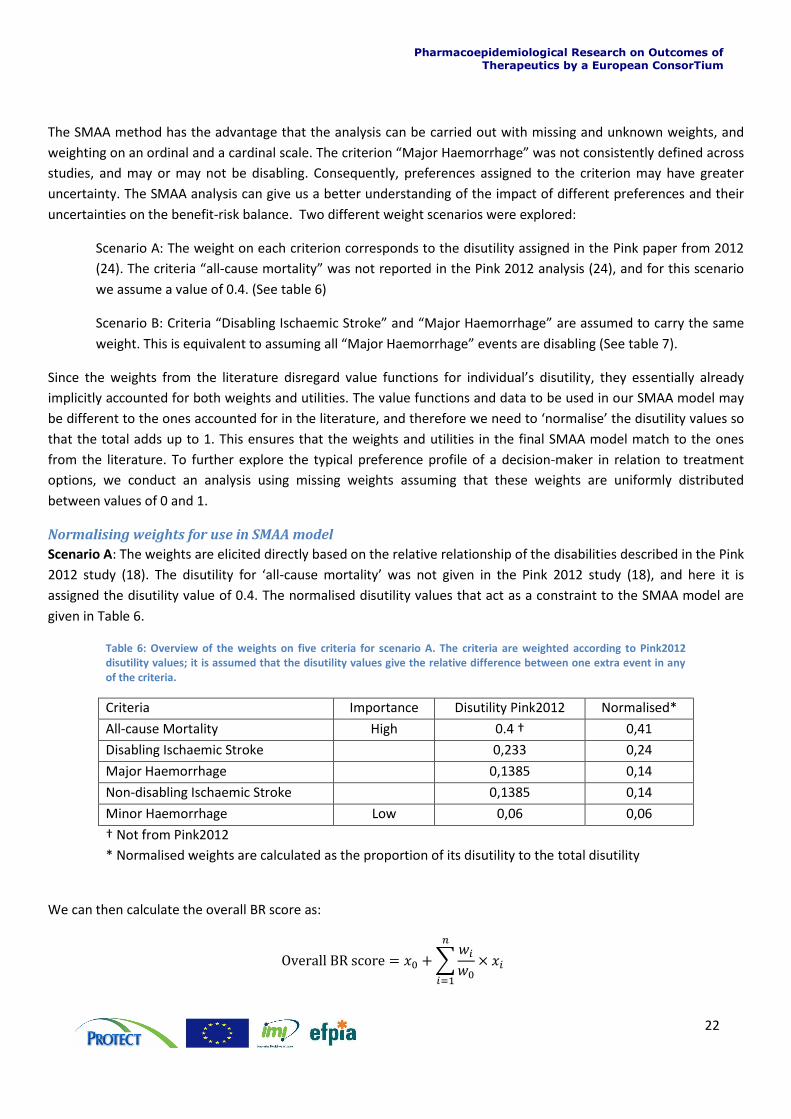
Table 6: Overview of the weights on five criteria for scenario A. The criteria are weighted according to Pink2012 disutility values; it is assumed that the disutility values give the relative difference between one extra event in any of the criteria.
Criteria Importance Disutility Pink2012 Normalised*
All-cause Mortality High 0.4 † 0,41
Disabling Ischaemic Stroke 0,233 0,24
Major Haemorrhage 0,1385 0,14
Non-disabling Ischaemic Stroke 0,1385 0,14
Minor Haemorrhage Low 0,06 0,06
† Not from Pink2012
* Normalised weights are calculated as the proportion of its disutility to the total disutility
We can then calculate the overall BR score as:
∑
Pharmacoepidemiological Research on Outcomes of Therapeutics by a European ConsorTium
23
where and are the value and the normalised weight of the key event (‘all-cause mortality’), and and are the values and the normalised weights of other events. From the table above for scenario A, the overall BR score can be expressed as follows: Overall BR score = ( ‘All-cause Mortality’) + (0.58 x ‘disabling Ischaemic Stroke’)
+ (0.35 x ‘Major Haemorrhage”) + (0.35 x ‘Non-disabling Ischaemic Stroke’) + (0.15 x ‘Minor Haemorrhage”)
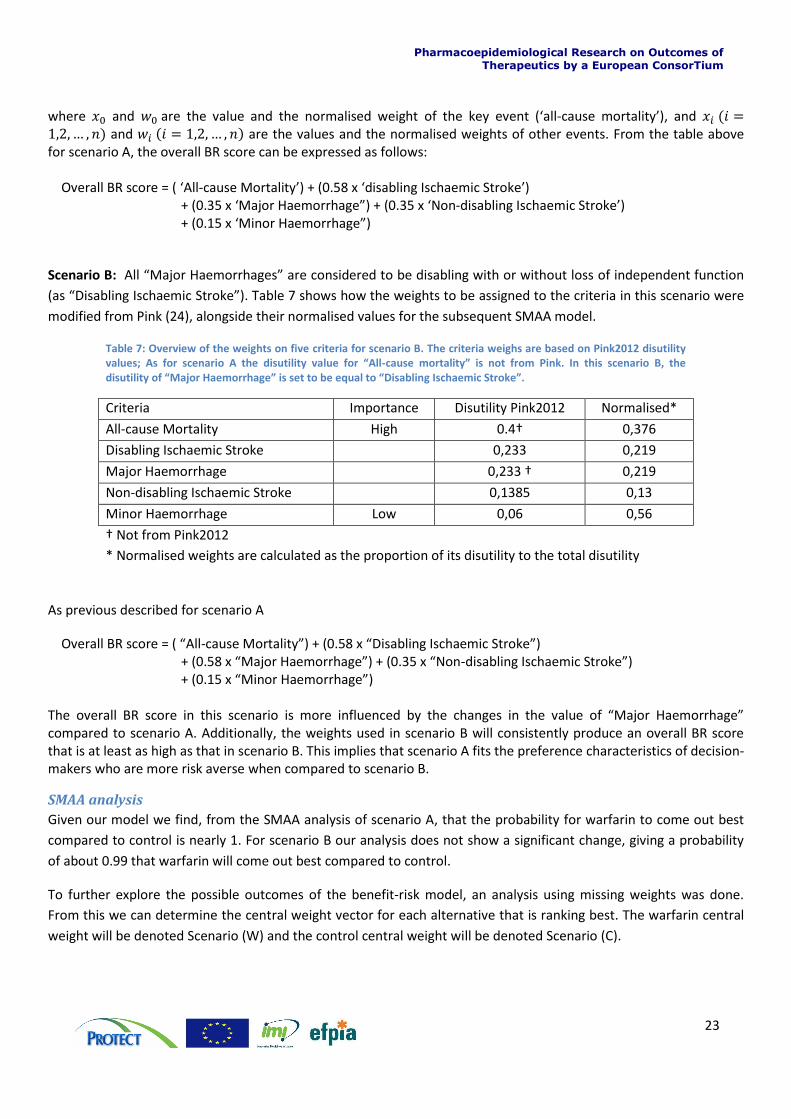
Scenario B: All “Major Haemorrhages” are considered to be disabling with or without loss of independent function
(as “Disabling Ischaemic Stroke”). Table 7 shows how the weights to be assigned to the criteria in this scenario were
modified from Pink (24), alongside their normalised values for the subsequent SMAA model.
Table 7: Overview of the weights on five criteria for scenario B. The criteria weighs are based on Pink2012 disutility values; As for scenario A the disutility value for “All-cause mortality” is not from Pink. In this scenario B, the disutility of “Major Haemorrhage” is set to be equal to “Disabling Ischaemic Stroke”.
Criteria Importance Disutility Pink2012 Normalised*
All-cause Mortality High 0.4† 0,376
Disabling Ischaemic Stroke 0,233 0,219
Major Haemorrhage 0,233 † 0,219
Non-disabling Ischaemic Stroke 0,1385 0,13
Minor Haemorrhage Low 0,06 0,56
† Not from Pink2012
* Normalised weights are calculated as the proportion of its disutility to the total disutility
As previous described for scenario A
Overall BR score = ( “All-cause Mortality”) + (0.58 x “Disabling Ischaemic Stroke”) + (0.58 x “Major Haemorrhage”) + (0.35 x “Non-disabling Ischaemic Stroke”) + (0.15 x “Minor Haemorrhage”)
The overall BR score in this scenario is more influenced by the changes in the value of “Major Haemorrhage” compared to scenario A. Additionally, the weights used in scenario B will consistently produce an overall BR score that is at least as high as that in scenario B. This implies that scenario A fits the preference characteristics of decision-makers who are more risk averse when compared to scenario B.
SMAA analysis
Given our model we find, from the SMAA analysis of scenario A, that the probability for warfarin to come out best
compared to control is nearly 1. For scenario B our analysis does not show a significant change, giving a probability
of about 0.99 that warfarin will come out best compared to control.
To further explore the possible outcomes of the benefit-risk model, an analysis using missing weights was done.
From this we can determine the central weight vector for each alternative that is ranking best. The warfarin central
weight will be denoted Scenario (W) and the control central weight will be denoted Scenario (C).
Pharmacoepidemiological Research on Outcomes of Therapeutics by a European ConsorTium
24
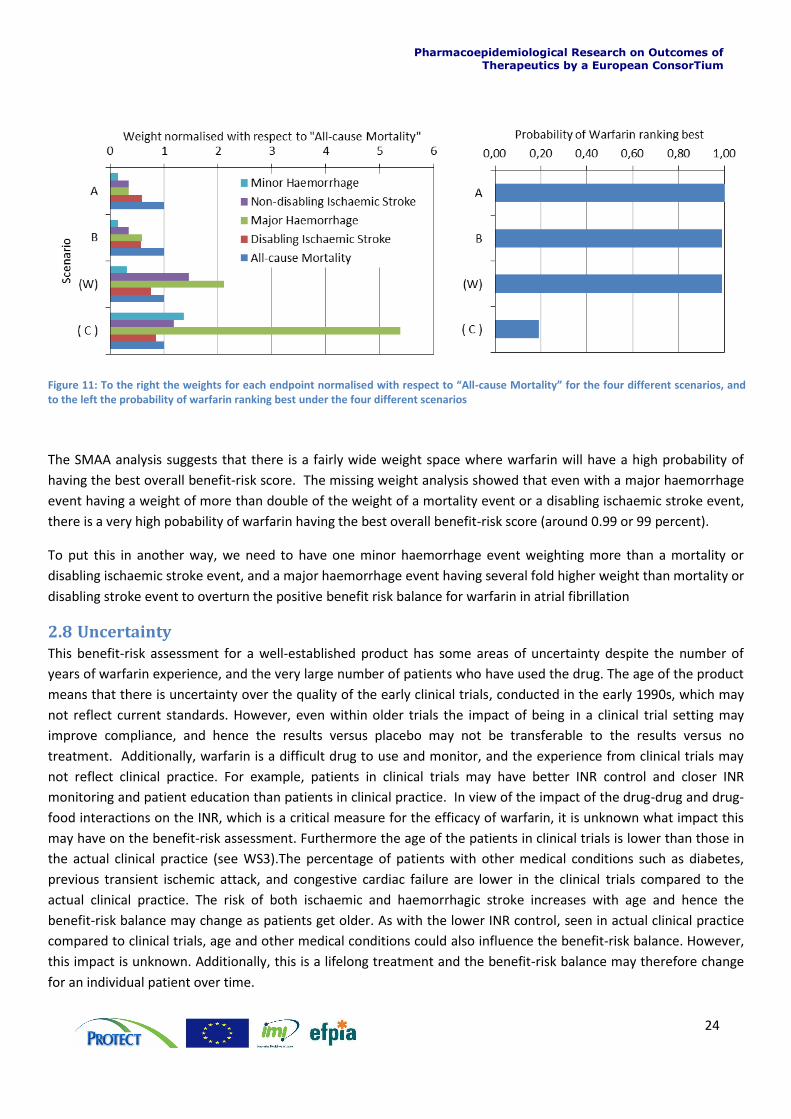
The SMAA analysis suggests that there is a fairly wide weight space where warfarin will have a high probability of
having the best overall benefit-risk score. The missing weight analysis showed that even with a major haemorrhage
event having a weight of more than double of the weight of a mortality event or a disabling ischaemic stroke event,
there is a very high pobability of warfarin having the best overall benefit-risk score (around 0.99 or 99 percent).
To put this in another way, we need to have one minor haemorrhage event weighting more than a mortality or
disabling ischaemic stroke event, and a major haemorrhage event having several fold higher weight than mortality or
disabling stroke event to overturn the positive benefit risk balance for warfarin in atrial fibrillation
2.8 Uncertainty This benefit-risk assessment for a well-established product has some areas of uncertainty despite the number of
years of warfarin experience, and the very large number of patients who have used the drug. The age of the product
means that there is uncertainty over the quality of the early clinical trials, conducted in the early 1990s, which may
not reflect current standards. However, even within older trials the impact of being in a clinical trial setting may
improve compliance, and hence the results versus placebo may not be transferable to the results versus no
treatment. Additionally, warfarin is a difficult drug to use and monitor, and the experience from clinical trials may
not reflect clinical practice. For example, patients in clinical trials may have better INR control and closer INR
monitoring and patient education than patients in clinical practice. In view of the impact of the drug-drug and drug-
food interactions on the INR, which is a critical measure for the efficacy of warfarin, it is unknown what impact this
may have on the benefit-risk assessment. Furthermore the age of the patients in clinical trials is lower than those in
the actual clinical practice (see WS3).The percentage of patients with other medical conditions such as diabetes,
previous transient ischemic attack, and congestive cardiac failure are lower in the clinical trials compared to the
actual clinical practice. The risk of both ischaemic and haemorrhagic stroke increases with age and hence the
benefit-risk balance may change as patients get older. As with the lower INR control, seen in actual clinical practice
compared to clinical trials, age and other medical conditions could also influence the benefit-risk balance. However,
this impact is unknown. Additionally, this is a lifelong treatment and the benefit-risk balance may therefore change
for an individual patient over time.
Figure 11: To the right the weights for each endpoint normalised with respect to “All-cause Mortality” for the four different scenarios, and to the left the probability of warfarin ranking best under the four different scenarios
Pharmacoepidemiological Research on Outcomes of Therapeutics by a European ConsorTium
25
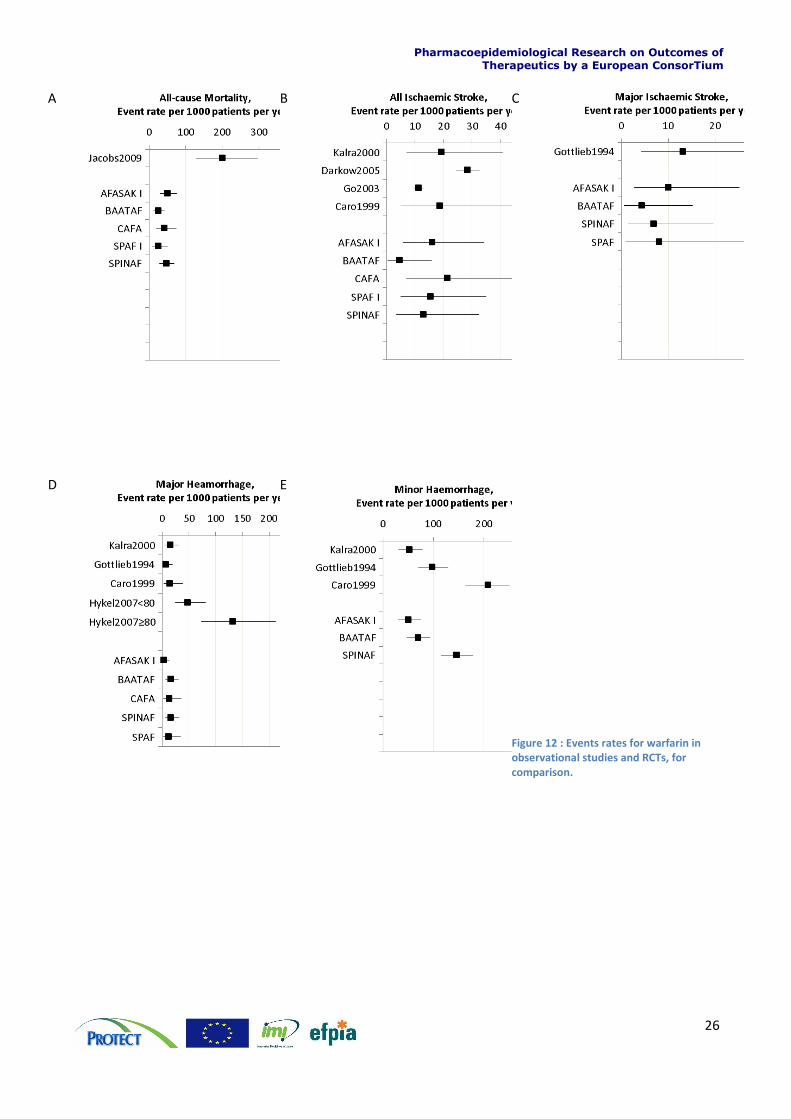
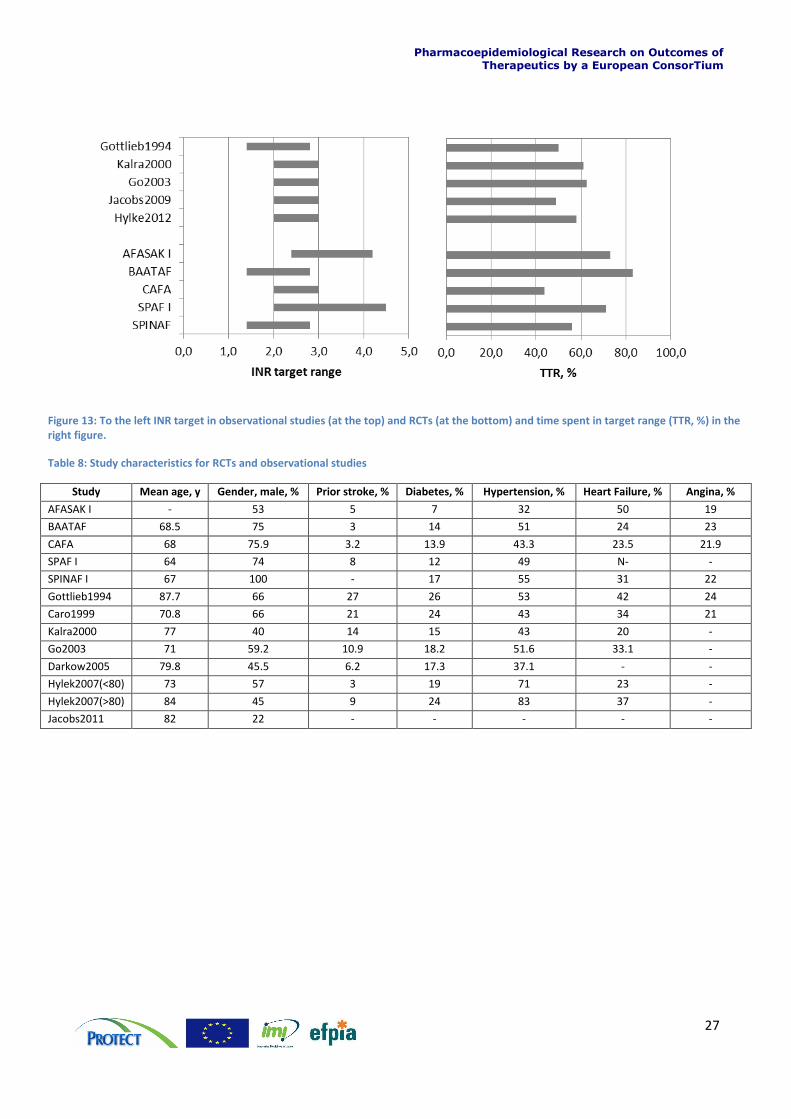
To compare the events rate (Figure 12) for observational studies and RCTs, it is relevant to look at differences
between studies. Figure 13 below shows the intended INR target range for the difference between observational
studies and the RCTs together with the actual time spend in the target (TTR, %). It is also relevant to compare other
study characteristics when looking at the events rates for warfarin in the different studies; this is done in table 8 and
for a quick overview, in figure 14.
Below we compare the performance of warfarin on the benefit and risk criteria in the different observational studies
and RCTs.
For the endpoint all-cause mortality (Figure 12 A) there is minimal overlap between the RCTs and the observational
study (Jacobs study (19)). This observational study is the only one to state this endpoint, however differences
between the observational study and the RCTs could be explained by the difference in mean age, which is between
64 and 68.5 years in the RCTs and 83 years in the Jacobs study (19).
To compare the event rates of ischaemic stroke in the RCTs and observational studies, we look at the observations
disabling ischaemic stroke (see Figure 12 C), which is also a critieria in our benefit-risk analysis. This endpoint was
reported only in one of the identified observational studies. Therefore, a comparison is also made for the endpoint
all ischaemic strokes (see Figure 12 B). The event rate for ischaemic stroke of warfarin-treated patients in the clinical
trials reflects fairly well the event rate seen in the observational studies. Both for the RCTs and the observational
studies, there is some between-study variation, some of this variation may be explained by the difference in study
characteristics, which will be investigated further in WS3.
For the risk criteria major haemorrhage (see Figure 12 D), the Hykle study (20) stands out as different from the other
studies, a high rate of major haemorrhage is observed, however the patients in this study are older than the patients
in the RCTs. Additionally, the two groups in the Hykle study (20) have higher prevalence of hypertension. In the
minor haemorrhage (see Figure 12 E), there is some between-study variation both between the RCTs results and
between results from RCTs and observational studies, again some of this could be explained by differences between
study population characteristics. Again this will be explored further in WS3.
Overall the efficacy and safety seen in the RCTs is reflected fairly well in the observational studies, and will not
change the benefit-risk profile for patients with atrial fibrillation. The comparison does reveal some possibilities for a
different benefit-risk profile in specific patient groups e.g. by age or hypertension status, and this will be explored
further in WS3.
Pharmacoepidemiological Research on Outcomes of Therapeutics by a European ConsorTium
26
A
B
C
D
E
Figure 12 : Events rates for warfarin in observational studies and RCTs, for comparison.
Pharmacoepidemiological Research on Outcomes of Therapeutics by a European ConsorTium
27
Figure 13: To the left INR target in observational studies (at the top) and RCTs (at the bottom) and time spent in target range (TTR, %) in the right figure.
Table 8: Study characteristics for RCTs and observational studies
Study Mean age, y Gender, male, % Prior stroke, % Diabetes, % Hypertension, % Heart Failure, % Angina, %
AFASAK I - 53 5 7 32 50 19
BAATAF 68.5 75 3 14 51 24 23
CAFA 68 75.9 3.2 13.9 43.3 23.5 21.9
SPAF I 64 74 8 12 49 N- -
SPINAF I 67 100 - 17 55 31 22
Gottlieb1994 87.7 66 27 26 53 42 24
Caro1999 70.8 66 21 24 43 34 21
Kalra2000 77 40 14 15 43 20 -
Go2003 71 59.2 10.9 18.2 51.6 33.1 -
Darkow2005 79.8 45.5 6.2 17.3 37.1 - -
Hylek2007(<80) 73 57 3 19 71 23 -
Hylek2007(>80) 84 45 9 24 83 37 -
Jacobs2011 82 22 - - - - -
Pharmacoepidemiological Research on Outcomes of Therapeutics by a European ConsorTium
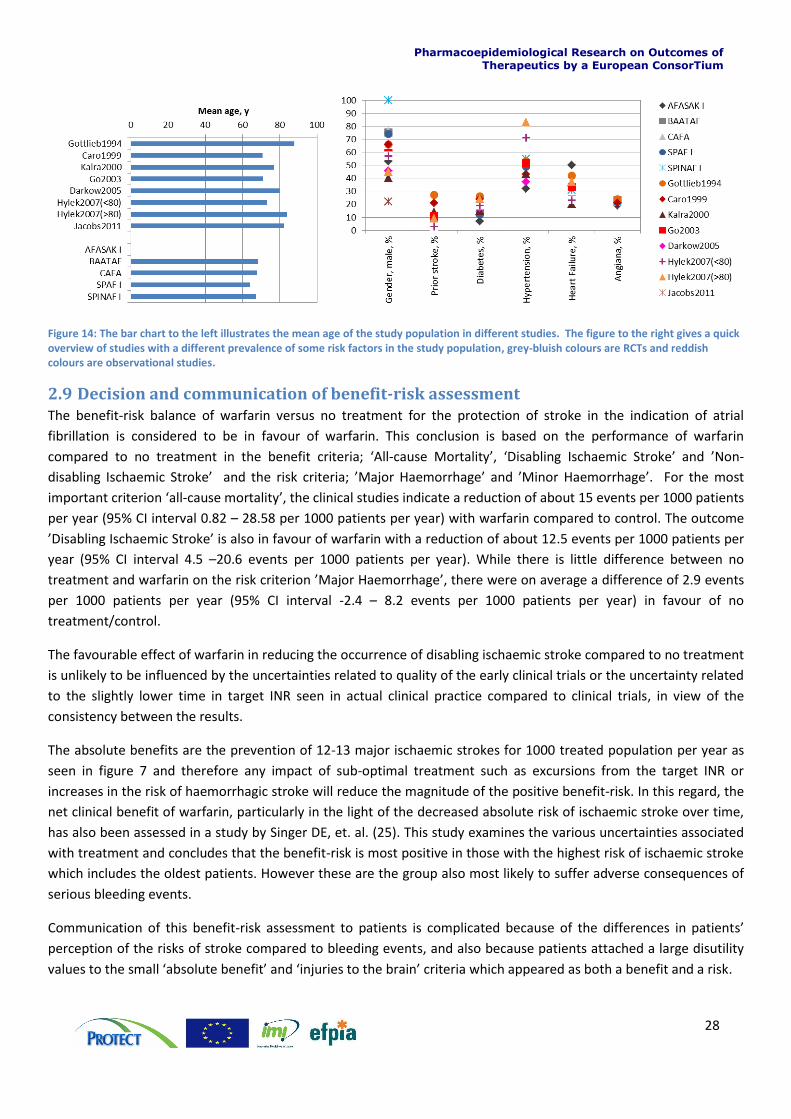
28
Figure 14: The bar chart to the left illustrates the mean age of the study population in different studies. The figure to the right gives a quick overview of studies with a different prevalence of some risk factors in the study population, grey-bluish colours are RCTs and reddish colours are observational studies.
2.9 Decision and communication of benefit-risk assessment The benefit-risk balance of warfarin versus no treatment for the protection of stroke in the indication of atrial
fibrillation is considered to be in favour of warfarin. This conclusion is based on the performance of warfarin
compared to no treatment in the benefit criteria; ‘All-cause Mortality’, ‘Disabling Ischaemic Stroke’ and ’Non-
disabling Ischaemic Stroke’ and the risk criteria; ’Major Haemorrhage’ and ’Minor Haemorrhage’. For the most
important criterion ‘all-cause mortality’, the clinical studies indicate a reduction of about 15 events per 1000 patients
per year (95% CI interval 0.82 – 28.58 per 1000 patients per year) with warfarin compared to control. The outcome
’Disabling Ischaemic Stroke’ is also in favour of warfarin with a reduction of about 12.5 events per 1000 patients per
year (95% CI interval 4.5 –20.6 events per 1000 patients per year). While there is little difference between no
treatment and warfarin on the risk criterion ’Major Haemorrhage’, there were on average a difference of 2.9 events
per 1000 patients per year (95% CI interval -2.4 – 8.2 events per 1000 patients per year) in favour of no
treatment/control.
The favourable effect of warfarin in reducing the occurrence of disabling ischaemic stroke compared to no treatment
is unlikely to be influenced by the uncertainties related to quality of the early clinical trials or the uncertainty related
to the slightly lower time in target INR seen in actual clinical practice compared to clinical trials, in view of the
consistency between the results.
The absolute benefits are the prevention of 12-13 major ischaemic strokes for 1000 treated population per year as
seen in figure 7 and therefore any impact of sub-optimal treatment such as excursions from the target INR or
increases in the risk of haemorrhagic stroke will reduce the magnitude of the positive benefit-risk. In this regard, the
net clinical benefit of warfarin, particularly in the light of the decreased absolute risk of ischaemic stroke over time,
has also been assessed in a study by Singer DE, et. al. (25). This study examines the various uncertainties associated
with treatment and concludes that the benefit-risk is most positive in those with the highest risk of ischaemic stroke
which includes the oldest patients. However these are the group also most likely to suffer adverse consequences of
serious bleeding events.
Communication of this benefit-risk assessment to patients is complicated because of the differences in patients’
perception of the risks of stroke compared to bleeding events, and also because patients attached a large disutility
values to the small ‘absolute benefit’ and ‘injuries to the brain’ criteria which appeared as both a benefit and a risk.
Pharmacoepidemiological Research on Outcomes of Therapeutics by a European ConsorTium
29
However the results suggest that it may be possible to derive some data from the published literature to allow a
benefit-risk assessment to be visualised, even for an older medicine. Additionally it has been possible in this case to
identify articles related to the use of warfarin in routine clinical practice, and to compare these to the results seen in
clinical trials. This helps reduce much of the uncertainty in the assessment. Such data may not always be available
and therefore this may impact the ability to derive robust benefit-risk assessments for older medicines. This group of
medicines includes some of the most widely prescribed medicines in clinical practice.
2.10 Discussion In work stream 1 the benefit-risk assessment of warfarin versus control was done based on data from 5 older
randomised trials. The availability of data did play a role in the definition of benefit-risk criteria and the value tree
(see Appendix 3: Iterative process to define value tree/effect table). A consequence of this was a grouping of
endpoints into broader defined benefit-risk criteria and difficulties in trading off benefit and risk criteria. The
quantitative analysis was used to test the effect of different weights for the risk criteria ‘major haemorrhage’ and to
take into account the large uncertainty related to the small sample size of the RCTs.
The weighting of benefit-risk criteria was done based on information available in the literature. However, such
information might not always be available, in this case it is also important to emphasise that the assessment of
outcome importance and weight elicitation should always represent the decision maker’s opinion.
Observational studies were used to evaluate if the benefit-risk balance based on data from RCTs could be considered
valid in the actual practice. This analysis showed a fairly good agreement between what was observed in the RCTs
and in the observational studies, but also flagged that some groups (e.g. high age > 80 years) might have a less
favourable benefit-risk from taking warfarin. This will be investigated further in WS3. Additionally, it should be
emphasised that the observational studies evaluated in this study do not represent an exhaustive review of studies
from the published literature.
Pharmacoepidemiological Research on Outcomes of Therapeutics by a European ConsorTium
30
3 Section 3: Work stream 2 – Warfarin versus Active Comparators
3.1 Introduction This section discusses the second work stream in the warfarin case study where the benefit-risk balance of warfarin
is assessed and compared to new active comparators. The benefit-risk assessment is structured according to the
BRAT framework as described in Section Error! Reference source not found..
The benefit-risk assessment of warfarin in atrial fibrillation versus the alternatives rivaroxaban, apixaban and
dabigatran is presented here. We also explore the differences it would make to the benefit-risk balance when using
warfarin data from new randomised clinical trials compared to using data from the older warfarin randomised
clinical trials.
3.2 Decision context Until recently warfarin was the only licensed anticoagulant for the indication of stroke prevention in patients with
atrial fibrillation. Newer therapies have recently become available, with more specific and more direct effects on the
coagulation process, such as factor Xa inhibitors (including rivaroxaban and apixaban) and thromin (II) inhibitors
(including dabigatran), see figure 1 page 7.
These products are administered at a fixed dose, orally, without the need for monitoring. These products are not
affected by vitamin K or food, and compared to warfarin, have minimal drug-drug interactions. Although these
drugs appear more convenient, it is important to compare the benefits, and the risks to those of warfarin, as these
drugs too are associated with bleeding related adverse events, including cerebral haemorrhages.
In WS2 the benefit-risk assessment of warfarin will be against the three newer anticoagulation agents rivaroxaban,
dabigatran and apixaban. As in WS1, the assessment will be for the prevention of thrombotic stroke for patients with
non-valvular atrial fibrillation. This case study is used to illustrate some of the differences in approach required for
older products, where clinical trial data to current standards may not be available.
Pharmacoepidemiological Research on Outcomes of Therapeutics by a European ConsorTium
31
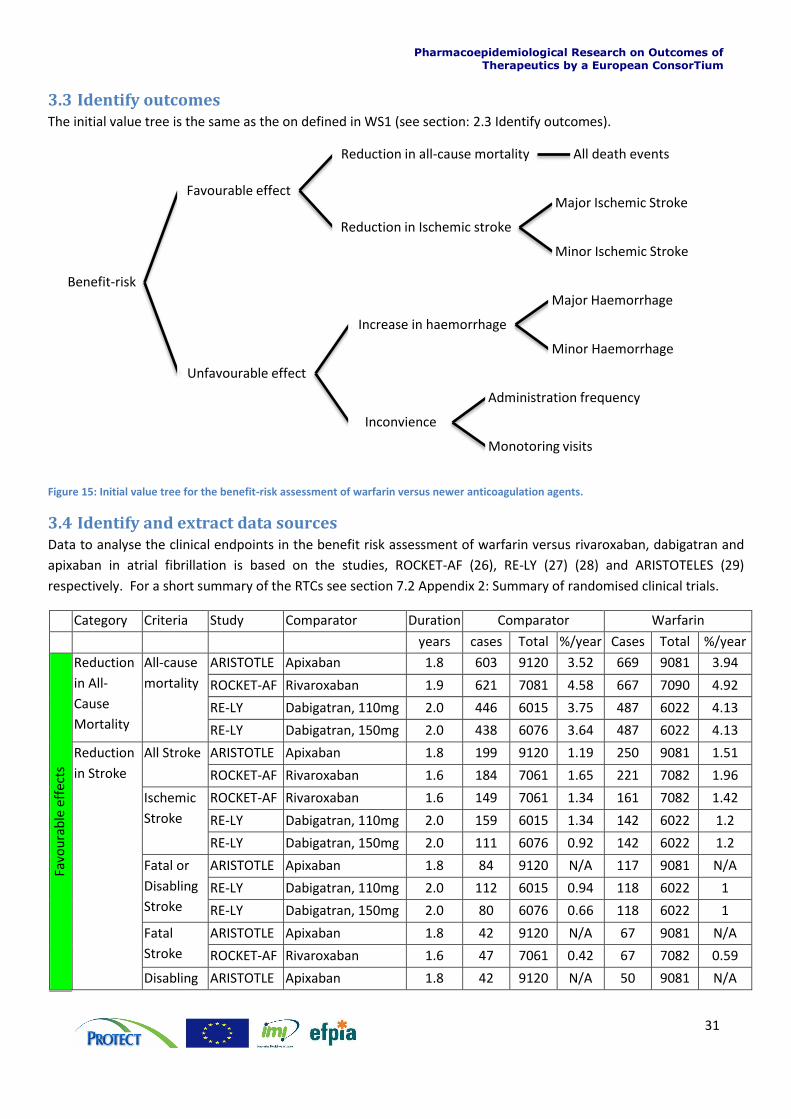
3.3 Identify outcomes The initial value tree is the same as the on defined in WS1 (see section: 2.3 Identify outcomes).
Figure 15: Initial value tree for the benefit-risk assessment of warfarin versus newer anticoagulation agents.
3.4 Identify and extract data sources Data to analyse the clinical endpoints in the benefit risk assessment of warfarin versus rivaroxaban, dabigatran and
apixaban in atrial fibrillation is based on the studies, ROCKET-AF (26), RE-LY (27) (28) and ARISTOTELES (29)
respectively. For a short summary of the RTCs see section 7.2 Appendix 2: Summary of randomised clinical trials.
Category Criteria Study Comparator Duration Comparator Warfarin
years cases Total %/year Cases Total %/year
Favo
ura
ble
eff
ects
Reduction
in All-
Cause
Mortality
All-cause
mortality
ARISTOTLE Apixaban 1.8 603 9120 3.52 669 9081 3.94
ROCKET-AF Rivaroxaban 1.9 621 7081 4.58 667 7090 4.92
RE-LY Dabigatran, 110mg 2.0 446 6015 3.75 487 6022 4.13
RE-LY Dabigatran, 150mg 2.0 438 6076 3.64 487 6022 4.13
Reduction
in Stroke
All Stroke ARISTOTLE Apixaban 1.8 199 9120 1.19 250 9081 1.51
ROCKET-AF Rivaroxaban 1.6 184 7061 1.65 221 7082 1.96
Ischemic
Stroke
ROCKET-AF Rivaroxaban 1.6 149 7061 1.34 161 7082 1.42
RE-LY Dabigatran, 110mg 2.0 159 6015 1.34 142 6022 1.2
RE-LY Dabigatran, 150mg 2.0 111 6076 0.92 142 6022 1.2
Fatal or
Disabling
Stroke
ARISTOTLE Apixaban 1.8 84 9120 N/A 117 9081 N/A
RE-LY Dabigatran, 110mg 2.0 112 6015 0.94 118 6022 1
RE-LY Dabigatran, 150mg 2.0 80 6076 0.66 118 6022 1
Fatal
Stroke
ARISTOTLE Apixaban 1.8 42 9120 N/A 67 9081 N/A
ROCKET-AF Rivaroxaban 1.6 47 7061 0.42 67 7082 0.59
Disabling ARISTOTLE Apixaban 1.8 42 9120 N/A 50 9081 N/A
Benefit-risk
Favourable effect
Reduction in all-cause mortality All death events
Reduction in Ischemic stroke
Major Ischemic Stroke
Minor Ischemic Stroke
Unfavourable effect
Increase in haemorrhage
Major Haemorrhage
Minor Haemorrhage
Inconvience
Administration frequency
Monotoring visits
Pharmacoepidemiological Research on Outcomes of Therapeutics by a European ConsorTium
32
Stroke ROCKET-AF Rivaroxaban 1.6 43 7061 0.39 57 7082 0.5
Non-
disabling
Stroke
ARISTOTLE Apixaban 1.8 115 9120 N/A 133 9081 N/A
ROCKET-AF Rivaroxaban 1.6 88 7061 0.79 87 7082 0.77
RE-LY Dabigatran, 110mg 2.0 60 6015 0.5 69 6022 0.58
RE-LY Dabigatran, 150mg 2.0 44 6076 0.37 69 6022 0.58
Un
favo
ura
ble
eff
ects
Increase in
Haemorrh
age
Haemorrh
agic
Stroke
ROCKET-AF Rivaroxaban 1.6 29 7061 0.26 50 7082 0.44
RE-LY Dabigatran, 110mg 1.2 14 6015 0.2 45 6022 0.38
RE-LY Dabigatran, 150mg 2.0 12 6076 0.1 45 6022 0.38
Fatal
Bleed
ARISTOTLE Apixaban 1.8 34 9120 N/A 55 9081 N/A
ROCKET-AF Rivaroxaban 1.9 27 7111 0.2 55 7125 0.5
RE-LY Dabigatran, 110mg 2.0 23 6015 0.19 39 6022 0.33
RE-LY Dabigatran, 150mg 2.0 28 6076 0.23 39 6022 0.33
Major
Bleed*
ARISTOTLE† Apixaban 1.7 380 9088 N/A 459 9052 N/A
ROCKET-AF Rivaroxaban 1.4 579 7111 N/A 536 7125 N/A
RE-LY Dabigatran, 110mg 2.0 319 6015 N/A 382 6022 N/A
RE-LY Dabigatran, 150mg 2.0 371 6076 N/A 382 6022 N/A
Minor
Bleed
ROCKET-AF Rivaroxaban 1.4 1185 7111 N/A 1151 7125 N/A
RE-LY Dabigatran, 110mg 2.0 1566 6015 13.16 1931 6022 16.37
RE-LY Dabigatran, 150mg 2.0 1787 6076 14.84 1931 6022 16.37
Stroke refers to both ischemic and haemorrhagic stroke in nothing else is stated
*Include intracranial haemorrhage and exclude fatal events
†Exclude intracranial haemorrhage and include fatal events
N/A – data not available
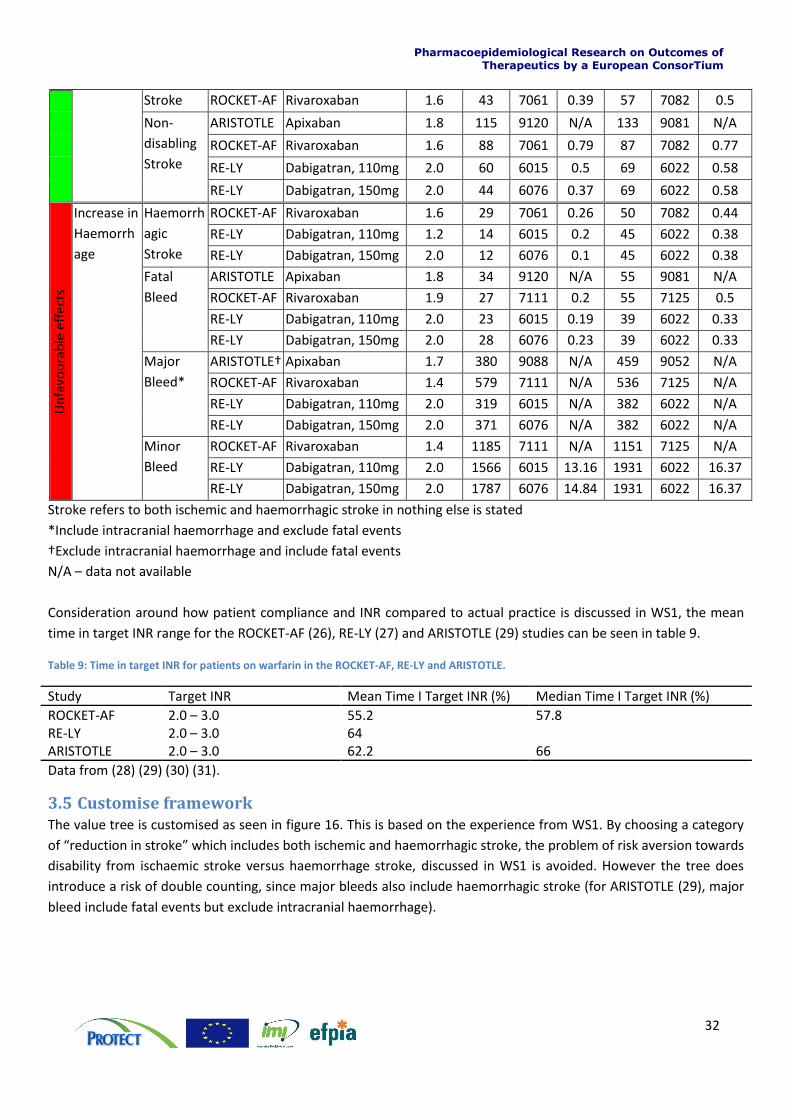
Consideration around how patient compliance and INR compared to actual practice is discussed in WS1, the mean
time in target INR range for the ROCKET-AF (26), RE-LY (27) and ARISTOTLE (29) studies can be seen in table 9.
Table 9: Time in target INR for patients on warfarin in the ROCKET-AF, RE-LY and ARISTOTLE.
Study Target INR Mean Time I Target INR (%) Median Time I Target INR (%)
ROCKET-AF 2.0 – 3.0 55.2 57.8 RE-LY 2.0 – 3.0 64 ARISTOTLE 2.0 – 3.0 62.2 66
Data from (28) (29) (30) (31).
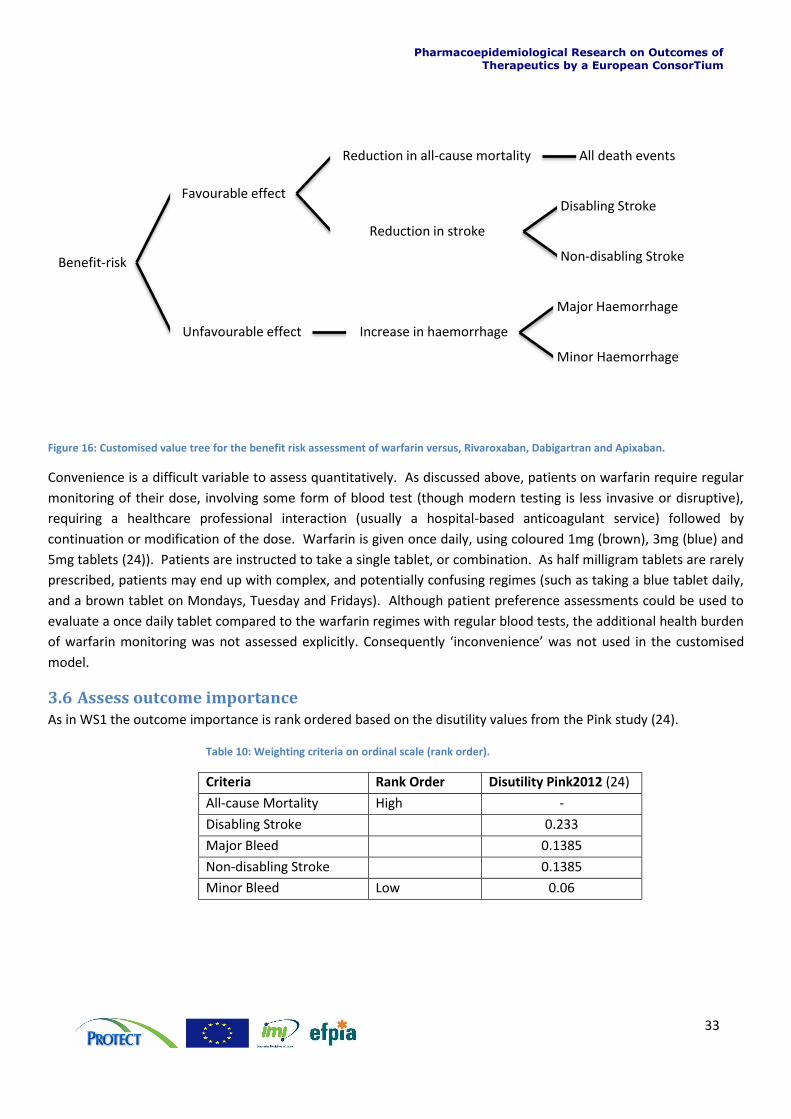
3.5 Customise framework The value tree is customised as seen in figure 16. This is based on the experience from WS1. By choosing a category
of “reduction in stroke” which includes both ischemic and haemorrhagic stroke, the problem of risk aversion towards
disability from ischaemic stroke versus haemorrhage stroke, discussed in WS1 is avoided. However the tree does
introduce a risk of double counting, since major bleeds also include haemorrhagic stroke (for ARISTOTLE (29), major
bleed include fatal events but exclude intracranial haemorrhage).
Pharmacoepidemiological Research on Outcomes of Therapeutics by a European ConsorTium
33
Figure 16: Customised value tree for the benefit risk assessment of warfarin versus, Rivaroxaban, Dabigartran and Apixaban.
Convenience is a difficult variable to assess quantitatively. As discussed above, patients on warfarin require regular
monitoring of their dose, involving some form of blood test (though modern testing is less invasive or disruptive),
requiring a healthcare professional interaction (usually a hospital-based anticoagulant service) followed by
continuation or modification of the dose. Warfarin is given once daily, using coloured 1mg (brown), 3mg (blue) and
5mg tablets (24)). Patients are instructed to take a single tablet, or combination. As half milligram tablets are rarely
prescribed, patients may end up with complex, and potentially confusing regimes (such as taking a blue tablet daily,
and a brown tablet on Mondays, Tuesday and Fridays). Although patient preference assessments could be used to
evaluate a once daily tablet compared to the warfarin regimes with regular blood tests, the additional health burden
of warfarin monitoring was not assessed explicitly. Consequently ‘inconvenience’ was not used in the customised
model.
3.6 Assess outcome importance As in WS1 the outcome importance is rank ordered based on the disutility values from the Pink study (24).
Table 10: Weighting criteria on ordinal scale (rank order).
Criteria Rank Order Disutility Pink2012 (24)
All-cause Mortality High -
Disabling Stroke 0.233
Major Bleed 0.1385
Non-disabling Stroke 0.1385
Minor Bleed Low 0.06
Benefit-risk
Favourable effect
Reduction in all-cause mortality All death events
Reduction in stroke
Disabling Stroke
Non-disabling Stroke
Unfavourable effect Increase in haemorrhage
Major Haemorrhage
Minor Haemorrhage
Pharmacoepidemiological Research on Outcomes of Therapeutics by a European ConsorTium
34
3.7 Quantify and interpret key benefit-risk metric
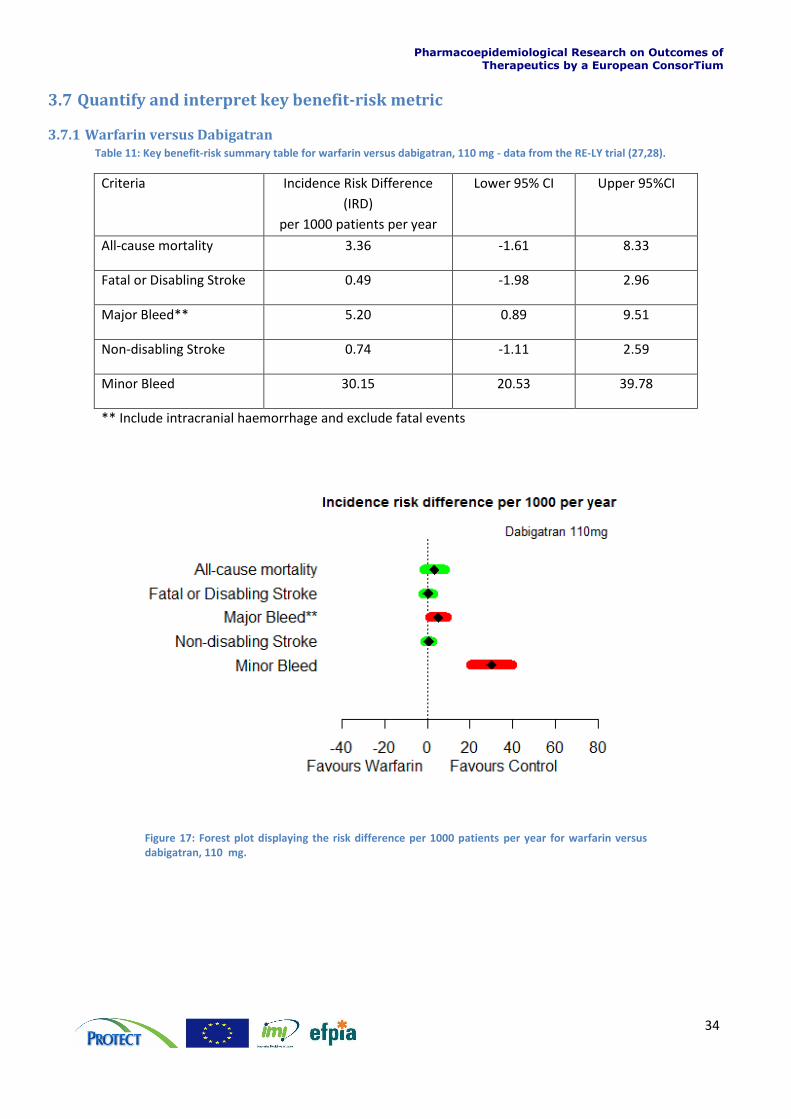
3.7.1 Warfarin versus Dabigatran Table 11: Key benefit-risk summary table for warfarin versus dabigatran, 110 mg - data from the RE-LY trial (27,28).
Criteria Incidence Risk Difference
(IRD)
per 1000 patients per year
Lower 95% CI Upper 95%CI
All-cause mortality 3.36 -1.61 8.33
Fatal or Disabling Stroke 0.49 -1.98 2.96
Major Bleed** 5.20 0.89 9.51
Non-disabling Stroke 0.74 -1.11 2.59
Minor Bleed 30.15 20.53 39.78
** Include intracranial haemorrhage and exclude fatal events
Figure 17: Forest plot displaying the risk difference per 1000 patients per year for warfarin versus dabigatran, 110 mg.
Pharmacoepidemiological Research on Outcomes of Therapeutics by a European ConsorTium
35
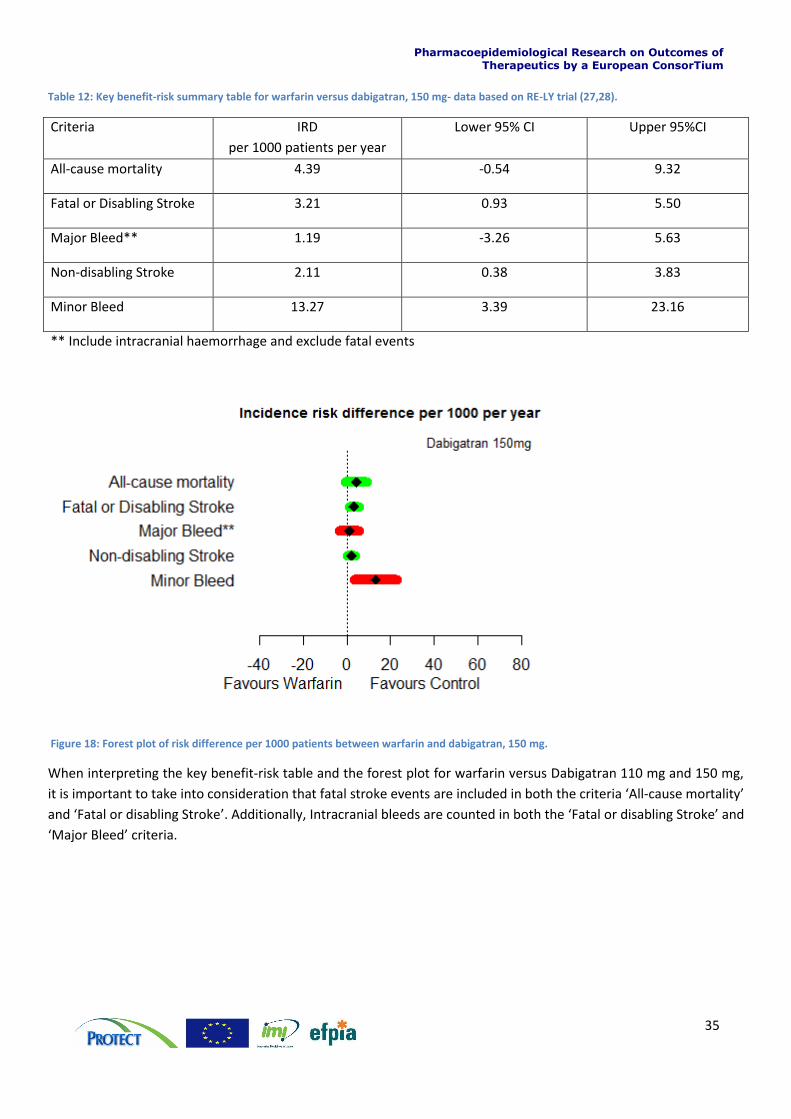
Table 12: Key benefit-risk summary table for warfarin versus dabigatran, 150 mg- data based on RE-LY trial (27,28).
Criteria IRD
per 1000 patients per year
Lower 95% CI Upper 95%CI
All-cause mortality 4.39 -0.54 9.32
Fatal or Disabling Stroke 3.21 0.93 5.50
Major Bleed** 1.19 -3.26 5.63
Non-disabling Stroke 2.11 0.38 3.83
Minor Bleed 13.27 3.39 23.16
** Include intracranial haemorrhage and exclude fatal events
Figure 18: Forest plot of risk difference per 1000 patients between warfarin and dabigatran, 150 mg.
When interpreting the key benefit-risk table and the forest plot for warfarin versus Dabigatran 110 mg and 150 mg,
it is important to take into consideration that fatal stroke events are included in both the criteria ‘All-cause mortality’
and ‘Fatal or disabling Stroke’. Additionally, Intracranial bleeds are counted in both the ‘Fatal or disabling Stroke’ and
‘Major Bleed’ criteria.
Pharmacoepidemiological Research on Outcomes of Therapeutics by a European ConsorTium
36
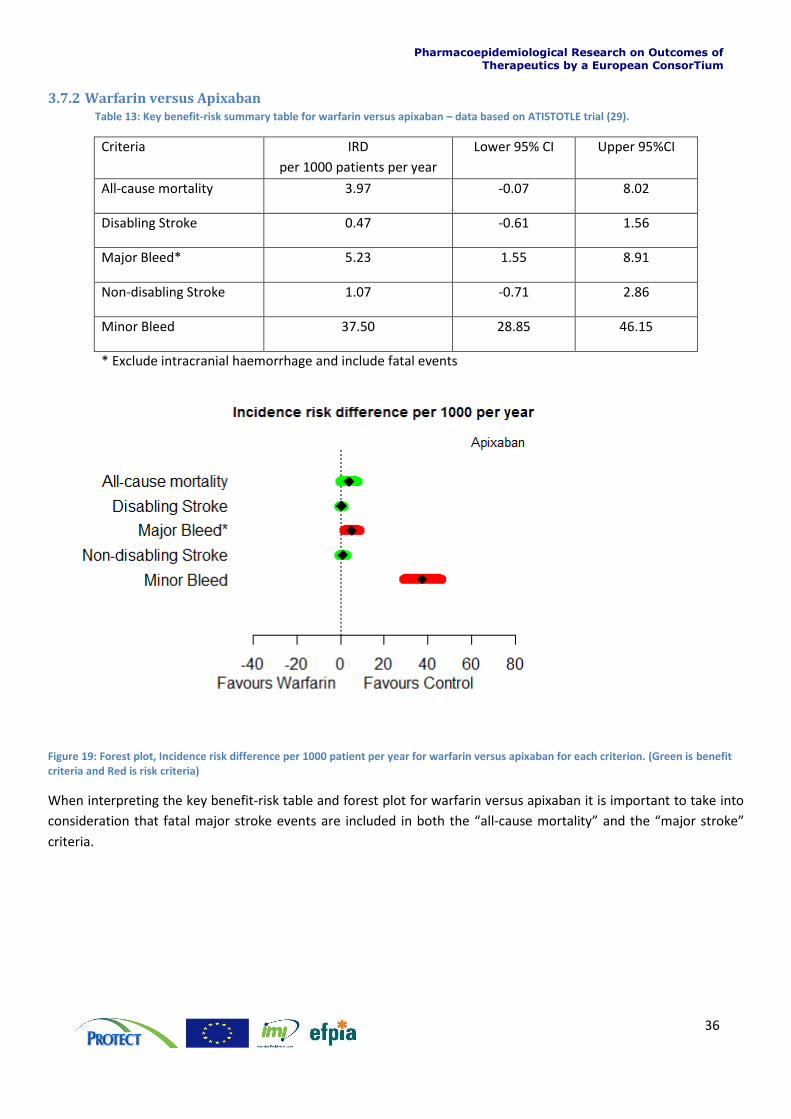
3.7.2 Warfarin versus Apixaban Table 13: Key benefit-risk summary table for warfarin versus apixaban – data based on ATISTOTLE trial (29).
Criteria IRD
per 1000 patients per year
Lower 95% CI Upper 95%CI
All-cause mortality 3.97 -0.07 8.02
Disabling Stroke 0.47 -0.61 1.56
Major Bleed* 5.23 1.55 8.91
Non-disabling Stroke 1.07 -0.71 2.86
Minor Bleed 37.50 28.85 46.15
* Exclude intracranial haemorrhage and include fatal events
Figure 19: Forest plot, Incidence risk difference per 1000 patient per year for warfarin versus apixaban for each criterion. (Green is benefit criteria and Red is risk criteria)
When interpreting the key benefit-risk table and forest plot for warfarin versus apixaban it is important to take into
consideration that fatal major stroke events are included in both the “all-cause mortality” and the “major stroke”
criteria.
Pharmacoepidemiological Research on Outcomes of Therapeutics by a European ConsorTium
37
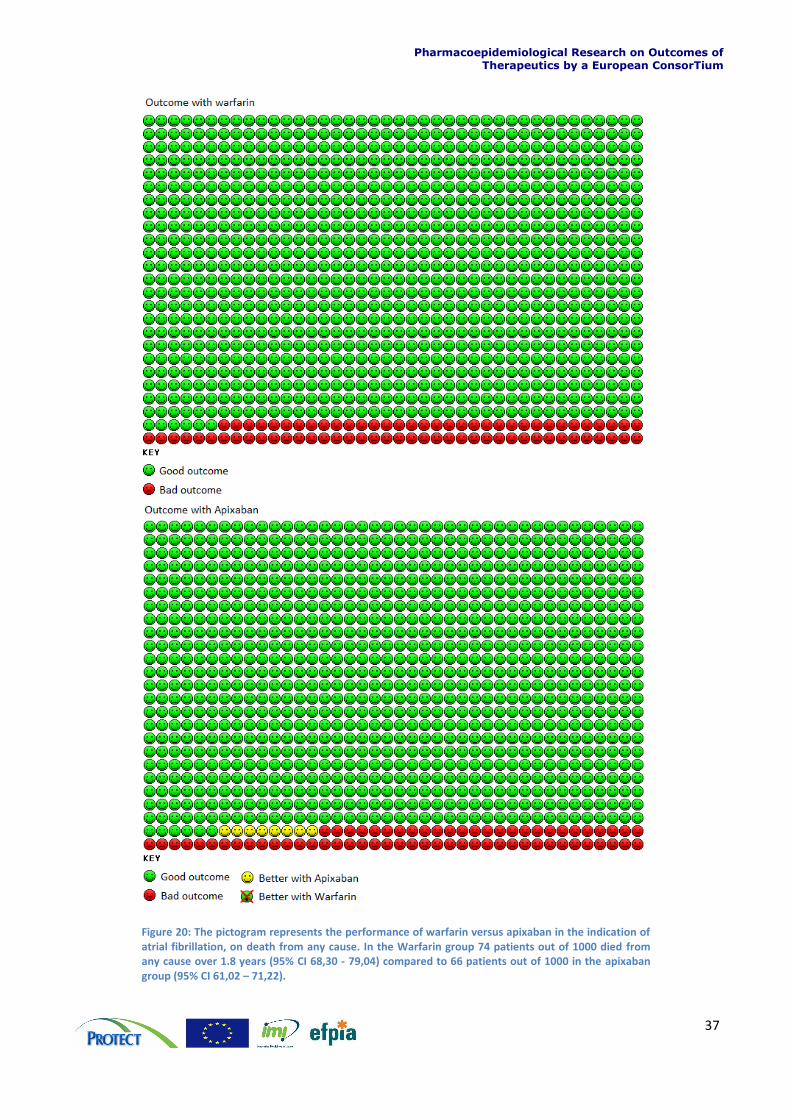
Figure 20: The pictogram represents the performance of warfarin versus apixaban in the indication of atrial fibrillation, on death from any cause. In the Warfarin group 74 patients out of 1000 died from any cause over 1.8 years (95% CI 68,30 - 79,04) compared to 66 patients out of 1000 in the apixaban group (95% CI 61,02 – 71,22).
Pharmacoepidemiological Research on Outcomes of Therapeutics by a European ConsorTium
38
3.7.3 Warfarin versus rivaroxaban
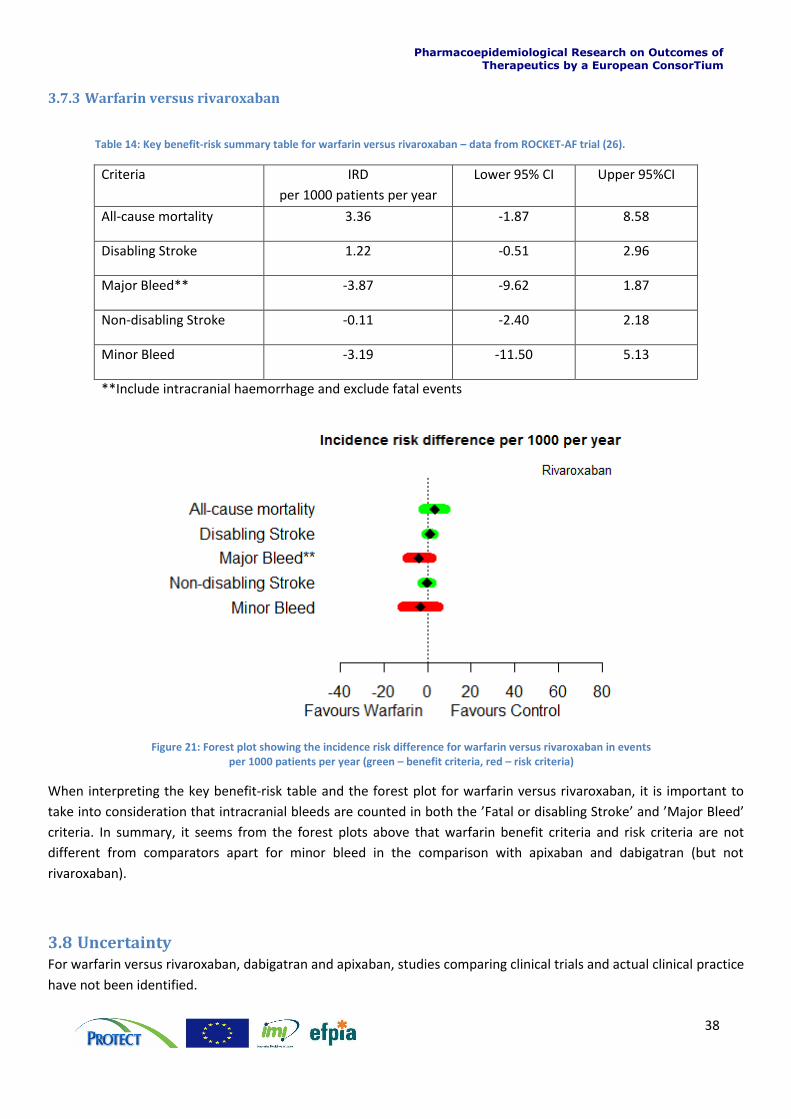
Table 14: Key benefit-risk summary table for warfarin versus rivaroxaban – data from ROCKET-AF trial (26).
Criteria IRD
per 1000 patients per year
Lower 95% CI Upper 95%CI
All-cause mortality 3.36 -1.87 8.58
Disabling Stroke 1.22 -0.51 2.96
Major Bleed** -3.87 -9.62 1.87
Non-disabling Stroke -0.11 -2.40 2.18
Minor Bleed -3.19 -11.50 5.13
**Include intracranial haemorrhage and exclude fatal events
Figure 21: Forest plot showing the incidence risk difference for warfarin versus rivaroxaban in events per 1000 patients per year (green – benefit criteria, red – risk criteria)
When interpreting the key benefit-risk table and the forest plot for warfarin versus rivaroxaban, it is important to
take into consideration that intracranial bleeds are counted in both the ’Fatal or disabling Stroke’ and ’Major Bleed’
criteria. In summary, it seems from the forest plots above that warfarin benefit criteria and risk criteria are not
different from comparators apart for minor bleed in the comparison with apixaban and dabigatran (but not
rivaroxaban).
3.8 Uncertainty For warfarin versus rivaroxaban, dabigatran and apixaban, studies comparing clinical trials and actual clinical practice
have not been identified.
Pharmacoepidemiological Research on Outcomes of Therapeutics by a European ConsorTium
39
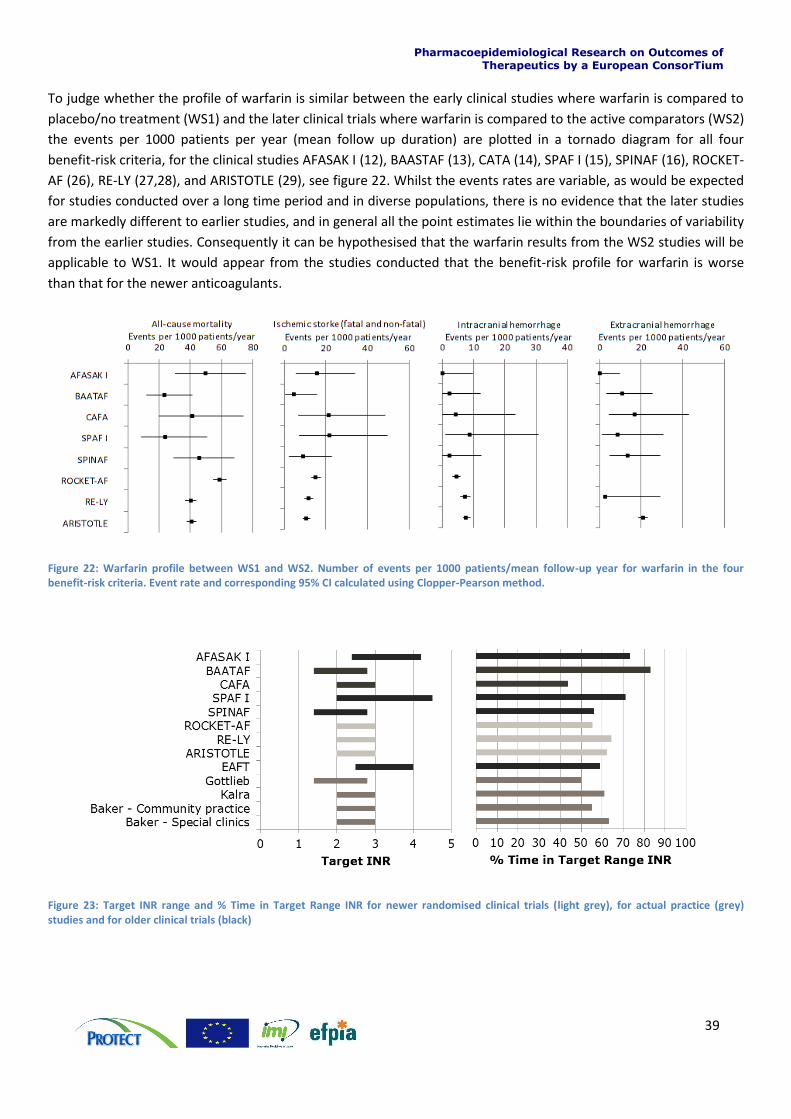
To judge whether the profile of warfarin is similar between the early clinical studies where warfarin is compared to
placebo/no treatment (WS1) and the later clinical trials where warfarin is compared to the active comparators (WS2)
the events per 1000 patients per year (mean follow up duration) are plotted in a tornado diagram for all four
benefit-risk criteria, for the clinical studies AFASAK I (12), BAASTAF (13), CATA (14), SPAF I (15), SPINAF (16), ROCKET-
AF (26), RE-LY (27,28), and ARISTOTLE (29), see figure 22. Whilst the events rates are variable, as would be expected
for studies conducted over a long time period and in diverse populations, there is no evidence that the later studies
are markedly different to earlier studies, and in general all the point estimates lie within the boundaries of variability
from the earlier studies. Consequently it can be hypothesised that the warfarin results from the WS2 studies will be
applicable to WS1. It would appear from the studies conducted that the benefit-risk profile for warfarin is worse
than that for the newer anticoagulants.
Figure 22: Warfarin profile between WS1 and WS2. Number of events per 1000 patients/mean follow-up year for warfarin in the four benefit-risk criteria. Event rate and corresponding 95% CI calculated using Clopper-Pearson method.
Figure 23: Target INR range and % Time in Target Range INR for newer randomised clinical trials (light grey), for actual practice (grey) studies and for older clinical trials (black)

Pharmacoepidemiological Research on Outcomes of Therapeutics by a European ConsorTium
40
3.9 Decision and communication of benefit-risk assessment In order to communicate the benefit-risk assessment for warfarin to healthcare professionals, either the warfarin
versus placebo or no treatment, or the warfarin versus new comparator would be meaningful. These 2 different
assessments answer 2 different questions. The first one answers the question of whether to treat patients in non-
valvular atrial fibrillation with warfarin or not, which is the situation physicians have been experiencing until
recently. The second one answers whether there is any incremental benefit, and how large that benefit may be, for
choosing a newer anticoagulant compared to warfarin. In this case, the data presented in figure 17 - figure 19 may
be helpful in establishing that warfarin and new anticoagulants are comparable, on fields where similar data exist.
However, there are some fields where data are not available. These include “inconvenience” aspects of a treatment,
such as issues with drug-drug and drug-food interactions and the need for regular INR monitoring with warfarin, and
concerns over the lack of antidote and the lack of monitoring with the newer anticoagulants. However if any
quantification of data and of preferences on this criteria had been available, they would likely have all pointed
towards an advantage of newer comparators versus warfarin.
In order to communicate the benefit-risk assessment for warfarin to patients however, the requirements are
different. Patients who want this level of information will need to understand the risks of adverse events if they are
not treated at all, and the risks of adverse events under treatment. The communication of benefit-risk to patients for
older products is complicated by the lack of availability of relevant data. However, this study demonstrates that
visual displays such as that in figure 20 may be used to aid the communication to patients. Patient’s disutility for
softer criteria such as inconvenience is more difficult to quantify. Additionally, there may be an asymmetric aversion
to risk (one for haemorrhagic, the other for ischemic stroke). It is important to avoid inconsistencies among
conclusions of identical decision problems, but framed differently. For this, it might be helpful reasoning in terms of
health metrics, like mortality and disability, rather than focusing on the cause of fatal or disabling events.
3.10 Discussion In work stream 2 (WS2) a qualitative assessment of warfarin versus active comparators was done. The data used in
the assessment came from 3 large RCTs. As for WS2 data availability was limited to published data, which influenced
the definition of benefit and risk criteria. The benefit-risk criteria was chosen to mimic the criteria from WS1,
however it was not possible to extract data on ischaemic stroke, and therefore the assessment was based on the
criteria disabling stroke (ischaemic and haemorrhagic) and non-disabling stroke (ischaemic and haemorrhagic) the
criteria major bleed was defined differently in the three assessments. For dabigatran and rivaroxaban major bleeds
included intracranial haemorrhage (also included in the stroke criteria) but not fatal events. For apixaban major
bleed excluded intracranial haemorrhage but included fatal events (also included in the ‘all-cause mortality’ criteria).
Therefore the assessments in WS2 introduced a risk of double counting. The data from the warfarin arm of the
newer RCTs was compared to data from the warfarin arm of the old RCTs in order to assess whether the evidence
from the old and quite small RCTs matched the evidence from the new RCTs. There is a good agreement between
the evidence from the older and newer RCTs, on the four criteria ‘all-cause mortality’, ‘ischaemic stroke (fatal and
non-fatal)’, ‘intercranial haemorrhage’ and extracranial haemorrhage’ despite the differences between the old and
the new RCT in relation to target INR which is generally narrower in the new trials and TTR which is general lower in
the never RCTs compared to the older.
Pharmacoepidemiological Research on Outcomes of Therapeutics by a European ConsorTium
41
4 Section 4: Individual benefit risk assessments for warfarin using patient level
data
4.1 Introduction There is limited evidence on how the benefit-risk profile for warfarin varies with individual patient characteristics
and how to best identify those patients where the benefits of warfarin in reducing the risks of ischaemic events
outweigh the adverse haemorrhagic effects. Most epidemiological research focuses on the estimation of relative
measures (such as relative rates or odds ratios) rather than absolute risks and is based on population level analyses.
But relative rates do not convey the absolute effect of treatment (32) and population level analyses may be
inappropriate for an individual patient. Attributable risks are the probability of the occurrence of a particular event
over a specific time-period as a result of exposure. Attributable risks (or risk difference), rather than relative rates,
are of key importance in the assessment of the risk and benefit of drug therapies. An adverse event with a large
relative rate that occurs only rarely may be less important than an event with a small relative rate occurring
frequently.
In WS3, we use real life data from the CPRD database to estimate as accurately as possible the individual risks of
bleeding and stroke in patients with atrial fibrillation (AF) treated with warfarin. Furthermore we explore
characteristics that influence the individual benefit-risk balance.
4.2 Methods
4.2.1 Data source
Data for this study were obtained from the Clinical Practice Research Datalink (CPRD). CPRD collates the
computerized medical records of general practitioners (GPs). GPs play a key role in the UK healthcare system, as they
are responsible for primary healthcare and specialist referrals. Patients are semi-permanently affiliated with a
practice that centralizes the medical information from the GPs, specialist referrals, and hospitalizations. The data
recorded in the CPRD include demographic information, prescription details, clinical events, preventive care
provided, specialist referrals, hospital admissions, and major outcomes [www.cprd.com]. Several software packages
are used by GPs for their patients’ medical records, including Vision from In Practice Systems Ltd and EMIS that
combined covers just over 80% of all UK practices. The CPRD currently contains the complete anonymised patient
medical records from GPs who use the system from In Practice Systems and who agree to adhere to “Recording
Guidelines” that are subject to detailed quality control checks of data at both practice and individual patient level.
CPRD can now be linked individually and anonymously to other NHS datasets in England. Currently, over 325 GP
practices in England are participating in this linkage (about 50% of CPRD). Participating GP practices send information
on patient identifiers (including NHS number) and the anonymous CPRD patient number to a trusted third party. The
linked database also sends information on patient identifiers and their patient numbers to the trusted third party.
After matching, the patient identifiers are removed and CPRD is then linked anonymously to other databases.
Data from the following datasets were used for this study in addition to CPRD:
Hospital Episode Statistics (HES). The HES includes records of inpatient hospitalisations (including date of admission and discharge, diagnoses and procedures)
Pharmacoepidemiological Research on Outcomes of Therapeutics by a European ConsorTium
42
4.2.2 Study design
The study design was a retrospective cohort. The start of follow-up was 1st January 1990, the start date of CPRD or
HES data collection for each patient, whichever date came last. The end of follow-up was the end date of data
collection for each patient in CPRD or HES, whichever date came earliest. Patients were censored 6 months after the
date of the last warfarin prescription.
4.2.3 Study population
The cohort of warfarin users included patients aged ≥18 years with a documented record of AF. The index date was
the first warfarin prescription issued at least 12 months after start of data collection. Patients with a record of
rheumatic valve disease or patients with valvular repair/replacement were excluded.
4.2.4 Outcomes
The following outcomes were measured in this study.
On the benefit side:
Ischaemic stroke (recorded in HES)
Transient ischaemic attack (recorded in CPRD) On the risk side:
Haemorrhagic stroke (recorded in HES)
Major bleed (recorded in HES). Major bleed was defined as symptomatic bleeding in a critical area or organ (excluding intracranial), such as intraspinal, intraocular, retroperitoneal, gastrointestinal, intraarticular or pericardial, or intramuscular with compartment syndrome.
4.2.5 Individual benefit-risk balance
We used methods described previously by the CPRD-group to calculate attributable risk and benefit for each
individual (30). The first step was to estimate the cumulative incidence (CI) of an event for each set of patient
characteristics using the survivor function in the Cox-proportional hazard regression model. In this way the model
allows calculation of an individual’s probability of an outcome. The second step is to obtain an estimate on the likely
effects on this event of the drug. We assumed for this case study that the relative rate (RR) found in randomized
clinical trials is an unbiased estimate of the drug effect and is expected to be consistent across the population. If the
RR of drug effect is known, the underlying (unexposed) event probability can be estimated by dividing the event
probability in the exposed through the RR. The attributable risk is the difference between the exposed and
unexposed event probabilities (see text box 1 for schematic representation). The information on the RR’s (drug
effect) were obtained from the Cochrane meta-analysis and a meta-regression based on the literature review done
in work stream 1 (18) . The meta-regression was done to correct for differences in INR time in therapeutic range
(TTR). Table 16 gives an overview of the selected RR’s.
Table 15: Chosen relative rates for the different outcomes and their sources.
Outcome Relative Rate Source
TIA 0.45 Cochrane meta-analysis
Ischaemic stroke 0.28 WS1 – meta-regression
Haemorrhagic stroke 2.38 Cochrane meta-analysis
Major Bleed 1.23 WS1 – meta-regression
Pharmacoepidemiological Research on Outcomes of Therapeutics by a European ConsorTium
43
The number of cases of haemorrhagic stroke and major bleed that would occur and the number of cases of
ischaemic stroke and TIA that were prevented whilst exposed to warfarin were calculated by taking the average
difference between cumulative incidence exposed and cumulative incidence unexposed per 1000 patients. The
results were stratified for a patients risk for ischaemic stroke according to the CHA2DS2-VASc (consisting of:
congestive heart failure, hypertension, age >75, diabetes mellitus, stroke, vascular disease, age 65-74 and female
gender) and risk of bleed according to the HAS-BLED (consisting of: hypertension, abnormal liver/kidney function,
stroke, bleed, labile INR, age>65, drugs/alcohol intake). The net benefit was calculated as the weighted sum of the
probability of a beneficial outcome (in %) minus the probability of an adverse event (in %) caused by warfarin
(attributable risk/benefit). The weight was chosen on the basis of the 1-year mortality of the outcome compared to
the mortality of ischaemic stroke. This led to the following formula:
Net benefit = (Prevention of ischaemic stroke + Prevention of TIA*0.84) – (Occurrence of Haemorrhagic stroke*1.7 –
Occurrence of Major bleed*0.91)
For each individual the net benefit was calculated. The net benefit represents the net probability (%) of the
prevention of an ischaemic stroke. Then each patient was assigned to one of the following groups: unfavourable (net
benefit < 0.5%), favourable (net benefit 0.5-1.5%) and a very favourable (net benefit >1.5%) benefit-risk balance.
These limits were chosen on the basis of the variation and occurrence of the values of net benefit across the
population, in order to create three comparable groups. Table16 shows the ranges of the quartiles.
Table 16: Range of quantiles of net benefit
Quantile Estimate
100% 1675.7
99% 10.1
95% 4.2
90% 2.5
75% Q3 1.5
50% Median 1.0
25% Q1 0.6
10% 0.2
5% -0.7
1% -11.8
0% Min -404.5
Patients that had a net benefit around average were considered to be favourable, patients that were below or above
this average range were considered to be respectively unfavourable or very favourable. We used logistic regression
RR = Cum Inc exposed/ Cum Inc unexposed RR: from literature review
Cum Inc exposed: estimated in database with Cox proportional hazard model Attributable risks/benefit = Cum Inc exposed – Cum Inc unexposed
Texbox 1
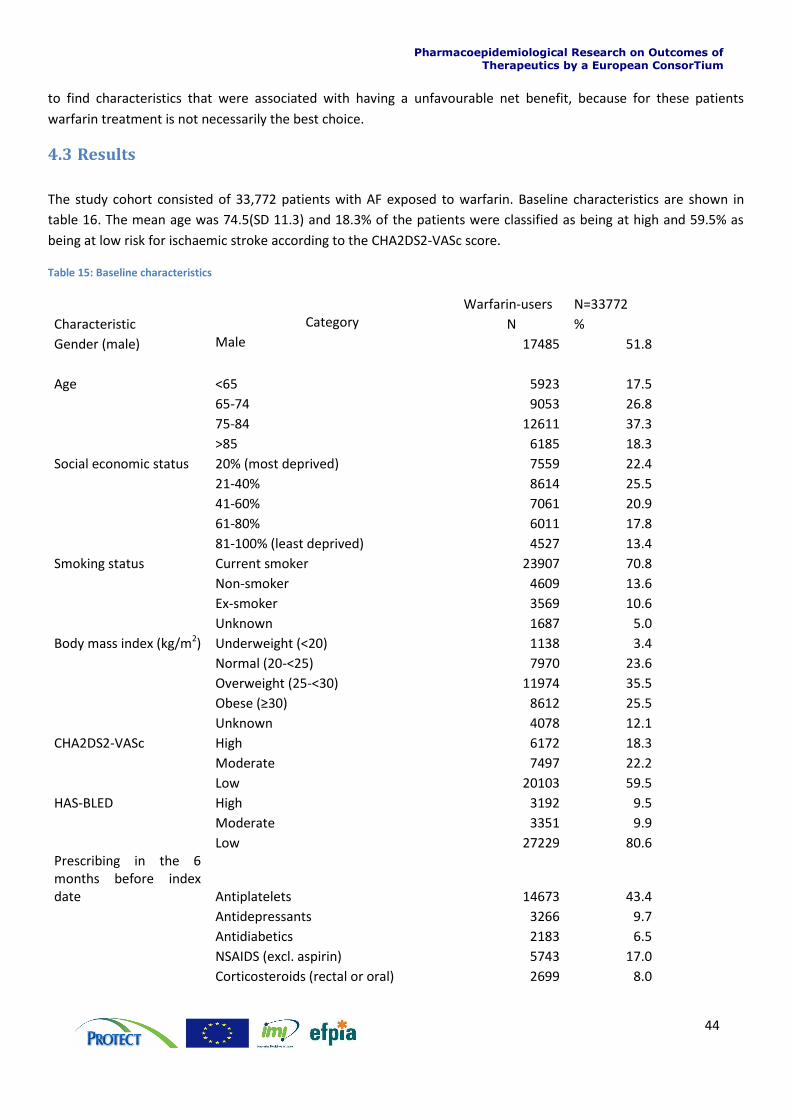
Pharmacoepidemiological Research on Outcomes of Therapeutics by a European ConsorTium
44
to find characteristics that were associated with having a unfavourable net benefit, because for these patients
warfarin treatment is not necessarily the best choice.
4.3 Results
The study cohort consisted of 33,772 patients with AF exposed to warfarin. Baseline characteristics are shown in
table 16. The mean age was 74.5(SD 11.3) and 18.3% of the patients were classified as being at high and 59.5% as
being at low risk for ischaemic stroke according to the CHA2DS2-VASc score.
Table 15: Baseline characteristics
Warfarin-users N=33772
Characteristic Category N %
Gender (male) Male 17485 51.8
Age <65 5923 17.5
65-74 9053 26.8
75-84 12611 37.3
>85 6185 18.3
Social economic status 20% (most deprived) 7559 22.4
21-40% 8614 25.5
41-60% 7061 20.9
61-80% 6011 17.8
81-100% (least deprived) 4527 13.4
Smoking status Current smoker 23907 70.8
Non-smoker 4609 13.6
Ex-smoker 3569 10.6
Unknown 1687 5.0
Body mass index (kg/m2) Underweight (<20) 1138 3.4
Normal (20-<25) 7970 23.6
Overweight (25-<30) 11974 35.5
Obese (≥30) 8612 25.5
Unknown 4078 12.1
CHA2DS2-VASc High 6172 18.3
Moderate 7497 22.2
Low 20103 59.5
HAS-BLED High 3192 9.5
Moderate 3351 9.9
Low 27229 80.6 Prescribing in the 6 months before index date Antiplatelets 14673 43.4
Antidepressants 3266 9.7
Antidiabetics 2183 6.5
NSAIDS (excl. aspirin) 5743 17.0
Corticosteroids (rectal or oral) 2699 8.0
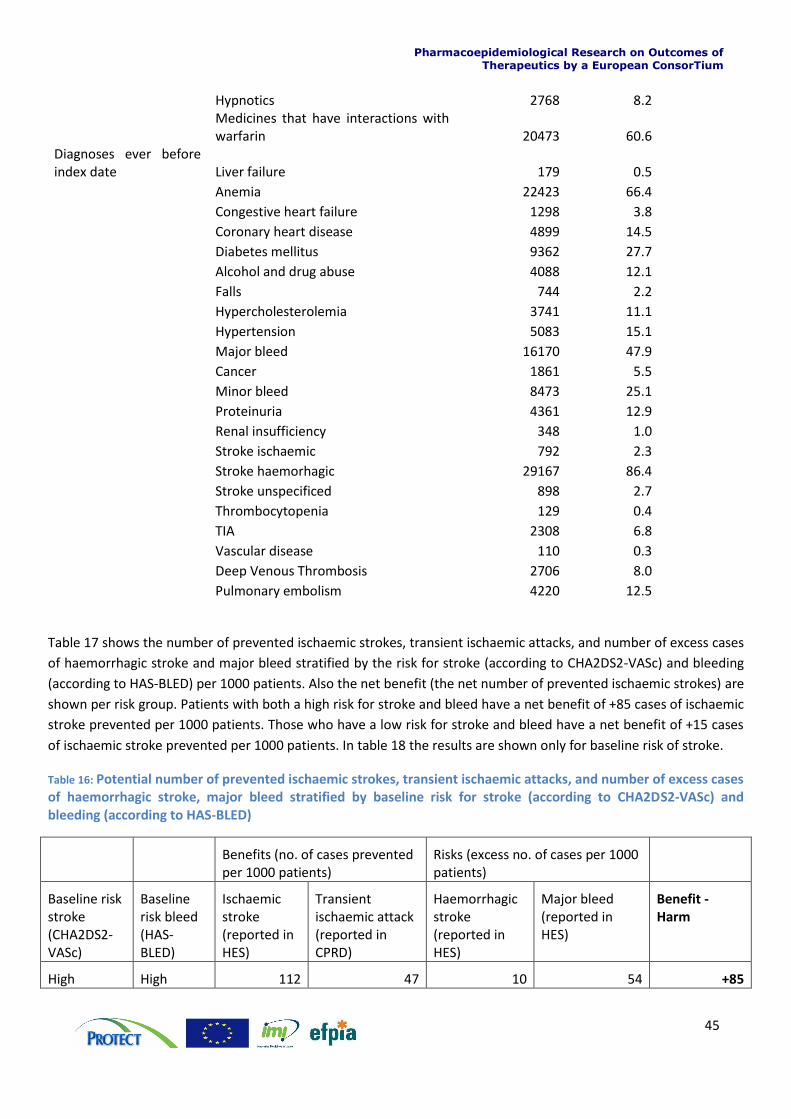
Pharmacoepidemiological Research on Outcomes of Therapeutics by a European ConsorTium
45
Hypnotics 2768 8.2
Medicines that have interactions with warfarin 20473 60.6
Diagnoses ever before index date Liver failure 179 0.5
Anemia 22423 66.4
Congestive heart failure 1298 3.8
Coronary heart disease 4899 14.5
Diabetes mellitus 9362 27.7
Alcohol and drug abuse 4088 12.1
Falls 744 2.2
Hypercholesterolemia 3741 11.1
Hypertension 5083 15.1
Major bleed 16170 47.9
Cancer 1861 5.5
Minor bleed 8473 25.1
Proteinuria 4361 12.9
Renal insufficiency 348 1.0
Stroke ischaemic 792 2.3
Stroke haemorhagic 29167 86.4
Stroke unspecificed 898 2.7
Thrombocytopenia 129 0.4
TIA 2308 6.8
Vascular disease 110 0.3
Deep Venous Thrombosis 2706 8.0
Pulmonary embolism 4220 12.5
Table 17 shows the number of prevented ischaemic strokes, transient ischaemic attacks, and number of excess cases
of haemorrhagic stroke and major bleed stratified by the risk for stroke (according to CHA2DS2-VASc) and bleeding
(according to HAS-BLED) per 1000 patients. Also the net benefit (the net number of prevented ischaemic strokes) are
shown per risk group. Patients with both a high risk for stroke and bleed have a net benefit of +85 cases of ischaemic
stroke prevented per 1000 patients. Those who have a low risk for stroke and bleed have a net benefit of +15 cases
of ischaemic stroke prevented per 1000 patients. In table 18 the results are shown only for baseline risk of stroke.
Table 16: Potential number of prevented ischaemic strokes, transient ischaemic attacks, and number of excess cases of haemorrhagic stroke, major bleed stratified by baseline risk for stroke (according to CHA2DS2-VASc) and bleeding (according to HAS-BLED)
Benefits (no. of cases prevented per 1000 patients)
Risks (excess no. of cases per 1000 patients)
Baseline risk stroke (CHA2DS2-VASc)
Baseline risk bleed (HAS-BLED)
Ischaemic stroke (reported in HES)
Transient ischaemic attack (reported in CPRD)
Haemorrhagic stroke (reported in HES)
Major bleed (reported in HES)
Benefit - Harm
High High 112 47 10 54 +85
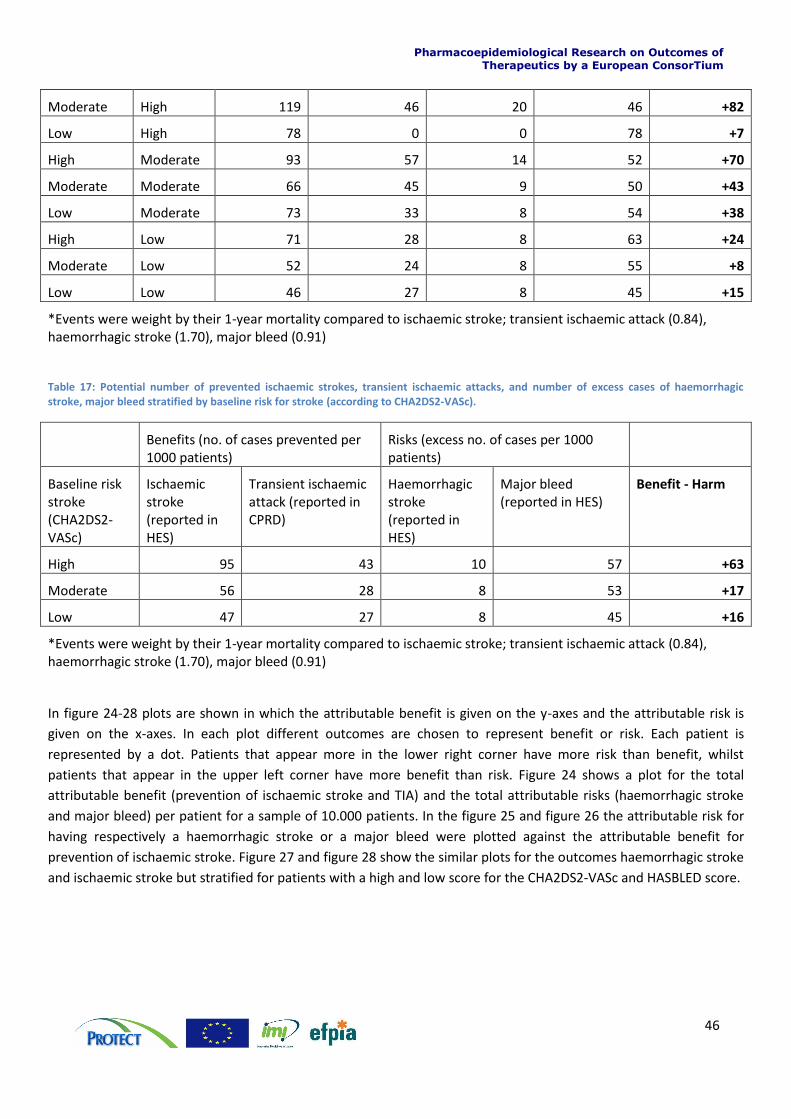
Pharmacoepidemiological Research on Outcomes of Therapeutics by a European ConsorTium
46
Moderate High 119 46 20 46 +82
Low High 78 0 0 78 +7
High Moderate 93 57 14 52 +70
Moderate Moderate 66 45 9 50 +43
Low Moderate 73 33 8 54 +38
High Low 71 28 8 63 +24
Moderate Low 52 24 8 55 +8
Low Low 46 27 8 45 +15
*Events were weight by their 1-year mortality compared to ischaemic stroke; transient ischaemic attack (0.84), haemorrhagic stroke (1.70), major bleed (0.91)
Table 17: Potential number of prevented ischaemic strokes, transient ischaemic attacks, and number of excess cases of haemorrhagic stroke, major bleed stratified by baseline risk for stroke (according to CHA2DS2-VASc).
Benefits (no. of cases prevented per 1000 patients)
Risks (excess no. of cases per 1000 patients)
Baseline risk stroke (CHA2DS2-VASc)
Ischaemic stroke (reported in HES)
Transient ischaemic attack (reported in CPRD)
Haemorrhagic stroke (reported in HES)
Major bleed (reported in HES)
Benefit - Harm
High 95 43 10 57 +63
Moderate 56 28 8 53 +17
Low 47 27 8 45 +16
*Events were weight by their 1-year mortality compared to ischaemic stroke; transient ischaemic attack (0.84), haemorrhagic stroke (1.70), major bleed (0.91)
In figure 24-28 plots are shown in which the attributable benefit is given on the y-axes and the attributable risk is
given on the x-axes. In each plot different outcomes are chosen to represent benefit or risk. Each patient is
represented by a dot. Patients that appear more in the lower right corner have more risk than benefit, whilst
patients that appear in the upper left corner have more benefit than risk. Figure 24 shows a plot for the total
attributable benefit (prevention of ischaemic stroke and TIA) and the total attributable risks (haemorrhagic stroke
and major bleed) per patient for a sample of 10.000 patients. In the figure 25 and figure 26 the attributable risk for
having respectively a haemorrhagic stroke or a major bleed were plotted against the attributable benefit for
prevention of ischaemic stroke. Figure 27 and figure 28 show the similar plots for the outcomes haemorrhagic stroke
and ischaemic stroke but stratified for patients with a high and low score for the CHA2DS2-VASc and HASBLED score.
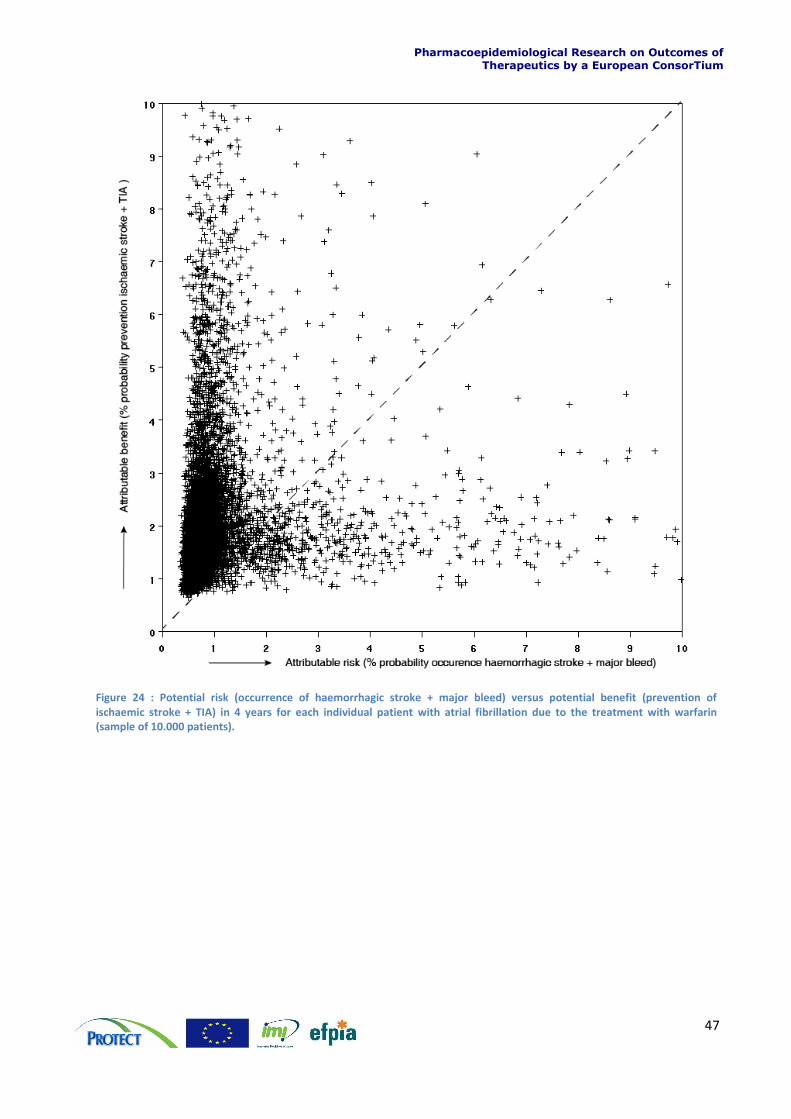
Pharmacoepidemiological Research on Outcomes of Therapeutics by a European ConsorTium
47
Figure 24 : Potential risk (occurrence of haemorrhagic stroke + major bleed) versus potential benefit (prevention of ischaemic stroke + TIA) in 4 years for each individual patient with atrial fibrillation due to the treatment with warfarin (sample of 10.000 patients).

Pharmacoepidemiological Research on Outcomes of Therapeutics by a European ConsorTium
48
Figure 25: Potential risk (occurrence of haemorrhagic stroke) versus potential benefit (prevention of ischaemic stroke) in 4 years for each individual patient with atrial fibrillation due to the treatment with warfarin.
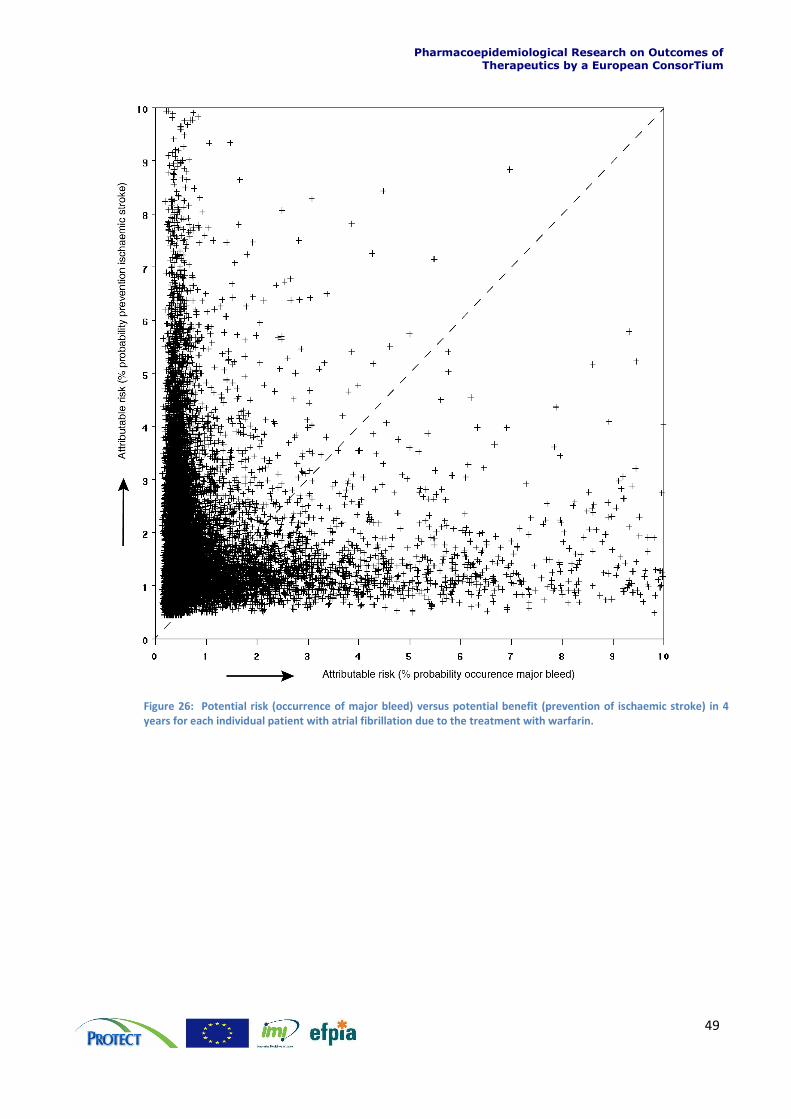
Pharmacoepidemiological Research on Outcomes of Therapeutics by a European ConsorTium
49
Figure 26: Potential risk (occurrence of major bleed) versus potential benefit (prevention of ischaemic stroke) in 4 years for each individual patient with atrial fibrillation due to the treatment with warfarin.
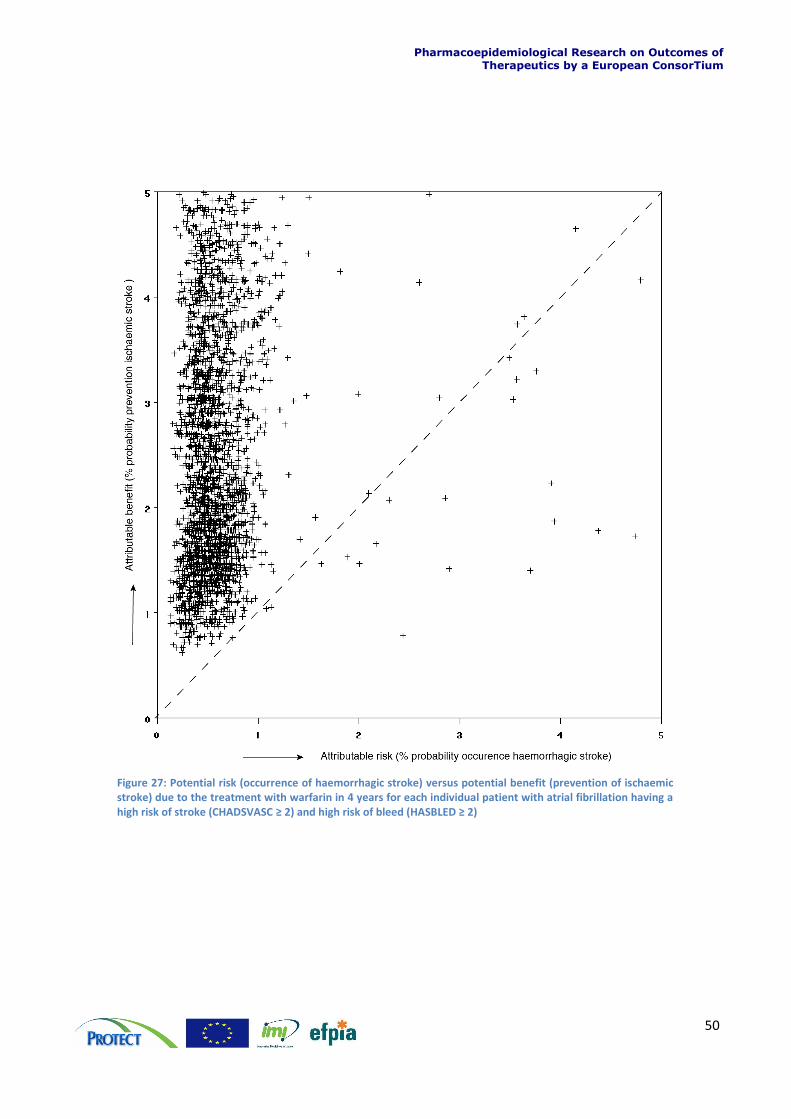
Pharmacoepidemiological Research on Outcomes of Therapeutics by a European ConsorTium
50
Figure 27: Potential risk (occurrence of haemorrhagic stroke) versus potential benefit (prevention of ischaemic stroke) due to the treatment with warfarin in 4 years for each individual patient with atrial fibrillation having a high risk of stroke (CHADSVASC ≥ 2) and high risk of bleed (HASBLED ≥ 2)
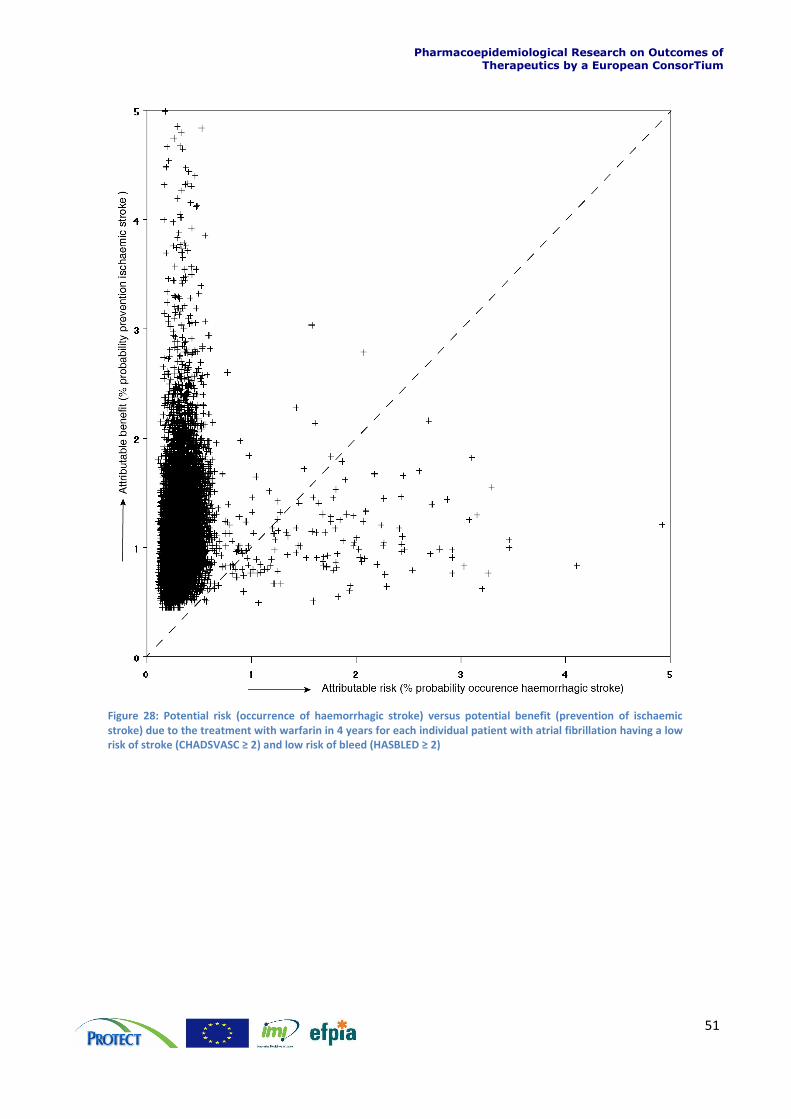
Pharmacoepidemiological Research on Outcomes of Therapeutics by a European ConsorTium
51
Figure 28: Potential risk (occurrence of haemorrhagic stroke) versus potential benefit (prevention of ischaemic stroke) due to the treatment with warfarin in 4 years for each individual patient with atrial fibrillation having a low risk of stroke (CHADSVASC ≥ 2) and low risk of bleed (HASBLED ≥ 2)
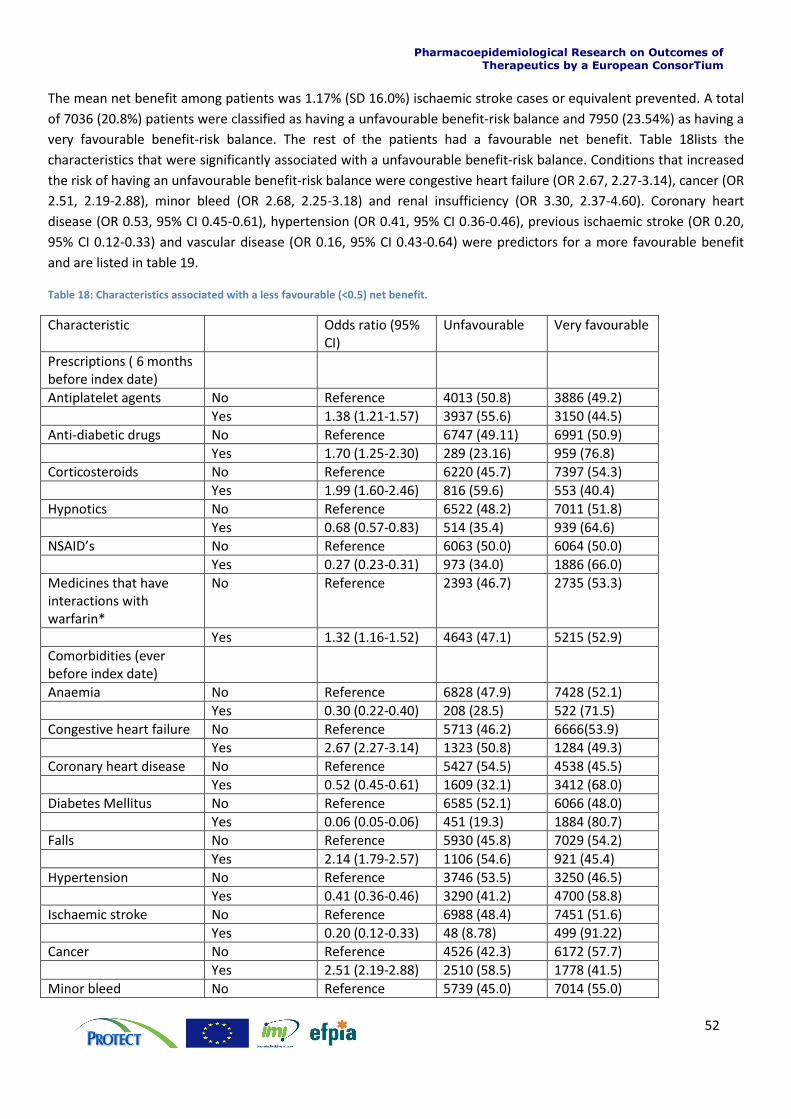
Pharmacoepidemiological Research on Outcomes of Therapeutics by a European ConsorTium
52
The mean net benefit among patients was 1.17% (SD 16.0%) ischaemic stroke cases or equivalent prevented. A total
of 7036 (20.8%) patients were classified as having a unfavourable benefit-risk balance and 7950 (23.54%) as having a
very favourable benefit-risk balance. The rest of the patients had a favourable net benefit. Table 18lists the
characteristics that were significantly associated with a unfavourable benefit-risk balance. Conditions that increased
the risk of having an unfavourable benefit-risk balance were congestive heart failure (OR 2.67, 2.27-3.14), cancer (OR
2.51, 2.19-2.88), minor bleed (OR 2.68, 2.25-3.18) and renal insufficiency (OR 3.30, 2.37-4.60). Coronary heart
disease (OR 0.53, 95% CI 0.45-0.61), hypertension (OR 0.41, 95% CI 0.36-0.46), previous ischaemic stroke (OR 0.20,
95% CI 0.12-0.33) and vascular disease (OR 0.16, 95% CI 0.43-0.64) were predictors for a more favourable benefit
and are listed in table 19.
Table 18: Characteristics associated with a less favourable (<0.5) net benefit.
Characteristic Odds ratio (95% CI)
Unfavourable
Very favourable
Prescriptions ( 6 months before index date)
Antiplatelet agents No Reference 4013 (50.8) 3886 (49.2)
Yes 1.38 (1.21-1.57) 3937 (55.6) 3150 (44.5)
Anti-diabetic drugs No Reference 6747 (49.11) 6991 (50.9)
Yes 1.70 (1.25-2.30) 289 (23.16) 959 (76.8)
Corticosteroids No Reference 6220 (45.7) 7397 (54.3)
Yes 1.99 (1.60-2.46) 816 (59.6) 553 (40.4)
Hypnotics No Reference 6522 (48.2) 7011 (51.8)
Yes 0.68 (0.57-0.83) 514 (35.4) 939 (64.6)
NSAID’s No Reference 6063 (50.0) 6064 (50.0)
Yes 0.27 (0.23-0.31) 973 (34.0) 1886 (66.0)
Medicines that have interactions with warfarin*
No Reference 2393 (46.7) 2735 (53.3)
Yes 1.32 (1.16-1.52) 4643 (47.1) 5215 (52.9)
Comorbidities (ever before index date)
Anaemia No Reference 6828 (47.9) 7428 (52.1)
Yes 0.30 (0.22-0.40) 208 (28.5) 522 (71.5)
Congestive heart failure No Reference 5713 (46.2) 6666(53.9)
Yes 2.67 (2.27-3.14) 1323 (50.8) 1284 (49.3)
Coronary heart disease No Reference 5427 (54.5) 4538 (45.5)
Yes 0.52 (0.45-0.61) 1609 (32.1) 3412 (68.0)
Diabetes Mellitus No Reference 6585 (52.1) 6066 (48.0)
Yes 0.06 (0.05-0.06) 451 (19.3) 1884 (80.7)
Falls No Reference 5930 (45.8) 7029 (54.2)
Yes 2.14 (1.79-2.57) 1106 (54.6) 921 (45.4)
Hypertension No Reference 3746 (53.5) 3250 (46.5)
Yes 0.41 (0.36-0.46) 3290 (41.2) 4700 (58.8)
Ischaemic stroke No Reference 6988 (48.4) 7451 (51.6)
Yes 0.20 (0.12-0.33) 48 (8.78) 499 (91.22)
Cancer No Reference 4526 (42.3) 6172 (57.7)
Yes 2.51 (2.19-2.88) 2510 (58.5) 1778 (41.5)
Minor bleed No Reference 5739 (45.0) 7014 (55.0)
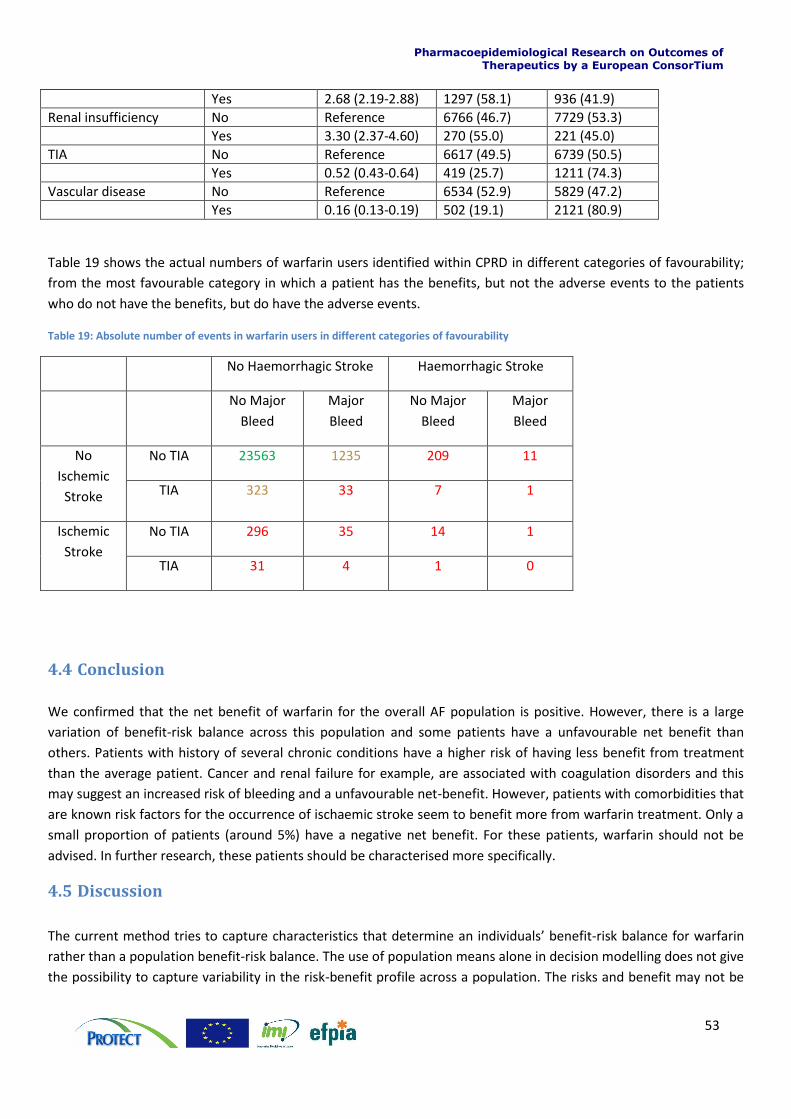
Pharmacoepidemiological Research on Outcomes of Therapeutics by a European ConsorTium
53
Yes 2.68 (2.19-2.88) 1297 (58.1) 936 (41.9)
Renal insufficiency No Reference 6766 (46.7) 7729 (53.3)
Yes 3.30 (2.37-4.60) 270 (55.0) 221 (45.0)
TIA No Reference 6617 (49.5) 6739 (50.5)
Yes 0.52 (0.43-0.64) 419 (25.7) 1211 (74.3)
Vascular disease No Reference 6534 (52.9) 5829 (47.2)
Yes 0.16 (0.13-0.19) 502 (19.1) 2121 (80.9)
Table 19 shows the actual numbers of warfarin users identified within CPRD in different categories of favourability;
from the most favourable category in which a patient has the benefits, but not the adverse events to the patients
who do not have the benefits, but do have the adverse events.
Table 19: Absolute number of events in warfarin users in different categories of favourability
No Haemorrhagic Stroke Haemorrhagic Stroke
No Major
Bleed
Major
Bleed
No Major
Bleed
Major
Bleed
No
Ischemic
Stroke
No TIA 23563 1235 209 11
TIA 323 33 7 1
Ischemic
Stroke
No TIA 296 35 14 1
TIA 31 4 1 0
4.4 Conclusion
We confirmed that the net benefit of warfarin for the overall AF population is positive. However, there is a large
variation of benefit-risk balance across this population and some patients have a unfavourable net benefit than
others. Patients with history of several chronic conditions have a higher risk of having less benefit from treatment
than the average patient. Cancer and renal failure for example, are associated with coagulation disorders and this
may suggest an increased risk of bleeding and a unfavourable net-benefit. However, patients with comorbidities that
are known risk factors for the occurrence of ischaemic stroke seem to benefit more from warfarin treatment. Only a
small proportion of patients (around 5%) have a negative net benefit. For these patients, warfarin should not be
advised. In further research, these patients should be characterised more specifically.
4.5 Discussion
The current method tries to capture characteristics that determine an individuals’ benefit-risk balance for warfarin
rather than a population benefit-risk balance. The use of population means alone in decision modelling does not give
the possibility to capture variability in the risk-benefit profile across a population. The risks and benefit may not be
Pharmacoepidemiological Research on Outcomes of Therapeutics by a European ConsorTium
54
evenly distributed across a population. Risks may occur more frequently in specific subpopulations whilst others
benefit more from therapy. With this method we are able to identify which patients might have a more or less
favourable benefit-risk balance than others. There will always be individual patients for whom, when actually
treated, the risks outweighs the benefits, but in general for each combination of baseline risk levels this was not the
case.
There is a substantial group that has a unfavourable net benefit, which means that their net benefit is marginal or
even negative (<0.5 %) and they will benefit less from treatment than the average patient that is on warfarin. For
these individuals warfarin might not be the best treatment option. By identifying these patients we could assist a
physician to decide between treatment options.
With any medicinal compound there are a balance of benefits and risks to be made for each individual when
deciding whether to take it (or be prescribed it, or for it to be licensed, depending on whose decision is being
considered). The ideal compound would provide the maximum favourable effect but without unfavourable effects to
the majority of patients. There would be some people who experienced any unfavourable effects, and from a
pharmacological perspective it is also assumed that these would be the same people who experienced the
favourable effects. It is also to some extent assumed that those who do not experience the favourable effects tend
to not also suffer from the unfavourable effects. Ideally there should be very few people who fail to reap the
benefits but suffer the risks. Data on this scenario, either in trials or observational studies, is almost always lacking
and assumptions have to be made. This overall balance helps answer the question of which patients could take this
drug.
Table 19 demonstrates that warfarin does indeed behave like this, providing additional reassurance that the overall
balance of benefits and risks is positive. However the aim for any treating physician may well be to try and treat
those who fall into the top left hand side of the table, and avoid treating those who fall into the bottom right,
especially when suitable alternatives are available. Identifying the factors that predict where any individual patient
may lie is key to this decision. It helps answer the question whether this drug is right for the individual patient. The
fortuitous consequence of such an approach if one can successfully identify such individuals is that the overall
balance of benefits and risks in the population 'in reality' improves as well.
In this report we have shown how we can use clinical trial data to make trade-offs between benefits and risks even
for older drugs where good quality data may be lacking. In benefit-risk assessment it is of key importance that the
data that are used are representative for the population that uses the medicine. Whilst experimental data from
clinical trials provide the effects of a treatment in perfect conditions (efficacy), the evidence from observational data
can provide the effects in real life (effectiveness). This difference in benefit-risk has been described in literature as
the efficacy-effectiveness gap (31) Similar considerations are true for the safety data from clinical studies, as the
exclusion criteria, study monitoring and the study populations may lead to lower overall adverse event rates and
severity than will be observed in the wider population. Within RCTs the variability in the study population is
expected to be minimised with the aim of enhancing the signal-to-noise ratio and increasing the power of the study.
This may involve trial staff making a special effort to convince patients to take the trial medications according to the
prescribed dosing regimen to maximise efficacy, and narrow selection criteria to eliminate those with a low
susceptibility for toxicity, e.g. those with co-morbidities. However, in real life such dedicated trial support will not be
available, and prescriptions will be given to those outside the trial population, and thus variability will increase which
may lead to a shift in the overall benefit-risk profile in ‘reality’ as opposed to the ‘expectation’ of it. In this case study
Pharmacoepidemiological Research on Outcomes of Therapeutics by a European ConsorTium
55
the benefit-risk profile does not shift on a population level, but it does show that it differs for specific individuals. It
advocates for the treatment to be more tailored to the individual.
Sources of variability are differences in genotype, presence of comorbidities, adherence to treatment and off label
prescribing. Furthermore, it has been shown that the usage of drugs in actual clinical practice is different than in a
clinical trial setting. For example in clinical trials with COX-2 inhibitors, the usage was restricted to patients with
rheumatoid arthritis or osteoarthritis that used these medicines in high dosages for prolonged time. However, in
actual clinical practice patients often used these medicines intermittently and at lower dosages and didn’t have an
indication of rheumatoid arthritis or osteoarthritis. Consequently, this will change the benefit risk balance. The
question then arises whether one should lower the expectations of the benefit-risk balance to the level of reality, by
assessing the benefit risk balance based on real-world data, or try and raise reality up to the level of expectations
through effective Risk Management measures, or a combination of the two (31).
Although we have a clear overview of the benefit-risk profile through experience, the new Pharmacovigilance
legislation now requires the periodic evaluation of both benefits and risks of a medicine with more level of detail.
Whilst regulators have a desire for an armamentarium of drugs with an acceptable balance of benefits and risks, for
the individual patient or prescribing physician, alternatives emerging on to the market may require a re-evaluation of
prescribing choice. With the availability of electronic healthcare data we are able to quantify the actual rate of the
beneficial outcomes for those treated with warfarin in the real world as compared with the idealised clinical trial
setting.
A limitation of this study was the discrimination between haemorrhagic stroke and ischaemic stroke in CPRD is
limited as frequently non-specific codes are used. However, it may be possible to improve this discrimination using
HES data, because data are recorded more frequently by aetiology (haemorrhagic or ischaemic stroke). Although the
use of this linkage improves the recording of the type of stroke, still 26% of the strokes are classified as being
‘unspecified’. Although this is likely to reflect a medical situation, in the follow up of this project multiple imputation
techniques will be used to classify the type of stroke. It is also not possible to distinguish in CPRD between
paroxysmal, persistent and permanent AF due to non-specific AF coding. The assumption that the relative rate as
seen in clinical trials is constant across the whole population is a strong one, especially considering the argument
that real life use is more variable, which implies lower potential efficacy and higher potential for greater toxicity.
Relaxing this assumption by assuming for example that the absolute effect as seen across trials is the same as in the
whole population could result in different conclusions being drawn. However, the model can be easily adjusted if
there would be strong evidence that RR’s are different among subpopulations. This is the same for the weighing
factor used to calculate the net benefit. In the current study we used mortality rate compared to the mortality rate
of ischaemic stroke as a weighing factor, but also other weights, such as utility, can be justified.
Another limitation of this study is that we didn’t take INR-control into account. Warfarin use requires frequent blood
tests to monitor the level of anticoagulation which is measured by the International Normalised Ratio (INR). Previous
reports have found lower risks of ischaemic stroke at INR levels between 2.0 and 3.5 and increasing risk of
thromboembolic events with INR values below 2.0, and increasing risk of haemorrhages with INR values above 3.5
(32,33,34) Poor anticoagulation control occurs frequently in AF patients. It has been reported that most AF patients
admitted to the hospital with an ischaemic stroke who were candidates for anticoagulation, were either not taking
warfarin or had a sub therapeutic INR at the time of event (35). Moreover, several studies have found that the INR
values were out of the target range approximately half the time (36). This poor anticoagulation control can be
caused by several reasons including but not limited to adherence, drug-drug and drug-food interactions.

Pharmacoepidemiological Research on Outcomes of Therapeutics by a European ConsorTium
56
Furthermore, intercurrent illness or an exacerbation of an existing illness may also contribute to changes in INR
levels (37). Therefore, when assessing the benefit-risk balance of warfarin, it is of importance to take quality of
anticoagulation control into account.
Pharmacoepidemiological Research on Outcomes of Therapeutics by a European ConsorTium
57
5 Section 5
5.1 Overall Discussion This case study was carried out to identify whether there are specific challenges in conducting benefit-risk reviews
for older products and also to incorporate individual benefit-risk modelling. The aim for the individual benefit-risk
modelling was to demonstrate the diversity of benefit-risk balance across the population and to find characteristics
that might be associated with having an unfavourable net benefit. This approach was possible because the case
study group had access to individual patient data from CPRD. Warfarin was chosen for the case study because it is
an older product that is widely used but has a complex safety profile.
There is some clinical trial data in the indication of non-valvular atrial fibrillation and also three relatively new studies
in which standard of care (i.e. warfarin) was used as a comparator for new anticoagulants have been identified (28)
(29) (30) (31). These studies provide clinical trial data to current standards on warfarin as well as the new products
and allow for the comparison of older clinical trial data to the new data as well as allowing a comparison of warfarin
against newer anticoagulants.
The new studies suggested that the rate of events on warfarin in the older studies was similar to data collected
under new clinical trial conditions. This suggests that our assessment of the benefit-risk of warfarin therapy versus
no treatment for patients with non-valvular AF is robust, although clearly “no treatment” is a different option to
placebo. However the information from the new clinical trials was essential in helping to understand the benefit-risk
profile for warfarin, and to provide up-to-date visual comparisons that may help patients and health care
professionals to decide between various treatment options with delicate benefit-risk balance. The availability of
these data was due to newer products being submitted for marketing authorisation which will not always be the
case for older products, in which case the results would be similar to those seen in work stream 1, i.e. based on
extremely limited relevant data, with consequent uncertainty to the external validity and generalisability to more
recent medical practice.
The limitations of the available data for older products affect the development of the value tree, which for practical
reasons needs to be based on data that are available rather than allowing the value tree to be developed based on
the application of formal criteria. This means that there may be clinical outcomes which are very relevant to a B-R
assessment and for which no data or only limited or unusable data are available, for example post-marketing
spontaneous reports. This may decrease the overall validity of a value tree with a potential bias towards more
Benefit criteria and less Risk criteria (45). This results from eliminating some undesirable effects from the value tree
just because there is no exploitable data (non-comparative, or no incidence, or limited epidemiology data etc.).
Some of these undesirable effects would have played a major role in the BR assessment if data had been available
(e.g. serious bleeding events). Within the benefit-risk assessment, there may be an asymmetric aversion to risk (for
example different aversions to haemorrhagic, versus ischaemic stroke). As it is important to avoid inconsistencies
among conclusions of identical decision problems, which are simply framed differently, it might be helpful reasoning
in terms of health metrics, like mortality and disability, rather than focusing on the cause of fatal or disabling events.
The impact of missing data on the value tree and consequent benefit-risk decision may depend on the benefit-risk
model used. For example, standard BRAT tools have difficulty with missing data or data which are not biostatistically
acceptable. When aggregating data from different sources it is important to be aware of issues such as different
definitions of outcomes and different way of measuring certain effects, and also issue of bias when combining data.
This lead to some exercise of data transformation or even criteria customization in order to have matching criteria
Pharmacoepidemiological Research on Outcomes of Therapeutics by a European ConsorTium
58
across the sources of evidence. However, more qualitative use of the BRAT framework will allow the user to
incorporate some degree of flexibility. For MCDA, this is less a problem as the model can accommodate all types and
format of data. The building of the value tree then depends mainly on what is relevant for BR assessment and what
is not (many secondary redundant efficacy criteria, many mild tolerable AEs etc.) (38).
Another general issue in the construction of value trees is that different parties constructing them may have
different levels of access to the same information. For example there will always be more information in a clinical
study report than in a summary public assessment report or a published paper. Additionally regulators may also be
able to request further analyses and information from trial sponsors (for example different variables of interest,
different methods for handling missing data) whereas those reviewing only published data cannot, again leading to
an asymmetry of information. Therefore there is the potential that those with access to the fuller version of the data
set may appear to make slightly different decisions from those that do not whereas these decisions are actually
based on different amount of information. For older products, it may be that regulators have a lot of information in
the periodic safety update reports that is not generally available for public use.
With the help of patient level data we were able to show that although the overall benefit risk balance for a product
seems acceptable, it might be very different from one patient to another. Some patients might benefit more than
others, while others might have more risks. In this case study we have tried to use methods to identify these
patients. A person’s benefit-risk balance may be influenced by the specific combination of other risk factors, or by
the fact that the usage of a product in real life is very different from a clinical trial setting. By mapping this benefit-
risk profile of a medicine we might help prescribing physicians in giving the right drug to the right patient. Advantage
of this method is that it can be easily adapted to different scenarios by changing the input data such as the relative
rates and the weights. Therefore this method can be applied for both older drugs as new drugs.
Warfarin has been used therapeutically for this indication for over 50 years. Consequently the studies on which the
benefits were initially established are not of the same quality as those of newly-licensed medicines. The original
clinical trial data for earlier warfarin trials may not even still be available. This is likely to be an issue for a number of
products with long established use, and hampers formal benefit-risk assessments using standard methodologies and
visualisation techniques.
Considering the need for interpretation by patients, simple visuals have been used in this report to allow a one-
dimensional benefit-risk assessment, although this can be an important composite such as all-cause mortality. This
may help in interpretation and discussion with patients about their treatment options, but may risk oversimplifying a
benefit-risk problem.
Finally, warfarin is used for a wide range of indications requiring anticoagulation, and each of them carries their own
benefit-risk balance. Therefore it is clear that the benefit-risk assessment should be conducted on a specific
indication basis and should not be generalised to other indications not being considered in the decision model.
However the linked decisions between different models and indications may be further explored to ensure the
decisions are made consistently and transparently.
Pharmacoepidemiological Research on Outcomes of Therapeutics by a European ConsorTium
59
6 References
1. Go AS, Hylek EM, Phillips KA, Chang Y, Henault LE, Selby JV, et al. Prevalence of diagnosed atrial fibrillation in
adults: national implications for rhythm management and stroke prevention: the AnTicoagulation and Risk
Factors in Atrial Fibrillation (ATRIA) Study. JAMA. 2001 May; 285(18): p. 2370-2375.
2. Friberg L, Hammar N, Pettersson H, Rosenqvist M. Increased mortality in paroxysmal atrial fibrillation: report
from the Stockholm Cohort-Study of Atrial Fibrillation (SCAF). Eur Heart J. 2007 Oct; 28(19): p. 2346-2353.
3. Ericson L, Bergfeldt L, Björholt I. Atrial fibrillation: the cost of illness in Sweden. Eur J Health Econ. 2011 Oct;
12(5): p. 479-487.
4. Wolf PA, Abbott RD, Kannel WB. Atrial fibrillation as an independent risk factor for stroke: the Framingham
Study. Stroke. 1991 Aug; 22(8): p. 983-988.
5. Marini C, , Sacco S, Russo T, Olivieri L, Totaro R, et al. Contribution of atrial fibrillation to incidence and outcome
of ischemic stroke: results from a population-based study. Stroke. 2005 Jun; 36(6): p. 1115-1119.
6. Hart RG, Pearce LA, Aguilar MI. Meta-analysis: antithrombotic therapy to prevent stroke in patients who have
nonvalvular atrial fibrillation. Ann Intern Med. 2007 Jun; 146(12): p. 857-867.
7. Mant J, Hobbs FDR, Fletcher K, Roalfe A, Fitzmaurice D, Lip GYH, et al. Warfarin versus aspirin for stroke
prevention in an elderly community population with atrial fibrillation (the Birmingham Atrial Fibrillation
Treatment of the Aged Study, BAFTA): a randomised controlled trial. Lancet. 2007 Aug; 370(9586): p. 493-503.
8. Camm AJ, Kirchhof P, Lip GYH, Schotten U, Savelieva I, Ernst S, et al. Guidelines for the management of atrial
fibrillation. European Heart Journal. 2010.
9. Wintzen AR, , Loeliger EA, Bots GT. The risk of intracerebral hemorrhage during oral anticoagulant treatment: a
population study. Ann Neurol. 1984 Nov; 16(5): p. 553-558.
10. Hart RG, Boop BS, Anderson DC. Oral anticoagulants and intracranial hemorrhage. Facts and hypotheses. Stroke.
1995 Aug; 26(8): p. 1471-1477.
11. Mt-Isa S, Wang N, Hallgreen CE, Callréus T, Genov G, Hirsch I, Hobbiger S, et al. Review of methodologies for
benefit and risk assessment of medication. Tech. rep. IMI PROTECT WP5; 2013.
12. Petersen P, Boysen G, Godtfredsen J, Andersen ED, Andersen B. Placebo-controlled, randomised trial of warfarin
and aspirin for prevention of thromboembolic complications in chronic atrial fibrillation. The Copenhagen
AFASAK study. Lancet. 1989 Jan; 1(8631): p. 175-179.
13. Boston Area Anticoagulation Trial for Atrial Fibrillation Investigators B. The effect of low-dose warfarin on the risk
of stroke in patients with nonrheumatic atrial fibrillation. N Engl J Med. 1991 Jul; 325(2): p. 129-132.
14. Connolly SJ, Laupacis A, Gent M, Roberts RS, Cairns JA, Joyner C. Canadian Atrial Fibrillation Anticoagulation
(CAFA) Study. J Am Coll Cardiol. 1991 Aug; 18(2): p. 349-355.
Pharmacoepidemiological Research on Outcomes of Therapeutics by a European ConsorTium
60
15. Atrial Fibrillation Investigators S. Stroke Prevention in Atrial Fibrillation Study. Final results. Circulation. 1991 Aug;
84(2): p. 527-539.
16. Ezekowitz MD, Bridgers SL, James KE, Carliner NH, Colling CL, Gornick CC, et al. Warfarin in the prevention of
stroke associated with nonrheumatic atrial fibrillation. Veterans Affairs Stroke Prevention in Nonrheumatic Atrial
Fibrillation Investigators. N Engl J Med. 1992 Nov; 327(20): p. 1406-1412.
17. European Atrial Fibrillation Trial Study Group E. Secondary prevention in non-rheumatic atrial fibrillation after
transient ischaemic attack or minor stroke. EAFT (European Atrial Fibrillation Trial) Study Group. Lancet. 1993
Nov; 342(8882): p. 1255-1262.
18. Aguilar MI,HR. Oral anticoagulants for preventing stroke in patients with non-valvular atrial fibrillation and no
previous history of stroke or transient ischemic attacks. Cochrane database of systematic reviews (Online).
2005;(3): p. CD001927.
19. Jacobs LG, Billett HH, Freeman K, Dinglas C, Jumaquio L. Anticoagulation for stroke prevention in elderly patients
with atrial fibrillation, including those with falls and/or early-stage dementia: a single-center, retrospective,
observational study. Am J Geriatr Pharmacother. 2009 Jun; 7(3): p. 159-166.
20. Kalra LaYGbPIaLAcDNd. Prospective cohort study to determine if trial efficacy of anticoagulation for stroke
prevention in atrial fibrillation translates into clinical effectiveness. British Medical Journal. 2000; 320(7244): p.
1236-1239.
21. Darkow T, Henk HJ, Thomas SK, Feng W, Baladi JF, Goldberg GA, et al. Treatment interruptions and non-
adherence with imatinib and associated healthcare costs: a retrospective analysis among managed care patients
with chronic myelogenous leukaemia. Pharmacoeconomics. 2007; 25(6): p. 481-496.
22. Go AS, Hylek EM, Chang Y, Phillips KA, Henault LE, Capra AM, et al. Anticoagulation therapy for stroke prevention
in atrial fibrillation: how well do randomized trials translate into clinical practice? JAMA. 2003 Nov; 290(20): p.
2685-2692.
23. Caro JJ, Flegel KM, Orejuela ME, Kelley HE, Speckman JL, Migliaccio-Walle K. Anticoagulant prophylaxis against
stroke in atrial fibrillation: effectiveness in actual practice. CMAJ. 1999 Sep; 161(5): p. 493-497.
24. Gottlieb LK, Slaem-Schatz S. Autocoagulation in atrial fibrillation, does efficacy in clincial trials translate into
effectiveness in practise? Arch Intern Med. 1994; 154: p. 1945-1953.
25. Hylek EM, Singer DE. Risk factors for intracranial hemorrhage in outpatients taking warfarin. Ann Intern Med.
1994 Jun; 120(11): p. 897-902.
26. Pink J, Lane S, Pirmohamed M, Hughes DA. Dabigatran etexilate versus warfarin in management of non-valvular
atrial fibrillation in UK context: quantitative benefit-harm and economic analyses. BMJ. 2011; 343: p. d6333.
27. Singer DE, Chang Y, Fang MC, Borowsky LH, Pomernacki NK, Udaltsova N, et al. The net clinical benefit of
warfarin anticoagulation in atrial fibrillation. Ann Intern Med. 2009 Sep; 151(5): p. 297-305.
Pharmacoepidemiological Research on Outcomes of Therapeutics by a European ConsorTium
61
28. CHMP(Rivaroxaban). EPAR - CHMP assessment report Xarelto (Rivaroxaban). Tech. rep. EMA; 2011.
29. CHMP(Dabigatran). EPAR - CHMP assessment report, Pradaxa (Dabigatran etexilate). Tech. rep. EMA; 2011.
30. Connolly SJ, Ezekowitz MD, Yusuf S, Eikelboom J, Oldgren J, Parekh A, et al. Dabigatran versus warfarin in
patients with atrial fibrillation. N Engl J Med. 2009 Sep; 361(12): p. 1139-1151.
31. Granger
CB,AJHMJJVLRDHEMHMAKHRAJADAABMCDREJDEJAFGGDGMGBJGSGSHAGHSHHJMPJPLBSLSJLPPPAVFWAZJWL.
Apixaban versus warfarin in patients with atrial fibrillation. New England Journal of Medicine. 2011; 365(11): p.
981-992.
32. RELATIVE OR ATTRIBUTABLE RISK? The Lancet. 1981; 318(8257): p. 1211-1212.
33. van Staa TP, Smeeth L, Persson I, Parkinson J, Leufkens HGM. What is the harm-benefit ratio of Cox-2 inhibitors?
Int J Epidemiol. 2008 Apr; 37(2): p. 405-413.
34. Eichler HG, Abadie E, Breckenridge A, Flamion B, Gustafsson LL, Leufkens H, et al. Bridging the efficacy-
effectiveness gap: a regulator's perspective on addressing variability of drug response. Nat Rev Drug Discov. 2011
Jul; 10(7): p. 495-506.
35. Rietbrock S, Plumb JM, Gallagher AM,. How effective are dose-adjusted warfarin and aspirin for the prevention
of stroke in patients with chronic atrial fibrillation? An analysis of the UK General Practice Research Database.
Thromb Haemost. 2009 Mar; 101(3): p. 527-534.
36. Fang MCaSDEbc. Anticoagulation for atrial fibrillation. Cardiology Clinics. 2004; 22(1): p. 47-62.
37. Singer DE, Chang Y, Fang MC, Borowsky LH, Pomernacki NK, Udaltsova N, et al. Should patient characteristics
influence target anticoagulation intensity for stroke prevention in nonvalvular atrial fibrillation?: the ATRIA
study. Circ Cardiovasc Qual Outcomes. 2009 Jul; 2(4): p. 297-304.
38. Gladstone DJ, Bui E, Fang J, Laupacis A, Lindsay MP, Tu JV, et al. Potentially preventable strokes in high-risk
patients with atrial fibrillation who are not adequately anticoagulated. Stroke. 2009 Jan; 40(1): p. 235-240.
39. Samsa GP, Matchar DB, Goldstein LB, Bonito AJ, Lux LJ, Witter DM, et al. Quality of anticoagulation management
among patients with atrial fibrillation: results of a review of medical records from 2 communities. Arch Intern
Med. 2000 Apr; 160(7): p. 967-973.
40. Ansell J, Hirsh J, Hylek E, Jacobson A, Crowther M, Palareti G, et al. Pharmacology and management of the
vitamin K antagonists: American College of Chest Physicians Evidence-Based Clinical Practice Guidelines (8th
Edition). Chest. 2008 Jun; 133(6 Suppl): p. 160S--198S.
41. Phillips LD. A theory of requisite decision models. Acta Psychol. (Amst.). 1984; 56: p. 29-48.
42. Wolf PA, Dawber TR, Thomas JH, Kannel WB. Epidemiologic assessment of chronic atrial fibrillation and risk of
Pharmacoepidemiological Research on Outcomes of Therapeutics by a European ConsorTium
62
stroke: the Framingham study. Neurology. 1978 Oct; 28(10): p. 973-977.
43. Wolbers M, Koller MT, Witteman JCM, Steyerberg EW. Prognostic models with competing risks: methods and
application to coronary risk prediction. Epidemiology. 2009 Jul; 20(4): p. 555-561.
44. unknown. Value Three Analysis. unpublished. ; 2002 april.
45. Uchino K,HAV. Dabigatran association with higher risk of acute coronary events: Meta-analysis of noninferiority
randomized controlled trials. Archives of Internal Medicine. 2012; 172(5): p. 397-402.
46. Singer DE,HRGPLA. Antithrombotic therapy to prevent stroke in patients with atrial fibrillation [1] (multiple
letters). Annals of Internal Medicine. 2000; 132(10): p. 841.
47. Singer DE,AGWDJEGASHJLMWJ. Antithrombotic therapy in atrial fibrillation: The Seventh ACCP Conference on
Antithrombotic and Thrombolytic Therapy. Chest. 2004; 126(3 SUPPL.): p. 429S-456S.
48. Segal JB, McNamara RL, Miller MR, Kim N, Goodman SN, Powe NR, et al. Prevention of thromboembolism in
atrial fibrillation. A meta-analysis of trials of anticoagulants and antiplatelet drugs. J Gen Intern Med. 2000 Jan;
15(1): p. 56-67.
49. Saxena R, Koudstaal PJ. Anticoagulants for preventing stroke in patients with nonrheumatic atrial fibrillation and
a history of stroke or transient ischaemic attack. Cochrane Database Syst Rev. 2004;(2): p. CD000185.
50. Rosendaal FR, Cannegieter SC, , Briët E. A method to determine the optimal intensity of oral anticoagulant
therapy. Thromb Haemost. 1993 Mar; 69(3): p. 236-239.
51. Reynolds MW, Fahrbach K, Hauch O, Wygant G, Estok R, Cella C, et al. Warfarin anticoagulation and outcomes in
patients with atrial fibrillation: a systematic review and metaanalysis. Chest. 2004 Dec; 126(6): p. 1938-1945.
52. Patel MR,MKWGJPGSDEHWBGHJLHGJPJPBRCNCCPJFBSDFKAACRM. Rivaroxaban versus warfarin in nonvalvular
atrial fibrillation. New England Journal of Medicine. 2011; 365(10): p. 883-891.
53. Nademanee K,KEMWANKKPRRJAFRH. Long-term antithrombotic treatment for atrial fibrillation. American
Journal of Cardiology. 1998; 82(8 A): p. 37N-42N.
54. Morgan SV. Between the devil and the deep blue sea - Balancing the risks and potential benefits of warfarin for
older people with atrial fibrillation. Age and Ageing. 2004; 33(6): p. 544-547.
55. Man-Son-Hing M, Gage BF, Montgomery AA, Howitt A, Thomson R, Devereaux PJ, et al. Preference-based
antithrombotic therapy in atrial fibrillation: implications for clinical decision making. Med Decis Making. 2005;
25(5): p. 548-559.
56. Man-Son-Hing M, Laupacis A. Balancing the risks of stroke and upper gastrointestinal tract bleeding in older
patients with atrial fibrillation. Arch Intern Med. 2002 Mar; 162(5): p. 541-550.
Pharmacoepidemiological Research on Outcomes of Therapeutics by a European ConsorTium
63
57. Man-Son-Hing M, Nichol G, Lau A, Laupacis A. Choosing antithrombotic therapy for elderly patients with atrial
fibrillation who are at risk for falls. Arch Intern Med. 1999 Apr; 159(7): p. 677-685.
58. MacLean SaMSaAEAaeJMcVPOfESaMSdBNbGGHa. Patient values and preferences in decision making for
antithrombotic therapy: A systematic review - Antithrombotic therapy and prevention of thrombosis, 9th ed:
American College of Chest Physicians evidence-based clinical practice guidelines. Chest. 2012; 141(2 SUPPL.): p.
e1S-e23S.
59. Lip GYH, Edwards SJ. Stroke prevention with aspirin, warfarin and ximelagatran in patients with non-valvular
atrial fibrillation: a systematic review and meta-analysis. Thromb Res. 2006; 118(3): p. 321-333.
60. Lip GYH, Tello-Montoliu A. Management of atrial fibrillation. Heart. 2006; 92(8): p. 1177-1182.
61. Kangelaris KNabcBSbNRLdGDAeTJAb. Genetic testing before anticoagulation? A systematic review of
pharmacogenetic dosing of warfarin. Journal of General Internal Medicine. 2009; 24(5): p. 656-664.
62. Kamath S,LGYH. Risk stratification for thromboprophylaxis in atrial fibrillation. Cardiac Electrophysiology Review.
2001; 5(2-3): p. 171-176.
63. Investigators AF. Risk factors for stroke and efficacy of antithrombotic therapy in atrial fibrillation. Analysis of
pooled data from five randomized controlled trials. Arch Intern Med. 1994 Jul; 154(13): p. 1449-1457.
64. Hughes GJaPPNaSNb. Effect of acetaminophen on international normalized ratio in patients receiving warfarin
therapy. Pharmacotherapy. 2011; 31(6): p. 591-597.
65. Holbrook AM, Pereira JA, Labris R, McDonald H, Douketis JD, Crowther M, et al. Systematic Overview of Warfarin
and Its Drug and Food Interactions. Arch Intern Med. 2005; 165: p. 10951106.
66. Hart RG,BOMR. The sin of omission: A systematic review of antithrombotic therapy to prevent stroke in atrial
fibrillation: Antithrombotic therapy to prevent stroke in patients with atrial fibrillation: A meta-analysis. Journal
of the American Geriatrics Society. 2001; 49(1): p. 91-94.
67. Hart RG,BOMR. Review: Antithrombotic agents prevent stroke in non-valvular atrial fibrillation: Commentary.
Evidence-Based Medicine. 2000; 5(3): p. 82.
68. Hart RG,HJL. Atrial fibrillation and stroke concepts and controversies. Stroke. 2001; 32(3): p. [d]803-808.
69. Hart RG, Benavente O, McBride R, Pearce LA. Antithrombotic therapy to prevent stroke in patients with atrial
fibrillation: a meta-analysis. Ann Intern Med. 1999 Oct; 131(7): p. 492-501.
70. Hankey GJ,PMRSSRBRCBGCADHCDGAHJLMKWMJLMANBNCCPJFRROSDEWLCRMFKAAHW. Rivaroxaban
compared with warfarin in patients with atrial fibrillation and previous stroke or transient ischaemic attack: A
subgroup analysis of ROCKET AF. The Lancet Neurology. 2012; 11(4): p. 315-322.
71. Gorter JW. Major bleeding during anticoagulation after cerebral ischemia: patterns and risk factors. Stroke
Prevention In Reversible Ischemia Trial (SPIRIT). European Atrial Fibrillation Trial (EAFT) study groups. Neurology.
Pharmacoepidemiological Research on Outcomes of Therapeutics by a European ConsorTium
64
1999 Oct; 53(6): p. 1319-1327.
72. Go AS,FMCSDE. Antithrombotic therapy for stroke prevention in atrial fibrillation. Progress in Cardiovascular
Diseases. 2005; 48(2): p. 108-124.
73. Gersh BJab. Antithrombotic therapy in nonrheumatic/nonvalvular atrial fibrillation. Journal of Cardiovascular
Electrophysiology. 1999; 10(3): p. 461-471.
74. Gattellari MabdWJcZNa. Warfarin: An inconvenient truth. Stroke. 2009; 40(1): p. 5-7.
75. Fang MC, Go AS, Hylek EM, Chang Y, Henault LE, Jensvold NG, et al. Age and the risk of warfarin-associated
hemorrhage: the anticoagulation and risk factors in atrial fibrillation study. J Am Geriatr Soc. 2006 Aug; 54(8): p.
1231-1236.
76. Ezekowitz MD, Levine JA. Preventing stroke in patients with atrial fibrillation. JAMA. 1999 May; 281(19): p. 1830-
1835.
77. Evans A, Kalra L. Are the results of randomized controlled trials on anticoagulation in patients with atrial
fibrillation generalizable to clinical practice? Arch Intern Med. 2001 Jun; 161(11): p. 1443-1447.
78. Eikelboom JW,WLCSJEMHJSOJYSAMKSHSHDHCFMGHKRPVJYS. Risk of bleeding with 2 doses of dabigatran
compared with warfarin in older and younger patients with atrial fibrillation: An analysis of the randomized
evaluation of long-term anticoagulant therapy (RE-LY) Trial. Circulation. 2011; 123(21): p. 2363-2372.
79. Cleland JGF,CPJFRH. Should all patients with atrial fibrillation receive warfarin? Evidence from randomized
clinical trials. European Heart Journal. 1996; 17(5): p. 674-681.
80. Chevalier PaTPb. Pharmacotherapy of atrial fibrillation. Annals of Noninvasive Electrocardiology. 1998; 3(2): p.
153-161.
81. Beyerbach DMaZDPab. Mortality as an endpoint in atrial fibrillation. Heart Rhythm. 2004; 1(2 SUPPL.): p. B8-B19.
82. Belot A, Remontet L, Launoy G, Jooste V, Giorgi R. Competing risk models to estimate the excess mortality and
the first recurrent-event hazards. BMC Med Res Methodol. 2011; 11: p. 78.
83. Baker WL, Cios DA, Sander SD, Coleman CI. Meta-analysis to assess the quality of warfarin control in atrial
fibrillation patients in the United States. J Manag Care Pharm. 2009 Apr; 15(3): p. 244-252.
84. Andersen PK, Geskus RB, , Putter H. Competing risks in epidemiology: possibilities and pitfalls. Int J Epidemiol.
2012 Jun; 41(3): p. 861-870.
85. Andersen LV, Vestergaard P, Deichgraeber P, Lindholt JS, Mortensen LS, Frost L. Warfarin for the prevention of
systemic embolism in patients with non-valvular atrial fibrillation: a meta-analysis. Heart. 2008 Dec; 94(12): p.
1607-1613.

Pharmacoepidemiological Research on Outcomes of Therapeutics by a European ConsorTium
65
86. Albers GW,AJEHJSDGHRACSJ. Stroke prevention in nonvalvular atrial fibrillation. Annals of Internal Medicine.
1991; 115(9): p. 727-736.
87. Albers GW,DJELAMWJPPSDE. Antithrombotic therapy in atrial fibrillation. Chest. 2001; 119(1 SUPPL.): p. 194S-
206S.
88. Ahrens I,LGYHPK. What do the RE-LY, AVERROES and ROCKET-AF trials tell us for stroke prevention in atrial
fibrillation? Thrombosis and Haemostasis. 2011; 105(4): p. 574-578.
89. Agarwal MMCS, Hachamovitch MMR, Menon MV. Current Trial-Associated Outcomes With Warfarin in
Prevention of Stroke in Patients With Nonvalvular Atrial FibrillationA Meta-analysis. Archives of Internal
Medicine. 2012; 172(8): p. 623-631.
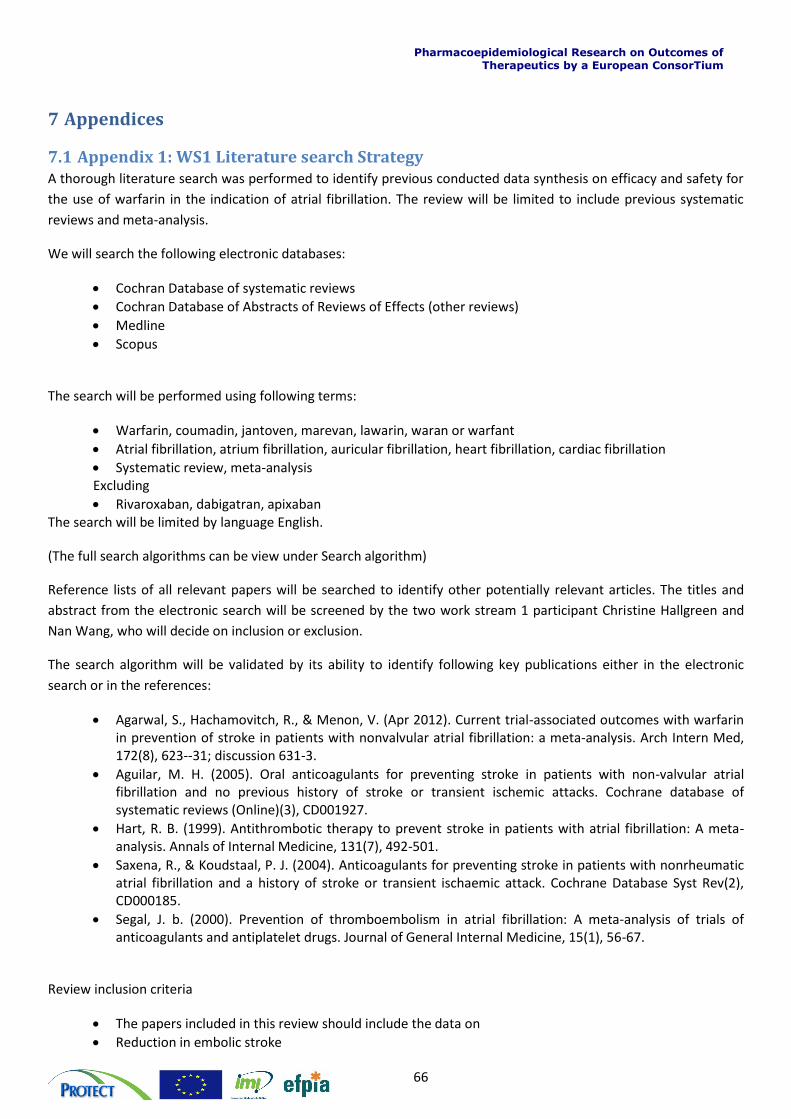
Pharmacoepidemiological Research on Outcomes of Therapeutics by a European ConsorTium
66
7 Appendices
7.1 Appendix 1: WS1 Literature search Strategy A thorough literature search was performed to identify previous conducted data synthesis on efficacy and safety for
the use of warfarin in the indication of atrial fibrillation. The review will be limited to include previous systematic
reviews and meta-analysis.
We will search the following electronic databases:
Cochran Database of systematic reviews
Cochran Database of Abstracts of Reviews of Effects (other reviews)
Medline
Scopus
The search will be performed using following terms:
Warfarin, coumadin, jantoven, marevan, lawarin, waran or warfant
Atrial fibrillation, atrium fibrillation, auricular fibrillation, heart fibrillation, cardiac fibrillation
Systematic review, meta-analysis Excluding
Rivaroxaban, dabigatran, apixaban The search will be limited by language English.
(The full search algorithms can be view under Search algorithm)
Reference lists of all relevant papers will be searched to identify other potentially relevant articles. The titles and
abstract from the electronic search will be screened by the two work stream 1 participant Christine Hallgreen and
Nan Wang, who will decide on inclusion or exclusion.
The search algorithm will be validated by its ability to identify following key publications either in the electronic
search or in the references:
Agarwal, S., Hachamovitch, R., & Menon, V. (Apr 2012). Current trial-associated outcomes with warfarin in prevention of stroke in patients with nonvalvular atrial fibrillation: a meta-analysis. Arch Intern Med, 172(8), 623--31; discussion 631-3.
Aguilar, M. H. (2005). Oral anticoagulants for preventing stroke in patients with non-valvular atrial fibrillation and no previous history of stroke or transient ischemic attacks. Cochrane database of systematic reviews (Online)(3), CD001927.
Hart, R. B. (1999). Antithrombotic therapy to prevent stroke in patients with atrial fibrillation: A meta-analysis. Annals of Internal Medicine, 131(7), 492-501.
Saxena, R., & Koudstaal, P. J. (2004). Anticoagulants for preventing stroke in patients with nonrheumatic atrial fibrillation and a history of stroke or transient ischaemic attack. Cochrane Database Syst Rev(2), CD000185.
Segal, J. b. (2000). Prevention of thromboembolism in atrial fibrillation: A meta-analysis of trials of anticoagulants and antiplatelet drugs. Journal of General Internal Medicine, 15(1), 56-67.
Review inclusion criteria
The papers included in this review should include the data on
Reduction in embolic stroke
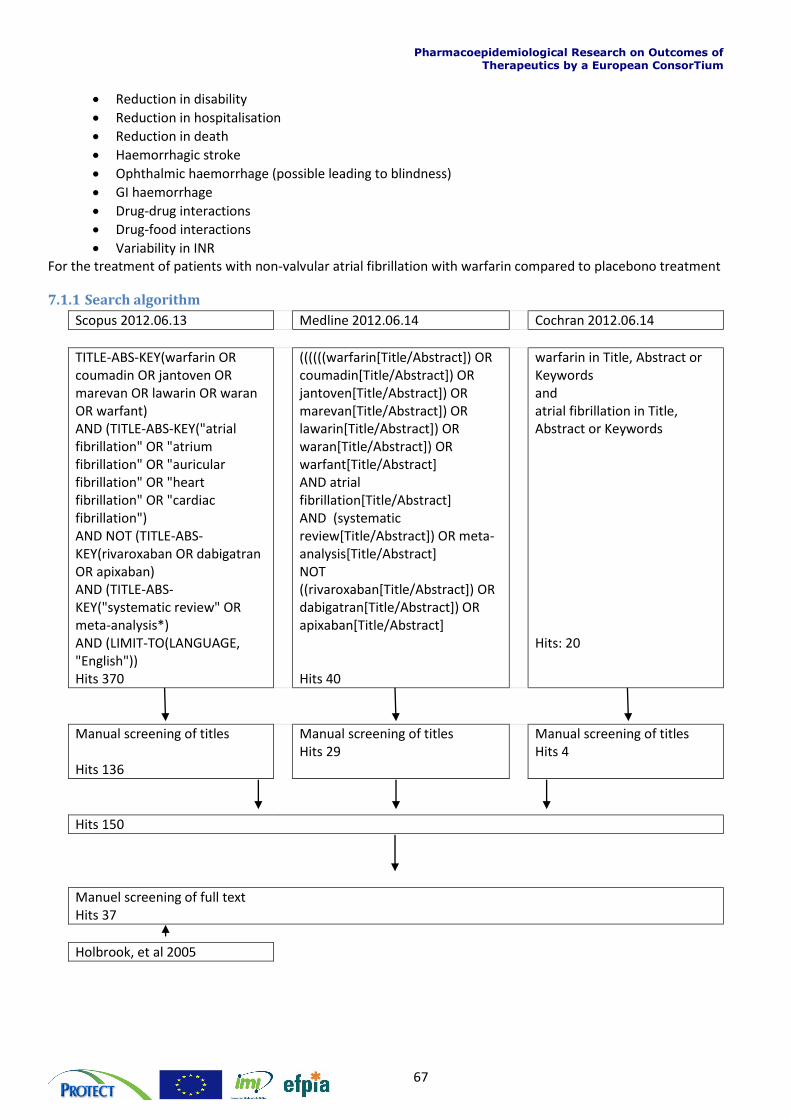
Pharmacoepidemiological Research on Outcomes of Therapeutics by a European ConsorTium
67
Reduction in disability
Reduction in hospitalisation
Reduction in death
Haemorrhagic stroke
Ophthalmic haemorrhage (possible leading to blindness)
GI haemorrhage
Drug-drug interactions
Drug-food interactions
Variability in INR For the treatment of patients with non-valvular atrial fibrillation with warfarin compared to placebono treatment
7.1.1 Search algorithm
Scopus 2012.06.13 Medline 2012.06.14 Cochran 2012.06.14
TITLE-ABS-KEY(warfarin OR coumadin OR jantoven OR marevan OR lawarin OR waran OR warfant) AND (TITLE-ABS-KEY("atrial fibrillation" OR "atrium fibrillation" OR "auricular fibrillation" OR "heart fibrillation" OR "cardiac fibrillation") AND NOT (TITLE-ABS-KEY(rivaroxaban OR dabigatran OR apixaban) AND (TITLE-ABS-KEY("systematic review" OR meta-analysis*) AND (LIMIT-TO(LANGUAGE, "English")) Hits 370
((((((warfarin[Title/Abstract]) OR coumadin[Title/Abstract]) OR jantoven[Title/Abstract]) OR marevan[Title/Abstract]) OR lawarin[Title/Abstract]) OR waran[Title/Abstract]) OR warfant[Title/Abstract] AND atrial fibrillation[Title/Abstract] AND (systematic review[Title/Abstract]) OR meta-analysis[Title/Abstract] NOT ((rivaroxaban[Title/Abstract]) OR dabigatran[Title/Abstract]) OR apixaban[Title/Abstract] Hits 40
warfarin in Title, Abstract or Keywords and atrial fibrillation in Title, Abstract or Keywords Hits: 20
Manual screening of titles Hits 136
Manual screening of titles Hits 29
Manual screening of titles Hits 4
Hits 150
Manuel screening of full text Hits 37
Holbrook, et al 2005
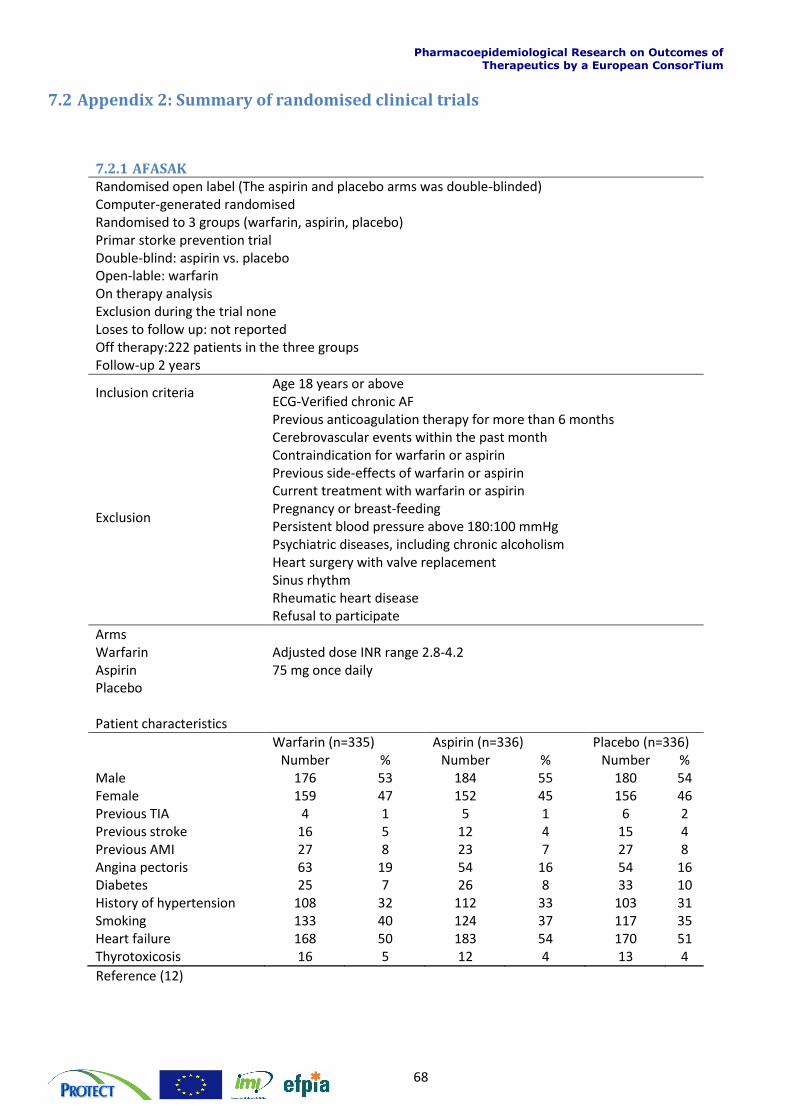
Pharmacoepidemiological Research on Outcomes of Therapeutics by a European ConsorTium
68
7.2 Appendix 2: Summary of randomised clinical trials
7.2.1 AFASAK Randomised open label (The aspirin and placebo arms was double-blinded) Computer-generated randomised Randomised to 3 groups (warfarin, aspirin, placebo) Primar storke prevention trial Double-blind: aspirin vs. placebo Open-lable: warfarin On therapy analysis Exclusion during the trial none Loses to follow up: not reported Off therapy:222 patients in the three groups Follow-up 2 years
Inclusion criteria Age 18 years or above ECG-Verified chronic AF
Exclusion
Previous anticoagulation therapy for more than 6 months Cerebrovascular events within the past month Contraindication for warfarin or aspirin Previous side-effects of warfarin or aspirin Current treatment with warfarin or aspirin Pregnancy or breast-feeding Persistent blood pressure above 180:100 mmHg Psychiatric diseases, including chronic alcoholism Heart surgery with valve replacement Sinus rhythm Rheumatic heart disease Refusal to participate
Arms Warfarin Adjusted dose INR range 2.8-4.2 Aspirin 75 mg once daily Placebo Patient characteristics
Warfarin (n=335) Aspirin (n=336) Placebo (n=336) Number % Number % Number % Male 176 53 184 55 180 54 Female 159 47 152 45 156 46 Previous TIA 4 1 5 1 6 2 Previous stroke 16 5 12 4 15 4 Previous AMI 27 8 23 7 27 8 Angina pectoris 63 19 54 16 54 16 Diabetes 25 7 26 8 33 10 History of hypertension 108 32 112 33 103 31 Smoking 133 40 124 37 117 35 Heart failure 168 50 183 54 170 51 Thyrotoxicosis 16 5 12 4 13 4
Reference (12)
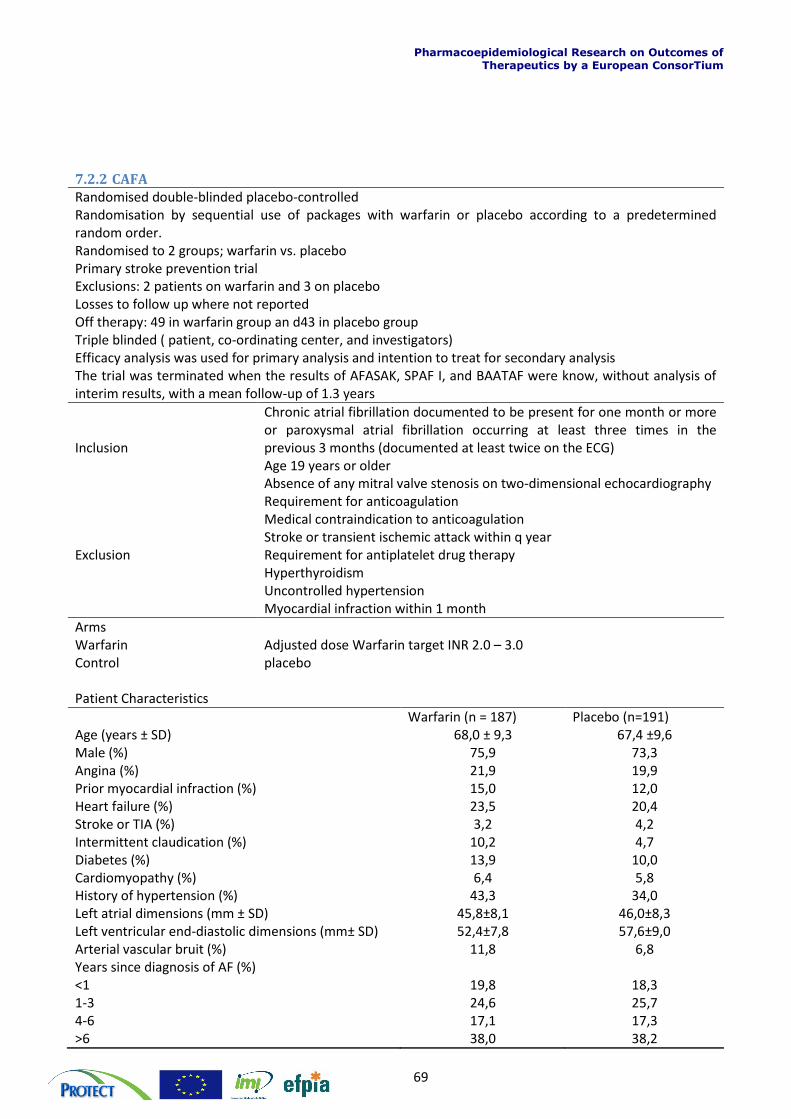
Pharmacoepidemiological Research on Outcomes of Therapeutics by a European ConsorTium
69
7.2.2 CAFA Randomised double-blinded placebo-controlled Randomisation by sequential use of packages with warfarin or placebo according to a predetermined random order. Randomised to 2 groups; warfarin vs. placebo Primary stroke prevention trial Exclusions: 2 patients on warfarin and 3 on placebo Losses to follow up where not reported Off therapy: 49 in warfarin group an d43 in placebo group Triple blinded ( patient, co-ordinating center, and investigators) Efficacy analysis was used for primary analysis and intention to treat for secondary analysis The trial was terminated when the results of AFASAK, SPAF I, and BAATAF were know, without analysis of interim results, with a mean follow-up of 1.3 years
Inclusion
Chronic atrial fibrillation documented to be present for one month or more or paroxysmal atrial fibrillation occurring at least three times in the previous 3 months (documented at least twice on the ECG) Age 19 years or older Absence of any mitral valve stenosis on two-dimensional echocardiography
Exclusion
Requirement for anticoagulation Medical contraindication to anticoagulation Stroke or transient ischemic attack within q year Requirement for antiplatelet drug therapy Hyperthyroidism Uncontrolled hypertension Myocardial infraction within 1 month
Arms Warfarin Adjusted dose Warfarin target INR 2.0 – 3.0 Control placebo Patient Characteristics
Warfarin (n = 187) Placebo (n=191) Age (years ± SD) 68,0 ± 9,3 67,4 ±9,6 Male (%) 75,9 73,3 Angina (%) 21,9 19,9 Prior myocardial infraction (%) 15,0 12,0 Heart failure (%) 23,5 20,4 Stroke or TIA (%) 3,2 4,2 Intermittent claudication (%) 10,2 4,7 Diabetes (%) 13,9 10,0 Cardiomyopathy (%) 6,4 5,8 History of hypertension (%) 43,3 34,0 Left atrial dimensions (mm ± SD) 45,8±8,1 46,0±8,3 Left ventricular end-diastolic dimensions (mm± SD) 52,4±7,8 57,6±9,0 Arterial vascular bruit (%) 11,8 6,8 Years since diagnosis of AF (%) <1 19,8 18,3 1-3 24,6 25,7 4-6 17,1 17,3 >6 38,0 38,2
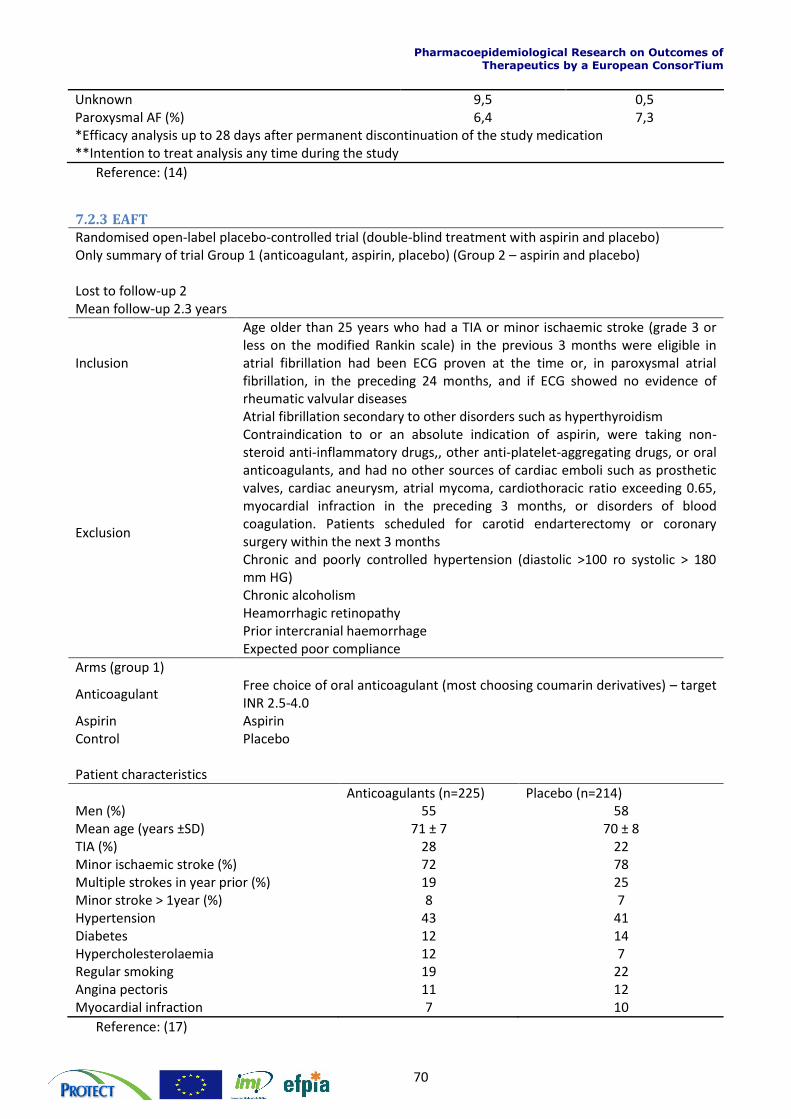
Pharmacoepidemiological Research on Outcomes of Therapeutics by a European ConsorTium
70
Unknown 9,5 0,5 Paroxysmal AF (%) 6,4 7,3 *Efficacy analysis up to 28 days after permanent discontinuation of the study medication **Intention to treat analysis any time during the study
Reference: (14)
7.2.3 EAFT Randomised open-label placebo-controlled trial (double-blind treatment with aspirin and placebo) Only summary of trial Group 1 (anticoagulant, aspirin, placebo) (Group 2 – aspirin and placebo) Lost to follow-up 2 Mean follow-up 2.3 years
Inclusion
Age older than 25 years who had a TIA or minor ischaemic stroke (grade 3 or less on the modified Rankin scale) in the previous 3 months were eligible in atrial fibrillation had been ECG proven at the time or, in paroxysmal atrial fibrillation, in the preceding 24 months, and if ECG showed no evidence of rheumatic valvular diseases
Exclusion
Atrial fibrillation secondary to other disorders such as hyperthyroidism Contraindication to or an absolute indication of aspirin, were taking non-steroid anti-inflammatory drugs,, other anti-platelet-aggregating drugs, or oral anticoagulants, and had no other sources of cardiac emboli such as prosthetic valves, cardiac aneurysm, atrial mycoma, cardiothoracic ratio exceeding 0.65, myocardial infraction in the preceding 3 months, or disorders of blood coagulation. Patients scheduled for carotid endarterectomy or coronary surgery within the next 3 months Chronic and poorly controlled hypertension (diastolic >100 ro systolic > 180 mm HG) Chronic alcoholism Heamorrhagic retinopathy Prior intercranial haemorrhage Expected poor compliance
Arms (group 1)
Anticoagulant Free choice of oral anticoagulant (most choosing coumarin derivatives) – target INR 2.5-4.0
Aspirin Aspirin Control Placebo Patient characteristics
Anticoagulants (n=225) Placebo (n=214) Men (%) 55 58 Mean age (years ±SD) 71 ± 7 70 ± 8 TIA (%) 28 22 Minor ischaemic stroke (%) 72 78 Multiple strokes in year prior (%) 19 25 Minor stroke > 1year (%) 8 7 Hypertension 43 41 Diabetes 12 14 Hypercholesterolaemia 12 7 Regular smoking 19 22 Angina pectoris 11 12 Myocardial infraction 7 10
Reference: (17)
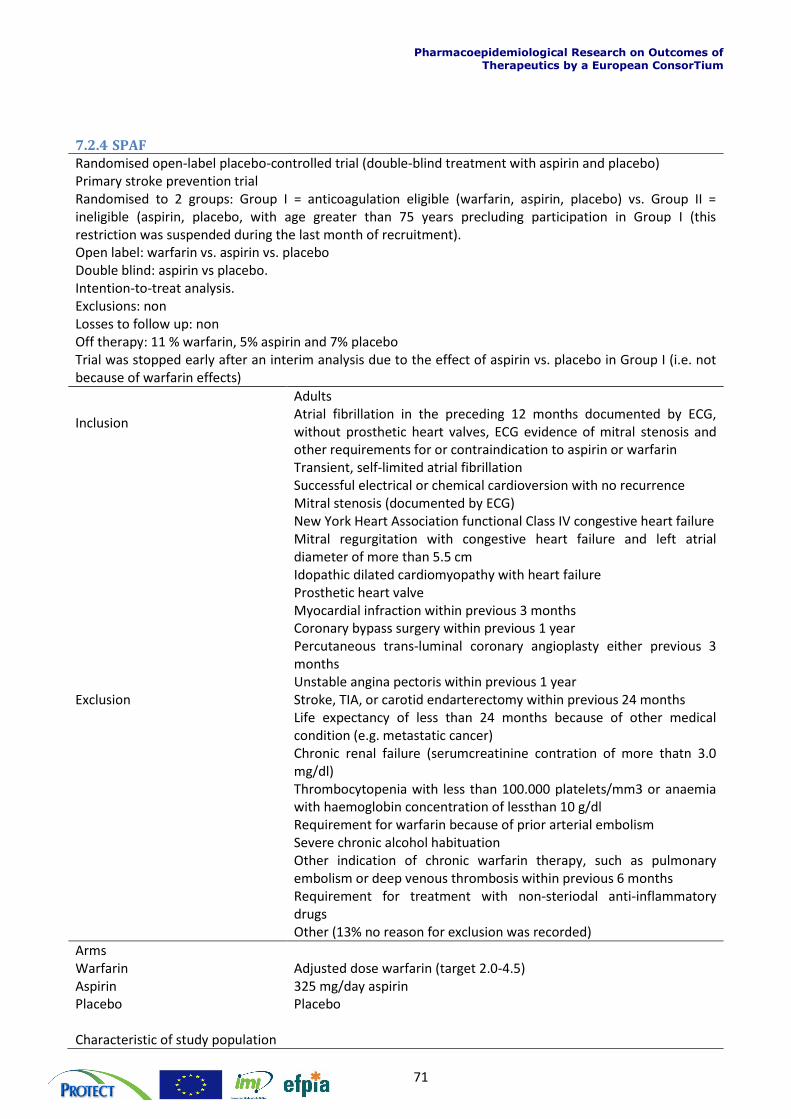
Pharmacoepidemiological Research on Outcomes of Therapeutics by a European ConsorTium
71
7.2.4 SPAF Randomised open-label placebo-controlled trial (double-blind treatment with aspirin and placebo) Primary stroke prevention trial Randomised to 2 groups: Group I = anticoagulation eligible (warfarin, aspirin, placebo) vs. Group II = ineligible (aspirin, placebo, with age greater than 75 years precluding participation in Group I (this restriction was suspended during the last month of recruitment). Open label: warfarin vs. aspirin vs. placebo Double blind: aspirin vs placebo. Intention-to-treat analysis. Exclusions: non Losses to follow up: non Off therapy: 11 % warfarin, 5% aspirin and 7% placebo Trial was stopped early after an interim analysis due to the effect of aspirin vs. placebo in Group I (i.e. not because of warfarin effects)
Inclusion
Adults Atrial fibrillation in the preceding 12 months documented by ECG, without prosthetic heart valves, ECG evidence of mitral stenosis and other requirements for or contraindication to aspirin or warfarin
Exclusion
Transient, self-limited atrial fibrillation Successful electrical or chemical cardioversion with no recurrence Mitral stenosis (documented by ECG) New York Heart Association functional Class IV congestive heart failure Mitral regurgitation with congestive heart failure and left atrial diameter of more than 5.5 cm Idopathic dilated cardiomyopathy with heart failure Prosthetic heart valve Myocardial infraction within previous 3 months Coronary bypass surgery within previous 1 year Percutaneous trans-luminal coronary angioplasty either previous 3 months Unstable angina pectoris within previous 1 year Stroke, TIA, or carotid endarterectomy within previous 24 months Life expectancy of less than 24 months because of other medical condition (e.g. metastatic cancer) Chronic renal failure (serumcreatinine contration of more thatn 3.0 mg/dl) Thrombocytopenia with less than 100.000 platelets/mm3 or anaemia with haemoglobin concentration of lessthan 10 g/dl Requirement for warfarin because of prior arterial embolism Severe chronic alcohol habituation Other indication of chronic warfarin therapy, such as pulmonary embolism or deep venous thrombosis within previous 6 months Requirement for treatment with non-steriodal anti-inflammatory drugs Other (13% no reason for exclusion was recorded)
Arms Warfarin Adjusted dose warfarin (target 2.0-4.5) Aspirin 325 mg/day aspirin Placebo Placebo Characteristic of study population
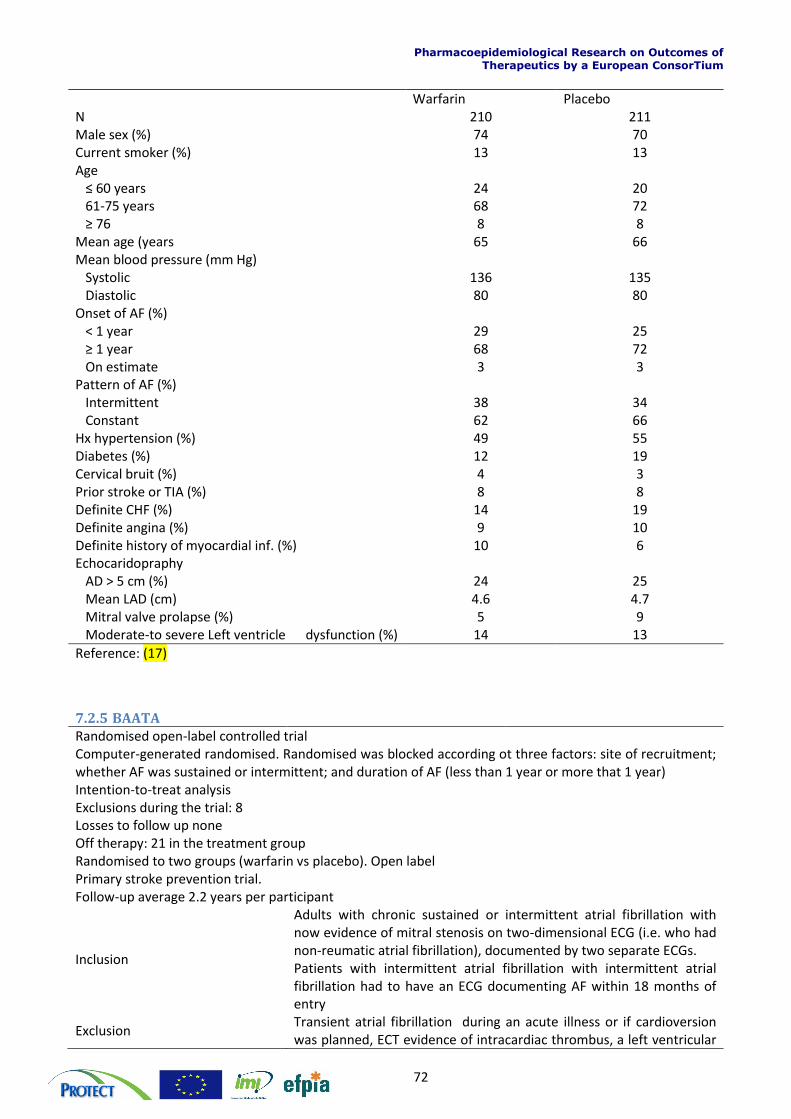
Pharmacoepidemiological Research on Outcomes of Therapeutics by a European ConsorTium
72
Warfarin Placebo N 210 211 Male sex (%) 74 70 Current smoker (%) 13 13 Age ≤ 60 years 24 20 61-75 years 68 72 ≥ 76 8 8 Mean age (years 65 66 Mean blood pressure (mm Hg) Systolic 136 135 Diastolic 80 80 Onset of AF (%) < 1 year 29 25 ≥ 1 year 68 72 On estimate 3 3 Pattern of AF (%) Intermittent 38 34 Constant 62 66 Hx hypertension (%) 49 55 Diabetes (%) 12 19 Cervical bruit (%) 4 3 Prior stroke or TIA (%) 8 8 Definite CHF (%) 14 19 Definite angina (%) 9 10 Definite history of myocardial inf. (%) 10 6 Echocaridopraphy AD > 5 cm (%) 24 25 Mean LAD (cm) 4.6 4.7 Mitral valve prolapse (%) 5 9 Moderate-to severe Left ventricle dysfunction (%) 14 13
Reference: (17)
7.2.5 BAATA
Randomised open-label controlled trial Computer-generated randomised. Randomised was blocked according ot three factors: site of recruitment; whether AF was sustained or intermittent; and duration of AF (less than 1 year or more that 1 year) Intention-to-treat analysis Exclusions during the trial: 8 Losses to follow up none Off therapy: 21 in the treatment group Randomised to two groups (warfarin vs placebo). Open label Primary stroke prevention trial. Follow-up average 2.2 years per participant
Inclusion
Adults with chronic sustained or intermittent atrial fibrillation with now evidence of mitral stenosis on two-dimensional ECG (i.e. who had non-reumatic atrial fibrillation), documented by two separate ECGs. Patients with intermittent atrial fibrillation with intermittent atrial fibrillation had to have an ECG documenting AF within 18 months of entry
Exclusion Transient atrial fibrillation during an acute illness or if cardioversion was planned, ECT evidence of intracardiac thrombus, a left ventricular
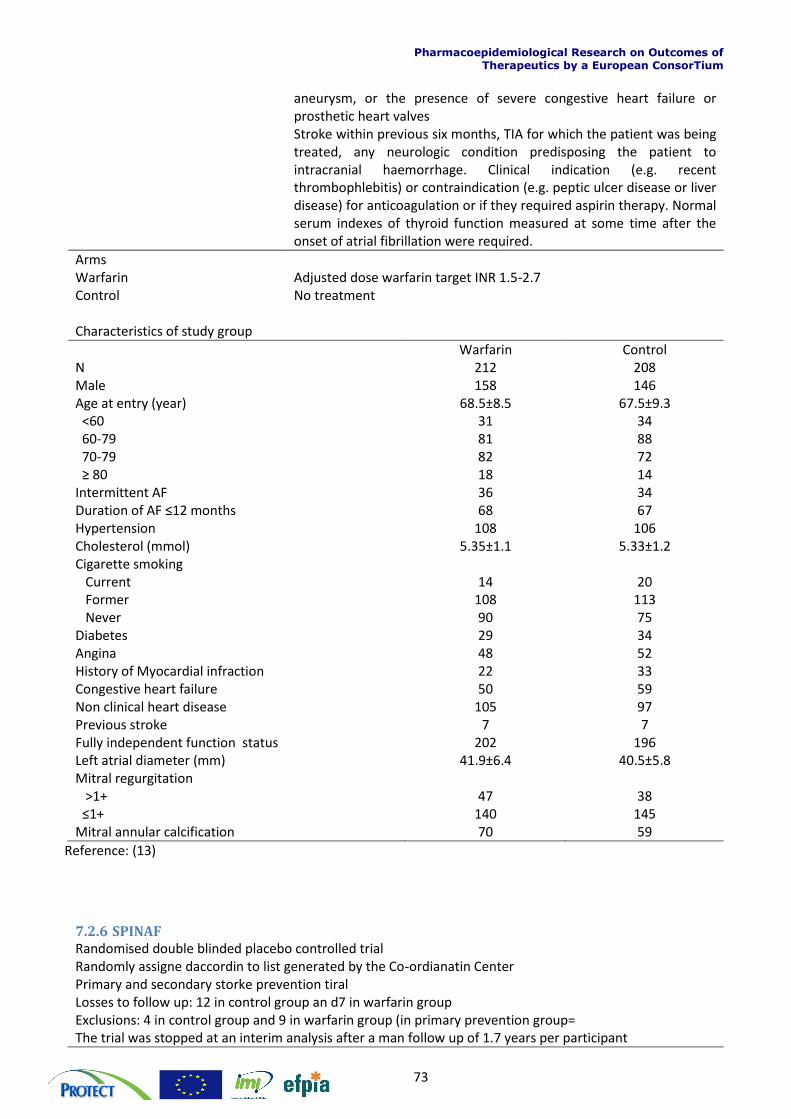
Pharmacoepidemiological Research on Outcomes of Therapeutics by a European ConsorTium
73
aneurysm, or the presence of severe congestive heart failure or prosthetic heart valves Stroke within previous six months, TIA for which the patient was being treated, any neurologic condition predisposing the patient to intracranial haemorrhage. Clinical indication (e.g. recent thrombophlebitis) or contraindication (e.g. peptic ulcer disease or liver disease) for anticoagulation or if they required aspirin therapy. Normal serum indexes of thyroid function measured at some time after the onset of atrial fibrillation were required.
Arms Warfarin Adjusted dose warfarin target INR 1.5-2.7 Control No treatment Characteristics of study group
Warfarin Control N 212 208 Male 158 146 Age at entry (year) 68.5±8.5 67.5±9.3 <60 31 34 60-79 81 88 70-79 82 72 ≥ 80 18 14 Intermittent AF 36 34 Duration of AF ≤12 months 68 67 Hypertension 108 106 Cholesterol (mmol) 5.35±1.1 5.33±1.2 Cigarette smoking Current 14 20 Former 108 113 Never 90 75 Diabetes 29 34 Angina 48 52 History of Myocardial infraction 22 33 Congestive heart failure 50 59 Non clinical heart disease 105 97 Previous stroke 7 7 Fully independent function status 202 196 Left atrial diameter (mm) 41.9±6.4 40.5±5.8 Mitral regurgitation >1+ 47 38 ≤1+ 140 145 Mitral annular calcification 70 59
Reference: (13)
7.2.6 SPINAF
Randomised double blinded placebo controlled trial Randomly assigne daccordin to list generated by the Co-ordianatin Center Primary and secondary storke prevention tiral Losses to follow up: 12 in control group an d7 in warfarin group Exclusions: 4 in control group and 9 in warfarin group (in primary prevention group= The trial was stopped at an interim analysis after a man follow up of 1.7 years per participant
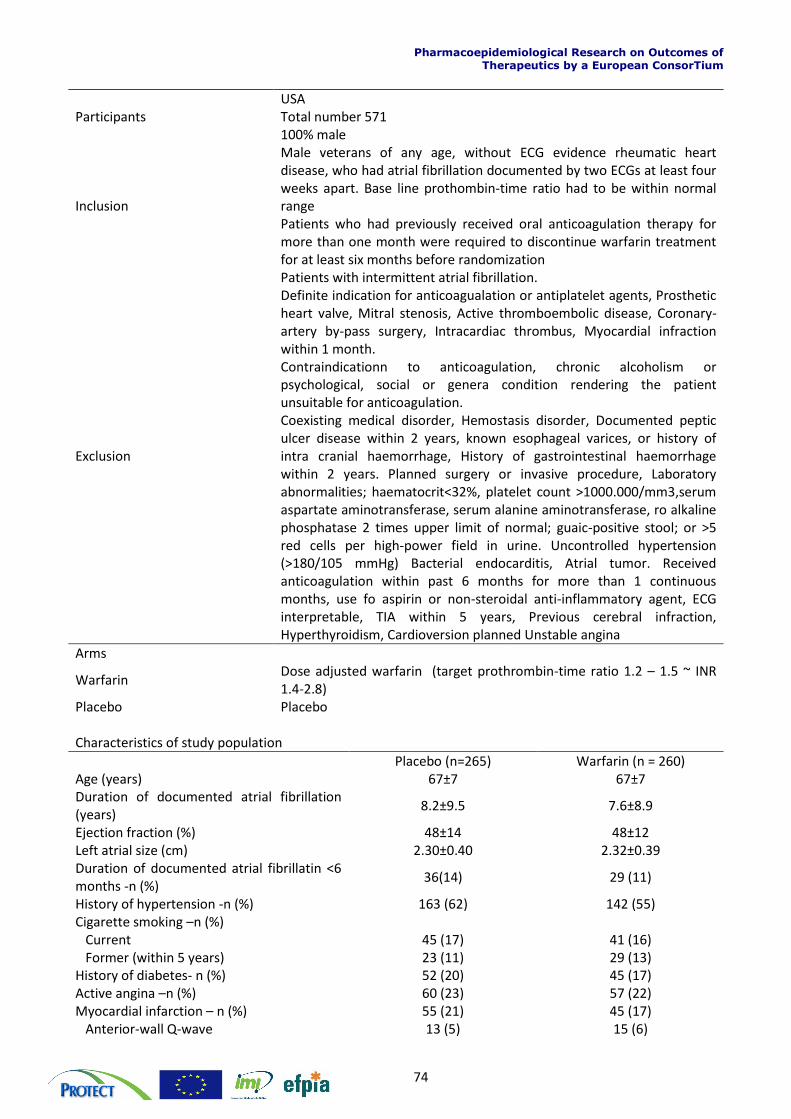
Pharmacoepidemiological Research on Outcomes of Therapeutics by a European ConsorTium
74
Participants USA Total number 571 100% male
Inclusion
Male veterans of any age, without ECG evidence rheumatic heart disease, who had atrial fibrillation documented by two ECGs at least four weeks apart. Base line prothombin-time ratio had to be within normal range Patients who had previously received oral anticoagulation therapy for more than one month were required to discontinue warfarin treatment for at least six months before randomization
Exclusion
Patients with intermittent atrial fibrillation. Definite indication for anticoagualation or antiplatelet agents, Prosthetic heart valve, Mitral stenosis, Active thromboembolic disease, Coronary-artery by-pass surgery, Intracardiac thrombus, Myocardial infraction within 1 month. Contraindicationn to anticoagulation, chronic alcoholism or psychological, social or genera condition rendering the patient unsuitable for anticoagulation. Coexisting medical disorder, Hemostasis disorder, Documented peptic ulcer disease within 2 years, known esophageal varices, or history of intra cranial haemorrhage, History of gastrointestinal haemorrhage within 2 years. Planned surgery or invasive procedure, Laboratory abnormalities; haematocrit<32%, platelet count >1000.000/mm3,serum aspartate aminotransferase, serum alanine aminotransferase, ro alkaline phosphatase 2 times upper limit of normal; guaic-positive stool; or >5 red cells per high-power field in urine. Uncontrolled hypertension (>180/105 mmHg) Bacterial endocarditis, Atrial tumor. Received anticoagulation within past 6 months for more than 1 continuous months, use fo aspirin or non-steroidal anti-inflammatory agent, ECG interpretable, TIA within 5 years, Previous cerebral infraction, Hyperthyroidism, Cardioversion planned Unstable angina
Arms
Warfarin Dose adjusted warfarin (target prothrombin-time ratio 1.2 – 1.5 ~ INR 1.4-2.8)
Placebo Placebo Characteristics of study population
Placebo (n=265) Warfarin (n = 260) Age (years) 67±7 67±7 Duration of documented atrial fibrillation (years)
8.2±9.5 7.6±8.9
Ejection fraction (%) 48±14 48±12 Left atrial size (cm) 2.30±0.40 2.32±0.39 Duration of documented atrial fibrillatin <6 months -n (%)
36(14) 29 (11)
History of hypertension -n (%) 163 (62) 142 (55) Cigarette smoking –n (%) Current 45 (17) 41 (16) Former (within 5 years) 23 (11) 29 (13) History of diabetes- n (%) 52 (20) 45 (17) Active angina –n (%) 60 (23) 57 (22) Myocardial infarction – n (%) 55 (21) 45 (17) Anterior-wall Q-wave 13 (5) 15 (6)
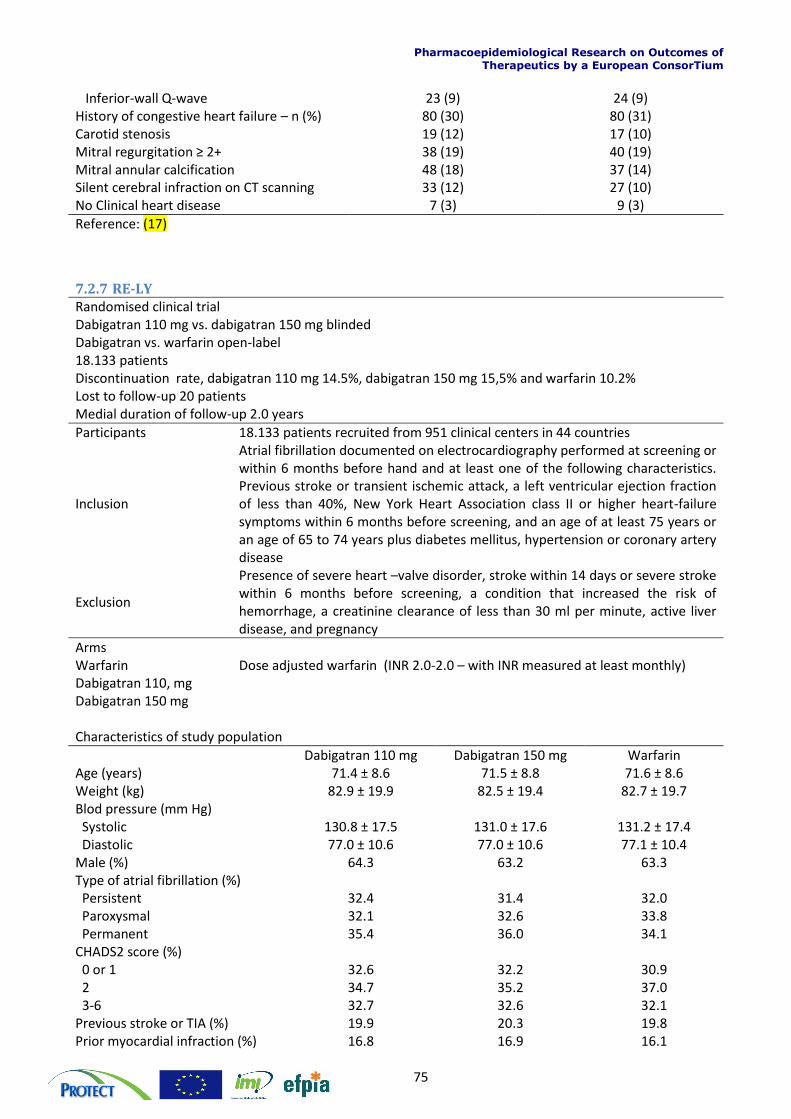
Pharmacoepidemiological Research on Outcomes of Therapeutics by a European ConsorTium
75
Inferior-wall Q-wave 23 (9) 24 (9) History of congestive heart failure – n (%) 80 (30) 80 (31) Carotid stenosis 19 (12) 17 (10) Mitral regurgitation ≥ 2+ 38 (19) 40 (19) Mitral annular calcification 48 (18) 37 (14) Silent cerebral infraction on CT scanning 33 (12) 27 (10) No Clinical heart disease 7 (3) 9 (3)
Reference: (17)
7.2.7 RE-LY Randomised clinical trial Dabigatran 110 mg vs. dabigatran 150 mg blinded Dabigatran vs. warfarin open-label 18.133 patients Discontinuation rate, dabigatran 110 mg 14.5%, dabigatran 150 mg 15,5% and warfarin 10.2% Lost to follow-up 20 patients Medial duration of follow-up 2.0 years
Participants 18.133 patients recruited from 951 clinical centers in 44 countries
Inclusion
Atrial fibrillation documented on electrocardiography performed at screening or within 6 months before hand and at least one of the following characteristics. Previous stroke or transient ischemic attack, a left ventricular ejection fraction of less than 40%, New York Heart Association class II or higher heart-failure symptoms within 6 months before screening, and an age of at least 75 years or an age of 65 to 74 years plus diabetes mellitus, hypertension or coronary artery disease
Exclusion
Presence of severe heart –valve disorder, stroke within 14 days or severe stroke within 6 months before screening, a condition that increased the risk of hemorrhage, a creatinine clearance of less than 30 ml per minute, active liver disease, and pregnancy
Arms Warfarin Dose adjusted warfarin (INR 2.0-2.0 – with INR measured at least monthly) Dabigatran 110, mg Dabigatran 150 mg Characteristics of study population
Dabigatran 110 mg Dabigatran 150 mg Warfarin Age (years) 71.4 ± 8.6 71.5 ± 8.8 71.6 ± 8.6 Weight (kg) 82.9 ± 19.9 82.5 ± 19.4 82.7 ± 19.7 Blod pressure (mm Hg) Systolic 130.8 ± 17.5 131.0 ± 17.6 131.2 ± 17.4 Diastolic 77.0 ± 10.6 77.0 ± 10.6 77.1 ± 10.4 Male (%) 64.3 63.2 63.3 Type of atrial fibrillation (%) Persistent 32.4 31.4 32.0 Paroxysmal 32.1 32.6 33.8 Permanent 35.4 36.0 34.1 CHADS2 score (%) 0 or 1 32.6 32.2 30.9 2 34.7 35.2 37.0 3-6 32.7 32.6 32.1 Previous stroke or TIA (%) 19.9 20.3 19.8 Prior myocardial infraction (%) 16.8 16.9 16.1
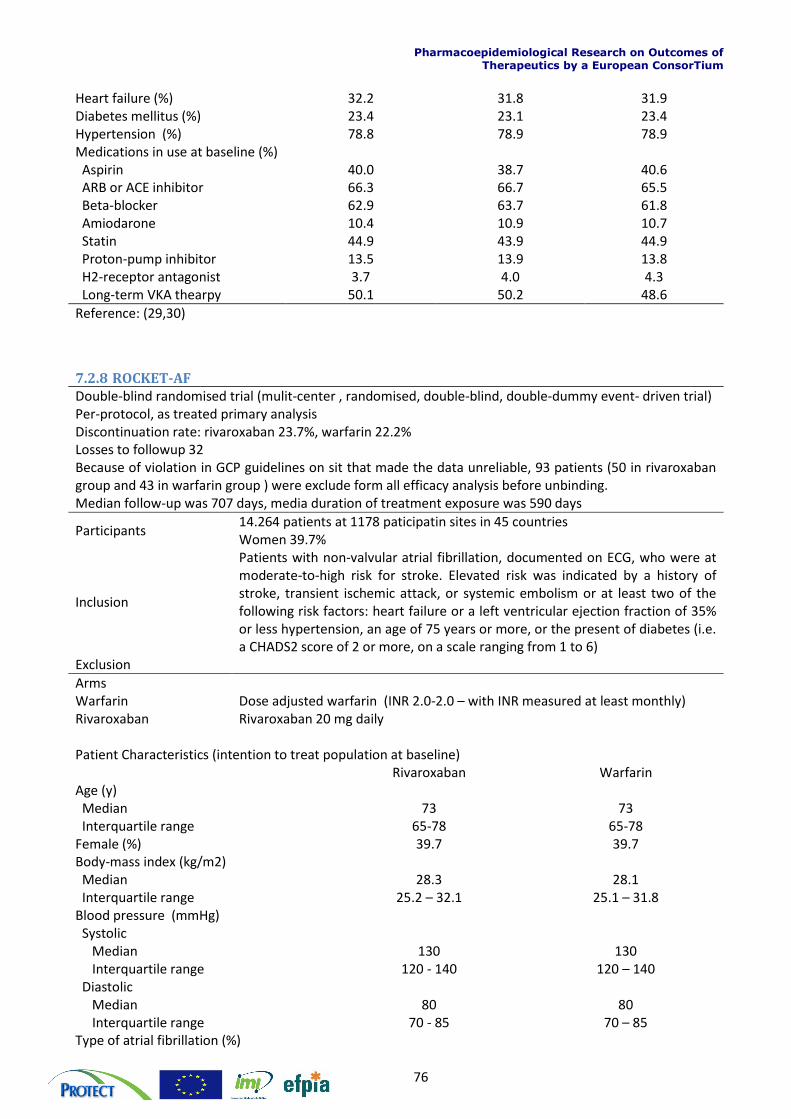
Pharmacoepidemiological Research on Outcomes of Therapeutics by a European ConsorTium
76
Heart failure (%) 32.2 31.8 31.9 Diabetes mellitus (%) 23.4 23.1 23.4 Hypertension (%) 78.8 78.9 78.9 Medications in use at baseline (%) Aspirin 40.0 38.7 40.6 ARB or ACE inhibitor 66.3 66.7 65.5 Beta-blocker 62.9 63.7 61.8 Amiodarone 10.4 10.9 10.7 Statin 44.9 43.9 44.9 Proton-pump inhibitor 13.5 13.9 13.8 H2-receptor antagonist 3.7 4.0 4.3 Long-term VKA thearpy 50.1 50.2 48.6
Reference: (29,30)
7.2.8 ROCKET-AF Double-blind randomised trial (mulit-center , randomised, double-blind, double-dummy event- driven trial) Per-protocol, as treated primary analysis Discontinuation rate: rivaroxaban 23.7%, warfarin 22.2% Losses to followup 32 Because of violation in GCP guidelines on sit that made the data unreliable, 93 patients (50 in rivaroxaban group and 43 in warfarin group ) were exclude form all efficacy analysis before unbinding. Median follow-up was 707 days, media duration of treatment exposure was 590 days
Participants 14.264 patients at 1178 paticipatin sites in 45 countries Women 39.7%
Inclusion
Patients with non-valvular atrial fibrillation, documented on ECG, who were at moderate-to-high risk for stroke. Elevated risk was indicated by a history of stroke, transient ischemic attack, or systemic embolism or at least two of the following risk factors: heart failure or a left ventricular ejection fraction of 35% or less hypertension, an age of 75 years or more, or the present of diabetes (i.e. a CHADS2 score of 2 or more, on a scale ranging from 1 to 6)
Exclusion
Arms Warfarin Dose adjusted warfarin (INR 2.0-2.0 – with INR measured at least monthly) Rivaroxaban Rivaroxaban 20 mg daily Patient Characteristics (intention to treat population at baseline) Rivaroxaban Warfarin Age (y) Median 73 73 Interquartile range 65-78 65-78 Female (%) 39.7 39.7 Body-mass index (kg/m2) Median 28.3 28.1 Interquartile range 25.2 – 32.1 25.1 – 31.8 Blood pressure (mmHg) Systolic Median 130 130 Interquartile range 120 - 140 120 – 140 Diastolic Median 80 80 Interquartile range 70 - 85 70 – 85 Type of atrial fibrillation (%)
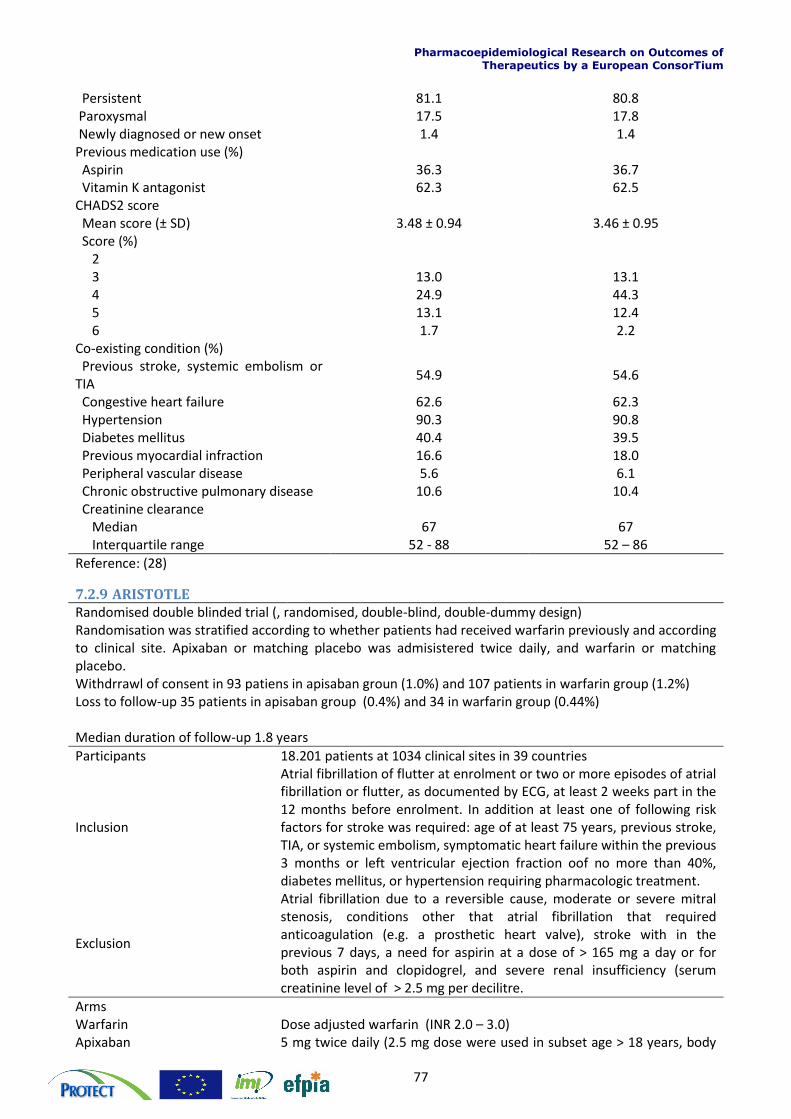
Pharmacoepidemiological Research on Outcomes of Therapeutics by a European ConsorTium
77
Persistent 81.1 80.8 Paroxysmal 17.5 17.8 Newly diagnosed or new onset 1.4 1.4 Previous medication use (%) Aspirin 36.3 36.7 Vitamin K antagonist 62.3 62.5 CHADS2 score Mean score (± SD) 3.48 ± 0.94 3.46 ± 0.95 Score (%) 2 3 13.0 13.1 4 24.9 44.3 5 13.1 12.4 6 1.7 2.2 Co-existing condition (%) Previous stroke, systemic embolism or TIA
54.9 54.6
Congestive heart failure 62.6 62.3 Hypertension 90.3 90.8 Diabetes mellitus 40.4 39.5 Previous myocardial infraction 16.6 18.0 Peripheral vascular disease 5.6 6.1 Chronic obstructive pulmonary disease 10.6 10.4 Creatinine clearance Median 67 67 Interquartile range 52 - 88 52 – 86
Reference: (28)
7.2.9 ARISTOTLE
Randomised double blinded trial (, randomised, double-blind, double-dummy design) Randomisation was stratified according to whether patients had received warfarin previously and according to clinical site. Apixaban or matching placebo was admisistered twice daily, and warfarin or matching placebo. Withdrrawl of consent in 93 patiens in apisaban groun (1.0%) and 107 patients in warfarin group (1.2%) Loss to follow-up 35 patients in apisaban group (0.4%) and 34 in warfarin group (0.44%) Median duration of follow-up 1.8 years
Participants 18.201 patients at 1034 clinical sites in 39 countries
Inclusion
Atrial fibrillation of flutter at enrolment or two or more episodes of atrial fibrillation or flutter, as documented by ECG, at least 2 weeks part in the 12 months before enrolment. In addition at least one of following risk factors for stroke was required: age of at least 75 years, previous stroke, TIA, or systemic embolism, symptomatic heart failure within the previous 3 months or left ventricular ejection fraction oof no more than 40%, diabetes mellitus, or hypertension requiring pharmacologic treatment.
Exclusion
Atrial fibrillation due to a reversible cause, moderate or severe mitral stenosis, conditions other that atrial fibrillation that required anticoagulation (e.g. a prosthetic heart valve), stroke with in the previous 7 days, a need for aspirin at a dose of > 165 mg a day or for both aspirin and clopidogrel, and severe renal insufficiency (serum creatinine level of > 2.5 mg per decilitre.
Arms Warfarin Dose adjusted warfarin (INR 2.0 – 3.0) Apixaban 5 mg twice daily (2.5 mg dose were used in subset age > 18 years, body
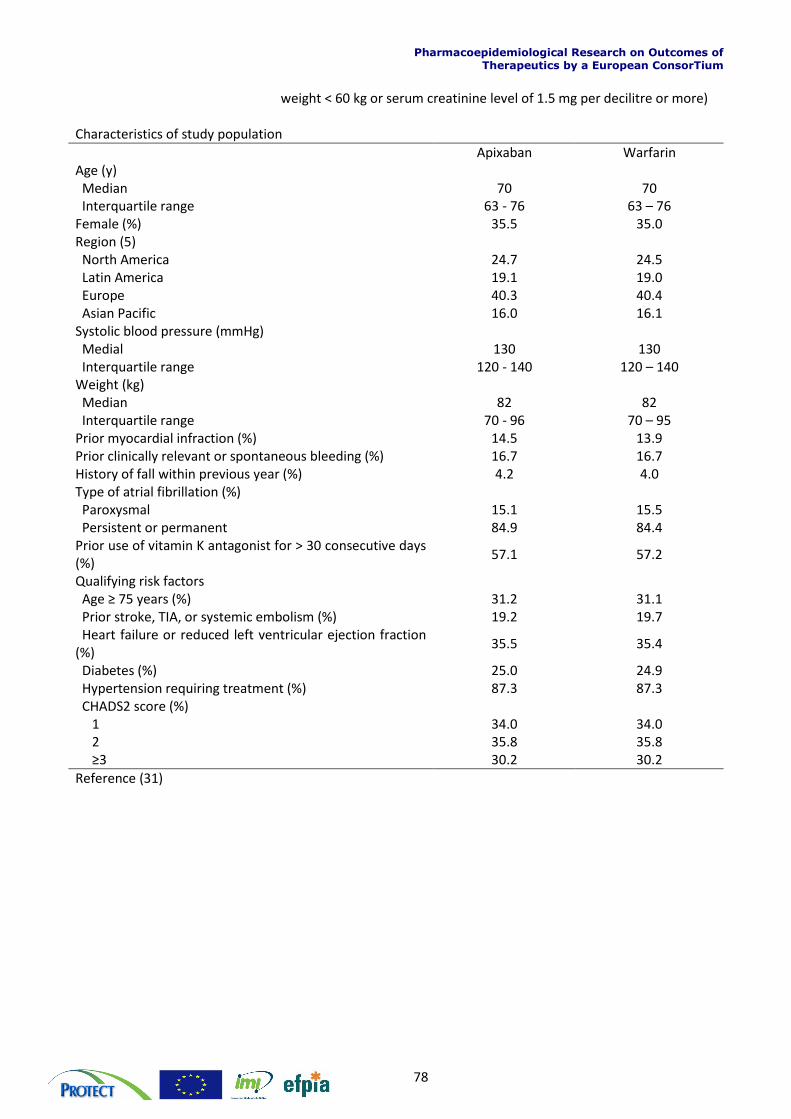
Pharmacoepidemiological Research on Outcomes of Therapeutics by a European ConsorTium
78
weight < 60 kg or serum creatinine level of 1.5 mg per decilitre or more) Characteristics of study population
Apixaban Warfarin Age (y) Median 70 70 Interquartile range 63 - 76 63 – 76 Female (%) 35.5 35.0 Region (5) North America 24.7 24.5 Latin America 19.1 19.0 Europe 40.3 40.4 Asian Pacific 16.0 16.1 Systolic blood pressure (mmHg) Medial 130 130 Interquartile range 120 - 140 120 – 140 Weight (kg) Median 82 82 Interquartile range 70 - 96 70 – 95 Prior myocardial infraction (%) 14.5 13.9 Prior clinically relevant or spontaneous bleeding (%) 16.7 16.7 History of fall within previous year (%) 4.2 4.0 Type of atrial fibrillation (%) Paroxysmal 15.1 15.5 Persistent or permanent 84.9 84.4 Prior use of vitamin K antagonist for > 30 consecutive days (%)
57.1 57.2
Qualifying risk factors Age ≥ 75 years (%) 31.2 31.1 Prior stroke, TIA, or systemic embolism (%) 19.2 19.7 Heart failure or reduced left ventricular ejection fraction (%)
35.5 35.4
Diabetes (%) 25.0 24.9 Hypertension requiring treatment (%) 87.3 87.3 CHADS2 score (%) 1 34.0 34.0 2 35.8 35.8 ≥3 30.2 30.2
Reference (31)
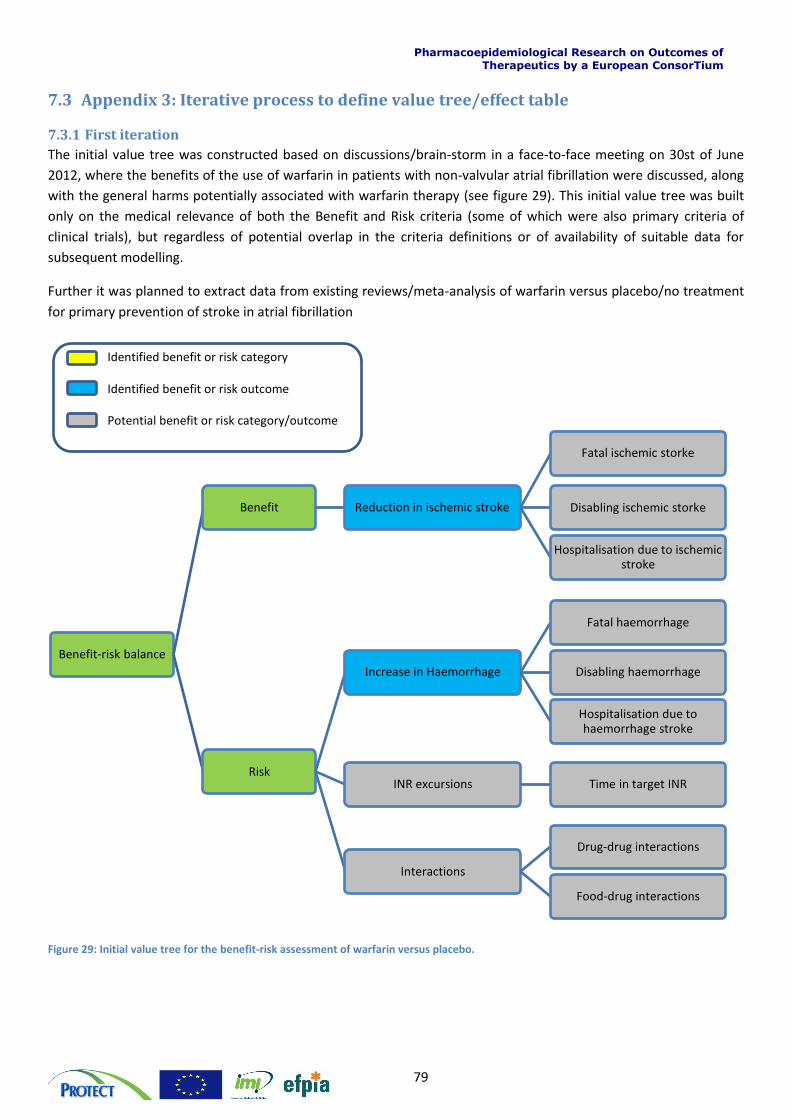
Pharmacoepidemiological Research on Outcomes of Therapeutics by a European ConsorTium
79
7.3 Appendix 3: Iterative process to define value tree/effect table
7.3.1 First iteration
The initial value tree was constructed based on discussions/brain-storm in a face-to-face meeting on 30st of June
2012, where the benefits of the use of warfarin in patients with non-valvular atrial fibrillation were discussed, along
with the general harms potentially associated with warfarin therapy (see figure 29). This initial value tree was built
only on the medical relevance of both the Benefit and Risk criteria (some of which were also primary criteria of
clinical trials), but regardless of potential overlap in the criteria definitions or of availability of suitable data for
subsequent modelling.
Further it was planned to extract data from existing reviews/meta-analysis of warfarin versus placebo/no treatment
for primary prevention of stroke in atrial fibrillation
Figure 29: Initial value tree for the benefit-risk assessment of warfarin versus placebo.
Benefit-risk balance
Benefit Reduction in ischemic stroke
Fatal ischemic storke
Disabling ischemic storke
Hospitalisation due to ischemic stroke
Risk
Increase in Haemorrhage
Fatal haemorrhage
Disabling haemorrhage
Hospitalisation due to haemorrhage stroke
INR excursions Time in target INR
Interactions
Drug-drug interactions
Food-drug interactions
Identified benefit or risk category
Identified benefit or risk outcome
Potential benefit or risk category/outcome
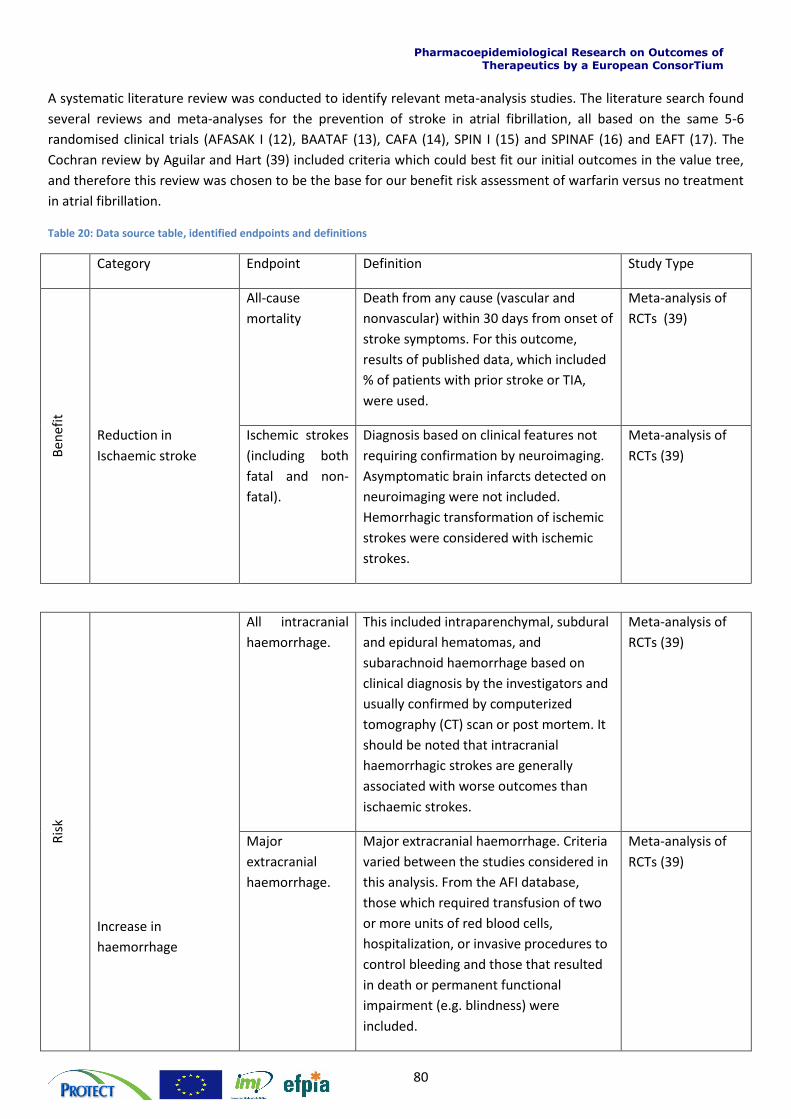
Pharmacoepidemiological Research on Outcomes of Therapeutics by a European ConsorTium
80
A systematic literature review was conducted to identify relevant meta-analysis studies. The literature search found
several reviews and meta-analyses for the prevention of stroke in atrial fibrillation, all based on the same 5-6
randomised clinical trials (AFASAK I (12), BAATAF (13), CAFA (14), SPIN I (15) and SPINAF (16) and EAFT (17). The
Cochran review by Aguilar and Hart (39) included criteria which could best fit our initial outcomes in the value tree,
and therefore this review was chosen to be the base for our benefit risk assessment of warfarin versus no treatment
in atrial fibrillation.
Table 20: Data source table, identified endpoints and definitions
Category Endpoint Definition Study Type
Ben
efit
All-cause
mortality
Death from any cause (vascular and
nonvascular) within 30 days from onset of
stroke symptoms. For this outcome,
results of published data, which included
% of patients with prior stroke or TIA,
were used.
Meta-analysis of
RCTs (39)
Reduction in
Ischaemic stroke
Ischemic strokes
(including both
fatal and non-
fatal).
Diagnosis based on clinical features not
requiring confirmation by neuroimaging.
Asymptomatic brain infarcts detected on
neuroimaging were not included.
Hemorrhagic transformation of ischemic
strokes were considered with ischemic
strokes.
Meta-analysis of
RCTs (39)
Ris
k
Increase in
haemorrhage
All intracranial
haemorrhage.
This included intraparenchymal, subdural
and epidural hematomas, and
subarachnoid haemorrhage based on
clinical diagnosis by the investigators and
usually confirmed by computerized
tomography (CT) scan or post mortem. It
should be noted that intracranial
haemorrhagic strokes are generally
associated with worse outcomes than
ischaemic strokes.
Meta-analysis of
RCTs (39)
Major
extracranial
haemorrhage.
Major extracranial haemorrhage. Criteria
varied between the studies considered in
this analysis. From the AFI database,
those which required transfusion of two
or more units of red blood cells,
hospitalization, or invasive procedures to
control bleeding and those that resulted
in death or permanent functional
impairment (e.g. blindness) were
included.
Meta-analysis of
RCTs (39)
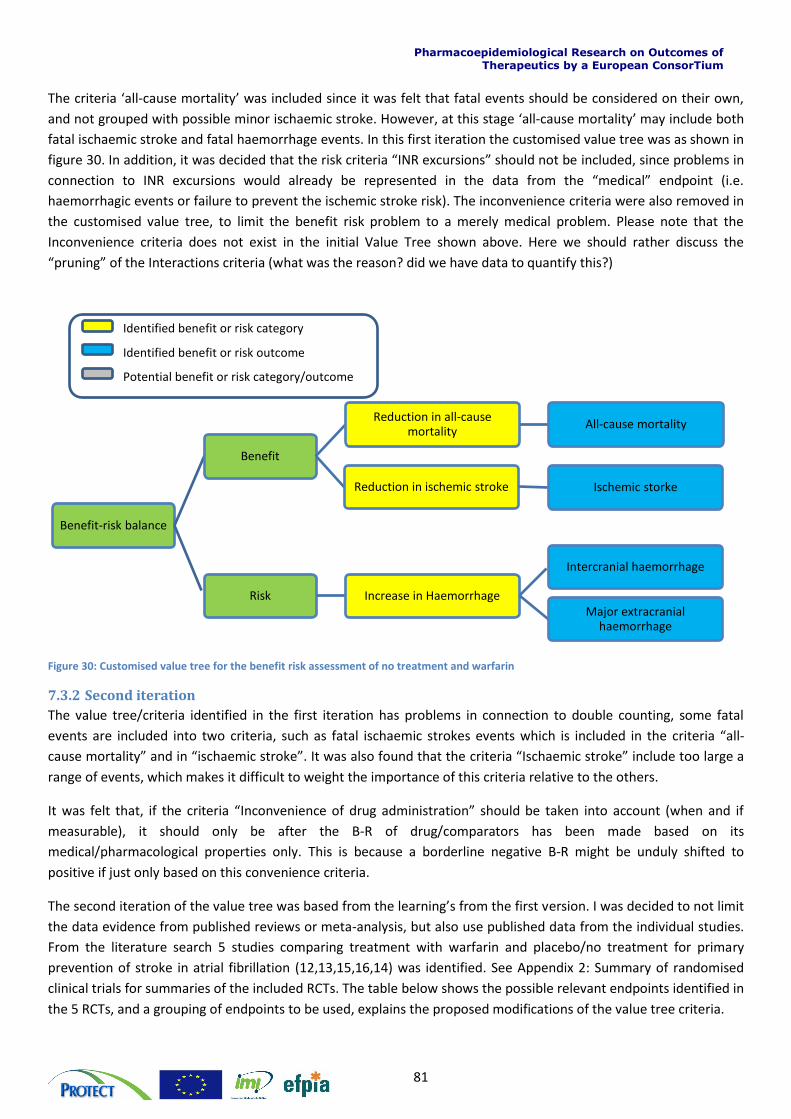
Pharmacoepidemiological Research on Outcomes of Therapeutics by a European ConsorTium
81
The criteria ‘all-cause mortality’ was included since it was felt that fatal events should be considered on their own,
and not grouped with possible minor ischaemic stroke. However, at this stage ‘all-cause mortality’ may include both
fatal ischaemic stroke and fatal haemorrhage events. In this first iteration the customised value tree was as shown in
figure 30. In addition, it was decided that the risk criteria “INR excursions” should not be included, since problems in
connection to INR excursions would already be represented in the data from the “medical” endpoint (i.e.
haemorrhagic events or failure to prevent the ischemic stroke risk). The inconvenience criteria were also removed in
the customised value tree, to limit the benefit risk problem to a merely medical problem. Please note that the
Inconvenience criteria does not exist in the initial Value Tree shown above. Here we should rather discuss the
“pruning” of the Interactions criteria (what was the reason? did we have data to quantify this?)
Figure 30: Customised value tree for the benefit risk assessment of no treatment and warfarin
7.3.2 Second iteration
The value tree/criteria identified in the first iteration has problems in connection to double counting, some fatal
events are included into two criteria, such as fatal ischaemic strokes events which is included in the criteria “all-
cause mortality” and in “ischaemic stroke”. It was also found that the criteria “Ischaemic stroke” include too large a
range of events, which makes it difficult to weight the importance of this criteria relative to the others.
It was felt that, if the criteria “Inconvenience of drug administration” should be taken into account (when and if
measurable), it should only be after the B-R of drug/comparators has been made based on its
medical/pharmacological properties only. This is because a borderline negative B-R might be unduly shifted to
positive if just only based on this convenience criteria.
The second iteration of the value tree was based from the learning’s from the first version. I was decided to not limit
the data evidence from published reviews or meta-analysis, but also use published data from the individual studies.
From the literature search 5 studies comparing treatment with warfarin and placebo/no treatment for primary
prevention of stroke in atrial fibrillation (12,13,15,16,14) was identified. See Appendix 2: Summary of randomised
clinical trials for summaries of the included RCTs. The table below shows the possible relevant endpoints identified in
the 5 RCTs, and a grouping of endpoints to be used, explains the proposed modifications of the value tree criteria.
Benefit-risk balance
Benefit
Reduction in ischemic stroke Ischemic storke
Reduction in all-cause mortality
All-cause mortality
Risk Increase in Haemorrhage
Intercranial haemorrhage
Major extracranial haemorrhage
Identified benefit or risk category
Identified benefit or risk outcome
Potential benefit or risk category/outcome
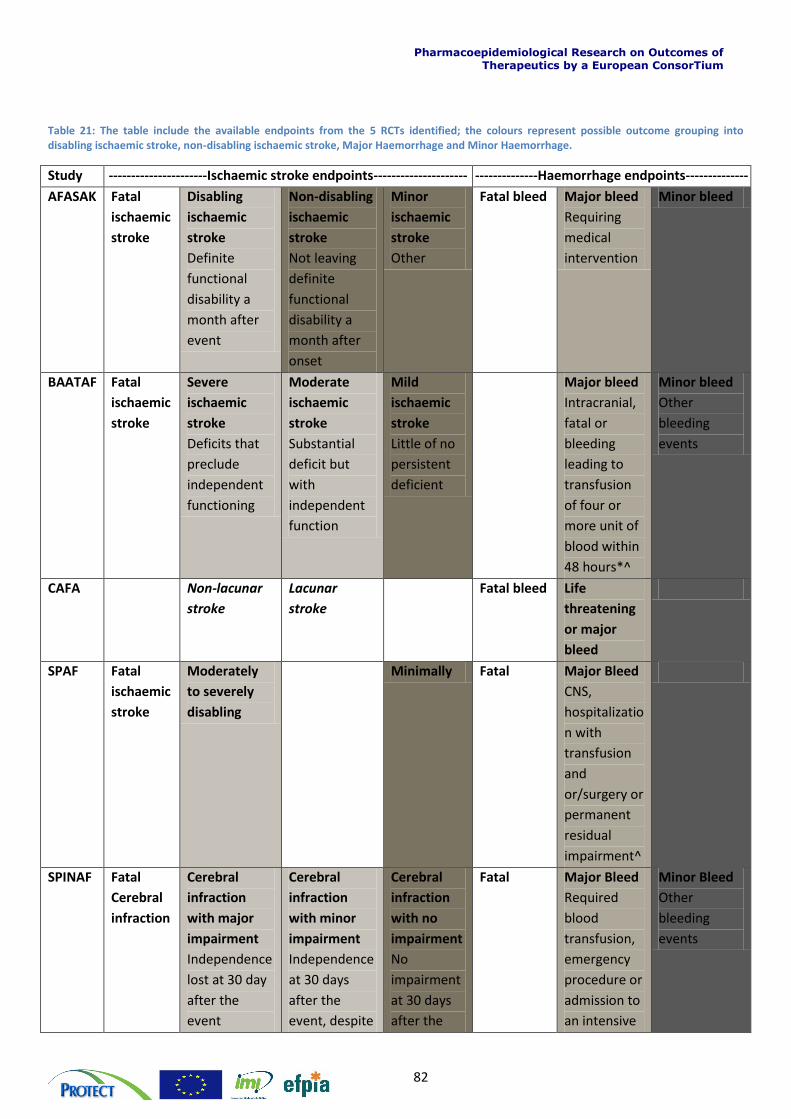
Pharmacoepidemiological Research on Outcomes of Therapeutics by a European ConsorTium
82
Table 21: The table include the available endpoints from the 5 RCTs identified; the colours represent possible outcome grouping into disabling ischaemic stroke, non-disabling ischaemic stroke, Major Haemorrhage and Minor Haemorrhage.
Study ----------------------Ischaemic stroke endpoints--------------------- --------------Haemorrhage endpoints--------------
AFASAK Fatal
ischaemic
stroke
Disabling
ischaemic
stroke
Definite
functional
disability a
month after
event
Non-disabling
ischaemic
stroke
Not leaving
definite
functional
disability a
month after
onset
Minor
ischaemic
stroke
Other
Fatal bleed Major bleed
Requiring
medical
intervention
Minor bleed
BAATAF Fatal
ischaemic
stroke
Severe
ischaemic
stroke
Deficits that
preclude
independent
functioning
Moderate
ischaemic
stroke
Substantial
deficit but
with
independent
function
Mild
ischaemic
stroke
Little of no
persistent
deficient
Major bleed
Intracranial,
fatal or
bleeding
leading to
transfusion
of four or
more unit of
blood within
48 hours*^
Minor bleed
Other
bleeding
events
CAFA Non-lacunar
stroke
Lacunar
stroke
Fatal bleed Life
threatening
or major
bleed
SPAF Fatal
ischaemic
stroke
Moderately
to severely
disabling
Minimally Fatal Major Bleed
CNS,
hospitalizatio
n with
transfusion
and
or/surgery or
permanent
residual
impairment^
SPINAF Fatal
Cerebral
infraction
Cerebral
infraction
with major
impairment
Independence
lost at 30 day
after the
event
Cerebral
infraction
with minor
impairment
Independence
at 30 days
after the
event, despite
Cerebral
infraction
with no
impairment
No
impairment
at 30 days
after the
Fatal Major Bleed
Required
blood
transfusion,
emergency
procedure or
admission to
an intensive
Minor Bleed
Other
bleeding
events
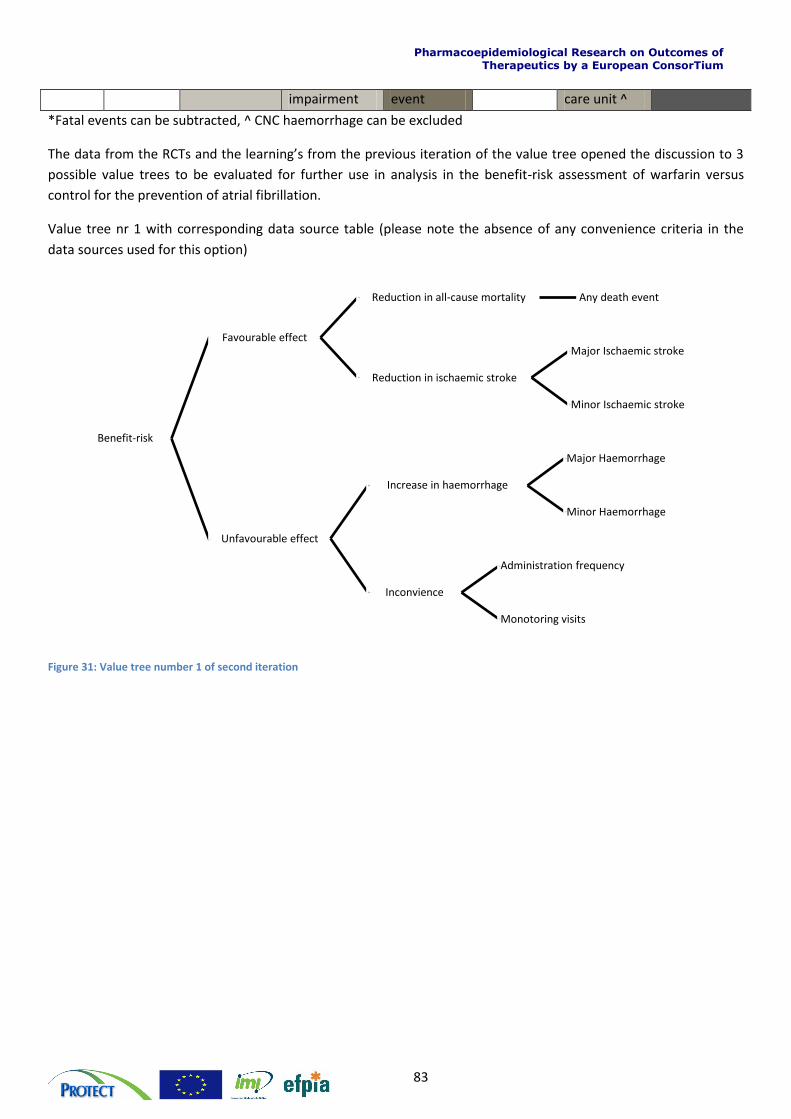
Pharmacoepidemiological Research on Outcomes of Therapeutics by a European ConsorTium
83
impairment event care unit ^
*Fatal events can be subtracted, ^ CNC haemorrhage can be excluded
The data from the RCTs and the learning’s from the previous iteration of the value tree opened the discussion to 3
possible value trees to be evaluated for further use in analysis in the benefit-risk assessment of warfarin versus
control for the prevention of atrial fibrillation.
Value tree nr 1 with corresponding data source table (please note the absence of any convenience criteria in the
data sources used for this option)
Figure 31: Value tree number 1 of second iteration
Benefit-risk
Favourable effect
Reduction in all-cause mortality Any death event
Reduction in ischaemic stroke
Major Ischaemic stroke
Minor Ischaemic stroke
Unfavourable effect
Increase in haemorrhage
Major Haemorrhage
Minor Haemorrhage
Inconvience
Administration frequency
Monotoring visits
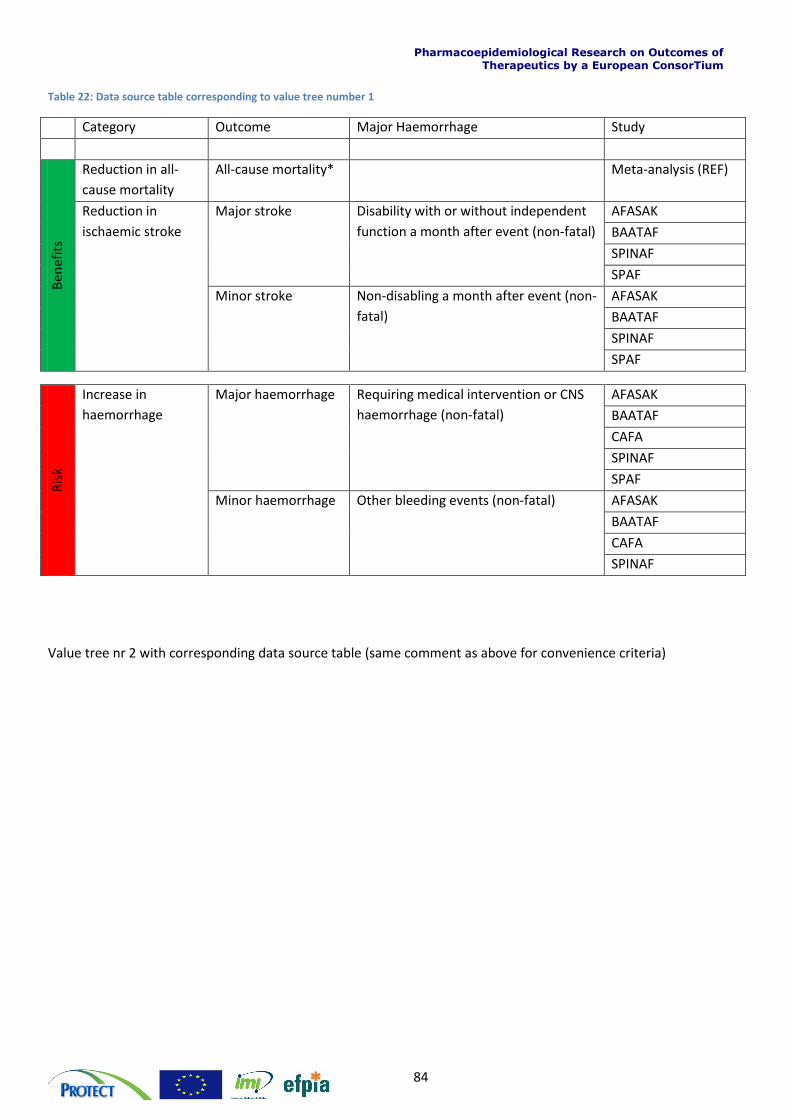
Pharmacoepidemiological Research on Outcomes of Therapeutics by a European ConsorTium
84
Table 22: Data source table corresponding to value tree number 1
Category Outcome Major Haemorrhage Study
Ben
efit
s
Reduction in all-
cause mortality
All-cause mortality* Meta-analysis (REF)
Reduction in
ischaemic stroke
Major stroke Disability with or without independent
function a month after event (non-fatal)
AFASAK
BAATAF
SPINAF
SPAF
Minor stroke Non-disabling a month after event (non-
fatal)
AFASAK
BAATAF
SPINAF
SPAF
Ris
k
Increase in
haemorrhage
Major haemorrhage Requiring medical intervention or CNS
haemorrhage (non-fatal)
AFASAK
BAATAF
CAFA
SPINAF
SPAF
Minor haemorrhage Other bleeding events (non-fatal) AFASAK
BAATAF
CAFA
SPINAF
Value tree nr 2 with corresponding data source table (same comment as above for convenience criteria)
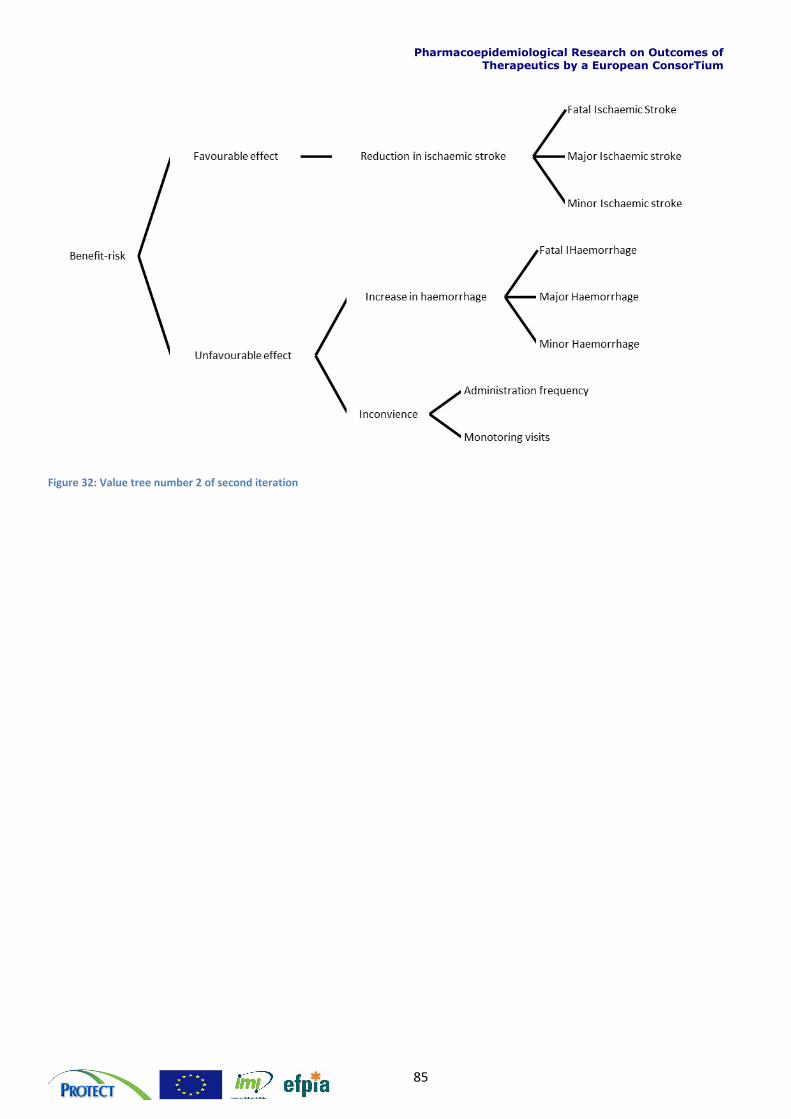
Pharmacoepidemiological Research on Outcomes of Therapeutics by a European ConsorTium
85
Figure 32: Value tree number 2 of second iteration
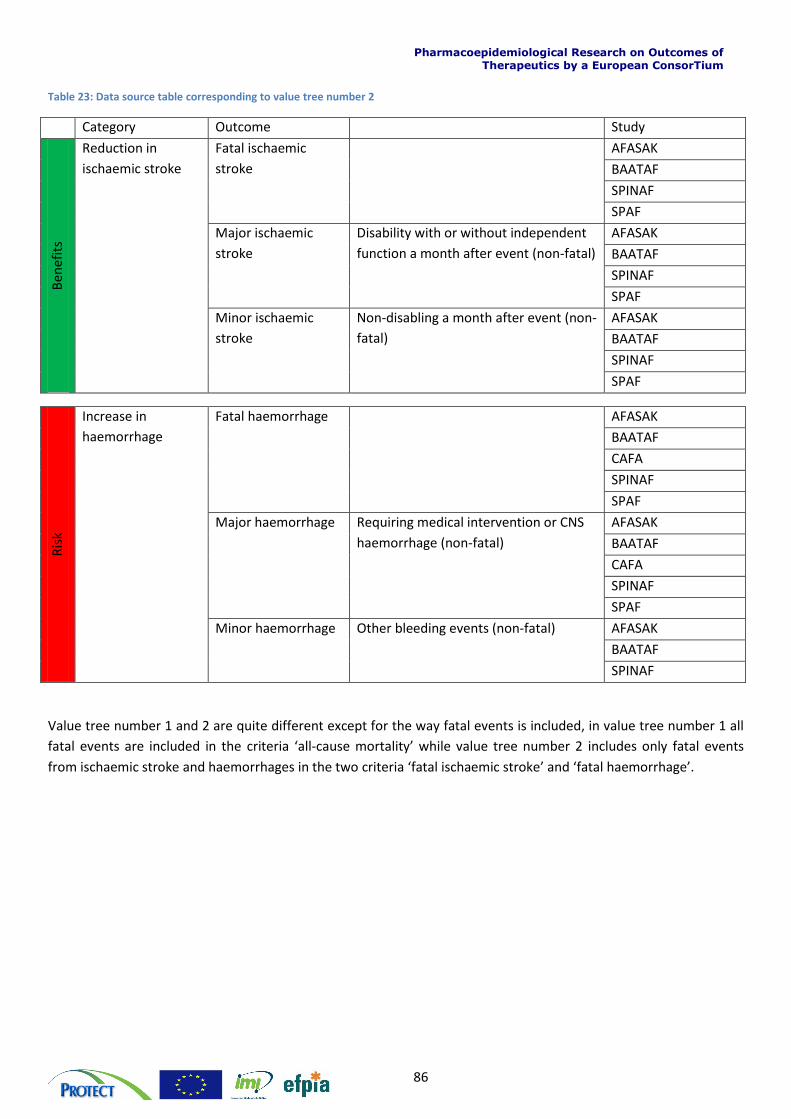
Pharmacoepidemiological Research on Outcomes of Therapeutics by a European ConsorTium
86
Table 23: Data source table corresponding to value tree number 2
Category Outcome Study
Ben
efit
s
Reduction in
ischaemic stroke
Fatal ischaemic
stroke
AFASAK
BAATAF
SPINAF
SPAF
Major ischaemic
stroke
Disability with or without independent
function a month after event (non-fatal)
AFASAK
BAATAF
SPINAF
SPAF
Minor ischaemic
stroke
Non-disabling a month after event (non-
fatal)
AFASAK
BAATAF
SPINAF
SPAF
Ris
k
Increase in
haemorrhage
Fatal haemorrhage AFASAK
BAATAF
CAFA
SPINAF
SPAF
Major haemorrhage Requiring medical intervention or CNS
haemorrhage (non-fatal)
AFASAK
BAATAF
CAFA
SPINAF
SPAF
Minor haemorrhage Other bleeding events (non-fatal) AFASAK
BAATAF
SPINAF
Value tree number 1 and 2 are quite different except for the way fatal events is included, in value tree number 1 all
fatal events are included in the criteria ‘all-cause mortality’ while value tree number 2 includes only fatal events
from ischaemic stroke and haemorrhages in the two criteria ‘fatal ischaemic stroke’ and ‘fatal haemorrhage’.
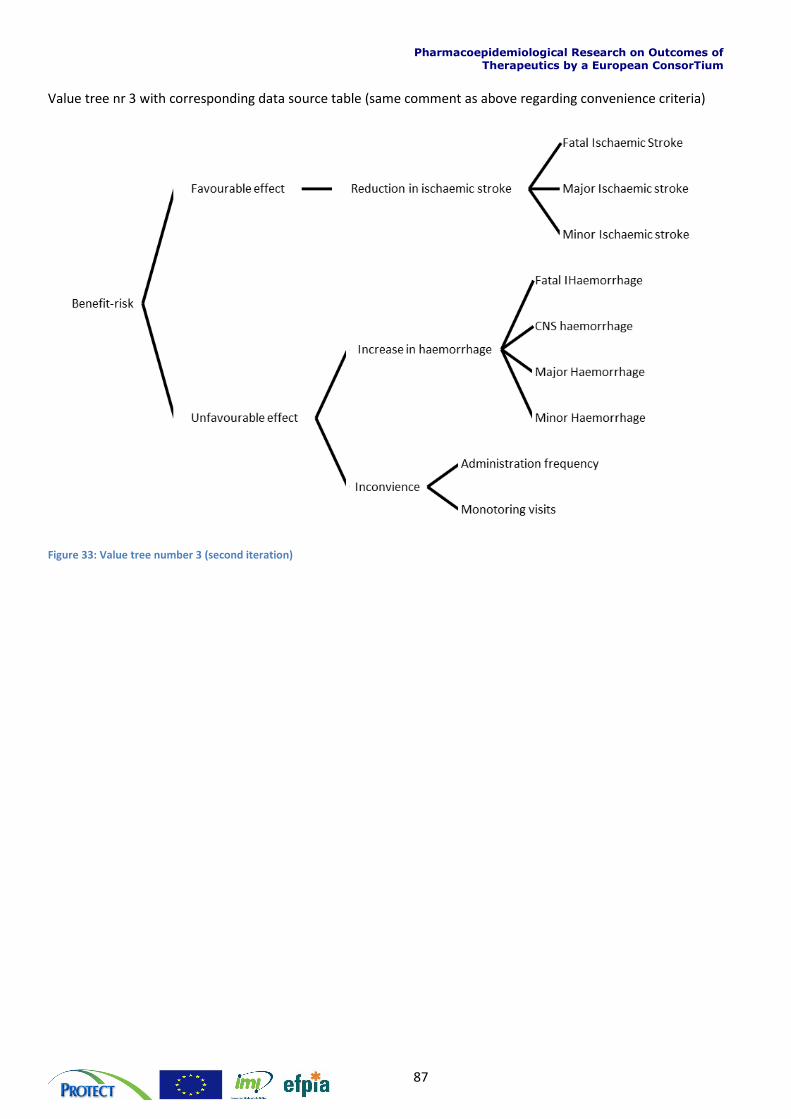
Pharmacoepidemiological Research on Outcomes of Therapeutics by a European ConsorTium
87
Value tree nr 3 with corresponding data source table (same comment as above regarding convenience criteria)
Figure 33: Value tree number 3 (second iteration)
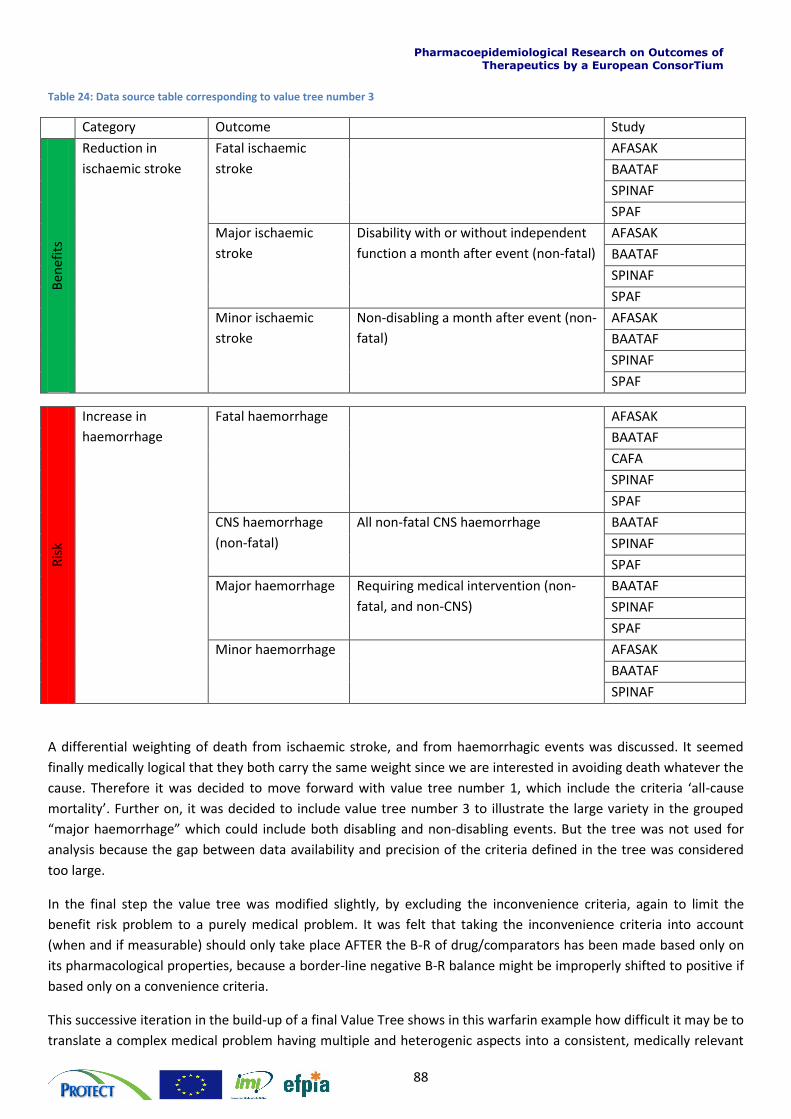
Pharmacoepidemiological Research on Outcomes of Therapeutics by a European ConsorTium
88
Table 24: Data source table corresponding to value tree number 3
Category Outcome Study
Ben
efit
s
Reduction in
ischaemic stroke
Fatal ischaemic
stroke
AFASAK
BAATAF
SPINAF
SPAF
Major ischaemic
stroke
Disability with or without independent
function a month after event (non-fatal)
AFASAK
BAATAF
SPINAF
SPAF
Minor ischaemic
stroke
Non-disabling a month after event (non-
fatal)
AFASAK
BAATAF
SPINAF
SPAF
Ris
k
Increase in
haemorrhage
Fatal haemorrhage AFASAK
BAATAF
CAFA
SPINAF
SPAF
CNS haemorrhage
(non-fatal)
All non-fatal CNS haemorrhage BAATAF
SPINAF
SPAF
Major haemorrhage Requiring medical intervention (non-
fatal, and non-CNS)
BAATAF
SPINAF
SPAF
Minor haemorrhage AFASAK
BAATAF
SPINAF
A differential weighting of death from ischaemic stroke, and from haemorrhagic events was discussed. It seemed
finally medically logical that they both carry the same weight since we are interested in avoiding death whatever the
cause. Therefore it was decided to move forward with value tree number 1, which include the criteria ‘all-cause
mortality’. Further on, it was decided to include value tree number 3 to illustrate the large variety in the grouped
“major haemorrhage” which could include both disabling and non-disabling events. But the tree was not used for
analysis because the gap between data availability and precision of the criteria defined in the tree was considered
too large.
In the final step the value tree was modified slightly, by excluding the inconvenience criteria, again to limit the
benefit risk problem to a purely medical problem. It was felt that taking the inconvenience criteria into account
(when and if measurable) should only take place AFTER the B-R of drug/comparators has been made based only on
its pharmacological properties, because a border-line negative B-R balance might be improperly shifted to positive if
based only on a convenience criteria.
This successive iteration in the build-up of a final Value Tree shows in this warfarin example how difficult it may be to
translate a complex medical problem having multiple and heterogenic aspects into a consistent, medically relevant
Pharmacoepidemiological Research on Outcomes of Therapeutics by a European ConsorTium
89
and statistically performing model. In the example shown above, a multiplicity of issues had to be addressed by the
team in order to come up with a satisfying model: availability of data, reliability and consistency of the same data
across a large data set, medical relevance of chosen criteria even though they might have been clinical endpoints of
Clinical Trials, ability of quantify of some important clinical criteria, duplication of patient counting through
overlapping of criteria, etc.
The build-up of a Value Tree is a critical step in the process of a Benefit-Risk assessment as its final design (i.e. the
model tested) may have a major influence in the final result of a B-R balance assessment.
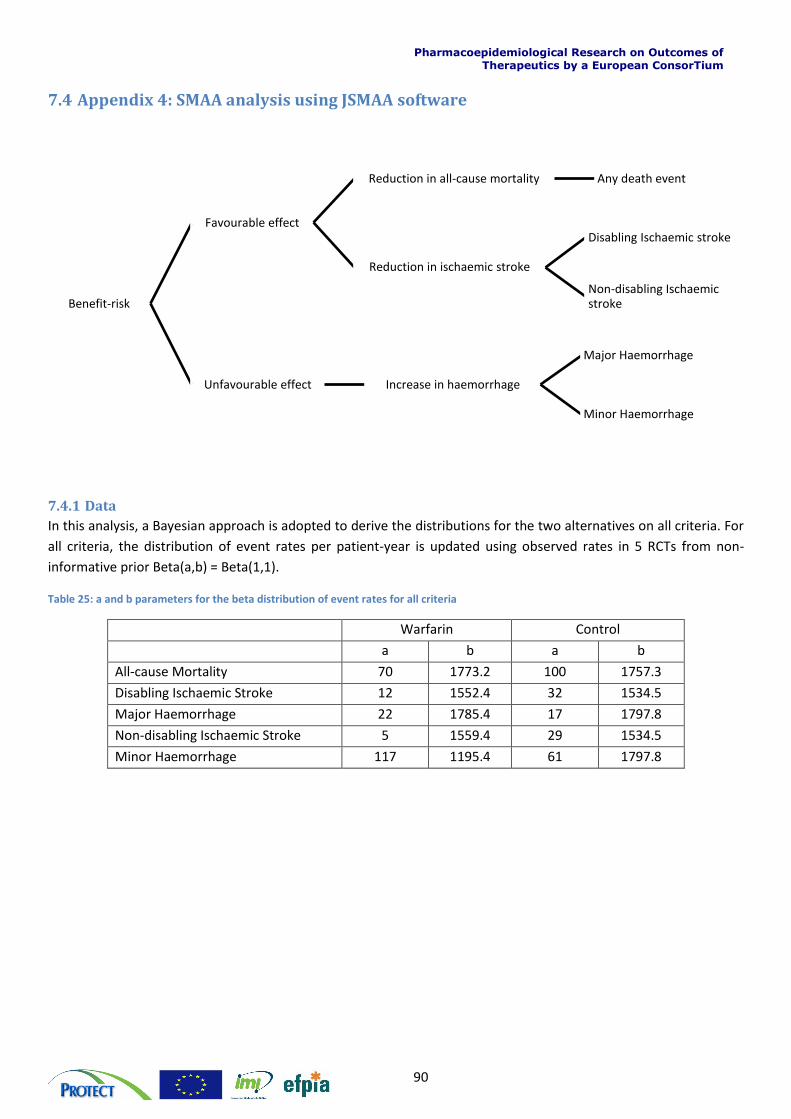
Pharmacoepidemiological Research on Outcomes of Therapeutics by a European ConsorTium
90
7.4 Appendix 4: SMAA analysis using JSMAA software
7.4.1 Data
In this analysis, a Bayesian approach is adopted to derive the distributions for the two alternatives on all criteria. For
all criteria, the distribution of event rates per patient-year is updated using observed rates in 5 RCTs from non-
informative prior Beta(a,b) = Beta(1,1).
Table 25: a and b parameters for the beta distribution of event rates for all criteria
Warfarin Control
a b a b
All-cause Mortality 70 1773.2 100 1757.3
Disabling Ischaemic Stroke 12 1552.4 32 1534.5
Major Haemorrhage 22 1785.4 17 1797.8
Non-disabling Ischaemic Stroke 5 1559.4 29 1534.5
Minor Haemorrhage 117 1195.4 61 1797.8
Benefit-risk
Favourable effect
Reduction in all-cause mortality Any death event
Reduction in ischaemic stroke
Disabling Ischaemic stroke
Non-disabling Ischaemic stroke
Unfavourable effect Increase in haemorrhage
Major Haemorrhage
Minor Haemorrhage
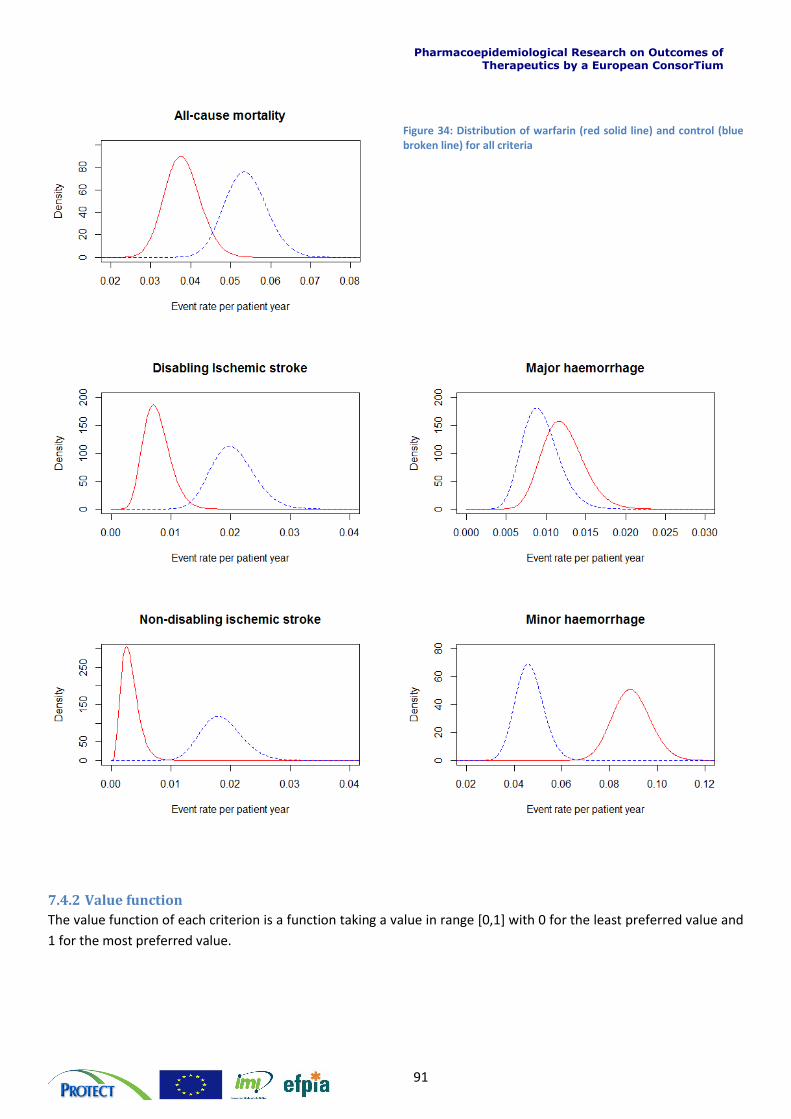
Pharmacoepidemiological Research on Outcomes of Therapeutics by a European ConsorTium
91
Figure 34: Distribution of warfarin (red solid line) and control (blue broken line) for all criteria
7.4.2 Value function
The value function of each criterion is a function taking a value in range [0,1] with 0 for the least preferred value and
1 for the most preferred value.
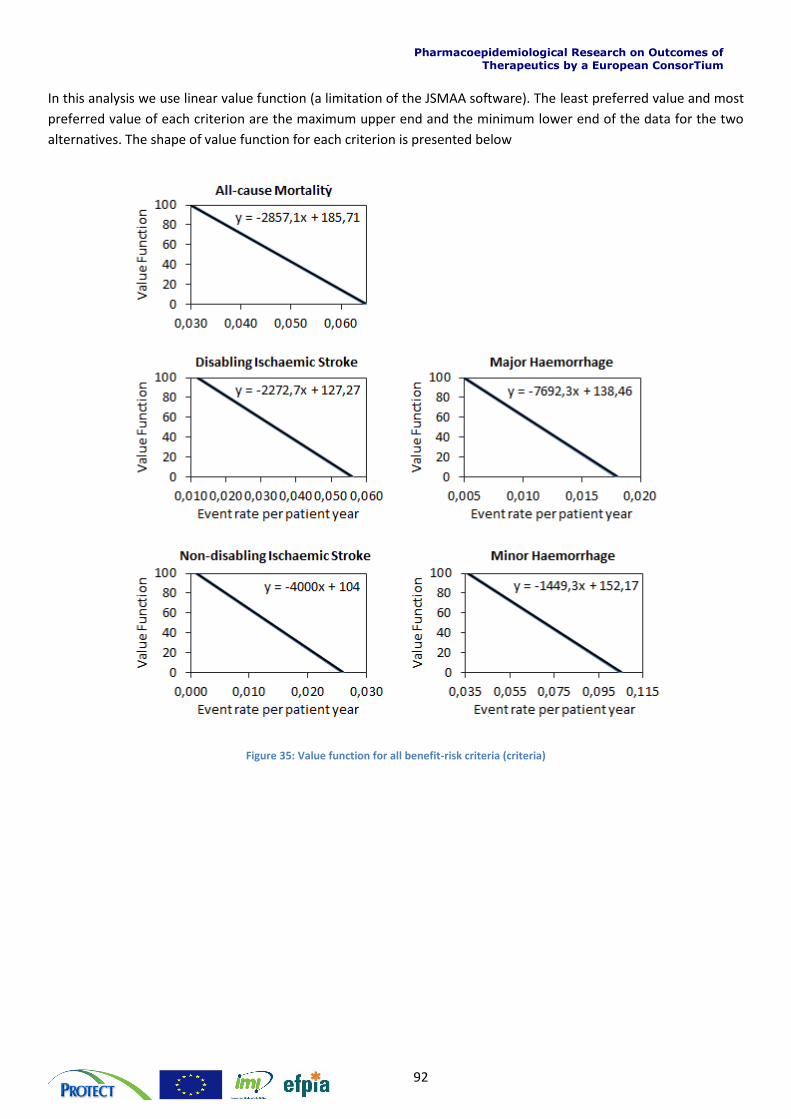
Pharmacoepidemiological Research on Outcomes of Therapeutics by a European ConsorTium
92
In this analysis we use linear value function (a limitation of the JSMAA software). The least preferred value and most
preferred value of each criterion are the maximum upper end and the minimum lower end of the data for the two
alternatives. The shape of value function for each criterion is presented below
Figure 35: Value function for all benefit-risk criteria (criteria)
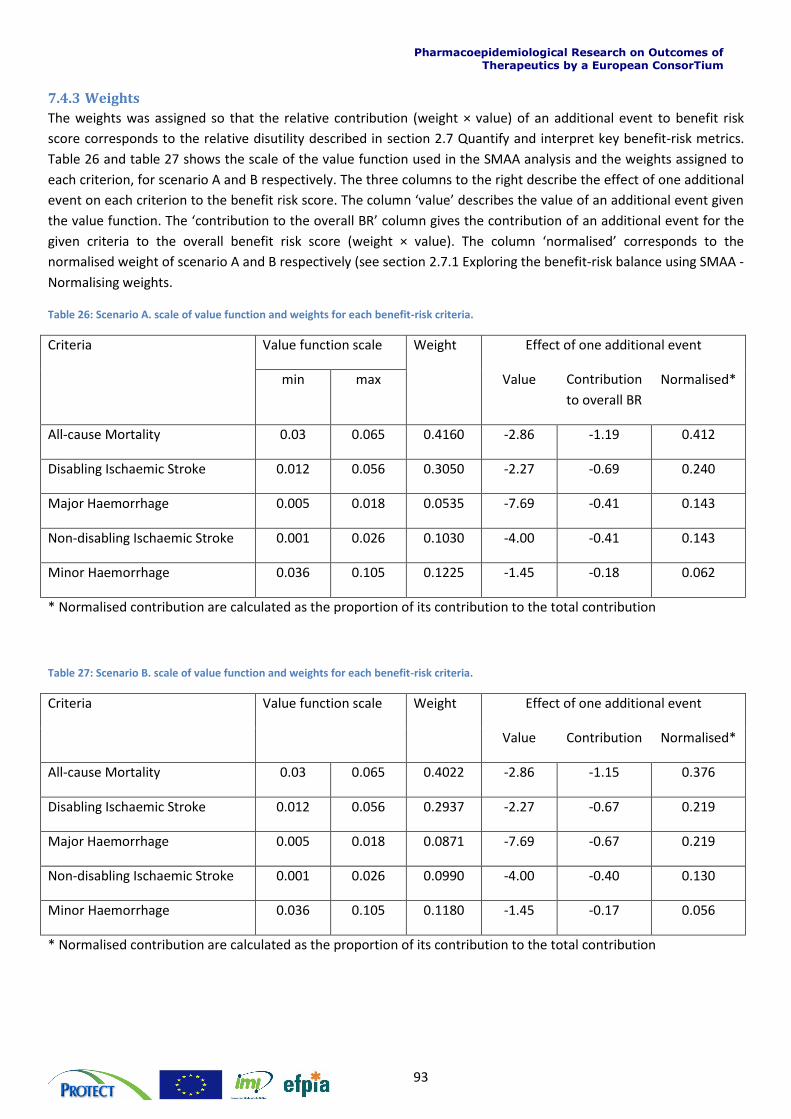
Pharmacoepidemiological Research on Outcomes of Therapeutics by a European ConsorTium
93
7.4.3 Weights
The weights was assigned so that the relative contribution (weight × value) of an additional event to benefit risk
score corresponds to the relative disutility described in section 2.7 Quantify and interpret key benefit-risk metrics.
Table 26 and table 27 shows the scale of the value function used in the SMAA analysis and the weights assigned to
each criterion, for scenario A and B respectively. The three columns to the right describe the effect of one additional
event on each criterion to the benefit risk score. The column ‘value’ describes the value of an additional event given
the value function. The ‘contribution to the overall BR’ column gives the contribution of an additional event for the
given criteria to the overall benefit risk score (weight × value). The column ‘normalised’ corresponds to the
normalised weight of scenario A and B respectively (see section 2.7.1 Exploring the benefit-risk balance using SMAA -
Normalising weights.
Table 26: Scenario A. scale of value function and weights for each benefit-risk criteria.
Criteria Value function scale Weight Effect of one additional event
min max Value Contribution
to overall BR
Normalised*
All-cause Mortality 0.03 0.065 0.4160 -2.86 -1.19 0.412
Disabling Ischaemic Stroke 0.012 0.056 0.3050 -2.27 -0.69 0.240
Major Haemorrhage 0.005 0.018 0.0535 -7.69 -0.41 0.143
Non-disabling Ischaemic Stroke 0.001 0.026 0.1030 -4.00 -0.41 0.143
Minor Haemorrhage 0.036 0.105 0.1225 -1.45 -0.18 0.062
* Normalised contribution are calculated as the proportion of its contribution to the total contribution
Table 27: Scenario B. scale of value function and weights for each benefit-risk criteria.
Criteria Value function scale Weight Effect of one additional event
Value Contribution Normalised*
All-cause Mortality 0.03 0.065 0.4022 -2.86 -1.15 0.376
Disabling Ischaemic Stroke 0.012 0.056 0.2937 -2.27 -0.67 0.219
Major Haemorrhage 0.005 0.018 0.0871 -7.69 -0.67 0.219
Non-disabling Ischaemic Stroke 0.001 0.026 0.0990 -4.00 -0.40 0.130
Minor Haemorrhage 0.036 0.105 0.1180 -1.45 -0.17 0.056
* Normalised contribution are calculated as the proportion of its contribution to the total contribution
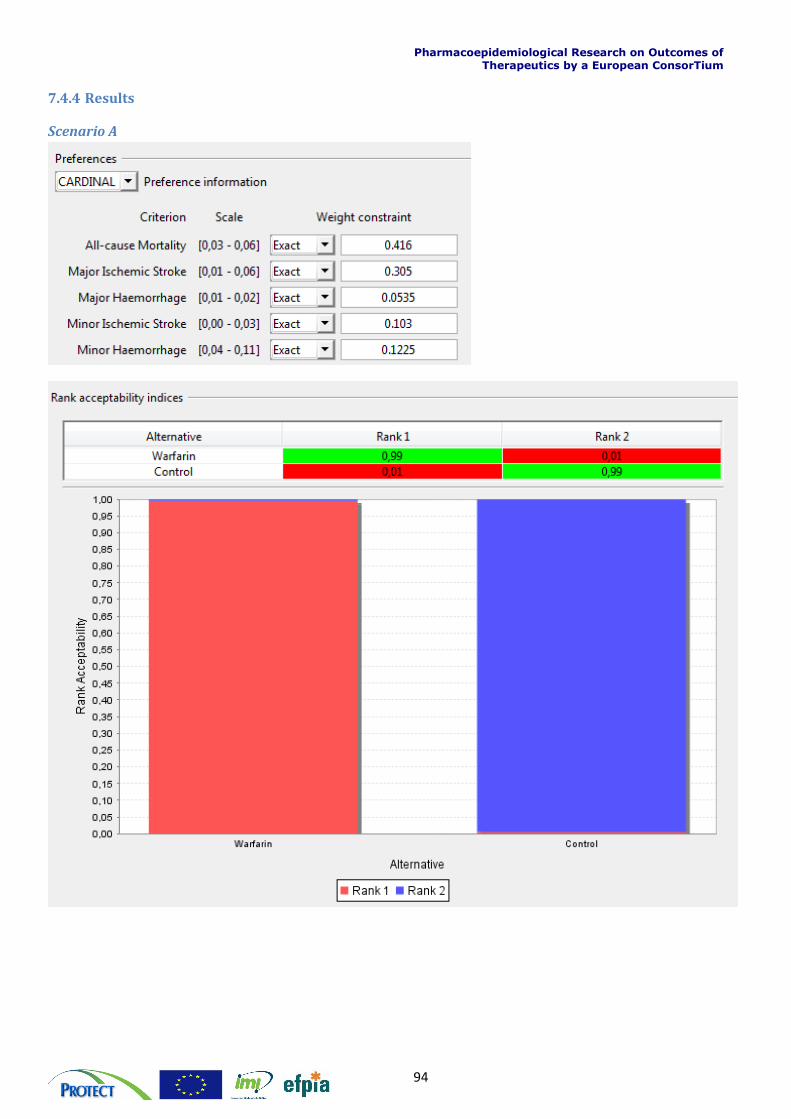
Pharmacoepidemiological Research on Outcomes of Therapeutics by a European ConsorTium
94
7.4.4 Results
Scenario A
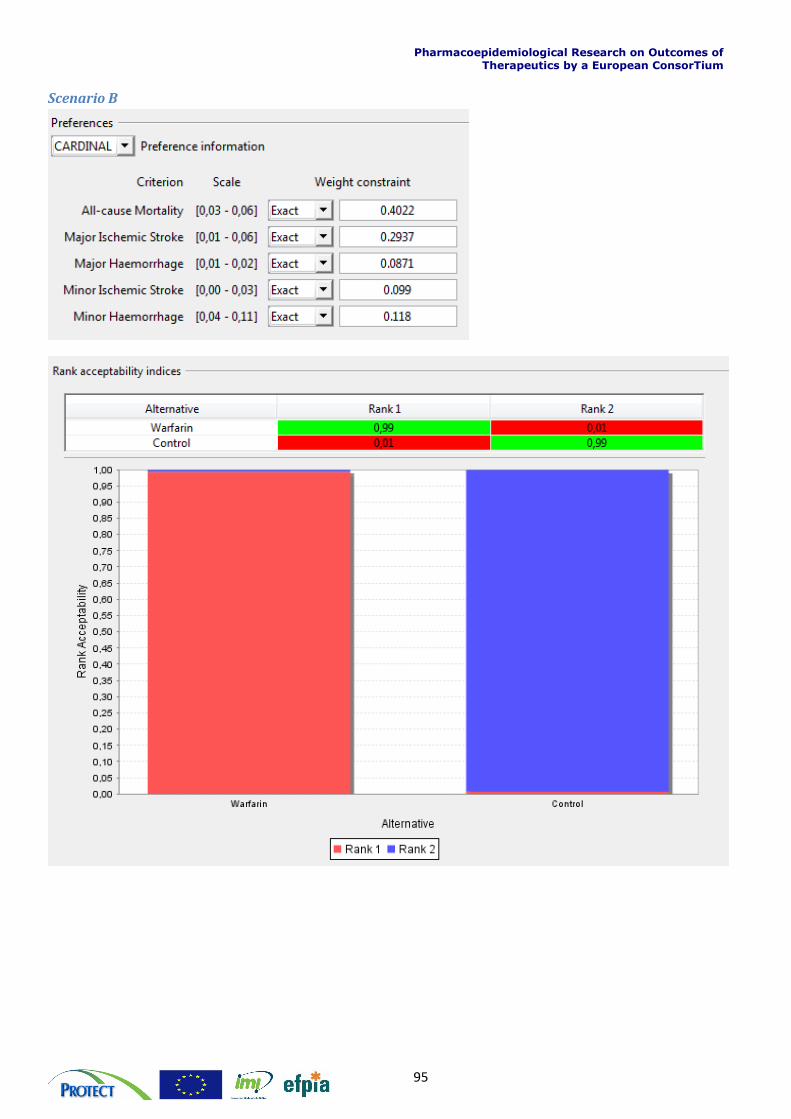
Pharmacoepidemiological Research on Outcomes of Therapeutics by a European ConsorTium
95
Scenario B
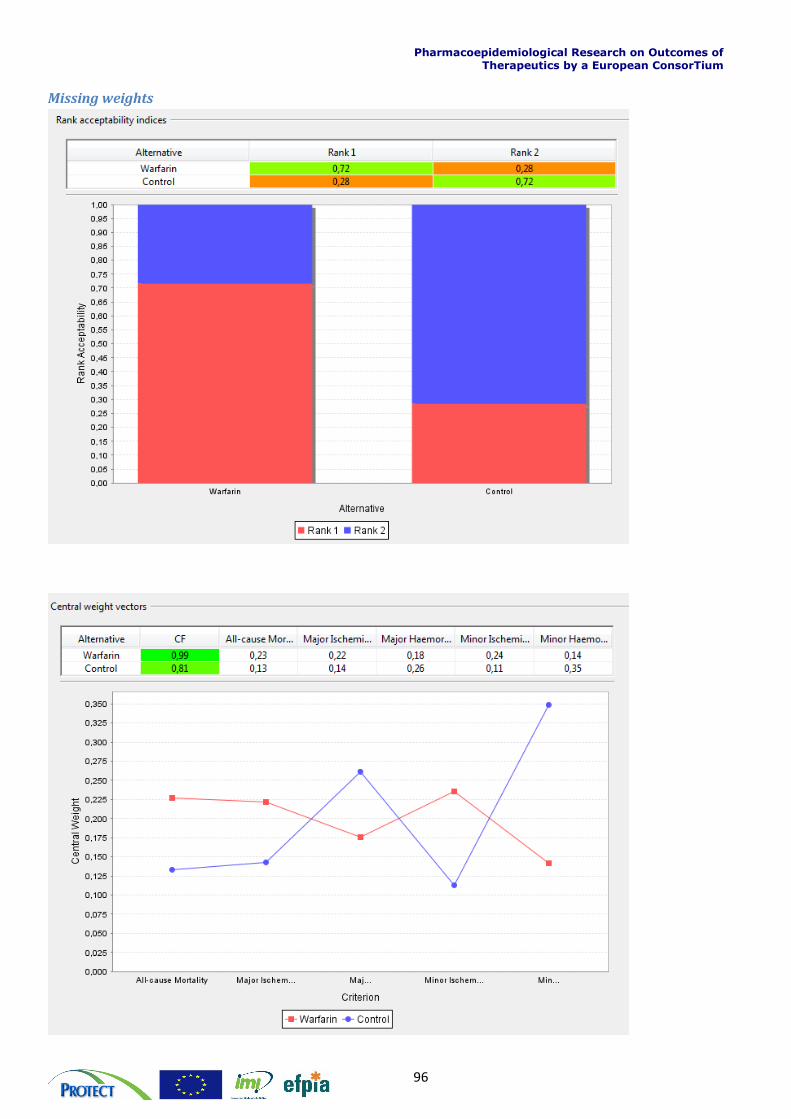
Pharmacoepidemiological Research on Outcomes of Therapeutics by a European ConsorTium
96
Missing weights