IMF - Policy Analysis and Forecasting in the World Economy: A Panel Unobserved Components...
77
7/30/2019 IMF - Policy Analysis and Forecasting in the World Economy: A Panel Unobserved Components Approach http://slidepdf.com/reader/full/imf-policy-analysis-and-forecasting-in-the-world-economy-a-panel-unobserved 1/77 Policy Analysis and Forecasting in the World Economy: A Panel Unobserved Components Approach Francis Vitek WP/12/149
Transcript of IMF - Policy Analysis and Forecasting in the World Economy: A Panel Unobserved Components...

7/30/2019 IMF - Policy Analysis and Forecasting in the World Economy: A Panel Unobserved Components Approach
http://slidepdf.com/reader/full/imf-policy-analysis-and-forecasting-in-the-world-economy-a-panel-unobserved 1/77
Policy Analysis and Forecasting in the
World Economy: A Panel Unobserved
Components Approach
Francis Vitek
WP/12/149
7/30/2019 IMF - Policy Analysis and Forecasting in the World Economy: A Panel Unobserved Components Approach
http://slidepdf.com/reader/full/imf-policy-analysis-and-forecasting-in-the-world-economy-a-panel-unobserved 2/77
© 2012 International Monetary Fund WP/
IMF Working Paper
Strategy, Policy, and Review Department
Policy Analysis and Forecasting in the World Economy:
A Panel Unobserved Components Approach
Prepared by Francis Vitek1
Authorized for distribution by Martin Mühleisen
June 2012
Abstract
This paper develops a structural macroeconometric model of the world economy,isaggregated into thirty five national economies. This panel unobserved components model
eatures a monetary transmission mechanism, a fiscal transmission mechanism, and extensive
macrofinancial linkages, both within and across economies. A variety of monetary policy
analysis, fiscal policy analysis, spillover analysis, and forecasting applications of the estimated
model are demonstrated, based on a Bayesian framework for conditioning on judgment.
JEL Classification Numbers: C11; C33; C51; C53; E31; E32; E44; E52; E62; F41
Keywords: Monetary policy analysis; Fiscal policy analysis; Spillover analysis; Forecasting;
World economy; Panel unobserved components model; Bayesian econometrics
Author’s E-Mail Address: [email protected]
1The author gratefully acknowledges advice provided by Tamim Bayoumi, in addition to comments and
suggestions received from seminar participants at the European Central Bank and the International Monetary Fund.
This Working Paper should not be reported as representing the views of the IMF.The views expressed in this Working Paper are those of the author(s) and do not necessarily
represent those of the IMF or IMF policy. Working Papers describe research in progress by theauthor(s) and are published to elicit comments and to further debate.

7/30/2019 IMF - Policy Analysis and Forecasting in the World Economy: A Panel Unobserved Components Approach
http://slidepdf.com/reader/full/imf-policy-analysis-and-forecasting-in-the-world-economy-a-panel-unobserved 3/77
7/30/2019 IMF - Policy Analysis and Forecasting in the World Economy: A Panel Unobserved Components Approach
http://slidepdf.com/reader/full/imf-policy-analysis-and-forecasting-in-the-world-economy-a-panel-unobserved 4/77
3
11. Impulse Responses to a Domestic Fiscal Revenue Shock .................................................46 12. Impulse Responses to a World Energy Commodity Price Shock ......................................47 13. Impulse Responses to a World Nonenergy Commodity Price Shock................................48 14. Forecast Error Variance Decompositions of Consumption Price Inflation .......................49 15. Forecast Error Variance Decompositions of Output ..........................................................50 16. Forecast Error Variance Decompositions of Domestic Demand .......................................51
17. Forecast Error Variance Decompositions of the Nominal Policy Interest Rate ................52 18. Forecast Error Variance Decompositions of the Real Effective Exchange Rate ...............53 19. Forecast Error Variance Decompositions of the Fiscal Balance .......................................54 20. Forecast Error Variance Decompositions of the Current Account Balance ......................55 21. Historical Decompositions of Consumption Price Inflation ..............................................56 22. Historical Decompositions of Output Growth ...................................................................57 23. Historical Decompositions of the Fiscal Balance ..............................................................58 24. Historical Decompositions of the Current Account Balance .............................................59 25. Simulated Conditional Betas of the Output Gap................................................................60 26. Peak Impulse Responses to Foreign Supply Shocks..........................................................61 27. Peak Impulse Responses to Foreign Private Demand Shocks ...........................................62
28. Peak Impulse Responses to Foreign Monetary Policy Shocks ..........................................63 29. Peak Impulse Responses to Foreign Credit Risk Premium Shocks ...................................64 30. Peak Impulse Responses to Foreign Duration Risk Premium Shocks ...............................65 31. Peak Impulse Responses to Foreign Equity Risk Premium Shocks ..................................66 32. Peak Impulse Responses to Foreign Fiscal Expenditure Shocks .......................................67 33. Peak Impulse Responses to Foreign Fiscal Revenue Shocks ............................................68 34. Sequential Unconditional Forecasts of Consumption Price Inflation ................................69 35. Sequential Unconditional Forecasts of Output Growth .....................................................70 36. Conditional Forecasts of Consumption Price Inflation ......................................................71 37. Conditional Forecasts of Output Growth ...........................................................................72 38. Conditional Forecast Decompositions for Consumption Price Inflation ...........................73 39. Conditional Forecast Decompositions for Output Growth ................................................74 References ................................................................................................................................75
7/30/2019 IMF - Policy Analysis and Forecasting in the World Economy: A Panel Unobserved Components Approach
http://slidepdf.com/reader/full/imf-policy-analysis-and-forecasting-in-the-world-economy-a-panel-unobserved 5/77
4
I. INTRODUCTION
The global financial crisis highlighted the potency of macrofinancial linkages, both within
and across economies. As discussed in a recent survey paper on structural macroeconometric
models used for policy analysis and forecasting by Roger and Vlcek (2012), much progress
has since been made on incorporating macrofinancial linkages within economies, but littlehas been made across economies. The development of highly disaggregated structural
macroeconometric models of the world economy featuring a monetary transmission
mechanism, a fiscal transmission mechanism, and macrofinancial linkages along both
dimensions is prerequisite to the effective integration of bilateral and multilateral
surveillance at the International Monetary Fund.
The development of highly disaggregated structural macroeconometric models of the world
economy is not without precedent. In a recent contribution, Dées, Pesaran, Smith and
Smith (2010) develop a structural macroeconometric model of the world economy, consisting
of a large number of interconnected multivariate linear rational expectations models of themonetary transmission mechanism in a large open economy. While these multivariate linear
rational expectations models are driven by orthogonal shocks having structural
interpretations, they feature neither a fiscal transmission mechanism nor macrofinancial
linkages, and are estimated individually conditional on preliminary trend component
estimates subject to small open economy restrictions, precluding the imposition of cross-
economy equality restrictions on structural parameters. A related contribution is the global
vector autoregressive model introduced by Pesaran, Schuermann and Weiner (2004), which
consists of a large number of interconnected reduced form vector autoregressive models of
the monetary transmission mechanism in a large open economy estimated individually
subject to small open economy restrictions. While these vector autoregressive models
generally do account for macrofinancial linkages, they are not driven by orthogonal shocks
having structural interpretations, and tend not to incorporate a fiscal transmission
mechanism.
This paper develops a structural macroeconometric model of the world economy,
disaggregated into thirty five national economies. This panel unobserved components model
features a monetary transmission mechanism, a fiscal transmission mechanism, and extensive
macrofinancial linkages, both within and across economies. The advanced and emerging
economies under consideration are Argentina, Australia, Austria, Belgium, Brazil, Canada,
China, the Czech Republic, Denmark, Finland, France, Germany, Greece, India, Indonesia,
Ireland, Italy, Japan, Korea, Mexico, the Netherlands, New Zealand, Norway, Poland,
Portugal, Russia, Saudi Arabia, South Africa, Spain, Sweden, Switzerland, Thailand, Turkey,
the United Kingdom, and the United States. A variety of monetary policy analysis, fiscal
policy analysis, spillover analysis, and forecasting applications of the estimated model are
demonstrated. These include accounting for business cycle fluctuations, quantifying the
monetary and fiscal transmission mechanisms, and generating conditional forecasts of
7/30/2019 IMF - Policy Analysis and Forecasting in the World Economy: A Panel Unobserved Components Approach
http://slidepdf.com/reader/full/imf-policy-analysis-and-forecasting-in-the-world-economy-a-panel-unobserved 6/77
5
inflation and output growth. They are based on a Bayesian framework for conditioning on
judgment in estimation and forecasting.
The structural macroeconometric model of the world economy documented in this paper is
the third in a series developed to facilitate multilaterally consistent policy analysis, spillover
analysis, and forecasting. The panel unobserved components model of the monetarytransmission mechanism documented in Vitek (2009) covers fifteen major advanced and
emerging economies, while that documented in Vitek (2010) covers twenty. In an extension
and refinement of this empirical framework, the panel unobserved components model
documented in this paper also features a fiscal transmission mechanism. The design of this
empirical framework is intended to strike a balance between theoretical coherence and
empirical adequacy, given the large number of structurally diverse economies under
consideration.
The organization of this paper is as follows. The next section describes a panel unobserved
components model of the world economy. Estimation of this model is the subject of sectionthree. Monetary and fiscal policy analysis within the framework of the estimated model is
conducted in section four, while spillover analysis is undertaken in section five, and
forecasting in section six. Finally, section seven offers conclusions and recommendations for
further research.
II. THE PANEL UNOBSERVED COMPONENTS MODEL
Our panel unobserved components model of the world economy consists of multiple large
open economies connected by trade, financial, and commodity price linkages. Within each
economy, cyclical components are modeled as a multivariate linear rational expectations
model of interconnected real, external, monetary, fiscal, and financial sectors derived from
postulated behavioral relationships and standard accounting identities. These behavioral
relationships approximately nest those associated with a variety of alternative structural
macroeconomic models derived from microeconomic foundations, conferring robustness to
model misspecification. In the interest of parsimony, cross-economy equality restrictions are
imposed on the structural parameters of these behavioral relationships, the response
coefficients of which vary across economies with their structural characteristics. Trend
components are modeled as independent random walks, conferring robustness to intermittent
structural breaks.
In what follows, ,ˆi t x denotes the cyclical component of variable ,i t x , while ,i t x denotes the
trend component of variable ,i t x . Cyclical and trend components are additively separable,
that is , , ,ˆ
i t i t i t x x x . Furthermore, ,Et i t s x denotes the rational expectation of variable ,i t s x
associated with economy i , conditional on information available at time t . In addition,,
Z
i t x
denotes the trade weighted average of variable ,i t x across the trading partners of economy i ,
given bilateral weights,
Z
i jw based on exports for Z X , imports for Z M , and their
average for Z T . Similarly,,
Z
i t x denotes the portfolio weighted average of domestic
7/30/2019 IMF - Policy Analysis and Forecasting in the World Economy: A Panel Unobserved Components Approach
http://slidepdf.com/reader/full/imf-policy-analysis-and-forecasting-in-the-world-economy-a-panel-unobserved 7/77
6
currency denominated variable ,i t x across the investment destinations of economy i , given
bilateral weights,
Z
i jw based on debt for Z B and equity for Z S . Moreover, Z
t x denotes
the weighted average of variable ,i t x across all economies, given world weights Z
iw based on
money market capitalization for Z M , bond market capitalization for Z B , stock market
capitalization for Z S , and output for Z Y . Finally, economy *i issues the quotation
currency for transactions in the foreign exchange market.
A. Cyclical Components
The cyclical component of output price inflation,ˆ
Y
i t depends on a linear combination of its
past and expected future cyclical components driven by the contemporaneous cyclical
component of output according to domestic supply relationship,
ˆ, *,
, 1,1 , 1 1,2 , 1 1,1 , 1,2 1 ,
,
ˆ ˆ
ˆˆ ˆ ˆE ln ( ) ln ,
ˆ
z z
Y
COM COM i i t t Y Y Y Pi i
i t i t t i t i t i t Y zi i i t
P X X Y L
Y X P (1)
where domestic supply shock ˆ ˆ ˆ
ˆ, , 1 ,
Y Y Y
Y P P P
i t i t i t P withˆ
2ˆ, ,~ iid (0, )
Y
Y Pi t P i . The cyclical
component of output price inflation also depends on contemporaneous, past, and expected
future changes in the cyclical components of the relative domestic currency denominated
prices of energy and nonenergy commodity exports, where polynomial in the lag operator1
1 1,1 1,2( ) 1 Et L L L . The response coefficients of this relationship vary across
economies with their export openness, measured by the ratio of exports to output i
i
X
Y , as well
as their commodity export intensities, measured by the ratios of commodity exports to
exports zCOM
i
i
X
X .
The cyclical component of consumption price inflation,
ˆC
i t depends on a linear combination
of its past and expected future cyclical components driven by the contemporaneous cyclicalcomponent of output according to supply relationship,
, 1,1 , 1 1,2 , 1 1,1 ,
ˆ ˆ, *,
2,1 1 , 2,2 , ,
,
ˆˆ ˆ ˆE ln
ˆ ˆ
ˆ( ) 1 ln ln ,ˆ
z z
M Y
C C C
i t i t t i t i t
COM COM COM i i t t P Pi i i
i t i t i t Y zi i i i t
Y
P M M M L
D M M P
(2)
where import supply shock ˆ ˆ ˆ
ˆ, , 1 ,
M M M
M
P P P
i t i t i t P with
ˆ 2
ˆ, ,~ iid (0, )
M
M
P
i t P i . The cyclical
component of consumption price inflation also depends on contemporaneous, past, and
expected future changes in the cyclical component of the terms of trade and the relative
domestic currency denominated prices of energy and nonenergy commodity imports. The
response coefficients of this relationship vary across economies with their import openness,
measured by the ratio of imports to domestic demand i
i
M
D, as well as their commodity import
intensities, measured by the ratios of commodity imports to imports zCOM
i
i
M
M .
The cyclical component of output ,ˆlni t
Y follows a stationary first order autoregressive
process driven by a monetary conditions index according to demand relationship,

7/30/2019 IMF - Policy Analysis and Forecasting in the World Economy: A Panel Unobserved Components Approach
http://slidepdf.com/reader/full/imf-policy-analysis-and-forecasting-in-the-world-economy-a-panel-unobserved 8/77
7
,
,,
, 3,1 , 1 4,1 3,1 , 3,2
,
1
ˆ,
3,3 3 , 3,4 , 3,5 , 3 ,
, ,
ˆ
ˆ ˆln ln 1 lnˆ
ˆ
ˆ ˆˆ( ) ln ln 1 ( ) ln
STK S
i t L C i ii t i t i t C
i i i t
i t C i i ii t i t i t iY Y
i i i i t i t i
P M C Y Y r
D Y P
T M T G L Y L G
D P Y P Y Y
ˆ
3 4,1 , , 4,2 , , ˆˆ( ) (ln ) 1 ln 1 ln ,
t
X
X X i i i i ii t i t i t i t
i i i i i
X X M M M L D
Y Y D Y D
(3)
where export demand shock ˆ ˆ ˆ
ˆ, , 1 ,
X X X
i t i t i t X with
ˆ 2
ˆ, ,~ iid (0, ) X
i t X i . Reflecting the
existence of international trade and financial linkages, this monetary conditions index is
defined as a linear combination of a financial conditions index and the contemporaneous and
past cyclical components of the terms of trade.2
Reflecting the existence of credit constraints,
the cyclical component of output also depends on the contemporaneous and past cyclical
components of output, the terms of trade, and the ratio of tax revenues to nominal output. In
addition, the cyclical component of output depends on the contemporaneous and past cyclicalcomponents of public domestic demand. Finally, the cyclical component of output depends
on the contemporaneous and past cyclical components of export weighted foreign demand,
where polynomial in the lag operator 3 3,1( ) 1 L L . The response coefficients of this
relationship vary across economies with their trade openness, measured by the ratio of
exports to output i
i
X
Y or imports to output i
i
M
Y .
The cyclical component of domestic demand ,ˆln
i t D follows a stationary first order
autoregressive process driven by a financial conditions index according to domestic demand
relationship,
1
,,,
, 3,1 , 1 3,1 , 3,2
,
1
ˆ,
3,3 3 , 3,4 , 3,5 , 3 ,
, ,
ˆ
ˆ ˆ ˆln ln lnˆ
ˆ
ˆ ˆˆ( ) ln ln 1 ( ) ln
STK S i t L C i ii t i t i t C
i i i t
i t C i i ii t i t i t i t Y Y
i i i i t i t i
P D C D D r Y Y P
T M T G L Y L G
D P Y P Y Y
,
(4)
where private domestic demand shock ˆ ˆ ˆ
ˆ, , 1 ,
C C C
i t i t i t C with
ˆ 2
ˆ, ,~ iid (0, )
C
i t C i . This
financial conditions index is defined as a linear combination of the contemporaneous and
past cyclical components of the long term consumption based real market interest rate and
the real value of an internationally diversified equity portfolio. Reflecting the existence of
2This monetary conditions index ,
MCI
i t is defined as that subcomponent of the cyclical component of output
driven by contemporaneous and past monetary and financial variables. It is generated recursively as
1
, 3,1 , 1 3,3 4,1 , ˆ ˆ1 1i i
i i
MCI MCI MCI
i t i t i t
C M
Y D I
, where , , 3,3 3,4 4,1 3 ,ˆˆ ˆ 1 ( ) lni i i
i i i
MCI FCI
i t i t i t
C M M
Y D D I I L
4,2 3 , ,ˆ ˆ( ) 1 ln 1 lni i i i
i i i i
X
i t i t
X M M M
Y D Y D L
. The corresponding financial conditions index ,
ˆ FCI
i t is
defined as that subcomponent of the cyclical component of output driven by contemporaneous and past
financial variables. It is also generated recursively as 1
, 3,1 , 1 3,3 4,1 , ˆ ˆ1 1i i
i i
FCI FCI FCI
i t i t i t
C M
Y D I
, where
,
,
,
,
, 3,1 4,1 , 3,2
ˆ
ˆ
ˆ ˆ1 lnSTK S
i t i i
C i i i t
FCI L C
i t i t
PC M
Y D P I r
.
7/30/2019 IMF - Policy Analysis and Forecasting in the World Economy: A Panel Unobserved Components Approach
http://slidepdf.com/reader/full/imf-policy-analysis-and-forecasting-in-the-world-economy-a-panel-unobserved 9/77
8
credit constraints, the cyclical component of domestic demand also depends on the
contemporaneous and past cyclical components of output, the terms of trade, and the ratio of
tax revenues to nominal output. In addition, the cyclical component of domestic demand
depends on the contemporaneous and past cyclical components of public domestic demand.
The response coefficients of this relationship vary across economies with the size of their
government, measured by the ratio of public domestic demand to output i
i
GY
or tax revenuesto nominal output
i
Y
i i
T
P Y .
The cyclical component of the nominal policy interest rate ,ˆ
P
i t i depends on a weighted average
of its past and desired cyclical components according to monetary policy rule,
ˆ
, 5,1 , 1 5,1 5,1, , 5,2, , 5,3, , ,ˆˆˆ ˆ ˆ(1 )( ln ln ) ,
PP P C T i
i t i t j i t j i t j i t i t i i Y (5)
where monetary policy shock ˆ 2
, ˆ ,~ iid (0, )
P
P
i
i t i i . Under a flexible inflation targeting
regime 1 j and the desired cyclical component of the nominal policy interest rate responds
to the contemporaneous cyclical components of consumption price inflation and output,
while under a managed exchange rate regime 0 j and it also responds to thecontemporaneous cyclical component of the trade weighted real effective exchange rate. For
economies belonging to a currency union, the target variables entering into their common
monetary policy rule are expressed as output weighted averages across union members. The
cyclical component of the real policy interest rate ,
,ˆP Z
i t r satisfies,
, , , 1ˆˆ ˆE
P Z P Z
i t i t t i t r i , where
{ , } Z C Y .
The cyclical component of the spread between the short term nominal market interest rate ,ˆ
S
i t i
and the nominal policy interest rate follows a stationary first order autoregressive process
driven by the contemporaneous cyclical component of the ratio of net foreign assets to
nominal output according to money market relationship,
ˆ ˆ, 1 ,
, , 6 ,1 , 1 , 1 6,1 6,1 6, 6, ,
, ,
ˆ
ˆ ˆ ˆ ˆ( ) (1 ) (1 ) ,S S i t S P S P i M M i
i t i t i t i t j t j i i t Y
i t i t
Bi i i i w
P Y
(6)
where credit risk premium shock ˆ ˆ ˆ
, , 1 ,ˆ
S S S
S
i i i
i t i t i t i with
ˆ 2
, ˆ ,~ iid (0, )
S
S
i
i t i i . The intensity
of international money market contagion varies across economies, with 0 j for advanced
economies, 1 j for emerging economies with capital controls, and 2 j for emerging
economies without capital controls. For economies belonging to a currency union, the ratio
of net foreign assets to nominal output is expressed as an output weighted average across
union members, scaled by the number of union members. The cyclical component of the
short term real market interest rate,
,ˆ
S Z
i t r satisfies,
, , , 1ˆ
ˆ ˆES Z S Z
i t i t t i t r i .
The cyclical component of the long term nominal market interest rate ,
L
i t i depends on a linear
combination of its past and expected future cyclical components driven by the
contemporaneous cyclical component of the short term nominal market interest rate
according to bond market relationship,
ˆ ˆ,
, 7,1 , 1 7,2 , 1 7,1 , 7, 7, ,ˆ ˆ ˆ ˆE (1 ) ,
L L L L L S i B B i
i t i t t i t i t j t j i i t i i i i w (7)
7/30/2019 IMF - Policy Analysis and Forecasting in the World Economy: A Panel Unobserved Components Approach
http://slidepdf.com/reader/full/imf-policy-analysis-and-forecasting-in-the-world-economy-a-panel-unobserved 10/77
9
where duration risk premium shock ˆ ˆ ˆ
, , 1 ,ˆ
L L L
L
i i i
i t i t i t i with
ˆ 2
, ˆ ,~ iid (0, )
L
L
i
i t i i . The
intensity of international bond market contagion varies across economies, with 0 j for
advanced economies, 1 j for emerging economies with capital controls, and 2 j for
emerging economies without capital controls. The cyclical component of the long term real
market interest rate ,
,
ˆ L Z
i t
r satisfies the same bond market relationship, driven by the
contemporaneous cyclical component of the corresponding short term real market interest
rate.
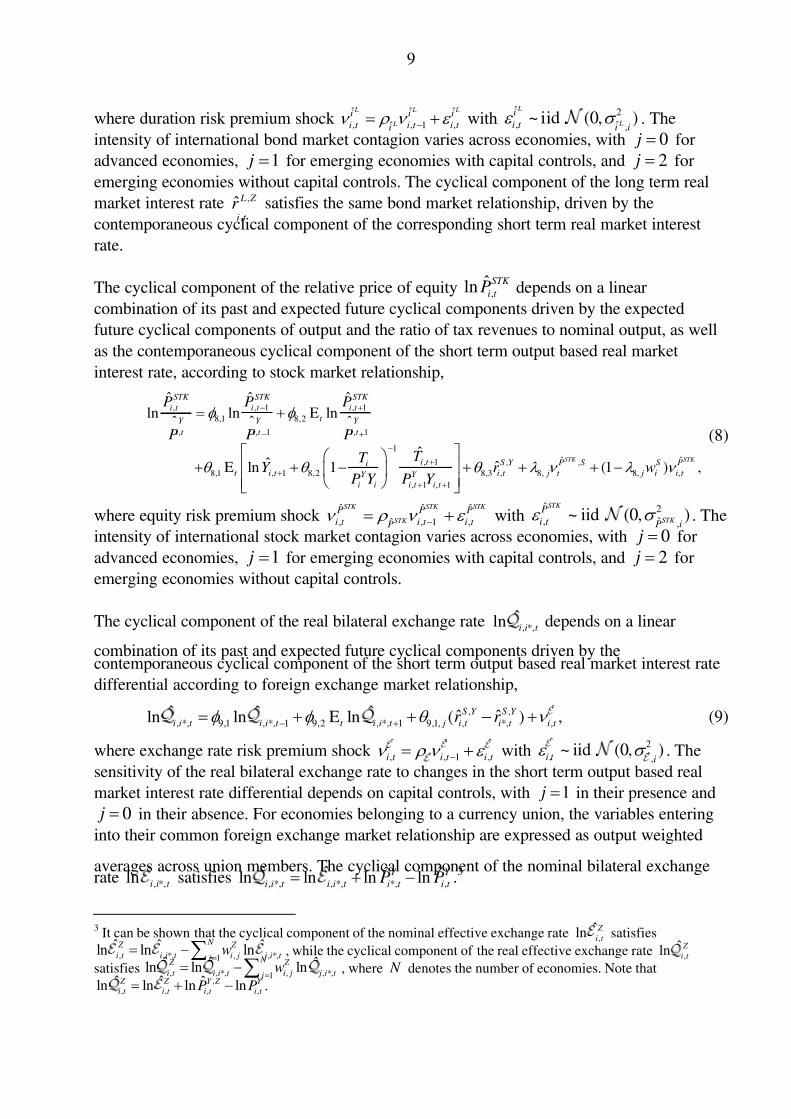
The cyclical component of the relative price of equity ,ˆln
STK
i t P depends on a linear
combination of its past and expected future cyclical components driven by the expected
future cyclical components of output and the ratio of tax revenues to nominal output, as well
as the contemporaneous cyclical component of the short term output based real market
interest rate, according to stock market relationship,
, , 1 , 1
8,1 8,2
, , 1 , 1
1
ˆ ˆ, 1 , ,
8,1 , 1 8,2 8,3 , 8, 8, ,
, 1 , 1
ˆ ˆ ˆ
ln ln E lnˆ ˆ ˆ
ˆ
ˆˆE ln 1 (1 ) ,
STK STK
STK STK STK
i t i t i t
t Y Y Y
i t i t i t
i t S Y P S S Pit i t i t j t j i i t Y Y
i i i t i t
P P P
P P P
T T Y r w
P Y P Y
(8)
where equity risk premium shock ˆ ˆ ˆ
ˆ, , 1 ,
STK STK STK
STK
P P P
i t i t i t P with
ˆ 2
ˆ, ,~ iid (0, )
STK
STK
P
i t P i . The
intensity of international stock market contagion varies across economies, with 0 j for
advanced economies, 1 j for emerging economies with capital controls, and 2 j for
emerging economies without capital controls.
The cyclical component of the real bilateral exchange rate , *,ˆln i i t depends on a linear
combination of its past and expected future cyclical components driven by thecontemporaneous cyclical component of the short term output based real market interest rate
differential according to foreign exchange market relationship,
ˆ, ,
, *, 9,1 , *, 1 9,2 , *, 1 9,1, , *, ,ˆ ˆ ˆ
ˆ ˆln ln E ln ( ) ,S Y S Y
i i t i i t t i i t j i t i t i t r r (9)
where exchange rate risk premium shock ˆ ˆ ˆ
ˆ, , 1 ,i t i t i t withˆ 2
ˆ, ,~ iid (0, )
i t i . The
sensitivity of the real bilateral exchange rate to changes in the short term output based real
market interest rate differential depends on capital controls, with 1 j in their presence and
0 j in their absence. For economies belonging to a currency union, the variables entering
into their common foreign exchange market relationship are expressed as output weighted
averages across union members. The cyclical component of the nominal bilateral exchangerate , *,
ˆln i i t satisfies , *, , *, *, ,ˆ ˆ ˆ ˆln ln ln lnY Y
i i t i i t i t i t P P .3
3It can be shown that the cyclical component of the nominal effective exchange rate ,
ˆlnZ
i t satisfies
, , *, , , *,1
ˆln ln ln N Z Z
i t i i t i j j i t jw
, while the cyclical component of the real effective exchange rate ,
ˆlnZ
i t
satisfies , , *, , , *,1
ˆln ln ln N Z Z
i t i i t i j j i t jw
, where N denotes the number of economies. Note that
,
, , , ,ˆ ˆ ˆ ˆln ln ln ln Z Z Y Z Y
i t i t i t i t P P .
7/30/2019 IMF - Policy Analysis and Forecasting in the World Economy: A Panel Unobserved Components Approach
http://slidepdf.com/reader/full/imf-policy-analysis-and-forecasting-in-the-world-economy-a-panel-unobserved 11/77
10
The change in the cyclical component of the terms of trade,
ˆln i t depends on a linear
combination of its past and expected future cyclical components driven by the
contemporaneous cyclical component of the deviation of the import weighted real effective
exchange rate from the terms of trade according to terms of trade relationship,
ˆ,
, 10,1 , 1 10,2 , 1 10,1 10,2 10 , ,
,
ˆ
ˆ ˆ ˆˆln ln E ln ln ( ) ,
ˆ
M
i t Y
i t i t t i t i t i t
i t
L (10)
where terms of trade shock ˆ ˆ ˆ
ˆ, , 1 ,i t i t i t withˆ 2
ˆ, ,~ iid (0, )i t i
. The change in the
cyclical component of the terms of trade also depends on the contemporaneous, past, and
expected future cyclical components of output price inflation, where polynomial in the lag
operator 1
10 10,1 10,2( ) 1 Et L L L .
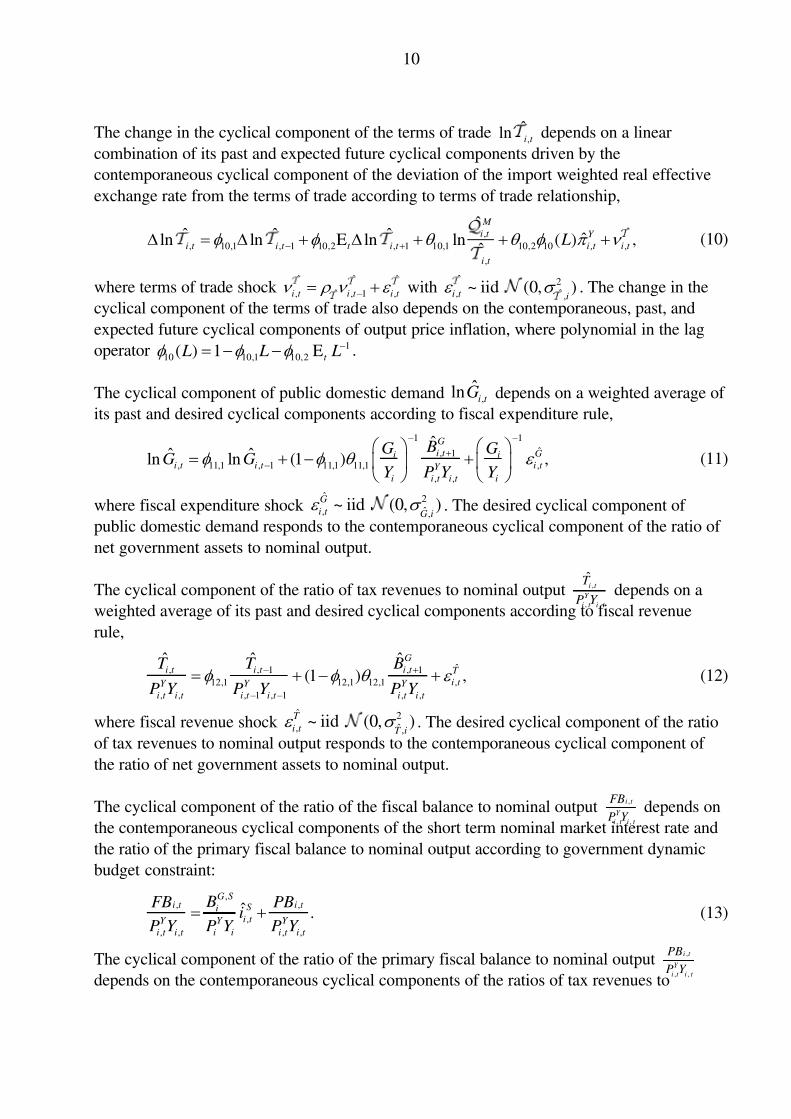
The cyclical component of public domestic demand ,ˆln
i t G depends on a weighted average of
its past and desired cyclical components according to fiscal expenditure rule,
1 1
ˆ, 1
, 11,1 , 1 11,1 11,1 ,
, ,
ˆ
ˆ ˆln ln (1 ) ,
G
i t Gi ii t i t i t Y
i i t i t i
BG GG G
Y P Y Y
(11)
where fiscal expenditure shock ˆ 2
ˆ, ,~ iid (0, )
G
i t G i . The desired cyclical component of
public domestic demand responds to the contemporaneous cyclical component of the ratio of
net government assets to nominal output.
The cyclical component of the ratio of tax revenues to nominal output ,
, ,
ˆi t
Y
i t i t
T
P Y depends on a
weighted average of its past and desired cyclical components according to fiscal revenue
rule,
ˆ, , 1 , 1
12,1 12,1 12,1 ,
, , , 1 , 1 , ,
ˆ ˆ ˆ
(1 ) ,
G
i t i t i t T
i t Y Y Y
i t i t i t i t i t i t
T T B
P Y P Y P Y
(12)
where fiscal revenue shock ˆ 2
ˆ, ,~ iid (0, )
T
i t T i . The desired cyclical component of the ratio
of tax revenues to nominal output responds to the contemporaneous cyclical component of
the ratio of net government assets to nominal output.
The cyclical component of the ratio of the fiscal balance to nominal output,
, ,
i t
Y
i t i t
FB
P Y depends on
the contemporaneous cyclical components of the short term nominal market interest rate and
the ratio of the primary fiscal balance to nominal output according to government dynamic
budget constraint:
,, ,
,
, , , ,
ˆ .G S
i t i t S ii t Y Y Y
i t i t i i i t i t
BFB PBi
P Y P Y P Y (13)
The cyclical component of the ratio of the primary fiscal balance to nominal output,
, ,
i t
Y
i t i t
PB
P Y
depends on the contemporaneous cyclical components of the ratios of tax revenues to
7/30/2019 IMF - Policy Analysis and Forecasting in the World Economy: A Panel Unobserved Components Approach
http://slidepdf.com/reader/full/imf-policy-analysis-and-forecasting-in-the-world-economy-a-panel-unobserved 12/77
11
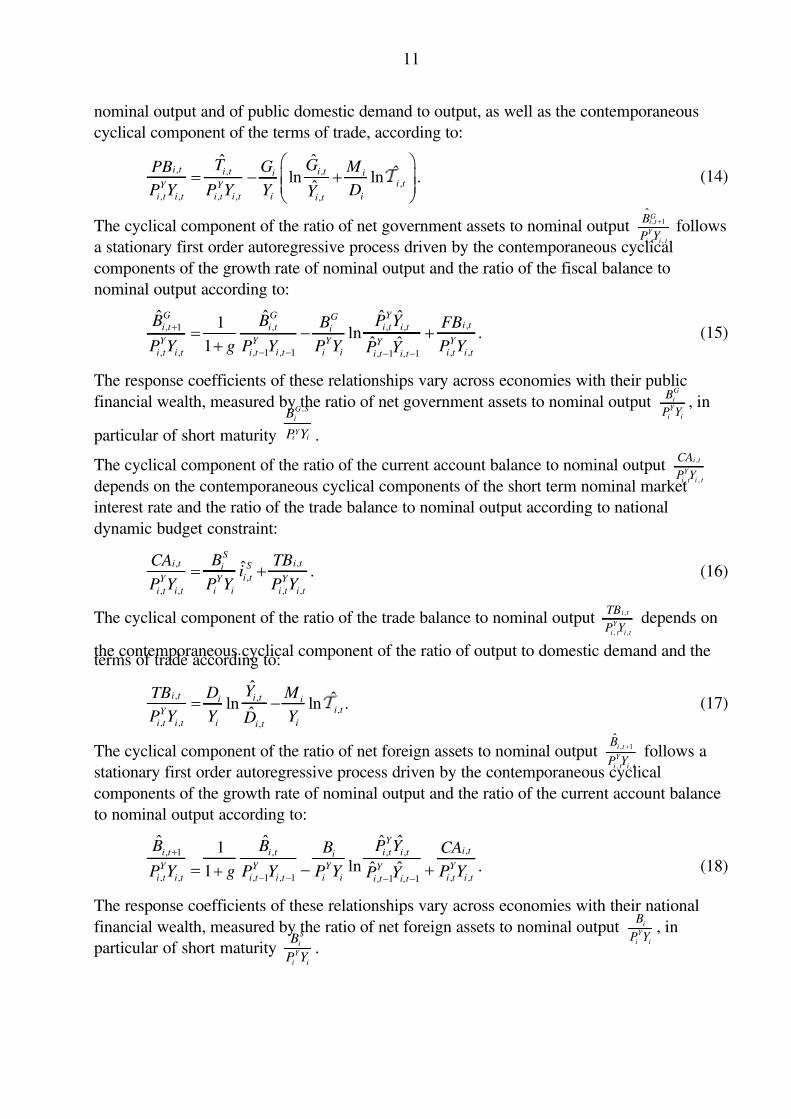
nominal output and of public domestic demand to output, as well as the contemporaneous
cyclical component of the terms of trade, according to:
, , ,
,
, , , , ,
ˆˆ
ˆln ln .ˆ
i t i t i t i ii t Y Y
i t i t i t i t i ii t
T GG M PB
P Y P Y Y DY
(14)
The cyclical component of the ratio of net government assets to nominal output , 1
, ,
ˆ Gi t
Y
i t i t
B
P Y
follows
a stationary first order autoregressive process driven by the contemporaneous cyclical
components of the growth rate of nominal output and the ratio of the fiscal balance to
nominal output according to:
,, 1 , , ,
, , , 1 , 1 , ,, 1 , 1
ˆ ˆ ˆ ˆ1ln .
ˆ ˆ1
G G Y Gi t i t i t i t i t i
Y Y Y Y Y i t i t i t i t i i i t i t i t i t
B B P Y B FB
P Y g P Y P Y P Y P Y
(15)
The response coefficients of these relationships vary across economies with their public
financial wealth, measured by the ratio of net government assets to nominal outputG
i
Y
i i
B
P Y , in
particular of short maturity
,G S
i
Y i i
B
P Y .
The cyclical component of the ratio of the current account balance to nominal output,
, ,
i t
Y
i t i t
CA
P Y
depends on the contemporaneous cyclical components of the short term nominal market
interest rate and the ratio of the trade balance to nominal output according to national
dynamic budget constraint:
,,
,
, , , ,
ˆ .S
i t i t S ii t Y Y Y
i t i t i i i t i t
BCA TBi
P Y P Y P Y (16)
The cyclical component of the ratio of the trade balance to nominal output,
, ,
i t
Y
i t i t
TB
P Y depends on
the contemporaneous cyclical component of the ratio of output to domestic demand and theterms of trade according to:
, ,
,
, , ,
ˆ
ˆln ln .ˆ
i t i t i ii t Y
i t i t i ii t
Y D M TB
P Y Y Y D (17)
The cyclical component of the ratio of net foreign assets to nominal output , 1
, ,
ˆi t
Y
i t i t
B
P Y
follows a
stationary first order autoregressive process driven by the contemporaneous cyclical
components of the growth rate of nominal output and the ratio of the current account balance
to nominal output according to:
,, 1 , , ,
, , , 1 , 1 , ,, 1 , 1
ˆ ˆ ˆ ˆ1ln .ˆ ˆ1
Y i t i t i t i t i t i
Y Y Y Y Y i t i t i t i t i i i t i t i t i t
B B P Y B CA
P Y g P Y P Y P Y P Y
(18)
The response coefficients of these relationships vary across economies with their national
financial wealth, measured by the ratio of net foreign assets to nominal output i
Y
i i
B
P Y , in
particular of short maturityS
i
Y
i i
B
P Y .
7/30/2019 IMF - Policy Analysis and Forecasting in the World Economy: A Panel Unobserved Components Approach
http://slidepdf.com/reader/full/imf-policy-analysis-and-forecasting-in-the-world-economy-a-panel-unobserved 13/77
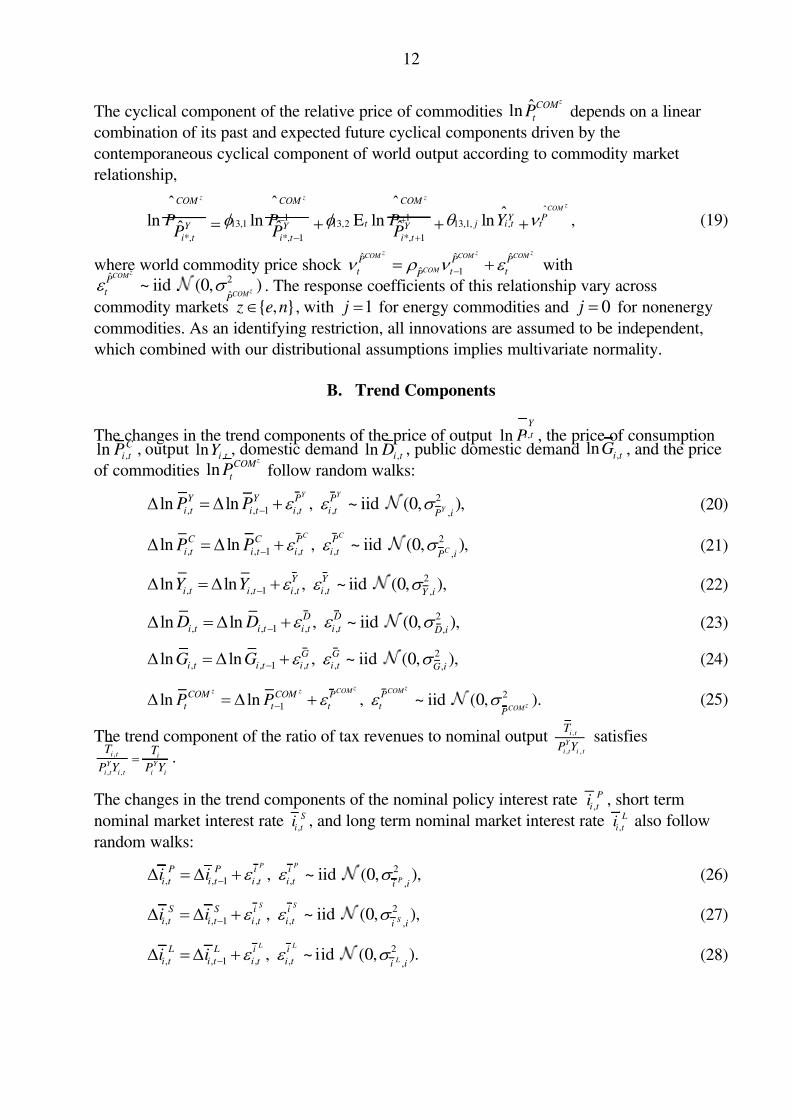
12
The cyclical component of the relative price of commodities ˆln z
COM
t P depends on a linear
combination of its past and expected future cyclical components driven by the
contemporaneous cyclical component of world output according to commodity market
relationship,
ˆ
1 113,1 13,2 13,1, ,
*, *, 1 *, 1
ˆ ˆ ˆ
ˆln ln E ln ln ,ˆ ˆ ˆ
z z z z
COM COM COM COM
Y Pt t t t j i t t Y Y Y
i t i t i t
P P P Y P P P
(19)
where world commodity price shock ˆ ˆ ˆ
ˆ 1
z z zCOM COM COM
COM
P P P
t t t P with
ˆ 2
ˆ
~ iid (0, ) z
COM
zCOM
P
t P
. The response coefficients of this relationship vary across
commodity markets { , } z e n , with 1 j for energy commodities and 0 j for nonenergy
commodities. As an identifying restriction, all innovations are assumed to be independent,
which combined with our distributional assumptions implies multivariate normality.
B. Trend Components
The changes in the trend components of the price of output ,lnY
i t P , the price of consumption,ln C
i t P , output,
ln i t Y , domestic demand,ln i t D , public domestic demand ,
lni t
G , and the price
of commodities ln z
COM
t P follow random walks:
2
, , 1 , , ,ln ln , ~ iid (0, ),
Y Y
Y
Y Y P P
i t i t i t i t P iP P (20)
2
, , 1 , , ,ln ln , ~ iid (0, ),
C C
C
C C P P
i t i t i t i t P iP P (21)
2
, , 1 , , ,ln ln , ~ iid (0, ),Y Y
i t i t i t i t Y iY Y (22)
2
, , 1 , , ,ln ln , ~ iid (0, ),
D D
i t i t i t i t D i D D (23)
2
, , 1 , , ,ln ln , ~ iid (0, ),G G
i t i t i t i t G iG G (24)
2
1ln ln , ~ iid (0, ). z z z z COM COM
zCOM
COM COM P P
t t t t P
P P (25)
The trend component of the ratio of tax revenues to nominal output ,
, ,
i t
Y
i t i t
T
P Y satisfies
,
, ,
i t i
Y Y
i t i t i i
T T
P Y P Y .
The changes in the trend components of the nominal policy interest rate,
P
i t i , short term
nominal market interest rate,
S
i t i , and long term nominal market interest rate
,
L
i t i also follow
random walks:
2
, , 1 , , ,, ~ iid (0, ),
P P
P
P P i i
i t i t i t i t i ii i (26)
2
, , 1 , , ,, ~ iid (0, ),
S S
S
S S i i
i t i t i t i t i ii i (27)
2
, , 1 , , ,, ~ iid (0, ).
L L
L
L L i i
i t i t i t i t i ii i (28)

7/30/2019 IMF - Policy Analysis and Forecasting in the World Economy: A Panel Unobserved Components Approach
http://slidepdf.com/reader/full/imf-policy-analysis-and-forecasting-in-the-world-economy-a-panel-unobserved 14/77
13
The trend component of the real policy interest rate ,
,
P Z
i t r satisfies ,
, , , 1EP Z P Z
i t i t t i t r i , the
trend component of the short term real market interest rate ,
,
S Z
i t r satisfies ,
, , , 1ES Z S Z
i t i t t i t r i ,
and the trend component of the long term real market interest rate ,
,
L Z
i t r satisfies,
, , , 1E L Z L Z
i t i t t i t r i .
The changes in the trend components of the price of equity ,ln STK i t P and the nominal bilateral
exchange rate , *,lni i t also follow random walks:
2
, , 1 , , ,ln ln , ~ iid (0, ),
STK STK
STK
STK STK P P
i t i t i t i t P iP P (29)
2
, *, , *, 1 , , ,ln ln , ~ iid (0, ).
i i t i i t i t i t i (30)
The trend component of the real bilateral exchange rate , *,ln
i i t satisfies
, *, , *, *, ,ln ln ln lnY Y
i i t i i t i t i t P P , and the trend component of the terms of trade ,
lni t
satisfies ,ln 0
i t .
The changes in the trend components of the ratios of the fiscal balance to nominal output,
, ,
i t
Y
i t i t
FB
P Y and the current account balance to nominal output
,
, ,
i t
Y
i t i t
CA
P Y also follow random walks:
, , 1 2
, , ,
, , , 1 , 1
, ~ iid (0, ),i t i t FB FB
i t i t Y Y FB i
i t i t i t i t
FB FB
P Y P Y
(31)
, , 1 2
, , ,
, , , 1 , 1
, ~ iid (0, ).i t i t CA CA
i t i t Y Y CA i
i t i t i t i t
CA CA
P Y P Y
(32)
The trend component of the ratio of the primary fiscal balance to nominal output,
, ,
i t
Y
i t i t
PB
P Y
satisfies ,
, ,
i t i i
Y Y
i t i t i i i
PB T G
P Y P Y Y , and the trend component of the ratio of net government assets to
nominal output
, 1
, ,
G
i t
Y i t i t
B
P Y
satisfies, 1
, ,
G Gi t i
Y Y i t i t i i
B B
P Y P Y
. The trend component of the ratio of the tradebalance to nominal output
,
, ,
i t
Y
i t i t
TB
P Y satisfies ,
, ,
i t i i
Y
i t i t i i
TB X M
P Y Y Y , and the trend component of the
ratio of net foreign assets to nominal output , 1
, ,
i t
Y
i t i t
B
P Y
satisfies , 1
, ,
i t i
Y Y
i t i t i i
B B
P Y P Y
. As an identifying
restriction, all innovations are assumed to be independent.
III. ESTIMATION
The traditional econometric interpretation of this panel unobserved components model of the
world economy regards it as a representation of the joint probability distribution of the data.
We employ a Bayesian estimation procedure which respects this traditional econometric
interpretation while conditioning on prior information concerning the common values of
structural parameters across economies, and judgment concerning the paths of trend
components. In addition to mitigating potential model misspecification and identification
problems, exploiting this additional information may be expected to yield efficiency gains in
estimation.
7/30/2019 IMF - Policy Analysis and Forecasting in the World Economy: A Panel Unobserved Components Approach
http://slidepdf.com/reader/full/imf-policy-analysis-and-forecasting-in-the-world-economy-a-panel-unobserved 15/77
14
A. Estimation Procedure
Let t x denote a vector stochastic process consisting of the levels of N
x nonpredetermined
endogenous variables, of which N y are observed. The cyclical components of this vector
stochastic process satisfy second order stochastic linear difference equation
0 1 1 2 1 3ˆ ˆ ˆ ˆE ,t t t t t A x A x A x A ν (33)
where vector stochastic process ˆt
ν consists of the cyclical components of N ν exogenous
variables. This vector stochastic process satisfies stationary first order stochastic linear
difference equation
1 1 1,ˆ ˆ ,
t t t ν B ν ε (34)
where 1, 1~ iid ( , )t ε Σ 0 . If there exists a unique stationary solution to this multivariate
linear rational expectations model, then it may be expressed as:
1 1 2ˆ ˆ ˆ .
t t t x C x C ν (35)
This unique stationary solution is calculated with the procedure due to Klein (2000).
The trend components of vector stochastic process t x satisfy first order stochastic linear
difference equation
0 1 2 1 2,,
t t t t D x D u D x ε (36)
where 2, 2~ iid ( , )
t ε Σ 0 . Vector stochastic process t u consists of the levels of N u common
stochastic trends, and satisfies nonstationary first order stochastic linear difference equation
1 3,,
t t t u u ε (37)
where 3, 3~ iid ( , )
t ε Σ 0 . Cyclical and trend components are additively separable, that is
ˆt t t
x x x .
Let t y denote a vector stochastic process consisting of the levels of N
y observed
nonpredetermined endogenous variables. Also, let t z denote a vector stochastic process
consisting of the levels of N N x y unobserved nonpredetermined endogenous variables, the
cyclical components of N x nonpredetermined endogenous variables, the trend components
of N x nonpredetermined endogenous variables, the cyclical components of N
ν exogenous
variables, and the levels of N u common stochastic trends. Given unique stationary solution
(35), these vector stochastic processes have linear state space representation
1,
t t y F z (38)
1 1 2 4, ,t t t z G z G ε (39)
where 4, 4~ iid ( , )
t ε Σ 0 and 0 0|0 0|0~ ( , ) z z P . Let
t w denote a vector stochastic process
consisting of alternative estimates or forecasts of N w linearly independent linear
combinations of unobserved state variables. Following Vitek (2009), suppose that this vector
stochastic process satisfies
7/30/2019 IMF - Policy Analysis and Forecasting in the World Economy: A Panel Unobserved Components Approach
http://slidepdf.com/reader/full/imf-policy-analysis-and-forecasting-in-the-world-economy-a-panel-unobserved 16/77
15
1 5,,
t t t w H z ε (40)
where 5, 5,~ iid ( , )t t ε Σ 0 . Conditional on known parameter values, this signal equation
imposes judgment on linear combinations of unobserved state variables in the form of a set
of stochastic restrictions of time dependent tightness. The signal and state innovation vectors
are assumed to be independent, while the initial state vector is assumed to be independentfrom the signal and state innovation vectors, which combined with our distributional
assumptions implies multivariate normality.
Conditional on the parameters associated with these signal and state equations, estimates of
unobserved state vector t z and its mean squared error matrix t P may be calculated with the
filter due to Kalman (1960) or the smoother associated with de Jong (1989). Given initial
conditions 0|0 z and 0|0
P , estimates conditional on information available at time 1t satisfy
prediction equations:
| 1 1 1| 1,
t t t t z G z (41)
| 1 1 1| 1 1 2 4 2 ,t t t t P G P G G Σ G T T (42)
| 1 1 | 1,t t t t y F z (43)
| 1 1 | 1 1 ,t t t t Q F P F T (44)
| 1 1 | 1,t t t t w H z (45)
| 1 1 | 1 1 5, .t t t t t R H P H Σ T (46)
Given these predictions, under the assumption of multivariate normally distributed signal and
state innovation vectors, together with conditionally contemporaneously uncorrelated signalvectors, estimates conditional on information available at time t , and judgment concerning
the paths of linear combinations of state variables through time t , satisfy Bayesian updating
equations
| | 1 | 1 | 1( ) ( ),t t t t t t t t t t t t
y w z z K y y K w w (47)
| | 1 1 | 1 1 | 1,t t t t t t t t t t y w
P P K F P K H P (48)
where1
| 1 1 | 1t t t t t
y K P F QT
and1
| 1 1 | 1t t t t t
w K P H RT
. Given terminal conditions 1|ˆ
T T z 0 and
1|ˆ
T T P 0 , estimates conditional on information available at time T , and judgment
concerning the paths of linear combinations of state variables through time T , satisfy
computationally efficient Bayesian smoothing equations
1 1
| 1| 1 | 1 | 1 1 | 1 | 1ˆ ˆ ( ) ( ),t T t t T t t t t t t t t t t
z J z F Q y y H R w wT T T (49)
| | 1 | 1 |ˆ ,t T t t t t t T z z P z (50)
1 1
| 1| 1 | 1 1 1 | 1 1ˆ ˆ ,
t T t t T t t t t t
P J P J F Q F H R H T T T
(51)
7/30/2019 IMF - Policy Analysis and Forecasting in the World Economy: A Panel Unobserved Components Approach
http://slidepdf.com/reader/full/imf-policy-analysis-and-forecasting-in-the-world-economy-a-panel-unobserved 17/77
16
| | 1 | 1 | | 1ˆ ,
t T t t t t t T t t P P P P P (52)
where 1 1
1 | 1 1 | 1 1 1 | 1 1( )t K t t t t t t
J G I P F Q F H R H T T . Under our distributional assumptions,
recursive forward evaluation of equations (41) through (48), followed by recursive backward
evaluation of equations (49) and (51), yields mean squared error optimal conditional
estimates of the unobserved state vector.
LetK θ Θ denote a K dimensional vector containing the parameters associated with
the signal and state equations of this linear state space model. The Bayesian estimator of this
parameter vector has posterior density function
( | ) ( | ) ( ),T T f f f θ θ θ (53)
where 1 1{{ } ,{ } }t t
t s s s s y w . Under the assumption of multivariate normally distributed
signal and state innovation vectors, together with conditionally contemporaneously
uncorrelated signal vectors, conditional density function ( | )T f θ satisfies:
1 1
1 1
( | ) ( | , ) ( | , ).T T
T t t t t
t t
f f f
θ y θ w θ (54)
Under our distributional assumptions, conditional density functions 1( | , )
t t f y θ and
1( | , )
t t f w θ satisfy:
1
12 21 | 1 | 1 | 1 | 1
1( | , ) (2 ) | | exp ( ) ( ) ,
2
N
t t t t t t t t t t t t f
y
y θ Q y y Q y yT(55)
1
12 21 | 1 | 1 | 1 | 1
1( | , ) (2 ) | | exp ( ) ( ) .
2
N
t t t t t t t t t t t t f
w
w θ R w w R w wT(56)
Prior information concerning parameter vector θ is summarized by a multivariate normal
prior distribution having mean vector 1θ and covariance matrix Ω :
1
12 21 1
1( ) (2 ) | | exp ( ) ( ) .
2
K
f
θ Ω θ θ Ω θ θ T
(57)
Independent priors are represented by a diagonal covariance matrix, under which diffuse
priors are represented by infinite variances.
Inference on the parameters is based on an asymptotic normal approximation to the posterior
distribution around its mode. Under regularity conditions stated in Geweke (2005), posterior
mode ˆT θ satisfies
1
0 0ˆ( ) ( , ),
d
T T θ θ 0 (58)
where 0θ Θ denotes the pseudo-true parameter vector. Following Engle and
Watson (1981), Hessian 0 is estimated by:
7/30/2019 IMF - Policy Analysis and Forecasting in the World Economy: A Panel Unobserved Components Approach
http://slidepdf.com/reader/full/imf-policy-analysis-and-forecasting-in-the-world-economy-a-panel-unobserved 18/77
17
1 1 1
| 1 | 1 | 1 | 1 | 1 | 1 | 1
1
1 1 1 1
| 1 | 1 | 1 | 1 | 1 | 1 | 1
1
1 1ˆ ( )
2
1 1 1( ) .
2
T
T t t t t t t t t t t t t t t
t
T
t t t t t t t t t t t t t t
t
T
T T
θ θ θ θ
θ θ θ θ
y Q y Q Q Q Q
w R w R R R R Ω
T T
T T
(59)
This estimator of the Hessian depends only on first derivatives and is negative semidefinite.
B. Estimation Results
Joint estimation of the parameters and unobserved components of our panel unobserved
components model of the world economy is based on the levels of a total of four hundred one
endogenous variables observed for thirty five economies over the sample period 1999Q1
through 2011Q3. The economies under consideration are Argentina, Australia, Austria,
Belgium, Brazil, Canada, China, the Czech Republic, Denmark, Finland, France, Germany,
Greece, India, Indonesia, Ireland, Italy, Japan, Korea, Mexico, the Netherlands, New
Zealand, Norway, Poland, Portugal, Russia, Saudi Arabia, South Africa, Spain, Sweden,Switzerland, Thailand, Turkey, the United Kingdom, and the United States. The observed
endogenous variables under consideration are the price of output, the price of consumption,
the quantity of output, the quantity of domestic demand, the nominal policy interest rate, the
short term nominal market interest rate, the long term nominal market interest rate, the price
of equity, the nominal bilateral exchange rate, the quantity of public domestic demand, the
ratio of the fiscal balance to nominal output, the ratio of the current account balance to
nominal output, and the prices of energy and nonenergy commodities. For a detailed
description of this data set, please refer to Appendix A.
Parameters
The set of parameters associated with our panel unobserved components model is partitioned
into two subsets. Those parameters associated with the conditional mean function are
estimated conditional on informative independent priors, while those parameters associated
exclusively with the conditional variance function are estimated conditional on diffuse priors.
The marginal prior distributions of those parameters associated with the conditional mean
function are centered within the range of estimates reported in the existing empirical
literature, where available. The conduct of monetary policy is represented by a flexible
inflation targeting regime in all economies except for Argentina, China, the Czech Republic,
Denmark, India, Indonesia, Russia, Saudi Arabia and Thailand, where it is represented by amanaged exchange rate regime, consistent with IMF (2006). Capital controls apply in China,
India, and Saudi Arabia. The quotation currency for transactions in the foreign exchange
market is issued by the United States. Great ratios and bilateral trade and equity portfolio
weights entering into the conditional mean function are calibrated to match their observed
values in 2005. All world weights and bilateral trade and portfolio weights are normalized to
sum to one.
7/30/2019 IMF - Policy Analysis and Forecasting in the World Economy: A Panel Unobserved Components Approach
http://slidepdf.com/reader/full/imf-policy-analysis-and-forecasting-in-the-world-economy-a-panel-unobserved 19/77
18
Judgment concerning the paths of trend components is generated by passing the levels of all
observed endogenous variables through the filter described in Hodrick and Prescott (1997).
Stochastic restrictions on the trend components of all observed endogenous variables are
derived from these preliminary estimates, with a time varying innovation covariance matrix
set equal to that obtained from unrestricted estimation, rescaled by a factor of 2 2. Initialconditions for the cyclical components of exogenous variables are given by their
unconditional means and variances, while the initial values of all other state variables are
treated as parameters, and are calibrated to match functions of initial realizations of the levels
of observed endogenous variables, or preliminary estimates of their trend components
calculated with the filter associated with Hodrick and Prescott (1997).
The posterior mode is calculated by numerically maximizing the logarithm of the posterior
density kernel with a modified steepest ascent algorithm. To avoid finding a local as opposed
to global maximum, starting values for structural parameters are generated with a customized
implementation of the differential evolution algorithm proposed by Storn and Price (1997).Parameter estimation results pertaining to the sample period 1999Q3 through 2011Q3 are
reported in Table 1 of Appendix B. The sufficient condition for the existence of a unique
stationary rational expectations equilibrium stated in Klein (2000) is satisfied in a
neighborhood around the posterior mode, while our estimator of the Hessian is not nearly
singular at the posterior mode, suggesting that the linear state space representation of our
panel unobserved components model is locally identified.
The posterior modes of most structural parameters are close to their prior means, reflecting
the imposition of tight priors to preserve empirically plausible impulse response dynamics.
Nevertheless, the data are quite informative regarding some of these structural parameters, asevidenced by substantial updates from prior to posterior. The estimated variances of
innovations driving variation in cyclical components are all well within the range of
estimates reported in the existing empirical literature, after accounting for data rescaling. The
estimated variances of innovations driving variation in trend components vary considerably
across economies and observed endogenous variables.
Unobserved Components
Within the framework of our estimated panel unobserved components model, the output gap
and the monetary conditions gap are indicators of inflationary or disinflationary pressure,
while the monetary conditions gap is also an indicator of business cycle fluctuations.
Smoothed estimates of the output gap are plotted in Figure 1 and Figure 2 of Appendix B,
while smoothed estimates of the monetary conditions gap are also plotted in Figure 2 of
Appendix B. These estimates are conditional on past, present, and future information.
A decomposition of our output gap estimates into contributions from domestic demand and
net exports indicates that the gradual global synchronized accumulation of excess demand
7/30/2019 IMF - Policy Analysis and Forecasting in the World Economy: A Panel Unobserved Components Approach
http://slidepdf.com/reader/full/imf-policy-analysis-and-forecasting-in-the-world-economy-a-panel-unobserved 20/77
19
pressure which occurred during the build up to the global financial crisis was primarily
driven by the excessive expansion of private domestic demand in most economies. During
this period of widening global current account imbalances, the excessive expansion of net
exports was also a major contributor to the accumulation of excess demand pressure in major
surplus economies such as China, Germany, and Japan. The global financial crisis triggered
the rapid global synchronized unwinding of this excess demand pressure, and resulted in theaccumulation of substantial excess supply pressure in many economies. During this episode
of narrowing global current account imbalances, collapses in private domestic demand in
major deficit economies such as France, the United Kingdom, and the United States
coincided with collapses in net exports in major surplus economies.
A decomposition of our output gap estimates into contributions from monetary conditions
and real conditions reveals that the gradual global synchronized accumulation of excess
demand pressure which occurred during the build up to the global financial crisis was
accompanied by loose financial conditions in many economies, notably France, Germany,
and the United States. During the global financial crisis, monetary and financial conditionsabruptly tightened in these and many other economies.
IV. MONETARY AND FISCAL POLICY ANALYSIS
We analyze the interaction between business cycle dynamics in the world economy, and the
systematic and unsystematic components of monetary and fiscal policy, within the
framework of our estimated panel unobserved components model. In particular, we quantify
dynamic interrelationships among key instrument, indicator, and target variables with
simulated unconditional correlations and estimated impulse response functions. We also
identify the structural determinants of these instrument, indicator, and target variables with
estimated forecast error variance decompositions and historical decompositions.
A. Simulated Unconditional Correlations
Simulated unconditional correlations measure intertemporal comovement between
endogenous variables driven by all structural shocks, on average over the business cycle. The
simulated unconditional correlations between consumption price inflation, the output gap,
and the monetary conditions gap are plotted in Figure 3 of Appendix B.
Our simulated unconditional correlations confirm that the output gap and the monetary
conditions gap are both leading indicators of inflationary or disinflationary pressure.However, the usefulness of these indicators for predicting deviations of inflation from its
implicit target rate varies across economies and horizons. These deviations are relatively
unpredictable in economies with flexible inflation targeting regimes, particularly relatively
small and open ones such as Australia, Canada, New Zealand, Norway, Sweden, and the
United Kingdom. They are generally slightly more predictable in economies with managed
exchange rate regimes, reflecting their lower degree of monetary policy autonomy. In
7/30/2019 IMF - Policy Analysis and Forecasting in the World Economy: A Panel Unobserved Components Approach
http://slidepdf.com/reader/full/imf-policy-analysis-and-forecasting-in-the-world-economy-a-panel-unobserved 21/77
20
contrast, they tend to be relatively predictable within the Euro Area, the member economies
of which lack monetary policy autonomy. Reflecting lags in the monetary transmission
mechanism, the output gap is generally slightly more useful for predicting inflation at short
horizons, while the monetary conditions gap tends to be slightly more useful at long
horizons.
Simulated unconditional correlations also verify that the monetary conditions gap is a leading
indicator of business cycle fluctuations. The monetary conditions gap is generally more
useful for predicting the output gap in economies with high dependence on private domestic
demand. Conversely, it tends to be less useful for predicting the output gap in relatively open
economies, due to their high dependence on foreign demand, and in economies with
relatively large governments, reflecting their high dependence on public domestic demand.
B. Impulse Response Functions
Impulse response functions measure the dynamic effects of selected structural shocks onendogenous variables. The estimated impulse responses of consumption price inflation,
output, domestic demand, the nominal policy interest rate, the real effective exchange rate,
the ratio of the fiscal balance to nominal output, and the ratio of the current account balance
to nominal output to a variety of structural shocks are plotted in Figure 4 through Figure 13
of Appendix B. The structural shocks under consideration are domestic supply shocks,
domestic private demand shocks, domestic monetary policy shocks, domestic credit risk
premium shocks, domestic duration risk premium shocks, domestic equity risk premium
shocks, domestic fiscal expenditure shocks, domestic fiscal revenue shocks, world energy
commodity price shocks, and world nonenergy commodity price shocks.
In response to a domestic supply shock which generates a persistent increase in inflation,
there arises a persistent hump shaped contraction of output. Facing a monetary policy
tradeoff, the central bank raises the nominal policy interest rate to control inflation, and the
currency generally appreciates in real effective terms. The fiscal balance tends to deteriorate
due to the fall in output, while the current account balance generally improves reflecting the
generally larger fall in domestic demand. In response to a domestic private demand shock
which generates a persistent hump shaped expansion of output, there generally arises a
persistent hump shaped increase in inflation. Not facing a monetary policy tradeoff, the
central bank tends to raise the nominal policy interest rate to stabilize inflation and output,
and the currency appreciates in real effective terms. The fiscal balance improves due to the
rise in output, while the current account balance deteriorates reflecting the larger rise in
domestic demand.
In response to a domestic monetary policy shock which generates a persistent increase in the
nominal policy interest rate, the currency appreciates in real effective terms. Reflecting the
interest rate and exchange rate channels of monetary transmission, interacted with an
international financial accelerator mechanism, there arises a persistent hump shaped
7/30/2019 IMF - Policy Analysis and Forecasting in the World Economy: A Panel Unobserved Components Approach
http://slidepdf.com/reader/full/imf-policy-analysis-and-forecasting-in-the-world-economy-a-panel-unobserved 22/77
21
contraction of output, accompanied by a persistent decrease in inflation. In particular, in
response to a one percentage point increase in the nominal policy interest rate, the peak
contraction of output averages 0.5 percent across economies within a range of 0.2 to
0.7 percent, while the peak decrease in inflation averages 0.3 percentage points within a
range of 0.1 to 0.4 percentage points. The fiscal balance deteriorates due to the fall in output,
while the current account balance generally improves reflecting the generally larger fall indomestic demand.
In response to a domestic credit risk premium shock which generates a persistent increase in
the short term nominal market interest rate, the currency generally appreciates in real
effective terms, and there arises a persistent hump shaped contraction of output, accompanied
by a persistent decrease in inflation. The central bank tends to cut the nominal policy interest
rate to stabilize inflation and output, but the fiscal balance deteriorates due to the fall in
output, while the current account balance generally improves reflecting the generally larger
fall in domestic demand. In response to a domestic duration risk premium shock which
generates a persistent increase in the long term nominal market interest rate, there arises apersistent hump shaped contraction of output, generally accompanied by a persistent hump
shaped decrease in inflation. The central bank tends to cut the nominal policy interest rate to
stabilize inflation and output, and the currency depreciates in real effective terms. The fiscal
balance deteriorates due to the fall in output, while the current account balance improves
reflecting the larger fall in domestic demand. In response to a domestic equity risk premium
shock which generates a persistent increase in the price of equity, there arises a persistent
hump shaped expansion of output, generally accompanied by a persistent hump shaped
increase in inflation. The central bank tends to raise the nominal policy interest rate to
stabilize inflation and output, and the currency appreciates in real effective terms. The fiscal
balance generally improves due to the rise in output, while the current account balancedeteriorates reflecting the larger rise in domestic demand.
In response to a domestic fiscal expenditure shock which generates a persistent deterioration
in the fiscal balance, there arises a persistent expansion of output, generally accompanied by
a persistent hump shaped increase in inflation. In particular, in response to a one percentage
point decrease in the ratio of the fiscal balance to nominal output, the peak expansion of
output averages 1.0 percent within a range of 0.2 to 1.7 percent, and tends to decrease across
economies with their trade openness. The central bank generally raises the nominal policy
interest rate to stabilize inflation and output, and the currency appreciates in real effective
terms. The current account balance deteriorates, reflecting the larger rise in domestic demandthan in output. In response to a domestic fiscal revenue shock which generates a persistent
improvement in the fiscal balance, there arises a persistent contraction of output, generally
accompanied by a persistent hump shaped decrease in inflation. In particular, in response to a
one percentage point increase in the ratio of the fiscal balance to nominal output, the peak
contraction of output averages 0.6 percent within a range of 0.1 to 1.0 percent, and tends to
decrease across economies with their trade openness. The central bank generally cuts the
nominal policy interest rate to stabilize inflation and output, and the currency depreciates in
7/30/2019 IMF - Policy Analysis and Forecasting in the World Economy: A Panel Unobserved Components Approach
http://slidepdf.com/reader/full/imf-policy-analysis-and-forecasting-in-the-world-economy-a-panel-unobserved 23/77
22
real effective terms. The current account balance improves, reflecting the larger fall in
domestic demand than in output.
In response to a world energy or nonenergy commodity price shock which generates a
persistent increase in the price of energy or nonenergy commodities, inflation generally
increases, and the central bank tends to raise the nominal policy interest rate. For netexporters of energy or nonenergy commodities, the currency generally appreciates in real
effective terms, generally inducing a persistent terms of trade driven expansion of domestic
demand mitigated by monetary policy tightening, which eventually translates into a persistent
expansion of output in spite of terms of trade driven expenditure switching. The fiscal
balance tends to improve, while the current account balance may improve or deteriorate. For
net importers of energy or nonenergy commodities, the currency generally depreciates in real
effective terms, generally inducing a persistent terms of trade driven contraction of domestic
demand amplified by monetary policy tightening, which immediately translates into a
persistent contraction of output in spite of terms of trade driven expenditure switching. The
fiscal balance tends to deteriorate, while the current account balance may deteriorate orimprove.
C. Forecast Error Variance Decompositions
Forecast error variance decompositions measure the contributions of mutually exclusive sets
of structural shocks to unpredictable variation in endogenous variables at different horizons,
on average over the business cycle. The estimated forecast error variance decompositions of
consumption price inflation, output, domestic demand, the nominal policy interest rate, the
real effective exchange rate, the ratio of the fiscal balance to nominal output, and the ratio of
the current account balance to nominal output are plotted in Figure 14 through Figure 20 of
Appendix B. The sets of structural shocks under consideration are domestic supply shocks,
foreign supply shocks, domestic demand shocks, foreign demand shocks, world monetary
policy shocks, world fiscal policy shocks, world risk premium shocks, and world terms of
trade shocks.
Our estimated forecast error variance decompositions indicate that unpredictable variation in
inflation is primarily driven by domestic and foreign supply shocks, and to a lesser extent
world monetary policy shocks, at all horizons. The contribution of domestic supply shocks
relative to foreign supply shocks is generally decreasing across economies with their trade
openness and increasing with their monetary policy autonomy. In contrast, unpredictable
variation in output tends to be primarily attributable to domestic and foreign demand shocks,
together with world risk premium shocks, at high frequencies. The contribution of domestic
demand shocks relative to foreign demand shocks is generally decreasing across economies
with their trade openness. Nevertheless, domestic and foreign supply shocks, together with
world monetary policy shocks, are major contributors to unpredictable output fluctuations at
low frequencies. Estimated forecast error variance decompositions of domestic demand
reveal a similar pattern, with the exception that domestic demand shocks are larger
7/30/2019 IMF - Policy Analysis and Forecasting in the World Economy: A Panel Unobserved Components Approach
http://slidepdf.com/reader/full/imf-policy-analysis-and-forecasting-in-the-world-economy-a-panel-unobserved 24/77
23
contributors to unpredictable variation at all frequencies, while foreign demand shocks are
smaller contributors. In addition, world fiscal policy shocks tend to be significant
contributors to unpredictable domestic demand fluctuations at high frequencies.
Estimated forecast error variance decompositions indicate that unpredictable variation in the
nominal policy interest rate is primarily driven by world monetary policy shocks at shorthorizons. However, domestic and foreign supply shocks are also major contributors to
unpredictable variation at long horizons, where the relative contribution of domestic supply
shocks is generally decreasing across economies with their trade openness and increasing
with their monetary policy autonomy. Estimated forecast error variance decompositions of
the real effective exchange rate attribute most unpredictable high frequency variation to
world monetary policy and risk premium shocks. Nevertheless, domestic and foreign supply
shocks are also major contributors to unpredictable real effective exchange rate fluctuations
at low frequencies.
Our estimated forecast error variance decompositions reveal that unpredictable variation inthe fiscal balance is primarily driven by world monetary and fiscal policy shocks, and to a
lesser extent domestic and foreign demand shocks, at short horizons. However, domestic and
foreign supply shocks, and to a lesser extent domestic and foreign demand shocks, are also
major contributors to unpredictable variation at long horizons. Estimated forecast error
variance decompositions of the current account balance attribute most unpredictable high
frequency variation to domestic and foreign demand shocks, together with world monetary
policy shocks for economies with high net foreign asset or debt positions. The contribution of
domestic demand shocks relative to foreign demand shocks tends to be decreasing across
economies with their trade openness. Nevertheless, domestic and foreign supply shocks are
also major contributors to unpredictable current account balance fluctuations at lowfrequencies.
D. Historical Decompositions
Historical decompositions measure the time varying contributions of mutually exclusive sets
of structural shocks to the realizations of endogenous variables. The estimated historical
decompositions of consumption price inflation, output growth, the ratio of the fiscal balance
to nominal output, and the ratio of the current account balance to nominal output are plotted
in Figure 21 through Figure 24 of Appendix B. The sets of structural shocks under
consideration are domestic supply shocks, foreign supply shocks, domestic demand shocks,
foreign demand shocks, world monetary policy shocks, world fiscal policy shocks, world risk
premium shocks, and world terms of trade shocks.
Our estimated historical decompositions of inflation attribute deviations from implicit targets
primarily to economy specific combinations of domestic and foreign supply and demand
shocks, together with world risk premium and terms of trade shocks. Implicit inflation targets
have generally stabilized at relatively low levels in advanced economies, particularly those
7/30/2019 IMF - Policy Analysis and Forecasting in the World Economy: A Panel Unobserved Components Approach
http://slidepdf.com/reader/full/imf-policy-analysis-and-forecasting-in-the-world-economy-a-panel-unobserved 25/77
24
with well established flexible inflation targeting regimes such as Australia, Canada, New
Zealand, Norway, Sweden, and the United Kingdom. Estimated historical decompositions of
output growth attribute business cycle dynamics around relatively stable potential output
growth rates primarily to economy specific combinations of domestic and foreign demand
shocks, together with world fiscal policy and risk premium shocks. Business cycle
fluctuations in major deficit economies such as Spain and the United States have beenprimarily driven by domestic demand shocks, whereas those in major surplus economies
such as China and Germany have been primarily driven by foreign demand shocks. In both
groups of economies, these business cycle fluctuations have usually been amplified by world
risk premium shocks and mitigated by world fiscal policy shocks. Potential output growth
rates have generally stabilized at relatively low levels in advanced economies, and at
relatively high levels in emerging economies.
Estimated historical decompositions of the fiscal balance attribute fluctuations around
structural balances primarily to world fiscal policy shocks, together with economy specific
combinations of domestic and foreign demand shocks. These fluctuations have usually beenamplified by world risk premium shocks, reflecting the effects of discretionary fiscal policy
on nominal market interest rates. Structural fiscal balances have generally deteriorated
recently, particularly in advanced economies. Our estimated historical decompositions of the
current account balance attribute fluctuations around structural balances primarily to
economy specific combinations of domestic and foreign demand shocks. These contributions
have been broadly balanced in major surplus and deficit economies, with the notable
exception of Spain where domestic demand shocks have dominated, and China where foreign
demand shocks have dominated.
During the build up to the global financial crisis, positive domestic and foreign demandshocks contributed to the gradual accumulation of excess demand pressure throughout the
world economy, generally amplified by world risk premium shocks. This synchronized
global expansion was reflected in a synchronized global rise in inflation, usually amplified by
world terms of trade shocks. During the global financial crisis, economy specific
combinations of negative domestic and foreign demand shocks, amplified and accelerated by
world risk premium shocks, rapidly eliminated this excess demand pressure, generally
supplanting it with excess supply pressure to varying degrees. This synchronized global
recession was mitigated by unsystematic monetary and fiscal policy interventions, with the
latter contributing to large deteriorations in fiscal balances. It was reflected in a synchronized
global fall in inflation, usually amplified by world terms of trade shocks. Since the globalfinancial crisis, economy specific combinations of positive domestic and foreign demand
shocks, generally amplified by world risk premium shocks, have gradually reduced this
excess supply pressure. This synchronized global recovery has been decelerated by world
fiscal policy shocks, which have contributed to moderate to large improvements in fiscal
balances.
7/30/2019 IMF - Policy Analysis and Forecasting in the World Economy: A Panel Unobserved Components Approach
http://slidepdf.com/reader/full/imf-policy-analysis-and-forecasting-in-the-world-economy-a-panel-unobserved 26/77
25
V. SPILLOVER ANALYSIS
Within the framework of our estimated panel unobserved components model, the dynamic
effects of macroeconomic and financial shocks are transmitted throughout the world
economy via trade, financial and commodity price linkages, necessitating monetary and
fiscal policy responses to spillovers. Macroeconomic shocks are transmitted via directfinancial linkages, while financial shocks are also transmitted via indirect financial linkages
representing contagion effects.
We analyze spillovers from macroeconomic and financial shocks in systemic economies to
the rest of the world with simulated conditional betas and estimated impulse response
functions. The systemic economies under consideration are China, the Euro Area, Japan, the
United Kingdom, and the United States, consistent with IMF (2011). The macroeconomic
shocks under consideration are supply shocks, private demand shocks, monetary policy
shocks, fiscal expenditure shocks, and fiscal revenue shocks. The financial shocks under
consideration are credit risk premium shocks, duration risk premium shocks, and equity risk premium shocks.
A. Simulated Conditional Betas
Simulated conditional betas measure contemporaneous comovement between endogenous
variables driven by selected structural shocks, on average over the business cycle. They are
ordinary least squares estimates of slope coefficients in bivariate regressions of endogenous
variables on contemporaneous endogenous variables, averaged across a large number of
simulated paths for the world economy. The simulated betas of the output gap with respect to
the contemporaneous output gap in systemic economies, conditional on macroeconomic or
financial shocks in each of these systemic economies, are plotted in Figure 25 of Appendix
B. They measure causality as opposed to correlation, because they abstract from structural
shocks associated with other economies.
On average over the business cycle, output spillovers from systemic economies to the rest of
the world in our estimated panel unobserved components model are primarily generated by
macroeconomic shocks, which contribute more to business cycle fluctuations than financial
shocks. This implies weak international business cycle comovement beyond close trading
partners. However, during episodes of financial stress in systemic economies, such as during
the global financial crisis, international business cycle comovement is more uniformly strong
due to the prevalence of financial shocks, which propagate via elevated contagion effects.
Output spillovers generated by macroeconomic shocks are generally small but concentrated
in our estimated panel unobserved components model. The pattern of international business
cycle comovement driven by macroeconomic shocks primarily reflects bilateral trade
relationships, and therefore exhibits gravity. That is, output spillovers generated by
macroeconomic shocks tend to be concentrated among geographically close trading partners,
7/30/2019 IMF - Policy Analysis and Forecasting in the World Economy: A Panel Unobserved Components Approach
http://slidepdf.com/reader/full/imf-policy-analysis-and-forecasting-in-the-world-economy-a-panel-unobserved 27/77
26
which generally have strong bilateral trade relationships due in part to transportation costs.
However, this pattern is diluted by supply shocks, which are primarily transmitted
internationally via terms of trade shifts, unlike other macroeconomic shocks which are
primarily transmitted internationally via domestic demand shifts.
Output spillovers generated by financial shocks are generally large and diffuse in ourestimated panel unobserved components model. The pattern of international business cycle
comovement driven by financial shocks transcends bilateral portfolio investment
relationships, which tend to be weak reflecting home bias. Output spillovers generated by
financial shocks are primarily transmitted via international comovement in financial asset
prices. Given that bilateral trade relationships are generally weak beyond close trading
partners, accounting for strong international comovement in financial asset prices requires
strong international comovement in risk premia. The intensity of these contagion effects
varies across source and recipient economies. They are uniquely strong from the United
States, reflecting the depth of its money, bond and stock markets. They are strong to
emerging economies with open capital accounts, moderate to advanced economies, and weak to emerging economies with closed capital accounts.
B. Impulse Response Functions
Peak impulse response functions measure the maximum effects of selected structural shocks
on endogenous variables. The estimated peak impulse responses of consumption price
inflation, output, the real effective exchange rate, the ratio of the fiscal balance to nominal
output, and the ratio of the current account balance to nominal output to a variety of
structural shocks are plotted in Figure 26 through Figure 33 of Appendix B. The structural
shocks under consideration are foreign supply shocks, foreign private demand shocks,
foreign monetary policy shocks, foreign credit risk premium shocks, foreign duration risk
premium shocks, foreign equity risk premium shocks, foreign fiscal expenditure shocks, and
foreign fiscal revenue shocks.
In response to a supply shock which generates an increase in inflation and contraction of
output in a systemic economy, the currencies of recipient economies generally depreciate in
real effective terms. The effects on inflation and output in recipient economies are diverse, as
are the effects on their fiscal and current account balances. In response to a private demand
shock which generates an increase in inflation and expansion of output in a systemic
economy, there generally arise foreign demand driven increases in inflation and expansions
of output in recipient economies, accompanied by depreciations of their currencies in real
effective terms. As a result, their fiscal and current account balances tend to improve.
In response to a monetary policy shock which generates an increase in the nominal policy
interest rate in a systemic economy, the currencies of recipient economies generally
depreciate in real effective terms. There tend to arise terms of trade driven increases in
7/30/2019 IMF - Policy Analysis and Forecasting in the World Economy: A Panel Unobserved Components Approach
http://slidepdf.com/reader/full/imf-policy-analysis-and-forecasting-in-the-world-economy-a-panel-unobserved 28/77
27
inflation and foreign demand driven contractions of output in recipient economies, while
their fiscal and current account balances generally deteriorate.
In response to a credit risk premium shock which generates an increase in the short term
nominal market interest rate in a systemic economy, the short term nominal market interest
rates of recipient economies also generally increase, reflecting international money marketcontagion effects. As a result, there tend to arise decreases in inflation and contractions of
output in recipient economies, accompanied by deteriorations of their fiscal and current
account balances. In response to a duration risk premium shock which generates an increase
in the long term nominal market interest rate in a systemic economy, the long term nominal
market interest rates of recipient economies also generally increase, reflecting international
bond market contagion effects. As a result, there tend to arise decreases in inflation and
contractions of output in recipient economies, accompanied by deteriorations of their fiscal
and current account balances. In response to an equity risk premium shock which generates
an increase in the price of equity in a systemic economy, the prices of equity in recipient
economies also generally increase, reflecting international stock market contagion effects. Asa result, there tend to arise increases in inflation and expansions of output in recipient
economies, accompanied by improvements in their fiscal and current account balances.
In response to a fiscal expenditure shock which generates a deterioration in the fiscal balance
in a systemic economy, there generally arise foreign demand driven increases in inflation and
expansions of output in recipient economies, accompanied by depreciations of their
currencies in real effective terms. As a result, their fiscal and current account balances tend to
improve. In response to a fiscal revenue shock which generates an improvement in the fiscal
balance in a systemic economy, there generally arise foreign demand driven decreases in
inflation and contractions of output in recipient economies, accompanied by appreciations of their currencies in real effective terms. As a result, their fiscal and current account balances
tend to deteriorate.
It should be noted that the economies of Greece and Portugal, and to a lesser degree that of
Spain, are nearly dynamically unstable in our estimated panel unobserved components
model. To elaborate, in response to selected foreign shocks, notably foreign supply shocks
which cause large shifts in their terms of trade, these economies undergo disruptive internal
adjustments, in the form of large shifts in domestic demand, to maintain external debt
sustainability. This reflects their membership of a currency union in which low weights are
attached to cyclical stabilization of their target variables in the setting of monetary policy,combined with their low trade openness and high net foreign debt positions. In contrast, the
other economies in the Euro Area which have recently been subjected to severe financial
stress, namely Ireland and Italy, are not nearly dynamically unstable in the model, due in part
to their low net foreign debt positions.
7/30/2019 IMF - Policy Analysis and Forecasting in the World Economy: A Panel Unobserved Components Approach
http://slidepdf.com/reader/full/imf-policy-analysis-and-forecasting-in-the-world-economy-a-panel-unobserved 29/77
28
VI. FORECASTING
The world economy is complex, and any structural macroeconometric model of it is
necessarily misspecified to some extent, while any forecasts generated by such a model are
necessarily based on an incomplete information set. To mitigate these problems while
respecting monetary and fiscal policy relevant constraints, we employ a Bayesian forecastingprocedure which combines restricted forecasts generated with our estimated panel
unobserved components model with judgment.
A. Forecasting Procedure
Consider the linear state space model consisting of signal equations (38) and (40), and state
equation (39). Given initial conditions |T T z and |T T P , dynamic out of sample forecasts at
horizon h conditional on information available at time T , and judgment concerning the
paths of linear combinations of state variables through time 1T h , satisfy prediction
equations:
| 1 1 1| 1,T h T h T h T h z G z (60)
| 1 1 1| 1 1 2 4 2 ,T h T h T h T h P G P G G Σ G T T (61)
| 1 1 | 1,T h T h T h T h y F z (62)
| 1 1 | 1 1 ,T h T h T h T h Q F P F T (63)
| 1 1 | 1,T h T h T h T h w H z (64)
| 1 1 | 1 1 5, .T h T h T h T h T h R H P H Σ T (65)
Given these predictions, under the assumption of multivariate normally distributed signal and
state innovation vectors, dynamic out of sample forecasts at horizon h conditional on
information available at time T , and judgment concerning the paths of linear combinations
of state variables through time T h , satisfy Bayesian updating equations
| | 1 | 1( ),T hT h T h T h T h T h T h T h
w z z K w w (66)
| | 1 1 | 1,T hT h T h T h T h T h T h w P P K H P (67)
| 1 | ,T h T h T h T h y F z (68)
| 1 | 1 ,T h T h T h T h Q F P F T (69)
where1
| 1 1 | 1T h T h T h T h T h
w K P H RT
. Given terminal forecasts 1|ˆ
T H T H z 0 and
1|ˆ
T H T H P 0 , dynamic out of sample forecasts at horizon h conditional on information
available at time T , and judgment concerning the paths of linear combinations of state
variables through time T H , satisfy computationally efficient Bayesian smoothing
equations
1
| 1| 1 | 1 | 1ˆ ˆ ( ),T h T H T h T h T H T h T h T h T h T h
z J z H R w wT T (70)
7/30/2019 IMF - Policy Analysis and Forecasting in the World Economy: A Panel Unobserved Components Approach
http://slidepdf.com/reader/full/imf-policy-analysis-and-forecasting-in-the-world-economy-a-panel-unobserved 30/77
29
| | 1 | 1 |ˆ ,T h T H T h T h T h T h T h T H z z P z (71)
1
| 1| 1 | 1 1ˆ ˆ ,
T h T H T h T h T H T h T h T h
P J P J H R H T T
(72)
| | 1 | 1 | | 1ˆ ,
T h T H T h T h T h T h T h T H T h T h P P P P P (73)
| 1 | ,T h T H T h T H y F z (74)
| 1 | 1 ,T h T H T h T H Q F P F T (75)
where 1
1 | 1 1 | 1 1( )T h K T h T h T h T h
J G I P H R H T . Under our distributional assumptions,
recursive forward evaluation of equations (60) through (69), followed by recursive backward
evaluation of equations (70) through (75), yields mean squared error optimal conditional
forecasts.
B. Forecasting Results
We analyze the predictive accuracy of our panel unobserved components model for
consumption price inflation and output growth with sequential unconditional forecasts in
sample. We then generate conditional forecasts of these variables out of sample with
Bayesian updating, and analyze the revisions to unconditional forecasts resulting from
imposing judgment on them with conditional forecast decompositions. The results of this
forecasting exercise are plotted in Figure 34 through Figure 39.
Sequential Unconditional Forecasts
Sequential unconditional forecasts of inflation and output growth indicate that our panel
unobserved components model is capable of predicting business cycle turning points. Indeed,our sequential unconditional forecasts of output growth suggest that a synchronized global
moderation was overdue by the time of the global financial crisis. However, the model
generally underpredicted the severity of this synchronized global recession, while
overpredicting its disinflationary impact. While the model forecast the subsequent
synchronized global recovery, it systematically underpredicted its sluggishness in economies
undergoing balance sheet deleveraging such as Spain, the United Kingdom and the United
States, due in part to violation of the zero lower bound constraint on the nominal policy
interest rate.
Conditional Forecasts
We generate forecasts of inflation and output growth conditional on monetary and fiscal
policy relevant constraints, and judgment concerning the paths of these variables. These
combined forecasts are recursive weighted averages of restricted forecasts generated with our
panel unobserved components model, and judgmental forecasts produced by the International
Monetary Fund. To facilitate comparability with the World Economic Outlook of January
2012, the restricted forecasts are generated subject to constant real effective exchange rates,
7/30/2019 IMF - Policy Analysis and Forecasting in the World Economy: A Panel Unobserved Components Approach
http://slidepdf.com/reader/full/imf-policy-analysis-and-forecasting-in-the-world-economy-a-panel-unobserved 31/77
30
and common assumptions concerning the paths of energy and nonenergy commodity prices.
They are also generated subject to the zero lower bound constraint on the nominal policy
interest rate in the Euro Area, Japan, the United Kingdom, and the United States. The weight
assigned to these restricted forecasts is decreasing in the objective uncertainty surrounding
them, measured by their time varying forecast error covariance matrix, and is increasing in
the subjective uncertainty associated with the judgmental forecasts, represented by the sameforecast error covariance matrix, rescaled by a factor of 2
2.
The combined forecasts of inflation and output growth generally lie between the restricted
forecasts and the judgmental forecasts, while the restricted forecasts tend to lie slightly below
the unrestricted forecasts. These alternative forecasts generally have similar profiles, and
point towards a temporary moderation of the synchronized global recovery. But the restricted
forecasts tend to be more optimistic with regards to output growth prospects than the World
Economic Outlook.
Conditional Forecast Decompositions
Our conditional forecast decompositions measure the contributions of different structural
shocks to revisions to the unrestricted forecasts of inflation and output growth given the
deterministic restrictions imposed in generating the restricted forecasts, and to these
restricted forecasts given the stochastic restrictions imposed in representing the judgmental
forecasts. These conditional forecast decompositions are estimated by the difference between
unconditional forecast decompositions of the combined and unrestricted forecasts, which in
turn are estimated by out of sample extensions of unconditional historical decompositions.
The effects on the unrestricted forecasts of inflation and output growth of conditioning on
constant real effective exchange rates, given paths for energy and nonenergy commodity
prices, and the zero lower bound constraint on the nominal policy interest rate are primarily
measured by contributions from world risk premium shocks, world terms of trade shocks,
and world monetary policy shocks, respectively. While imposing the zero lower bound
constraint on the nominal policy interest rate is generally disinflationary and contractionary,
the effects of imposing the other deterministic restrictions are of variable sign. The effects on
the restricted forecasts of conditioning on judgment concerning the paths of inflation and
output growth are primarily measured by contributions from domestic supply shocks and
domestic private demand shocks. While domestic supply shocks of variable sign tend to
account for most of the persistent discrepancies between the restricted and judgmental
forecasts, negative domestic private demand shocks account for much in economies
undergoing balance sheet deleveraging, with substantial spillovers to close trading partners.
VII. CONCLUSION
This paper develops a structural macroeconometric model of the world economy,
disaggregated into thirty five national economies. A variety of monetary policy analysis,
7/30/2019 IMF - Policy Analysis and Forecasting in the World Economy: A Panel Unobserved Components Approach
http://slidepdf.com/reader/full/imf-policy-analysis-and-forecasting-in-the-world-economy-a-panel-unobserved 32/77
31
fiscal policy analysis, spillover analysis, and forecasting applications of the estimated model
are demonstrated. These include accounting for business cycle fluctuations, quantifying the
monetary and fiscal transmission mechanisms, and generating conditional forecasts of
inflation and output growth. They are based on a Bayesian framework for conditioning on
judgment in estimation and forecasting.
This panel unobserved components model consolidates much existing theoretical and
empirical knowledge concerning business cycle dynamics in the world economy, provides a
framework for a progressive research strategy, and suggests explanations for its own
deficiencies. In particular, the structural interpretations of some of the orthogonal shocks
driving variation in cyclical components are ambiguous, and strengthening the
microeconomic foundations of the model remains an objective for future research. In
addition, a more sophisticated procedure for generating judgment concerning the paths of
trend components which accounts for structural breaks associated with financial crises seems
warranted.

7/30/2019 IMF - Policy Analysis and Forecasting in the World Economy: A Panel Unobserved Components Approach
http://slidepdf.com/reader/full/imf-policy-analysis-and-forecasting-in-the-world-economy-a-panel-unobserved 33/77
32
Appendix A. Description of the Data Set
Estimation is based on quarterly data on several macroeconomic and financial market
variables for thirty five economies over the sample period 1999Q1 through 2011Q3. The
economies under consideration are Argentina, Australia, Austria, Belgium, Brazil, Canada,
China, the Czech Republic, Denmark, Finland, France, Germany, Greece, India, Indonesia,Ireland, Italy, Japan, Korea, Mexico, the Netherlands, New Zealand, Norway, Poland,
Portugal, Russia, Saudi Arabia, South Africa, Spain, Sweden, Switzerland, Thailand, Turkey,
the United Kingdom, and the United States. Where available, this data was obtained from the
GDS and WEO databases compiled by the International Monetary Fund. Otherwise, it was
extracted from the IFS database compiled by the International Monetary Fund, or the CEIC
database produced by Internet Securities Incorporated, or the EMED database produced by
Emerging Markets Economic Data Limited.
The macroeconomic variables under consideration are the price of output, the price of
consumption, the quantity of output, the quantity of domestic demand, the quantity of publicdomestic demand, the ratio of the fiscal balance to nominal output, the ratio of the current
account balance to nominal output, and the prices of energy and nonenergy commodities.
The price of output is measured by the seasonally adjusted gross domestic product price
deflator, while the price of consumption is proxied by the seasonally adjusted consumer price
index. The quantity of output is measured by seasonally adjusted real gross domestic product,
while the quantity of domestic demand is measured by the sum of seasonally adjusted real
consumption and investment expenditures, and the quantity of public domestic demand is
measured by the sum of quadratically interpolated annual real consumption and investment
expenditures of the general government. The fiscal balance is measured by the quadratically
interpolated annual overall fiscal balance of the general government, while the current
account balance is measured by the quadratically interpolated annual current account
balance. The prices of energy and nonenergy commodities are proxied by broad commodity
price indexes denominated in United States dollars.
The financial market variables under consideration are the nominal policy interest rate, the
short term nominal market interest rate, the long term nominal market interest rate, the price
of equity, and the nominal bilateral exchange rate. The nominal policy interest rate is
measured by the central bank discount rate, expressed as a period average. The short term
nominal market interest rate is measured by a three month money market rate, expressed as a
period average. The long term nominal market interest rate is measured by the ten year
government bond yield where available, and a ten year commercial bank lending rate
otherwise, expressed as a period average. The price of equity is proxied by a broad stock
price index denominated in domestic currency units. The nominal bilateral exchange rate is
measured by the domestic currency price of one United States dollar expressed as a period
average.

7/30/2019 IMF - Policy Analysis and Forecasting in the World Economy: A Panel Unobserved Components Approach
http://slidepdf.com/reader/full/imf-policy-analysis-and-forecasting-in-the-world-economy-a-panel-unobserved 34/77
33
Calibration is based on annual data obtained from databases compiled by the International
Monetary Fund where available, and from the Bank for International Settlements or the
World Bank Group otherwise. Great ratios are derived from the WEO and WDI databases.
Bilateral trade weights are derived from the DOTS database. Portfolio weights are derived
from the CPIS, BIS, and WDI databases.
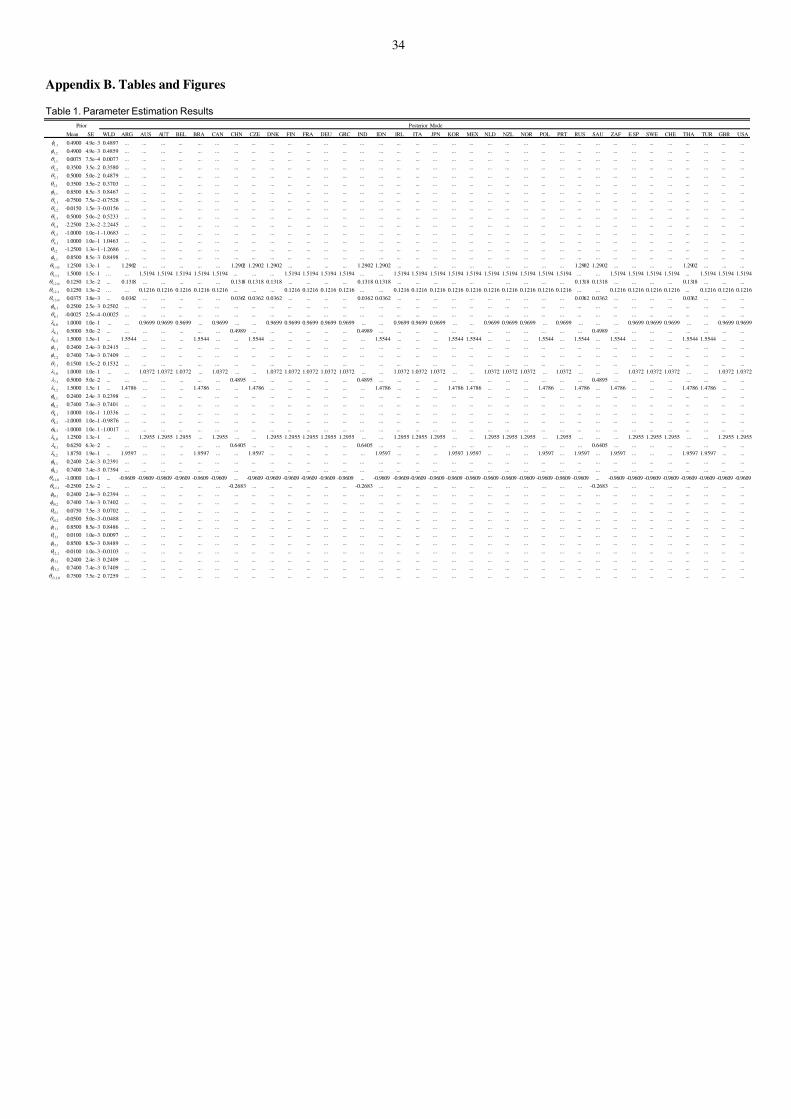
7/30/2019 IMF - Policy Analysis and Forecasting in the World Economy: A Panel Unobserved Components Approach
http://slidepdf.com/reader/full/imf-policy-analysis-and-forecasting-in-the-world-economy-a-panel-unobserved 35/77
34
Appendix B. Tables and Figures
Table 1. Parameter Estimation Results
Prior Posterior Mode
Mean SE WLD ARG AUS AUT BEL BRA CAN CHN CZE DNK FIN FRA DEU GRC IND IDN IRL ITA JPN KOR MEX NLD NZL NOR POL PRT RUS SAU ZAF E SP SWE CHE THA TUR GBR USA
1,1 0.4900 4.9e – 3 0.4897 ... ... ... ... ... ... ... ... ... ... ... ... ... ... ... ... ... ... ... ... ... ... ... ... ... ... ... ... ... ... ... ... ... ... ...
1,2 0.4900 4.9e – 3 0.4859 ... ... ... ... ... ... ... ... ... ... ... ... ... ... ... ... ... ... ... ... ... ... ... ... ... ... ... ... ... ... ... ... ... ... ...
1,1 0.0075 7.5e – 4 0.0077 ... ... ... ... ... ... ... ... ... ... ... ... ... ... ... ... ... ... ... ... ... ... ... ... ... ... ... ... ... ... ... ... ... ... ...
1,2 0.3500 3.5e – 2 0.3580 ... ... ... ... ... ... ... ... ... ... ... ... ... ... ... ... ... ... ... ... ... ... ... ... ... ... ... ... ... ... ... ... ... ... ...
2,1 0.5000 5.0e – 2 0.4879 ... ... ... ... ... ... ... ... ... ... ... ... ... ... ... ... ... ... ... ... ... ... ... ... ... ... ... ... ... ... ... ... ... ... ...
2,2 0.3500 3.5e – 2 0.3703 ... ... ... ... ... ... ... ... ... ... ... ... ... ... ... ... ... ... ... ... ... ... ... ... ... ... ... ... ... ... ... ... ... ... ...
3,1 0.8500 8.5e – 3 0.8467 ... ... ... ... ... ... ... ... ... ... ... ... ... ... ... ... ... ... ... ... ... ... ... ... ... ... ... ... ... ... ... ... ... ... ...
3,1 -0.7500 7.5e – 2 -0.7528 ... ... ... ... ... ... ... ... ... ... ... ... ... ... ... ... ... ... ... ... ... ... ... ... ... ... ... ... ... ... ... ... ... ... ...
3,2 -0.0150 1.5e – 3 -0.0156 ... ... ... ... ... ... ... ... ... ... ... ... ... ... ... ... ... ... ... ... ... ... ... ... ... ... ... ... ... ... ... ... ... ... ...
3,3 0.5000 5.0e – 2 0.5233 ... ... ... ... ... ... ... ... ... ... ... ... ... ... ... ... ... ... ... ... ... ... ... ... ... ... ... ... ... ... ... ... ... ... ...
3,4 -2.2500 2.3e – 2 -2.2445 ... ... ... ... ... ... ... ... ... ... ... ... ... ... ... ... ... ... ... ... ... ... ... ... ... ... ... ... ... ... ... ... ... ... ...
3,5 -1.0000 1.0e – 1 -1.0683 ... ... ... ... ... ... ... ... ... ... ... ... ... ... ... ... ... ... ... ... ... ... ... ... ... ... ... ... ... ... ... ... ... ... ...
4,1 1.0000 1.0e – 1 1.0463 ... ... ... ... ... ... ... ... ... ... ... ... ... ... ... ... ... ... ... ... ... ... ... ... ... ... ... ... ... ... ... ... ... ... ...
4,2 -1.2500 1.3e – 1 -1.2686 ... ... ... ... ... ... ... ... ... ... ... ... ... ... ... ... ... ... ... ... ... ... ... ... ... ... ... ... ... ... ... ... ... ... ...
5,1 0.8500 8.5e – 3 0.8498 ... ... ... ... ... ... ... ... ... ... ... ... ... ... ... ... ... ... ... ... ... ... ... ... ... ... ... ... ... ... ... ... ... ... ...
5,1,0 1.2500 1.3e – 1 ... 1.2902 ... ... ... ... ... 1.2902 1.2902 1.2902 ... ... ... ... 1.2902 1.2902 ... ... ... ... ... ... ... ... ... ... 1.2902 1.2902 ... ... ... ... 1.2902 ... ... ...
5,1,1 1.5000 1.5e – 1 . .. ... 1.5194 1.5194 1.5194 1.5194 1.5194 ... ... ... 1.5194 1.5194 1.5194 1.5194 ... ... 1.5194 1.5194 1.5194 1.5194 1.5194 1.5194 1.5194 1.5194 1.5194 1.5194 ... ... 1.5194 1.5194 1.5194 1.5194 ... 1.5194 1.5194 1.5194
5,2,0 0.1250 1.3e – 2 ... 0.1318 ... ... ... ... ... 0.1318 0.1318 0.1318 ... ... ... ... 0.1318 0.1318 ... ... ... ... ... ... ... ... ... ... 0.1318 0.1318 ... ... ... ... 0.1318 ... ... ...
5,2,1 0.1250 1.3e – 2 . .. ... 0.1216 0.1216 0.1216 0.1216 0.1216 ... ... ... 0.1216 0.1216 0.1216 0.1216 ... ... 0.1216 0.1216 0.1216 0.1216 0.1216 0.1216 0.1216 0.1216 0.1216 0.1216 ... ... 0.1216 0.1216 0.1216 0.1216 ... 0.1216 0.1216 0.1216
5,3,0 0.0375 3.8e – 3 ... 0.0362 ... ... ... ... ... 0.0362 0.0362 0.0362 ... ... ... ... 0.0362 0.0362 ... ... ... ... ... ... ... ... ... ... 0.0362 0.0362 ... ... ... ... 0.0362 ... ... ...
6,1 0.2500 2.5e – 3 0.2502 ... ... ... ... ... ... ... ... ... ... ... ... ... ... ... ... ... ... ... ... ... ... ... ... ... ... ... ... ... ... ... ... ... ... ...
6,1 -0.0025 2.5e – 4 -0.0025 ... ... ... ... ... ... ... ... ... ... ... ... ... ... ... ... ... ... ... ... ... ... ... ... ... ... ... ... ... ... ... ... ... ... ...
6,0 1.0000 1.0e – 1 ... ... 0.9699 0.9699 0.9699 ... 0.9699 ... ... 0.9699 0.9699 0.9699 0.9699 0.9699 ... ... 0.9699 0.9699 0.9699 ... ... 0.9699 0.9699 0.9699 ... 0.9699 ... ... ... 0.9699 0.9699 0.9699 ... ... 0.9699 0.9699
6,1 0.5000 5.0e – 2 ... ... ... ... ... ... ... 0.4989 ... ... ... ... ... ... 0.4989 ... ... ... ... ... ... ... ... ... ... ... ... 0.4989 ... ... ... ... ... ... ... ...
6,2 1.5000 1.5e – 1 ... 1.5544 ... ... ... 1.5544 ... ... 1.5544 ... ... ... ... ... ... 1.5544 ... ... ... 1.5544 1.5544 ... ... ... 1.5544 ... 1.5544 ... 1.5544 ... ... ... 1.5544 1.5544 ... ...
7,1 0.2400 2.4e – 3 0.2415 ... ... ... ... ... ... ... ... ... ... ... ... ... ... ... ... ... ... ... ... ... ... ... ... ... ... ... ... ... ... ... ... ... ... ...
7,2 0.7400 7.4e – 3 0.7409 ... ... ... ... ... ... ... ... ... ... ... ... ... ... ... ... ... ... ... ... ... ... ... ... ... ... ... ... ... ... ... ... ... ... ...
7,1 0.1500 1.5e – 2 0.1532 ... ... ... ... ... ... ... ... ... ... ... ... ... ... ... ... ... ... ... ... ... ... ... ... ... ... ... ... ... ... ... ... ... ... ...
7,0 1.0000 1.0e – 1 ... ... 1.0372 1.0372 1.0372 ... 1.0372 ... ... 1.0372 1.0372 1.0372 1.0372 1.0372 ... ... 1.0372 1.0372 1.0372 ... ... 1.0372 1.0372 1.0372 ... 1.0372 ... ... ... 1.0372 1.0372 1.0372 ... ... 1.0372 1.0372
7,1 0.5000 5.0e – 2 ... ... ... ... ... ... ... 0.4895 ... ... ... ... ... ... 0.4895 ... ... ... ... ... ... ... ... ... ... ... ... 0.4895 ... ... ... ... ... ... ... ...
7,2 1.5000 1.5e – 1 ... 1.4786 ... ... ... 1.4786 ... ... 1.4786 ... ... ... ... ... ... 1.4786 ... ... ... 1.4786 1.4786 ... ... ... 1.4786 ... 1.4786 ... 1.4786 ... ... ... 1.4786 1.4786 ... ...
8,1 0.2400 2.4e – 3 0.2398 ... ... ... ... ... ... ... ... ... ... ... ... ... ... ... ... ... ... ... ... ... ... ... ... ... ... ... ... ... ... ... ... ... ... ...
8,2 0.7400 7.4e – 3 0.7401 ... ... ... ... ... ... ... ... ... ... ... ... ... ... ... ... ... ... ... ... ... ... ... ... ... ... ... ... ... ... ... ... ... ... ...
8,1 1.0000 1.0e – 1 1.0336 ... ... ... ... ... ... ... ... ... ... ... ... ... ... ... ... ... ... ... ... ... ... ... ... ... ... ... ... ... ... ... ... ... ... ...
8,2 -1.0000 1.0e – 1 -0.9876 ... ... ... ... ... ... ... ... ... ... ... ... ... ... ... ... ... ... ... ... ... ... ... ... ... ... ... ... ... ... ... ... ... ... ...
8,3 -1.0000 1.0e – 1 -1.0017 ... ... ... ... ... ... ... ... ... ... ... ... ... ... ... ... ... ... ... ... ... ... ... ... ... ... ... ... ... ... ... ... ... ... ...
8,0 1.2500 1.3e – 1 ... ... 1.2955 1.2955 1.2955 ... 1.2955 ... ... 1.2955 1.2955 1.2955 1.2955 1.2955 ... ... 1.2955 1.2955 1.2955 ... ... 1.2955 1.2955 1.2955 ... 1.2955 ... ... ... 1.2955 1.2955 1.2955 ... ... 1.2955 1.2955
8,1 0.6250 6.3e – 2 ... ... ... ... ... ... ... 0.6405 ... ... ... ... ... ... 0.6405 ... ... ... ... ... ... ... ... ... ... ... ... 0.6405 ... ... ... ... ... ... ... ...
8,2 1.8750 1.9e – 1 ... 1.9597 ... ... ... 1.9597 ... ... 1.9597 ... ... ... ... ... ... 1.9597 ... ... ... 1.9597 1.9597 ... ... ... 1.9597 ... 1.9597 ... 1.9597 ... ... ... 1.9597 1.9597 ... ...
9,1 0.2400 2.4e – 3 0.2391 ... ... ... ... ... ... ... ... ... ... ... ... ... ... ... ... ... ... ... ... ... ... ... ... ... ... ... ... ... ... ... ... ... ... ...
9,2 0.7400 7.4e – 3 0.7394 ... ... ... ... ... ... ... ... ... ... ... ... ... ... ... ... ... ... ... ... ... ... ... ... ... ... ... ... ... ... ... ... ... ... ...
9,1,0 -1.0000 1.0e – 1 ... -0.9609 -0.9609 -0.9609 -0.9609 -0.9609 -0.9609 ... -0.9609 -0.9609 -0.9609 -0.9609 -0.9609 -0.9609 ... -0.9609 -0.9609 -0.9609 -0.9609 -0.9609 -0.9609 -0.9609 -0.9609 -0.9609 -0.9609 -0.9609 -0.9609 ... -0.9609 -0.9609 -0.9609 -0.9609 -0.9609 -0.9609 -0.9609 -0.9609
9,1,1 -0.2500 2.5e – 2 ... ... ... ... ... ... ... -0.2683 ... ... ... ... ... ... -0.2683 ... ... ... ... ... ... ... ... ... ... ... ... -0.2683 ... ... ... ... ... ... ... ...
10,1 0.2400 2.4e – 3 0.2394 ... ... ... ... ... ... ... ... ... ... ... ... ... ... ... ... ... ... ... ... ... ... ... ... ... ... ... ... ... ... ... ... ... ... ...
10,2 0.7400 7.4e – 3 0.7402 ... ... ... ... ... ... ... ... ... ... ... ... ... ... ... ... ... ... ... ... ... ... ... ... ... ... ... ... ... ... ... ... ... ... ...
10,1 0.0750 7.5e – 3 0.0702 ... ... ... ... ... ... ... ... ... ... ... ... ... ... ... ... ... ... ... ... ... ... ... ... ... ... ... ... ... ... ... ... ... ... ...
10,2 -0.0500 5.0e – 3 -0.0488 ... ... ... ... ... ... ... ... ... ... ... ... ... ... ... ... ... ... ... ... ... ... ... ... ... ... ... ... ... ... ... ... ... ... ...
11,1 0.8500 8.5e – 3 0.8486 ... ... ... ... ... ... ... ... ... ... ... ... ... ... ... ... ... ... ... ... ... ... ... ... ... ... ... ... ... ... ... ... ... ... ...
11,1 0.0100 1.0e – 3 0.0097 ... ... ... ... ... ... ... ... ... ... ... ... ... ... ... ... ... ... ... ... ... ... ... ... ... ... ... ... ... ... ... ... ... ... ...
12,1 0.8500 8.5e – 3 0.8489 ... ... ... ... ... ... ... ... ... ... ... ... ... ... ... ... ... ... ... ... ... ... ... ... ... ... ... ... ... ... ... ... ... ... ...
12,1 -0.0100 1.0e – 3 -0.0103 ... ... ... ... ... ... ... ... ... ... ... ... ... ... ... ... ... ... ... ... ... ... ... ... ... ... ... ... ... ... ... ... ... ... ...
13,1 0.2400 2.4e – 3 0.2409 ... ... ... ... ... ... ... ... ... ... ... ... ... ... ... ... ... ... ... ... ... ... ... ... ... ... ... ... ... ... ... ... ... ... ...
13,2 0.7400 7.4e – 3 0.7409 ... ... ... ... ... ... ... ... ... ... ... ... ... ... ... ... ... ... ... ... ... ... ... ... ... ... ... ... ... ... ... ... ... ... ...
13,1,0 0.7500 7.5e – 2 0.7259 ... ... ... ... ... ... ... ... ... ... ... ... ... ... ... ... ... ... ... ... ... ... ... ... ... ... ... ... ... ... ... ... ... ... ...
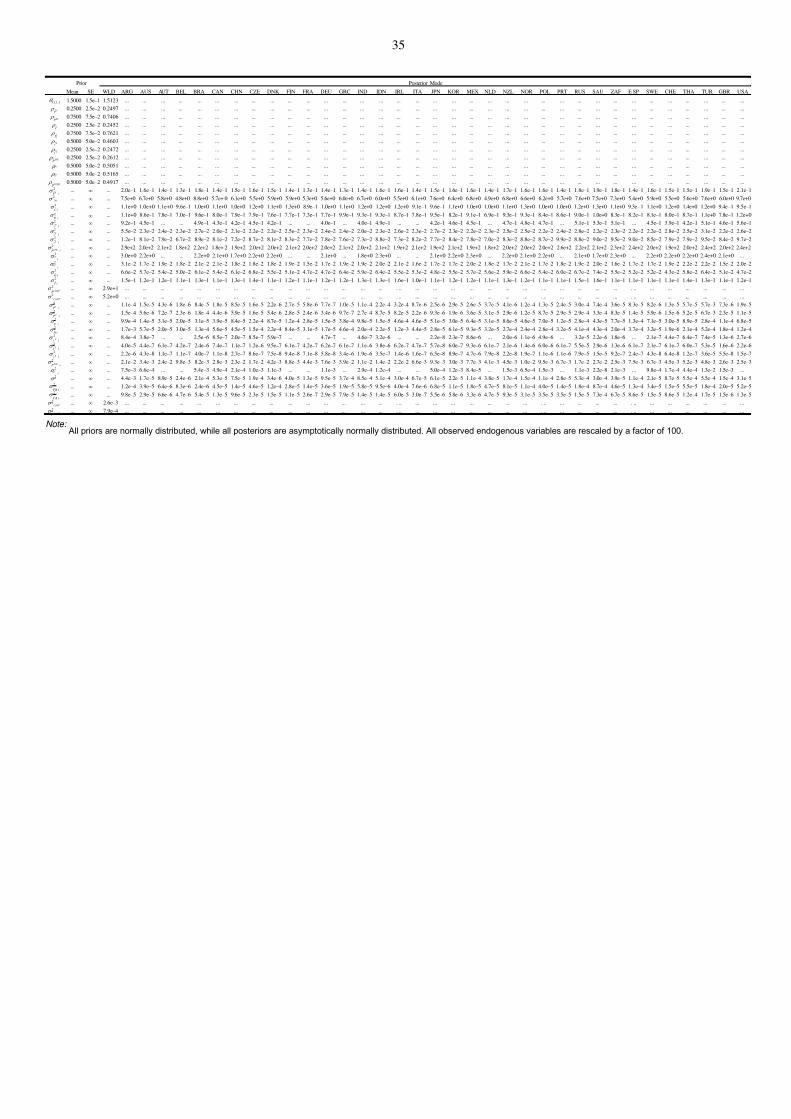
7/30/2019 IMF - Policy Analysis and Forecasting in the World Economy: A Panel Unobserved Components Approach
http://slidepdf.com/reader/full/imf-policy-analysis-and-forecasting-in-the-world-economy-a-panel-unobserved 36/77
35
Prior Posterior Mode
Mean SE WLD ARG AUS AUT BEL BRA CAN CHN CZE DNK FIN FRA DEU GRC IND IDN IRL ITA JPN KOR MEX NLD NZL NOR POL PRT RUS SAU ZAF E SP SWE CHE THA TUR GBR USA
13,1,1 1.5000 1.5e – 1 1.5123 ... ... ... ... ... ... ... ... ... ... ... ... ... ... ... ... ... ... ... ... ... ... ... ... ... ... ... ... ... ... ... ... ... ... ...
ˆ Y P
0.2500 2.5e – 2 0.2497 ... ... ... ... ... ... ... ... ... ... ... ... ... ... ... ... ... ... ... ... ... ... ... ... ... ... ... ... ... ... ... ... ... ... ...
ˆ M P 0.7500 7.5e – 2 0.7406 ... ... ... ... ... ... ... ... ... ... ... ... ... ... ... ... ... ... ... ... ... ... ... ... ... ... ... ... ... ... ... ... ... ... ...
ˆC 0.2500 2.5e – 2 0.2452 ... ... ... ... ... ... ... ... ... ... ... ... ... ... ... ... ... ... ... ... ... ... ... ... ... ... ... ... ... ... ... ... ... ... ...
ˆ X 0.7500 7.5e – 2 0.7621 ... ... ... ... ... ... ... ... ... ... ... ... ... ... ... ... ... ... ... ... ... ... ... ... ... ... ... ... ... ... ... ... ... ... ...
ˆS i
0.5000 5.0e – 2 0.4603 ... ... ... ... ... ... ... ... ... ... ... ... ... ... ... ... ... ... ... ... ... ... ... ... ... ... ... ... ... ... ... ... ... ... ...
Li
0.2500 2.5e – 2 0.2472 ... ... ... ... ... ... ... ... ... ... ... ... ... ... ... ... ... ... ... ... ... ... ... ... ... ... ... ... ... ... ... ... ... ... ...
ˆ STK P
0.2500 2.5e – 2 0.2612 ... ... ... ... ... ... ... ... ... ... ... ... ... ... ... ... ... ... ... ... ... ... ... ... ... ... ... ... ... ... ... ... ... ... ...
ˆ 0.5000 5.0e – 2 0.5051 ... ... ... ... ... ... ... ... ... ... ... ... ... ... ... ... ... ... ... ... ... ... ... ... ... ... ... ... ... ... ... ... ... ... ...
ˆ 0.5000 5.0e – 2 0.5165 ... ... ... ... ... ... ... ... ... ... ... ... ... ... ... ... ... ... ... ... ... ... ... ... ... ... ... ... ... ... ... ... ... ... ...
ˆCOM P
0.5000 5.0e – 2 0.4917 ... ... ... ... ... ... ... ... ... ... ... ... ... ... ... ... ... ... ... ... ... ... ... ... ... ... ... ... ... ... ... ... ... ... ...2
ˆ Y P i
... ... 2.0e – 1 1.6e – 1 1.4e – 1 1.3e – 1 1.8e – 1 1.4e – 1 1.5e – 1 1.6e – 1 1.5e – 1 1.4e – 1 1.3e – 1 1.4e – 1 1.3e – 1 1.4e – 1 1.6e – 1 1.6e – 1 1.4e – 1 1.5e – 1 1.6e – 1 1.6e – 1 1.4e – 1 1.7e – 1 1.6e – 1 1.6e – 1 1.4e – 1 1.8e – 1 1.9e – 1 1.8e – 1 1.4e – 1 1.6e – 1 1.5e – 1 1.5e – 1 1.9e – 1 1.5e – 1 2.1e – 12
M ... ... 7.5e+0 6.7e+0 5.8e+0 4.8e+0 8.8e+0 5.7e+ 0 6.1e+0 5.5e+0 5.9e+0 5.9e+0 5.3e+0 5.6e+0 6.0e+0 6.7e+0 6.0e+0 5.5e+0 6.1e+0 7.6e+0 6.4e+0 6.8e+0 4.9e+0 6.8e+0 6.6e+0 6.2e+0 5.7e+0 7.6e+0 7.5e+0 7.3e+0 5.4e+0 5.9e+0 5.5e+0 5.6e+0 7.6e+0 6.0e+0 9.7e+02
ˆC i ... ... 1.1e+0 1.0e+0 1.1e+0 9.6e – 1 1.0e+0 1.1e+0 1.0e+0 1.2e+0 1.1e+0 1.3e+0 8.9e – 1 1.0e+0 1.1e+0 1.2e+0 1.2e+0 1.2e+0 9.1e – 1 9.6e – 1 1.1e+0 1.0e+0 1.0e+0 1.1e+0 1.3e+0 1.0e+0 1.0e+0 1.2e+0 1.3e+0 1.1e+0 9.3e – 1 1.1e+0 1.2e+0 1.4e+0 1.2e+0 9.4e – 1 9.5e – 1
2ˆ X i
... ... 1.1e+0 8.6e – 1 7.8e – 1 7.0e – 1 9.6e – 1 8.0e – 1 7.9e – 1 7.9e – 1 7.6e – 1 7.7e – 1 7.3e – 1 7.7e – 1 9.9e – 1 9.3e – 1 9.3e – 1 8.7e – 1 7.8e – 1 9.5e – 1 8.2e – 1 9.1e – 1 6.9e – 1 9.3e – 1 9.3e – 1 8.4e – 1 8.6e – 1 9.0e – 1 1.0e+0 8.3e – 1 8.2e – 1 8.1e – 1 8.0e – 1 8.7e – 1 1.1e+0 7.8e – 1 1.2e+02
ˆPi i
... ... 9.2e – 1 4.5e – 1 ... ... 4.9e – 1 4.3e – 1 4.2e – 1 4.5e – 1 4.2e – 1 ... ... 4.0e – 1 ... 4.0e – 1 4.9e – 1 ... ... 4.2e – 1 4.6e – 1 4.5e – 1 ... 4.7e – 1 4.8e – 1 4.7e – 1 ... 5.1e – 1 5.3e – 1 5.1e – 1 ... 4.5e – 1 3.9e – 1 4.2e – 1 5.1e – 1 4.6e – 1 5.6e – 12
ˆS i i
... ... 5.5e – 2 2.3e – 2 2.4e – 2 2.3e – 2 2.7e – 2 2.0e – 2 2.1e – 2 2.2e – 2 2.2e – 2 2.5e – 2 2.3e – 2 2.4e – 2 2.4e – 2 2.0e – 2 2.3e – 2 2.6e – 2 2.3e – 2 2.7e – 2 2.3e – 2 2.2e – 2 2.3e – 2 2.5e – 2 2.5e – 2 2.2e – 2 2.4e – 2 2.8e – 2 2.2e – 2 2.3e – 2 2.2e – 2 2.2e – 2 2.8e – 2 2.5e – 2 3.1e – 2 2.2e – 2 2.6e – 22 Li i
... ... 1.2e – 1 8.1e – 2 7.9e – 2 6.7e – 2 8.9e – 2 8.1e – 2 7.2e – 2 8.7e – 2 8.1e – 2 8.3e – 2 7.7e – 2 7.8e – 2 7.6e – 2 7.3e – 2 8.8e – 2 7.3e – 2 8.2e – 2 7.7e – 2 8.4e – 2 7.8e – 2 7.0e – 2 8.3e – 2 8.8e – 2 8.7e – 2 9.9e – 2 8.8e – 2 9.0e – 2 9.5e – 2 9.0e – 2 8.5e – 2 7.9e – 2 7.9e – 2 9.5e – 2 8.4e – 2 9.7e – 22
ˆ STK P i ... ... 2.9e+2 2.0e+2 2.1e+2 1.8e+2 2.2e+2 1.8e+ 2 1.9e+2 2.0e+2 2.0e+2 2.1e+2 2.0e+2 2.0e+2 2.1e+2 2.0e+2 2.1e+2 1.9e+2 2.1e+2 1.9e+2 2.1e+2 1.9e+2 1.8e+2 2.0e+2 2.0e+2 2.0e+2 2.6e+2 2.2e+2 2.1e+2 2.3e+2 2.4e+2 2.0e+2 1.9e+2 2.0e+2 2.4e+2 2.0e+2 2.4e+2
2
ˆ i ... ... 3.0e+0 2.2e+0 ... ... 2.2e+0 2.1e+0 1.7e+0 2.2e+0 2.2e+0 ... ... 2.1e+0 ... 1.8e+0 2.3e+0 ... ... 2.1e+0 2.2e+0 2.3e+0 ... 2.2e+0 2.1e+0 2.2e+0 ... 2.1e+0 1.7e+0 2.3e+0 ... 2.2e+0 2.2e+0 2.2e+0 2.4e+0 2.1e+0 ...
2
ˆ i ... ... 3.1e – 2 1.7e – 2 1.9e – 2 1.8e – 2 2.1e – 2 2.1e – 2 1.8e – 2 1.8e – 2 1.8e – 2 1.9e – 2 1.5e – 2 1.7e – 2 1.9e – 2 1.9e – 2 2.0e – 2 2.1e – 2 1.6e – 2 1.7e – 2 1.7e – 2 2.0e – 2 1.8e – 2 1.7e – 2 2.1e – 2 1.7e – 2 1.8e – 2 1.9e – 2 2.0e – 2 1.6e – 2 1.7e – 2 1.7e – 2 1.9e – 2 2.2e – 2 2.2e – 2 1.5e – 2 2.0e – 2
2
ˆG i ... ... 6.6e – 2 5.7e – 2 5.4e – 2 5.0e – 2 6.1e – 2 5.4e – 2 6.1e – 2 6.8e – 2 5.5e – 2 5.1e – 2 4.7e – 2 4.7e – 2 6.4e – 2 5.9e – 2 6.4e – 2 5.5e – 2 5.3e – 2 4.8e – 2 5.5e – 2 5.7e – 2 5.6e – 2 5.9e – 2 6.6e – 2 5.4e – 2 6.0e – 2 6.7e – 2 7.4e – 2 5.5e – 2 5.2e – 2 5.2e – 2 4.3e – 2 5.8e – 2 6.4e – 2 5.1e – 2 4.7e – 2
2
ˆT i ... ... 1.5e – 1 1.2e – 1 1.2e – 1 1.1e – 1 1.3e – 1 1.1e – 1 1.3e – 1 1.4e – 1 1.1e – 1 1.2e – 1 1.1e – 1 1.2e – 1 1.2e – 1 1.3e – 1 1.3e – 1 1.6e – 1 1.0e – 1 1.1e – 1 1.2e – 1 1.2e – 1 1.1e – 1 1.3e – 1 1.2e – 1 1.1e – 1 1.1e – 1 1.5e – 1 1.6e – 1 1.1e – 1 1.1e – 1 1.1e – 1 1.1e – 1 1.4e – 1 1.3e – 1 1.1e – 1 1.2e – 12
ˆeCOM P
... 2.9e+1 ... ... ... ... ... ... ... ... ... ... ... ... ... ... ... . .. ... ... ... ... ... ... ... . .. ... ... ... ... . .. ... ... ... ... ... ...2
ˆnCOM
... 5.2e+0 ... ... ... ... ... ... ... ... ... ... ... ... ... ... ... . .. ... ... ... ... ... ... ... . .. ... ... ... ... . .. ... ... ... ... ... ...2
Y P i ... ... 1.1e – 4 1.5e – 5 4.3e – 6 1.8e – 6 8.4e – 5 1.8e – 5 8.5e – 5 1.6e – 5 2.2e – 6 2.7e – 5 5.8e – 6 7.7e – 7 1.0e – 5 1.1e – 4 2.2e – 4 3.2e – 4 8.7e – 6 2.5e – 6 2.9e – 5 2.6e – 5 3.7e – 5 4.1e – 6 1.2e – 4 1.3e – 5 2.4e – 5 3.0e – 4 7.4e – 4 3.6e – 5 8.3e – 5 8.2e – 6 1.3e – 5 5.7e – 5 5.7e – 3 7.3e – 6 1.9e – 5
2C P i
... ... 1.5e – 4 5.6e – 6 7.2e – 7 2.3e – 6 1.8e – 4 4.4e – 6 5.9e – 5 1.6e – 5 5.4e – 6 2.8e – 5 2.4e – 6 3.4e – 6 9.7e – 7 2.7e – 4 8.7e – 5 8.2e – 5 2.2e – 6 9.3e – 6 1.9e – 6 3.6e – 5 3.1e – 5 2.9e – 6 1.2e – 5 8.7e – 5 2.9e – 5 2.9e – 4 3.3e – 4 8.3e – 5 1.4e – 5 5.9e – 6 1.5e – 6 5.2e – 5 6.7e – 3 2.3e – 5 1.1e – 52
Y i ... ... 9.9e – 4 1.4e – 5 3.1e – 5 2.0e – 5 3.1e – 5 3.9e – 5 8.4e – 5 2.2e – 4 8.7e – 5 1.2e – 4 2.8e – 5 1.5e – 5 3.8e – 4 9.8e – 5 1.5e – 5 4.6e – 4 4.6e – 5 5.1e – 5 3.0e – 5 6.4e – 5 3.1e – 5 8.6e – 5 4.6e – 5 7.0e – 5 1.2e – 5 2.8e – 4 4.3e – 5 7.7e – 5 1.3e – 4 7.1e – 5 3.0e – 5 8.9e – 5 2.8e – 4 1.1e – 4 6.8e – 5
2
D i ... ... 1.7e – 3 5.7e – 5 2.0e – 5 3.0e – 5 1.3e – 4 5.6e – 5 4.5e – 5 1.5e – 4 2.2e – 4 8.4e – 5 3.1e – 5 1.7e – 5 4.6e – 4 2.0e – 4 2.2e – 5 1.2e – 3 4.4e – 5 2.8e – 5 6.1e – 5 9.3e – 5 3.2e – 5 2.7e – 4 2.4e – 4 2.8e – 4 3.2e – 5 4.1e – 4 4.3e – 4 2.0e – 4 3.7e – 4 3.2e – 5 1.9e – 6 2.1e – 4 5.2e – 4 1.8e – 4 1.2e – 4
2Pi i
... ... 8.4e – 4 3.8e – 7 ... ... 2.5e – 6 8.5e – 7 2.0e – 7 8.5e – 7 5.9e – 7 ... ... 4.7e – 7 ... 4.6e – 7 3.2e – 6 ... ... 2.2e – 8 2.3e – 7 8.6e – 6 ... 2.0e – 6 1.1e – 6 4.9e – 6 ... 3.2e – 5 2.2e – 6 1.8e – 6 ... 2.1e – 7 4.4e – 7 6.4e – 7 7.4e – 5 1.3e – 6 2.7e – 62
S i i ... ... 4.0e – 5 4.4e – 7 6.1e – 7 4.2e – 7 2.4e – 6 7.4e – 7 1.1e – 7 1.2e – 6 9.5e – 7 6.1e – 7 4.2e – 7 6.2e – 7 6.1e – 7 1.1e – 6 3.8e – 6 6.2e – 7 4.7e – 7 5.7e – 8 6.0e – 7 9.3e – 6 6.1e – 7 2.1e – 6 1.4e – 6 6.0e – 6 6.1e – 7 5.5e – 5 2.9e – 6 1.3e – 6 6.1e – 7 2.1e – 7 6.1e – 7 6.0e – 7 5.3e – 5 1.6e – 6 2.2e – 6
2 Li i
... ... 2.2e – 6 4.3e – 8 1.1e – 7 1.1e – 7 4.0e – 7 1.1e – 8 2.7e – 7 8.6e – 7 7.5e – 8 9.4e – 8 7.1e – 8 5.8e – 8 3.4e – 6 1.9e – 6 3.5e – 7 1.4e – 6 1.6e – 7 6.5e – 8 8.9e – 7 4.7e – 6 7.9e – 8 2.2e – 8 1.9e – 7 1.1e – 6 1.1e – 6 7.9e – 5 1.5e – 5 9.2e – 7 2.4e – 7 4.3e – 8 6.4e – 8 1.2e – 7 3.6e – 5 5.5e – 8 1.5e – 72
STK P i ... ... 2.1e – 2 3.4e – 3 2.4e – 2 9.8e – 3 8.2e – 3 2.8e – 3 2.3e – 2 1.7e – 2 4.2e – 3 8.8e – 3 4.4e – 3 7.6e – 3 3.9e – 2 1.1e – 2 1.4e – 2 2.2e – 2 6.6e – 3 9.3e – 3 3.0e – 3 7.7e – 3 4.1e – 3 4.5e – 3 1.0e – 2 9.5e – 3 6.7e – 3 1.7e – 2 2.7e – 2 2.5e – 3 7.5e – 3 6.7e – 3 4.5e – 3 5.2e – 3 4.8e – 3 2.6e – 3 2.5e – 3
2
i ... ... 7.5e – 3 6.6e – 4 ... ... 5.4e – 3 4.9e – 4 2.1e – 4 1.0e – 3 1.1e – 3 ... ... 1.1e – 3 ... 2.9e – 4 1.2e – 4 ... ... 5.0e – 4 1.2e – 3 8.4e – 5 ... 1.5e – 3 6.5e – 4 1.5e – 3 ... 1.1e – 3 2.2e – 8 2.1e – 3 ... 9.8e – 4 1.7e – 4 4.4e – 4 1.3e – 2 1.5e – 3 ...
2 ... ... 4.4e – 3 1.7e – 5 8.9e – 5 2.4e – 6 2.1e – 4 5.3e – 5 7.5e – 5 1.9e – 4 3.4e – 6 4.0e – 5 1.3e – 5 9.5e – 5 3.7e – 4 8.5e – 4 5.1e – 4 3.0e – 4 6.7e – 5 6.1e – 5 2.2e – 5 1.1e – 4 3.8e – 5 1.7e – 4 1.5e – 4 1.1e – 4 2.8e – 5 5.3e – 4 3.0e – 4 3.9e – 5 1.1e – 4 2.1e – 5 8.7e – 5 5.5e – 4 5.5e – 4 1.5e – 4 3.1e – 5
2
FB i ... ... 1.2e – 4 3.9e – 5 6.4e – 6 8.3e – 6 2.4e – 6 4.5e – 5 1.4e – 5 4.6e – 5 1.2e – 4 2.8e – 5 1.4e – 5 3.6e – 5 1.9e – 5 5.8e – 5 9.5e – 6 4.0e – 4 7.6e – 6 6.8e – 5 1.1e – 5 1.8e – 5 4.7e – 5 8.1e – 5 1.1e – 4 4.0e – 5 1.4e – 5 1.8e – 4 8.7e – 4 4.6e – 5 1.3e – 4 3.4e – 5 1.5e – 5 5.5e – 5 1.8e – 4 2.0e – 5 5.2e – 5
2
CA i ... ... 9.8e – 5 2.9e – 5 6.6e – 6 4.7e – 6 5.4e – 5 1.3e – 5 9.6e – 5 2.3e – 5 1.5e – 5 1.1e – 5 2.6e – 7 2.9e – 5 7.9e – 5 1.4e – 5 1.4e – 5 6.0e – 5 3.0e – 7 5.5e – 6 5.8e – 6 3.3e – 6 4.7e – 5 9.3e – 5 3.1e – 5 3.5e – 5 3.5e – 5 1.5e – 5 7.3e – 4 6.7e – 5 8.6e – 5 1.5e – 5 8.6e – 5 1.2e – 4 1.7e – 5 1.5e – 6 1.3e – 5
2eCOM
... 2.6e – 3 ... ... ... ... ... ... ... ... ... ... ... ... ... ... ... . .. ... ... ... ... ... ... ... . .. ... ... ... ... . .. ... ... ... ... ... ...2
nCOM P ... 7.9e – 4 ... ... ... ... ... ... ... ... ... ... ... ... ... ... ... . .. ... ... ... ... ... ... ... . .. ... ... ... ... . .. ... ... ... ... ... ...
Note: All priors are normally distributed, while all posteriors are asymptotically normally distributed. All observed endogenous variables are rescaled by a factor of 100.
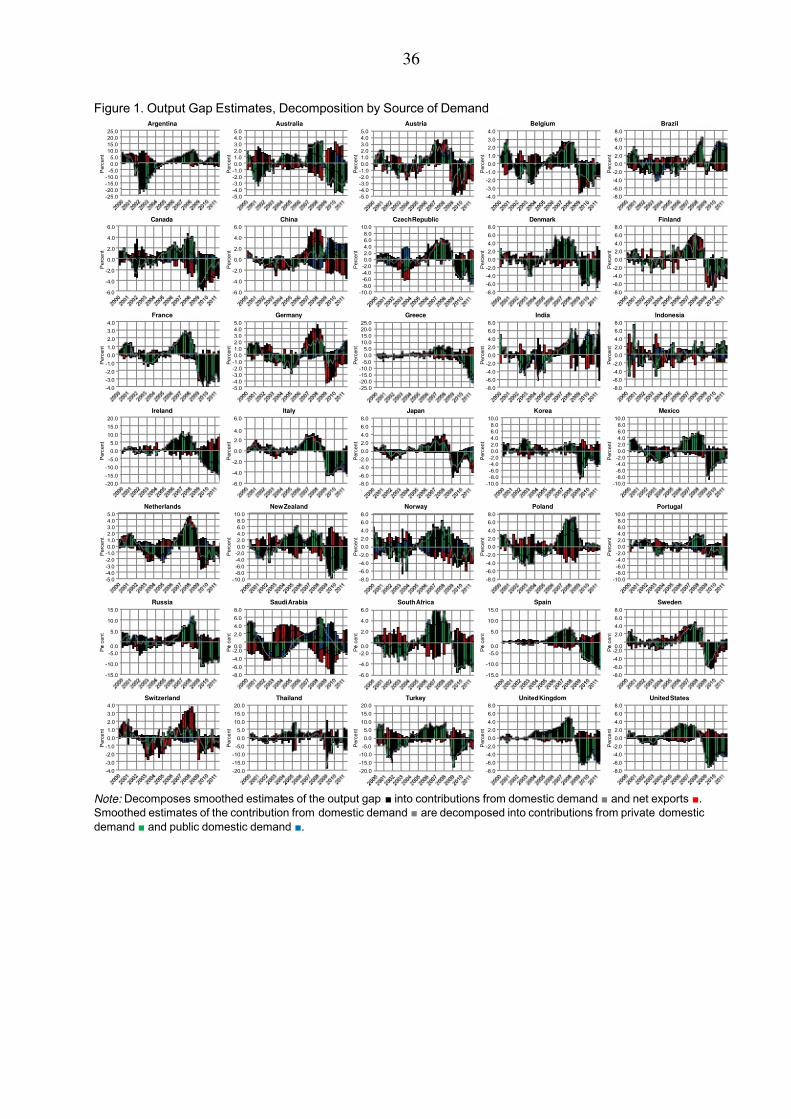
7/30/2019 IMF - Policy Analysis and Forecasting in the World Economy: A Panel Unobserved Components Approach
http://slidepdf.com/reader/full/imf-policy-analysis-and-forecasting-in-the-world-economy-a-panel-unobserved 37/77
36
Figure 1. Output Gap Estimates, Decomposition by Source of Demand
Note: Decomposes smoothed estimates of the output gap ■ into contributions from domestic demand ■ and net exports ■.
Smoothed estimates of the contribution from domestic demand ■ are decomposed into contributions from private domestic
demand ■ and public domestic demand ■.
-25.0
-20.0
-15.0
-10.0
-5.0
0.0
5.0
10.0
15.0
20.0
25.0
P e r c e n t
Argentina
-5.0
-4.0
-3.0
-2.0
-1.0
0.0
1.0
2.0
3.0
4.0
5.0
P e r c e n t
Australia
-5.0
-4.0
-3.0
-2.0
-1.0
0.0
1.0
2.0
3.0
4.0
5.0
P e r c e n t
Austria
-4.0
-3.0
-2.0
-1.0
0.0
1.0
2.0
3.0
4.0
P e r c e n t
Belgium
-8.0
-6.0
-4.0
-2.0
0.0
2.0
4.0
6.0
8.0
P e r c e n t
Brazil
-6.0
-4.0
-2.0
0.0
2.0
4.0
6.0
P e r c e n t
Canada
-6.0
-4.0
-2.0
0.0
2.0
4.0
6.0
P e r c e n t
China
-10.0
-8.0
-6.0
-4.0
-2.0
0.0
2.0
4.0
6.0
8.0
10.0
P e r c e n t
Czech Republic
-8.0
-6.0
-4.0
-2.0
0.0
2.0
4.0
6.0
8.0
P e r c e n t
Denmark
-8.0
-6.0
-4.0
-2.0
0.0
2.0
4.0
6.0
8.0
P e r c e n t
Finland
-4.0
-3.0
-2.0
-1.0
0.0
1.0
2.0
3.0
4.0
P e r c e n t
France
-5.0
-4.0
-3.0
-2.0
-1.0
0.0
1.0
2.0
3.0
4.0
5.0
P e r c e n t
Germany
-25.0
-20.0
-15.0
-10.0
-5.0
0.0
5.0
10.0
15.0
20.0
25.0
P e r c e n t
Greece
-8.0
-6.0
-4.0
-2.0
0.0
2.0
4.0
6.0
8.0
P e r c e n t
India
-8.0
-6.0
-4.0
-2.0
0.0
2.0
4.0
6.0
8.0
P e r c e n t
Indonesia
-20.0
-15.0
-10.0
-5.0
0.0
5.0
10.0
15.0
20.0
P e r c e n t
Ireland
-6.0
-4.0
-2.0
0.0
2.0
4.0
6.0
P e r c e n t
Italy
-8.0
-6.0
-4.0
-2.0
0.0
2.0
4.0
6.0
8.0
P e r c e n t
Japan
-10.0
-8.0
-6.0
-4.0
-2.0
0.0
2.0
4.0
6.0
8.0
10.0
P e r c e n t
Korea
-10.0
-8.0
-6.0
-4.0
-2.0
0.0
2.0
4.0
6.0
8.0
10.0
P e r c e n t
Mexico
-5.0
-4.0
-3.0
-2.0
-1.0
0.0
1.0
2.0
3.0
4.0
5.0
P e r c e n t
Netherlands
-10.0
-8.0
-6.0
-4.0
-2.0
0.0
2.0
4.0
6.0
8.0
10.0
P e r c e n t
New Zealand
-8.0
-6.0
-4.0
-2.0
0.0
2.0
4.0
6.0
8.0
P e r c e n t
Norway
-8.0
-6.0
-4.0
-2.0
0.0
2.0
4.0
6.0
8.0
P e r c e n t
Poland
-10.0
-8.0
-6.0
-4.0
-2.0
0.0
2.0
4.0
6.0
8.0
10.0
P e r c e n t
Portugal
-15.0
-10.0
-5.0
0.0
5.0
10.0
15.0
P e r c e n t
Russia
-8.0
-6.0
-4.0
-2.00.0
2.0
4.0
6.0
8.0
P e r c e n t
Saudi Arabia
-6.0
-4.0
-2.0
0.0
2.0
4.0
6.0
P e r c e n t
South Africa
-15.0
-10.0
-5.0
0.0
5.0
10.0
15.0
P e r c e n t
Spain
-8.0
-6.0
-4.0
-2.00.0
2.0
4.0
6.0
8.0
P e r c e n t
Sweden
-4.0
-3.0
-2.0
-1.0
0.0
1.0
2.0
3.0
4.0
P e r c e n t
Switzerland
-20.0
-15.0
-10.0
-5.0
0.0
5.0
10.0
15.0
20.0
P e r c e n t
Thailand
-20.0
-15.0
-10.0
-5.0
0.0
5.0
10.0
15.0
20.0
P e r c e n t
Turkey
-8.0
-6.0
-4.0
-2.0
0.0
2.0
4.0
6.0
8.0
P e r c e n t
United Kingdom
-8.0
-6.0
-4.0
-2.0
0.0
2.0
4.0
6.0
8.0
P e r c e n t
United States
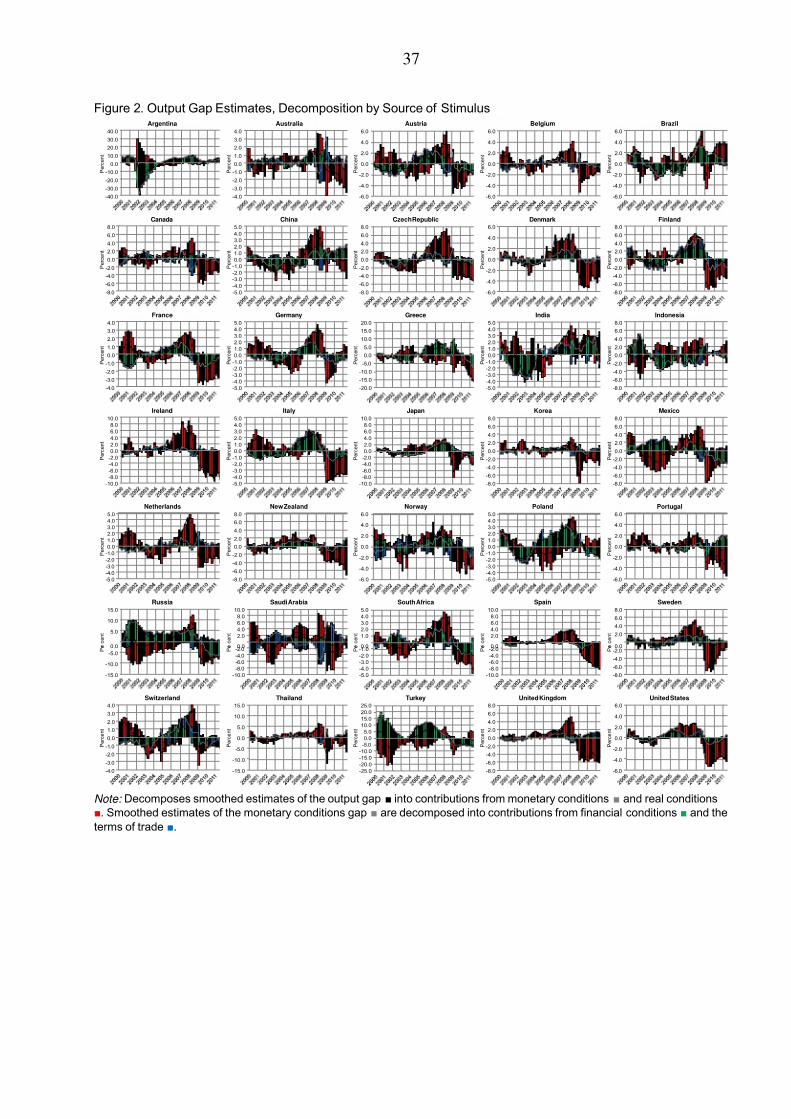
7/30/2019 IMF - Policy Analysis and Forecasting in the World Economy: A Panel Unobserved Components Approach
http://slidepdf.com/reader/full/imf-policy-analysis-and-forecasting-in-the-world-economy-a-panel-unobserved 38/77
37
Figure 2. Output Gap Estimates, Decomposition by Source of Stimulus
Note: Decomposes smoothed estimates of the output gap ■ into contributions from monetary conditions ■ and real conditions
■. Smoothed estimates of the monetary conditions gap ■ are decomposed into contributions from financial conditions ■ and the
terms of trade ■.
-40.0
-30.0
-20.0
-10.0
0.0
10.0
20.0
30.0
40.0
P e r c e n t
Argentina
-4.0
-3.0
-2.0
-1.0
0.0
1.0
2.0
3.0
4.0
P e r c e n t
Australia
-6.0
-4.0
-2.0
0.0
2.0
4.0
6.0
P e r c e n t
Austria
-6.0
-4.0
-2.0
0.0
2.0
4.0
6.0
P e r c e n t
Belgium
-6.0
-4.0
-2.0
0.0
2.0
4.0
6.0
P e r c e n t
Brazil
-8.0
-6.0
-4.0
-2.0
0.0
2.0
4.0
6.0
8.0
P e r c e n t
Canada
-5.0
-4.0
-3.0
-2.0
-1.0
0.0
1.0
2.0
3.0
4.0
5.0
P e r c e n t
China
-8.0
-6.0
-4.0
-2.0
0.0
2.0
4.0
6.0
8.0
P e r c e n t
Czech Republic
-6.0
-4.0
-2.0
0.0
2.0
4.0
6.0
P e r c e n t
Denmark
-8.0
-6.0
-4.0
-2.0
0.0
2.0
4.0
6.0
8.0
P e r c e n t
Finland
-4.0
-3.0
-2.0
-1.0
0.0
1.0
2.0
3.0
4.0
P e r c e n t
France
-5.0
-4.0
-3.0
-2.0
-1.0
0.0
1.0
2.0
3.0
4.0
5.0
P e r c e n t
Germany
-20.0
-15.0
-10.0
-5.0
0.0
5.0
10.0
15.0
20.0
P e r c e n t
Greece
-5.0
-4.0
-3.0
-2.0
-1.0
0.0
1.0
2.0
3.0
4.0
5.0
P e r c e n t
India
-8.0
-6.0
-4.0
-2.0
0.0
2.0
4.0
6.0
8.0
P e r c e n t
Indonesia
-10.0
-8.0
-6.0
-4.0
-2.0
0.0
2.0
4.0
6.0
8.0
10.0
P e r c e n t
Ireland
-5.0
-4.0
-3.0
-2.0
-1.0
0.0
1.0
2.0
3.0
4.0
5.0
P e r c e n t
Italy
-10.0
-8.0
-6.0
-4.0
-2.0
0.0
2.0
4.0
6.0
8.0
10.0
P e r c e n t
Japan
-8.0
-6.0
-4.0
-2.0
0.0
2.0
4.0
6.0
8.0
P e r c e n t
Korea
-8.0
-6.0
-4.0
-2.0
0.0
2.0
4.0
6.0
8.0
P e r c e n t
Mexico
-5.0
-4.0
-3.0
-2.0
-1.0
0.0
1.0
2.0
3.0
4.0
5.0
P e r c e n t
Netherlands
-8.0
-6.0
-4.0
-2.0
0.0
2.0
4.0
6.0
8.0
P e r c e n t
New Zealand
-6.0
-4.0
-2.0
0.0
2.0
4.0
6.0
P e r c e n t
Norway
-5.0
-4.0
-3.0
-2.0
-1.0
0.0
1.0
2.0
3.0
4.0
5.0
P e r c e n t
Poland
-6.0
-4.0
-2.0
0.0
2.0
4.0
6.0
P e r c e n t
Portugal
-15.0
-10.0
-5.0
0.0
5.0
10.0
15.0
P e r c e n t
Russia
-10.0
-8.0
-6.0
-4.0
-2.00.0
2.0
4.0
6.0
8.0
10.0
P e r c e n t
Saudi Arabia
-5.0
-4.0
-3.0
-2.0
-1.00.0
1.0
2.0
3.0
4.0
5.0
P e r c e n t
South Africa
-10.0
-8.0
-6.0
-4.0
-2.00.0
2.0
4.0
6.0
8.0
10.0
P e r c e n t
Spain
-8.0
-6.0
-4.0
-2.00.0
2.0
4.0
6.0
8.0
P e r c e n t
Sweden
-4.0
-3.0
-2.0
-1.0
0.0
1.0
2.0
3.0
4.0
P e r c e n t
Switzerland
-15.0
-10.0
-5.0
0.0
5.0
10.0
15.0
P e r c e n t
Thailand
-25.0
-20.0
-15.0
-10.0
-5.0
0.0
5.0
10.0
15.0
20.0
25.0
P e r c e n t
Turkey
-8.0
-6.0
-4.0
-2.0
0.0
2.0
4.0
6.0
8.0
P e r c e n t
United Kingdom
-6.0
-4.0
-2.0
0.0
2.0
4.0
6.0
P e r c e n t
United States
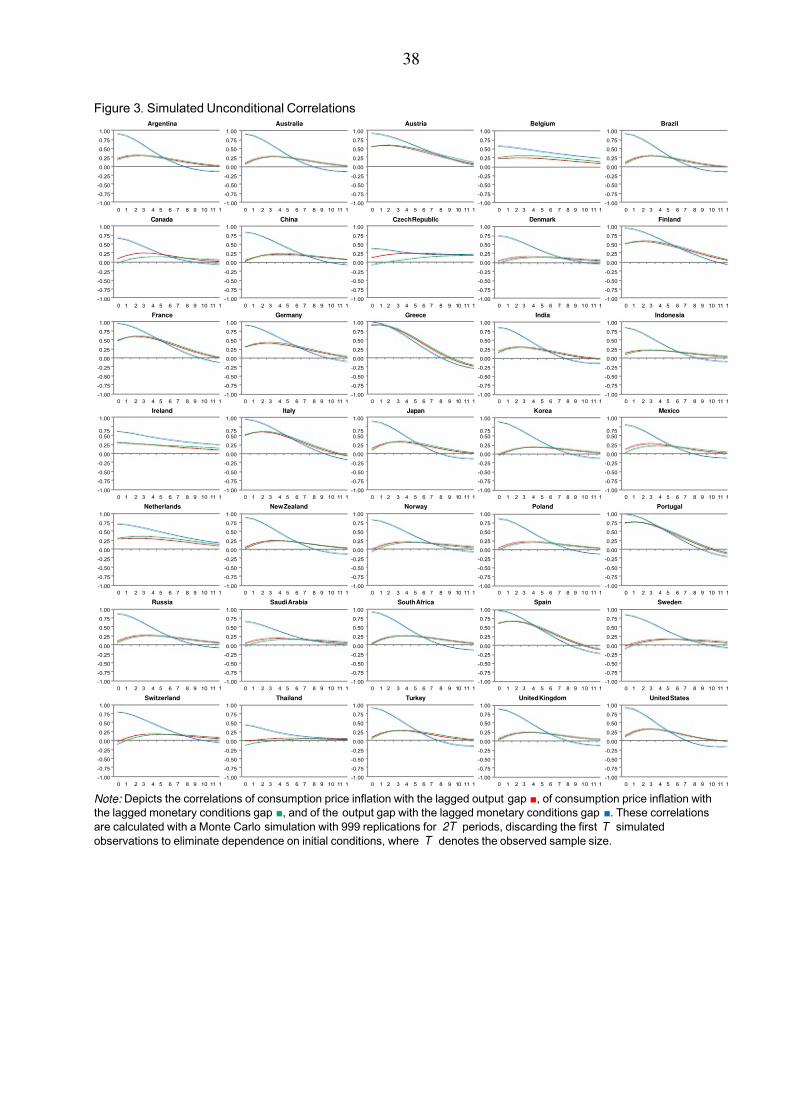
7/30/2019 IMF - Policy Analysis and Forecasting in the World Economy: A Panel Unobserved Components Approach
http://slidepdf.com/reader/full/imf-policy-analysis-and-forecasting-in-the-world-economy-a-panel-unobserved 39/77
38
Figure 3. Simulated Unconditional Correlations
Note: Depicts the correlations of consumption price inflation with the lagged output gap ■, of consumption price inflation with
the lagged monetary conditions gap ■, and of the output gap with the lagged monetary conditions gap ■. These correlations
are calculated with a Monte Carlo simulation with 999 replications for 2T periods, discarding the first T simulated
observations to eliminate dependence on initial conditions, where T denotes the observed sample size.
-1.00
-0.75
-0.50
-0.25
0.00
0.25
0.50
0.75
1.00
0 1 2 3 4 5 6 7 8 9 10 11 1
Argentina
-1.00
-0.75
-0.50
-0.25
0.00
0.25
0.50
0.75
1.00
0 1 2 3 4 5 6 7 8 9 10 11 1
Australia
-1.00
-0.75
-0.50
-0.25
0.00
0.25
0.50
0.75
1.00
0 1 2 3 4 5 6 7 8 9 10 11 1
Austria
-1.00
-0.75
-0.50
-0.25
0.00
0.25
0.50
0.75
1.00
0 1 2 3 4 5 6 7 8 9 1 0 11 1
Belgium
-1.00
-0.75
-0.50
-0.25
0.00
0.25
0.50
0.75
1.00
0 1 2 3 4 5 6 7 8 9 10 11 1
Brazil
-1.00
-0.75
-0.50
-0.25
0.00
0.25
0.50
0.75
1.00
0 1 2 3 4 5 6 7 8 9 10 11 1
Canada
-1.00
-0.75
-0.50
-0.25
0.00
0.25
0.50
0.75
1.00
0 1 2 3 4 5 6 7 8 9 10 11 1
China
-1.00
-0.75
-0.50
-0.25
0.00
0.25
0.50
0.75
1.00
0 1 2 3 4 5 6 7 8 9 10 11 1
Czech Republic
-1.00
-0.75
-0.50
-0.25
0.00
0.25
0.50
0.75
1.00
0 1 2 3 4 5 6 7 8 9 1 0 11 1
Denmark
-1.00
-0.75
-0.50
-0.25
0.00
0.25
0.50
0.75
1.00
0 1 2 3 4 5 6 7 8 9 10 11 1
Finland
-1.00
-0.75
-0.50
-0.25
0.00
0.25
0.50
0.75
1.00
0 1 2 3 4 5 6 7 8 9 10 11 1
France
-1.00
-0.75
-0.50
-0.25
0.00
0.25
0.50
0.75
1.00
0 1 2 3 4 5 6 7 8 9 10 11 1
Germany
-1.00
-0.75
-0.50
-0.25
0.00
0.25
0.50
0.75
1.00
0 1 2 3 4 5 6 7 8 9 10 11 1
Greece
-1.00
-0.75
-0.50
-0.25
0.00
0.25
0.50
0.75
1.00
0 1 2 3 4 5 6 7 8 9 1 0 11 1
India
-1.00
-0.75
-0.50
-0.25
0.00
0.25
0.50
0.75
1.00
0 1 2 3 4 5 6 7 8 9 10 11 1
Indonesia
-1.00
-0.75
-0.50
-0.25
0.00
0.25
0.50
0.75
1.00
0 1 2 3 4 5 6 7 8 9 10 11 1
Ireland
-1.00
-0.75
-0.50
-0.25
0.00
0.25
0.50
0.75
1.00
0 1 2 3 4 5 6 7 8 9 10 11 1
Italy
-1.00
-0.75
-0.50
-0.25
0.00
0.25
0.50
0.75
1.00
0 1 2 3 4 5 6 7 8 9 10 11 1
Japan
-1.00
-0.75
-0.50
-0.25
0.00
0.25
0.50
0.75
1.00
0 1 2 3 4 5 6 7 8 9 1 0 11 1
Korea
-1.00
-0.75
-0.50
-0.25
0.00
0.25
0.50
0.75
1.00
0 1 2 3 4 5 6 7 8 9 10 11 1
Mexico
-1.00
-0.75
-0.50
-0.25
0.00
0.25
0.50
0.75
1.00
0 1 2 3 4 5 6 7 8 9 10 11 1
Netherlands
-1.00
-0.75
-0.50
-0.25
0.00
0.25
0.50
0.75
1.00
0 1 2 3 4 5 6 7 8 9 10 11 1
New Zealand
-1.00
-0.75
-0.50
-0.25
0.00
0.25
0.50
0.75
1.00
0 1 2 3 4 5 6 7 8 9 10 11 1
Norway
-1.00
-0.75
-0.50
-0.25
0.00
0.25
0.50
0.75
1.00
0 1 2 3 4 5 6 7 8 9 1 0 11 1
Poland
-1.00
-0.75
-0.50
-0.25
0.00
0.25
0.50
0.75
1.00
0 1 2 3 4 5 6 7 8 9 10 11 1
Portugal
-1.00
-0.75
-0.50
-0.25
0.00
0.25
0.50
0.75
1.00
0 1 2 3 4 5 6 7 8 9 10 11 1
Russia
-1.00
-0.75
-0.50
-0.25
0.00
0.25
0.50
0.75
1.00
0 1 2 3 4 5 6 7 8 9 10 11 1
Saudi Arabia
-1.00
-0.75
-0.50
-0.25
0.00
0.25
0.50
0.75
1.00
0 1 2 3 4 5 6 7 8 9 10 11 1
South Africa
-1.00
-0.75
-0.50
-0.25
0.00
0.25
0.50
0.75
1.00
0 1 2 3 4 5 6 7 8 9 1 0 11 1
Spain
-1.00
-0.75
-0.50
-0.25
0.00
0.25
0.50
0.75
1.00
0 1 2 3 4 5 6 7 8 9 10 11 1
Sweden
-1.00
-0.75
-0.50
-0.25
0.00
0.25
0.50
0.75
1.00
0 1 2 3 4 5 6 7 8 9 10 11 1
Switzerland
-1.00
-0.75
-0.50
-0.25
0.00
0.25
0.50
0.75
1.00
0 1 2 3 4 5 6 7 8 9 10 11 1
Thailand
-1.00
-0.75
-0.50
-0.25
0.00
0.25
0.50
0.75
1.00
0 1 2 3 4 5 6 7 8 9 10 11 1
Turkey
-1.00
-0.75
-0.50
-0.25
0.00
0.25
0.50
0.75
1.00
0 1 2 3 4 5 6 7 8 9 1 0 11 1
United Kingdom
-1.00
-0.75
-0.50
-0.25
0.00
0.25
0.50
0.75
1.00
0 1 2 3 4 5 6 7 8 9 10 11 1
United States
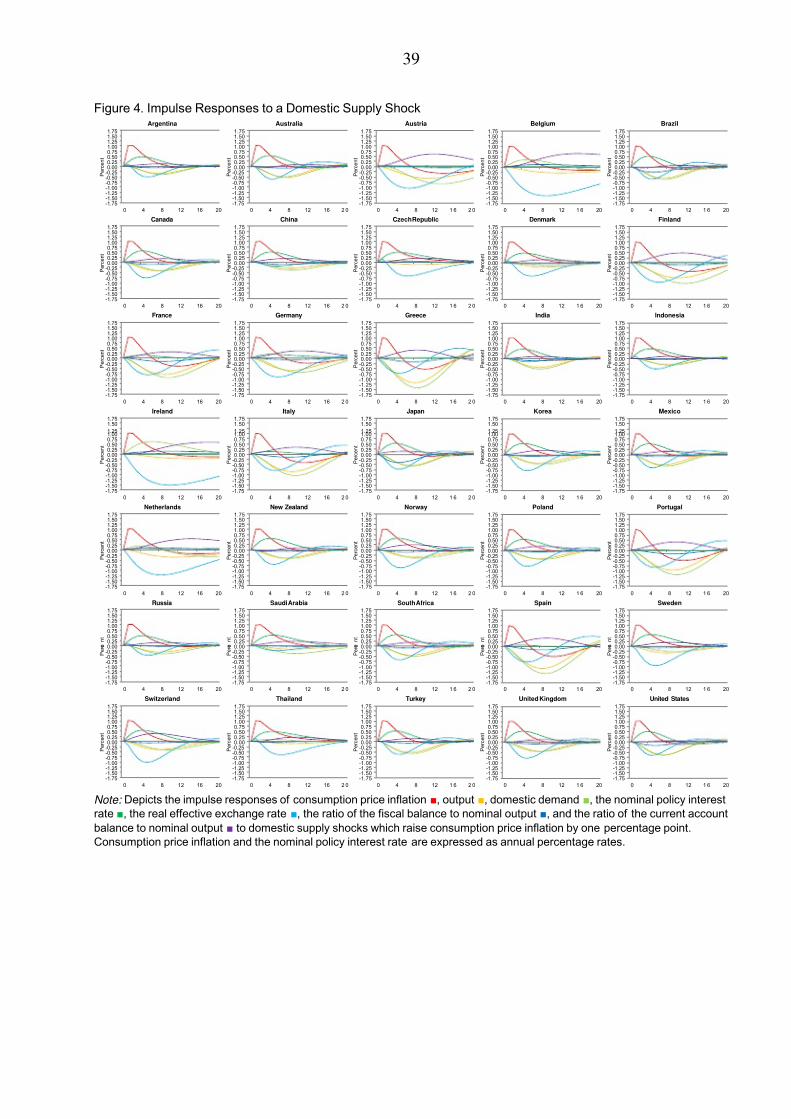
7/30/2019 IMF - Policy Analysis and Forecasting in the World Economy: A Panel Unobserved Components Approach
http://slidepdf.com/reader/full/imf-policy-analysis-and-forecasting-in-the-world-economy-a-panel-unobserved 40/77
39
Figure 4. Impulse Responses to a Domestic Supply Shock
Note: Depicts the impulse responses of consumption price inflation ■, output ■, domestic demand ■, the nominal policy interest
rate ■, the real effective exchange rate ■, the ratio of the fiscal balance to nominal output ■, and the ratio of the current account
balance to nominal output ■ to domestic supply shocks which raise consumption price inflation by one percentage point.
Consumption price inflation and the nominal policy interest rate are expressed as annual percentage rates.
-1.75
-1.50
-1.25
-1.00
-0.75
-0.50
-0.25
0.00
0.25
0.500.75
1.00
1.25
1.50
1.75
0 4 8 12 16 20
P e r c e n t
Argentina
-1.75
-1.50
-1.25
-1.00
-0.75
-0.50
-0.25
0.00
0.25
0.500.75
1.00
1.25
1.50
1.75
0 4 8 12 16 2 0
P e r c e n t
Australia
-1.75
-1.50
-1.25
-1.00
-0.75
-0.50
-0.25
0.00
0.25
0.500.75
1.00
1.25
1.50
1.75
0 4 8 12 1 6 2 0
P e r c e n t
Austria
-1.75
-1.50
-1.25
-1.00
-0.75
-0.50
-0.25
0.00
0.25
0.500.75
1.00
1.25
1.50
1.75
0 4 8 12 1 6 20
P e r c e n t
Belgium
-1.75
-1.50
-1.25
-1.00
-0.75
-0.50
-0.25
0.00
0.25
0.500.75
1.00
1.25
1.50
1.75
0 4 8 12 1 6 20
P e r c e n t
Brazil
-1.75
-1.50
-1.25
-1.00
-0.75
-0.50
-0.25
0.00
0.250.50
0.75
1.00
1.25
1.50
1.75
0 4 8 12 16 20
P e r c e n t
Canada
-1.75
-1.50
-1.25
-1.00
-0.75
-0.50
-0.25
0.00
0.250.50
0.75
1.00
1.25
1.50
1.75
0 4 8 12 16 2 0
P e r c e n t
China
-1.75
-1.50
-1.25
-1.00
-0.75
-0.50
-0.25
0.00
0.250.50
0.75
1.00
1.25
1.50
1.75
0 4 8 12 1 6 2 0
P e r c e n t
Czech Republic
-1.75
-1.50
-1.25
-1.00
-0.75
-0.50
-0.25
0.00
0.250.50
0.75
1.00
1.25
1.50
1.75
0 4 8 12 1 6 20
P e r c e n t
Denmark
-1.75
-1.50
-1.25
-1.00
-0.75
-0.50
-0.25
0.00
0.250.50
0.75
1.00
1.25
1.50
1.75
0 4 8 12 1 6 20
P e r c e n t
Finland
-1.75
-1.50
-1.25
-1.00
-0.75
-0.50
-0.25
0.000.25
0.50
0.75
1.00
1.25
1.50
1.75
0 4 8 12 16 20
P e r c e n t
France
-1.75
-1.50
-1.25
-1.00
-0.75
-0.50
-0.25
0.000.25
0.50
0.75
1.00
1.25
1.50
1.75
0 4 8 12 16 2 0
P e r c e n t
Germany
-1.75
-1.50
-1.25
-1.00
-0.75
-0.50
-0.25
0.000.25
0.50
0.75
1.00
1.25
1.50
1.75
0 4 8 12 1 6 2 0
P e r c e n t
Greece
-1.75
-1.50
-1.25
-1.00
-0.75
-0.50
-0.25
0.000.25
0.50
0.75
1.00
1.25
1.50
1.75
0 4 8 12 1 6 20
P e r c e n t
India
-1.75
-1.50
-1.25
-1.00
-0.75
-0.50
-0.25
0.000.25
0.50
0.75
1.00
1.25
1.50
1.75
0 4 8 12 1 6 20
P e r c e n t
Indonesia
-1.75
-1.50
-1.25
-1.00
-0.75-0.50
-0.25
0.00
0.25
0.50
0.75
1.001.25
1.50
1.75
0 4 8 12 16 20
P e r c e n t
Ireland
-1.75
-1.50
-1.25
-1.00
-0.75-0.50
-0.25
0.00
0.25
0.50
0.75
1.001.25
1.50
1.75
0 4 8 12 16 2 0
P e r c e n t
Italy
-1.75
-1.50
-1.25
-1.00
-0.75-0.50
-0.25
0.00
0.25
0.50
0.75
1.001.25
1.50
1.75
0 4 8 12 1 6 2 0
P e r c e n t
Japan
-1.75
-1.50
-1.25
-1.00
-0.75-0.50
-0.25
0.00
0.25
0.50
0.75
1.001.25
1.50
1.75
0 4 8 12 1 6 20
P e r c e n t
Korea
-1.75
-1.50
-1.25
-1.00
-0.75-0.50
-0.25
0.00
0.25
0.50
0.75
1.001.25
1.50
1.75
0 4 8 12 1 6 20
P e r c e n t
Mexico
-1.75
-1.50
-1.25
-1.00-0.75
-0.50
-0.25
0.00
0.25
0.50
0.75
1.00
1.25
1.50
1.75
0 4 8 12 16 20
P e r c e n t
Netherlands
-1.75
-1.50
-1.25
-1.00-0.75
-0.50
-0.25
0.00
0.25
0.50
0.75
1.00
1.25
1.50
1.75
0 4 8 12 16 2 0
P e r c e n t
New Zealand
-1.75
-1.50
-1.25
-1.00-0.75
-0.50
-0.25
0.00
0.25
0.50
0.75
1.00
1.25
1.50
1.75
0 4 8 12 1 6 2 0
P e r c e n t
Norway
-1.75
-1.50
-1.25
-1.00-0.75
-0.50
-0.25
0.00
0.25
0.50
0.75
1.00
1.25
1.50
1.75
0 4 8 12 1 6 20
P e r c e n t
Poland
-1.75
-1.50
-1.25
-1.00-0.75
-0.50
-0.25
0.00
0.25
0.50
0.75
1.00
1.25
1.50
1.75
0 4 8 12 1 6 20
P e r c e n t
Portugal
-1.75
-1.50
-1.25-1.00
-0.75
-0.50
-0.25
0.00
0.25
0.50
0.75
1.00
1.25
1.50
1.75
0 4 8 12 16 20
P e r c e
n t
Russia
-1.75
-1.50
-1.25-1.00
-0.75
-0.50
-0.25
0.00
0.25
0.50
0.75
1.00
1.25
1.50
1.75
0 4 8 12 16 2 0
P e r c e
n t
Saudi Arabia
-1.75
-1.50
-1.25-1.00
-0.75
-0.50
-0.25
0.00
0.25
0.50
0.75
1.00
1.25
1.50
1.75
0 4 8 12 1 6 2 0
P e r c e
n t
South Africa
-1.75
-1.50
-1.25-1.00
-0.75
-0.50
-0.25
0.00
0.25
0.50
0.75
1.00
1.25
1.50
1.75
0 4 8 12 1 6 20
P e r c e
n t
Spain
-1.75
-1.50
-1.25-1.00
-0.75
-0.50
-0.25
0.00
0.25
0.50
0.75
1.00
1.25
1.50
1.75
0 4 8 12 1 6 20
P e r c e
n t
Sweden
-1.75
-1.50-1.25
-1.00
-0.75
-0.50
-0.25
0.00
0.25
0.50
0.75
1.00
1.251.50
1.75
0 4 8 12 16 20
P e r c e n t
Switzerland
-1.75
-1.50-1.25
-1.00
-0.75
-0.50
-0.25
0.00
0.25
0.50
0.75
1.00
1.251.50
1.75
0 4 8 12 16 2 0
P e r c e n t
Thailand
-1.75
-1.50-1.25
-1.00
-0.75
-0.50
-0.25
0.00
0.25
0.50
0.75
1.00
1.251.50
1.75
0 4 8 12 1 6 2 0
P e r c e n t
Turkey
-1.75
-1.50-1.25
-1.00
-0.75
-0.50
-0.25
0.00
0.25
0.50
0.75
1.00
1.251.50
1.75
0 4 8 12 1 6 20
P e r c e n t
United Kingdom
-1.75
-1.50-1.25
-1.00
-0.75
-0.50
-0.25
0.00
0.25
0.50
0.75
1.00
1.251.50
1.75
0 4 8 12 1 6 20
P e r c e n t
United States

7/30/2019 IMF - Policy Analysis and Forecasting in the World Economy: A Panel Unobserved Components Approach
http://slidepdf.com/reader/full/imf-policy-analysis-and-forecasting-in-the-world-economy-a-panel-unobserved 41/77
40
Figure 5. Impulse Responses to a Domestic Private Demand Shock
Note: Depicts the impulse responses of consumption price inflation ■, output ■, domestic demand ■, the nominal policy interest
rate ■, the real effective exchange rate ■, the ratio of the fiscal balance to nominal output ■, and the ratio of the current account
balance to nominal output ■ to private domestic demand shocks which raise domestic demand by one percent. Consumption
price inflation and the nominal policy interest rate are expressed as annual percentage rates.
-1.25
-1.00
-0.75
-0.50
-0.25
0.00
0.25
0.50
0.75
1.00
1.25
0 4 8 12 16 20
P e r c e n t
Argentina
-1.25
-1.00
-0.75
-0.50
-0.25
0.00
0.25
0.50
0.75
1.00
1.25
0 4 8 12 16 2 0
P e r c e n t
Australia
-1.25
-1.00
-0.75
-0.50
-0.25
0.00
0.25
0.50
0.75
1.00
1.25
0 4 8 12 1 6 2 0
P e r c e n t
Austria
-1.25
-1.00
-0.75
-0.50
-0.25
0.00
0.25
0.50
0.75
1.00
1.25
0 4 8 12 1 6 20
P e r c e n t
Belgium
-1.25
-1.00
-0.75
-0.50
-0.25
0.00
0.25
0.50
0.75
1.00
1.25
0 4 8 12 1 6 20
P e r c e n t
Brazil
-1.25
-1.00
-0.75
-0.50
-0.25
0.00
0.25
0.50
0.75
1.00
1.25
0 4 8 12 16 20
P e r c e n t
Canada
-1.25
-1.00
-0.75
-0.50
-0.25
0.00
0.25
0.50
0.75
1.00
1.25
0 4 8 12 16 2 0
P e r c e n t
China
-1.25
-1.00
-0.75
-0.50
-0.25
0.00
0.25
0.50
0.75
1.00
1.25
0 4 8 12 1 6 2 0
P e r c e n t
Czech Republic
-1.25
-1.00
-0.75
-0.50
-0.25
0.00
0.25
0.50
0.75
1.00
1.25
0 4 8 12 1 6 20
P e r c e n t
Denmark
-1.25
-1.00
-0.75
-0.50
-0.25
0.00
0.25
0.50
0.75
1.00
1.25
0 4 8 12 1 6 20
P e r c e n t
Finland
-1.25
-1.00
-0.75
-0.50
-0.25
0.00
0.25
0.50
0.75
1.00
1.25
0 4 8 12 16 20
P e r c e n t
France
-1.25
-1.00
-0.75
-0.50
-0.25
0.00
0.25
0.50
0.75
1.00
1.25
0 4 8 12 16 2 0
P e r c e n t
Germany
-1.25
-1.00
-0.75
-0.50
-0.25
0.00
0.25
0.50
0.75
1.00
1.25
0 4 8 12 1 6 2 0
P e r c e n t
Greece
-1.25
-1.00
-0.75
-0.50
-0.25
0.00
0.25
0.50
0.75
1.00
1.25
0 4 8 12 1 6 20
P e r c e n t
India
-1.25
-1.00
-0.75
-0.50
-0.25
0.00
0.25
0.50
0.75
1.00
1.25
0 4 8 12 1 6 20
P e r c e n t
Indonesia
-1.25
-1.00
-0.75
-0.50
-0.25
0.00
0.25
0.50
0.75
1.00
1.25
0 4 8 12 16 20
P e r c e n t
Ireland
-1.25
-1.00
-0.75
-0.50
-0.25
0.00
0.25
0.50
0.75
1.00
1.25
0 4 8 12 16 2 0
P e r c e n t
Italy
-1.25
-1.00
-0.75
-0.50
-0.25
0.00
0.25
0.50
0.75
1.00
1.25
0 4 8 12 1 6 2 0
P e r c e n t
Japan
-1.25
-1.00
-0.75
-0.50
-0.25
0.00
0.25
0.50
0.75
1.00
1.25
0 4 8 12 1 6 20
P e r c e n t
Korea
-1.25
-1.00
-0.75
-0.50
-0.25
0.00
0.25
0.50
0.75
1.00
1.25
0 4 8 12 1 6 20
P e r c e n t
Mexico
-1.25
-1.00
-0.75
-0.50
-0.25
0.00
0.25
0.50
0.75
1.00
1.25
0 4 8 12 16 20
P e r c e n t
Netherlands
-1.25
-1.00
-0.75
-0.50
-0.25
0.00
0.25
0.50
0.75
1.00
1.25
0 4 8 12 16 2 0
P e r c e n t
New Zealand
-1.25
-1.00
-0.75
-0.50
-0.25
0.00
0.25
0.50
0.75
1.00
1.25
0 4 8 12 1 6 2 0
P e r c e n t
Norway
-1.25
-1.00
-0.75
-0.50
-0.25
0.00
0.25
0.50
0.75
1.00
1.25
0 4 8 12 1 6 20
P e r c e n t
Poland
-1.25
-1.00
-0.75
-0.50
-0.25
0.00
0.25
0.50
0.75
1.00
1.25
0 4 8 12 1 6 20
P e r c e n t
Portugal
-1.25
-1.00
-0.75
-0.50
-0.25
0.00
0.25
0.50
0.75
1.00
1.25
0 4 8 12 16 20
P e r c e
n t
Russia
-1.25
-1.00
-0.75
-0.50
-0.25
0.00
0.25
0.50
0.75
1.00
1.25
0 4 8 12 16 2 0
P e r c e
n t
Saudi Arabia
-1.25
-1.00
-0.75
-0.50
-0.25
0.00
0.25
0.50
0.75
1.00
1.25
0 4 8 12 1 6 2 0
P e r c e
n t
South Africa
-1.25
-1.00
-0.75
-0.50
-0.25
0.00
0.25
0.50
0.75
1.00
1.25
0 4 8 12 1 6 20
P e r c e
n t
Spain
-1.25
-1.00
-0.75
-0.50
-0.25
0.00
0.25
0.50
0.75
1.00
1.25
0 4 8 12 1 6 20
P e r c e
n t
Sweden
-1.25
-1.00
-0.75
-0.50
-0.25
0.00
0.25
0.50
0.75
1.00
1.25
0 4 8 12 16 20
P e r c e n t
Switzerland
-1.25
-1.00
-0.75
-0.50
-0.25
0.00
0.25
0.50
0.75
1.00
1.25
0 4 8 12 16 2 0
P e r c e n t
Thailand
-1.25
-1.00
-0.75
-0.50
-0.25
0.00
0.25
0.50
0.75
1.00
1.25
0 4 8 12 1 6 2 0
P e r c e n t
Turkey
-1.25
-1.00
-0.75
-0.50
-0.25
0.00
0.25
0.50
0.75
1.00
1.25
0 4 8 12 1 6 20
P e r c e n t
United Kingdom
-1.25
-1.00
-0.75
-0.50
-0.25
0.00
0.25
0.50
0.75
1.00
1.25
0 4 8 12 1 6 20
P e r c e n t
United States
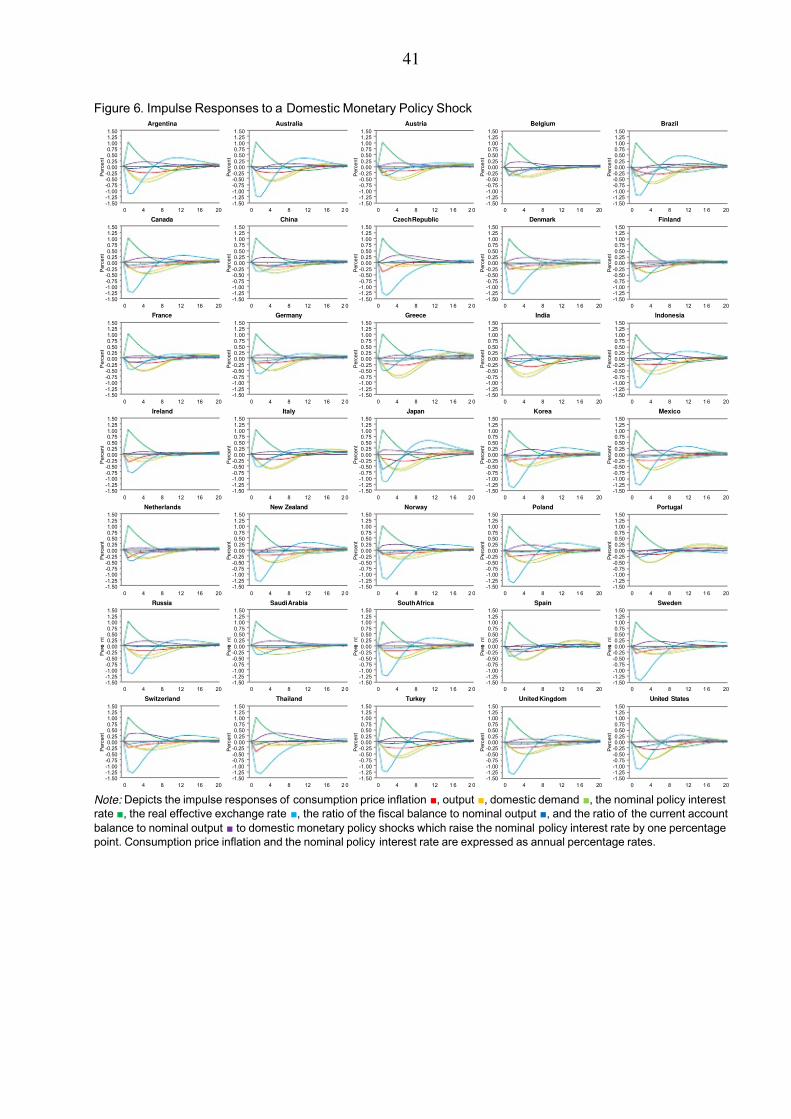
7/30/2019 IMF - Policy Analysis and Forecasting in the World Economy: A Panel Unobserved Components Approach
http://slidepdf.com/reader/full/imf-policy-analysis-and-forecasting-in-the-world-economy-a-panel-unobserved 42/77
41
Figure 6. Impulse Responses to a Domestic Monetary Policy Shock
Note: Depicts the impulse responses of consumption price inflation ■, output ■, domestic demand ■, the nominal policy interest
rate ■, the real effective exchange rate ■, the ratio of the fiscal balance to nominal output ■, and the ratio of the current account
balance to nominal output ■ to domestic monetary policy shocks which raise the nominal policy interest rate by one percentage
point. Consumption price inflation and the nominal policy interest rate are expressed as annual percentage rates.
-1.50
-1.25
-1.00
-0.75
-0.50
-0.25
0.00
0.25
0.50
0.75
1.00
1.25
1.50
0 4 8 12 16 20
P e r c e n t
Argentina
-1.50
-1.25
-1.00
-0.75
-0.50
-0.25
0.00
0.25
0.50
0.75
1.00
1.25
1.50
0 4 8 12 16 2 0
P e r c e n t
Australia
-1.50
-1.25
-1.00
-0.75
-0.50
-0.25
0.00
0.25
0.50
0.75
1.00
1.25
1.50
0 4 8 12 1 6 2 0
P e r c e n t
Austria
-1.50
-1.25
-1.00
-0.75
-0.50
-0.25
0.00
0.25
0.50
0.75
1.00
1.25
1.50
0 4 8 12 1 6 20
P e r c e n t
Belgium
-1.50
-1.25
-1.00
-0.75
-0.50
-0.25
0.00
0.25
0.50
0.75
1.00
1.25
1.50
0 4 8 12 1 6 20
P e r c e n t
Brazil
-1.50
-1.25
-1.00
-0.75
-0.50
-0.25
0.00
0.25
0.50
0.75
1.00
1.25
1.50
0 4 8 12 16 20
P e r c e n t
Canada
-1.50
-1.25
-1.00
-0.75
-0.50
-0.25
0.00
0.25
0.50
0.75
1.00
1.25
1.50
0 4 8 12 16 2 0
P e r c e n t
China
-1.50
-1.25
-1.00
-0.75
-0.50
-0.25
0.00
0.25
0.50
0.75
1.00
1.25
1.50
0 4 8 12 1 6 2 0
P e r c e n t
Czech Republic
-1.50
-1.25
-1.00
-0.75
-0.50
-0.25
0.00
0.25
0.50
0.75
1.00
1.25
1.50
0 4 8 12 1 6 20
P e r c e n t
Denmark
-1.50
-1.25
-1.00
-0.75
-0.50
-0.25
0.00
0.25
0.50
0.75
1.00
1.25
1.50
0 4 8 12 1 6 20
P e r c e n t
Finland
-1.50
-1.25
-1.00
-0.75
-0.50
-0.25
0.00
0.25
0.50
0.75
1.00
1.25
1.50
0 4 8 12 16 20
P e r c e n t
France
-1.50
-1.25
-1.00
-0.75
-0.50
-0.25
0.00
0.25
0.50
0.75
1.00
1.25
1.50
0 4 8 12 16 2 0
P e r c e n t
Germany
-1.50
-1.25
-1.00
-0.75
-0.50
-0.25
0.00
0.25
0.50
0.75
1.00
1.25
1.50
0 4 8 12 1 6 2 0
P e r c e n t
Greece
-1.50
-1.25
-1.00
-0.75
-0.50
-0.25
0.00
0.25
0.50
0.75
1.00
1.25
1.50
0 4 8 12 1 6 20
P e r c e n t
India
-1.50
-1.25
-1.00
-0.75
-0.50
-0.25
0.00
0.25
0.50
0.75
1.00
1.25
1.50
0 4 8 12 1 6 20
P e r c e n t
Indonesia
-1.50
-1.25
-1.00
-0.75
-0.50
-0.25
0.00
0.25
0.50
0.75
1.00
1.25
1.50
0 4 8 12 16 20
P e r c e n t
Ireland
-1.50
-1.25
-1.00
-0.75
-0.50
-0.25
0.00
0.25
0.50
0.75
1.00
1.25
1.50
0 4 8 12 16 2 0
P e r c e n t
Italy
-1.50
-1.25
-1.00
-0.75
-0.50
-0.25
0.00
0.25
0.50
0.75
1.00
1.25
1.50
0 4 8 12 1 6 2 0
P e r c e n t
Japan
-1.50
-1.25
-1.00
-0.75
-0.50
-0.25
0.00
0.25
0.50
0.75
1.00
1.25
1.50
0 4 8 12 1 6 20
P e r c e n t
Korea
-1.50
-1.25
-1.00
-0.75
-0.50
-0.25
0.00
0.25
0.50
0.75
1.00
1.25
1.50
0 4 8 12 1 6 20
P e r c e n t
Mexico
-1.50
-1.25
-1.00
-0.75
-0.50
-0.25
0.00
0.25
0.50
0.75
1.00
1.25
1.50
0 4 8 12 16 20
P e r c e n t
Netherlands
-1.50
-1.25
-1.00
-0.75
-0.50
-0.25
0.00
0.25
0.50
0.75
1.00
1.25
1.50
0 4 8 12 16 2 0
P e r c e n t
New Zealand
-1.50
-1.25
-1.00
-0.75
-0.50
-0.25
0.00
0.25
0.50
0.75
1.00
1.25
1.50
0 4 8 12 1 6 2 0
P e r c e n t
Norway
-1.50
-1.25
-1.00
-0.75
-0.50
-0.25
0.00
0.25
0.50
0.75
1.00
1.25
1.50
0 4 8 12 1 6 20
P e r c e n t
Poland
-1.50
-1.25
-1.00
-0.75
-0.50
-0.25
0.00
0.25
0.50
0.75
1.00
1.25
1.50
0 4 8 12 1 6 20
P e r c e n t
Portugal
-1.50
-1.25
-1.00
-0.75
-0.50
-0.25
0.00
0.25
0.50
0.75
1.00
1.25
1.50
0 4 8 12 16 20
P e r c e
n t
Russia
-1.50
-1.25
-1.00
-0.75
-0.50
-0.25
0.00
0.25
0.50
0.75
1.00
1.25
1.50
0 4 8 12 16 2 0
P e r c e
n t
Saudi Arabia
-1.50
-1.25
-1.00
-0.75
-0.50
-0.25
0.00
0.25
0.50
0.75
1.00
1.25
1.50
0 4 8 12 1 6 2 0
P e r c e
n t
South Africa
-1.50
-1.25
-1.00
-0.75
-0.50
-0.25
0.00
0.25
0.50
0.75
1.00
1.25
1.50
0 4 8 12 1 6 20
P e r c e
n t
Spain
-1.50
-1.25
-1.00
-0.75
-0.50
-0.25
0.00
0.25
0.50
0.75
1.00
1.25
1.50
0 4 8 12 1 6 20
P e r c e
n t
Sweden
-1.50
-1.25
-1.00
-0.75
-0.50
-0.25
0.00
0.25
0.50
0.75
1.00
1.25
1.50
0 4 8 12 16 20
P e r c e n t
Switzerland
-1.50
-1.25
-1.00
-0.75
-0.50
-0.25
0.00
0.25
0.50
0.75
1.00
1.25
1.50
0 4 8 12 16 2 0
P e r c e n t
Thailand
-1.50
-1.25
-1.00
-0.75
-0.50
-0.25
0.00
0.25
0.50
0.75
1.00
1.25
1.50
0 4 8 12 1 6 2 0
P e r c e n t
Turkey
-1.50
-1.25
-1.00
-0.75
-0.50
-0.25
0.00
0.25
0.50
0.75
1.00
1.25
1.50
0 4 8 12 1 6 20
P e r c e n t
United Kingdom
-1.50
-1.25
-1.00
-0.75
-0.50
-0.25
0.00
0.25
0.50
0.75
1.00
1.25
1.50
0 4 8 12 1 6 20
P e r c e n t
United States
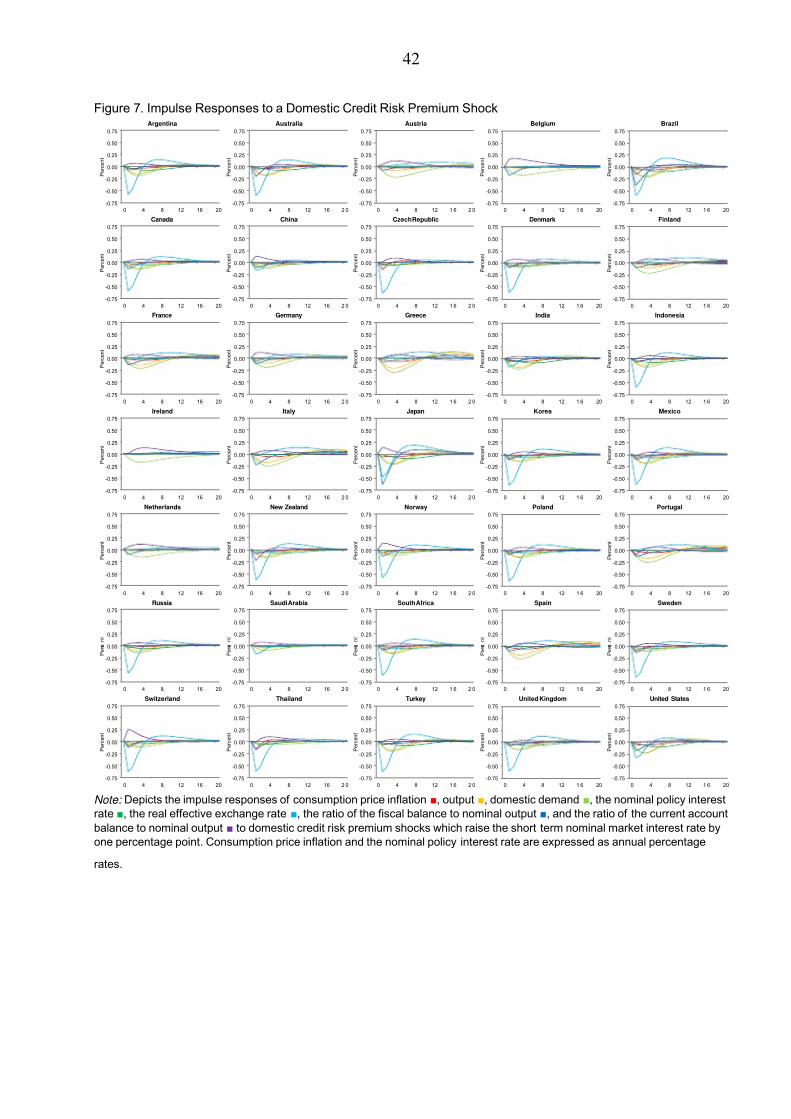
7/30/2019 IMF - Policy Analysis and Forecasting in the World Economy: A Panel Unobserved Components Approach
http://slidepdf.com/reader/full/imf-policy-analysis-and-forecasting-in-the-world-economy-a-panel-unobserved 43/77
42
Figure 7. Impulse Responses to a Domestic Credit Risk Premium Shock
Note: Depicts the impulse responses of consumption price inflation ■, output ■, domestic demand ■, the nominal policy interest
rate ■, the real effective exchange rate ■, the ratio of the fiscal balance to nominal output ■, and the ratio of the current account
balance to nominal output ■ to domestic credit risk premium shocks which raise the short term nominal market interest rate by
one percentage point. Consumption price inflation and the nominal policy interest rate are expressed as annual percentage
rates.
-0.75
-0.50
-0.25
0.00
0.25
0.50
0.75
0 4 8 12 16 20
P e r c e n t
Argentina
-0.75
-0.50
-0.25
0.00
0.25
0.50
0.75
0 4 8 12 16 2 0
P e r c e n t
Australia
-0.75
-0.50
-0.25
0.00
0.25
0.50
0.75
0 4 8 12 1 6 2 0
P e r c e n t
Austria
-0.75
-0.50
-0.25
0.00
0.25
0.50
0.75
0 4 8 12 1 6 20
P e r c e n t
Belgium
-0.75
-0.50
-0.25
0.00
0.25
0.50
0.75
0 4 8 12 1 6 20
P e r c e n t
Brazil
-0.75
-0.50
-0.25
0.00
0.25
0.50
0.75
0 4 8 12 16 20
P e r c e n t
Canada
-0.75
-0.50
-0.25
0.00
0.25
0.50
0.75
0 4 8 12 16 2 0
P e r c e n t
China
-0.75
-0.50
-0.25
0.00
0.25
0.50
0.75
0 4 8 12 1 6 2 0
P e r c e n t
Czech Republic
-0.75
-0.50
-0.25
0.00
0.25
0.50
0.75
0 4 8 12 1 6 20
P e r c e n t
Denmark
-0.75
-0.50
-0.25
0.00
0.25
0.50
0.75
0 4 8 12 1 6 20
P e r c e n t
Finland
-0.75
-0.50
-0.25
0.00
0.25
0.50
0.75
0 4 8 12 16 20
P e r c e n t
France
-0.75
-0.50
-0.25
0.00
0.25
0.50
0.75
0 4 8 12 16 2 0
P e r c e n t
Germany
-0.75
-0.50
-0.25
0.00
0.25
0.50
0.75
0 4 8 12 1 6 2 0
P e r c e n t
Greece
-0.75
-0.50
-0.25
0.00
0.25
0.50
0.75
0 4 8 12 1 6 20
P e r c e n t
India
-0.75
-0.50
-0.25
0.00
0.25
0.50
0.75
0 4 8 12 1 6 20
P e r c e n t
Indonesia
-0.75
-0.50
-0.25
0.00
0.25
0.50
0.75
0 4 8 12 16 20
P e r c e n t
Ireland
-0.75
-0.50
-0.25
0.00
0.25
0.50
0.75
0 4 8 12 16 2 0
P e r c e n t
Italy
-0.75
-0.50
-0.25
0.00
0.25
0.50
0.75
0 4 8 12 1 6 2 0
P e r c e n t
Japan
-0.75
-0.50
-0.25
0.00
0.25
0.50
0.75
0 4 8 12 1 6 20
P e r c e n t
Korea
-0.75
-0.50
-0.25
0.00
0.25
0.50
0.75
0 4 8 12 1 6 20
P e r c e n t
Mexico
-0.75
-0.50
-0.25
0.00
0.25
0.50
0.75
0 4 8 12 16 20
P e r c e n t
Netherlands
-0.75
-0.50
-0.25
0.00
0.25
0.50
0.75
0 4 8 12 16 2 0
P e r c e n t
New Zealand
-0.75
-0.50
-0.25
0.00
0.25
0.50
0.75
0 4 8 12 1 6 2 0
P e r c e n t
Norway
-0.75
-0.50
-0.25
0.00
0.25
0.50
0.75
0 4 8 12 1 6 20
P e r c e n t
Poland
-0.75
-0.50
-0.25
0.00
0.25
0.50
0.75
0 4 8 12 1 6 20
P e r c e n t
Portugal
-0.75
-0.50
-0.25
0.00
0.25
0.50
0.75
0 4 8 12 16 20
P e r c e
n t
Russia
-0.75
-0.50
-0.25
0.00
0.25
0.50
0.75
0 4 8 12 16 2 0
P e r c e
n t
Saudi Arabia
-0.75
-0.50
-0.25
0.00
0.25
0.50
0.75
0 4 8 12 1 6 2 0
P e r c e
n t
South Africa
-0.75
-0.50
-0.25
0.00
0.25
0.50
0.75
0 4 8 12 1 6 20
P e r c e
n t
Spain
-0.75
-0.50
-0.25
0.00
0.25
0.50
0.75
0 4 8 12 1 6 20
P e r c e
n t
Sweden
-0.75
-0.50
-0.25
0.00
0.25
0.50
0.75
0 4 8 12 16 20
P e r c e n t
Switzerland
-0.75
-0.50
-0.25
0.00
0.25
0.50
0.75
0 4 8 12 16 2 0
P e r c e n t
Thailand
-0.75
-0.50
-0.25
0.00
0.25
0.50
0.75
0 4 8 12 1 6 2 0
P e r c e n t
Turkey
-0.75
-0.50
-0.25
0.00
0.25
0.50
0.75
0 4 8 12 1 6 20
P e r c e n t
United Kingdom
-0.75
-0.50
-0.25
0.00
0.25
0.50
0.75
0 4 8 12 1 6 20
P e r c e n t
United States
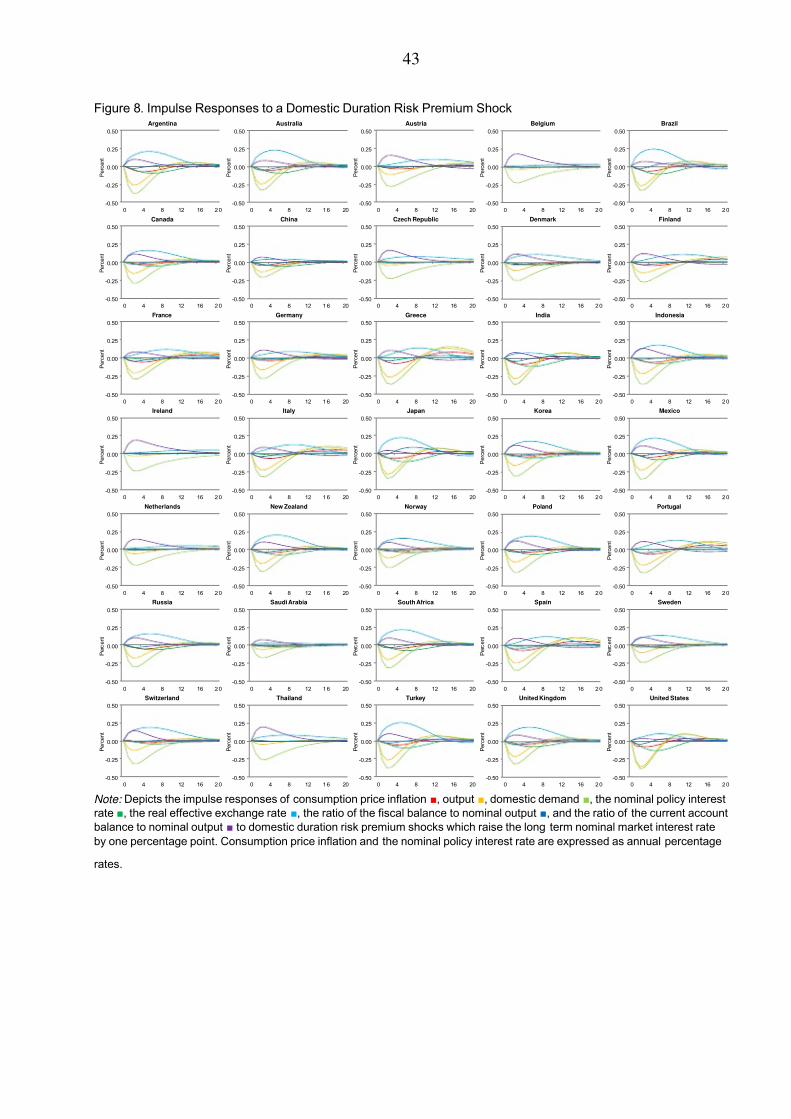
7/30/2019 IMF - Policy Analysis and Forecasting in the World Economy: A Panel Unobserved Components Approach
http://slidepdf.com/reader/full/imf-policy-analysis-and-forecasting-in-the-world-economy-a-panel-unobserved 44/77
43
Figure 8. Impulse Responses to a Domestic Duration Risk Premium Shock
Note: Depicts the impulse responses of consumption price inflation ■, output ■, domestic demand ■, the nominal policy interest
rate ■, the real effective exchange rate ■, the ratio of the fiscal balance to nominal output ■, and the ratio of the current account
balance to nominal output ■ to domestic duration risk premium shocks which raise the long term nominal market interest rate
by one percentage point. Consumption price inflation and the nominal policy interest rate are expressed as annual percentage
rates.
-0.50
-0.25
0.00
0.25
0.50
0 4 8 12 16 2 0
P e r c e n t
Argentina
-0.50
-0.25
0.00
0.25
0.50
0 4 8 12 1 6 20
P e r c e n t
Australia
-0.50
-0.25
0.00
0.25
0.50
0 4 8 12 16 20
P e r c e n t
Austria
-0.50
-0.25
0.00
0.25
0.50
0 4 8 12 16 2 0
P e r c e n t
Belgium
-0.50
-0.25
0.00
0.25
0.50
0 4 8 12 16 2 0
P e r c e n t
Brazil
-0.50
-0.25
0.00
0.25
0.50
0 4 8 12 16 2 0
P e r c e n t
Canada
-0.50
-0.25
0.00
0.25
0.50
0 4 8 12 1 6 20
P e r c e n t
China
-0.50
-0.25
0.00
0.25
0.50
0 4 8 12 16 20
P e r c e n t
Czech Republic
-0.50
-0.25
0.00
0.25
0.50
0 4 8 12 16 2 0
P e r c e n t
Denmark
-0.50
-0.25
0.00
0.25
0.50
0 4 8 12 16 2 0
P e r c e n t
Finland
-0.50
-0.25
0.00
0.25
0.50
0 4 8 12 16 2 0
P e r c e n t
France
-0.50
-0.25
0.00
0.25
0.50
0 4 8 12 1 6 20
P e r c e n t
Germany
-0.50
-0.25
0.00
0.25
0.50
0 4 8 12 16 20
P e r c e n t
Greece
-0.50
-0.25
0.00
0.25
0.50
0 4 8 12 16 2 0
P e r c e n t
India
-0.50
-0.25
0.00
0.25
0.50
0 4 8 12 16 2 0
P e r c e n t
Indonesia
-0.50
-0.25
0.00
0.25
0.50
0 4 8 12 16 2 0
P e r c e n t
Ireland
-0.50
-0.25
0.00
0.25
0.50
0 4 8 12 1 6 20
P e r c e n t
Italy
-0.50
-0.25
0.00
0.25
0.50
0 4 8 12 16 20
P e r c e n t
Japan
-0.50
-0.25
0.00
0.25
0.50
0 4 8 12 16 2 0
P e r c e n t
Korea
-0.50
-0.25
0.00
0.25
0.50
0 4 8 12 16 2 0
P e r c e n t
Mexico
-0.50
-0.25
0.00
0.25
0.50
0 4 8 12 16 2 0
P e r c e n t
Netherlands
-0.50
-0.25
0.00
0.25
0.50
0 4 8 12 1 6 20
P e r c e n t
New Zealand
-0.50
-0.25
0.00
0.25
0.50
0 4 8 12 16 20
P e r c e n t
Norway
-0.50
-0.25
0.00
0.25
0.50
0 4 8 12 16 2 0
P e r c e n t
Poland
-0.50
-0.25
0.00
0.25
0.50
0 4 8 12 16 2 0
P e r c e n t
Portugal
-0.50
-0.25
0.00
0.25
0.50
0 4 8 12 16 2 0
P e r c e n t
Russia
-0.50
-0.25
0.00
0.25
0.50
0 4 8 12 1 6 20
P e r c e n t
Saudi Arabia
-0.50
-0.25
0.00
0.25
0.50
0 4 8 12 16 20
P e r c e n t
South Africa
-0.50
-0.25
0.00
0.25
0.50
0 4 8 12 16 2 0
P e r c e n t
Spain
-0.50
-0.25
0.00
0.25
0.50
0 4 8 12 16 2 0
P e r c e n t
Sweden
-0.50
-0.25
0.00
0.25
0.50
0 4 8 12 16 2 0
P e r c e n t
Switzerland
-0.50
-0.25
0.00
0.25
0.50
0 4 8 12 1 6 20
P e r c e n t
Thailand
-0.50
-0.25
0.00
0.25
0.50
0 4 8 12 16 20
P e r c e n t
Turkey
-0.50
-0.25
0.00
0.25
0.50
0 4 8 12 16 2 0
P e r c e n t
United Kingdom
-0.50
-0.25
0.00
0.25
0.50
0 4 8 12 16 2 0
P e r c e n t
United States
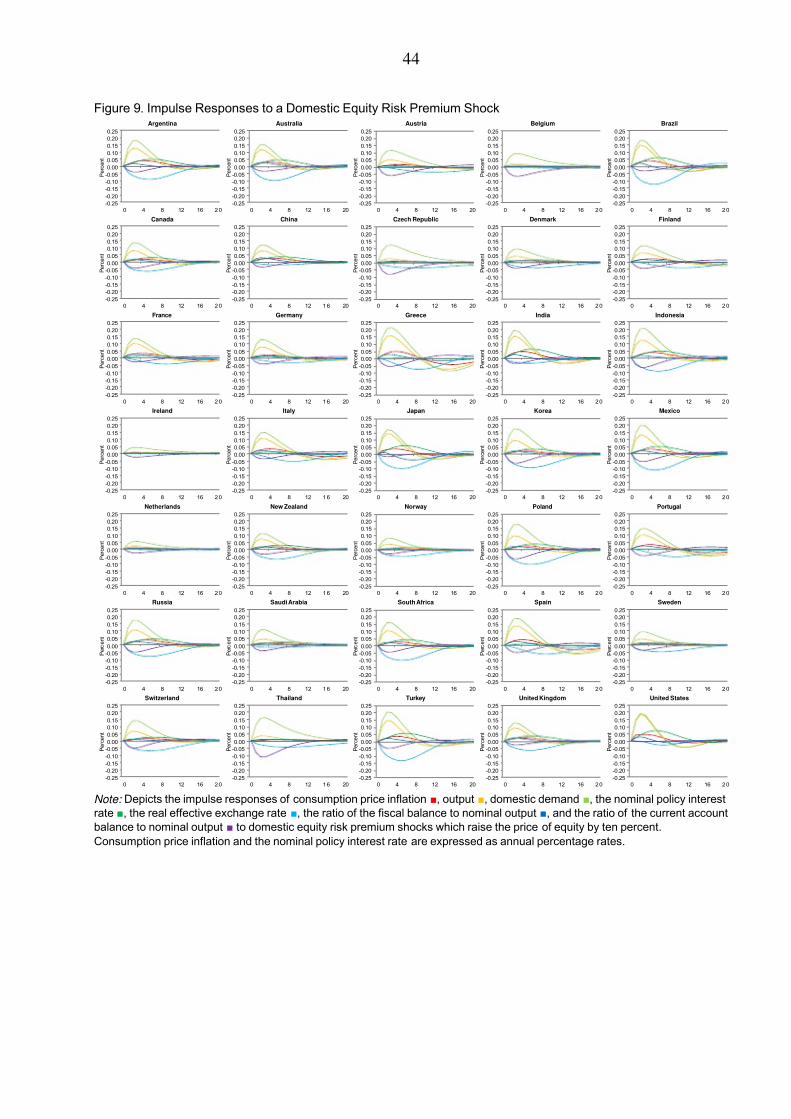
7/30/2019 IMF - Policy Analysis and Forecasting in the World Economy: A Panel Unobserved Components Approach
http://slidepdf.com/reader/full/imf-policy-analysis-and-forecasting-in-the-world-economy-a-panel-unobserved 45/77
44
Figure 9. Impulse Responses to a Domestic Equity Risk Premium Shock
Note: Depicts the impulse responses of consumption price inflation ■, output ■, domestic demand ■, the nominal policy interest
rate ■, the real effective exchange rate ■, the ratio of the fiscal balance to nominal output ■, and the ratio of the current account
balance to nominal output ■ to domestic equity risk premium shocks which raise the price of equity by ten percent.
Consumption price inflation and the nominal policy interest rate are expressed as annual percentage rates.
-0.25
-0.20
-0.15
-0.10
-0.05
0.00
0.05
0.10
0.15
0.20
0.25
0 4 8 12 16 2 0
P e r c e n t
Argentina
-0.25
-0.20
-0.15
-0.10
-0.05
0.00
0.05
0.10
0.15
0.20
0.25
0 4 8 12 1 6 20
P e r c e n t
Australia
-0.25
-0.20
-0.15
-0.10
-0.05
0.00
0.05
0.10
0.15
0.20
0.25
0 4 8 12 16 20
P e r c e n t
Austria
-0.25
-0.20
-0.15
-0.10
-0.05
0.00
0.05
0.10
0.15
0.20
0.25
0 4 8 12 16 2 0
P e r c e n t
Belgium
-0.25
-0.20
-0.15
-0.10
-0.05
0.00
0.05
0.10
0.15
0.20
0.25
0 4 8 12 16 2 0
P e r c e n t
Brazil
-0.25
-0.20
-0.15
-0.10
-0.05
0.00
0.05
0.10
0.15
0.20
0.25
0 4 8 12 16 2 0
P e r c e n t
Canada
-0.25
-0.20
-0.15
-0.10
-0.05
0.00
0.05
0.10
0.15
0.20
0.25
0 4 8 12 1 6 20
P e r c e n t
China
-0.25
-0.20
-0.15
-0.10
-0.05
0.00
0.05
0.10
0.15
0.20
0.25
0 4 8 12 16 20
P e r c e n t
Czech Republic
-0.25
-0.20
-0.15
-0.10
-0.05
0.00
0.05
0.10
0.15
0.20
0.25
0 4 8 12 16 2 0
P e r c e n t
Denmark
-0.25
-0.20
-0.15
-0.10
-0.05
0.00
0.05
0.10
0.15
0.20
0.25
0 4 8 12 16 2 0
P e r c e n t
Finland
-0.25
-0.20
-0.15
-0.10
-0.05
0.00
0.05
0.10
0.15
0.20
0.25
0 4 8 12 16 2 0
P e r c e n t
France
-0.25
-0.20
-0.15
-0.10
-0.05
0.00
0.05
0.10
0.15
0.20
0.25
0 4 8 12 1 6 20
P e r c e n t
Germany
-0.25
-0.20
-0.15
-0.10
-0.05
0.00
0.05
0.10
0.15
0.20
0.25
0 4 8 12 16 20
P e r c e n t
Greece
-0.25
-0.20
-0.15
-0.10
-0.05
0.00
0.05
0.10
0.15
0.20
0.25
0 4 8 12 16 2 0
P e r c e n t
India
-0.25
-0.20
-0.15
-0.10
-0.05
0.00
0.05
0.10
0.15
0.20
0.25
0 4 8 12 16 2 0
P e r c e n t
Indonesia
-0.25
-0.20
-0.15
-0.10
-0.05
0.00
0.05
0.10
0.15
0.20
0.25
0 4 8 12 16 2 0
P e r c e n t
Ireland
-0.25
-0.20
-0.15
-0.10
-0.05
0.00
0.05
0.10
0.15
0.20
0.25
0 4 8 12 1 6 20
P e r c e n t
Italy
-0.25
-0.20
-0.15
-0.10
-0.05
0.00
0.05
0.10
0.15
0.20
0.25
0 4 8 12 16 20
P e r c e n t
Japan
-0.25
-0.20
-0.15
-0.10
-0.05
0.00
0.05
0.10
0.15
0.20
0.25
0 4 8 12 16 2 0
P e r c e n t
Korea
-0.25
-0.20
-0.15
-0.10
-0.05
0.00
0.05
0.10
0.15
0.20
0.25
0 4 8 12 16 2 0
P e r c e n t
Mexico
-0.25
-0.20
-0.15
-0.10
-0.05
0.00
0.05
0.10
0.15
0.20
0.25
0 4 8 12 16 2 0
P e r c e n t
Netherlands
-0.25
-0.20
-0.15
-0.10
-0.05
0.00
0.05
0.10
0.15
0.20
0.25
0 4 8 12 1 6 20
P e r c e n t
New Zealand
-0.25
-0.20
-0.15
-0.10
-0.05
0.00
0.05
0.10
0.15
0.20
0.25
0 4 8 12 16 20
P e r c e n t
Norway
-0.25
-0.20
-0.15
-0.10
-0.05
0.00
0.05
0.10
0.15
0.20
0.25
0 4 8 12 16 2 0
P e r c e n t
Poland
-0.25
-0.20
-0.15
-0.10
-0.05
0.00
0.05
0.10
0.15
0.20
0.25
0 4 8 12 16 2 0
P e r c e n t
Portugal
-0.25
-0.20
-0.15
-0.10
-0.05
0.00
0.05
0.10
0.15
0.20
0.25
0 4 8 12 16 2 0
P e r c e n t
Russia
-0.25
-0.20
-0.15
-0.10
-0.05
0.00
0.05
0.10
0.15
0.20
0.25
0 4 8 12 1 6 20
P e r c e n t
Saudi Arabia
-0.25
-0.20
-0.15
-0.10
-0.05
0.00
0.05
0.10
0.15
0.20
0.25
0 4 8 12 16 20
P e r c e n t
South Africa
-0.25
-0.20
-0.15
-0.10
-0.05
0.00
0.05
0.10
0.15
0.20
0.25
0 4 8 12 16 2 0
P e r c e n t
Spain
-0.25
-0.20
-0.15
-0.10
-0.05
0.00
0.05
0.10
0.15
0.20
0.25
0 4 8 12 16 2 0
P e r c e n t
Sweden
-0.25
-0.20
-0.15
-0.10
-0.05
0.00
0.05
0.10
0.15
0.20
0.25
0 4 8 12 16 2 0
P e r c e n t
Switzerland
-0.25
-0.20
-0.15
-0.10
-0.05
0.00
0.05
0.10
0.15
0.20
0.25
0 4 8 12 1 6 20
P e r c e n t
Thailand
-0.25
-0.20
-0.15
-0.10
-0.05
0.00
0.05
0.10
0.15
0.20
0.25
0 4 8 12 16 20
P e r c e n t
Turkey
-0.25
-0.20
-0.15
-0.10
-0.05
0.00
0.05
0.10
0.15
0.20
0.25
0 4 8 12 16 2 0
P e r c e n t
United Kingdom
-0.25
-0.20
-0.15
-0.10
-0.05
0.00
0.05
0.10
0.15
0.20
0.25
0 4 8 12 16 2 0
P e r c e n t
United States
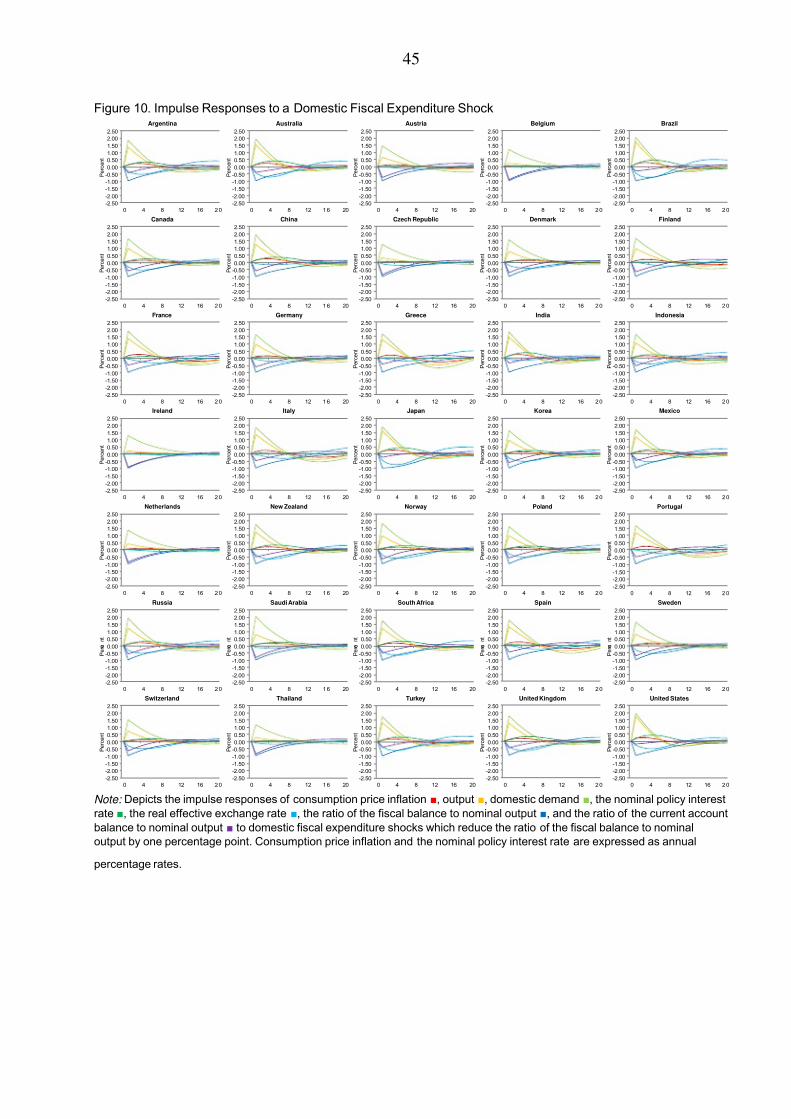
7/30/2019 IMF - Policy Analysis and Forecasting in the World Economy: A Panel Unobserved Components Approach
http://slidepdf.com/reader/full/imf-policy-analysis-and-forecasting-in-the-world-economy-a-panel-unobserved 46/77
45
Figure 10. Impulse Responses to a Domestic Fiscal Expenditure Shock
Note: Depicts the impulse responses of consumption price inflation ■, output ■, domestic demand ■, the nominal policy interest
rate ■, the real effective exchange rate ■, the ratio of the fiscal balance to nominal output ■, and the ratio of the current account
balance to nominal output ■ to domestic fiscal expenditure shocks which reduce the ratio of the fiscal balance to nominal
output by one percentage point. Consumption price inflation and the nominal policy interest rate are expressed as annual
percentage rates.
-2.50
-2.00
-1.50
-1.00
-0.50
0.00
0.50
1.00
1.50
2.00
2.50
0 4 8 12 16 2 0
P e r c e n t
Argentina
-2.50
-2.00
-1.50
-1.00
-0.50
0.00
0.50
1.00
1.50
2.00
2.50
0 4 8 12 1 6 20
P e r c e n t
Australia
-2.50
-2.00
-1.50
-1.00
-0.50
0.00
0.50
1.00
1.50
2.00
2.50
0 4 8 12 16 20
P e r c e n t
Austria
-2.50
-2.00
-1.50
-1.00
-0.50
0.00
0.50
1.00
1.50
2.00
2.50
0 4 8 12 16 2 0
P e r c e n t
Belgium
-2.50
-2.00
-1.50
-1.00
-0.50
0.00
0.50
1.00
1.50
2.00
2.50
0 4 8 12 16 2 0
P e r c e n t
Brazil
-2.50
-2.00
-1.50
-1.00
-0.50
0.00
0.50
1.00
1.50
2.00
2.50
0 4 8 12 16 2 0
P e r c e n t
Canada
-2.50
-2.00
-1.50
-1.00
-0.50
0.00
0.50
1.00
1.50
2.00
2.50
0 4 8 12 1 6 20
P e r c e n t
China
-2.50
-2.00
-1.50
-1.00
-0.50
0.00
0.50
1.00
1.50
2.00
2.50
0 4 8 12 16 20
P e r c e n t
Czech Republic
-2.50
-2.00
-1.50
-1.00
-0.50
0.00
0.50
1.00
1.50
2.00
2.50
0 4 8 12 16 2 0
P e r c e n t
Denmark
-2.50
-2.00
-1.50
-1.00
-0.50
0.00
0.50
1.00
1.50
2.00
2.50
0 4 8 12 16 2 0
P e r c e n t
Finland
-2.50
-2.00
-1.50
-1.00
-0.50
0.00
0.50
1.00
1.50
2.00
2.50
0 4 8 12 16 2 0
P e r c e n t
France
-2.50
-2.00
-1.50
-1.00
-0.50
0.00
0.50
1.00
1.50
2.00
2.50
0 4 8 12 1 6 20
P e r c e n t
Germany
-2.50
-2.00
-1.50
-1.00
-0.50
0.00
0.50
1.00
1.50
2.00
2.50
0 4 8 12 16 20
P e r c e n t
Greece
-2.50
-2.00
-1.50
-1.00
-0.50
0.00
0.50
1.00
1.50
2.00
2.50
0 4 8 12 16 2 0
P e r c e n t
India
-2.50
-2.00
-1.50
-1.00
-0.50
0.00
0.50
1.00
1.50
2.00
2.50
0 4 8 12 16 2 0
P e r c e n t
Indonesia
-2.50
-2.00
-1.50
-1.00
-0.50
0.00
0.50
1.00
1.50
2.00
2.50
0 4 8 12 16 2 0
P e r c e n t
Ireland
-2.50
-2.00
-1.50
-1.00
-0.50
0.00
0.50
1.00
1.50
2.00
2.50
0 4 8 12 1 6 20
P e r c e n t
Italy
-2.50
-2.00
-1.50
-1.00
-0.50
0.00
0.50
1.00
1.50
2.00
2.50
0 4 8 12 16 20
P e r c e n t
Japan
-2.50
-2.00
-1.50
-1.00
-0.50
0.00
0.50
1.00
1.50
2.00
2.50
0 4 8 12 16 2 0
P e r c e n t
Korea
-2.50
-2.00
-1.50
-1.00
-0.50
0.00
0.50
1.00
1.50
2.00
2.50
0 4 8 12 16 2 0
P e r c e n t
Mexico
-2.50
-2.00
-1.50
-1.00
-0.50
0.00
0.50
1.00
1.50
2.00
2.50
0 4 8 12 16 2 0
P e r c e n t
Netherlands
-2.50
-2.00
-1.50
-1.00
-0.50
0.00
0.50
1.00
1.50
2.00
2.50
0 4 8 12 1 6 20
P e r c e n t
New Zealand
-2.50
-2.00
-1.50
-1.00
-0.50
0.00
0.50
1.00
1.50
2.00
2.50
0 4 8 12 16 20
P e r c e n t
Norway
-2.50
-2.00
-1.50
-1.00
-0.50
0.00
0.50
1.00
1.50
2.00
2.50
0 4 8 12 16 2 0
P e r c e n t
Poland
-2.50
-2.00
-1.50
-1.00
-0.50
0.00
0.50
1.00
1.50
2.00
2.50
0 4 8 12 16 2 0
P e r c e n t
Portugal
-2.50
-2.00
-1.50
-1.00
-0.50
0.00
0.50
1.00
1.50
2.00
2.50
0 4 8 12 16 2 0
P e r c e
n t
Russia
-2.50
-2.00
-1.50
-1.00
-0.50
0.00
0.50
1.00
1.50
2.00
2.50
0 4 8 12 1 6 20
P e r c e
n t
Saudi Arabia
-2.50
-2.00
-1.50
-1.00
-0.50
0.00
0.50
1.00
1.50
2.00
2.50
0 4 8 12 16 20
P e r c e
n t
South Africa
-2.50
-2.00
-1.50
-1.00
-0.50
0.00
0.50
1.00
1.50
2.00
2.50
0 4 8 12 16 2 0
P e r c e
n t
Spain
-2.50
-2.00
-1.50
-1.00
-0.50
0.00
0.50
1.00
1.50
2.00
2.50
0 4 8 12 16 2 0
P e r c e
n t
Sweden
-2.50
-2.00
-1.50
-1.00
-0.50
0.00
0.50
1.00
1.50
2.00
2.50
0 4 8 12 16 2 0
P e r c e n t
Switzerland
-2.50
-2.00
-1.50
-1.00
-0.50
0.00
0.50
1.00
1.50
2.00
2.50
0 4 8 12 1 6 20
P e r c e n t
Thailand
-2.50
-2.00
-1.50
-1.00
-0.50
0.00
0.50
1.00
1.50
2.00
2.50
0 4 8 12 16 20
P e r c e n t
Turkey
-2.50
-2.00
-1.50
-1.00
-0.50
0.00
0.50
1.00
1.50
2.00
2.50
0 4 8 12 16 2 0
P e r c e n t
United Kingdom
-2.50
-2.00
-1.50
-1.00
-0.50
0.00
0.50
1.00
1.50
2.00
2.50
0 4 8 12 16 2 0
P e r c e n t
United States
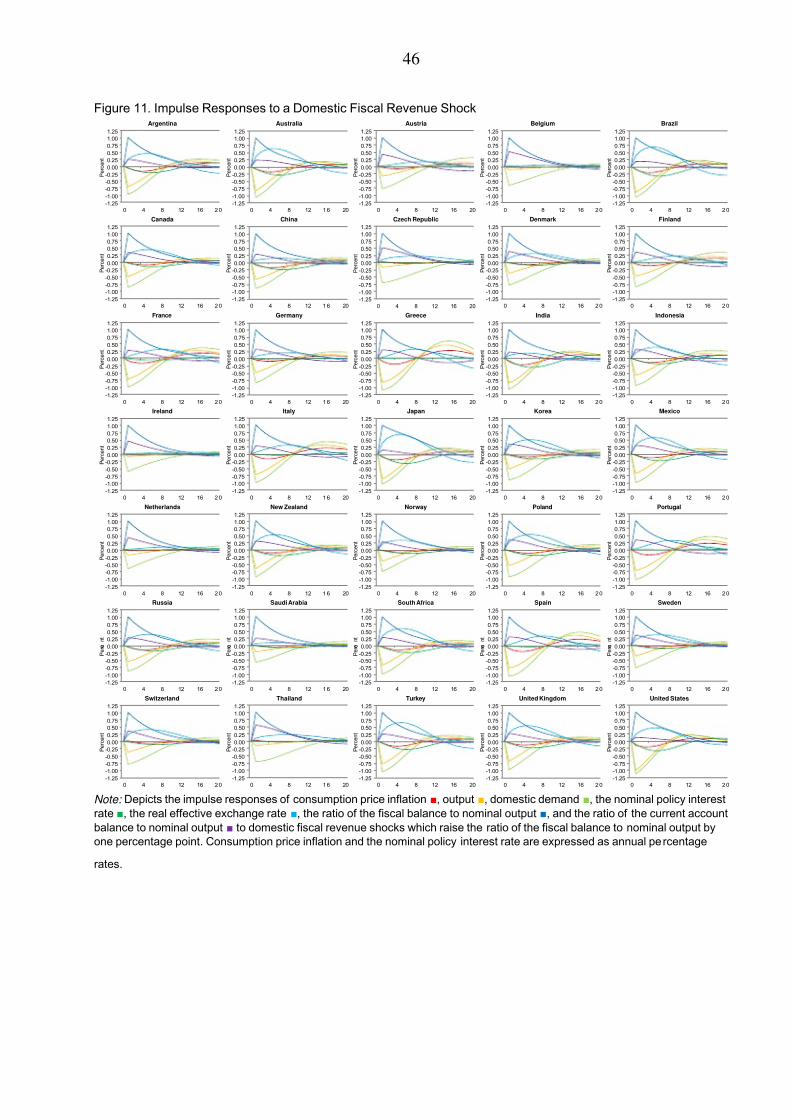
7/30/2019 IMF - Policy Analysis and Forecasting in the World Economy: A Panel Unobserved Components Approach
http://slidepdf.com/reader/full/imf-policy-analysis-and-forecasting-in-the-world-economy-a-panel-unobserved 47/77
46
Figure 11. Impulse Responses to a Domestic Fiscal Revenue Shock
Note: Depicts the impulse responses of consumption price inflation ■, output ■, domestic demand ■, the nominal policy interest
rate ■, the real effective exchange rate ■, the ratio of the fiscal balance to nominal output ■, and the ratio of the current account
balance to nominal output ■ to domestic fiscal revenue shocks which raise the ratio of the fiscal balance to nominal output by
one percentage point. Consumption price inflation and the nominal policy interest rate are expressed as annual percentage
rates.
-1.25
-1.00
-0.75
-0.50
-0.25
0.00
0.25
0.50
0.75
1.00
1.25
0 4 8 12 16 2 0
P e r c e n t
Argentina
-1.25
-1.00
-0.75
-0.50
-0.25
0.00
0.25
0.50
0.75
1.00
1.25
0 4 8 12 1 6 20
P e r c e n t
Australia
-1.25
-1.00
-0.75
-0.50
-0.25
0.00
0.25
0.50
0.75
1.00
1.25
0 4 8 12 16 20
P e r c e n t
Austria
-1.25
-1.00
-0.75
-0.50
-0.25
0.00
0.25
0.50
0.75
1.00
1.25
0 4 8 12 16 2 0
P e r c e n t
Belgium
-1.25
-1.00
-0.75
-0.50
-0.25
0.00
0.25
0.50
0.75
1.00
1.25
0 4 8 12 16 2 0
P e r c e n t
Brazil
-1.25
-1.00
-0.75
-0.50
-0.25
0.00
0.25
0.50
0.75
1.00
1.25
0 4 8 12 16 2 0
P e r c e n t
Canada
-1.25
-1.00
-0.75
-0.50
-0.25
0.00
0.25
0.50
0.75
1.00
1.25
0 4 8 12 1 6 20
P e r c e n t
China
-1.25
-1.00
-0.75
-0.50
-0.25
0.00
0.25
0.50
0.75
1.00
1.25
0 4 8 12 16 20
P e r c e n t
Czech Republic
-1.25
-1.00
-0.75
-0.50
-0.25
0.00
0.25
0.50
0.75
1.00
1.25
0 4 8 12 16 2 0
P e r c e n t
Denmark
-1.25
-1.00
-0.75
-0.50
-0.25
0.00
0.25
0.50
0.75
1.00
1.25
0 4 8 12 16 2 0
P e r c e n t
Finland
-1.25
-1.00
-0.75
-0.50
-0.25
0.00
0.25
0.50
0.75
1.00
1.25
0 4 8 12 16 2 0
P e r c e n t
France
-1.25
-1.00
-0.75
-0.50
-0.25
0.00
0.25
0.50
0.75
1.00
1.25
0 4 8 12 1 6 20
P e r c e n t
Germany
-1.25
-1.00
-0.75
-0.50
-0.25
0.00
0.25
0.50
0.75
1.00
1.25
0 4 8 12 16 20
P e r c e n t
Greece
-1.25
-1.00
-0.75
-0.50
-0.25
0.00
0.25
0.50
0.75
1.00
1.25
0 4 8 12 16 2 0
P e r c e n t
India
-1.25
-1.00
-0.75
-0.50
-0.25
0.00
0.25
0.50
0.75
1.00
1.25
0 4 8 12 16 2 0
P e r c e n t
Indonesia
-1.25
-1.00
-0.75
-0.50
-0.25
0.00
0.25
0.50
0.75
1.00
1.25
0 4 8 12 16 2 0
P e r c e n t
Ireland
-1.25
-1.00
-0.75
-0.50
-0.25
0.00
0.25
0.50
0.75
1.00
1.25
0 4 8 12 1 6 20
P e r c e n t
Italy
-1.25
-1.00
-0.75
-0.50
-0.25
0.00
0.25
0.50
0.75
1.00
1.25
0 4 8 12 16 20
P e r c e n t
Japan
-1.25
-1.00
-0.75
-0.50
-0.25
0.00
0.25
0.50
0.75
1.00
1.25
0 4 8 12 16 2 0
P e r c e n t
Korea
-1.25
-1.00
-0.75
-0.50
-0.25
0.00
0.25
0.50
0.75
1.00
1.25
0 4 8 12 16 2 0
P e r c e n t
Mexico
-1.25
-1.00
-0.75
-0.50
-0.25
0.00
0.25
0.50
0.75
1.00
1.25
0 4 8 12 16 2 0
P e r c e n t
Netherlands
-1.25
-1.00
-0.75
-0.50
-0.25
0.00
0.25
0.50
0.75
1.00
1.25
0 4 8 12 1 6 20
P e r c e n t
New Zealand
-1.25
-1.00
-0.75
-0.50
-0.25
0.00
0.25
0.50
0.75
1.00
1.25
0 4 8 12 16 20
P e r c e n t
Norway
-1.25
-1.00
-0.75
-0.50
-0.25
0.00
0.25
0.50
0.75
1.00
1.25
0 4 8 12 16 2 0
P e r c e n t
Poland
-1.25
-1.00
-0.75
-0.50
-0.25
0.00
0.25
0.50
0.75
1.00
1.25
0 4 8 12 16 2 0
P e r c e n t
Portugal
-1.25
-1.00
-0.75
-0.50
-0.25
0.00
0.25
0.50
0.75
1.00
1.25
0 4 8 12 16 2 0
P e r c e
n t
Russia
-1.25
-1.00
-0.75
-0.50
-0.25
0.00
0.25
0.50
0.75
1.00
1.25
0 4 8 12 1 6 20
P e r c e
n t
Saudi Arabia
-1.25
-1.00
-0.75
-0.50
-0.25
0.00
0.25
0.50
0.75
1.00
1.25
0 4 8 12 16 20
P e r c e
n t
South Africa
-1.25
-1.00
-0.75
-0.50
-0.25
0.00
0.25
0.50
0.75
1.00
1.25
0 4 8 12 16 2 0
P e r c e
n t
Spain
-1.25
-1.00
-0.75
-0.50
-0.25
0.00
0.25
0.50
0.75
1.00
1.25
0 4 8 12 16 2 0
P e r c e
n t
Sweden
-1.25
-1.00
-0.75
-0.50
-0.25
0.00
0.25
0.50
0.75
1.00
1.25
0 4 8 12 16 2 0
P e r c e n t
Switzerland
-1.25
-1.00
-0.75
-0.50
-0.25
0.00
0.25
0.50
0.75
1.00
1.25
0 4 8 12 1 6 20
P e r c e n t
Thailand
-1.25
-1.00
-0.75
-0.50
-0.25
0.00
0.25
0.50
0.75
1.00
1.25
0 4 8 12 16 20
P e r c e n t
Turkey
-1.25
-1.00
-0.75
-0.50
-0.25
0.00
0.25
0.50
0.75
1.00
1.25
0 4 8 12 16 2 0
P e r c e n t
United Kingdom
-1.25
-1.00
-0.75
-0.50
-0.25
0.00
0.25
0.50
0.75
1.00
1.25
0 4 8 12 16 2 0
P e r c e n t
United States
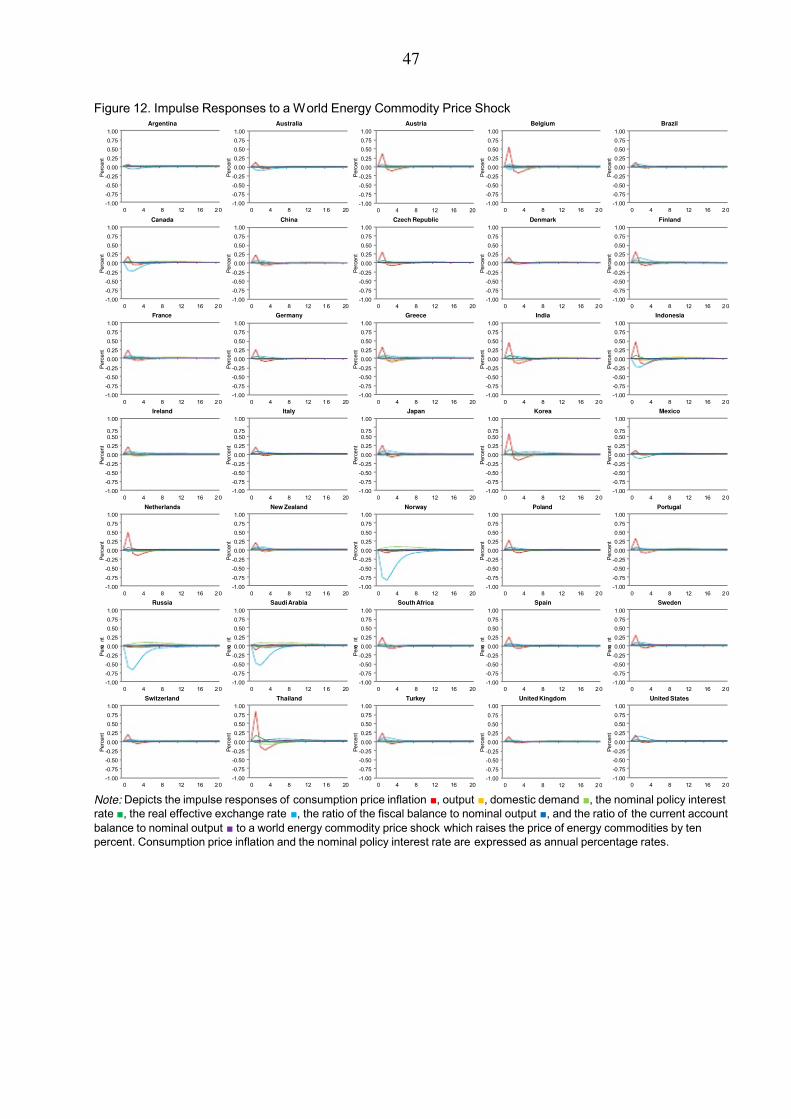
7/30/2019 IMF - Policy Analysis and Forecasting in the World Economy: A Panel Unobserved Components Approach
http://slidepdf.com/reader/full/imf-policy-analysis-and-forecasting-in-the-world-economy-a-panel-unobserved 48/77
47
Figure 12. Impulse Responses to a World Energy Commodity Price Shock
Note: Depicts the impulse responses of consumption price inflation ■, output ■, domestic demand ■, the nominal policy interest
rate ■, the real effective exchange rate ■, the ratio of the fiscal balance to nominal output ■, and the ratio of the current account
balance to nominal output ■ to a world energy commodity price shock which raises the price of energy commodities by ten
percent. Consumption price inflation and the nominal policy interest rate are expressed as annual percentage rates.
-1.00
-0.75
-0.50
-0.25
0.00
0.25
0.50
0.75
1.00
0 4 8 12 16 2 0
P e r c e n t
Argentina
-1.00
-0.75
-0.50
-0.25
0.00
0.25
0.50
0.75
1.00
0 4 8 12 1 6 20
P e r c e n t
Australia
-1.00
-0.75
-0.50
-0.25
0.00
0.25
0.50
0.75
1.00
0 4 8 12 16 20
P e r c e n t
Austria
-1.00
-0.75
-0.50
-0.25
0.00
0.25
0.50
0.75
1.00
0 4 8 12 16 2 0
P e r c e n t
Belgium
-1.00
-0.75
-0.50
-0.25
0.00
0.25
0.50
0.75
1.00
0 4 8 12 16 2 0
P e r c e n t
Brazil
-1.00
-0.75
-0.50
-0.25
0.00
0.25
0.50
0.75
1.00
0 4 8 12 16 2 0
P e r c e n t
Canada
-1.00
-0.75
-0.50
-0.25
0.00
0.25
0.50
0.75
1.00
0 4 8 12 1 6 20
P e r c e n t
China
-1.00
-0.75
-0.50
-0.25
0.00
0.25
0.50
0.75
1.00
0 4 8 12 16 20
P e r c e n t
Czech Republic
-1.00
-0.75
-0.50
-0.25
0.00
0.25
0.50
0.75
1.00
0 4 8 12 16 2 0
P e r c e n t
Denmark
-1.00
-0.75
-0.50
-0.25
0.00
0.25
0.50
0.75
1.00
0 4 8 12 16 2 0
P e r c e n t
Finland
-1.00
-0.75
-0.50
-0.25
0.00
0.25
0.50
0.75
1.00
0 4 8 12 16 2 0
P e r c e n t
France
-1.00
-0.75
-0.50
-0.25
0.00
0.25
0.50
0.75
1.00
0 4 8 12 1 6 20
P e r c e n t
Germany
-1.00
-0.75
-0.50
-0.25
0.00
0.25
0.50
0.75
1.00
0 4 8 12 16 20
P e r c e n t
Greece
-1.00
-0.75
-0.50
-0.25
0.00
0.25
0.50
0.75
1.00
0 4 8 12 16 2 0
P e r c e n t
India
-1.00
-0.75
-0.50
-0.25
0.00
0.25
0.50
0.75
1.00
0 4 8 12 16 2 0
P e r c e n t
Indonesia
-1.00
-0.75
-0.50
-0.25
0.00
0.25
0.50
0.75
1.00
0 4 8 12 16 2 0
P e r c e n t
Ireland
-1.00
-0.75
-0.50
-0.25
0.00
0.25
0.50
0.75
1.00
0 4 8 12 1 6 20
P e r c e n t
Italy
-1.00
-0.75
-0.50
-0.25
0.00
0.25
0.50
0.75
1.00
0 4 8 12 16 20
P e r c e n t
Japan
-1.00
-0.75
-0.50
-0.25
0.00
0.25
0.50
0.75
1.00
0 4 8 12 16 2 0
P e r c e n t
Korea
-1.00
-0.75
-0.50
-0.25
0.00
0.25
0.50
0.75
1.00
0 4 8 12 16 2 0
P e r c e n t
Mexico
-1.00
-0.75
-0.50
-0.25
0.00
0.25
0.50
0.75
1.00
0 4 8 12 16 2 0
P e r c e n t
Netherlands
-1.00
-0.75
-0.50
-0.25
0.00
0.25
0.50
0.75
1.00
0 4 8 12 1 6 20
P e r c e n t
New Zealand
-1.00
-0.75
-0.50
-0.25
0.00
0.25
0.50
0.75
1.00
0 4 8 12 16 20
P e r c e n t
Norway
-1.00
-0.75
-0.50
-0.25
0.00
0.25
0.50
0.75
1.00
0 4 8 12 16 2 0
P e r c e n t
Poland
-1.00
-0.75
-0.50
-0.25
0.00
0.25
0.50
0.75
1.00
0 4 8 12 16 2 0
P e r c e n t
Portugal
-1.00
-0.75
-0.50
-0.25
0.00
0.25
0.50
0.75
1.00
0 4 8 12 16 2 0
P e r c e
n t
Russia
-1.00
-0.75
-0.50
-0.25
0.00
0.25
0.50
0.75
1.00
0 4 8 12 1 6 20
P e r c e
n t
Saudi Arabia
-1.00
-0.75
-0.50
-0.25
0.00
0.25
0.50
0.75
1.00
0 4 8 12 16 20
P e r c e
n t
South Africa
-1.00
-0.75
-0.50
-0.25
0.00
0.25
0.50
0.75
1.00
0 4 8 12 16 2 0
P e r c e
n t
Spain
-1.00
-0.75
-0.50
-0.25
0.00
0.25
0.50
0.75
1.00
0 4 8 12 16 2 0
P e r c e
n t
Sweden
-1.00
-0.75
-0.50
-0.25
0.00
0.25
0.50
0.75
1.00
0 4 8 12 16 2 0
P e r c e n t
Switzerland
-1.00
-0.75
-0.50
-0.25
0.00
0.25
0.50
0.75
1.00
0 4 8 12 1 6 20
P e r c e n t
Thailand
-1.00
-0.75
-0.50
-0.25
0.00
0.25
0.50
0.75
1.00
0 4 8 12 16 20
P e r c e n t
Turkey
-1.00
-0.75
-0.50
-0.25
0.00
0.25
0.50
0.75
1.00
0 4 8 12 16 2 0
P e r c e n t
United Kingdom
-1.00
-0.75
-0.50
-0.25
0.00
0.25
0.50
0.75
1.00
0 4 8 12 16 2 0
P e r c e n t
United States
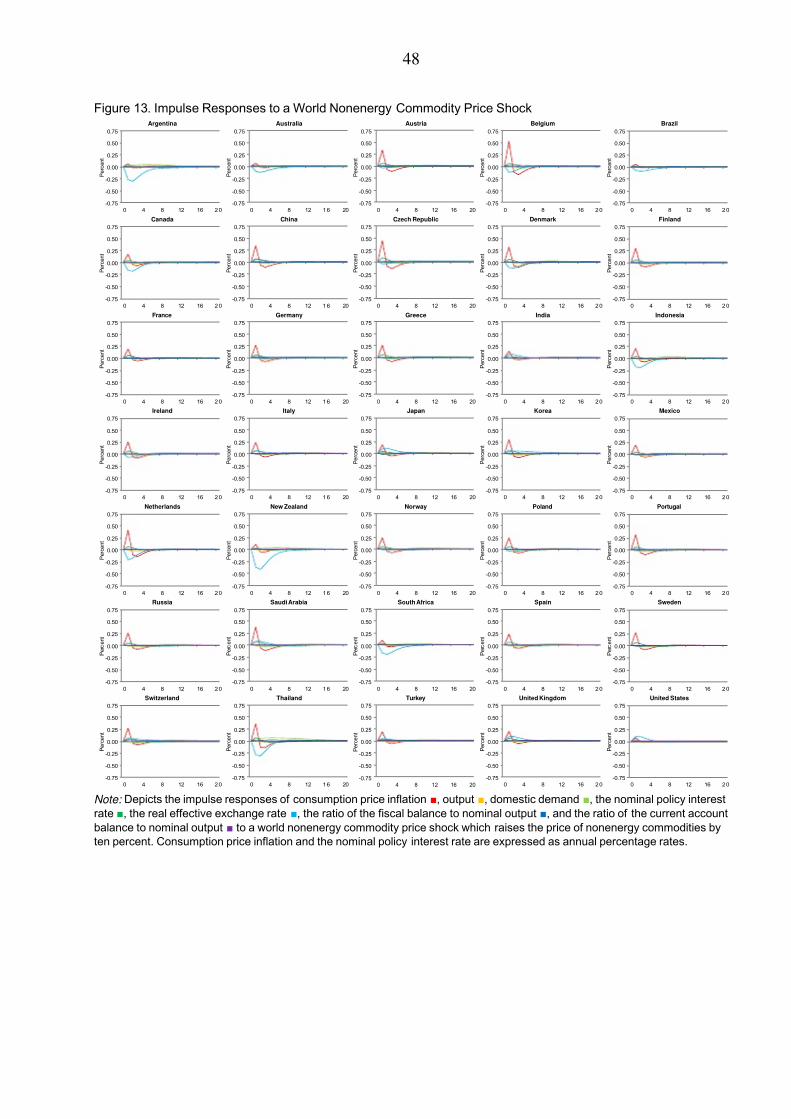
7/30/2019 IMF - Policy Analysis and Forecasting in the World Economy: A Panel Unobserved Components Approach
http://slidepdf.com/reader/full/imf-policy-analysis-and-forecasting-in-the-world-economy-a-panel-unobserved 49/77
48
Figure 13. Impulse Responses to a World Nonenergy Commodity Price Shock
Note: Depicts the impulse responses of consumption price inflation ■, output ■, domestic demand ■, the nominal policy interest
rate ■, the real effective exchange rate ■, the ratio of the fiscal balance to nominal output ■, and the ratio of the current account
balance to nominal output ■ to a world nonenergy commodity price shock which raises the price of nonenergy commodities by
ten percent. Consumption price inflation and the nominal policy interest rate are expressed as annual percentage rates.
-0.75
-0.50
-0.25
0.00
0.25
0.50
0.75
0 4 8 12 16 2 0
P e r c e n t
Argentina
-0.75
-0.50
-0.25
0.00
0.25
0.50
0.75
0 4 8 12 1 6 20
P e r c e n t
Australia
-0.75
-0.50
-0.25
0.00
0.25
0.50
0.75
0 4 8 12 16 20
P e r c e n t
Austria
-0.75
-0.50
-0.25
0.00
0.25
0.50
0.75
0 4 8 12 16 2 0
P e r c e n t
Belgium
-0.75
-0.50
-0.25
0.00
0.25
0.50
0.75
0 4 8 12 16 2 0
P e r c e n t
Brazil
-0.75
-0.50
-0.25
0.00
0.25
0.50
0.75
0 4 8 12 16 2 0
P e r c e n t
Canada
-0.75
-0.50
-0.25
0.00
0.25
0.50
0.75
0 4 8 12 1 6 20
P e r c e n t
China
-0.75
-0.50
-0.25
0.00
0.25
0.50
0.75
0 4 8 12 16 20
P e r c e n t
Czech Republic
-0.75
-0.50
-0.25
0.00
0.25
0.50
0.75
0 4 8 12 16 2 0
P e r c e n t
Denmark
-0.75
-0.50
-0.25
0.00
0.25
0.50
0.75
0 4 8 12 16 2 0
P e r c e n t
Finland
-0.75
-0.50
-0.25
0.00
0.25
0.50
0.75
0 4 8 12 16 2 0
P e r c e n t
France
-0.75
-0.50
-0.25
0.00
0.25
0.50
0.75
0 4 8 12 1 6 20
P e r c e n t
Germany
-0.75
-0.50
-0.25
0.00
0.25
0.50
0.75
0 4 8 12 16 20
P e r c e n t
Greece
-0.75
-0.50
-0.25
0.00
0.25
0.50
0.75
0 4 8 12 16 2 0
P e r c e n t
India
-0.75
-0.50
-0.25
0.00
0.25
0.50
0.75
0 4 8 12 16 2 0
P e r c e n t
Indonesia
-0.75
-0.50
-0.25
0.00
0.25
0.50
0.75
0 4 8 12 16 2 0
P e r c e n t
Ireland
-0.75
-0.50
-0.25
0.00
0.25
0.50
0.75
0 4 8 12 1 6 20
P e r c e n t
Italy
-0.75
-0.50
-0.25
0.00
0.25
0.50
0.75
0 4 8 12 16 20
P e r c e n t
Japan
-0.75
-0.50
-0.25
0.00
0.25
0.50
0.75
0 4 8 12 16 2 0
P e r c e n t
Korea
-0.75
-0.50
-0.25
0.00
0.25
0.50
0.75
0 4 8 12 16 2 0
P e r c e n t
Mexico
-0.75
-0.50
-0.25
0.00
0.25
0.50
0.75
0 4 8 12 16 2 0
P e r c e n t
Netherlands
-0.75
-0.50
-0.25
0.00
0.25
0.50
0.75
0 4 8 12 1 6 20
P e r c e n t
New Zealand
-0.75
-0.50
-0.25
0.00
0.25
0.50
0.75
0 4 8 12 16 20
P e r c e n t
Norway
-0.75
-0.50
-0.25
0.00
0.25
0.50
0.75
0 4 8 12 16 2 0
P e r c e n t
Poland
-0.75
-0.50
-0.25
0.00
0.25
0.50
0.75
0 4 8 12 16 2 0
P e r c e n t
Portugal
-0.75
-0.50
-0.25
0.00
0.25
0.50
0.75
0 4 8 12 16 2 0
P e r c e n t
Russia
-0.75
-0.50
-0.25
0.00
0.25
0.50
0.75
0 4 8 12 1 6 20
P e r c e n t
Saudi Arabia
-0.75
-0.50
-0.25
0.00
0.25
0.50
0.75
0 4 8 12 16 20
P e r c e n t
South Africa
-0.75
-0.50
-0.25
0.00
0.25
0.50
0.75
0 4 8 12 16 2 0
P e r c e n t
Spain
-0.75
-0.50
-0.25
0.00
0.25
0.50
0.75
0 4 8 12 16 2 0
P e r c e n t
Sweden
-0.75
-0.50
-0.25
0.00
0.25
0.50
0.75
0 4 8 12 16 2 0
P e r c e n t
Switzerland
-0.75
-0.50
-0.25
0.00
0.25
0.50
0.75
0 4 8 12 1 6 20
P e r c e n t
Thailand
-0.75
-0.50
-0.25
0.00
0.25
0.50
0.75
0 4 8 12 16 20
P e r c e n t
Turkey
-0.75
-0.50
-0.25
0.00
0.25
0.50
0.75
0 4 8 12 16 2 0
P e r c e n t
United Kingdom
-0.75
-0.50
-0.25
0.00
0.25
0.50
0.75
0 4 8 12 16 2 0
P e r c e n t
United States
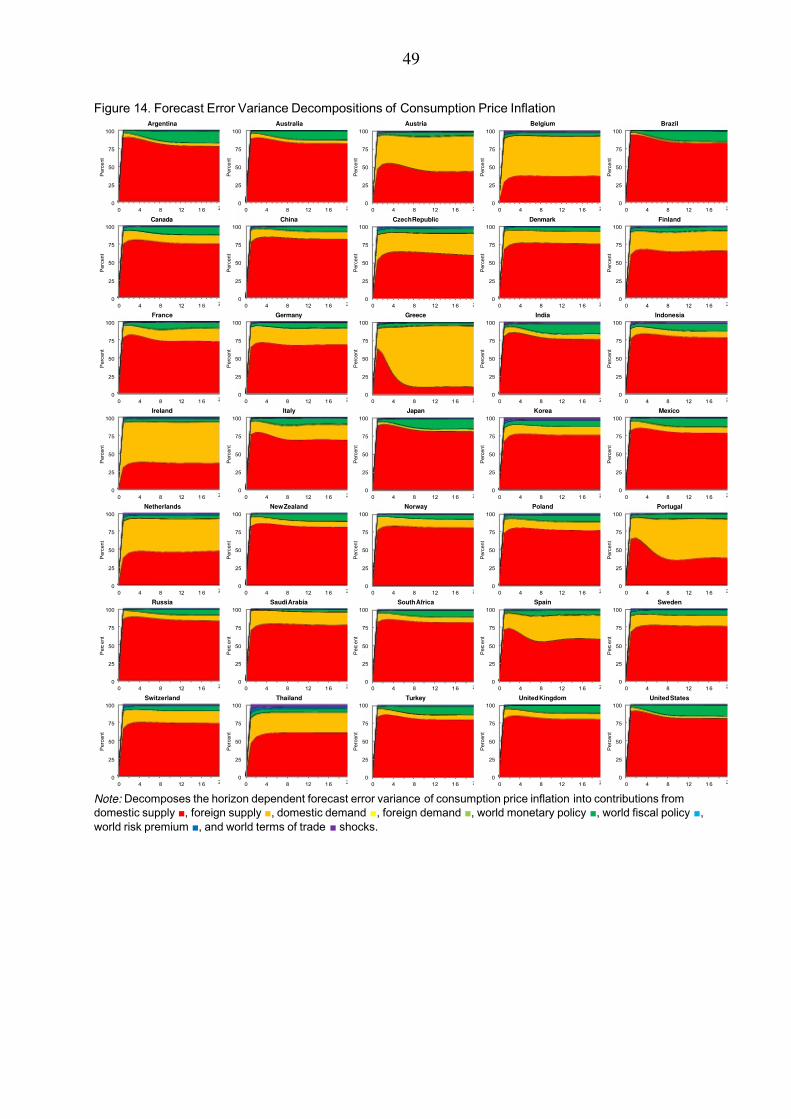
7/30/2019 IMF - Policy Analysis and Forecasting in the World Economy: A Panel Unobserved Components Approach
http://slidepdf.com/reader/full/imf-policy-analysis-and-forecasting-in-the-world-economy-a-panel-unobserved 50/77
49
Figure 14. Forecast Error Variance Decompositions of Consumption Price Inflation
Note: Decomposes the horizon dependent forecast error variance of consumption price inflation into contributions from
domestic supply ■, foreign supply ■, domestic demand ■, foreign demand ■, world monetary policy ■, world fiscal policy ■,
world risk premium ■, and world terms of trade ■ shocks.
0
25
50
75
100
0 4 8 12 1 6
P e r c e n t
Argentina
0
25
50
75
100
0 4 8 12 1 6
P e r c e n t
Australia
0
25
50
75
100
0 4 8 12 1 6
P e r c e n t
Austria
0
25
50
75
100
0 4 8 12 1 6
P e r c e n t
Belgium
0
25
50
75
100
0 4 8 12 1 6
P e r c e n t
Brazil
0
25
50
75
100
0 4 8 12 1 6
P e r c e n t
Canada
0
25
50
75
100
0 4 8 12 1 6
P e r c e n t
China
0
25
50
75
100
0 4 8 12 1 6
P e r c e n t
Czech Republic
0
25
50
75
100
0 4 8 12 1 6
P e r c e n t
Denmark
0
25
50
75
100
0 4 8 12 1 6
P e r c e n t
Finland
0
25
50
75
100
0 4 8 12 1 6
P e r c e n t
France
0
25
50
75
100
0 4 8 12 1 6
P e r c e n t
Germany
0
25
50
75
100
0 4 8 12 1 6
P e r c e n t
Greece
0
25
50
75
100
0 4 8 12 1 6
P e r c e n t
India
0
25
50
75
100
0 4 8 12 1 6
P e r c e n t
Indonesia
0
25
50
75
100
0 4 8 12 1 6
P e r c e n t
Ireland
0
25
50
75
100
0 4 8 12 1 6
P e r c e n t
Italy
0
25
50
75
100
0 4 8 12 1 6
P e r c e n t
Japan
0
25
50
75
100
0 4 8 12 1 6
P e r c e n t
Korea
0
25
50
75
100
0 4 8 12 1 6
P e r c e n t
Mexico
0
25
50
75
100
0 4 8 12 1 6
P e r c e n t
Netherlands
0
25
50
75
100
0 4 8 12 1 6
P e r c e n t
New Zealand
0
25
50
75
100
0 4 8 12 1 6
P e r c e n t
Norway
0
25
50
75
100
0 4 8 12 1 6
P e r c e n t
Poland
0
25
50
75
100
0 4 8 12 1 6
P e r c e n t
Portugal
0
25
50
75
100
0 4 8 12 1 6
P e r c e n t
Russia
0
25
50
75
100
0 4 8 12 1 6
P e r c e n t
Saudi Arabia
0
25
50
75
100
0 4 8 12 1 6
P e r c e n t
South Africa
0
25
50
75
100
0 4 8 12 1 6
P e r c e n t
Spain
0
25
50
75
100
0 4 8 12 1 6
P e r c e n t
Sweden
0
25
50
75
100
0 4 8 12 1 6
P e r c e n t
Switzerland
0
25
50
75
100
0 4 8 12 1 6
P e r c e n t
Thailand
0
25
50
75
100
0 4 8 12 1 6
P e r c e n t
Turkey
0
25
50
75
100
0 4 8 12 1 6
P e r c e n t
United Kingdom
0
25
50
75
100
0 4 8 12 1 6
P e r c e n t
United States

7/30/2019 IMF - Policy Analysis and Forecasting in the World Economy: A Panel Unobserved Components Approach
http://slidepdf.com/reader/full/imf-policy-analysis-and-forecasting-in-the-world-economy-a-panel-unobserved 51/77
50
Figure 15. Forecast Error Variance Decompositions of Output
Note: Decomposes the horizon dependent forecast error variance of output into contributions from domestic supply ■, foreign
supply ■, domestic demand ■, foreign demand ■, world monetary policy ■, world fiscal policy ■, world risk premium ■, and
world terms of trade ■ shocks.
0
25
50
75
100
0 4 8 12 1 6
P e r c e n t
Argentina
0
25
50
75
100
0 4 8 12 1 6
P e r c e n t
Australia
0
25
50
75
100
0 4 8 12 1 6
P e r c e n t
Austria
0
25
50
75
100
0 4 8 12 1 6
P e r c e n t
Belgium
0
25
50
75
100
0 4 8 12 1 6
P e r c e n t
Brazil
0
25
50
75
100
0 4 8 12 1 6
P e r c e n t
Canada
0
25
50
75
100
0 4 8 12 1 6
P e r c e n t
China
0
25
50
75
100
0 4 8 12 1 6
P e r c e n t
Czech Republic
0
25
50
75
100
0 4 8 12 1 6
P e r c e n t
Denmark
0
25
50
75
100
0 4 8 12 1 6
P e r c e n t
Finland
0
25
50
75
100
0 4 8 12 1 6
P e r c e n t
France
0
25
50
75
100
0 4 8 12 1 6
P e r c e n t
Germany
0
25
50
75
100
0 4 8 12 1 6
P e r c e n t
Greece
0
25
50
75
100
0 4 8 12 1 6
P e r c e n t
India
0
25
50
75
100
0 4 8 12 1 6
P e r c e n t
Indonesia
0
25
50
75
100
0 4 8 12 1 6
P e r c e n t
Ireland
0
25
50
75
100
0 4 8 12 1 6
P e r c e n t
Italy
0
25
50
75
100
0 4 8 12 1 6
P e r c e n t
Japan
0
25
50
75
100
0 4 8 12 1 6
P e r c e n t
Korea
0
25
50
75
100
0 4 8 12 1 6
P e r c e n t
Mexico
0
25
50
75
100
0 4 8 12 1 6
P e r c e n t
Netherlands
0
25
50
75
100
0 4 8 12 1 6
P e r c e n t
New Zealand
0
25
50
75
100
0 4 8 12 1 6
P e r c e n t
Norway
0
25
50
75
100
0 4 8 12 1 6
P e r c e n t
Poland
0
25
50
75
100
0 4 8 12 1 6
P e r c e n t
Portugal
0
25
50
75
100
0 4 8 12 1 6
P e r c e n t
Russia
0
25
50
75
100
0 4 8 12 1 6
P e r c e n t
Saudi Arabia
0
25
50
75
100
0 4 8 12 1 6
P e r c e n t
South Africa
0
25
50
75
100
0 4 8 12 1 6
P e r c e n t
Spain
0
25
50
75
100
0 4 8 12 1 6
P e r c e n t
Sweden
0
25
50
75
100
0 4 8 12 1 6
P e r c e n t
Switzerland
0
25
50
75
100
0 4 8 12 1 6
P e r c e n t
Thailand
0
25
50
75
100
0 4 8 12 1 6
P e r c e n t
Turkey
0
25
50
75
100
0 4 8 12 1 6
P e r c e n t
United Kingdom
0
25
50
75
100
0 4 8 12 1 6
P e r c e n t
United States
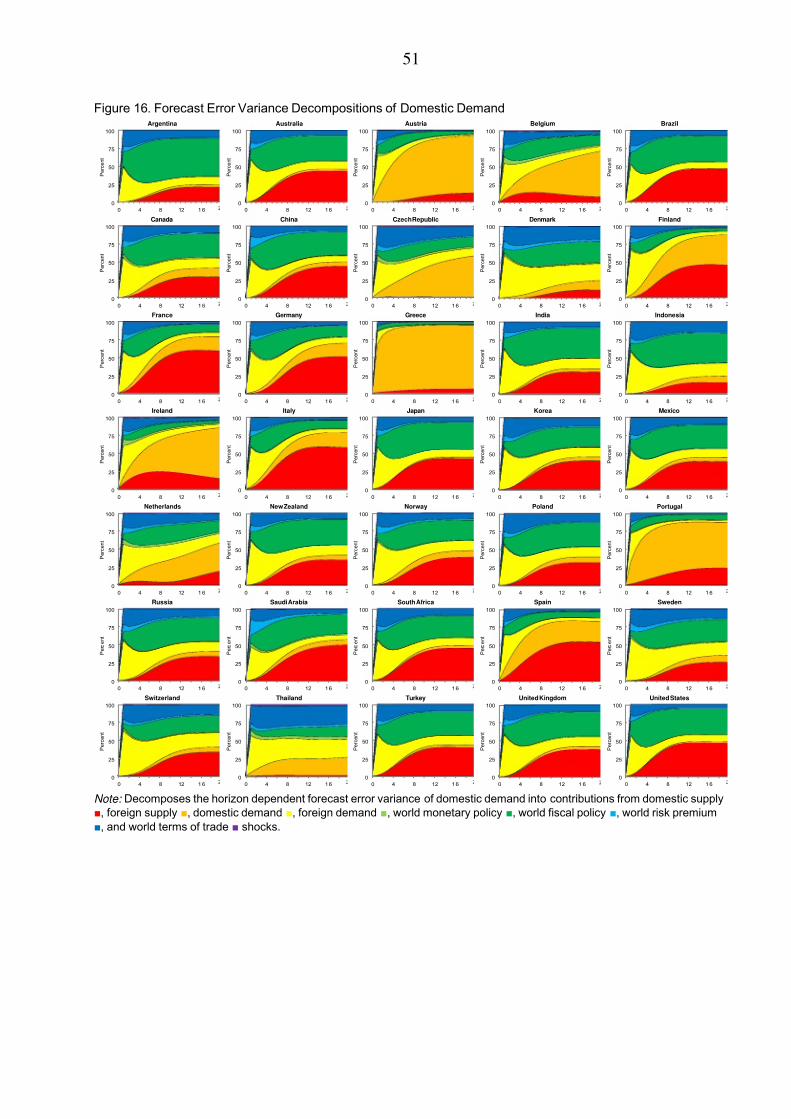
7/30/2019 IMF - Policy Analysis and Forecasting in the World Economy: A Panel Unobserved Components Approach
http://slidepdf.com/reader/full/imf-policy-analysis-and-forecasting-in-the-world-economy-a-panel-unobserved 52/77
51
Figure 16. Forecast Error Variance Decompositions of Domestic Demand
Note: Decomposes the horizon dependent forecast error variance of domestic demand into contributions from domestic supply
■, foreign supply ■, domestic demand ■, foreign demand ■, world monetary policy ■, world fiscal policy ■, world risk premium
■, and world terms of trade ■ shocks.
0
25
50
75
100
0 4 8 12 1 6
P e r c e n t
Argentina
0
25
50
75
100
0 4 8 12 1 6
P e r c e n t
Australia
0
25
50
75
100
0 4 8 12 1 6
P e r c e n t
Austria
0
25
50
75
100
0 4 8 12 1 6
P e r c e n t
Belgium
0
25
50
75
100
0 4 8 12 1 6
P e r c e n t
Brazil
0
25
50
75
100
0 4 8 12 1 6
P e r c e n t
Canada
0
25
50
75
100
0 4 8 12 1 6
P e r c e n t
China
0
25
50
75
100
0 4 8 12 1 6
P e r c e n t
Czech Republic
0
25
50
75
100
0 4 8 12 1 6
P e r c e n t
Denmark
0
25
50
75
100
0 4 8 12 1 6
P e r c e n t
Finland
0
25
50
75
100
0 4 8 12 1 6
P e r c e n t
France
0
25
50
75
100
0 4 8 12 1 6
P e r c e n t
Germany
0
25
50
75
100
0 4 8 12 1 6
P e r c e n t
Greece
0
25
50
75
100
0 4 8 12 1 6
P e r c e n t
India
0
25
50
75
100
0 4 8 12 1 6
P e r c e n t
Indonesia
0
25
50
75
100
0 4 8 12 1 6
P e r c e n t
Ireland
0
25
50
75
100
0 4 8 12 1 6
P e r c e n t
Italy
0
25
50
75
100
0 4 8 12 1 6
P e r c e n t
Japan
0
25
50
75
100
0 4 8 12 1 6
P e r c e n t
Korea
0
25
50
75
100
0 4 8 12 1 6
P e r c e n t
Mexico
0
25
50
75
100
0 4 8 12 1 6
P e r c e n t
Netherlands
0
25
50
75
100
0 4 8 12 1 6
P e r c e n t
New Zealand
0
25
50
75
100
0 4 8 12 1 6
P e r c e n t
Norway
0
25
50
75
100
0 4 8 12 1 6
P e r c e n t
Poland
0
25
50
75
100
0 4 8 12 1 6
P e r c e n t
Portugal
0
25
50
75
100
0 4 8 12 1 6
P e r c e n t
Russia
0
25
50
75
100
0 4 8 12 1 6
P e r c e n t
Saudi Arabia
0
25
50
75
100
0 4 8 12 1 6
P e r c e n t
South Africa
0
25
50
75
100
0 4 8 12 1 6
P e r c e n t
Spain
0
25
50
75
100
0 4 8 12 1 6
P e r c e n t
Sweden
0
25
50
75
100
0 4 8 12 1 6
P e r c e n t
Switzerland
0
25
50
75
100
0 4 8 12 1 6
P e r c e n t
Thailand
0
25
50
75
100
0 4 8 12 1 6
P e r c e n t
Turkey
0
25
50
75
100
0 4 8 12 1 6
P e r c e n t
United Kingdom
0
25
50
75
100
0 4 8 12 1 6
P e r c e n t
United States
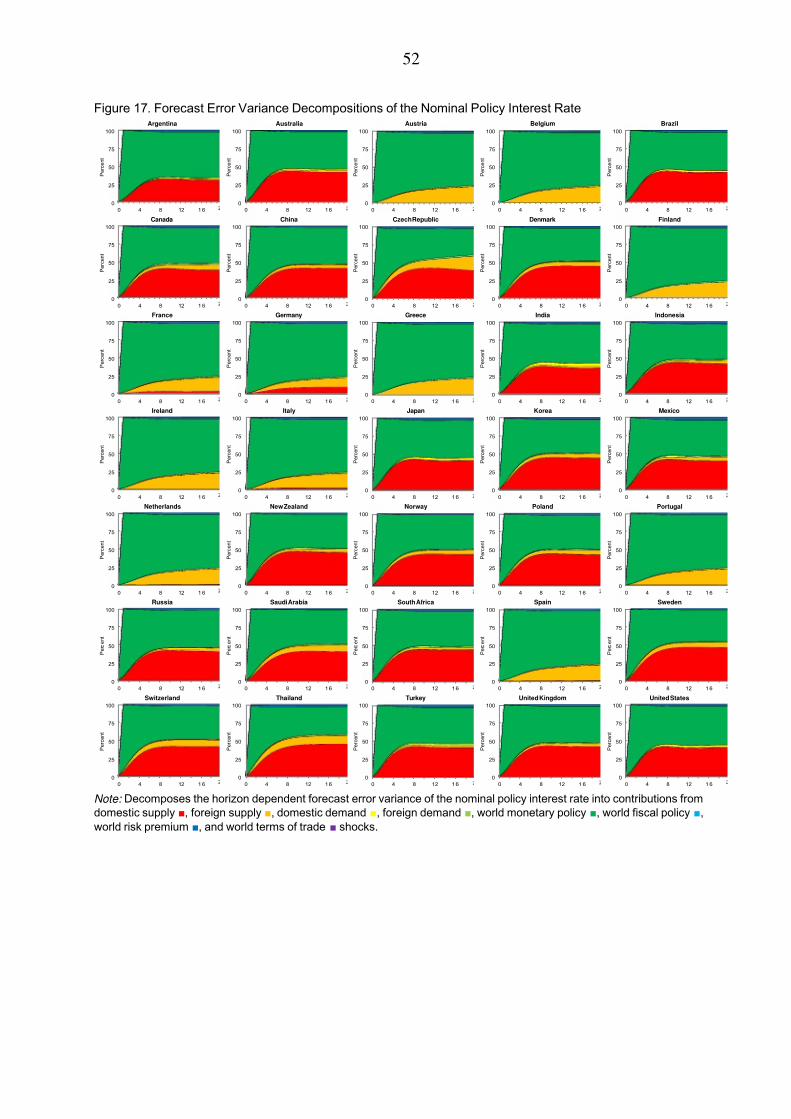
7/30/2019 IMF - Policy Analysis and Forecasting in the World Economy: A Panel Unobserved Components Approach
http://slidepdf.com/reader/full/imf-policy-analysis-and-forecasting-in-the-world-economy-a-panel-unobserved 53/77
52
Figure 17. Forecast Error Variance Decompositions of the Nominal Policy Interest Rate
Note: Decomposes the horizon dependent forecast error variance of the nominal policy interest rate into contributions from
domestic supply ■, foreign supply ■, domestic demand ■, foreign demand ■, world monetary policy ■, world fiscal policy ■,
world risk premium ■, and world terms of trade ■ shocks.
0
25
50
75
100
0 4 8 12 1 6
P e r c e n t
Argentina
0
25
50
75
100
0 4 8 12 1 6
P e r c e n t
Australia
0
25
50
75
100
0 4 8 12 1 6
P e r c e n t
Austria
0
25
50
75
100
0 4 8 12 1 6
P e r c e n t
Belgium
0
25
50
75
100
0 4 8 12 1 6
P e r c e n t
Brazil
0
25
50
75
100
0 4 8 12 1 6
P e r c e n t
Canada
0
25
50
75
100
0 4 8 12 1 6
P e r c e n t
China
0
25
50
75
100
0 4 8 12 1 6
P e r c e n t
Czech Republic
0
25
50
75
100
0 4 8 12 1 6
P e r c e n t
Denmark
0
25
50
75
100
0 4 8 12 1 6
P e r c e n t
Finland
0
25
50
75
100
0 4 8 12 1 6
P e r c e n t
France
0
25
50
75
100
0 4 8 12 1 6
P e r c e n t
Germany
0
25
50
75
100
0 4 8 12 1 6
P e r c e n t
Greece
0
25
50
75
100
0 4 8 12 1 6
P e r c e n t
India
0
25
50
75
100
0 4 8 12 1 6
P e r c e n t
Indonesia
0
25
50
75
100
0 4 8 12 1 6
P e r c e n t
Ireland
0
25
50
75
100
0 4 8 12 1 6
P e r c e n t
Italy
0
25
50
75
100
0 4 8 12 1 6
P e r c e n t
Japan
0
25
50
75
100
0 4 8 12 1 6
P e r c e n t
Korea
0
25
50
75
100
0 4 8 12 1 6
P e r c e n t
Mexico
0
25
50
75
100
0 4 8 12 1 6
P e r c e n t
Netherlands
0
25
50
75
100
0 4 8 12 1 6
P e r c e n t
New Zealand
0
25
50
75
100
0 4 8 12 1 6
P e r c e n t
Norway
0
25
50
75
100
0 4 8 12 1 6
P e r c e n t
Poland
0
25
50
75
100
0 4 8 12 1 6
P e r c e n t
Portugal
0
25
50
75
100
0 4 8 12 1 6
P e r c e n t
Russia
0
25
50
75
100
0 4 8 12 1 6
P e r c e n t
Saudi Arabia
0
25
50
75
100
0 4 8 12 1 6
P e r c e n t
South Africa
0
25
50
75
100
0 4 8 12 1 6
P e r c e n t
Spain
0
25
50
75
100
0 4 8 12 1 6
P e r c e n t
Sweden
0
25
50
75
100
0 4 8 12 1 6
P e r c e n t
Switzerland
0
25
50
75
100
0 4 8 12 1 6
P e r c e n t
Thailand
0
25
50
75
100
0 4 8 12 1 6
P e r c e n t
Turkey
0
25
50
75
100
0 4 8 12 1 6
P e r c e n t
United Kingdom
0
25
50
75
100
0 4 8 12 1 6
P e r c e n t
United States
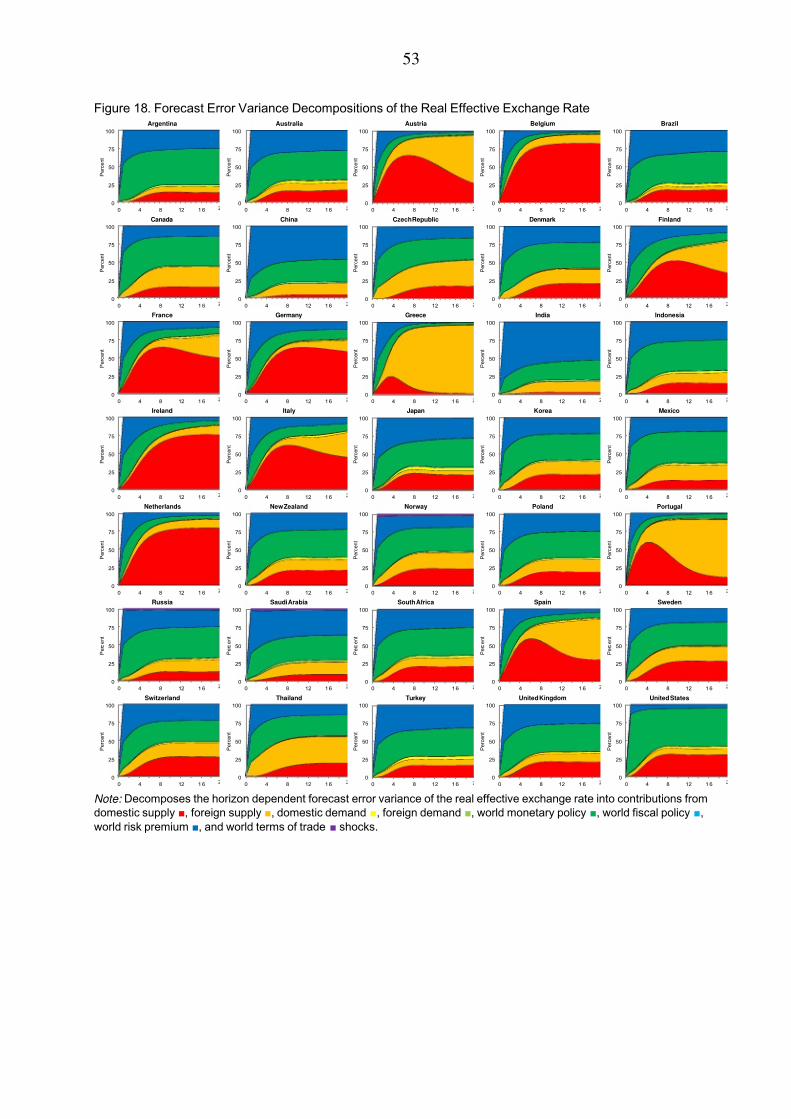
7/30/2019 IMF - Policy Analysis and Forecasting in the World Economy: A Panel Unobserved Components Approach
http://slidepdf.com/reader/full/imf-policy-analysis-and-forecasting-in-the-world-economy-a-panel-unobserved 54/77
53
Figure 18. Forecast Error Variance Decompositions of the Real Effective Exchange Rate
Note: Decomposes the horizon dependent forecast error variance of the real effective exchange rate into contributions from
domestic supply ■, foreign supply ■, domestic demand ■, foreign demand ■, world monetary policy ■, world fiscal policy ■,
world risk premium ■, and world terms of trade ■ shocks.
0
25
50
75
100
0 4 8 12 1 6
P e r c e n t
Argentina
0
25
50
75
100
0 4 8 12 1 6
P e r c e n t
Australia
0
25
50
75
100
0 4 8 12 1 6
P e r c e n t
Austria
0
25
50
75
100
0 4 8 12 1 6
P e r c e n t
Belgium
0
25
50
75
100
0 4 8 12 1 6
P e r c e n t
Brazil
0
25
50
75
100
0 4 8 12 1 6
P e r c e n t
Canada
0
25
50
75
100
0 4 8 12 1 6
P e r c e n t
China
0
25
50
75
100
0 4 8 12 1 6
P e r c e n t
Czech Republic
0
25
50
75
100
0 4 8 12 1 6
P e r c e n t
Denmark
0
25
50
75
100
0 4 8 12 1 6
P e r c e n t
Finland
0
25
50
75
100
0 4 8 12 1 6
P e r c e n t
France
0
25
50
75
100
0 4 8 12 1 6
P e r c e n t
Germany
0
25
50
75
100
0 4 8 12 1 6
P e r c e n t
Greece
0
25
50
75
100
0 4 8 12 1 6
P e r c e n t
India
0
25
50
75
100
0 4 8 12 1 6
P e r c e n t
Indonesia
0
25
50
75
100
0 4 8 12 1 6
P e r c e n t
Ireland
0
25
50
75
100
0 4 8 12 1 6
P e r c e n t
Italy
0
25
50
75
100
0 4 8 12 1 6
P e r c e n t
Japan
0
25
50
75
100
0 4 8 12 1 6
P e r c e n t
Korea
0
25
50
75
100
0 4 8 12 1 6
P e r c e n t
Mexico
0
25
50
75
100
0 4 8 12 1 6
P e r c e n t
Netherlands
0
25
50
75
100
0 4 8 12 1 6
P e r c e n t
New Zealand
0
25
50
75
100
0 4 8 12 1 6
P e r c e n t
Norway
0
25
50
75
100
0 4 8 12 1 6
P e r c e n t
Poland
0
25
50
75
100
0 4 8 12 1 6
P e r c e n t
Portugal
0
25
50
75
100
0 4 8 12 1 6
P e r c e n t
Russia
0
25
50
75
100
0 4 8 12 1 6
P e r c e n t
Saudi Arabia
0
25
50
75
100
0 4 8 12 1 6
P e r c e n t
South Africa
0
25
50
75
100
0 4 8 12 1 6
P e r c e n t
Spain
0
25
50
75
100
0 4 8 12 1 6
P e r c e n t
Sweden
0
25
50
75
100
0 4 8 12 1 6
P e r c e n t
Switzerland
0
25
50
75
100
0 4 8 12 1 6
P e r c e n t
Thailand
0
25
50
75
100
0 4 8 12 1 6
P e r c e n t
Turkey
0
25
50
75
100
0 4 8 12 1 6
P e r c e n t
United Kingdom
0
25
50
75
100
0 4 8 12 1 6
P e r c e n t
United States
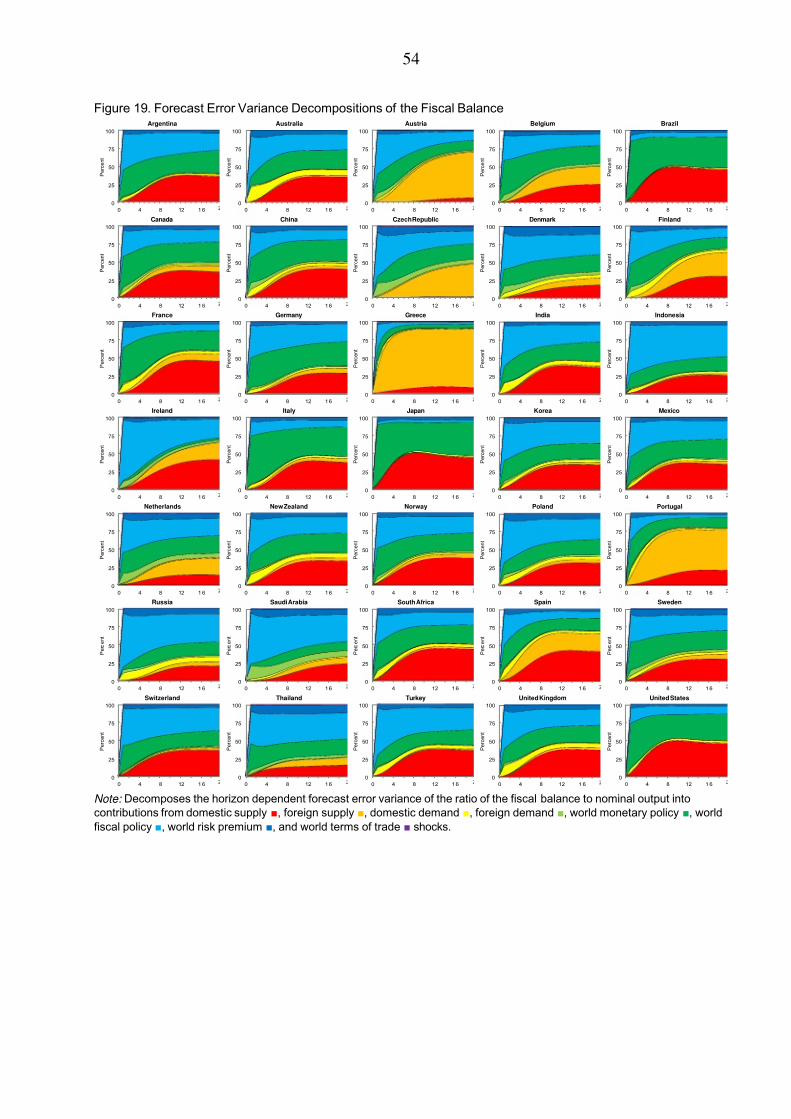
7/30/2019 IMF - Policy Analysis and Forecasting in the World Economy: A Panel Unobserved Components Approach
http://slidepdf.com/reader/full/imf-policy-analysis-and-forecasting-in-the-world-economy-a-panel-unobserved 55/77
54
Figure 19. Forecast Error Variance Decompositions of the Fiscal Balance
Note: Decomposes the horizon dependent forecast error variance of the ratio of the fiscal balance to nominal output into
contributions from domestic supply ■, foreign supply ■, domestic demand ■, foreign demand ■, world monetary policy ■, world
fiscal policy ■, world risk premium ■, and world terms of trade ■ shocks.
0
25
50
75
100
0 4 8 12 1 6
P e r c e n t
Argentina
0
25
50
75
100
0 4 8 12 1 6
P e r c e n t
Australia
0
25
50
75
100
0 4 8 12 1 6
P e r c e n t
Austria
0
25
50
75
100
0 4 8 12 1 6
P e r c e n t
Belgium
0
25
50
75
100
0 4 8 12 1 6
P e r c e n t
Brazil
0
25
50
75
100
0 4 8 12 1 6
P e r c e n t
Canada
0
25
50
75
100
0 4 8 12 1 6
P e r c e n t
China
0
25
50
75
100
0 4 8 12 1 6
P e r c e n t
Czech Republic
0
25
50
75
100
0 4 8 12 1 6
P e r c e n t
Denmark
0
25
50
75
100
0 4 8 12 1 6
P e r c e n t
Finland
0
25
50
75
100
0 4 8 12 1 6
P e r c e n t
France
0
25
50
75
100
0 4 8 12 1 6
P e r c e n t
Germany
0
25
50
75
100
0 4 8 12 1 6
P e r c e n t
Greece
0
25
50
75
100
0 4 8 12 1 6
P e r c e n t
India
0
25
50
75
100
0 4 8 12 1 6
P e r c e n t
Indonesia
0
25
50
75
100
0 4 8 12 1 6
P e r c e n t
Ireland
0
25
50
75
100
0 4 8 12 1 6
P e r c e n t
Italy
0
25
50
75
100
0 4 8 12 1 6
P e r c e n t
Japan
0
25
50
75
100
0 4 8 12 1 6
P e r c e n t
Korea
0
25
50
75
100
0 4 8 12 1 6
P e r c e n t
Mexico
0
25
50
75
100
0 4 8 12 1 6
P e r c e n t
Netherlands
0
25
50
75
100
0 4 8 12 1 6
P e r c e n t
New Zealand
0
25
50
75
100
0 4 8 12 1 6
P e r c e n t
Norway
0
25
50
75
100
0 4 8 12 1 6
P e r c e n t
Poland
0
25
50
75
100
0 4 8 12 1 6
P e r c e n t
Portugal
0
25
50
75
100
0 4 8 12 1 6
P e r c e n t
Russia
0
25
50
75
100
0 4 8 12 1 6
P e r c e n t
Saudi Arabia
0
25
50
75
100
0 4 8 12 1 6
P e r c e n t
South Africa
0
25
50
75
100
0 4 8 12 1 6
P e r c e n t
Spain
0
25
50
75
100
0 4 8 12 1 6
P e r c e n t
Sweden
0
25
50
75
100
0 4 8 12 1 6
P e r c e n t
Switzerland
0
25
50
75
100
0 4 8 12 1 6
P e r c e n t
Thailand
0
25
50
75
100
0 4 8 12 1 6
P e r c e n t
Turkey
0
25
50
75
100
0 4 8 12 1 6
P e r c e n t
United Kingdom
0
25
50
75
100
0 4 8 12 1 6
P e r c e n t
United States
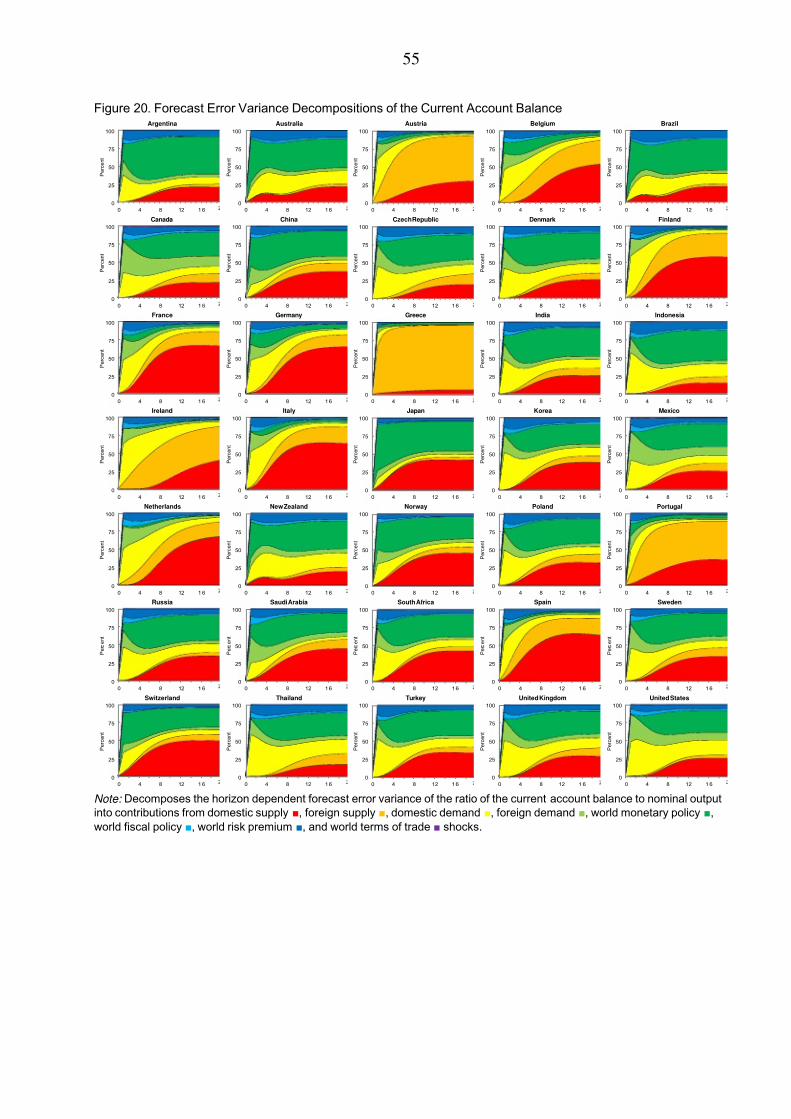
7/30/2019 IMF - Policy Analysis and Forecasting in the World Economy: A Panel Unobserved Components Approach
http://slidepdf.com/reader/full/imf-policy-analysis-and-forecasting-in-the-world-economy-a-panel-unobserved 56/77
55
Figure 20. Forecast Error Variance Decompositions of the Current Account Balance
Note: Decomposes the horizon dependent forecast error variance of the ratio of the current account balance to nominal output
into contributions from domestic supply ■, foreign supply ■, domestic demand ■, foreign demand ■, world monetary policy ■,
world fiscal policy ■, world risk premium ■, and world terms of trade ■ shocks.
0
25
50
75
100
0 4 8 12 1 6
P e r c e n t
Argentina
0
25
50
75
100
0 4 8 12 1 6
P e r c e n t
Australia
0
25
50
75
100
0 4 8 12 1 6
P e r c e n t
Austria
0
25
50
75
100
0 4 8 12 1 6
P e r c e n t
Belgium
0
25
50
75
100
0 4 8 12 1 6
P e r c e n t
Brazil
0
25
50
75
100
0 4 8 12 1 6
P e r c e n t
Canada
0
25
50
75
100
0 4 8 12 1 6
P e r c e n t
China
0
25
50
75
100
0 4 8 12 1 6
P e r c e n t
Czech Republic
0
25
50
75
100
0 4 8 12 1 6
P e r c e n t
Denmark
0
25
50
75
100
0 4 8 12 1 6
P e r c e n t
Finland
0
25
50
75
100
0 4 8 12 1 6
P e r c e n t
France
0
25
50
75
100
0 4 8 12 1 6
P e r c e n t
Germany
0
25
50
75
100
0 4 8 12 1 6
P e r c e n t
Greece
0
25
50
75
100
0 4 8 12 1 6
P e r c e n t
India
0
25
50
75
100
0 4 8 12 1 6
P e r c e n t
Indonesia
0
25
50
75
100
0 4 8 12 1 6
P e r c e n t
Ireland
0
25
50
75
100
0 4 8 12 1 6
P e r c e n t
Italy
0
25
50
75
100
0 4 8 12 1 6
P e r c e n t
Japan
0
25
50
75
100
0 4 8 12 1 6
P e r c e n t
Korea
0
25
50
75
100
0 4 8 12 1 6
P e r c e n t
Mexico
0
25
50
75
100
0 4 8 12 1 6
P e r c e n t
Netherlands
0
25
50
75
100
0 4 8 12 1 6
P e r c e n t
New Zealand
0
25
50
75
100
0 4 8 12 1 6
P e r c e n t
Norway
0
25
50
75
100
0 4 8 12 1 6
P e r c e n t
Poland
0
25
50
75
100
0 4 8 12 1 6
P e r c e n t
Portugal
0
25
50
75
100
0 4 8 12 1 6
P e r c e n t
Russia
0
25
50
75
100
0 4 8 12 1 6
P e r c e n t
Saudi Arabia
0
25
50
75
100
0 4 8 12 1 6
P e r c e n t
South Africa
0
25
50
75
100
0 4 8 12 1 6
P e r c e n t
Spain
0
25
50
75
100
0 4 8 12 1 6
P e r c e n t
Sweden
0
25
50
75
100
0 4 8 12 1 6
P e r c e n t
Switzerland
0
25
50
75
100
0 4 8 12 1 6
P e r c e n t
Thailand
0
25
50
75
100
0 4 8 12 1 6
P e r c e n t
Turkey
0
25
50
75
100
0 4 8 12 1 6
P e r c e n t
United Kingdom
0
25
50
75
100
0 4 8 12 1 6
P e r c e n t
United States
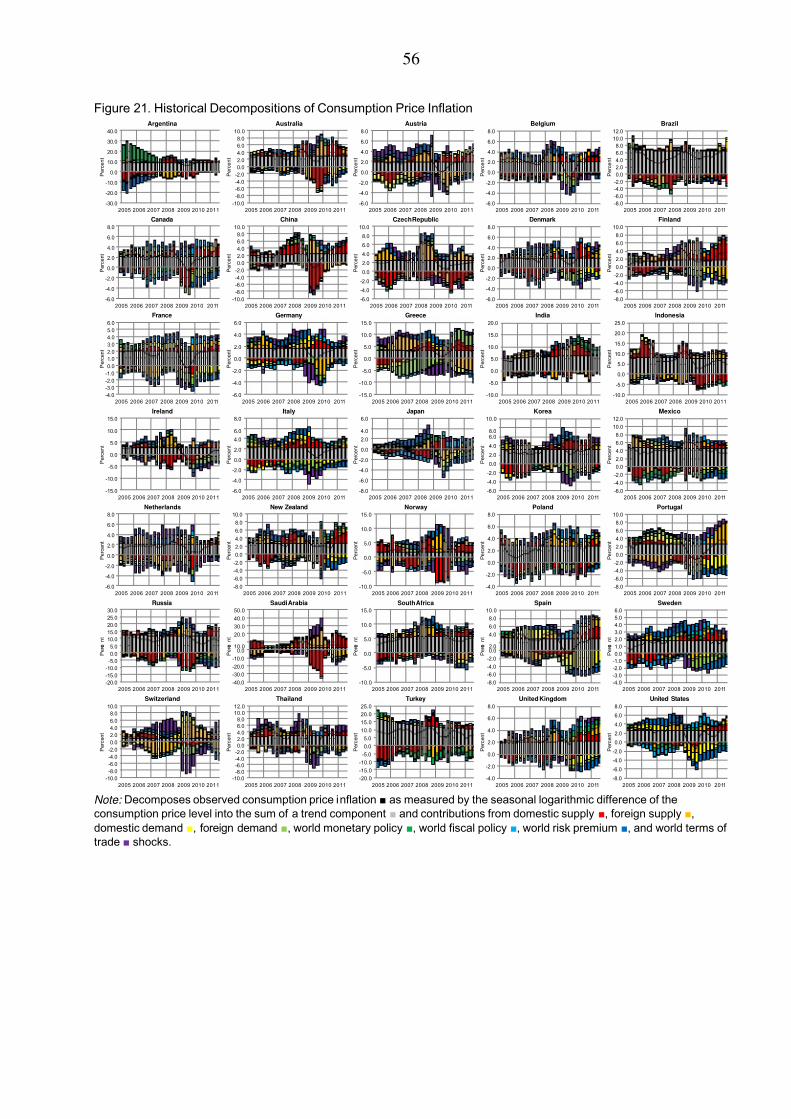
7/30/2019 IMF - Policy Analysis and Forecasting in the World Economy: A Panel Unobserved Components Approach
http://slidepdf.com/reader/full/imf-policy-analysis-and-forecasting-in-the-world-economy-a-panel-unobserved 57/77
56
Figure 21. Historical Decompositions of Consumption Price Inflation
Note: Decomposes observed consumption price inflation ■ as measured by the seasonal logarithmic difference of the
consumption price level into the sum of a trend component ■ and contributions from domestic supply ■, foreign supply ■,
domestic demand ■, foreign demand ■, world monetary policy ■, world fiscal policy ■, world risk premium ■, and world terms of
trade ■ shocks.
-30.0
-20.0
-10.0
0.0
10.0
20.0
30.0
40.0
2005 2006 2007 2008 2009 2010 2011
P e r c e n t
Argentina
-10.0
-8.0
-6.0
-4.0
-2.0
0.0
2.0
4.0
6.0
8.0
10.0
2005 2006 2007 2008 2009 2010 2011
P e r c e n t
Australia
-6.0
-4.0
-2.0
0.0
2.0
4.0
6.0
8.0
2005 2006 2007 2008 2009 2010 2011
P e r c e n t
Austria
-6.0
-4.0
-2.0
0.0
2.0
4.0
6.0
8.0
2005 2006 2007 2008 2009 2010 2011
P e r c e n t
Belgium
-8.0
-6.0
-4.0
-2.0
0.0
2.0
4.0
6.0
8.0
10.0
12.0
2005 2006 2007 2008 2009 2010 2011
P e r c e n t
Brazil
-6.0
-4.0
-2.0
0.0
2.0
4.0
6.0
8.0
2005 2006 2007 2008 2009 2010 2011
P e r c e n t
Canada
-10.0
-8.0
-6.0
-4.0
-2.0
0.0
2.0
4.0
6.0
8.0
10.0
2005 2006 2007 2008 2009 2010 2011
P e r c e n t
China
-6.0
-4.0
-2.0
0.0
2.0
4.0
6.0
8.0
10.0
2005 2006 2007 2008 2009 2010 2011
P e r c e n t
Czech Republic
-6.0
-4.0
-2.0
0.0
2.0
4.0
6.0
8.0
2005 2006 2007 2008 2009 2010 2011
P e r c e n t
Denmark
-8.0
-6.0
-4.0
-2.0
0.0
2.0
4.0
6.0
8.0
10.0
2005 2006 2007 2008 2009 2010 2011
P e r c e n t
Finland
-4.0
-3.0
-2.0
-1.0
0.0
1.0
2.0
3.0
4.0
5.0
6.0
2005 2006 2007 2008 2009 2010 2011
P e r c e n t
France
-6.0
-4.0
-2.0
0.0
2.0
4.0
6.0
2005 2006 2007 2008 2009 2010 2011
P e r c e n t
Germany
-15.0
-10.0
-5.0
0.0
5.0
10.0
15.0
2005 2006 2007 2008 2009 2010 2011
P e r c e n t
Greece
-10.0
-5.0
0.0
5.0
10.0
15.0
20.0
2005 2006 2007 2008 2009 2010 2011
P e r c e n t
India
-10.0
-5.0
0.0
5.0
10.0
15.0
20.0
25.0
2005 2006 2007 2008 2009 2010 2011
P e r c e n t
Indonesia
-15.0
-10.0
-5.0
0.0
5.0
10.0
15.0
2005 2006 2007 2008 2009 2010 2011
P e r c e n t
Ireland
-6.0
-4.0
-2.0
0.0
2.0
4.0
6.0
8.0
2005 2006 2007 2008 2009 2010 2011
P e r c e n t
Italy
-8.0
-6.0
-4.0
-2.0
0.0
2.0
4.0
6.0
2005 2006 2007 2008 2009 2010 2011
P e r c e n t
Japan
-6.0
-4.0
-2.0
0.0
2.0
4.0
6.0
8.0
10.0
2005 2006 2007 2008 2009 2010 2011
P e r c e n t
Korea
-6.0
-4.0
-2.0
0.0
2.0
4.0
6.0
8.0
10.0
12.0
2005 2006 2007 2008 2009 2010 2011
P e r c e n t
Mexico
-6.0
-4.0
-2.0
0.0
2.0
4.0
6.0
8.0
2005 2006 2007 2008 2009 2010 2011
P e r c e n t
Netherlands
-8.0
-6.0
-4.0
-2.0
0.0
2.0
4.0
6.0
8.0
10.0
2005 2006 2007 2008 2009 2010 2011
P e r c e n t
New Zealand
-10.0
-5.0
0.0
5.0
10.0
15.0
2005 2006 2007 2008 2009 2010 2011
P e r c e n t
Norway
-4.0
-2.0
0.0
2.0
4.0
6.0
8.0
2005 2006 2007 2008 2009 2010 2011
P e r c e n t
Poland
-8.0
-6.0
-4.0
-2.0
0.0
2.0
4.0
6.0
8.0
10.0
2005 2006 2007 2008 2009 2010 2011
P e r c e n t
Portugal
-20.0
-15.0
-10.0
-5.0
0.0
5.0
10.0
15.0
20.0
25.0
30.0
2005 2006 2007 2008 2009 2010 2011
P e r c e
n t
Russia
-40.0
-30.0
-20.0
-10.0
0.010.0
20.0
30.0
40.0
50.0
2005 2006 2007 2008 2009 2010 2011
P e r c e
n t
Saudi Arabia
-10.0
-5.0
0.0
5.0
10.0
15.0
2005 2006 2007 2008 2009 2010 2011
P e r c e
n t
South Africa
-8.0
-6.0
-4.0
-2.0
0.02.0
4.0
6.0
8.0
10.0
2005 2006 2007 2008 2009 2010 2011
P e r c e
n t
Spain
-4.0
-3.0
-2.0
-1.0
0.0
1.0
2.0
3.0
4.0
5.0
6.0
2005 2006 2007 2008 2009 2010 2011
P e r c e
n t
Sweden
-10.0
-8.0
-6.0
-4.0
-2.0
0.0
2.0
4.0
6.0
8.0
10.0
2005 2006 2007 2008 2009 2010 2011
P e r c e n t
Switzerland
-10.0
-8.0
-6.0
-4.0
-2.0
0.0
2.0
4.0
6.0
8.0
10.0
12.0
2005 2006 2007 2008 2009 2010 2011
P e r c e n t
Thailand
-20.0
-15.0
-10.0
-5.0
0.0
5.0
10.0
15.0
20.0
25.0
2005 2006 2007 2008 2009 2010 2011
P e r c e n t
Turkey
-4.0
-2.0
0.0
2.0
4.0
6.0
8.0
2005 2006 2007 2008 2009 2010 2011
P e r c e n t
United Kingdom
-8.0
-6.0
-4.0
-2.0
0.0
2.0
4.0
6.0
8.0
2005 2006 2007 2008 2009 2010 2011
P e r c e n t
United States
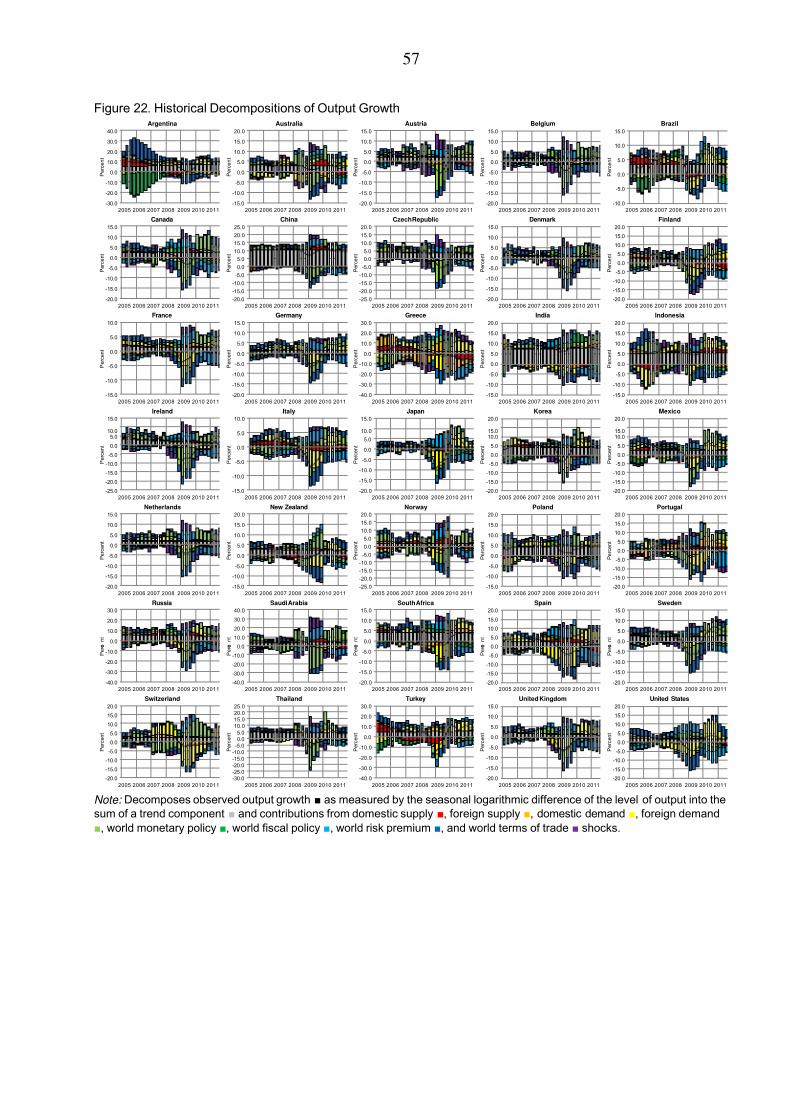
7/30/2019 IMF - Policy Analysis and Forecasting in the World Economy: A Panel Unobserved Components Approach
http://slidepdf.com/reader/full/imf-policy-analysis-and-forecasting-in-the-world-economy-a-panel-unobserved 58/77
57
Figure 22. Historical Decompositions of Output Growth
Note: Decomposes observed output growth ■ as measured by the seasonal logarithmic difference of the level of output into the
sum of a trend component ■ and contributions from domestic supply ■, foreign supply ■, domestic demand ■, foreign demand
■, world monetary policy ■, world fiscal policy ■, world risk premium ■, and world terms of trade ■ shocks.
-30.0
-20.0
-10.0
0.0
10.0
20.0
30.0
40.0
2005 2006 2007 2008 2009 2010 2011
P e r c e n t
Argentina
-15.0
-10.0
-5.0
0.0
5.0
10.0
15.0
20.0
2005 2006 2007 2008 2009 2010 2011
P e r c e n t
Australia
-20.0
-15.0
-10.0
-5.0
0.0
5.0
10.0
15.0
2005 2006 2007 2008 2009 2010 2011
P e r c e n t
Austria
-20.0
-15.0
-10.0
-5.0
0.0
5.0
10.0
15.0
2005 2006 2007 2008 2009 2010 2011
P e r c e n t
Belgium
-10.0
-5.0
0.0
5.0
10.0
15.0
2005 2006 2007 2008 2009 2010 2011
P e r c e n t
Brazil
-20.0
-15.0
-10.0
-5.0
0.0
5.0
10.0
15.0
2005 2006 2007 2008 2009 2010 2011
P e r c e n t
Canada
-20.0
-15.0
-10.0
-5.0
0.0
5.0
10.0
15.0
20.0
25.0
2005 2006 2007 2008 2009 2010 2011
P e r c e n t
China
-25.0
-20.0
-15.0
-10.0
-5.0
0.0
5.0
10.0
15.0
20.0
2005 2006 2007 2008 2009 2010 2011
P e r c e n t
Czech Republic
-20.0
-15.0
-10.0
-5.0
0.0
5.0
10.0
15.0
2005 2006 2007 2008 2009 2010 2011
P e r c e n t
Denmark
-20.0
-15.0
-10.0
-5.0
0.0
5.0
10.0
15.0
20.0
2005 2006 2007 2008 2009 2010 2011
P e r c e n t
Finland
-15.0
-10.0
-5.0
0.0
5.0
10.0
2005 2006 2007 2008 2009 2010 2011
P e r c e n t
France
-20.0
-15.0
-10.0
-5.0
0.0
5.0
10.0
15.0
2005 2006 2007 2008 2009 2010 2011
P e r c e n t
Germany
-40.0
-30.0
-20.0
-10.0
0.0
10.0
20.0
30.0
2005 2006 2007 2008 2009 2010 2011
P e r c e n t
Greece
-15.0
-10.0
-5.0
0.0
5.0
10.0
15.0
20.0
2005 2006 2007 2008 2009 2010 2011
P e r c e n t
India
-15.0
-10.0
-5.0
0.0
5.0
10.0
15.0
20.0
2005 2006 2007 2008 2009 2010 2011
P e r c e n t
Indonesia
-25.0
-20.0
-15.0
-10.0
-5.0
0.0
5.0
10.0
15.0
2005 2006 2007 2008 2009 2010 2011
P e r c e n t
Ireland
-15.0
-10.0
-5.0
0.0
5.0
10.0
2005 2006 2007 2008 2009 2010 2011
P e r c e n t
Italy
-20.0
-15.0
-10.0
-5.0
0.0
5.0
10.0
15.0
2005 2006 2007 2008 2009 2010 2011
P e r c e n t
Japan
-20.0
-15.0
-10.0
-5.0
0.0
5.0
10.0
15.0
20.0
2005 2006 2007 2008 2009 2010 2011
P e r c e n t
Korea
-20.0
-15.0
-10.0
-5.0
0.0
5.0
10.0
15.0
20.0
2005 2006 2007 2008 2009 2010 2011
P e r c e n t
Mexico
-20.0
-15.0
-10.0
-5.0
0.0
5.0
10.0
15.0
2005 2006 2007 2008 2009 2010 2011
P e r c e n t
Netherlands
-15.0
-10.0
-5.0
0.0
5.0
10.0
15.0
20.0
2005 2006 2007 2008 2009 2010 2011
P e r c e n t
New Zealand
-25.0
-20.0
-15.0
-10.0
-5.0
0.0
5.0
10.0
15.0
20.0
2005 2006 2007 2008 2009 2010 2011
P e r c e n t
Norway
-15.0
-10.0
-5.0
0.0
5.0
10.0
15.0
20.0
2005 2006 2007 2008 2009 2010 2011
P e r c e n t
Poland
-20.0
-15.0
-10.0
-5.0
0.0
5.0
10.0
15.0
20.0
2005 2006 2007 2008 2009 2010 2011
P e r c e n t
Portugal
-40.0
-30.0
-20.0
-10.0
0.0
10.0
20.0
30.0
2005 2006 2007 2008 2009 2010 2011
P e r c e
n t
Russia
-40.0
-30.0
-20.0
-10.0
0.0
10.0
20.0
30.0
40.0
2005 2006 2007 2008 2009 2010 2011
P e r c e
n t
Saudi Arabia
-20.0
-15.0
-10.0
-5.0
0.0
5.0
10.0
15.0
2005 2006 2007 2008 2009 2010 2011
P e r c e
n t
South Africa
-20.0
-15.0
-10.0
-5.0
0.0
5.0
10.0
15.0
20.0
2005 2006 2007 2008 2009 2010 2011
P e r c e
n t
Spain
-20.0
-15.0
-10.0
-5.0
0.0
5.0
10.0
15.0
2005 2006 2007 2008 2009 2010 2011
P e r c e
n t
Sweden
-20.0
-15.0
-10.0
-5.0
0.0
5.0
10.0
15.0
20.0
2005 2006 2007 2008 2009 2010 2011
P e r c e n t
Switzerland
-30.0
-25.0
-20.0
-15.0
-10.0
-5.0
0.0
5.0
10.0
15.0
20.0
25.0
2005 2006 2007 2008 2009 2010 2011
P e r c e n t
Thailand
-40.0
-30.0
-20.0
-10.0
0.0
10.0
20.0
30.0
2005 2006 2007 2008 2009 2010 2011
P e r c e n t
Turkey
-20.0
-15.0
-10.0
-5.0
0.0
5.0
10.0
15.0
2005 2006 2007 2008 2009 2010 2011
P e r c e n t
United Kingdom
-20.0
-15.0
-10.0
-5.0
0.0
5.0
10.0
15.0
20.0
2005 2006 2007 2008 2009 2010 2011
P e r c e n t
United States
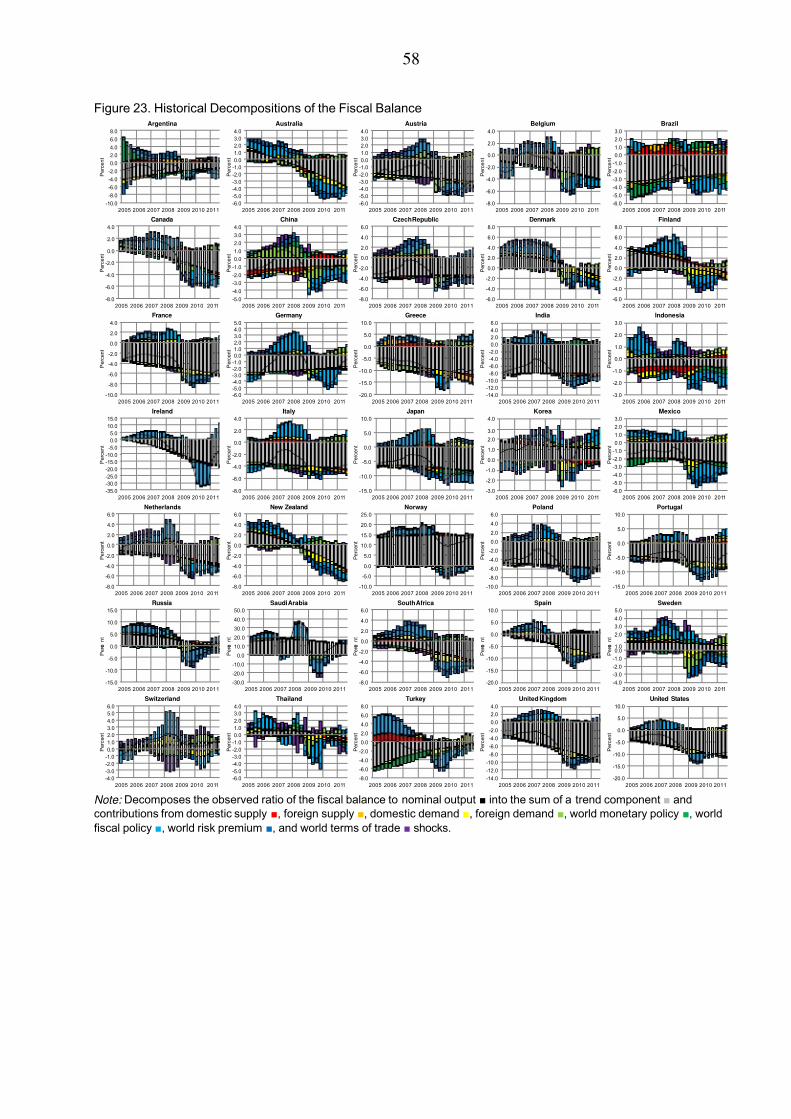
7/30/2019 IMF - Policy Analysis and Forecasting in the World Economy: A Panel Unobserved Components Approach
http://slidepdf.com/reader/full/imf-policy-analysis-and-forecasting-in-the-world-economy-a-panel-unobserved 59/77
58
Figure 23. Historical Decompositions of the Fiscal Balance
Note: Decomposes the observed ratio of the fiscal balance to nominal output ■ into the sum of a trend component ■ and
contributions from domestic supply ■, foreign supply ■, domestic demand ■, foreign demand ■, world monetary policy ■, world
fiscal policy ■, world risk premium ■, and world terms of trade ■ shocks.
-10.0
-8.0
-6.0
-4.0
-2.0
0.0
2.0
4.0
6.0
8.0
2005 2006 2007 2008 2009 2010 2011
P e r c e n t
Argentina
-6.0
-5.0
-4.0
-3.0
-2.0
-1.0
0.0
1.0
2.0
3.0
4.0
2005 2006 2007 2008 2009 2010 2011
P e r c e n t
Australia
-6.0
-5.0
-4.0
-3.0
-2.0
-1.0
0.0
1.0
2.0
3.0
4.0
2005 2006 2007 2008 2009 2010 2011
P e r c e n t
Austria
-8.0
-6.0
-4.0
-2.0
0.0
2.0
4.0
2005 2006 2007 2008 2009 2010 2011
P e r c e n t
Belgium
-6.0
-5.0
-4.0
-3.0
-2.0
-1.0
0.0
1.0
2.0
3.0
2005 2006 2007 2008 2009 2010 2011
P e r c e n t
Brazil
-8.0
-6.0
-4.0
-2.0
0.0
2.0
4.0
2005 2006 2007 2008 2009 2010 2011
P e r c e n t
Canada
-5.0
-4.0
-3.0
-2.0
-1.0
0.0
1.0
2.0
3.0
4.0
2005 2006 2007 2008 2009 2010 2011
P e r c e n t
China
-8.0
-6.0
-4.0
-2.0
0.0
2.0
4.0
6.0
2005 2006 2007 2008 2009 2010 2011
P e r c e n t
Czech Republic
-6.0
-4.0
-2.0
0.0
2.0
4.0
6.0
8.0
2005 2006 2007 2008 2009 2010 2011
P e r c e n t
Denmark
-6.0
-4.0
-2.0
0.0
2.0
4.0
6.0
8.0
2005 2006 2007 2008 2009 2010 2011
P e r c e n t
Finland
-10.0
-8.0
-6.0
-4.0
-2.0
0.0
2.0
4.0
2005 2006 2007 2008 2009 2010 2011
P e r c e n t
France
-6.0
-5.0
-4.0
-3.0
-2.0
-1.0
0.0
1.0
2.0
3.0
4.0
5.0
2005 2006 2007 2008 2009 2010 2011
P e r c e n t
Germany
-20.0
-15.0
-10.0
-5.0
0.0
5.0
10.0
2005 2006 2007 2008 2009 2010 2011
P e r c e n t
Greece
-14.0
-12.0
-10.0
-8.0
-6.0
-4.0
-2.0
0.0
2.0
4.0
6.0
2005 2006 2007 2008 2009 2010 2011
P e r c e n t
India
-3.0
-2.0
-1.0
0.0
1.0
2.0
3.0
2005 2006 2007 2008 2009 2010 2011
P e r c e n t
Indonesia
-35.0
-30.0
-25.0
-20.0
-15.0
-10.0
-5.0
0.0
5.0
10.0
15.0
2005 2006 2007 2008 2009 2010 2011
P e r c e n t
Ireland
-8.0
-6.0
-4.0
-2.0
0.0
2.0
4.0
2005 2006 2007 2008 2009 2010 2011
P e r c e n t
Italy
-15.0
-10.0
-5.0
0.0
5.0
10.0
2005 2006 2007 2008 2009 2010 2011
P e r c e n t
Japan
-3.0
-2.0
-1.0
0.0
1.0
2.0
3.0
4.0
2005 2006 2007 2008 2009 2010 2011
P e r c e n t
Korea
-6.0
-5.0
-4.0
-3.0
-2.0
-1.0
0.0
1.0
2.0
3.0
2005 2006 2007 2008 2009 2010 2011
P e r c e n t
Mexico
-8.0
-6.0
-4.0
-2.0
0.0
2.0
4.0
6.0
2005 2006 2007 2008 2009 2010 2011
P e r c e n t
Netherlands
-8.0
-6.0
-4.0
-2.0
0.0
2.0
4.0
6.0
2005 2006 2007 2008 2009 2010 2011
P e r c e n t
New Zealand
-10.0
-5.0
0.0
5.0
10.0
15.0
20.0
25.0
2005 2006 2007 2008 2009 2010 2011
P e r c e n t
Norway
-10.0
-8.0
-6.0
-4.0
-2.0
0.0
2.0
4.0
6.0
2005 2006 2007 2008 2009 2010 2011
P e r c e n t
Poland
-15.0
-10.0
-5.0
0.0
5.0
10.0
2005 2006 2007 2008 2009 2010 2011
P e r c e n t
Portugal
-15.0
-10.0
-5.0
0.0
5.0
10.0
15.0
2005 2006 2007 2008 2009 2010 2011
P e r c e
n t
Russia
-30.0
-20.0
-10.0
0.0
10.0
20.0
30.0
40.0
50.0
2005 2006 2007 2008 2009 2010 2011
P e r c e
n t
Saudi Arabia
-8.0
-6.0
-4.0
-2.0
0.0
2.0
4.0
6.0
2005 2006 2007 2008 2009 2010 2011
P e r c e
n t
South Africa
-20.0
-15.0
-10.0
-5.0
0.0
5.0
10.0
2005 2006 2007 2008 2009 2010 2011
P e r c e
n t
Spain
-4.0
-3.0
-2.0
-1.0
0.01.0
2.0
3.0
4.0
5.0
2005 2006 2007 2008 2009 2010 2011
P e r c e
n t
Sweden
-4.0
-3.0
-2.0
-1.0
0.0
1.0
2.0
3.0
4.0
5.0
6.0
2005 2006 2007 2008 2009 2010 2011
P e r c e n t
Switzerland
-6.0
-5.0
-4.0
-3.0
-2.0
-1.0
0.0
1.0
2.0
3.0
4.0
2005 2006 2007 2008 2009 2010 2011
P e r c e n t
Thailand
-8.0
-6.0
-4.0
-2.0
0.0
2.0
4.0
6.0
8.0
2005 2006 2007 2008 2009 2010 2011
P e r c e n t
Turkey
-14.0
-12.0
-10.0
-8.0
-6.0
-4.0
-2.0
0.0
2.0
4.0
2005 2006 2007 2008 2009 2010 2011
P e r c e n t
United Kingdom
-20.0
-15.0
-10.0
-5.0
0.0
5.0
10.0
2005 2006 2007 2008 2009 2010 2011
P e r c e n t
United States
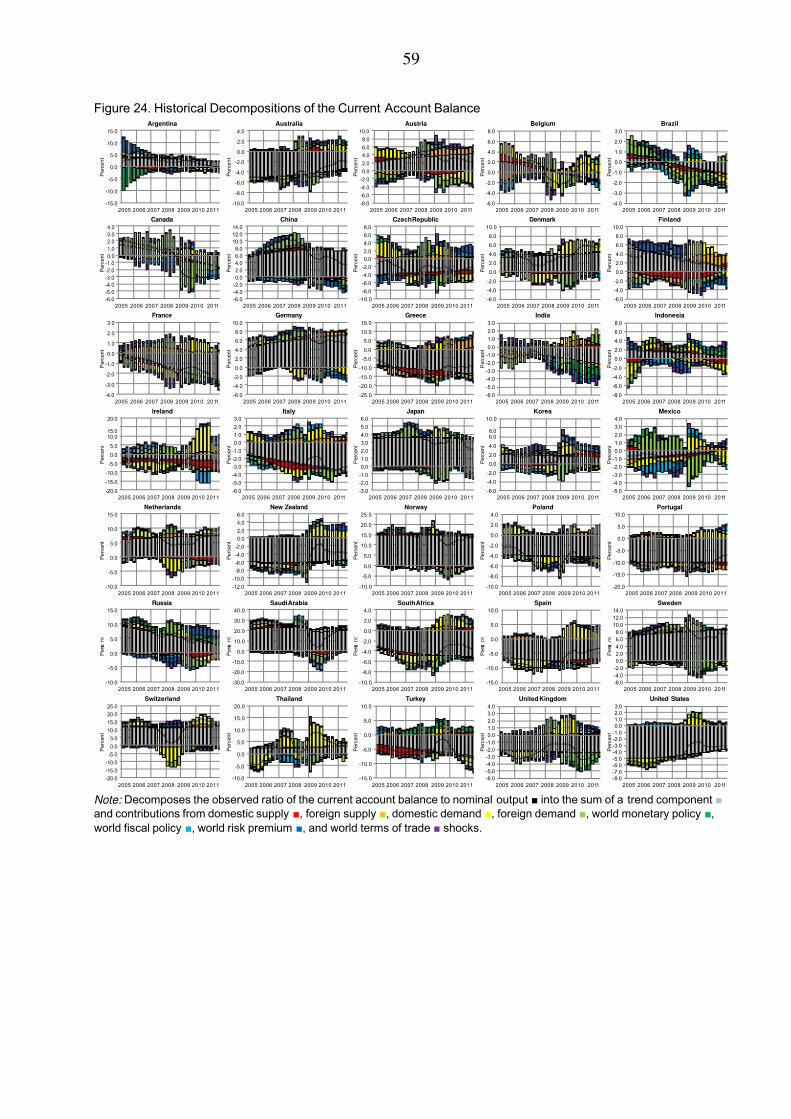
7/30/2019 IMF - Policy Analysis and Forecasting in the World Economy: A Panel Unobserved Components Approach
http://slidepdf.com/reader/full/imf-policy-analysis-and-forecasting-in-the-world-economy-a-panel-unobserved 60/77
59
Figure 24. Historical Decompositions of the Current Account Balance
Note: Decomposes the observed ratio of the current account balance to nominal output ■ into the sum of a trend component ■
and contributions from domestic supply ■, foreign supply ■, domestic demand ■, foreign demand ■, world monetary policy ■,
world fiscal policy ■, world risk premium ■, and world terms of trade ■ shocks.
-15.0
-10.0
-5.0
0.0
5.0
10.0
15.0
2005 2006 2007 2008 2009 2010 2011
P e r c e n t
Argentina
-10.0
-8.0
-6.0
-4.0
-2.0
0.0
2.0
4.0
2005 2006 2007 2008 2009 2010 2011
P e r c e n t
Australia
-8.0
-6.0
-4.0
-2.0
0.0
2.0
4.0
6.0
8.0
10.0
2005 2006 2007 2008 2009 2010 2011
P e r c e n t
Austria
-6.0
-4.0
-2.0
0.0
2.0
4.0
6.0
8.0
2005 2006 2007 2008 2009 2010 2011
P e r c e n t
Belgium
-4.0
-3.0
-2.0
-1.0
0.0
1.0
2.0
3.0
2005 2006 2007 2008 2009 2010 2011
P e r c e n t
Brazil
-6.0
-5.0
-4.0
-3.0
-2.0
-1.0
0.0
1.0
2.0
3.0
4.0
2005 2006 2007 2008 2009 2010 2011
P e r c e n t
Canada
-6.0
-4.0
-2.0
0.0
2.0
4.0
6.0
8.0
10.0
12.0
14.0
2005 2006 2007 2008 2009 2010 2011
P e r c e n t
China
-10.0
-8.0
-6.0
-4.0
-2.0
0.0
2.0
4.0
6.0
8.0
2005 2006 2007 2008 2009 2010 2011
P e r c e n t
Czech Republic
-6.0
-4.0
-2.0
0.0
2.0
4.0
6.0
8.0
10.0
2005 2006 2007 2008 2009 2010 2011
P e r c e n t
Denmark
-6.0
-4.0
-2.0
0.0
2.0
4.0
6.0
8.0
10.0
2005 2006 2007 2008 2009 2010 2011
P e r c e n t
Finland
-4.0
-3.0
-2.0
-1.0
0.0
1.0
2.0
3.0
2005 2006 2007 2008 2009 2010 2011
P e r c e n t
France
-6.0
-4.0
-2.0
0.0
2.0
4.0
6.0
8.0
10.0
2005 2006 2007 2008 2009 2010 2011
P e r c e n t
Germany
-25.0
-20.0
-15.0
-10.0
-5.0
0.0
5.0
10.0
15.0
2005 2006 2007 2008 2009 2010 2011
P e r c e n t
Greece
-6.0
-5.0
-4.0
-3.0
-2.0
-1.0
0.0
1.0
2.0
3.0
2005 2006 2007 2008 2009 2010 2011
P e r c e n t
India
-8.0
-6.0
-4.0
-2.0
0.0
2.0
4.0
6.0
8.0
2005 2006 2007 2008 2009 2010 2011
P e r c e n t
Indonesia
-20.0
-15.0
-10.0
-5.0
0.0
5.0
10.0
15.0
20.0
2005 2006 2007 2008 2009 2010 2011
P e r c e n t
Ireland
-6.0
-5.0
-4.0
-3.0
-2.0
-1.0
0.0
1.0
2.0
3.0
2005 2006 2007 2008 2009 2010 2011
P e r c e n t
Italy
-3.0
-2.0
-1.0
0.0
1.0
2.0
3.0
4.0
5.0
6.0
2005 2006 2007 2008 2009 2010 2011
P e r c e n t
Japan
-6.0
-4.0
-2.0
0.0
2.0
4.0
6.0
8.0
10.0
2005 2006 2007 2008 2009 2010 2011
P e r c e n t
Korea
-5.0
-4.0
-3.0
-2.0
-1.0
0.0
1.0
2.0
3.0
4.0
2005 2006 2007 2008 2009 2010 2011
P e r c e n t
Mexico
-10.0
-5.0
0.0
5.0
10.0
15.0
2005 2006 2007 2008 2009 2010 2011
P e r c e n t
Netherlands
-12.0
-10.0
-8.0
-6.0
-4.0
-2.0
0.0
2.0
4.0
6.0
2005 2006 2007 2008 2009 2010 2011
P e r c e n t
New Zealand
-10.0
-5.0
0.0
5.0
10.0
15.0
20.0
25.0
2005 2006 2007 2008 2009 2010 2011
P e r c e n t
Norway
-10.0
-8.0
-6.0
-4.0
-2.0
0.0
2.0
4.0
2005 2006 2007 2008 2009 2010 2011
P e r c e n t
Poland
-20.0
-15.0
-10.0
-5.0
0.0
5.0
10.0
2005 2006 2007 2008 2009 2010 2011
P e r c e n t
Portugal
-10.0
-5.0
0.0
5.0
10.0
15.0
2005 2006 2007 2008 2009 2010 2011
P e r c e
n t
Russia
-30.0
-20.0
-10.0
0.0
10.0
20.0
30.0
40.0
2005 2006 2007 2008 2009 2010 2011
P e r c e
n t
Saudi Arabia
-10.0
-8.0
-6.0
-4.0
-2.0
0.0
2.0
4.0
2005 2006 2007 2008 2009 2010 2011
P e r c e
n t
South Africa
-15.0
-10.0
-5.0
0.0
5.0
10.0
2005 2006 2007 2008 2009 2010 2011
P e r c e
n t
Spain
-6.0
-4.0
-2.0
0.0
2.0
4.0
6.0
8.0
10.0
12.0
14.0
2005 2006 2007 2008 2009 2010 2011
P e r c e
n t
Sweden
-20.0
-15.0
-10.0
-5.0
0.0
5.0
10.0
15.0
20.0
25.0
2005 2006 2007 2008 2009 2010 2011
P e r c e n t
Switzerland
-10.0
-5.0
0.0
5.0
10.0
15.0
20.0
2005 2006 2007 2008 2009 2010 2011
P e r c e n t
Thailand
-15.0
-10.0
-5.0
0.0
5.0
10.0
2005 2006 2007 2008 2009 2010 2011
P e r c e n t
Turkey
-6.0
-5.0
-4.0
-3.0
-2.0
-1.0
0.0
1.0
2.0
3.0
4.0
2005 2006 2007 2008 2009 2010 2011
P e r c e n t
United Kingdom
-8.0
-7.0
-6.0
-5.0
-4.0
-3.0
-2.0
-1.0
0.0
1.0
2.0
3.0
2005 2006 2007 2008 2009 2010 2011
P e r c e n t
United States
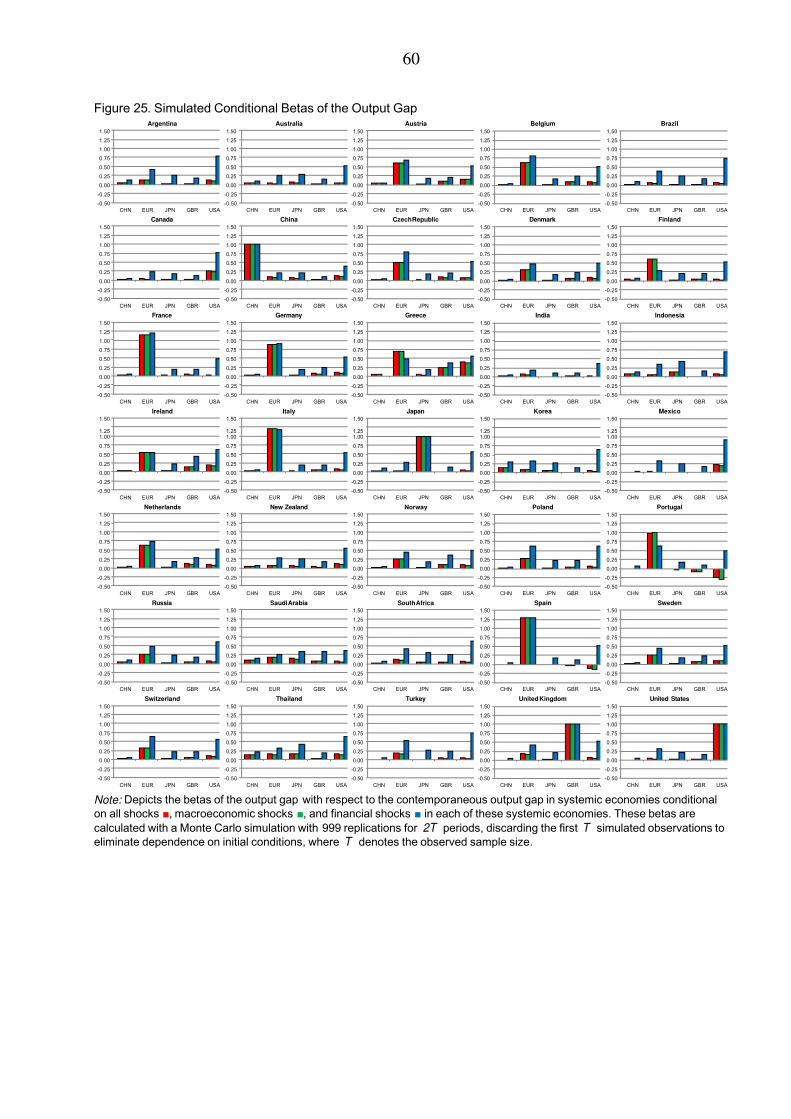
7/30/2019 IMF - Policy Analysis and Forecasting in the World Economy: A Panel Unobserved Components Approach
http://slidepdf.com/reader/full/imf-policy-analysis-and-forecasting-in-the-world-economy-a-panel-unobserved 61/77
60
Figure 25. Simulated Conditional Betas of the Output Gap
Note: Depicts the betas of the output gap with respect to the contemporaneous output gap in systemic economies conditional
on all shocks ■, macroeconomic shocks ■, and financial shocks ■ in each of these systemic economies. These betas are
calculated with a Monte Carlo simulation with 999 replications for 2T periods, discarding the first T simulated observations to
eliminate dependence on initial conditions, where T denotes the observed sample size.
-0.50
-0.25
0.00
0.25
0.50
0.75
1.00
1.25
1.50
CHN EUR JPN GBR USA
Argentina
-0.50
-0.25
0.00
0.25
0.50
0.75
1.00
1.25
1.50
CHN EUR JPN GBR USA
Australia
-0.50
-0.25
0.00
0.25
0.50
0.75
1.00
1.25
1.50
CHN EUR JPN GBR USA
Austria
-0.50
-0.25
0.00
0.25
0.50
0.75
1.00
1.25
1.50
CHN EUR JPN GBR USA
Belgium
-0.50
-0.25
0.00
0.25
0.50
0.75
1.00
1.25
1.50
CHN EUR JPN GBR USA
Brazil
-0.50
-0.25
0.00
0.25
0.50
0.75
1.00
1.25
1.50
CHN EUR JPN GBR USA
Canada
-0.50
-0.25
0.00
0.25
0.50
0.75
1.00
1.25
1.50
CHN EUR JPN GBR USA
China
-0.50
-0.25
0.00
0.25
0.50
0.75
1.00
1.25
1.50
CHN EUR JPN GBR USA
Czech Republic
-0.50
-0.25
0.00
0.25
0.50
0.75
1.00
1.25
1.50
CHN EUR JPN GBR USA
Denmark
-0.50
-0.25
0.00
0.25
0.50
0.75
1.00
1.25
1.50
CHN EUR JPN GBR USA
Finland
-0.50
-0.25
0.00
0.25
0.50
0.75
1.00
1.25
1.50
CHN EUR JPN GBR USA
France
-0.50
-0.25
0.00
0.25
0.50
0.75
1.00
1.25
1.50
CHN EUR JPN GBR USA
Germany
-0.50
-0.25
0.00
0.25
0.50
0.75
1.00
1.25
1.50
CHN EUR JPN GBR USA
Greece
-0.50
-0.25
0.00
0.25
0.50
0.75
1.00
1.25
1.50
CHN EUR JPN GBR USA
India
-0.50
-0.25
0.00
0.25
0.50
0.75
1.00
1.25
1.50
CHN EUR JPN GBR USA
Indonesia
-0.50
-0.25
0.00
0.25
0.50
0.75
1.00
1.25
1.50
CHN EUR JPN GBR USA
Ireland
-0.50
-0.25
0.00
0.25
0.50
0.75
1.00
1.25
1.50
CHN EUR JPN GBR USA
Italy
-0.50
-0.25
0.00
0.25
0.50
0.75
1.00
1.25
1.50
CHN EUR JPN GBR USA
Japan
-0.50
-0.25
0.00
0.25
0.50
0.75
1.00
1.25
1.50
CHN EUR JPN GBR USA
Korea
-0.50
-0.25
0.00
0.25
0.50
0.75
1.00
1.25
1.50
CHN EUR JPN GBR USA
Mexico
-0.50
-0.25
0.00
0.25
0.50
0.75
1.00
1.25
1.50
CHN EUR JPN GBR USA
Netherlands
-0.50
-0.25
0.00
0.25
0.50
0.75
1.00
1.25
1.50
CHN EUR JPN GBR USA
New Zealand
-0.50
-0.25
0.00
0.25
0.50
0.75
1.00
1.25
1.50
CHN EUR JPN GBR USA
Norway
-0.50
-0.25
0.00
0.25
0.50
0.75
1.00
1.25
1.50
CHN EUR JPN GBR USA
Poland
-0.50
-0.25
0.00
0.25
0.50
0.75
1.00
1.25
1.50
CHN EUR JPN GBR USA
Portugal
-0.50
-0.25
0.00
0.25
0.50
0.75
1.00
1.25
1.50
CHN EUR JPN GBR USA
Russia
-0.50
-0.25
0.00
0.25
0.50
0.75
1.00
1.25
1.50
CHN EUR JPN GBR USA
Saudi Arabia
-0.50
-0.25
0.00
0.25
0.50
0.75
1.00
1.25
1.50
CHN EUR JPN GBR USA
South Africa
-0.50
-0.25
0.00
0.25
0.50
0.75
1.00
1.25
1.50
CHN EUR JPN GBR USA
Spain
-0.50
-0.25
0.00
0.25
0.50
0.75
1.00
1.25
1.50
CHN EUR JPN GBR USA
Sweden
-0.50
-0.25
0.00
0.25
0.50
0.75
1.00
1.25
1.50
CHN EUR JPN GBR USA
Switzerland
-0.50
-0.25
0.00
0.25
0.50
0.75
1.00
1.25
1.50
CHN EUR JPN GBR USA
Thailand
-0.50
-0.25
0.00
0.25
0.50
0.75
1.00
1.25
1.50
CHN EUR JPN GBR USA
Turkey
-0.50
-0.25
0.00
0.25
0.50
0.75
1.00
1.25
1.50
CHN EUR JPN GBR USA
United Kingdom
-0.50
-0.25
0.00
0.25
0.50
0.75
1.00
1.25
1.50
CHN EUR JPN GBR USA
United States

7/30/2019 IMF - Policy Analysis and Forecasting in the World Economy: A Panel Unobserved Components Approach
http://slidepdf.com/reader/full/imf-policy-analysis-and-forecasting-in-the-world-economy-a-panel-unobserved 62/77
61
Figure 26. Peak Impulse Responses to Foreign Supply Shocks
Note: Depicts the peak impulse responses of consumption price inflation ■, output ■, the real effective exchange rate ■, the
ratio of the fiscal balance to nominal output ■, and the ratio of the current account balance to nominal output ■ to domestic
supply shocks in systemic economies which raise their consumption price inflation by one percentage point. Consumption price
inflation and the nominal policy interest rate are expressed as annual percentage rates.
-1.75
-1.50
-1.25
-1.00
-0.75
-0.50
-0.25
0.00
0.25
0.500.75
1.00
1.25
1.50
1.75
CHN EUR JPN GBR USA
P e r c e n t
Argentina
-1.75
-1.50
-1.25
-1.00
-0.75
-0.50
-0.25
0.00
0.25
0.500.75
1.00
1.25
1.50
1.75
CHN EUR JPN GBR USA
P e r c e n t
Australia
-1.75
-1.50
-1.25
-1.00
-0.75
-0.50
-0.25
0.00
0.25
0.500.75
1.00
1.25
1.50
1.75
CHN EUR JPN GBR USA
P e r c e n t
Austria
-1.75
-1.50
-1.25
-1.00
-0.75
-0.50
-0.25
0.00
0.25
0.500.75
1.00
1.25
1.50
1.75
CHN EUR JPN GBR USA
P e r c e n t
Belgium
-1.75
-1.50
-1.25
-1.00
-0.75
-0.50
-0.25
0.00
0.25
0.500.75
1.00
1.25
1.50
1.75
CHN EUR JPN GBR USA
P e r c e n t
Brazil
-1.75
-1.50
-1.25
-1.00
-0.75
-0.50
-0.25
0.00
0.250.50
0.75
1.00
1.25
1.50
1.75
CHN EUR JPN GBR USA
P e r c e n t
Canada
-1.75
-1.50
-1.25
-1.00
-0.75
-0.50
-0.25
0.00
0.250.50
0.75
1.00
1.25
1.50
1.75
CHN EUR JPN GBR USA
P e r c e n t
China
-1.75
-1.50
-1.25
-1.00
-0.75
-0.50
-0.25
0.00
0.250.50
0.75
1.00
1.25
1.50
1.75
CHN EUR JPN GBR USA
P e r c e n t
Czech Republic
-1.75
-1.50
-1.25
-1.00
-0.75
-0.50
-0.25
0.00
0.250.50
0.75
1.00
1.25
1.50
1.75
CHN EUR JPN GBR USA
P e r c e n t
Denmark
-1.75
-1.50
-1.25
-1.00
-0.75
-0.50
-0.25
0.00
0.250.50
0.75
1.00
1.25
1.50
1.75
CHN EUR JPN GBR USA
P e r c e n t
Finland
-1.75
-1.50
-1.25
-1.00
-0.75
-0.50
-0.25
0.000.25
0.50
0.75
1.00
1.25
1.50
1.75
CHN EUR JPN GBR USA
P e r c e n t
France
-1.75
-1.50
-1.25
-1.00
-0.75
-0.50
-0.25
0.000.25
0.50
0.75
1.00
1.25
1.50
1.75
CHN EUR JPN GBR USA
P e r c e n t
Germany
-1.75
-1.50
-1.25
-1.00
-0.75
-0.50
-0.25
0.000.25
0.50
0.75
1.00
1.25
1.50
1.75
CHN EUR JPN GBR USA
P e r c e n t
Greece
-1.75
-1.50
-1.25
-1.00
-0.75
-0.50
-0.25
0.000.25
0.50
0.75
1.00
1.25
1.50
1.75
CHN EUR JPN GBR USA
P e r c e n t
India
-1.75
-1.50
-1.25
-1.00
-0.75
-0.50
-0.25
0.000.25
0.50
0.75
1.00
1.25
1.50
1.75
CHN EUR JPN GBR USA
P e r c e n t
Indonesia
-1.75
-1.50
-1.25
-1.00
-0.75-0.50
-0.25
0.00
0.25
0.50
0.75
1.001.25
1.50
1.75
CHN EUR JPN GBR USA
P e r c e n t
Ireland
-1.75
-1.50
-1.25
-1.00
-0.75-0.50
-0.25
0.00
0.25
0.50
0.75
1.001.25
1.50
1.75
CHN EUR JPN GBR USA
P e r c e n t
Italy
-1.75
-1.50
-1.25
-1.00
-0.75-0.50
-0.25
0.00
0.25
0.50
0.75
1.001.25
1.50
1.75
CHN EUR JPN GBR USA
P e r c e n t
Japan
-1.75
-1.50
-1.25
-1.00
-0.75-0.50
-0.25
0.00
0.25
0.50
0.75
1.001.25
1.50
1.75
CHN EUR JPN GBR USA
P e r c e n t
Korea
-1.75
-1.50
-1.25
-1.00
-0.75-0.50
-0.25
0.00
0.25
0.50
0.75
1.001.25
1.50
1.75
CHN EUR JPN GBR USA
P e r c e n t
Mexico
-1.75
-1.50
-1.25
-1.00-0.75
-0.50
-0.25
0.00
0.25
0.50
0.75
1.00
1.25
1.50
1.75
CHN EUR JPN GBR USA
P e r c e n t
Netherlands
-1.75
-1.50
-1.25
-1.00-0.75
-0.50
-0.25
0.00
0.25
0.50
0.75
1.00
1.25
1.50
1.75
CHN EUR JPN GBR USA
P e r c e n t
New Zealand
-1.75
-1.50
-1.25
-1.00-0.75
-0.50
-0.25
0.00
0.25
0.50
0.75
1.00
1.25
1.50
1.75
CHN EUR JPN GBR USA
P e r c e n t
Norway
-1.75
-1.50
-1.25
-1.00-0.75
-0.50
-0.25
0.00
0.25
0.50
0.75
1.00
1.25
1.50
1.75
CHN EUR JPN GBR USA
P e r c e n t
Poland
-1.75
-1.50
-1.25
-1.00-0.75
-0.50
-0.25
0.00
0.25
0.50
0.75
1.00
1.25
1.50
1.75
CHN EUR JPN GBR USA
P e r c e n t
Portugal
-1.75
-1.50
-1.25-1.00
-0.75
-0.50
-0.25
0.00
0.25
0.50
0.75
1.00
1.25
1.50
1.75
CHN EUR JPN GBR USA
P e r c e
n t
Russia
-1.75
-1.50
-1.25-1.00
-0.75
-0.50
-0.25
0.00
0.25
0.50
0.75
1.00
1.25
1.50
1.75
CHN EUR JPN GBR USA
P e r c e
n t
Saudi Arabia
-1.75
-1.50
-1.25-1.00
-0.75
-0.50
-0.25
0.00
0.25
0.50
0.75
1.00
1.25
1.50
1.75
CHN EUR JPN GBR USA
P e r c e
n t
South Africa
-1.75
-1.50
-1.25-1.00
-0.75
-0.50
-0.25
0.00
0.25
0.50
0.75
1.00
1.25
1.50
1.75
CHN EUR JPN GBR USA
P e r c e
n t
Spain
-1.75
-1.50
-1.25-1.00
-0.75
-0.50
-0.25
0.00
0.25
0.50
0.75
1.00
1.25
1.50
1.75
CHN EUR JPN GBR USA
P e r c e
n t
Sweden
-1.75
-1.50-1.25
-1.00
-0.75
-0.50
-0.25
0.00
0.25
0.50
0.75
1.00
1.251.50
1.75
CHN EUR JPN GBR USA
P e r c e n t
Switzerland
-1.75
-1.50-1.25
-1.00
-0.75
-0.50
-0.25
0.00
0.25
0.50
0.75
1.00
1.251.50
1.75
CHN EUR JPN GBR USA
P e r c e n t
Thailand
-1.75
-1.50-1.25
-1.00
-0.75
-0.50
-0.25
0.00
0.25
0.50
0.75
1.00
1.251.50
1.75
CHN EUR JPN GBR USA
P e r c e n t
Turkey
-1.75
-1.50-1.25
-1.00
-0.75
-0.50
-0.25
0.00
0.25
0.50
0.75
1.00
1.251.50
1.75
CHN EUR JPN GBR USA
P e r c e n t
United Kingdom
-1.75
-1.50-1.25
-1.00
-0.75
-0.50
-0.25
0.00
0.25
0.50
0.75
1.00
1.251.50
1.75
CHN EUR JPN GBR USA
P e r c e n t
United States
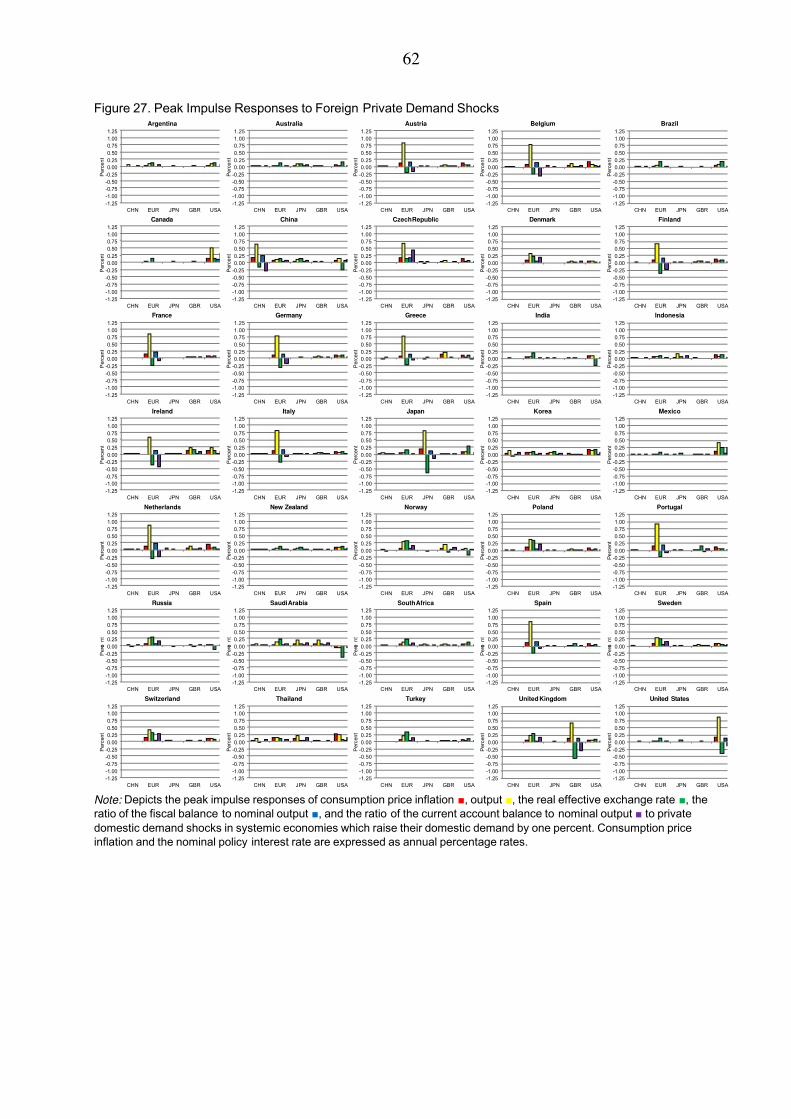
7/30/2019 IMF - Policy Analysis and Forecasting in the World Economy: A Panel Unobserved Components Approach
http://slidepdf.com/reader/full/imf-policy-analysis-and-forecasting-in-the-world-economy-a-panel-unobserved 63/77
62
Figure 27. Peak Impulse Responses to Foreign Private Demand Shocks
Note: Depicts the peak impulse responses of consumption price inflation ■, output ■, the real effective exchange rate ■, the
ratio of the fiscal balance to nominal output ■, and the ratio of the current account balance to nominal output ■ to private
domestic demand shocks in systemic economies which raise their domestic demand by one percent. Consumption price
inflation and the nominal policy interest rate are expressed as annual percentage rates.
-1.25
-1.00
-0.75
-0.50
-0.25
0.00
0.25
0.50
0.75
1.00
1.25
CHN EUR JPN GBR USA
P e r c e n t
Argentina
-1.25
-1.00
-0.75
-0.50
-0.25
0.00
0.25
0.50
0.75
1.00
1.25
CHN EUR JPN GBR USA
P e r c e n t
Australia
-1.25
-1.00
-0.75
-0.50
-0.25
0.00
0.25
0.50
0.75
1.00
1.25
CHN EUR JPN GBR USA
P e r c e n t
Austria
-1.25
-1.00
-0.75
-0.50
-0.25
0.00
0.25
0.50
0.75
1.00
1.25
CHN EUR JPN GBR USA
P e r c e n t
Belgium
-1.25
-1.00
-0.75
-0.50
-0.25
0.00
0.25
0.50
0.75
1.00
1.25
CHN EUR JPN GBR USA
P e r c e n t
Brazil
-1.25
-1.00
-0.75
-0.50
-0.25
0.00
0.25
0.50
0.75
1.00
1.25
CHN EUR JPN GBR USA
P e r c e n t
Canada
-1.25
-1.00
-0.75
-0.50
-0.25
0.00
0.25
0.50
0.75
1.00
1.25
CHN EUR JPN GBR USA
P e r c e n t
China
-1.25
-1.00
-0.75
-0.50
-0.25
0.00
0.25
0.50
0.75
1.00
1.25
CHN EUR JPN GBR USA
P e r c e n t
Czech Republic
-1.25
-1.00
-0.75
-0.50
-0.25
0.00
0.25
0.50
0.75
1.00
1.25
CHN EUR JPN GBR USA
P e r c e n t
Denmark
-1.25
-1.00
-0.75
-0.50
-0.25
0.00
0.25
0.50
0.75
1.00
1.25
CHN EUR JPN GBR USA
P e r c e n t
Finland
-1.25
-1.00
-0.75
-0.50
-0.25
0.00
0.25
0.50
0.75
1.00
1.25
CHN EUR JPN GBR USA
P e r c e n t
France
-1.25
-1.00
-0.75
-0.50
-0.25
0.00
0.25
0.50
0.75
1.00
1.25
CHN EUR JPN GBR USA
P e r c e n t
Germany
-1.25
-1.00
-0.75
-0.50
-0.25
0.00
0.25
0.50
0.75
1.00
1.25
CHN EUR JPN GBR USA
P e r c e n t
Greece
-1.25
-1.00
-0.75
-0.50
-0.25
0.00
0.25
0.50
0.75
1.00
1.25
CHN EUR JPN GBR USA
P e r c e n t
India
-1.25
-1.00
-0.75
-0.50
-0.25
0.00
0.25
0.50
0.75
1.00
1.25
CHN EUR JPN GBR USA
P e r c e n t
Indonesia
-1.25
-1.00
-0.75
-0.50
-0.25
0.00
0.25
0.50
0.75
1.00
1.25
CHN EUR JPN GBR USA
P e r c e n t
Ireland
-1.25
-1.00
-0.75
-0.50
-0.25
0.00
0.25
0.50
0.75
1.00
1.25
CHN EUR JPN GBR USA
P e r c e n t
Italy
-1.25
-1.00
-0.75
-0.50
-0.25
0.00
0.25
0.50
0.75
1.00
1.25
CHN EUR JPN GBR USA
P e r c e n t
Japan
-1.25
-1.00
-0.75
-0.50
-0.25
0.00
0.25
0.50
0.75
1.00
1.25
CHN EUR JPN GBR USA
P e r c e n t
Korea
-1.25
-1.00
-0.75
-0.50
-0.25
0.00
0.25
0.50
0.75
1.00
1.25
CHN EUR JPN GBR USA
P e r c e n t
Mexico
-1.25
-1.00
-0.75
-0.50
-0.25
0.00
0.25
0.50
0.75
1.00
1.25
CHN EUR JPN GBR USA
P e r c e n t
Netherlands
-1.25
-1.00
-0.75
-0.50
-0.25
0.00
0.25
0.50
0.75
1.00
1.25
CHN EUR JPN GBR USA
P e r c e n t
New Zealand
-1.25
-1.00
-0.75
-0.50
-0.25
0.00
0.25
0.50
0.75
1.00
1.25
CHN EUR JPN GBR USA
P e r c e n t
Norway
-1.25
-1.00
-0.75
-0.50
-0.25
0.00
0.25
0.50
0.75
1.00
1.25
CHN EUR JPN GBR USA
P e r c e n t
Poland
-1.25
-1.00
-0.75
-0.50
-0.25
0.00
0.25
0.50
0.75
1.00
1.25
CHN EUR JPN GBR USA
P e r c e n t
Portugal
-1.25
-1.00
-0.75
-0.50
-0.25
0.00
0.25
0.50
0.75
1.00
1.25
CHN EUR JPN GBR USA
P e r c e
n t
Russia
-1.25
-1.00
-0.75
-0.50
-0.25
0.00
0.25
0.50
0.75
1.00
1.25
CHN EUR JPN GBR USA
P e r c e
n t
Saudi Arabia
-1.25
-1.00
-0.75
-0.50
-0.25
0.00
0.25
0.50
0.75
1.00
1.25
CHN EUR JPN GBR USA
P e r c e
n t
South Africa
-1.25
-1.00
-0.75
-0.50
-0.25
0.00
0.25
0.50
0.75
1.00
1.25
CHN EUR JPN GBR USA
P e r c e
n t
Spain
-1.25
-1.00
-0.75
-0.50
-0.25
0.00
0.25
0.50
0.75
1.00
1.25
CHN EUR JPN GBR USA
P e r c e
n t
Sweden
-1.25
-1.00
-0.75
-0.50
-0.25
0.00
0.25
0.50
0.75
1.00
1.25
CHN EUR JPN GBR USA
P e r c e n t
Switzerland
-1.25
-1.00
-0.75
-0.50
-0.25
0.00
0.25
0.50
0.75
1.00
1.25
CHN EUR JPN GBR USA
P e r c e n t
Thailand
-1.25
-1.00
-0.75
-0.50
-0.25
0.00
0.25
0.50
0.75
1.00
1.25
CHN EUR JPN GBR USA
P e r c e n t
Turkey
-1.25
-1.00
-0.75
-0.50
-0.25
0.00
0.25
0.50
0.75
1.00
1.25
CHN EUR JPN GBR USA
P e r c e n t
United Kingdom
-1.25
-1.00
-0.75
-0.50
-0.25
0.00
0.25
0.50
0.75
1.00
1.25
CHN EUR JPN GBR USA
P e r c e n t
United States

7/30/2019 IMF - Policy Analysis and Forecasting in the World Economy: A Panel Unobserved Components Approach
http://slidepdf.com/reader/full/imf-policy-analysis-and-forecasting-in-the-world-economy-a-panel-unobserved 64/77
63
Figure 28. Peak Impulse Responses to Foreign Monetary Policy Shocks
Note: Depicts the peak impulse responses of consumption price inflation ■, output ■, the real effective exchange rate ■, the
ratio of the fiscal balance to nominal output ■, and the ratio of the current account balance to nominal output ■ to monetary
policy shocks in systemic economies which raise their nominal policy interest rate by one percentage point. Consumption price
inflation and the nominal policy interest rate are expressed as annual percentage rates.
-1.50
-1.25
-1.00
-0.75
-0.50
-0.25
0.00
0.25
0.50
0.75
1.00
1.25
1.50
CHN EUR JPN GBR USA
P e r c e n t
Argentina
-1.50
-1.25
-1.00
-0.75
-0.50
-0.25
0.00
0.25
0.50
0.75
1.00
1.25
1.50
CHN EUR JPN GBR USA
P e r c e n t
Australia
-1.50
-1.25
-1.00
-0.75
-0.50
-0.25
0.00
0.25
0.50
0.75
1.00
1.25
1.50
CHN EUR JPN GBR USA
P e r c e n t
Austria
-1.50
-1.25
-1.00
-0.75
-0.50
-0.25
0.00
0.25
0.50
0.75
1.00
1.25
1.50
CHN EUR JPN GBR USA
P e r c e n t
Belgium
-1.50
-1.25
-1.00
-0.75
-0.50
-0.25
0.00
0.25
0.50
0.75
1.00
1.25
1.50
CHN EUR JPN GBR USA
P e r c e n t
Brazil
-1.50
-1.25
-1.00
-0.75
-0.50
-0.25
0.00
0.25
0.50
0.75
1.00
1.25
1.50
CHN EUR JPN GBR USA
P e r c e n t
Canada
-1.50
-1.25
-1.00
-0.75
-0.50
-0.25
0.00
0.25
0.50
0.75
1.00
1.25
1.50
CHN EUR JPN GBR USA
P e r c e n t
China
-1.50
-1.25
-1.00
-0.75
-0.50
-0.25
0.00
0.25
0.50
0.75
1.00
1.25
1.50
CHN EUR JPN GBR USA
P e r c e n t
Czech Republic
-1.50
-1.25
-1.00
-0.75
-0.50
-0.25
0.00
0.25
0.50
0.75
1.00
1.25
1.50
CHN EUR JPN GBR USA
P e r c e n t
Denmark
-1.50
-1.25
-1.00
-0.75
-0.50
-0.25
0.00
0.25
0.50
0.75
1.00
1.25
1.50
CHN EUR JPN GBR USA
P e r c e n t
Finland
-1.50
-1.25
-1.00
-0.75
-0.50
-0.25
0.00
0.25
0.50
0.75
1.00
1.25
1.50
CHN EUR JPN GBR USA
P e r c e n t
France
-1.50
-1.25
-1.00
-0.75
-0.50
-0.25
0.00
0.25
0.50
0.75
1.00
1.25
1.50
CHN EUR JPN GBR USA
P e r c e n t
Germany
-1.50
-1.25
-1.00
-0.75
-0.50
-0.25
0.00
0.25
0.50
0.75
1.00
1.25
1.50
CHN EUR JPN GBR USA
P e r c e n t
Greece
-1.50
-1.25
-1.00
-0.75
-0.50
-0.25
0.00
0.25
0.50
0.75
1.00
1.25
1.50
CHN EUR JPN GBR USA
P e r c e n t
India
-1.50
-1.25
-1.00
-0.75
-0.50
-0.25
0.00
0.25
0.50
0.75
1.00
1.25
1.50
CHN EUR JPN GBR USA
P e r c e n t
Indonesia
-1.50
-1.25
-1.00
-0.75
-0.50
-0.25
0.00
0.25
0.50
0.75
1.00
1.25
1.50
CHN EUR JPN GBR USA
P e r c e n t
Ireland
-1.50
-1.25
-1.00
-0.75
-0.50
-0.25
0.00
0.25
0.50
0.75
1.00
1.25
1.50
CHN EUR JPN GBR USA
P e r c e n t
Italy
-1.50
-1.25
-1.00
-0.75
-0.50
-0.25
0.00
0.25
0.50
0.75
1.00
1.25
1.50
CHN EUR JPN GBR USA
P e r c e n t
Japan
-1.50
-1.25
-1.00
-0.75
-0.50
-0.25
0.00
0.25
0.50
0.75
1.00
1.25
1.50
CHN EUR JPN GBR USA
P e r c e n t
Korea
-1.50
-1.25
-1.00
-0.75
-0.50
-0.25
0.00
0.25
0.50
0.75
1.00
1.25
1.50
CHN EUR JPN GBR USA
P e r c e n t
Mexico
-1.50
-1.25
-1.00
-0.75
-0.50
-0.25
0.00
0.25
0.50
0.75
1.00
1.25
1.50
CHN EUR JPN GBR USA
P e r c e n t
Netherlands
-1.50
-1.25
-1.00
-0.75
-0.50
-0.25
0.00
0.25
0.50
0.75
1.00
1.25
1.50
CHN EUR JPN GBR USA
P e r c e n t
New Zealand
-1.50
-1.25
-1.00
-0.75
-0.50
-0.25
0.00
0.25
0.50
0.75
1.00
1.25
1.50
CHN EUR JPN GBR USA
P e r c e n t
Norway
-1.50
-1.25
-1.00
-0.75
-0.50
-0.25
0.00
0.25
0.50
0.75
1.00
1.25
1.50
CHN EUR JPN GBR USA
P e r c e n t
Poland
-1.50
-1.25
-1.00
-0.75
-0.50
-0.25
0.00
0.25
0.50
0.75
1.00
1.25
1.50
CHN EUR JPN GBR USA
P e r c e n t
Portugal
-1.50
-1.25
-1.00
-0.75
-0.50
-0.25
0.00
0.25
0.50
0.75
1.00
1.25
1.50
CHN EUR JPN GBR USA
P e r c e
n t
Russia
-1.50
-1.25
-1.00
-0.75
-0.50
-0.25
0.00
0.25
0.50
0.75
1.00
1.25
1.50
CHN EUR JPN GBR USA
P e r c e
n t
Saudi Arabia
-1.50
-1.25
-1.00
-0.75
-0.50
-0.25
0.00
0.25
0.50
0.75
1.00
1.25
1.50
CHN EUR JPN GBR USA
P e r c e
n t
South Africa
-1.50
-1.25
-1.00
-0.75
-0.50
-0.25
0.00
0.25
0.50
0.75
1.00
1.25
1.50
CHN EUR JPN GBR USA
P e r c e
n t
Spain
-1.50
-1.25
-1.00
-0.75
-0.50
-0.25
0.00
0.25
0.50
0.75
1.00
1.25
1.50
CHN EUR JPN GBR USA
P e r c e
n t
Sweden
-1.50
-1.25
-1.00
-0.75
-0.50
-0.25
0.00
0.25
0.50
0.75
1.00
1.25
1.50
CHN EUR JPN GBR USA
P e r c e n t
Switzerland
-1.50
-1.25
-1.00
-0.75
-0.50
-0.25
0.00
0.25
0.50
0.75
1.00
1.25
1.50
CHN EUR JPN GBR USA
P e r c e n t
Thailand
-1.50
-1.25
-1.00
-0.75
-0.50
-0.25
0.00
0.25
0.50
0.75
1.00
1.25
1.50
CHN EUR JPN GBR USA
P e r c e n t
Turkey
-1.50
-1.25
-1.00
-0.75
-0.50
-0.25
0.00
0.25
0.50
0.75
1.00
1.25
1.50
CHN EUR JPN GBR USA
P e r c e n t
United Kingdom
-1.50
-1.25
-1.00
-0.75
-0.50
-0.25
0.00
0.25
0.50
0.75
1.00
1.25
1.50
CHN EUR JPN GBR USA
P e r c e n t
United States

7/30/2019 IMF - Policy Analysis and Forecasting in the World Economy: A Panel Unobserved Components Approach
http://slidepdf.com/reader/full/imf-policy-analysis-and-forecasting-in-the-world-economy-a-panel-unobserved 65/77
64
Figure 29. Peak Impulse Responses to Foreign Credit Risk Premium Shocks
Note: Depicts the peak impulse responses of consumption price inflation ■, output ■, the real effective exchange rate ■, the
ratio of the fiscal balance to nominal output ■, and the ratio of the current account balance to nominal output ■ to credit risk
premium shocks in systemic economies which raise their short term nominal market interest rate by one percentage point.
Consumption price inflation and the nominal policy interest rate are expressed as annual percentage rates.
-0.75
-0.50
-0.25
0.00
0.25
0.50
0.75
CHN EUR JPN GBR USA
P e r c e n t
Argentina
-0.75
-0.50
-0.25
0.00
0.25
0.50
0.75
CHN EUR JPN GBR USA
P e r c e n t
Australia
-0.75
-0.50
-0.25
0.00
0.25
0.50
0.75
CHN EUR JPN GBR USA
P e r c e n t
Austria
-0.75
-0.50
-0.25
0.00
0.25
0.50
0.75
CHN EUR JPN GBR USA
P e r c e n t
Belgium
-0.75
-0.50
-0.25
0.00
0.25
0.50
0.75
CHN EUR JPN GBR USA
P e r c e n t
Brazil
-0.75
-0.50
-0.25
0.00
0.25
0.50
0.75
CHN EUR JPN GBR USA
P e r c e n t
Canada
-0.75
-0.50
-0.25
0.00
0.25
0.50
0.75
CHN EUR JPN GBR USA
P e r c e n t
China
-0.75
-0.50
-0.25
0.00
0.25
0.50
0.75
CHN EUR JPN GBR USA
P e r c e n t
Czech Republic
-0.75
-0.50
-0.25
0.00
0.25
0.50
0.75
CHN EUR JPN GBR USA
P e r c e n t
Denmark
-0.75
-0.50
-0.25
0.00
0.25
0.50
0.75
CHN EUR JPN GBR USA
P e r c e n t
Finland
-0.75
-0.50
-0.25
0.00
0.25
0.50
0.75
CHN EUR JPN GBR USA
P e r c e n t
France
-0.75
-0.50
-0.25
0.00
0.25
0.50
0.75
CHN EUR JPN GBR USA
P e r c e n t
Germany
-0.75
-0.50
-0.25
0.00
0.25
0.50
0.75
CHN EUR JPN GBR USA
P e r c e n t
Greece
-0.75
-0.50
-0.25
0.00
0.25
0.50
0.75
CHN EUR JPN GBR USA
P e r c e n t
India
-0.75
-0.50
-0.25
0.00
0.25
0.50
0.75
CHN EUR JPN GBR USA
P e r c e n t
Indonesia
-0.75
-0.50
-0.25
0.00
0.25
0.50
0.75
CHN EUR JPN GBR USA
P e r c e n t
Ireland
-0.75
-0.50
-0.25
0.00
0.25
0.50
0.75
CHN EUR JPN GBR USA
P e r c e n t
Italy
-0.75
-0.50
-0.25
0.00
0.25
0.50
0.75
CHN EUR JPN GBR USA
P e r c e n t
Japan
-0.75
-0.50
-0.25
0.00
0.25
0.50
0.75
CHN EUR JPN GBR USA
P e r c e n t
Korea
-0.75
-0.50
-0.25
0.00
0.25
0.50
0.75
CHN EUR JPN GBR USA
P e r c e n t
Mexico
-0.75
-0.50
-0.25
0.00
0.25
0.50
0.75
CHN EUR JPN GBR USA
P e r c e n t
Netherlands
-0.75
-0.50
-0.25
0.00
0.25
0.50
0.75
CHN EUR JPN GBR USA
P e r c e n t
New Zealand
-0.75
-0.50
-0.25
0.00
0.25
0.50
0.75
CHN EUR JPN GBR USA
P e r c e n t
Norway
-0.75
-0.50
-0.25
0.00
0.25
0.50
0.75
CHN EUR JPN GBR USA
P e r c e n t
Poland
-0.75
-0.50
-0.25
0.00
0.25
0.50
0.75
CHN EUR JPN GBR USA
P e r c e n t
Portugal
-0.75
-0.50
-0.25
0.00
0.25
0.50
0.75
CHN EUR JPN GBR USA
P e r c e
n t
Russia
-0.75
-0.50
-0.25
0.00
0.25
0.50
0.75
CHN EUR JPN GBR USA
P e r c e
n t
Saudi Arabia
-0.75
-0.50
-0.25
0.00
0.25
0.50
0.75
CHN EUR JPN GBR USA
P e r c e
n t
South Africa
-0.75
-0.50
-0.25
0.00
0.25
0.50
0.75
CHN EUR JPN GBR USA
P e r c e
n t
Spain
-0.75
-0.50
-0.25
0.00
0.25
0.50
0.75
CHN EUR JPN GBR USA
P e r c e
n t
Sweden
-0.75
-0.50
-0.25
0.00
0.25
0.50
0.75
CHN EUR JPN GBR USA
P e r c e n t
Switzerland
-0.75
-0.50
-0.25
0.00
0.25
0.50
0.75
CHN EUR JPN GBR USA
P e r c e n t
Thailand
-0.75
-0.50
-0.25
0.00
0.25
0.50
0.75
CHN EUR JPN GBR USA
P e r c e n t
Turkey
-0.75
-0.50
-0.25
0.00
0.25
0.50
0.75
CHN EUR JPN GBR USA
P e r c e n t
United Kingdom
-0.75
-0.50
-0.25
0.00
0.25
0.50
0.75
CHN EUR JPN GBR USA
P e r c e n t
United States

7/30/2019 IMF - Policy Analysis and Forecasting in the World Economy: A Panel Unobserved Components Approach
http://slidepdf.com/reader/full/imf-policy-analysis-and-forecasting-in-the-world-economy-a-panel-unobserved 66/77
65
Figure 30. Peak Impulse Responses to Foreign Duration Risk Premium Shocks
Note: Depicts the peak impulse responses of consumption price inflation ■, output ■, the real effective exchange rate ■, the
ratio of the fiscal balance to nominal output ■, and the ratio of the current account balance to nominal output ■ to duration risk
premium shocks in systemic economies which raise their long term nominal market interest rate by one percentage point.
Consumption price inflation and the nominal policy interest rate are expressed as annual percentage rates.
-0.50
-0.25
0.00
0.25
0.50
CHN EUR JPN GBR USA
P e r c e n t
Argentina
-0.50
-0.25
0.00
0.25
0.50
CHN EUR JPN GBR USA
P e r c e n t
Australia
-0.50
-0.25
0.00
0.25
0.50
CHN EUR JPN GBR USA
P e r c e n t
Austria
-0.50
-0.25
0.00
0.25
0.50
CHN EUR JPN GBR USA
P e r c e n t
Belgium
-0.50
-0.25
0.00
0.25
0.50
CHN EUR JPN GBR USA
P e r c e n t
Brazil
-0.50
-0.25
0.00
0.25
0.50
CHN EUR JPN GBR USA
P e r c e n t
Canada
-0.50
-0.25
0.00
0.25
0.50
CHN EUR JPN GBR USA
P e r c e n t
China
-0.50
-0.25
0.00
0.25
0.50
CHN EUR JPN GBR USA
P e r c e n t
Czech Republic
-0.50
-0.25
0.00
0.25
0.50
CHN EUR JPN GBR USA
P e r c e n t
Denmark
-0.50
-0.25
0.00
0.25
0.50
CHN EUR JPN GBR USA
P e r c e n t
Finland
-0.50
-0.25
0.00
0.25
0.50
CHN EUR JPN GBR USA
P e r c e n t
France
-0.50
-0.25
0.00
0.25
0.50
CHN EUR JPN GBR USA
P e r c e n t
Germany
-0.50
-0.25
0.00
0.25
0.50
CHN EUR JPN GBR USA
P e r c e n t
Greece
-0.50
-0.25
0.00
0.25
0.50
CHN EUR JPN GBR USA
P e r c e n t
India
-0.50
-0.25
0.00
0.25
0.50
CHN EUR JPN GBR USA
P e r c e n t
Indonesia
-0.50
-0.25
0.00
0.25
0.50
CHN EUR JPN GBR USA
P e r c e n t
Ireland
-0.50
-0.25
0.00
0.25
0.50
CHN EUR JPN GBR USA
P e r c e n t
Italy
-0.50
-0.25
0.00
0.25
0.50
CHN EUR JPN GBR USA
P e r c e n t
Japan
-0.50
-0.25
0.00
0.25
0.50
CHN EUR JPN GBR USA
P e r c e n t
Korea
-0.50
-0.25
0.00
0.25
0.50
CHN EUR JPN GBR USA
P e r c e n t
Mexico
-0.50
-0.25
0.00
0.25
0.50
CHN EUR JPN GBR USA
P e r c e n t
Netherlands
-0.50
-0.25
0.00
0.25
0.50
CHN EUR JPN GBR USA
P e r c e n t
New Zealand
-0.50
-0.25
0.00
0.25
0.50
CHN EUR JPN GBR USA
P e r c e n t
Norway
-0.50
-0.25
0.00
0.25
0.50
CHN EUR JPN GBR USA
P e r c e n t
Poland
-0.50
-0.25
0.00
0.25
0.50
CHN EUR JPN GBR USA
P e r c e n t
Portugal
-0.50
-0.25
0.00
0.25
0.50
CHN EUR JPN GBR USA
P e r c e
n t
Russia
-0.50
-0.25
0.00
0.25
0.50
CHN EUR JPN GBR USA
P e r c e
n t
Saudi Arabia
-0.50
-0.25
0.00
0.25
0.50
CHN EUR JPN GBR USA
P e r c e
n t
South Africa
-0.50
-0.25
0.00
0.25
0.50
CHN EUR JPN GBR USA
P e r c e
n t
Spain
-0.50
-0.25
0.00
0.25
0.50
CHN EUR JPN GBR USA
P e r c e
n t
Sweden
-0.50
-0.25
0.00
0.25
0.50
CHN EUR JPN GBR USA
P e r c e n t
Switzerland
-0.50
-0.25
0.00
0.25
0.50
CHN EUR JPN GBR USA
P e r c e n t
Thailand
-0.50
-0.25
0.00
0.25
0.50
CHN EUR JPN GBR USA
P e r c e n t
Turkey
-0.50
-0.25
0.00
0.25
0.50
CHN EUR JPN GBR USA
P e r c e n t
United Kingdom
-0.50
-0.25
0.00
0.25
0.50
CHN EUR JPN GBR USA
P e r c e n t
United States
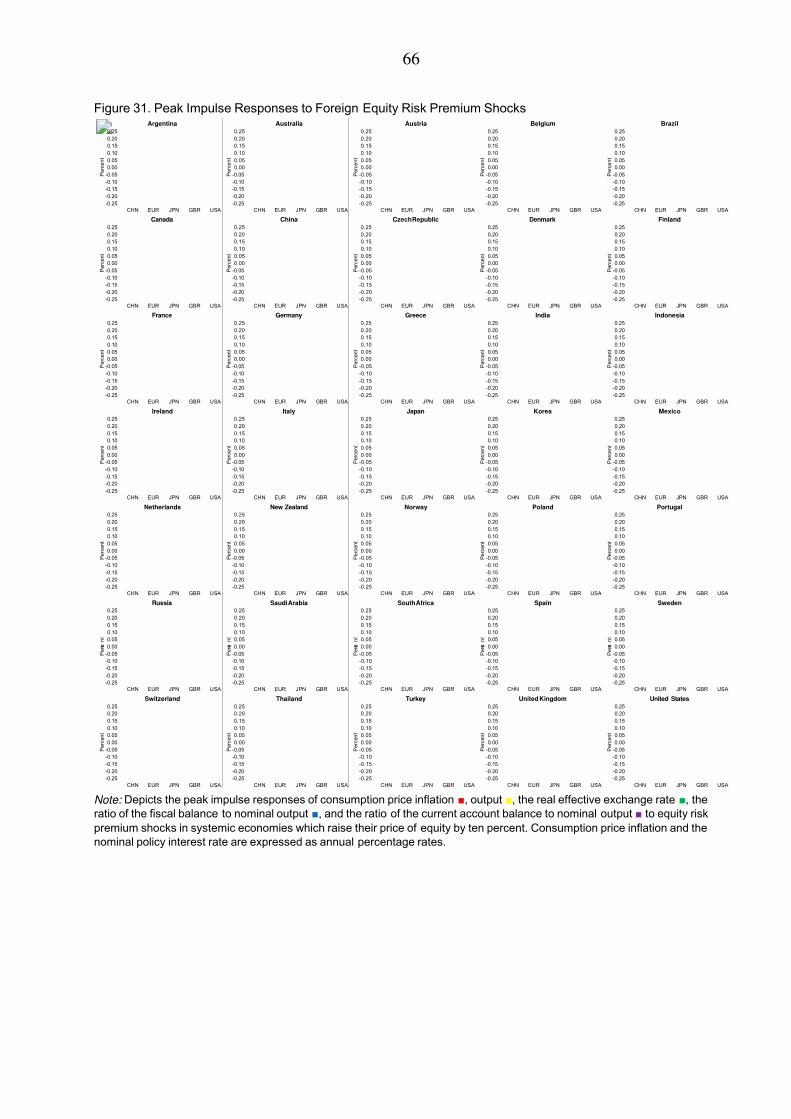
7/30/2019 IMF - Policy Analysis and Forecasting in the World Economy: A Panel Unobserved Components Approach
http://slidepdf.com/reader/full/imf-policy-analysis-and-forecasting-in-the-world-economy-a-panel-unobserved 67/77
66
Figure 31. Peak Impulse Responses to Foreign Equity Risk Premium Shocks
Note: Depicts the peak impulse responses of consumption price inflation ■, output ■, the real effective exchange rate ■, the
ratio of the fiscal balance to nominal output ■, and the ratio of the current account balance to nominal output ■ to equity risk
premium shocks in systemic economies which raise their price of equity by ten percent. Consumption price inflation and the
nominal policy interest rate are expressed as annual percentage rates.
-0.25
-0.20
-0.15
-0.10
-0.05
0.00
0.05
0.10
0.15
0.20
0.25
CHN EUR JPN GBR USA
P e r c e n t
Argentina
-0.25
-0.20
-0.15
-0.10
-0.05
0.00
0.05
0.10
0.15
0.20
0.25
CHN EUR JPN GBR USA
P e r c e n t
Australia
-0.25
-0.20
-0.15
-0.10
-0.05
0.00
0.05
0.10
0.15
0.20
0.25
CHN EUR JPN GBR USA
P e r c e n t
Austria
-0.25
-0.20
-0.15
-0.10
-0.05
0.00
0.05
0.10
0.15
0.20
0.25
CHN EUR JPN GBR USA
P e r c e n t
Belgium
-0.25
-0.20
-0.15
-0.10
-0.05
0.00
0.05
0.10
0.15
0.20
0.25
CHN EUR JPN GBR USA
P e r c e n t
Brazil
-0.25
-0.20
-0.15
-0.10
-0.05
0.00
0.05
0.10
0.15
0.20
0.25
CHN EUR JPN GBR USA
P e r c e n t
Canada
-0.25
-0.20
-0.15
-0.10
-0.05
0.00
0.05
0.10
0.15
0.20
0.25
CHN EUR JPN GBR USA
P e r c e n t
China
-0.25
-0.20
-0.15
-0.10
-0.05
0.00
0.05
0.10
0.15
0.20
0.25
CHN EUR JPN GBR USA
P e r c e n t
Czech Republic
-0.25
-0.20
-0.15
-0.10
-0.05
0.00
0.05
0.10
0.15
0.20
0.25
CHN EUR JPN GBR USA
P e r c e n t
Denmark
-0.25
-0.20
-0.15
-0.10
-0.05
0.00
0.05
0.10
0.15
0.20
0.25
CHN EUR JPN GBR USA
P e r c e n t
Finland
-0.25
-0.20
-0.15
-0.10
-0.05
0.00
0.05
0.10
0.15
0.20
0.25
CHN EUR JPN GBR USA
P e r c e n t
France
-0.25
-0.20
-0.15
-0.10
-0.05
0.00
0.05
0.10
0.15
0.20
0.25
CHN EUR JPN GBR USA
P e r c e n t
Germany
-0.25
-0.20
-0.15
-0.10
-0.05
0.00
0.05
0.10
0.15
0.20
0.25
CHN EUR JPN GBR USA
P e r c e n t
Greece
-0.25
-0.20
-0.15
-0.10
-0.05
0.00
0.05
0.10
0.15
0.20
0.25
CHN EUR JPN GBR USA
P e r c e n t
India
-0.25
-0.20
-0.15
-0.10
-0.05
0.00
0.05
0.10
0.15
0.20
0.25
CHN EUR JPN GBR USA
P e r c e n t
Indonesia
-0.25
-0.20
-0.15
-0.10
-0.05
0.00
0.05
0.10
0.15
0.20
0.25
CHN EUR JPN GBR USA
P e r c e n t
Ireland
-0.25
-0.20
-0.15
-0.10
-0.05
0.00
0.05
0.10
0.15
0.20
0.25
CHN EUR JPN GBR USA
P e r c e n t
Italy
-0.25
-0.20
-0.15
-0.10
-0.05
0.00
0.05
0.10
0.15
0.20
0.25
CHN EUR JPN GBR USA
P e r c e n t
Japan
-0.25
-0.20
-0.15
-0.10
-0.05
0.00
0.05
0.10
0.15
0.20
0.25
CHN EUR JPN GBR USA
P e r c e n t
Korea
-0.25
-0.20
-0.15
-0.10
-0.05
0.00
0.05
0.10
0.15
0.20
0.25
CHN EUR JPN GBR USA
P e r c e n t
Mexico
-0.25
-0.20
-0.15
-0.10
-0.05
0.00
0.05
0.10
0.15
0.20
0.25
CHN EUR JPN GBR USA
P e r c e n t
Netherlands
-0.25
-0.20
-0.15
-0.10
-0.05
0.00
0.05
0.10
0.15
0.20
0.25
CHN EUR JPN GBR USA
P e r c e n t
New Zealand
-0.25
-0.20
-0.15
-0.10
-0.05
0.00
0.05
0.10
0.15
0.20
0.25
CHN EUR JPN GBR USA
P e r c e n t
Norway
-0.25
-0.20
-0.15
-0.10
-0.05
0.00
0.05
0.10
0.15
0.20
0.25
CHN EUR JPN GBR USA
P e r c e n t
Poland
-0.25
-0.20
-0.15
-0.10
-0.05
0.00
0.05
0.10
0.15
0.20
0.25
CHN EUR JPN GBR USA
P e r c e n t
Portugal
-0.25
-0.20
-0.15
-0.10
-0.05
0.00
0.05
0.10
0.15
0.20
0.25
CHN EUR JPN GBR USA
P e r c e
n t
Russia
-0.25
-0.20
-0.15
-0.10
-0.05
0.00
0.05
0.10
0.15
0.20
0.25
CHN EUR JPN GBR USA
P e r c e
n t
Saudi Arabia
-0.25
-0.20
-0.15
-0.10
-0.05
0.00
0.05
0.10
0.15
0.20
0.25
CHN EUR JPN GBR USA
P e r c e
n t
South Africa
-0.25
-0.20
-0.15
-0.10
-0.05
0.00
0.05
0.10
0.15
0.20
0.25
CHN EUR JPN GBR USA
P e r c e
n t
Spain
-0.25
-0.20
-0.15
-0.10
-0.05
0.00
0.05
0.10
0.15
0.20
0.25
CHN EUR JPN GBR USA
P e r c e
n t
Sweden
-0.25
-0.20
-0.15
-0.10
-0.05
0.00
0.05
0.10
0.15
0.20
0.25
CHN EUR JPN GBR USA
P e r c e n t
Switzerland
-0.25
-0.20
-0.15
-0.10
-0.05
0.00
0.05
0.10
0.15
0.20
0.25
CHN EUR JPN GBR USA
P e r c e n t
Thailand
-0.25
-0.20
-0.15
-0.10
-0.05
0.00
0.05
0.10
0.15
0.20
0.25
CHN EUR JPN GBR USA
P e r c e n t
Turkey
-0.25
-0.20
-0.15
-0.10
-0.05
0.00
0.05
0.10
0.15
0.20
0.25
CHN EUR JPN GBR USA
P e r c e n t
United Kingdom
-0.25
-0.20
-0.15
-0.10
-0.05
0.00
0.05
0.10
0.15
0.20
0.25
CHN EUR JPN GBR USA
P e r c e n t
United States

7/30/2019 IMF - Policy Analysis and Forecasting in the World Economy: A Panel Unobserved Components Approach
http://slidepdf.com/reader/full/imf-policy-analysis-and-forecasting-in-the-world-economy-a-panel-unobserved 68/77
67
Figure 32. Peak Impulse Responses to Foreign Fiscal Expenditure Shocks
Note: Depicts the peak impulse responses of consumption price inflation ■, output ■, the real effective exchange rate ■, the
ratio of the fiscal balance to nominal output ■, and the ratio of the current account balance to nominal output ■ to fiscal
expenditure shocks in systemic economies which reduce their ratio of the fiscal balance to nominal output by one percentage
point. Consumption price inflation and the nominal policy interest rate are expressed as annual percentage rates.
-2.50
-2.00
-1.50
-1.00
-0.50
0.00
0.50
1.00
1.50
2.00
2.50
CHN EUR JPN GBR USA
P e r c e n t
Argentina
-2.50
-2.00
-1.50
-1.00
-0.50
0.00
0.50
1.00
1.50
2.00
2.50
CHN EUR JPN GBR USA
P e r c e n t
Australia
-2.50
-2.00
-1.50
-1.00
-0.50
0.00
0.50
1.00
1.50
2.00
2.50
CHN EUR JPN GBR USA
P e r c e n t
Austria
-2.50
-2.00
-1.50
-1.00
-0.50
0.00
0.50
1.00
1.50
2.00
2.50
CHN EUR JPN GBR USA
P e r c e n t
Belgium
-2.50
-2.00
-1.50
-1.00
-0.50
0.00
0.50
1.00
1.50
2.00
2.50
CHN EUR JPN GBR USA
P e r c e n t
Brazil
-2.50
-2.00
-1.50
-1.00
-0.50
0.00
0.50
1.00
1.50
2.00
2.50
CHN EUR JPN GBR USA
P e r c e n t
Canada
-2.50
-2.00
-1.50
-1.00
-0.50
0.00
0.50
1.00
1.50
2.00
2.50
CHN EUR JPN GBR USA
P e r c e n t
China
-2.50
-2.00
-1.50
-1.00
-0.50
0.00
0.50
1.00
1.50
2.00
2.50
CHN EUR JPN GBR USA
P e r c e n t
Czech Republic
-2.50
-2.00
-1.50
-1.00
-0.50
0.00
0.50
1.00
1.50
2.00
2.50
CHN EUR JPN GBR USA
P e r c e n t
Denmark
-2.50
-2.00
-1.50
-1.00
-0.50
0.00
0.50
1.00
1.50
2.00
2.50
CHN EUR JPN GBR USA
P e r c e n t
Finland
-2.50
-2.00
-1.50
-1.00
-0.50
0.00
0.50
1.00
1.50
2.00
2.50
CHN EUR JPN GBR USA
P e r c e n t
France
-2.50
-2.00
-1.50
-1.00
-0.50
0.00
0.50
1.00
1.50
2.00
2.50
CHN EUR JPN GBR USA
P e r c e n t
Germany
-2.50
-2.00
-1.50
-1.00
-0.50
0.00
0.50
1.00
1.50
2.00
2.50
CHN EUR JPN GBR USA
P e r c e n t
Greece
-2.50
-2.00
-1.50
-1.00
-0.50
0.00
0.50
1.00
1.50
2.00
2.50
CHN EUR JPN GBR USA
P e r c e n t
India
-2.50
-2.00
-1.50
-1.00
-0.50
0.00
0.50
1.00
1.50
2.00
2.50
CHN EUR JPN GBR USA
P e r c e n t
Indonesia
-2.50
-2.00
-1.50
-1.00
-0.50
0.00
0.50
1.00
1.50
2.00
2.50
CHN EUR JPN GBR USA
P e r c e n t
Ireland
-2.50
-2.00
-1.50
-1.00
-0.50
0.00
0.50
1.00
1.50
2.00
2.50
CHN EUR JPN GBR USA
P e r c e n t
Italy
-2.50
-2.00
-1.50
-1.00
-0.50
0.00
0.50
1.00
1.50
2.00
2.50
CHN EUR JPN GBR USA
P e r c e n t
Japan
-2.50
-2.00
-1.50
-1.00
-0.50
0.00
0.50
1.00
1.50
2.00
2.50
CHN EUR JPN GBR USA
P e r c e n t
Korea
-2.50
-2.00
-1.50
-1.00
-0.50
0.00
0.50
1.00
1.50
2.00
2.50
CHN EUR JPN GBR USA
P e r c e n t
Mexico
-2.50
-2.00
-1.50
-1.00
-0.50
0.00
0.50
1.00
1.50
2.00
2.50
CHN EUR JPN GBR USA
P e r c e n t
Netherlands
-2.50
-2.00
-1.50
-1.00
-0.50
0.00
0.50
1.00
1.50
2.00
2.50
CHN EUR JPN GBR USA
P e r c e n t
New Zealand
-2.50
-2.00
-1.50
-1.00
-0.50
0.00
0.50
1.00
1.50
2.00
2.50
CHN EUR JPN GBR USA
P e r c e n t
Norway
-2.50
-2.00
-1.50
-1.00
-0.50
0.00
0.50
1.00
1.50
2.00
2.50
CHN EUR JPN GBR USA
P e r c e n t
Poland
-2.50
-2.00
-1.50
-1.00
-0.50
0.00
0.50
1.00
1.50
2.00
2.50
CHN EUR JPN GBR USA
P e r c e n t
Portugal
-2.50
-2.00
-1.50
-1.00
-0.50
0.00
0.50
1.00
1.50
2.00
2.50
CHN EUR JPN GBR USA
P e r c e
n t
Russia
-2.50
-2.00
-1.50
-1.00
-0.50
0.00
0.50
1.00
1.50
2.00
2.50
CHN EUR JPN GBR USA
P e r c e
n t
Saudi Arabia
-2.50
-2.00
-1.50
-1.00
-0.50
0.00
0.50
1.00
1.50
2.00
2.50
CHN EUR JPN GBR USA
P e r c e
n t
South Africa
-2.50
-2.00
-1.50
-1.00
-0.50
0.00
0.50
1.00
1.50
2.00
2.50
CHN EUR JPN GBR USA
P e r c e
n t
Spain
-2.50
-2.00
-1.50
-1.00
-0.50
0.00
0.50
1.00
1.50
2.00
2.50
CHN EUR JPN GBR USA
P e r c e
n t
Sweden
-2.50
-2.00
-1.50
-1.00
-0.50
0.00
0.50
1.00
1.50
2.00
2.50
CHN EUR JPN GBR USA
P e r c e n t
Switzerland
-2.50
-2.00
-1.50
-1.00
-0.50
0.00
0.50
1.00
1.50
2.00
2.50
CHN EUR JPN GBR USA
P e r c e n t
Thailand
-2.50
-2.00
-1.50
-1.00
-0.50
0.00
0.50
1.00
1.50
2.00
2.50
CHN EUR JPN GBR USA
P e r c e n t
Turkey
-2.50
-2.00
-1.50
-1.00
-0.50
0.00
0.50
1.00
1.50
2.00
2.50
CHN EUR JPN GBR USA
P e r c e n t
United Kingdom
-2.50
-2.00
-1.50
-1.00
-0.50
0.00
0.50
1.00
1.50
2.00
2.50
CHN EUR JPN GBR USA
P e r c e n t
United States
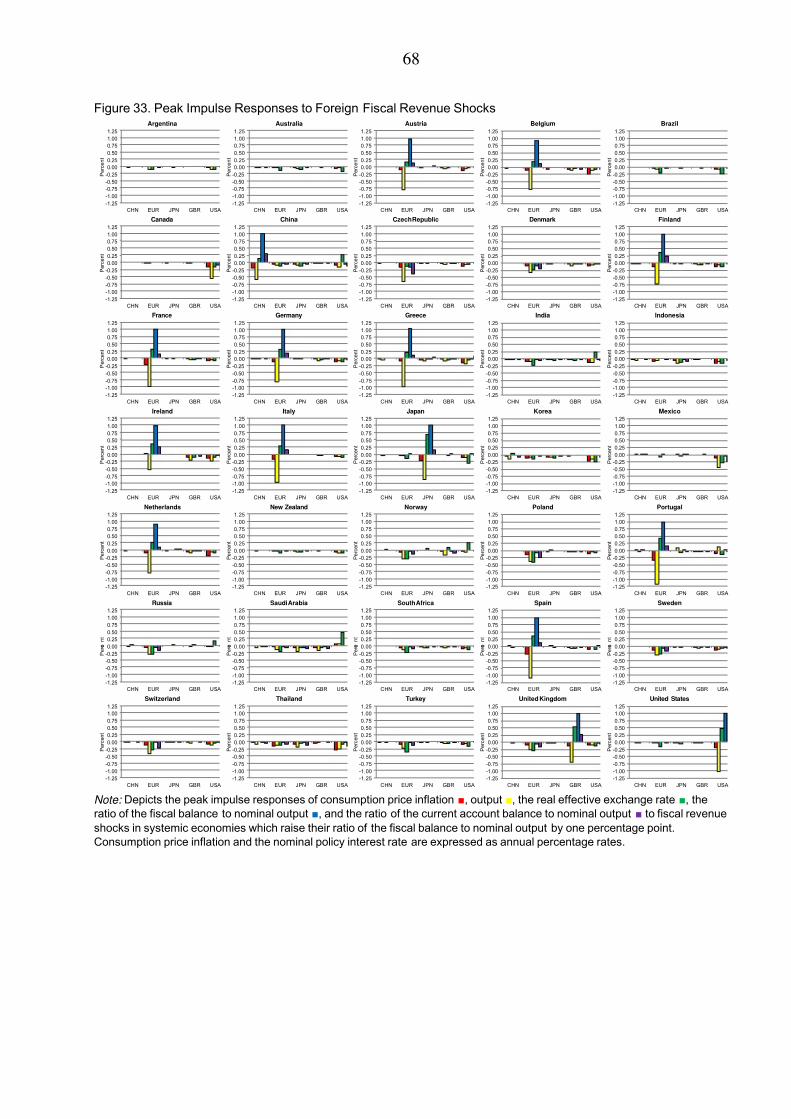
7/30/2019 IMF - Policy Analysis and Forecasting in the World Economy: A Panel Unobserved Components Approach
http://slidepdf.com/reader/full/imf-policy-analysis-and-forecasting-in-the-world-economy-a-panel-unobserved 69/77
68
Figure 33. Peak Impulse Responses to Foreign Fiscal Revenue Shocks
Note: Depicts the peak impulse responses of consumption price inflation ■, output ■, the real effective exchange rate ■, the
ratio of the fiscal balance to nominal output ■, and the ratio of the current account balance to nominal output ■ to fiscal revenue
shocks in systemic economies which raise their ratio of the fiscal balance to nominal output by one percentage point.
Consumption price inflation and the nominal policy interest rate are expressed as annual percentage rates.
-1.25
-1.00
-0.75
-0.50
-0.25
0.00
0.25
0.50
0.75
1.00
1.25
CHN EUR JPN GBR USA
P e r c e n t
Argentina
-1.25
-1.00
-0.75
-0.50
-0.25
0.00
0.25
0.50
0.75
1.00
1.25
CHN EUR JPN GBR USA
P e r c e n t
Australia
-1.25
-1.00
-0.75
-0.50
-0.25
0.00
0.25
0.50
0.75
1.00
1.25
CHN EUR JPN GBR USA
P e r c e n t
Austria
-1.25
-1.00
-0.75
-0.50
-0.25
0.00
0.25
0.50
0.75
1.00
1.25
CHN EUR JPN GBR USA
P e r c e n t
Belgium
-1.25
-1.00
-0.75
-0.50
-0.25
0.00
0.25
0.50
0.75
1.00
1.25
CHN EUR JPN GBR USA
P e r c e n t
Brazil
-1.25
-1.00
-0.75
-0.50
-0.25
0.00
0.25
0.50
0.75
1.00
1.25
CHN EUR JPN GBR USA
P e r c e n t
Canada
-1.25
-1.00
-0.75
-0.50
-0.25
0.00
0.25
0.50
0.75
1.00
1.25
CHN EUR JPN GBR USA
P e r c e n t
China
-1.25
-1.00
-0.75
-0.50
-0.25
0.00
0.25
0.50
0.75
1.00
1.25
CHN EUR JPN GBR USA
P e r c e n t
Czech Republic
-1.25
-1.00
-0.75
-0.50
-0.25
0.00
0.25
0.50
0.75
1.00
1.25
CHN EUR JPN GBR USA
P e r c e n t
Denmark
-1.25
-1.00
-0.75
-0.50
-0.25
0.00
0.25
0.50
0.75
1.00
1.25
CHN EUR JPN GBR USA
P e r c e n t
Finland
-1.25
-1.00
-0.75
-0.50
-0.25
0.00
0.25
0.50
0.75
1.00
1.25
CHN EUR JPN GBR USA
P e r c e n t
France
-1.25
-1.00
-0.75
-0.50
-0.25
0.00
0.25
0.50
0.75
1.00
1.25
CHN EUR JPN GBR USA
P e r c e n t
Germany
-1.25
-1.00
-0.75
-0.50
-0.25
0.00
0.25
0.50
0.75
1.00
1.25
CHN EUR JPN GBR USA
P e r c e n t
Greece
-1.25
-1.00
-0.75
-0.50
-0.25
0.00
0.25
0.50
0.75
1.00
1.25
CHN EUR JPN GBR USA
P e r c e n t
India
-1.25
-1.00
-0.75
-0.50
-0.25
0.00
0.25
0.50
0.75
1.00
1.25
CHN EUR JPN GBR USA
P e r c e n t
Indonesia
-1.25
-1.00
-0.75
-0.50
-0.25
0.00
0.25
0.50
0.75
1.00
1.25
CHN EUR JPN GBR USA
P e r c e n t
Ireland
-1.25
-1.00
-0.75
-0.50
-0.25
0.00
0.25
0.50
0.75
1.00
1.25
CHN EUR JPN GBR USA
P e r c e n t
Italy
-1.25
-1.00
-0.75
-0.50
-0.25
0.00
0.25
0.50
0.75
1.00
1.25
CHN EUR JPN GBR USA
P e r c e n t
Japan
-1.25
-1.00
-0.75
-0.50
-0.25
0.00
0.25
0.50
0.75
1.00
1.25
CHN EUR JPN GBR USA
P e r c e n t
Korea
-1.25
-1.00
-0.75
-0.50
-0.25
0.00
0.25
0.50
0.75
1.00
1.25
CHN EUR JPN GBR USA
P e r c e n t
Mexico
-1.25
-1.00
-0.75
-0.50
-0.25
0.00
0.25
0.50
0.75
1.00
1.25
CHN EUR JPN GBR USA
P e r c e n t
Netherlands
-1.25
-1.00
-0.75
-0.50
-0.25
0.00
0.25
0.50
0.75
1.00
1.25
CHN EUR JPN GBR USA
P e r c e n t
New Zealand
-1.25
-1.00
-0.75
-0.50
-0.25
0.00
0.25
0.50
0.75
1.00
1.25
CHN EUR JPN GBR USA
P e r c e n t
Norway
-1.25
-1.00
-0.75
-0.50
-0.25
0.00
0.25
0.50
0.75
1.00
1.25
CHN EUR JPN GBR USA
P e r c e n t
Poland
-1.25
-1.00
-0.75
-0.50
-0.25
0.00
0.25
0.50
0.75
1.00
1.25
CHN EUR JPN GBR USA
P e r c e n t
Portugal
-1.25
-1.00
-0.75
-0.50
-0.25
0.00
0.25
0.50
0.75
1.00
1.25
CHN EUR JPN GBR USA
P e r c e
n t
Russia
-1.25
-1.00
-0.75
-0.50
-0.25
0.00
0.25
0.50
0.75
1.00
1.25
CHN EUR JPN GBR USA
P e r c e
n t
Saudi Arabia
-1.25
-1.00
-0.75
-0.50
-0.25
0.00
0.25
0.50
0.75
1.00
1.25
CHN EUR JPN GBR USA
P e r c e
n t
South Africa
-1.25
-1.00
-0.75
-0.50
-0.25
0.00
0.25
0.50
0.75
1.00
1.25
CHN EUR JPN GBR USA
P e r c e
n t
Spain
-1.25
-1.00
-0.75
-0.50
-0.25
0.00
0.25
0.50
0.75
1.00
1.25
CHN EUR JPN GBR USA
P e r c e
n t
Sweden
-1.25
-1.00
-0.75
-0.50
-0.25
0.00
0.25
0.50
0.75
1.00
1.25
CHN EUR JPN GBR USA
P e r c e n t
Switzerland
-1.25
-1.00
-0.75
-0.50
-0.25
0.00
0.25
0.50
0.75
1.00
1.25
CHN EUR JPN GBR USA
P e r c e n t
Thailand
-1.25
-1.00
-0.75
-0.50
-0.25
0.00
0.25
0.50
0.75
1.00
1.25
CHN EUR JPN GBR USA
P e r c e n t
Turkey
-1.25
-1.00
-0.75
-0.50
-0.25
0.00
0.25
0.50
0.75
1.00
1.25
CHN EUR JPN GBR USA
P e r c e n t
United Kingdom
-1.25
-1.00
-0.75
-0.50
-0.25
0.00
0.25
0.50
0.75
1.00
1.25
CHN EUR JPN GBR USA
P e r c e n t
United States
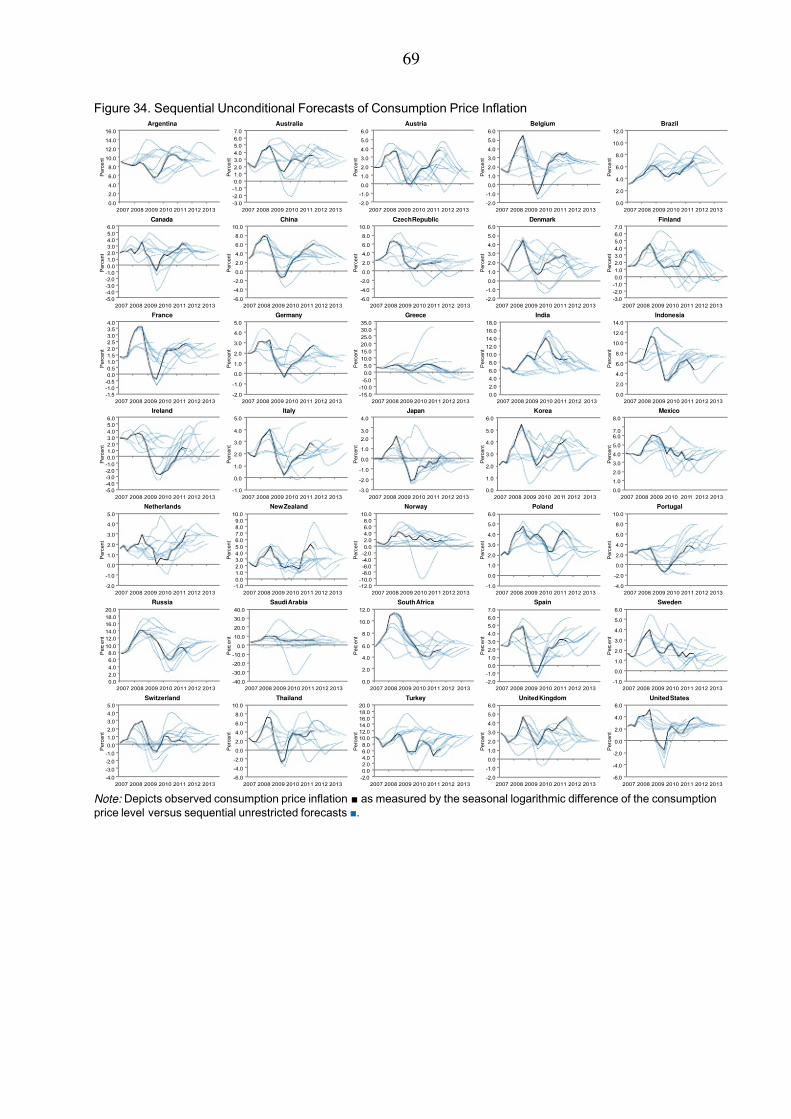
7/30/2019 IMF - Policy Analysis and Forecasting in the World Economy: A Panel Unobserved Components Approach
http://slidepdf.com/reader/full/imf-policy-analysis-and-forecasting-in-the-world-economy-a-panel-unobserved 70/77
69
Figure 34. Sequential Unconditional Forecasts of Consumption Price Inflation
Note: Depicts observed consumption price inflation ■ as measured by the seasonal logarithmic difference of the consumption
price level versus sequential unrestricted forecasts ■.
0.0
2.0
4.0
6.0
8.0
10.0
12.0
14.0
16.0
2007 2008 2009 2010 2011 2012 2013
P e r c e n t
Argentina
-3.0
-2.0
-1.0
0.0
1.0
2.0
3.0
4.0
5.0
6.0
7.0
2007 2008 2009 2010 2011 2012 2013
P e r c e n t
Australia
-2.0
-1.0
0.0
1.0
2.0
3.0
4.0
5.0
6.0
2007 2008 2009 2010 2011 2012 2013
P e r c e n t
Austria
-2.0
-1.0
0.0
1.0
2.0
3.0
4.0
5.0
6.0
2007 2008 2009 2010 2011 2012 2013
P e r c e n t
Belgium
0.0
2.0
4.0
6.0
8.0
10.0
12.0
2007 2008 2009 2010 2011 2012 2013
P e r c e n t
Brazil
-5.0
-4.0
-3.0
-2.0
-1.0
0.0
1.0
2.0
3.0
4.0
5.0
6.0
2007 2008 2009 2010 2011 2012 2013
P e r c e n t
Canada
-6.0
-4.0
-2.0
0.0
2.0
4.0
6.0
8.0
10.0
2007 2008 2009 2010 2011 2012 2013
P e r c e n t
China
-6.0
-4.0
-2.0
0.0
2.0
4.0
6.0
8.0
10.0
2007 2008 2009 2010 2011 2012 2013
P e r c e n t
Czech Republic
-2.0
-1.0
0.0
1.0
2.0
3.0
4.0
5.0
6.0
2007 2008 2009 2010 2011 2012 2013
P e r c e n t
Denmark
-3.0
-2.0
-1.0
0.0
1.0
2.0
3.0
4.0
5.0
6.0
7.0
2007 2008 2009 2010 2011 2012 2013
P e r c e n t
Finland
-1.5
-1.0
-0.5
0.0
0.5
1.0
1.5
2.0
2.5
3.0
3.5
4.0
2007 2008 2009 2010 2011 2012 2013
P e r c e n t
France
-2.0
-1.0
0.0
1.0
2.0
3.0
4.0
5.0
2007 2008 2009 2010 2011 2012 2013
P e r c e n t
Germany
-15.0
-10.0
-5.0
0.0
5.0
10.0
15.0
20.0
25.0
30.0
35.0
2007 2008 2009 2010 2011 2012 2013
P e r c e n t
Greece
0.0
2.0
4.0
6.0
8.0
10.0
12.0
14.0
16.0
18.0
2007 2008 2009 2010 2011 2012 2013
P e r c e n t
India
0.0
2.0
4.0
6.0
8.0
10.0
12.0
14.0
2007 2008 2009 2010 2011 2012 2013
P e r c e n t
Indonesia
-5.0
-4.0
-3.0
-2.0
-1.0
0.0
1.0
2.0
3.0
4.0
5.0
6.0
2007 2008 2009 2010 2011 2012 2013
P e r c e n t
Ireland
-1.0
0.0
1.0
2.0
3.0
4.0
5.0
2007 2008 2009 2010 2011 2012 2013
P e r c e n t
Italy
-3.0
-2.0
-1.0
0.0
1.0
2.0
3.0
4.0
2007 2008 2009 2010 2011 2012 2013
P e r c e n t
Japan
0.0
1.0
2.0
3.0
4.0
5.0
6.0
2007 2008 2009 2010 2011 2012 2013
P e r c e n t
Korea
0.0
1.0
2.0
3.0
4.0
5.0
6.0
7.0
8.0
2007 2008 2009 2010 2011 2012 2013
P e r c e n t
Mexico
-2.0
-1.0
0.0
1.0
2.0
3.0
4.0
5.0
2007 2008 2009 2010 2011 2012 2013
P e r c e n t
Netherlands
-1.0
0.0
1.0
2.0
3.0
4.0
5.0
6.0
7.0
8.0
9.0
10.0
2007 2008 2009 2010 2011 2012 2013
P e r c e n t
New Zealand
-12.0
-10.0
-8.0
-6.0
-4.0
-2.0
0.0
2.0
4.0
6.0
8.0
10.0
2007 2008 2009 2010 2011 2012 2013
P e r c e n t
Norway
-1.0
0.0
1.0
2.0
3.0
4.0
5.0
6.0
2007 2008 2009 2010 2011 2012 2013
P e r c e n t
Poland
-4.0
-2.0
0.0
2.0
4.0
6.0
8.0
10.0
2007 2008 2009 2010 2011 2012 2013
P e r c e n t
Portugal
0.0
2.0
4.0
6.0
8.0
10.0
12.0
14.0
16.0
18.0
20.0
2007 2008 2009 2010 2011 2012 2013
P e r c e n t
Russia
-40.0
-30.0
-20.0
-10.0
0.0
10.0
20.0
30.0
40.0
2007 2008 2009 2010 2011 2012 2013
P e r c e n t
Saudi Arabia
0.0
2.0
4.0
6.0
8.0
10.0
12.0
2007 2008 2009 2010 2011 2012 2013
P e r c e n t
South Africa
-2.0
-1.0
0.0
1.0
2.0
3.0
4.0
5.0
6.0
7.0
2007 2008 2009 2010 2011 2012 2013
P e r c e n t
Spain
-1.0
0.0
1.0
2.0
3.0
4.0
5.0
6.0
2007 2008 2009 2010 2011 2012 2013
P e r c e n t
Sweden
-4.0
-3.0
-2.0
-1.0
0.0
1.0
2.0
3.0
4.0
5.0
2007 2008 2009 2010 2011 2012 2013
P e r c e n t
Switzerland
-6.0
-4.0
-2.0
0.0
2.0
4.0
6.0
8.0
10.0
2007 2008 2009 2010 2011 2012 2013
P e r c e n t
Thailand
-2.0
0.0
2.0
4.0
6.0
8.0
10.0
12.0
14.0
16.0
18.0
20.0
2007 2008 2009 2010 2011 2012 2013
P e r c e n t
Turkey
-2.0
-1.0
0.0
1.0
2.0
3.0
4.0
5.0
6.0
2007 2008 2009 2010 2011 2012 2013
P e r c e n t
United Kingdom
-6.0
-4.0
-2.0
0.0
2.0
4.0
6.0
2007 2008 2009 2010 2011 2012 2013
P e r c e n t
United States
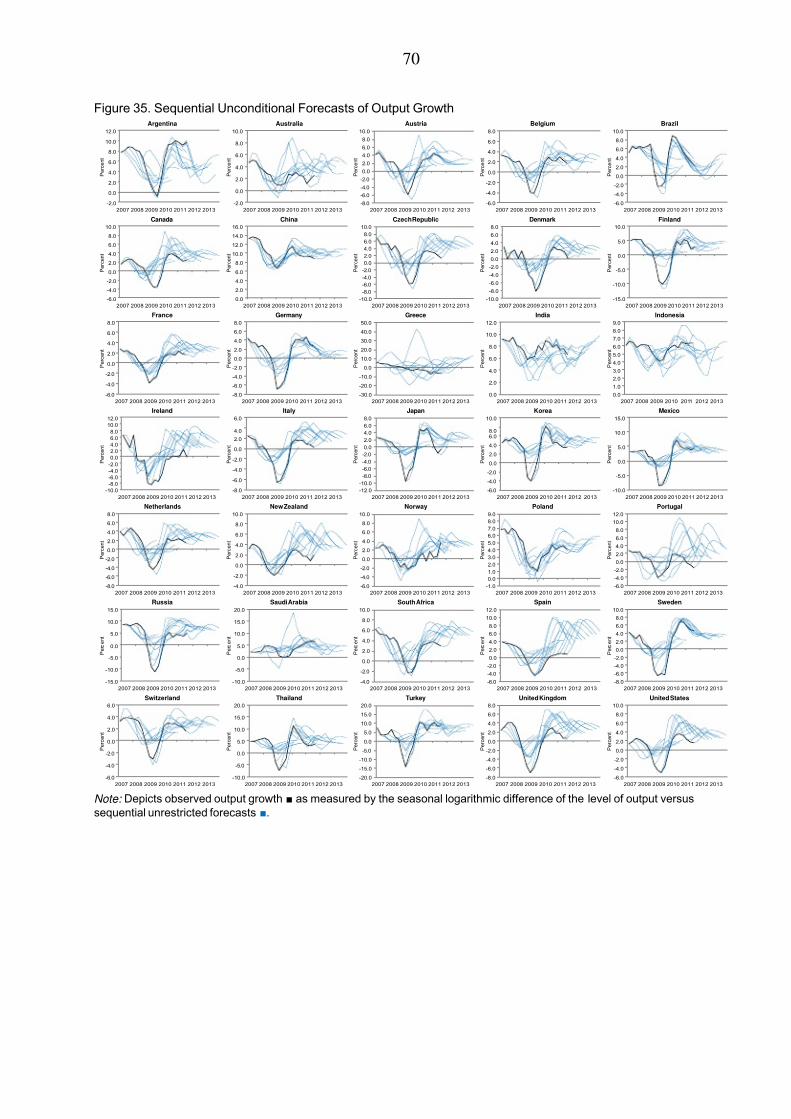
7/30/2019 IMF - Policy Analysis and Forecasting in the World Economy: A Panel Unobserved Components Approach
http://slidepdf.com/reader/full/imf-policy-analysis-and-forecasting-in-the-world-economy-a-panel-unobserved 71/77
70
Figure 35. Sequential Unconditional Forecasts of Output Growth
Note: Depicts observed output growth ■ as measured by the seasonal logarithmic difference of the level of output versus
sequential unrestricted forecasts ■.
-2.0
0.0
2.0
4.0
6.0
8.0
10.0
12.0
2007 2008 2009 2010 2011 2012 2013
P e r c e n t
Argentina
-2.0
0.0
2.0
4.0
6.0
8.0
10.0
2007 2008 2009 2010 2011 2012 2013
P e r c e n t
Australia
-8.0
-6.0
-4.0
-2.0
0.0
2.0
4.0
6.0
8.0
10.0
2007 2008 2009 2010 2011 2012 2013
P e r c e n t
Austria
-6.0
-4.0
-2.0
0.0
2.0
4.0
6.0
8.0
2007 2008 2009 2010 2011 2012 2013
P e r c e n t
Belgium
-6.0
-4.0
-2.0
0.0
2.0
4.0
6.0
8.0
10.0
2007 2008 2009 2010 2011 2012 2013
P e r c e n t
Brazil
-6.0
-4.0
-2.0
0.0
2.0
4.0
6.0
8.0
10.0
2007 2008 2009 2010 2011 2012 2013
P e r c e n t
Canada
0.0
2.0
4.0
6.0
8.0
10.0
12.0
14.0
16.0
2007 2008 2009 2010 2011 2012 2013
P e r c e n t
China
-10.0
-8.0
-6.0
-4.0
-2.0
0.0
2.0
4.0
6.0
8.0
10.0
2007 2008 2009 2010 2011 2012 2013
P e r c e n t
Czech Republic
-10.0
-8.0
-6.0
-4.0
-2.0
0.0
2.0
4.0
6.0
8.0
2007 2008 2009 2010 2011 2012 2013
P e r c e n t
Denmark
-15.0
-10.0
-5.0
0.0
5.0
10.0
2007 2008 2009 2010 2011 2012 2013
P e r c e n t
Finland
-6.0
-4.0
-2.0
0.0
2.0
4.0
6.0
8.0
2007 2008 2009 2010 2011 2012 2013
P e r c e n t
France
-8.0
-6.0
-4.0
-2.0
0.0
2.0
4.0
6.0
8.0
2007 2008 2009 2010 2011 2012 2013
P e r c e n t
Germany
-30.0
-20.0
-10.0
0.0
10.0
20.0
30.0
40.0
50.0
2007 2008 2009 2010 2011 2012 2013
P e r c e n t
Greece
0.0
2.0
4.0
6.0
8.0
10.0
12.0
2007 2008 2009 2010 2011 2012 2013
P e r c e n t
India
0.0
1.0
2.0
3.0
4.0
5.0
6.0
7.0
8.0
9.0
2007 2008 2009 2010 2011 2012 2013
P e r c e n t
Indonesia
-10.0
-8.0
-6.0
-4.0
-2.0
0.0
2.0
4.0
6.0
8.0
10.0
12.0
2007 2008 2009 2010 2011 2012 2013
P e r c e n t
Ireland
-8.0
-6.0
-4.0
-2.0
0.0
2.0
4.0
6.0
2007 2008 2009 2010 2011 2012 2013
P e r c e n t
Italy
-12.0
-10.0
-8.0
-6.0
-4.0
-2.0
0.0
2.0
4.0
6.0
8.0
2007 2008 2009 2010 2011 2012 2013
P e r c e n t
Japan
-6.0
-4.0
-2.0
0.0
2.0
4.0
6.0
8.0
10.0
2007 2008 2009 2010 2011 2012 2013
P e r c e n t
Korea
-10.0
-5.0
0.0
5.0
10.0
15.0
2007 2008 2009 2010 2011 2012 2013
P e r c e n t
Mexico
-8.0
-6.0
-4.0
-2.0
0.0
2.0
4.0
6.0
8.0
2007 2008 2009 2010 2011 2012 2013
P e r c e n t
Netherlands
-4.0
-2.0
0.0
2.0
4.0
6.0
8.0
10.0
2007 2008 2009 2010 2011 2012 2013
P e r c e n t
New Zealand
-6.0
-4.0
-2.0
0.0
2.0
4.0
6.0
8.0
10.0
2007 2008 2009 2010 2011 2012 2013
P e r c e n t
Norway
-1.0
0.0
1.0
2.0
3.0
4.0
5.0
6.0
7.0
8.0
9.0
2007 2008 2009 2010 2011 2012 2013
P e r c e n t
Poland
-6.0
-4.0
-2.0
0.0
2.0
4.0
6.0
8.0
10.0
12.0
2007 2008 2009 2010 2011 2012 2013
P e r c e n t
Portugal
-15.0
-10.0
-5.0
0.0
5.0
10.0
15.0
2007 2008 2009 2010 2011 2012 2013
P e r c e n t
Russia
-10.0
-5.0
0.0
5.0
10.0
15.0
20.0
2007 2008 2009 2010 2011 2012 2013
P e r c e n t
Saudi Arabia
-4.0
-2.0
0.0
2.0
4.0
6.0
8.0
10.0
2007 2008 2009 2010 2011 2012 2013
P e r c e n t
South Africa
-6.0
-4.0
-2.0
0.0
2.0
4.0
6.0
8.0
10.0
12.0
2007 2008 2009 2010 2011 2012 2013
P e r c e n t
Spain
-8.0
-6.0
-4.0
-2.0
0.0
2.0
4.0
6.0
8.0
10.0
2007 2008 2009 2010 2011 2012 2013
P e r c e n t
Sweden
-6.0
-4.0
-2.0
0.0
2.0
4.0
6.0
2007 2008 2009 2010 2011 2012 2013
P e r c e n t
Switzerland
-10.0
-5.0
0.0
5.0
10.0
15.0
20.0
2007 2008 2009 2010 2011 2012 2013
P e r c e n t
Thailand
-20.0
-15.0
-10.0
-5.0
0.0
5.0
10.0
15.0
20.0
2007 2008 2009 2010 2011 2012 2013
P e r c e n t
Turkey
-8.0
-6.0
-4.0
-2.0
0.0
2.0
4.0
6.0
8.0
2007 2008 2009 2010 2011 2012 2013
P e r c e n t
United Kingdom
-6.0
-4.0
-2.0
0.0
2.0
4.0
6.0
8.0
10.0
2007 2008 2009 2010 2011 2012 2013
P e r c e n t
United States

7/30/2019 IMF - Policy Analysis and Forecasting in the World Economy: A Panel Unobserved Components Approach
http://slidepdf.com/reader/full/imf-policy-analysis-and-forecasting-in-the-world-economy-a-panel-unobserved 72/77
71
Figure 36. Conditional Forecasts of Consumption Price Inflation
Note: Depicts observed consumption price inflation ■ as measured by the seasonal logarithmic difference of the consumption
price level together with unrestricted forecasts ■, restricted forecasts ■, judgmental forecasts ■, and combined forecasts ■.
Symmetric 90 percent confidence intervals represented by dashed lines assume normally distributed innovations and known
parameters.
0.0
2.0
4.0
6.0
8.0
10.0
12.0
14.0
16.0
18.0
20.0
2007 2008 2009 2010 2011 2012 2013
P e r c e n t
Argentina
-2.0
0.0
2.0
4.0
6.0
8.0
10.0
12.0
2007 2008 2009 2010 2011 2012 2013
P e r c e n t
Australia
-6.0
-4.0
-2.0
0.0
2.0
4.0
6.0
8.0
2007 2008 2009 2010 2011 2012 2013
P e r c e n t
Austria
-6.0
-4.0
-2.0
0.0
2.0
4.0
6.0
8.0
2007 2008 2009 2010 2011 2012 2013
P e r c e n t
Belgium
0.0
2.0
4.0
6.0
8.0
10.0
12.0
14.0
2007 2008 2009 2010 2011 2012 2013
P e r c e n t
Brazil
-4.0
-2.0
0.0
2.0
4.0
6.0
8.0
2007 2008 2009 2010 2011 2012 2013
P e r c e n t
Canada
-4.0
-2.0
0.0
2.0
4.0
6.0
8.0
10.0
12.0
2007 2008 2009 2010 2011 2012 2013
P e r c e n t
China
-8.0
-6.0
-4.0
-2.0
0.0
2.0
4.0
6.0
8.0
2007 2008 2009 2010 2011 2012 2013
P e r c e n t
Czech Republic
-8.0
-6.0
-4.0
-2.0
0.0
2.0
4.0
6.0
8.0
2007 2008 2009 2010 2011 2012 2013
P e r c e n t
Denmark
-6.0
-4.0
-2.0
0.0
2.0
4.0
6.0
2007 2008 2009 2010 2011 2012 2013
P e r c e n t
Finland
-4.0
-2.0
0.0
2.0
4.0
6.0
8.0
2007 2008 2009 2010 2011 2012 2013
P e r c e n t
France
-6.0
-4.0
-2.0
0.0
2.0
4.0
6.0
2007 2008 2009 2010 2011 2012 2013
P e r c e n t
Germany
-14.0
-12.0
-10.0
-8.0
-6.0
-4.0
-2.0
0.0
2.0
4.0
6.0
8.0
2007 2008 2009 2010 2011 2012 2013
P e r c e n t
Greece
0.0
2.0
4.0
6.0
8.0
10.0
12.0
14.0
16.0
2007 2008 2009 2010 2011 2012 2013
P e r c e n t
India
0.0
2.0
4.0
6.0
8.0
10.0
12.0
14.0
16.0
2007 2008 2009 2010 2011 2012 2013
P e r c e n t
Indonesia
-6.0
-4.0
-2.0
0.0
2.0
4.0
6.0
8.0
2007 2008 2009 2010 2011 2012 2013
P e r c e n t
Ireland
-6.0
-4.0
-2.0
0.0
2.0
4.0
6.0
8.0
2007 2008 2009 2010 2011 2012 2013
P e r c e n t
Italy
-6.0
-4.0
-2.0
0.0
2.0
4.0
6.0
8.0
2007 2008 2009 2010 2011 2012 2013
P e r c e n t
Japan
-4.0
-2.0
0.0
2.0
4.0
6.0
8.0
10.0
2007 2008 2009 2010 2011 2012 2013
P e r c e n t
Korea
-2.0
0.0
2.0
4.0
6.0
8.0
10.0
2007 2008 2009 2010 2011 2012 2013
P e r c e n t
Mexico
-6.0
-4.0
-2.0
0.0
2.0
4.0
6.0
8.0
2007 2008 2009 2010 2011 2012 2013
P e r c e n t
Netherlands
-2.0
0.0
2.0
4.0
6.0
8.0
10.0
2007 2008 2009 2010 2011 2012 2013
P e r c e n t
New Zealand
-4.0
-2.0
0.0
2.0
4.0
6.0
8.0
2007 2008 2009 2010 2011 2012 2013
P e r c e n t
Norway
-6.0
-4.0
-2.0
0.0
2.0
4.0
6.0
8.0
2007 2008 2009 2010 2011 2012 2013
P e r c e n t
Poland
-4.0
-2.0
0.0
2.0
4.0
6.0
8.0
10.0
2007 2008 2009 2010 2011 2012 2013
P e r c e n t
Portugal
0.0
2.0
4.0
6.0
8.0
10.0
12.0
14.0
16.0
18.0
2007 2008 2009 2010 2011 2012 2013
P e r c e n t
Russia
-4.0
-2.0
0.0
2.0
4.0
6.0
8.0
10.0
12.0
14.0
2007 2008 2009 2010 2011 2012 2013
P e r c e n t
Saudi Arabia
0.0
2.0
4.0
6.0
8.0
10.0
12.0
14.0
2007 2008 2009 2010 2011 2012 2013
P e r c e n t
South Africa
-4.0
-2.0
0.0
2.0
4.0
6.0
8.0
10.0
2007 2008 2009 2010 2011 2012 2013
P e r c e n t
Spain
-6.0
-4.0
-2.0
0.0
2.0
4.0
6.0
2007 2008 2009 2010 2011 2012 2013
P e r c e n t
Sweden
-2.0
0.0
2.0
4.0
6.0
8.0
10.0
2007 2008 2009 2010 2011 2012 2013
P e r c e n t
Switzerland
-4.0
-2.0
0.0
2.0
4.0
6.0
8.0
10.0
12.0
2007 2008 2009 2010 2011 2012 2013
P e r c e n t
Thailand
0.0
2.0
4.0
6.0
8.0
10.0
12.0
14.0
16.0
2007 2008 2009 2010 2011 2012 2013
P e r c e n t
Turkey
-4.0
-2.0
0.0
2.0
4.0
6.0
8.0
10.0
2007 2008 2009 2010 2011 2012 2013
P e r c e n t
United Kingdom
-4.0
-2.0
0.0
2.0
4.0
6.0
8.0
10.0
2007 2008 2009 2010 2011 2012 2013
P e r c e n t
United States
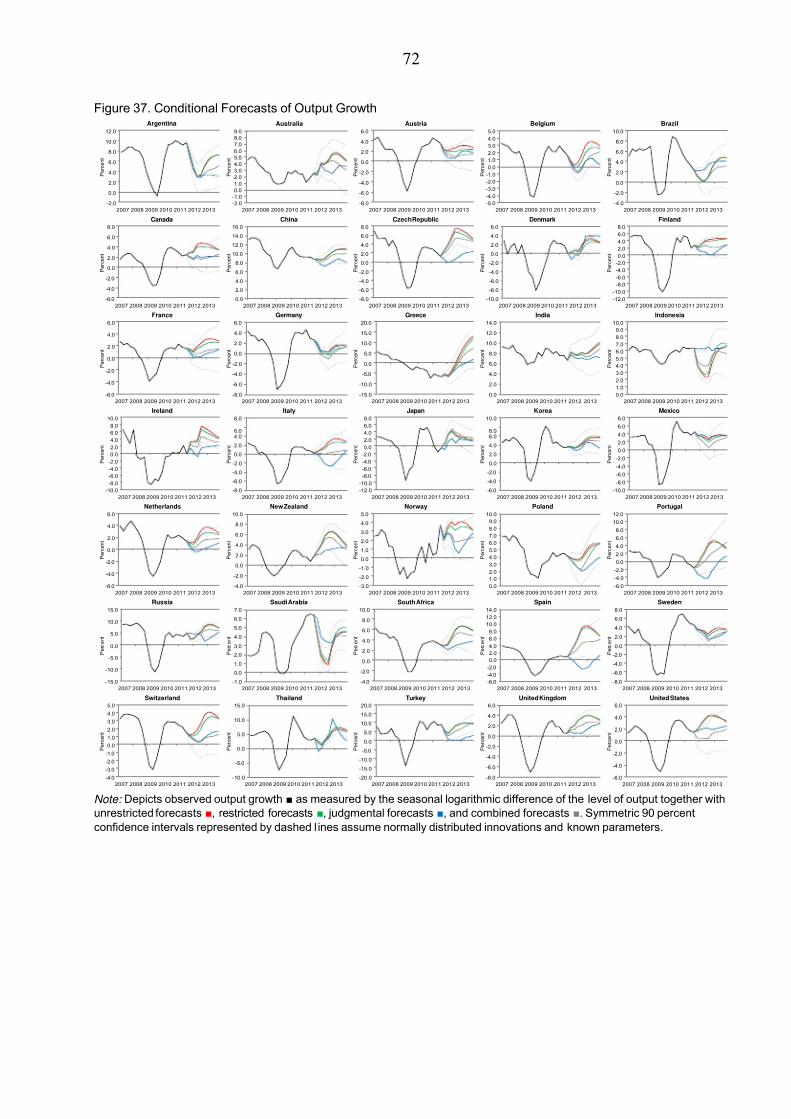
7/30/2019 IMF - Policy Analysis and Forecasting in the World Economy: A Panel Unobserved Components Approach
http://slidepdf.com/reader/full/imf-policy-analysis-and-forecasting-in-the-world-economy-a-panel-unobserved 73/77
72
Figure 37. Conditional Forecasts of Output Growth
Note: Depicts observed output growth ■ as measured by the seasonal logarithmic difference of the level of output together with
unrestricted forecasts ■, restricted forecasts ■, judgmental forecasts ■, and combined forecasts ■. Symmetric 90 percent
confidence intervals represented by dashed l ines assume normally distributed innovations and known parameters.
-2.0
0.0
2.0
4.0
6.0
8.0
10.0
12.0
2007 2008 2009 2010 2011 2012 2013
P e r c e n t
Argentina
-2.0
-1.0
0.0
1.0
2.0
3.0
4.0
5.0
6.0
7.0
8.0
9.0
2007 2008 2009 2010 2011 2012 2013
P e r c e n t
Australia
-8.0
-6.0
-4.0
-2.0
0.0
2.0
4.0
6.0
2007 2008 2009 2010 2011 2012 2013
P e r c e n t
Austria
-5.0
-4.0
-3.0
-2.0
-1.0
0.0
1.0
2.0
3.0
4.0
5.0
2007 2008 2009 2010 2011 2012 2013
P e r c e n t
Belgium
-4.0
-2.0
0.0
2.0
4.0
6.0
8.0
10.0
2007 2008 2009 2010 2011 2012 2013
P e r c e n t
Brazil
-6.0
-4.0
-2.0
0.0
2.0
4.0
6.0
8.0
2007 2008 2009 2010 2011 2012 2013
P e r c e n t
Canada
0.0
2.0
4.0
6.0
8.0
10.0
12.0
14.0
16.0
2007 2008 2009 2010 2011 2012 2013
P e r c e n t
China
-8.0
-6.0
-4.0
-2.0
0.0
2.0
4.0
6.0
8.0
2007 2008 2009 2010 2011 2012 2013
P e r c e n t
Czech Republic
-10.0
-8.0
-6.0
-4.0
-2.0
0.0
2.0
4.0
6.0
2007 2008 2009 2010 2011 2012 2013
P e r c e n t
Denmark
-12.0
-10.0
-8.0
-6.0
-4.0
-2.0
0.0
2.0
4.0
6.0
8.0
2007 2008 2009 2010 2011 2012 2013
P e r c e n t
Finland
-6.0
-4.0
-2.0
0.0
2.0
4.0
6.0
2007 2008 2009 2010 2011 2012 2013
P e r c e n t
France
-8.0
-6.0
-4.0
-2.0
0.0
2.0
4.0
6.0
2007 2008 2009 2010 2011 2012 2013
P e r c e n t
Germany
-15.0
-10.0
-5.0
0.0
5.0
10.0
15.0
20.0
2007 2008 2009 2010 2011 2012 2013
P e r c e n t
Greece
0.0
2.0
4.0
6.0
8.0
10.0
12.0
14.0
2007 2008 2009 2010 2011 2012 2013
P e r c e n t
India
0.0
1.0
2.0
3.0
4.0
5.0
6.0
7.0
8.0
9.0
10.0
2007 2008 2009 2010 2011 2012 2013
P e r c e n t
Indonesia
-10.0
-8.0
-6.0
-4.0
-2.0
0.0
2.0
4.0
6.0
8.0
10.0
2007 2008 2009 2010 2011 2012 2013
P e r c e n t
Ireland
-8.0
-6.0
-4.0
-2.0
0.0
2.0
4.0
6.0
8.0
2007 2008 2009 2010 2011 2012 2013
P e r c e n t
Italy
-12.0
-10.0
-8.0
-6.0
-4.0
-2.0
0.0
2.0
4.0
6.0
8.0
2007 2008 2009 2010 2011 2012 2013
P e r c e n t
Japan
-6.0
-4.0
-2.0
0.0
2.0
4.0
6.0
8.0
10.0
2007 2008 2009 2010 2011 2012 2013
P e r c e n t
Korea
-10.0
-8.0
-6.0
-4.0
-2.0
0.0
2.0
4.0
6.0
8.0
2007 2008 2009 2010 2011 2012 2013
P e r c e n t
Mexico
-6.0
-4.0
-2.0
0.0
2.0
4.0
6.0
2007 2008 2009 2010 2011 2012 2013
P e r c e n t
Netherlands
-4.0
-2.0
0.0
2.0
4.0
6.0
8.0
10.0
2007 2008 2009 2010 2011 2012 2013
P e r c e n t
New Zealand
-3.0
-2.0
-1.0
0.0
1.0
2.0
3.0
4.0
5.0
2007 2008 2009 2010 2011 2012 2013
P e r c e n t
Norway
0.0
1.0
2.0
3.0
4.0
5.0
6.0
7.0
8.0
9.0
10.0
2007 2008 2009 2010 2011 2012 2013
P e r c e n t
Poland
-6.0
-4.0
-2.0
0.0
2.0
4.0
6.0
8.0
10.0
12.0
2007 2008 2009 2010 2011 2012 2013
P e r c e n t
Portugal
-15.0
-10.0
-5.0
0.0
5.0
10.0
15.0
2007 2008 2009 2010 2011 2012 2013
P e r c e n t
Russia
-1.0
0.0
1.0
2.0
3.0
4.0
5.0
6.0
7.0
2007 2008 2009 2010 2011 2012 2013
P e r c e n t
Saudi Arabia
-4.0
-2.0
0.0
2.0
4.0
6.0
8.0
10.0
2007 2008 2009 2010 2011 2012 2013
P e r c e n t
South Africa
-6.0
-4.0
-2.0
0.0
2.0
4.0
6.0
8.0
10.0
12.0
14.0
2007 2008 2009 2010 2011 2012 2013
P e r c e n t
Spain
-8.0
-6.0
-4.0
-2.0
0.0
2.0
4.0
6.0
8.0
2007 2008 2009 2010 2011 2012 2013
P e r c e n t
Sweden
-4.0
-3.0
-2.0
-1.0
0.0
1.0
2.0
3.0
4.0
5.0
2007 2008 2009 2010 2011 2012 2013
P e r c e n t
Switzerland
-10.0
-5.0
0.0
5.0
10.0
15.0
2007 2008 2009 2010 2011 2012 2013
P e r c e n t
Thailand
-20.0
-15.0
-10.0
-5.0
0.0
5.0
10.0
15.0
20.0
2007 2008 2009 2010 2011 2012 2013
P e r c e n t
Turkey
-8.0
-6.0
-4.0
-2.0
0.0
2.0
4.0
6.0
2007 2008 2009 2010 2011 2012 2013
P e r c e n t
United Kingdom
-6.0
-4.0
-2.0
0.0
2.0
4.0
6.0
2007 2008 2009 2010 2011 2012 2013
P e r c e n t
United States
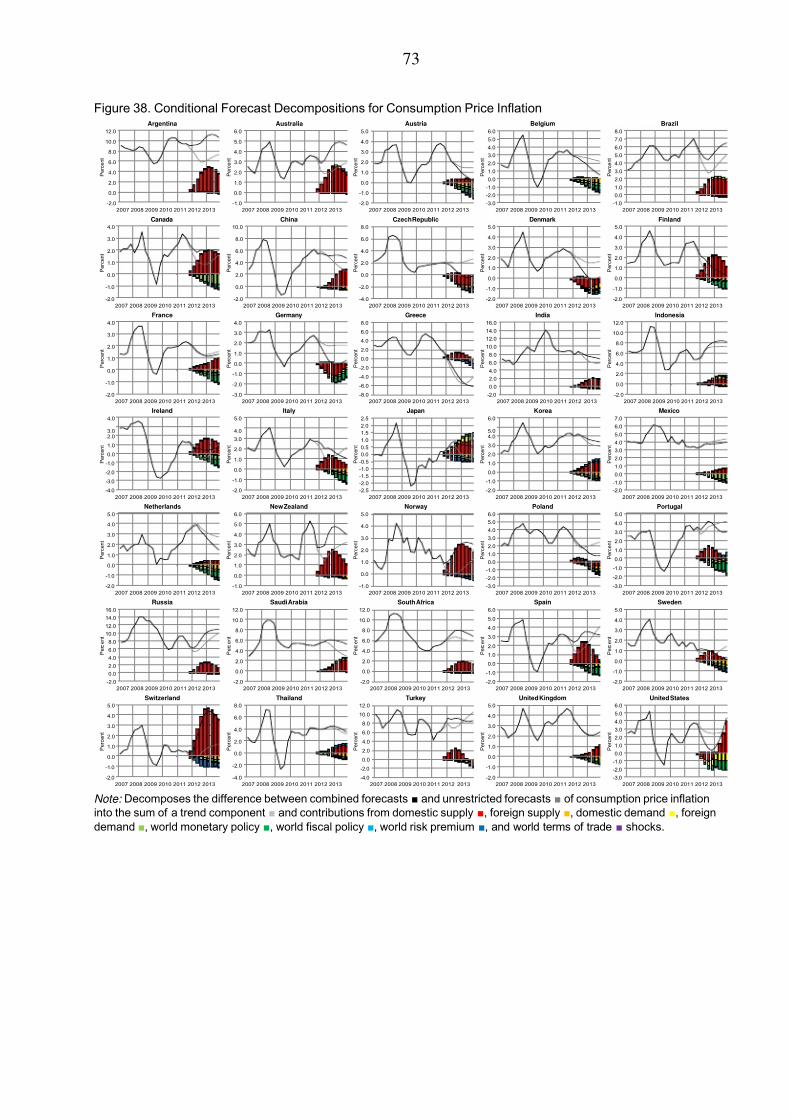
7/30/2019 IMF - Policy Analysis and Forecasting in the World Economy: A Panel Unobserved Components Approach
http://slidepdf.com/reader/full/imf-policy-analysis-and-forecasting-in-the-world-economy-a-panel-unobserved 74/77
73
Figure 38. Conditional Forecast Decompositions for Consumption Price Inflation
Note: Decomposes the difference between combined forecasts ■ and unrestricted forecasts ■ of consumption price inflation
into the sum of a trend component ■ and contributions from domestic supply ■, foreign supply ■, domestic demand ■, foreign
demand ■, world monetary policy ■, world fiscal policy ■, world risk premium ■, and world terms of trade ■ shocks.
-2.0
0.0
2.0
4.0
6.0
8.0
10.0
12.0
2007 2008 2009 2010 2011 2012 2013
P e r c e n t
Argentina
-1.0
0.0
1.0
2.0
3.0
4.0
5.0
6.0
2007 2008 2009 2010 2011 2012 2013
P e r c e n t
Australia
-2.0
-1.0
0.0
1.0
2.0
3.0
4.0
5.0
2007 2008 2009 2010 2011 2012 2013
P e r c e n t
Austria
-3.0
-2.0
-1.0
0.0
1.0
2.0
3.0
4.0
5.0
6.0
2007 2008 2009 2010 2011 2012 2013
P e r c e n t
Belgium
-1.0
0.0
1.0
2.0
3.0
4.0
5.0
6.0
7.0
8.0
2007 2008 2009 2010 2011 2012 2013
P e r c e n t
Brazil
-2.0
-1.0
0.0
1.0
2.0
3.0
4.0
2007 2008 2009 2010 2011 2012 2013
P e r c e n t
Canada
-2.0
0.0
2.0
4.0
6.0
8.0
10.0
2007 2008 2009 2010 2011 2012 2013
P e r c e n t
China
-4.0
-2.0
0.0
2.0
4.0
6.0
8.0
2007 2008 2009 2010 2011 2012 2013
P e r c e n t
Czech Republic
-2.0
-1.0
0.0
1.0
2.0
3.0
4.0
5.0
2007 2008 2009 2010 2011 2012 2013
P e r c e n t
Denmark
-2.0
-1.0
0.0
1.0
2.0
3.0
4.0
5.0
2007 2008 2009 2010 2011 2012 2013
P e r c e n t
Finland
-2.0
-1.0
0.0
1.0
2.0
3.0
4.0
2007 2008 2009 2010 2011 2012 2013
P e r c e n t
France
-3.0
-2.0
-1.0
0.0
1.0
2.0
3.0
4.0
2007 2008 2009 2010 2011 2012 2013
P e r c e n t
Germany
-8.0
-6.0
-4.0
-2.0
0.0
2.0
4.0
6.0
8.0
2007 2008 2009 2010 2011 2012 2013
P e r c e n t
Greece
-2.0
0.0
2.0
4.0
6.0
8.0
10.0
12.0
14.0
16.0
2007 2008 2009 2010 2011 2012 2013
P e r c e n t
India
-2.0
0.0
2.0
4.0
6.0
8.0
10.0
12.0
2007 2008 2009 2010 2011 2012 2013
P e r c e n t
Indonesia
-4.0
-3.0
-2.0
-1.0
0.0
1.0
2.0
3.0
4.0
2007 2008 2009 2010 2011 2012 2013
P e r c e n t
Ireland
-2.0
-1.0
0.0
1.0
2.0
3.0
4.0
5.0
2007 2008 2009 2010 2011 2012 2013
P e r c e n t
Italy
-2.5
-2.0
-1.5
-1.0
-0.5
0.0
0.5
1.0
1.5
2.0
2.5
2007 2008 2009 2010 2011 2012 2013
P e r c e n t
Japan
-2.0
-1.0
0.0
1.0
2.0
3.0
4.0
5.0
6.0
2007 2008 2009 2010 2011 2012 2013
P e r c e n t
Korea
-2.0
-1.0
0.0
1.0
2.0
3.0
4.0
5.0
6.0
7.0
2007 2008 2009 2010 2011 2012 2013
P e r c e n t
Mexico
-2.0
-1.0
0.0
1.0
2.0
3.0
4.0
5.0
2007 2008 2009 2010 2011 2012 2013
P e r c e n t
Netherlands
-1.0
0.0
1.0
2.0
3.0
4.0
5.0
6.0
2007 2008 2009 2010 2011 2012 2013
P e r c e n t
New Zealand
-1.0
0.0
1.0
2.0
3.0
4.0
5.0
2007 2008 2009 2010 2011 2012 2013
P e r c e n t
Norway
-3.0
-2.0
-1.0
0.0
1.0
2.0
3.0
4.0
5.0
6.0
2007 2008 2009 2010 2011 2012 2013
P e r c e n t
Poland
-3.0
-2.0
-1.0
0.0
1.0
2.0
3.0
4.0
5.0
2007 2008 2009 2010 2011 2012 2013
P e r c e n t
Portugal
-2.0
0.0
2.0
4.0
6.0
8.0
10.0
12.0
14.0
16.0
2007 2008 2009 2010 2011 2012 2013
P e r c e n t
Russia
-2.0
0.0
2.0
4.0
6.0
8.0
10.0
12.0
2007 2008 2009 2010 2011 2012 2013
P e r c e n t
Saudi Arabia
-2.0
0.0
2.0
4.0
6.0
8.0
10.0
12.0
2007 2008 2009 2010 2011 2012 2013
P e r c e n t
South Africa
-2.0
-1.0
0.0
1.0
2.0
3.0
4.0
5.0
6.0
2007 2008 2009 2010 2011 2012 2013
P e r c e n t
Spain
-2.0
-1.0
0.0
1.0
2.0
3.0
4.0
5.0
2007 2008 2009 2010 2011 2012 2013
P e r c e n t
Sweden
-2.0
-1.0
0.0
1.0
2.0
3.0
4.0
5.0
2007 2008 2009 2010 2011 2012 2013
P e r c e n t
Switzerland
-4.0
-2.0
0.0
2.0
4.0
6.0
8.0
2007 2008 2009 2010 2011 2012 2013
P e r c e n t
Thailand
-4.0
-2.0
0.0
2.0
4.0
6.0
8.0
10.0
12.0
2007 2008 2009 2010 2011 2012 2013
P e r c e n t
Turkey
-2.0
-1.0
0.0
1.0
2.0
3.0
4.0
5.0
2007 2008 2009 2010 2011 2012 2013
P e r c e n t
United Kingdom
-3.0
-2.0
-1.0
0.0
1.0
2.0
3.0
4.0
5.0
6.0
2007 2008 2009 2010 2011 2012 2013
P e r c e n t
United States
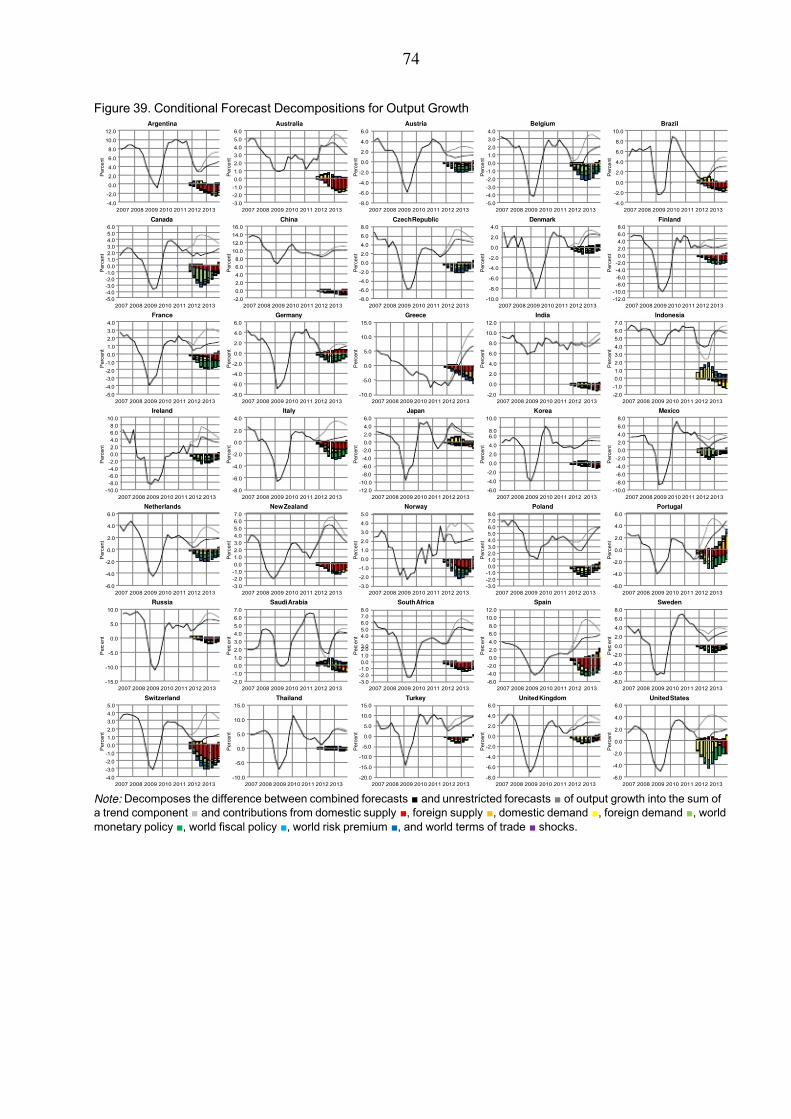
7/30/2019 IMF - Policy Analysis and Forecasting in the World Economy: A Panel Unobserved Components Approach
http://slidepdf.com/reader/full/imf-policy-analysis-and-forecasting-in-the-world-economy-a-panel-unobserved 75/77
74
Figure 39. Conditional Forecast Decompositions for Output Growth
Note: Decomposes the difference between combined forecasts ■ and unrestricted forecasts ■ of output growth into the sum of
a trend component ■ and contributions from domestic supply ■, foreign supply ■, domestic demand ■, foreign demand ■, world
monetary policy ■, world fiscal policy ■, world risk premium ■, and world terms of trade ■ shocks.
-4.0
-2.0
0.0
2.0
4.0
6.0
8.0
10.0
12.0
2007 2008 2009 2010 2011 2012 2013
P e r c e n t
Argentina
-3.0
-2.0
-1.0
0.0
1.0
2.0
3.0
4.0
5.0
6.0
2007 2008 2009 2010 2011 2012 2013
P e r c e n t
Australia
-8.0
-6.0
-4.0
-2.0
0.0
2.0
4.0
6.0
2007 2008 2009 2010 2011 2012 2013
P e r c e n t
Austria
-5.0
-4.0
-3.0
-2.0
-1.0
0.0
1.0
2.0
3.0
4.0
2007 2008 2009 2010 2011 2012 2013
P e r c e n t
Belgium
-4.0
-2.0
0.0
2.0
4.0
6.0
8.0
10.0
2007 2008 2009 2010 2011 2012 2013
P e r c e n t
Brazil
-5.0
-4.0
-3.0
-2.0
-1.0
0.0
1.0
2.0
3.0
4.0
5.0
6.0
2007 2008 2009 2010 2011 2012 2013
P e r c e n t
Canada
-2.0
0.0
2.0
4.0
6.0
8.0
10.0
12.0
14.0
16.0
2007 2008 2009 2010 2011 2012 2013
P e r c e n t
China
-8.0
-6.0
-4.0
-2.0
0.0
2.0
4.0
6.0
8.0
2007 2008 2009 2010 2011 2012 2013
P e r c e n t
Czech Republic
-10.0
-8.0
-6.0
-4.0
-2.0
0.0
2.0
4.0
2007 2008 2009 2010 2011 2012 2013
P e r c e n t
Denmark
-12.0
-10.0
-8.0
-6.0
-4.0
-2.0
0.0
2.0
4.0
6.0
8.0
2007 2008 2009 2010 2011 2012 2013
P e r c e n t
Finland
-5.0
-4.0
-3.0
-2.0
-1.0
0.0
1.0
2.0
3.0
4.0
2007 2008 2009 2010 2011 2012 2013
P e r c e n t
France
-8.0
-6.0
-4.0
-2.0
0.0
2.0
4.0
6.0
2007 2008 2009 2010 2011 2012 2013
P e r c e n t
Germany
-10.0
-5.0
0.0
5.0
10.0
15.0
2007 2008 2009 2010 2011 2012 2013
P e r c e n t
Greece
-2.0
0.0
2.0
4.0
6.0
8.0
10.0
12.0
2007 2008 2009 2010 2011 2012 2013
P e r c e n t
India
-2.0
-1.0
0.0
1.0
2.0
3.0
4.0
5.0
6.0
7.0
2007 2008 2009 2010 2011 2012 2013
P e r c e n t
Indonesia
-10.0
-8.0
-6.0
-4.0
-2.0
0.0
2.0
4.0
6.0
8.0
10.0
2007 2008 2009 2010 2011 2012 2013
P e r c e n t
Ireland
-8.0
-6.0
-4.0
-2.0
0.0
2.0
4.0
2007 2008 2009 2010 2011 2012 2013
P e r c e n t
Italy
-12.0
-10.0
-8.0
-6.0
-4.0
-2.0
0.0
2.0
4.0
6.0
2007 2008 2009 2010 2011 2012 2013
P e r c e n t
Japan
-6.0
-4.0
-2.0
0.0
2.0
4.0
6.0
8.0
10.0
2007 2008 2009 2010 2011 2012 2013
P e r c e n t
Korea
-10.0
-8.0
-6.0
-4.0
-2.0
0.0
2.0
4.0
6.0
8.0
2007 2008 2009 2010 2011 2012 2013
P e r c e n t
Mexico
-6.0
-4.0
-2.0
0.0
2.0
4.0
6.0
2007 2008 2009 2010 2011 2012 2013
P e r c e n t
Netherlands
-3.0
-2.0
-1.0
0.0
1.0
2.0
3.0
4.0
5.0
6.0
7.0
2007 2008 2009 2010 2011 2012 2013
P e r c e n t
New Zealand
-3.0
-2.0
-1.0
0.0
1.0
2.0
3.0
4.0
5.0
2007 2008 2009 2010 2011 2012 2013
P e r c e n t
Norway
-3.0
-2.0
-1.0
0.0
1.0
2.0
3.0
4.0
5.0
6.0
7.0
8.0
2007 2008 2009 2010 2011 2012 2013
P e r c e n t
Poland
-6.0
-4.0
-2.0
0.0
2.0
4.0
6.0
2007 2008 2009 2010 2011 2012 2013
P e r c e n t
Portugal
-15.0
-10.0
-5.0
0.0
5.0
10.0
2007 2008 2009 2010 2011 2012 2013
P e r c e n t
Russia
-2.0
-1.0
0.0
1.0
2.0
3.0
4.0
5.0
6.0
7.0
2007 2008 2009 2010 2011 2012 2013
P e r c e n t
Saudi Arabia
-3.0
-2.0
-1.0
0.0
1.0
2.03.0
4.0
5.0
6.0
7.0
8.0
2007 2008 2009 2010 2011 2012 2013
P e r c e n t
South Africa
-6.0
-4.0
-2.0
0.0
2.0
4.0
6.0
8.0
10.0
12.0
2007 2008 2009 2010 2011 2012 2013
P e r c e n t
Spain
-8.0
-6.0
-4.0
-2.0
0.0
2.0
4.0
6.0
8.0
2007 2008 2009 2010 2011 2012 2013
P e r c e n t
Sweden
-4.0
-3.0
-2.0
-1.0
0.0
1.0
2.0
3.0
4.0
5.0
2007 2008 2009 2010 2011 2012 2013
P e r c e n t
Switzerland
-10.0
-5.0
0.0
5.0
10.0
15.0
2007 2008 2009 2010 2011 2012 2013
P e r c e n t
Thailand
-20.0
-15.0
-10.0
-5.0
0.0
5.0
10.0
15.0
2007 2008 2009 2010 2011 2012 2013
P e r c e n t
Turkey
-8.0
-6.0
-4.0
-2.0
0.0
2.0
4.0
6.0
2007 2008 2009 2010 2011 2012 2013
P e r c e n t
United Kingdom
-6.0
-4.0
-2.0
0.0
2.0
4.0
6.0
2007 2008 2009 2010 2011 2012 2013
P e r c e n t
United States
7/30/2019 IMF - Policy Analysis and Forecasting in the World Economy: A Panel Unobserved Components Approach
http://slidepdf.com/reader/full/imf-policy-analysis-and-forecasting-in-the-world-economy-a-panel-unobserved 76/77
75
References
de Jong, P., 1989, ―Smoothing and Interpolation with the State-Space Model‖, Journal of the
American Statistical Association, Vol. 84, pp. 1085 – 88.
Dées, S., M. Pesaran, L. Smith, and R. Smith, 2010, ―Supply, Demand and Monetary PolicyShocks in a Multi-Country New Keynesian Model‖, European Central Bank Working
Paper 1239.
Engle, R., and M. Watson, 1981, ―A One-Factor Multivariate Time Series Model of
Metropolitan Wage Rates‖, Journal of the American Statistical Association, Vol. 76,
pp. 774 – 81.
Geweke, J., 2005, ―Contemporary Bayesian Econometrics and Statistics‖, Wiley.
Hodrick, R., and E. Prescott, 1997, ―Post-War U.S. Business Cycles: A DescriptiveEmpirical Investigation‖, Journal of Money, Credit, and Banking, Vol. 29, pp. 1 – 16.
International Monetary Fund, 2006, ― Annual Report on Exchange Arrangements and
Exchange Restrictions‖, (Washington: International Monetary Fund).
International Monetary Fund, 2011, ―Consolidated Spillover Report‖, IMF Policy
Paper 11/140, (Washington: International Monetary Fund).
Kalman, R., 1960, ―A New Approach to Linear Filtering and Prediction Problems‖,
Transactions ASME Journal of Basic Engineering, Vol. 82, pp. 35 – 45.
Klein, P., 2000, ―Using the Generalized Schur Form to Solve a Multivariate Linear Rational
Expectations Model‖, Journal of Economic Dynamics and Control, Vol. 24,
pp. 1405 – 23.
Pesaran, M., T. Schuermann, and S. Weiner, 2004, ―Modeling Regional Interdependencies
Using a Global Error-Correcting Macroeconometric Model‖, Journal of Business and
Economic Statistics, Vol. 22, pp. 129 – 62.
Roger, S., and J. Vlcek, 2012, ―Macrofinancial Modeling at Central Banks: Recent
Developments and Future Directions‖, IMF Working Paper 12/21, (Washington:
International Monetary Fund).
Storn, R., and K. Price, 1997, ―Differential Evolution — A Simple and Efficient Heuristic for
Global Optimization over Continuous Spaces‖, Journal of Global Optimization,
Vol. 11, pp. 341 – 59.
7/30/2019 IMF - Policy Analysis and Forecasting in the World Economy: A Panel Unobserved Components Approach
http://slidepdf.com/reader/full/imf-policy-analysis-and-forecasting-in-the-world-economy-a-panel-unobserved 77/77
76
Vitek, F., 2009, ―Monetary Policy Analysis and Forecasting in the World Economy: A Panel
Unobserved Components Approach‖, IMF Working Paper 09/238, (Washington:
International Monetary Fund).
Vitek, F. 2010, ―Monetary Policy Analysis and Forecasting in the Group of Twenty: A Panel
Unobserved Components Approach‖, IMF Working Paper 10/152, (Washington:International Monetary Fund).