
IMF Country Report No. 16/326 SAUDI ARABIA · 2 Executive Board Assessment2 Executive Directors...
80
© 2016 International Monetary Fund IMF Country Report No. 16/326 SAUDI ARABIA 2016 ARTICLE IV CONSULTATION—PRESS RELEASE; STAFF REPORT; AND INFORMATIONAL ANNEX Under Article IV of the IMF’s Articles of Agreement, the IMF holds bilateral discussions with members, usually every year. In the context of the 2016 Article IV consultation with Saudi Arabia, the following documents have been released and are included in this package: A Press Release summarizing the views of the Executive Board as expressed during its July 18, 2016 consideration of the staff report that concluded the Article IV consultation with Saudi Arabia. The Staff Report prepared by a staff team of the IMF for the Executive Board’s consideration on July 18, 2016 following discussions that ended on May 12, with the officials of Saudi Arabia on economic developments and policies. Based on information available at the time of these discussions, the staff report was completed on June 29, 2016. An Informational Annex prepared by the IMF staff. The documents listed below will be separately released. Selected Issues The IMF’s transparency policy allows for the deletion of market-sensitive information and premature disclosure of the authorities’ policy intentions in published staff reports and other documents. Copies of this report are available to the public from International Monetary Fund Publication Services PO Box 92780 Washington, D.C. 20090 Telephone: (202) 623-7430 Fax: (202) 623-7201 E-mail: [email protected] Web: http://www.imf.org Price: $18.00 per printed copy International Monetary Fund Washington, D.C. October 2016
Transcript of IMF Country Report No. 16/326 SAUDI ARABIA · 2 Executive Board Assessment2 Executive Directors...

© 2016 International Monetary Fund
IMF Country Report No. 16/326
SAUDI ARABIA 2016 ARTICLE IV CONSULTATION—PRESS RELEASE; STAFF REPORT; AND INFORMATIONAL ANNEX
Under Article IV of the IMF’s Articles of Agreement, the IMF holds bilateral discussions
with members, usually every year. In the context of the 2016 Article IV consultation with
Saudi Arabia, the following documents have been released and are included in this
package:
A Press Release summarizing the views of the Executive Board as expressed during its
July 18, 2016 consideration of the staff report that concluded the Article IV
consultation with Saudi Arabia.
The Staff Report prepared by a staff team of the IMF for the Executive Board’s
consideration on July 18, 2016 following discussions that ended on May 12, with the
officials of Saudi Arabia on economic developments and policies. Based on
information available at the time of these discussions, the staff report was completed
on June 29, 2016.
An Informational Annex prepared by the IMF staff.
The documents listed below will be separately released.
Selected Issues
The IMF’s transparency policy allows for the deletion of market-sensitive information and
premature disclosure of the authorities’ policy intentions in published staff reports and
other documents.
Copies of this report are available to the public from
International Monetary Fund Publication Services
PO Box 92780 Washington, D.C. 20090
Telephone: (202) 623-7430 Fax: (202) 623-7201
E-mail: [email protected] Web: http://www.imf.org
Price: $18.00 per printed copy
International Monetary Fund
Washington, D.C.
October 2016

Press Release No. 16/368
FOR IMMEDIATE RELEASE
July 28, 2016
IMF Executive Board Concludes 2016 Article IV Consultation with Saudi Arabia
On July 18, 2016, the Executive Board of the International Monetary Fund (IMF) concluded the
Article IV Consultation1 with Saudi Arabia.
Real GDP growth is expected to slow to 1.2 percent in 2016, but recover to 2 percent in 2017 as
the pace of fiscal consolidation eases and to settle around 2¼ -2½ percent over the medium-
term. Inflation has risen in recent months to over 4 percent as energy and water prices have been
increased, and is expected to ease to 2 percent in 2017.
Bank deposits have declined, but growth of credit to the private sector remains strong. Capital
buffers are high, NPLs low, and banks are well provisioned against loan losses. SIBOR has
moved higher in recent months and the spread to U.S rates has widened as liquidity has
tightened. SAMA relaxed the loan-to-deposit ratio in February and increased its reverse repo
rate by 25bp to 0.5 percent in December.
Based on current policies, the fiscal deficit is projected to narrow to 13 percent of GDP in 2016.
Non-oil revenues are expected to increase, while spending restraint, particularly on the capital side,
will result in a substantial reduction in expenditure. The fiscal deficit is expected to be financed
through a mix of deposit drawdown and domestic and international borrowing.
The current account deficit is projected to narrow to 6.4 percent of GDP in 2016 and then move
close to balance by 2021 as oil prices partial recover. SAMA’s NFA are expected to fall further
in 2016, but the pace of decline will slow over the medium term.
Saudi Arabia has begun a fundamental policy shift to respond to low oil prices. The government
has introduced a series of reforms over the past year and has recently set out plans for a bold and
ambitious transformation of the Saudi Arabian economy in Vision 2030 and the National
Transformation Program. Diversifying the economy, creating jobs for nationals in the private sector,
and implementing a gradual, but sizable and sustained fiscal consolidation to reach budget balance
in 5 years are key policy priorities.
1 Under Article IV of the IMF's Articles of Agreement, the IMF holds bilateral discussions with members, usually
every year. A staff team visits the country, collects economic and financial information, and discusses with officials
the country's economic developments and policies. On return to headquarters, the staff prepares a report, which
forms the basis for discussion by the Executive Board.
(continued…)
International Monetary Fund
700 19th Street, NW
Washington, D. C. 20431 USA

2
Executive Board Assessment2
Executive Directors noted that Saudi Arabia faces important challenges stemming from the
decline in oil prices. They welcomed the authorities’ timely response, which, supported by
sizeable fiscal buffers and a strong and resilient financial system, has maintained macroeconomic
growth and stability. Nonetheless, the fiscal and current account balances have moved into
deficit and growth is starting to slow. Directors highlighted the need for continued fiscal
adjustment and reforms to strengthen and transform the Saudi Arabian economy. In this regard,
they commended the authorities’ bold reform plans.
Directors welcomed the ambitious reform goals announced by the authorities in Vision 2030 and
the National Transformation Program, and underscored the importance of clear prioritization and
sequencing of the planned reforms to reduce implementation risks and give the economy time to
adjust. They supported the authorities’ plan to increase the role of the private sector in the
economy by focusing on privatization and public-private partnerships, improve the business
environment, develop local capital markets, encourage FDI, and support small and medium
enterprises. Directors noted that continued labor market and education reforms are needed to
encourage private sector employment of Saudi nationals and increase labor force participation of
women.
Directors agreed that a gradual but sizable and sustained fiscal consolidation is needed, and
welcomed the adjustment under way. They generally agreed that balancing the budget over the
medium term is an appropriate goal and encouraged the authorities to develop a credible
medium-term plan to achieve this objective. They supported expenditure and revenue reforms,
including continued gradual adjustment of energy prices with compensation for lower-income
households, introduction of a VAT and excise taxes, containment of the government wage bill,
and improved public investment management and spending efficiency. They recommended
accompanying these measures with growth-enhancing structural reforms.
Directors emphasized the importance of developing a medium-term fiscal framework and
strengthening the annual budget process, with better integration of the Public Investment Fund
and Aramco into the budget. They encouraged the authorities to take an integrated asset-liability
management approach to financing the fiscal deficit. They noted that government debt issuance
would help establish a risk-free yield curve and support the development of domestic debt
markets.
Directors noted that reforms have helped strengthen the financial system, and the banking sector
is well positioned to weather lower oil prices and slower growth. They encouraged the
authorities to continue to closely monitor credit quality, strengthen the macro-prudential
2 At the conclusion of the discussion, the Managing Director, as Chairman of the Board, summarizes the views of
Executive Directors, and this summary is transmitted to the country's authorities. An explanation of any qualifiers
used in summings up can be found here: http://www.imf.org/external/np/sec/misc/qualifiers.htm.

3
framework, and finalize the framework for bank resolution and liquidity provision. They also
recommended strengthening the liquidity forecasting and management frameworks of the central
bank.
Directors agreed that the exchange rate peg to the U.S. dollar is the best option for Saudi Arabia
given the current structure of its economy, and emphasized that a continued fiscal adjustment is
needed to support the peg. They saw merit in reviewing the peg periodically to ensure it remains
appropriate, given the desired evolution of the economy away from its current reliance on oil.
Directors welcomed the improvements in economic statistics, but noted that further work is
needed to fill remaining data gaps. Publication of more detailed budget data and updates would
enhance transparency. Directors encouraged the authorities to subscribe to the Fund’s Special
Data Dissemination Standard.
4
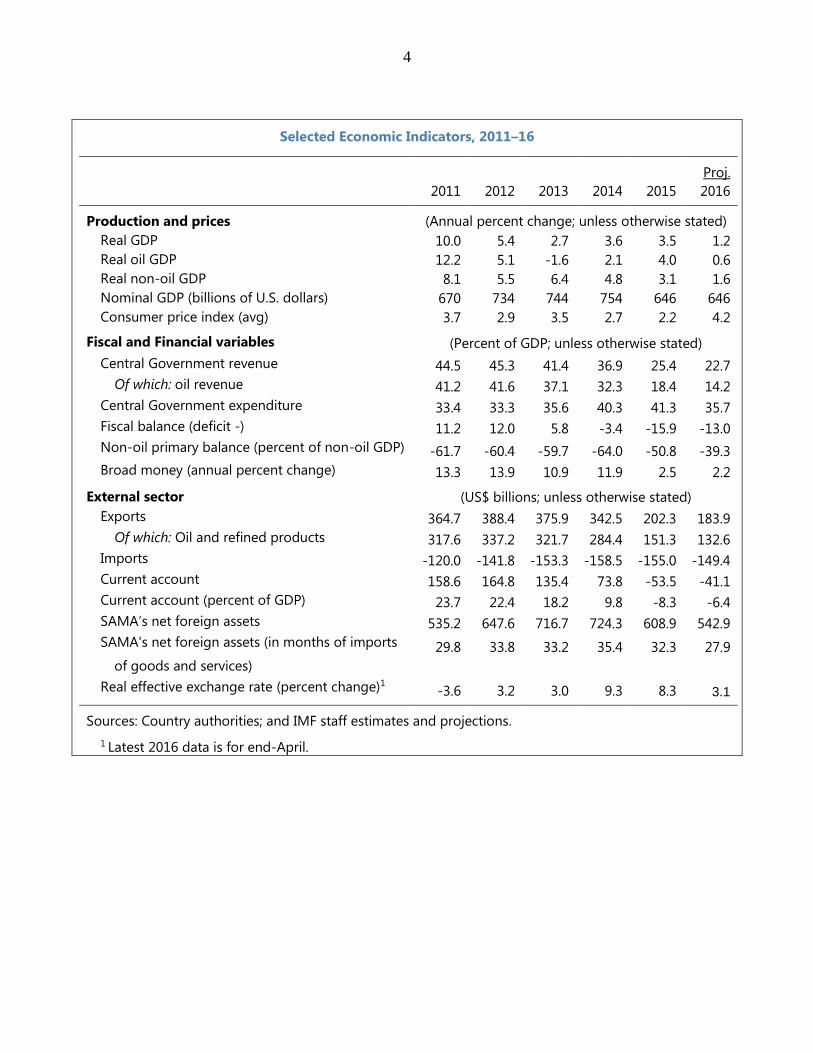
Selected Economic Indicators, 2011–16
Proj. 2011 2012 2013 2014 2015 2016
Production and prices (Annual percent change; unless otherwise stated)
Real GDP 10.0 5.4 2.7 3.6 3.5 1.2
Real oil GDP 12.2 5.1 -1.6 2.1 4.0 0.6
Real non-oil GDP 8.1 5.5 6.4 4.8 3.1 1.6
Nominal GDP (billions of U.S. dollars) 670 734 744 754 646 646
Consumer price index (avg) 3.7 2.9 3.5 2.7 2.2 4.2 Fiscal and Financial variables (Percent of GDP; unless otherwise stated)
Central Government revenue 44.5 45.3 41.4 36.9 25.4 22.7
Of which: oil revenue 41.2 41.6 37.1 32.3 18.4 14.2
Central Government expenditure 33.4 33.3 35.6 40.3 41.3 35.7
Fiscal balance (deficit -) 11.2 12.0 5.8 -3.4 -15.9 -13.0
Non-oil primary balance (percent of non-oil GDP) -61.7 -60.4 -59.7 -64.0 -50.8 -39.3
Broad money (annual percent change) 13.3 13.9 10.9 11.9 2.5 2.2 External sector (US$ billions; unless otherwise stated)
Exports 364.7 388.4 375.9 342.5 202.3 183.9
Of which: Oil and refined products 317.6 337.2 321.7 284.4 151.3 132.6
Imports -120.0 -141.8 -153.3 -158.5 -155.0 -149.4
Current account 158.6 164.8 135.4 73.8 -53.5 -41.1
Current account (percent of GDP) 23.7 22.4 18.2 9.8 -8.3 -6.4
SAMA’s net foreign assets 535.2 647.6 716.7 724.3 608.9 542.9
SAMA's net foreign assets (in months of imports 29.8 33.8 33.2 35.4 32.3 27.9
of goods and services)
Real effective exchange rate (percent change)1 -3.6 3.2 3.0 9.3 8.3 3.1
Sources: Country authorities; and IMF staff estimates and projections.
1 Latest 2016 data is for end-April.

SAUDI ARABIA STAFF REPORT FOR THE 2016 ARTICLE IV CONSULTATION
KEY ISSUES
Context. Saudi Arabia has begun a fundamental policy shift to respond to low oil prices.
The government has introduced a series of reforms over the past year and has recently
set out plans for a bold and ambitious transformation of the Saudi Arabian economy in
Vision 2030 and the National Transformation Program. Diversifying the economy,
creating jobs for nationals in the private sector, and implementing a gradual, but sizable
and sustained fiscal consolidation are key policy priorities.
Outlook and risks. The decline in oil prices is expected to dampen growth this year.
Risks to the outlook come mainly from uncertainties about the future path of oil prices
and implementation of the reform agenda, and ongoing regional tensions. Inflation has
increased due to higher energy and water prices.
Reform agenda. The reforms being outlined by the government are bold and far-
reaching. It is important that they are prioritized and sequenced to reduce the risk of
implementation bottlenecks and to give the economy time to adjust. With fiscal reforms
likely to have a negative short-term effect on growth and employment, growth-
enhancing structural reforms need to be introduced at the same time.
Fiscal policy. Fiscal consolidation is underway. Achieving the 2016 budget targets is a
priority. Balancing the budget over the next 5 years is an appropriate fiscal policy goal.
Financing of the fiscal deficits will rely on a combination of asset drawdown and
domestic and external borrowing. The fiscal framework should be strengthened,
including by specifying policy measures to achieve medium-term objectives.
External stability. The peg to the U.S. dollar remains appropriate given the structure of
the Saudi Arabian economy.
Financial sector. The banking sector remains strong, although it is being affected by
lower oil prices and weaker growth. SAMA is continuing to strengthen its regulation and
supervision of the financial sector. The macroprudential and liquidity management
frameworks should be strengthened.
June 29, 2016

SAUDI ARABIA
2 INTERNATIONAL MONETARY FUND
Approved By Aasim M. Husain and
Sanjaya Panth
Discussions were held in Riyadh during May 1–12, 2016. The staff
team comprised Tim Callen (head), Nabil Ben Ltaifa, Malika Pant,
Gazi Shbaikat (all MCD) and Ken Miyajima (MCM). Masood Ahmed
(MCD) participated in the concluding meetings. Executive Director
for Saudi Arabia Mr. Alshathri accompanied the mission. The team
met with Minister of Finance Al-Assaf, Minister of Economy and
Planning Al-Fakeih, Minister of State Al-Sheikh, the Governor of
SAMA Alkholifey, Chairman of the Capital Market Authority Al-
Jadaan, and other senior officials, as well as representatives of the
private sector. Diana Kargbo-Sical and Zhe Liu (MCD) provided
support from headquarters.
CONTENTS
CONTEXT_________________________________________________________________________________________ 4
MACRO-FINANCIAL DEVELOPMENTS, OUTLOOK, AND RISKS ________________________________ 5
A. Recent Macroeconomic Developments ________________________________________________________ 5
B. Outlook, Risks, and Spillovers __________________________________________________________________ 6
POLICY DISCUSSIONS _________________________________________________________________________ 14
A. Reforms to Support Growth and Strengthen Government Finances ___________________________ 14
B. External and Financial Sector Policies __________________________________________________________ 24
STAFF APPRAISAL _____________________________________________________________________________ 28
BOXES
1. Supply and Demand of Bank Credit in Saudi Arabia: Challenges and Opportunities ____________ 8
2. Outlook for the Global Oil Market and the Potential Role of Saudi Arabia ____________________ 11
3. Saudi Arabia—Spillovers to the GCC/MENA Region ___________________________________________ 12
4. Key Economic Targets Announced in Vision 2030 and the NTP _______________________________ 15
5. Energy and Water Price Reforms: What Has Happened and What’s Next?_____________________ 22
FIGURES
1. Real Sector Developments ____________________________________________________________________ 31
2. Oil Market Developments _____________________________________________________________________ 32
3. Fiscal Developments ___________________________________________________________________________ 33
4. External Sector Developments _________________________________________________________________ 34
5. Monetary and Financial Developments ________________________________________________________ 35
6. Labor Market Developments __________________________________________________________________ 36
7. Inflation and Asset Price Developments _______________________________________________________ 37
8. Indicators of the Business Climate _____________________________________________________________ 38
9. Upside/Downside Oil Price and External Borrowing Scenarios _________________________________ 39
10. Economic Outcomes Under Baseline and Reform Scenarios _________________________________ 40

SAUDI ARABIA
INTERNATIONAL MONETARY FUND 3
TABLES
1. Selected Economic Indicators, 2012–21 _______________________________________________________ 41
2. Budgetary Central Government Operations, 2014–21 _________________________________________ 42
3. Fiscal Operations of the General Government, 2010–15 _______________________________________ 43
4. Balance of Payments, 2012–21 ________________________________________________________________ 44
5. Monetary Survey, 2012–21 ____________________________________________________________________ 45
6. Fiscal Assumptions in the Baseline and Adjustment Scenarios _________________________________ 46
7. Financial Soundness Indicators, 2007–15 ______________________________________________________ 47
APPENDICES
I. Saudi Arabia’s Corporate Sector _______________________________________________________________ 48
II. Fiscal and External Debt Sustainability _________________________________________________________ 51
III. External Sustainability Assessment for Saudi Arabia __________________________________________ 55
IV. The Resilience of Saudi Banks to Lower Asset Quality and Deposit Withdrawals ______________ 62
V. Status of Key Recommendations of the 2011 FSAP Update ___________________________________ 65

SAUDI ARABIA
4 INTERNATIONAL MONETARY FUND
CONTEXT
1. Saudi Arabia has begun a fundamental policy shift to respond to low oil prices. The
government has introduced a series of reforms over the past year and has recently set out plans for
a bold and ambitious transformation of the Saudi Arabian economy in Vision 2030. The policies that
will help achieve the goals of Vision 2030 are to be set out in a series of policy plans. The first—the
National Transformation Program (NTP)—was released in early June. It lays out 178 strategic
objectives with over 340 targets and benchmarks for 24 ministries and government entities to be
achieved by 2020. The cabinet has recently been reshuffled and a number of Ministries have been
merged or restructured to support the reforms.
2. Meeting the aspirations of a young and growing population is a significant challenge.
With fiscal consolidation affecting growth, the challenges of generating jobs and ensuring sufficient
housing and resource (water, power) availability will rise. About 1.6-1.8 million Saudi nationals are
expected to enter the labor force over the next 5 years given demographic trends and an expected
increase in labor force participation rates. Saudi nationals have been traditionally largely employed
in the public sector, where job creation is expected to slow in the coming years. Creating sufficient
jobs for nationals in the private sector will be key.
3. Saudi Arabia has strong policy buffers that have been built over the past decade.
At end-2015, government deposits at SAMA stood at about $280 billion, SAMA net reserves
at $609 billion (32 months of imports), and government debt was around 5 percent of GDP. The
government also has large shareholding in domestic companies. These policy buffers are being
used to smooth the adjustment process.
4. A gradual increase in oil prices is expected in the next few years, but prices are not
expected to recover to the levels seen in the first half of 2014. Investment in the global oil
industry is falling and together with demand growth this should support firmer prices going
forward, although stocks are high and will take some time to clear. Noting that Saudi Arabia is one
of the world’s most efficient oil producers, the authorities are continuing to meet the demand for oil
from their customers. Production remained at around 10.2 mb/d in the first five months of 2016.
5. Regional tensions continue. The ongoing conflicts in Iraq, Syria, and Yemen are creating a
difficult security environment.

SAUDI ARABIA
INTERNATIONAL MONETARY FUND 5
MACRO-FINANCIAL DEVELOPMENTS,
OUTLOOK, AND RISKS
A. Recent Macroeconomic Developments
6. Real GDP growth was broadly
unchanged in 2015 at 3.5 percent. Non-oil
growth slowed to 3.1 percent in 2015 from
4.8 percent in 2014—non-oil public sector
GDP contracted by close to 9 percent (y/y)
in 2015Q4—but was offset by stronger oil
sector growth of 4 percent in 2015 compared
to 2.1 percent in 2014 (Table 1, Figures 1 and
2). Monthly indicators suggest that non-oil
private sector activity weakened in early
2016. Corporate profitability and the stock
market have fallen over past year, although
corporate balance sheets generally remain
healthy (Appendix I).
7. The fiscal deficit widened significantly in 2015 despite a sizable reduction in spending.
It increased to 15.9 percent of GDP from 3.4 percent of GDP in 2014 (Figure 3, Tables 2 and 3).
This was driven mainly by the drop in oil revenue (51 percent between 2014 and 2015). On the
expenditure side, wage and other bonuses payments boosted spending in early 2015, but spending
was curtailed significantly in the second half of the year (although some 2.5 percent of GDP of
spending was deferred to 2016 by delaying the 13th month wage payment and some payments
to contractors). The government financed the fiscal deficit through a rundown of its deposits and
domestic borrowing.
8. The external position has weakened.
The current account moved into a deficit of
8.3 percent of GDP in 2015 as the value of oil
exports fell (Table 4, Figure 4). Financial outflows
continued as banks and a large pension fund
increased their foreign assets. SAMA’s NFA have
fallen by $154 billion since December 2014.
There has been some pressure on the riyal in the
forward market, which has prompted the SAMA
Governor to reiterate the authorities’
commitment to the peg and the central bank to
ban local banks from selling option contracts on
FX forwards.
-10
-5
0
5
10
15
20
25
20
11
Q1
20
11
Q3
20
12
Q1
20
12
Q3
20
13
Q1
20
13
Q3
20
14
Q1
20
14
Q3
20
15
Q1
20
15
Q3
Oil
Non-oil
Overall GDP
Real GDP Growth, 2011–15
(y-o-y percent change)
Sources: Country authorities; and IMF staff calculations.
-25
-20
-15
-10
-5
0
5
10
15
20
25
30
2005 2006 2007 2008 2009 2010 2011 2012 2013 2014 2015
Current account
Financial account (including errors and omissions)Changes in reserves
Current Account and Financial Account Balance
(In percent of GDP)
Sources: Country authorities; and IMF staff calculations.

SAUDI ARABIA
6 INTERNATIONAL MONETARY FUND
9. Bank deposits have declined, but growth
of credit to the private sector has remained
strong (Table 5, Figure 5). Deposit growth declined
by 2 percent (y/y) in April 2016 as households and
businesses reduced their holdings of demand
deposits, with deposits of government entities
remaining broadly unchanged. Private sector credit
grew by 10 percent, due in part to a surge in credit
to the construction sector (27 percent (y/y) in
2016Q1), which was at least partly due to
contractors accessing credit lines in the face of
payment delays from the government. Over the
past year, Banks have reduced holdings of SAMA
bills, excess deposits at SAMA, and foreign assets to
meet credit demand and to purchase government
bonds, while SAMA also relaxed the loan-to-deposit
ratio in February. SIBOR has moved substantially
higher and the spread to U.S rates has widened.
SAMA increased its reverse repo rate by 25bp to
0.5 percent in December. Major credit rating
agencies have downgraded Saudi Arabia’s credit
rating (Fitch (AA-), S&P (A-), and Moody’s (A1)).
10. Job creation for Saudis was weak in 2015
(Figure 6). Total employment increased by
3.8 percent, while the employment of Saudis
increased by only 1 percent and actually fell by over
1 percent in the private sector. The unemployment
rate of nationals fell slightly to 11.5 percent,
although female unemployment rose to
33.8 percent.
B. Outlook, Risks, and Spillovers
11. Growth is expected to slow in 2016
to 1.2 percent. Oil output growth is projected to
slow to 0.6 percent (with oil production assumed to
average 10.2 mb/d) and non-oil growth to
1.6 percent, the latter due to the impact of fiscal
consolidation and tighter liquidity conditions,
higher funding costs, and slowing credit growth
(Box 1 discusses the determinants of bank credit in Saudi Arabia). In 2017, real GDP growth is
expected to recover to 2 percent as the pace of fiscal consolidation eases. The recovery in private
Sources: Country authorities; and IMF staff calculations.
-5
0
5
10
15
20
Jan
-10
Jun
-10
No
v-1
0
Ap
r-1
1
Sep
-11
Feb
-12
Jul-
12
Dec
-12
May
-13
Oct
-13
Mar
-14
Au
g-1
4
Jan
-15
Jun
-15
No
v-1
5
Ap
r-1
6
Total Bank Deposits
Bank Credit to Private Sector
Growth of Bank Credit to Private Sectors and Deposits
(percent, year to year)
-100
0
100
200
300
400
500
600
2014 2015
(tho
usan
d jo
bs)
Saudi, public sector Saudi, private sector
Non-Saudi, public sector Non-Saudi, private sector
Changes in Public and Private Sector Employment
(y-o-y change)
Sources: Country authorities; Haver; and IMF staff calculations.
0.0
0.5
1.0
1.5
2.0
2.5
Jan
-10
May
-10
Sep
-10
Jan
-11
May
-11
Sep
-11
Jan
-12
May
-12
Sep
-12
Jan
-13
May
-13
Sep
-13
Jan
-14
May
-14
Sep
-14
Jan
-15
May
-15
Sep
-15
Jan
-16
May
-16
Policy and Interbank Interest Rates
(Percent, daily closing rates)
Repo Rate
3-month SIBOR
Reverse Repo Rate
Sources: Haver; and Reuters.
Sources: Haver and IMF staff estimates.
Saudi Arabia: Change in Bank Balance Sheet Composition, Apr il 15-16(Percentage point change of share of total assets)
4.7 3.9
1.2
-1.0 -0.9
-7.8
1.2 0.9 0.6
-2.7
-10
-8
-6
-4
-2
0
2
4
6
Pri
vate
cre
dit
Pub
lic c
red
it
Oth
er
Fore
ign
Exce
ss d
epos
its
SAM
A b
ills
Oth
er
Cap
ital
acc
t.
Fore
ign
Dep
osi
ts
Assets Liabilities

SAUDI ARABIA
INTERNATIONAL MONETARY FUND 7
non-oil growth is, however, projected to weaken toward the end of the projection period in the
baseline as rising government debt increases the risk premium and crowds-out credit growth.
Fiscal Developments 2014–16
12. The fiscal deficit is projected to narrow to 13 percent of GDP in 2016 under the
baseline scenario. This is based on policies in the 2016 budget and other policies that have an
announced implementation schedule (see Table 6 for assumptions). Higher energy and water
prices introduced in late 2015 (ranging from 10-134 percent) and increased transfers from public
entities to the budget should generate additional
revenues of 1.3 percent of GDP and 1.6 percent of
GDP, respectively. Oil revenues are expected to
decline relative to 2015, while spending restraint,
particularly on the capital side, will result in a
substantial reduction in spending. Beyond 2016, the
fiscal deficit is expected to decline further to
7.7 percent of GDP in 2021, driven by higher
oil revenues (about 3 percent of GDP), higher
non-oil revenues (about 1 percent of GDP), mainly
from the VAT and higher excise taxes which are
partly offset by lower transfers from public entities,
and a gradual further reduction in capital spending
as a number of existing projects reach completion.
The baseline scenario does not include additional
spending measures in the NTP or additional revenue measures that have not been clearly specified.
The fiscal deficit is projected to be financed through a mix of deposit drawdown and domestic and
international borrowing. The government’s net financial asset position (defined as government
deposits less gross debt) moves from +38 percent of GDP in 2015 to -17 percent of GDP in 2021.
2014 2015 2016 2014 2015 2016
Revenue 36.9 25.4 22.7 65.0 35.6 30.3
Oil 32.3 18.4 14.2 56.9 25.8 18.8
Non-oil 4.6 7.0 8.6 8.2 9.8 11.40.0 0.0 0.0
Expenditure 40.3 41.3 35.7 71.0 57.8 47.5
Current 23.7 27.7 26.1 41.7 38.7 34.7
Capital 16.7 13.7 9.6 29.3 19.1 12.80.0 0.0 0.0
Overall Balance -3.4 -15.9 -13.0 -6.0 -22.3 -17.2
Balance excluding oil -35.7 -34.3 -27.1 -62.9 -48.1 -36.1
Memo items:
Nominal GDP (SARs billions) 2,827 2,423 2,424
Nominal Non-oil GDP (SARs billions) 1,606 1,731 1,821
(Percent of GDP) (Percent of non-oil GDP)
Fiscal Deficit and Fiscal Financing 2016–21
Accumulated Fiscal Deficit
Financing
Deposit drawdown at SAMA
Loans
Domestic debt issuance
Banks
Nonbanks
Foreign borrowing
Privatization proceeds
Memorandum items
2015 2021
Gross government debt 5.0 36.1
Deposits at SAMA 43.3 18.8
Net Financial assets 38.3 -17.3
Source: IMF staff calculations.
(Percent of GDP)
(SAR trillions)
2016–21
1.5
1.5
0.4
0.0
0.8
0.4
0.4
0.3
0.0

SAUDI ARABIA
8 INTERNATIONAL MONETARY FUND
Box 1. Supply and Demand of Bank Credit in Saudi Arabia: Challenges and Opportunities
Bank credit constitutes a key channel of transmission from oil prices to the real economy in Saudi Arabia. Empirical
evidence suggests that the supply and demand of bank credit to the private sector are affected by bank characteristics and
macroeconomic conditions. Bank-level credit growth is modeled using a range of bank-specific and macroeconomic variables
(Table 1). The results suggest that:
The supply of bank credit to the private sector improves as the capital ratio increases and deposit growth strengthens.
Credit supply weakens as banks provision for NPLs. Increases in excess liquidity in the banking system boosts credit
extension. Bank credit growth declines as banks increase their holdings of government bonds (suggesting “crowding-out”). It
also weakens as specialized credit institutions (SCIs) expand lending, suggesting the existence of competition rather than
complementarity between these institutions and banks in the segments of the market they work in.
The demand for credit from the private sector increases with higher oil prices and stronger activity in the non-oil private
sector. Financial deepening, proxied by bank credit to the private sector as a share of nonoil GDP, helps unlock demand for
credit.
Fixed Effects Panel Model of Bank-Level Real Credit Growth in Saudi Arabia
Model predictions help understand why credit growth has remained robust despite the sharp drop in oil prices (Figure 1;
using model 7). Credit growth held up well in 2015, supported by strong bank balance sheets and economic activity even as
deposit growth slowed. Looking ahead, credit growth could slow further reflecting lagged effects of slow deposit growth, and if
the capital ratios decline, provisioning for NPLs accelerates, or growth slows further.
These results suggest that, to support bank credit in the period ahead, bank balance sheets need to remain strong. Banks
need to maintain sufficient capital even as low oil prices start putting balance sheets under pressure. Provisioning for NPLs
reduces credit extension, but is essential for safeguarding financial stability. Greater confidence in the banking system also helps
attract customer deposits and support credit supply. Greater lending by SCIs does not increase bank credit, but fiscal adjustment
and a reduced reliance on banks to finance the budget deficit could support credit to the private sector.
Model number 1 2 3 4 5 6 7 8 9 Lagged
Bank characteristics
Capital ratio +** +** +* … … … +** +** +** Y
NPL provisions, real growth –*** –*** –*** … … … –*** –*** –*** Y
Deposits, real growth +*** +*** +*** … … … +*** +*** +*** Y
Net income, real growth – – – + – – – – – Y
Macro variables
Oil prices, real growth +*** … … … +*** + … +*** +* N
Special credit institution lending, real growth … –** … … … … … … … N
Gov. bond holdings to bank assets, ppt change … … –*** … … … … … … N
Nonoil PS GDP, real growth … … … +** … + +*** … +* N
Credit to GDP, ppt change … … … … … +*** … … … N
2008, 09 dummies Y Y Y Y Y Y Y Y Y N
N 138 138 138 142 142 142 138 138 138 …
r2_a 0.361 0.361 0.425 0.164 0.155 0.411 0.364 0.364 0.381 …
Source: Author's calculation.
Supply Demand
Note: Winsorised, which replaces outliers with values inside the tail of the distribution. 5% inside the tail in this case. Starts are *
p<.1; ** p<.05; *** p<.01 .
Combined
Actual and Predicted Contributions to Changes
-5
0
5
10
15
20
25
06 07 08 09 10 11 12 13 14 15
Actual
Predicted
-15
-10
-5
0
5
10
06 07 08 09 10 11 12 13 14 15
Nonoil GDPgrowth
Deposit growth
Provisioninggrowth
Capital ratio
Predicted
Time dummies not shown
Sources: Bankcope; Haver; and IMF staff calculations.

SAUDI ARABIA
INTERNATIONAL MONETARY FUND 9
13. The current account deficit is projected to narrow to 6.4 percent of GDP in 2016 and
then move close to balance by 2021 as oil prices rise. Financial outflows are also projected to
slow as banks and pension funds reverse their foreign investments and buy domestic government
debt, and the government borrows externally. SAMA’s NFA are expected to fall substantially further
in 2016, but the pace of decline will slow over the medium term.
14. Inflation is expected at a little over 4 percent in 2016. Higher energy prices led to a sharp
increase in inflation in January, but slowing growth over the year is expected to reduce underlying
pressures (Figure 7). After easing in 2017, inflation is expected to pick-up in 2018 with the
introduction of the VAT, before easing again to 2 percent in 2019–21.
15. Key risks to the growth outlook include (see Risk Assessment Matrix):
Global oil market uncertainties. Futures markets and consensus forecasts suggest oil price
risks are skewed to the upside. Nevertheless, with excess capacity in the market and downside
risks to global growth, a further drop in prices remains a possibility (Box 2 discusses how oil
production/prices affect the fiscal balance).
More volatile global financial market conditions. These could constrain external financing,
putting additional pressure on reserves, domestic liquidity, and credit.
Reform implementation. Quick progress in prioritizing and implementing reforms in the NTP
and other policy documents could boost growth relative to staff’s baseline. A failure to
implement fiscal adjustment may increase growth in the near-term, but at the cost of higher
debt and interest rates and pressures on the exchange rate peg with negative effects on growth
in the medium-term. On the other hand, too rapid a fiscal adjustment would hurt growth
excessively in the near-term.
An escalation of regional tensions or domestic security concerns could hurt confidence and
growth.
16. Economic developments in Saudi Arabia have an important impact on the other GCC
countries and the broader MENA region. The channels include imports, remittances, tourism, aid,
and financial flows, the importance of which varies across countries (Box 3). As growth slows in Saudi
Arabia this year, it is expected to have an impact on countries in the region with Bahrain, which has
strong ties to Saudi Arabia, perhaps likely to be one of the most affected.

SAUDI ARABIA
10 INTERNATIONAL MONETARY FUND
Saudi Arabia: Risk Assessment Matrix1
Nature/source of main risks Likelihood/Time
Horizon
Expected impact on the economy if
risk is realized
Policy Response
Persistently low energy
prices, triggered by supply
factors reversing only
gradually
High/Medium-term
High
A 10 percent permanent decline in oil prices
would reduce fiscal and external balances by 2.3
and 2.8 percentage points of GDP, respectively,
assuming no policy response. GDP growth would
drop by 0.5 percentage points a year assuming the
government fully offsets the revenue losses with
expenditure cuts. Adverse confidence effects in the
private sector and drying up of liquidity in the
banking system could reduce credit availability and
amplify negative spillovers.
Fiscal policy would need to adjust to
reflect the realities of lower oil prices.
Policymakers should intensify
diversification efforts to partially offset
potential negative spillovers from lower
oil prices. The authorities should ensure
adequate banking system liquidity and
carefully monitor banks for signs of
stress.
Government does not
implement fiscal
adjustment plans
Low/Medium-term
High
The government has announced an ambitious fiscal
adjustment in the 2016 budget and the objective of
balancing the budget going forward. If this
adjustment does not materialize, the fiscal path will
be considerably worse than in the baseline. Net debt
will rise quite rapidly, borrowing costs will increase,
risks of crowding-out will rise, and pressures on the
exchange rate peg will increase.
Ensure fiscal consolidation objectives
are adhered to, and strengthen
budgetary processes to support this.
Private sector employment
opportunities do not
increase fast enough to
provide jobs for the young
population
Medium/Medium-
term
High
Absorbing new labor market entrants into
government jobs is not be an option going forward
given the need for fiscal consolidation. Unless private
sector hiring increases, unemployment will rise.
Further labor market reforms are
needed to increase the employment of
Saudi nationals in the private sector.
Heightened risk of
fragmentation /security
dislocation in part of the
Middle East, Africa, and
Europe leading to a sharp rise
in migrant flows with negative
global spillovers
High/Short-term
Low
Heightened tensions and conflict in the Middle East
could result in higher oil prices if oil supply is
threatened. The positive impact on the economy
from higher oil prices could, however, be offset if
confidence and investment falls, financial market
volatility increases in response to heightened
regional tensions, and if spending on defense and
security increases.
Higher oil prices would ease pressure on
the fiscal position, but fiscal adjustment
would still be needed over the medium-
term. Increased efforts at diversification
would remain important. If growth was
significantly affected by a loss of
confidence, there could be a case for
temporarily slowing the pace of fiscal
adjustment.
Tighter or more volatile
global financial conditions:
Sharp asset price
adjustment and
decompression of credit
spreads
Surge in the U.S. dollar
Medium/Short-
term
High/Short-term
Low
Tighter financial market conditions could affect the
government’s ability to borrow from international
markets, thus increasing the domestic financing
requirement. Bank funding costs may also increase.
Given the peg, dollar strength would appreciate the
riyal. This, however, would have a minimal impact on
growth or the current account given small non-
hydrocarbon exports and limited substitutability
between domestic production and imports. Banks
should prove resilient as any open foreign exchange
positions (subject to prudential limits) are largely in
U.S. dollars.
Continued strong fundamentals would
likely prevent excessive volatility in
Saudi Arabian financial markets. Large
financial cushions are in place to
mitigate the impact.
1 The Risk Assessment Matrix (RAM) shows events that could materially alter the baseline path (the scenario most likely to materialize in the view of IMF staff). The relative
likelihood of risks listed is the staff’s subjective assessment of the risks surrounding the baseline (“low” is meant to indicate a probability below 10 percent, “medium” a probability
between 10 and 30 percent, and “high” a probability between 30 and 50 percent). The RAM reflects staff views on the source of risks and overall level of concern as of the time of
discussions with the authorities. Non-mutually exclusive risks may interact and materialize jointly.

SAUDI ARABIA
INTERNATIONAL MONETARY FUND 11
Box 2. Outlook for the Global Oil Market and the Potential Role of Saudi Arabia
Oversupply in the global oil market is
declining, although the market appears likely
to remain slightly oversupplied in the near
term. The June 2016 IEA monthly report expects
global oil demand to grow by 1.3mb/d in 2016
and 2017. On the supply side, non-OPEC supply,
mostly driven by US light tight oil and some one-
off factors, is expected to decline by 0.9 mb/d in
2016 and pick up slightly by 0.3 mb/d in 2017. In
OPEC, higher oil production in Iran and Iraq has
more than offset production difficulties in Nigeria.
These demand and supply developments are
reducing excess supply in the market, although
stocks are high and will take some time to clear.
There also remain considerable uncertainties
about the supply and demand outlook.
Three scenarios are considered to analyze
what would happen to Saudi Arabia’s oil
revenues if it decided to reduce its output to
eliminate estimated excess supply in the
market. These scenarios are: (i) a cut in oil
production by all the estimated excess supply of
0.9 mb/d in 2016 by Saudi Arabia alone, (ii) Saudi
Arabia cuts by half of the excess supply (0.4 mb/d)
and other OPEC producers jointly cut by the
remaining 0.4 mb/d and (iii) Saudi Arabia, other
OPEC, and non-OPEC (each cut one third of the
excess supply). These production cuts would
increase oil prices by 5-18 percent depending on
price elasticity of demand. The impact on Saudi oil
revenues could be negligible or negative if Saudi
absorbs all the output cut. If the cuts are shared
across OPEC and non-OPEC, however, the impact
on Saudi oil revenues is positive in most scenarios.
(Table 2).
in mb/d
2014 2015 2016 2017
Under Baseline
Global demand 92.8 94.7 96.1 97.4
change in inventories 0.9 1.7 … …
Global supply 93.7 96.4 96.9 97.6
Non-OPEC (includes NGLs) 56.2 57.7 56.8 57.0
US 12.0 12.9 12.5 12.5
Russia 10.9 11.1 11.2 11.1
OPEC 37.5 38.7 40.2 40.6
NGLs 6.5 6.7 6.9 7.0
Crude Saudi Arabia 9.7 10.2 10.2 10.3
Crude Other OPEC 21.3 21.9 23.1 23.2
Table 1. Medium-term Outlook for the Gobal Oil
Market
Sources: IEA Medium Term Oil Report 2016; IEA Monthly Oil
Report June 2016; and IMF staff estimates.
projections
in mb/d
Saudi Oil Production cut 1/
Only Saudi cuts production
All OPEC cut production
OPEC + Non-OPEC
Price Elasticity of Demand -0.2 -0.1 -0.05
percent change
Impact on oil prices 5% 9% 18%
Impact on Saudi fiscal balance in percent of GDP
Only Saudi cuts production -1% 0% 1%
All OPEC cut production -0.1% 0.5% 1.8%
OPEC + Non-OPEC 0.1% 0.8% 2.0%
Sources: IEA, and IMF staff estimates.
2/ Assuming no supply reaction, price elasticity of demand of -0.05, -
0.1 and -0.2 implies that a one percent increase in oil supply would
lead to fall in oil prices by 20 percent, 10 percent and 5 percent
respectively.
Table 2. Impact of supply cuts under various
scenario for the baseline outlook in 2016 1/
-0.3
-0.9
-0.4
1/ Assumes total oil production cut to be equal to the estimated
excess supply of 0.9 mb/d.
SAUDI ARABIA
12 INTERNATIONAL MONETARY FUND
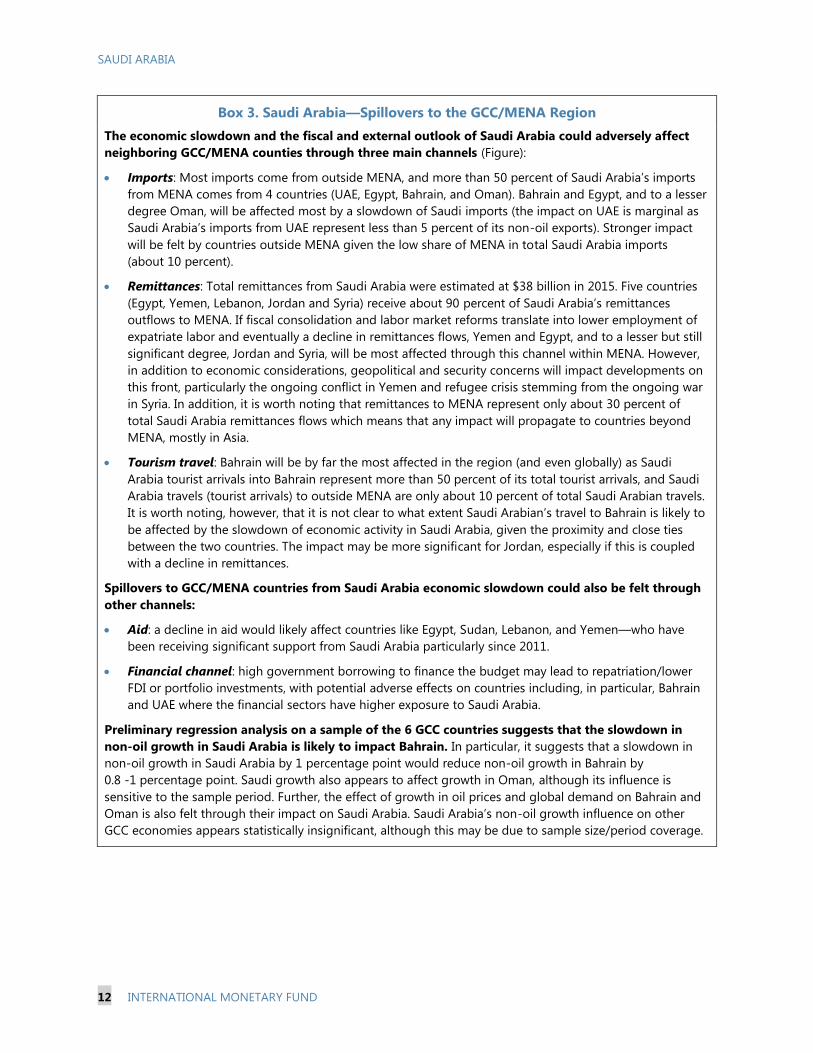
Box 3. Saudi Arabia—Spillovers to the GCC/MENA Region
The economic slowdown and the fiscal and external outlook of Saudi Arabia could adversely affect
neighboring GCC/MENA counties through three main channels (Figure):
Imports: Most imports come from outside MENA, and more than 50 percent of Saudi Arabia’s imports
from MENA comes from 4 countries (UAE, Egypt, Bahrain, and Oman). Bahrain and Egypt, and to a lesser
degree Oman, will be affected most by a slowdown of Saudi imports (the impact on UAE is marginal as
Saudi Arabia’s imports from UAE represent less than 5 percent of its non-oil exports). Stronger impact
will be felt by countries outside MENA given the low share of MENA in total Saudi Arabia imports
(about 10 percent).
Remittances: Total remittances from Saudi Arabia were estimated at $38 billion in 2015. Five countries
(Egypt, Yemen, Lebanon, Jordan and Syria) receive about 90 percent of Saudi Arabia’s remittances
outflows to MENA. If fiscal consolidation and labor market reforms translate into lower employment of
expatriate labor and eventually a decline in remittances flows, Yemen and Egypt, and to a lesser but still
significant degree, Jordan and Syria, will be most affected through this channel within MENA. However,
in addition to economic considerations, geopolitical and security concerns will impact developments on
this front, particularly the ongoing conflict in Yemen and refugee crisis stemming from the ongoing war
in Syria. In addition, it is worth noting that remittances to MENA represent only about 30 percent of
total Saudi Arabia remittances flows which means that any impact will propagate to countries beyond
MENA, mostly in Asia.
Tourism travel: Bahrain will be by far the most affected in the region (and even globally) as Saudi
Arabia tourist arrivals into Bahrain represent more than 50 percent of its total tourist arrivals, and Saudi
Arabia travels (tourist arrivals) to outside MENA are only about 10 percent of total Saudi Arabian travels.
It is worth noting, however, that it is not clear to what extent Saudi Arabian’s travel to Bahrain is likely to
be affected by the slowdown of economic activity in Saudi Arabia, given the proximity and close ties
between the two countries. The impact may be more significant for Jordan, especially if this is coupled
with a decline in remittances.
Spillovers to GCC/MENA countries from Saudi Arabia economic slowdown could also be felt through
other channels:
Aid: a decline in aid would likely affect countries like Egypt, Sudan, Lebanon, and Yemen—who have
been receiving significant support from Saudi Arabia particularly since 2011.
Financial channel: high government borrowing to finance the budget may lead to repatriation/lower
FDI or portfolio investments, with potential adverse effects on countries including, in particular, Bahrain
and UAE where the financial sectors have higher exposure to Saudi Arabia.
Preliminary regression analysis on a sample of the 6 GCC countries suggests that the slowdown in
non-oil growth in Saudi Arabia is likely to impact Bahrain. In particular, it suggests that a slowdown in
non-oil growth in Saudi Arabia by 1 percentage point would reduce non-oil growth in Bahrain by
0.8 -1 percentage point. Saudi growth also appears to affect growth in Oman, although its influence is
sensitive to the sample period. Further, the effect of growth in oil prices and global demand on Bahrain and
Oman is also felt through their impact on Saudi Arabia. Saudi Arabia’s non-oil growth influence on other
GCC economies appears statistically insignificant, although this may be due to sample size/period coverage.

SAUDI ARABIA
INTERNATIONAL MONETARY FUND 13
Saudi Arabia Trade, Remittance and Tourism Links with MENA
Source: IMF Direction of Trade; World Bank Migration and Remittances Data, UN World Tourism
Organization.
0
10
20
30
40
50
60
70
80
90
100
2005 2006 2007 2008 2009 2010 2011 2012 2013 2014
Saudi Arabia: Imports as a share of total
imports from MENA/ and Imports from MENA
as share of WorldOther MENA Bahrain
Egypt Oman
UAE Total MENA/Total World
0
2
4
6
8
10
12
14
16
18
20
Egypt Bahrain Oman UAE Other
MENA
Saudi Arabia's imports as share of partner
countries' total non-oil exports
2005
2010
2014
0102030405060708090
100
2010 2011 2012 2013 2014
Saudi Arabia: Remittance Outflows to MENA
as share of total outflows to MENA, and total
outfolows to MENA as share of total World
Other MENA Syrian Arab Republic
Jordan Lebanon
Yemen Egypt
Total to MENA/Tota l World
0
10
20
30
40
50
60
70
80
90
Egypt Yemen Lebanon Jordan Syria Other
MENA
Saudi Arabia's remittance outflows as share of
recipient countries' total remittance inflows
2010
2012
2014
0102030405060708090
100
2005 2006 2007 2008 2009 2010 2011 2012 2013 2014
Saudi Arabia: Outbound Tourist Travel to MENA
(arrivals in destination countries as a share of
total arrivals to MENA, and arrivals to MENA as
a share of World)
Other MENA Egypt
Jordan Kuwait
Bahrain, Kingdom of total MENA/total World
0
10
20
30
40
50
60
70
Bahrain Kuwait Jordan Egypt Other
MENA
Saudi Arabia Outbound Arrivals as share of
destination countries' total inbound arrivals
2005
2011
2014

SAUDI ARABIA
14 INTERNATIONAL MONETARY FUND
POLICY DISCUSSIONS
Against the background of the announcement of Vision 2030, discussions focused on four main themes
(i) prioritization, sequencing, and implementation of the reforms; (ii) growth and employment in a low-
oil price environment; (iii) fiscal adjustment, reforms, and financing; and (iv) maintaining external and
financial sector stability.
A. Reforms to Support Growth and Strengthen Government Finances
17. The authorities emphasized their commitment to reforms. They said the goals set out in
Vision 2030 are designed to transform the economy over the next 15 years to diversify growth,
reduce the dependence on oil, increase the role of the private sector, and create more jobs for
nationals (Box 4). They noted that substantial reforms have already been undertaken including to
reduce government spending, adjust energy prices, introduce key performance indicators for
ministries, and strengthen the management of public investment. The objectives in the NTP and
other forthcoming policy plans that support Vision 2030 will broaden and deepen these ongoing
reforms. The recent cabinet reshuffle and the merging and restructuring of a number of Ministries
are designed to streamline decision-making and introduce greater accountability in government to
support the reform process.
18. Staff welcomed the acceleration of reforms, and noted that their direction is
consistent with previous IMF policy advice. The goals and objectives in Vision 2030 and the NTP
are bold and far-reaching. They will be challenging to meet and will require considerable political
follow-through to implement. Staff emphasized the importance of clearly laying out the policy
measures that will help achieve these goals and objectives and prioritizing and sequencing the
reforms to reduce the risk of implementation bottlenecks and limit the possibility of pushback and
reform fatigue from the population. Staff suggested that with fiscal adjustment needing to proceed
given the large fiscal deficit, but likely to have a negative short-term effect on growth and
employment, it would be important to introduce growth-enhancing structural reforms to help offset
this effect to the extent possible. The impact of slower growth on the banking sector is likely to be
limited (see paragraph 46). Staff suggested an initial focus on structural reforms that improve the
functioning of product and financial markets rather than those that raise the cost of labor. The
authorities said they are discussing prioritization and sequencing as they move to finalize the
reforms and are putting an emphasis on reforms that will provide a short-term growth dividend.
They are also working on ensuring effective coordination across ministries, and taking steps to
strengthen the civil service to improve implementation capacity.
19. The authorities saw the staff’s growth projections in 2016 as too pessimistic. They
expected the ongoing expansions in the petrochemical, utility, and mining industries and a pickup in
visitors to Mecca and Medina to have a larger impact on non-oil growth while they thought the
impact of fiscal consolidation would be limited given the composition of adjustment and the scope
for improving spending efficiency. Looking further ahead, the authorities and staff agreed that with
government expenditure growth set to remain low, non-oil growth would be importantly

SAUDI ARABIA
INTERNATIONAL MONETARY FUND 15
determined by reforms to boost productivity and private investment and increase labor force
participation (see the Selected Issues paper on “Growth in a Low Oil Price Environment”).
Box 4. Key Economic Targets Announced in Vision 2030 and the NTP
Economic targets
Labor markets Unemployment to be reduced from 11.6 percent currently to 7 percent (9 percent by 2020).
Women’s participation in workforce to be increased from 22 percent currently to 30
percent (28 percent by 2020).
Create 450,000 jobs in nongovernment sector by 2020.
Reduce civil service workforce by 20 percent by 2020.
Trade Share of non-oil exports to be increased to 50 percent of total from current 16 percent.
Fiscal Non-oil revenue to be increased from SR163 billion in 2015 to SR1 trillion by 2030
(SR530 billion by 2020).
Reduce wages and salaries as share of budget spending.
Achieve balanced budget.
Subsidy reform Subsidies to be removed; direct cash payments to low and middle income households who
rely on subsidies.
Private and SME sectors Share of private sector in economy to be increased to 65 percent of GDP from 40 percent
currently; SME sector contribution to be raised from 20 percent of GDP to 35 percent.
FDI To increase FDI share of GDP from 3.8 percent to 5.7 percent of GDP.
Sector objectives/targets
Tourism Liberalizing tourist visa regime.
Plans to build world’s biggest Islamic museum alongside other heritage sites
Increase number of Umrah pilgrims from abroad from 6 to 30 million per year (15 million
by 2020).
Healthcare Plans to increase private sector role in healthcare and increase average life expectancy from
74 to 80 years.
Oil and gas Increase share of domestically owned (localized) oil and gas sector output from 40 percent to
75 percent.
Housing Focus on affordable housing and boost home ownership from 47 percent to 52 percent by
2020.
Military Military industry holding company to be created. Boost local participation in defense
production.
Education Curriculum modernization; greater focus on training teachers and measuring performance.
Productivity
To move into top-10 position on Global Competitiveness Index (25th currently).
Raise ranking in Global Logistics Performance Index from 49th place currently to 25th.
Raise ranking within Government Effectiveness Index from 80th currently to 20th.
Immigration policy
Green card-like program for foreign workers within five years.
Visa exemption for expats working in King Abdullah business district.
Aramco
IPO of up to 5 percent equity stake; dual listing likely. Government estimates value of
Aramco at over $2 trillion.
Public Investment Fund (PIF)
SWF to be created to diversify away from oil. PIF assets to be increased from SR600
billion currently to SR7 trillion by 2030.
All targets are for 2030, unless otherwise stated.
Source: Vision 2030 and National Transformation Program.

SAUDI ARABIA
16 INTERNATIONAL MONETARY FUND
Status of Staff Recommendations Made During the 2015 Article IV Consultation
Recommendation Current Status
A sizeable and sustained fiscal
consolidation needs to begin.
Fiscal consolidation began in 2015H2 and continued with the 2016
budget. The authorities have said they will balance the budget, but have
not yet set out a medium-term fiscal consolidation plan to do this.
Strengthen the fiscal policy framework. A macro-fiscal unit has been established within the Ministry of Finance
and a head appointed. Fund TA is being provided to support its
operations. The authorities are aiming to move toward a medium-term
fiscal framework and have introduced key performance indicators for
Ministries.
Comprehensive energy price reforms
are needed.
In the 2016 budget, the government announced its intention to
gradually raise energy and water prices over a 5 year period. A first
round of price increases has been implemented raising prices between
10-134 percent depending on the product.
Strengthen the non-oil revenue base. The government will introduce excise taxes on tobacco and sugary
drinks in 2017 and a VAT in 2018. IMF TA is being provided. A tax on
undeveloped land is being finalized.
Review capital and current
expenditures to better align spending
with policy priorities.
The National Project Management Office has been set up to strengthen
project management. All capital and current spending is being reviewed
and prioritized.
Reduce the government wage bill A review of allowances for government employees is ongoing.
Employment in the civil service fell in 2015 and the NTP targets a
reduction in the government wage bill of 5 percent by 2020.
Issue debt to finance the fiscal deficit
rather than relying solely on asset
draw-downs.
The government issued domestic debt in 2015 for the first time since
2007. An international loan has been finalized in 2016 and a sovereign
bond may be issued later this year. Fund TA is being provided on
establishing a Debt Management Office (DMO).
Strengthen macroprudential policy
framework to mitigate financial sector
risks in a countercyclical way.
The authorities are considering setting up a National Financial Stability
Committee. Early Warning Systems (EWS) have been strengthened. The
countercyclical capital buffers (CCB) framework has been introduced. A
first Financial Stability Report was published in June 2015 and a second
in May 2016.
Introduce reforms to strengthen
financial regulation and supervision.
The domestically systemically important banks (D-SIB) framework has
been published. Identified banks should comply with the higher capital
charges in 2016.
Policies are needed to increase the
employment of Saudis in the private
sector and spur diversification.
The authorities are re-starting their privatization program to reduce the
role of the public sector in the economy. Retail and wholesale sectors
have been opened to 100 percent foreign investment. The authorities
are continuing to develop their labor market strategy, but private sector
employment of Saudi nationals declined in 2015.

SAUDI ARABIA
INTERNATIONAL MONETARY FUND 17
20. Staff welcomed the government’s clear and open communication of the goals of
Vision 2030 and its efforts to increase government transparency. Continued communication as
the specific reforms are announced is important—explaining to the public the costs and benefits of
the reforms will be crucial to their success. The reforms will also need to be seen as equitable, and
the less well-off should be protected to the extent possible from their negative effects. The
authorities explained that their intention is to be very transparent to increase the accountability of
government. Once objectives and targets are set, progress will be regularly monitored via a
dashboard and updates published.
Encouraging private sector-led growth
21. The authorities and staff agreed that the role of the private sector is vital. High oil
prices and government spending increases have been the main engines of growth over the past
decade and have tilted the incentives for nationals toward public sector employment and private
sector production towards non-tradables. Increasing factor inputs boosted real GDP growth, but
productivity suffered. The government is developing plans to encourage private investment, spur
productivity growth, and increase the employment of nationals in the private sector.
22. The government is moving ahead with plans for privatization and greater use of PPPs.
Their aim is to sell two airports and the grain silos corporation this year and they intend to
undertake a broader range of asset sales and PPPs in the coming years, including selling a stake in
Aramco. Staff welcomed this agenda and suggested that the privatization and PPP program should
have a clear timetable, be underpinned by a legal and institutional framework, and take place in a
transparent environment that fosters competition (see Selected Issues paper on “Privatization and
PPPs in Saudi Arabia: Past Experience and the Way Forward”). Given the proposed sale of a stake in
Aramco, staff also thought it would be appropriate to review the tax regime as it applies to the oil
sector to ensure it is in line with international best practices. For PPPs, it will be important that they
are structured to avoid unexpected fiscal costs in the future, and that capacity is built to monitor
their operations and ensure proper service delivery.
23. Staff welcomed the ongoing reforms to strengthen the business environment and
encourage SME development. The recent decision to open fully the retail and wholesale sectors to
foreign investment and the introduction of the new companies’ law—which reduces the
administrative burden on SMEs, strengthens minority shareholder rights, and improves corporate
governance—are steps in the right direction. Work is also continuing on the new insolvency law and
stronger contract enforcement—difficulties resolving insolvencies and uncertainties about contract
enforcement are cited as impediments to doing business (Figure 8). FDI inflows have slowed
substantially in recent years, and a review of FDI policy would be useful. Increasing competition,
particularly in some service sectors, will also be important. The authorities explained that the
contribution of SMEs to GDP in Saudi Arabia is low and they are aiming to increase this over time.
They have set up an SME Authority to oversee all government policies affecting the SME sector, are
working to reduce the legal and administrative burden of setting up a business, and are continuing
with the Kafalah loan-guarantee program.

SAUDI ARABIA
18 INTERNATIONAL MONETARY FUND
24. Further development of the domestic capital markets is a policy priority. The authorities
explained that the recently announced reforms to increase investment opportunities for foreign
investors and facilitate trade and settlement of securities transactions are designed to support
further equity market development. Staff noted that the domestic debt market remains
underdeveloped and companies are very reliant on bank financing. The authorities agreed that
development of the private debt market is important, and the Capital Market Authority (CMA) is
currently reviewing procedures to make it easier for companies to issue debt and is amending
legislation to allow foreign investors to invest in listed domestic bonds. With the government now
issuing domestic debt, there is an opportunity to establish a risk-free yield curve and support the
development of the private debt market (see paragraph 39).
25. The government has made considerable efforts in recent years to encourage the
employment of Saudis in the private sector, but more needs to be done:
Setting expectations about the future availability of public sector jobs. The government
should state clearly that future public sector employment opportunities will be very limited. This
would help set expectations and incentivize greater job search and the acquisition of skills
relevant for the private sector.
Reducing the wage gap between Saudi and expatriate workers. The lack of mobility of
expatriate workers keeps their wages down and makes them more attractive to employers.
Allowing greater mobility of expatriate workers would likely increase their wages over time and
reduce the wage gap between Saudi and expatriate workers. The proposed changes in visa
policies that will delink a worker’s visa from the sponsor should help in this regard. Staff
expressed concerns that proposed reforms to the Nitaqat program—which requires companies
to meet certain employment quotas for nationals that vary by sector and size of company—may
result in a system that is more costly and difficult to implement. They suggested that a simpler
system of higher fees or limits on visas may be more effective, but would need to be phased in
gradually to allow companies time to adjust.
Education reforms and skills development should focus on improving quality. Saudi Arabia
has invested heavily in education, and with most children now attending school, the focus needs
to shift to improving education quality and developing the skills in demand in the private sector.
Increasing female participation is essential. Over 50 percent of university graduates are
women, but the participation rate of female nationals is very low despite the recent increase.
Policies need to improve transportation options, offer telework and other flexible work
arrangements, and ensure adequate childcare facilities.
Fiscal consolidation should continue
26. A sizeable and sustained fiscal consolidation is needed. Achieving the fiscal targets in the
2016 budget is a key first priority, and the authorities noted that data for the first four months of the
year indicated that the budgeted reduction in spending is on track. Spending restraint is being
supported by strict controls on transfers across budget lines, limiting overtime and other wage
allowances, reducing contracted spending, and tighter controls on government employment. An

SAUDI ARABIA
INTERNATIONAL MONETARY FUND 19
unallocated “Budget Support Provision” (22 percent of total spending) was created within the overall
2016 spending envelope to meet priority spending identified during the year. Staff emphasized that
it is essential that spending commitments are controlled and payments not deferred as happened at
the end of 2015.
27. Staff urged the authorities to develop a clear and credible medium-term fiscal
consolidation plan. Vision 2030 sets the broad objective of balancing the budget, and the NTP,
which was released after the mission, sets strategic objectives and 2020 targets for non-oil revenues,
subsidy reforms, and the government wage bill. The government has also laid out cost estimates of
the NTP initiatives that have been approved to start in 2016. These total about 2 percent of GDP a
year from 2016–20. The NTP does not, however, bring the individual revenue and expenditure
targets together in an overall fiscal framework, nor in most cases does it specify the measures that
will be taken to achieve the targets. Taken at face value, the targets in the NTP seem to imply a
much larger fiscal adjustment over the next 5 years than is needed to balance the budget. Staff
believes that too rapid a pace of fiscal adjustment would have significant adverse consequences for
non-oil growth and employment.
28. Staff supported a target of balancing the budget as set out in Vision 2030 and the
NTP. Achieved over the next 5 years (staff adjustment scenario in the text table), this fiscal path
would stabilize the government’s net financial asset-to-GDP ratio at a little above zero and preserve
space to manage future shocks and policy priorities (Figure 9). It would also move the primary
balance toward a level consistent with intergenerational equity (a surplus of 3.7 percent of GDP in
2021) while strengthening the external position. If oil prices were to exceed expectations, the
additional revenues should be saved, while if they were below expectations a determination would
need to be made as to whether the decline was temporary or permanent. If temporary, staff would
support maintaining planned expenditures, but if permanent, some further expenditure adjustment
would be necessary.
29. Fiscal consolidation will have costs for short-run growth, but will deliver stronger
growth over the medium-term (Figure 10). In the adjustment scenario, non-oil growth is expected
to be weaker in 2017–19 than in the baseline, but it recovers more strongly as fiscal consolidation
reduces risk premium and crowding-out effects. Effective sequencing will help moderate the adverse
effects of consolidation. The fiscal measures in 2015 and 2016 will deliver a large upfront reduction
in spending, but it will be important that a balance between revenue increases and expenditure
restraint is delivered in subsequent years. Public investment projects that meet clearly identified
needs are likely to deliver higher economic returns than current spending and should be protected
from expenditure cutbacks. Further, measures should be sequenced to deliver a steady pace of fiscal
consolidation.
30. The authorities and staff agreed that revenue reforms will need to be a central part of
the fiscal adjustment. They are planning to introduce excise taxes on tobacco and sugary drinks in
2017 and a VAT in January 2018. For the VAT, once the broad GCC agreement has been finalized, it
will be up to individual countries to enact their own legislation consistent with the principles of the
agreement. A list of zero-rated or exempted items has been agreed by the GCC (individual countries

SAUDI ARABIA
20 INTERNATIONAL MONETARY FUND
can choose which items are zero-rated/exempted on the list), the rate will initially be 5 percent, and
the turnover threshold has been set at $1 million. To meet the targeted implementation date,
however, the GCC agreement needs to be finalized soon and administrative preparations started.
The revenue impact of the excises and VAT is estimated by staff at about SAR 40 billion. Staff
expressed support for these measures and the “white lands” tax (a 2.5 percent tax on undeveloped
land) which has just been approved by the Cabinet, although they suggested that zero-rating and
exemptions to the VAT should be minimized and cautioned against earmarking revenues from the
“white lands” tax for housing projects. A higher VAT rate should be considered if agreement within
the GCC can be reached and this would be preferable to some of the less efficient fees that are
currently under consideration. As a longer-term objective, an income tax on domestic companies
(foreign companies are already subject to an income tax while domestic companies currently pay
Zakat) and a tax on high-end property could be considered, but the short-term priority should be on
the successful implementation of the excises, VAT, and white lands tax.
Saudi Arabia Baseline and Adjustment Scenarios, 2014–21
(Percent of GDP)
Cumulative
2014 2015 2016 2017 2018 2019 2020 2021 2016-21
Baseline Scenario
Overall balance -3.4 -15.9 -13.0 -9.6 -8.8 -7.0 -6.3 -7.7
Non-oil primary balance 1/
(Percent of non-oil GDP) -64.0 -50.8 -39.3 -36.2 -35.7 -32.6 -32.0 -33.1
Non-oil primary revenue 3.9 4.9 5.9 5.9 7.3 8.0 8.1 8.2
Primary spending 40.2 41.2 35.4 32.3 33.5 31.9 31.7 32.6
(1) Total government debt 1.6 5.0 14.3 20.2 25.1 28.8 32.0 36.1
(2) Government Deposits with SAMA 50.0 43.3 39.4 33.7 28.8 25.2 22.1 18.8
Net government financial assets (2-1) 48.4 38.3 25.1 13.6 3.7 -3.6 -9.9 -17.3
Current account balance 9.8 -8.3 -6.4 -2.7 -1.9 -1.2 -0.7 -0.3
Central Bank gross reserves (in months of imports) 35.4 32.3 27.9 24.4 21.4 18.8 16.6 14.7
Credit to the private sector (percentage change) 11.8 9.2 6.0 5.3 5.9 5.9 5.3 5.2
Real GDP growth (percent) 3.6 3.5 1.2 2.0 2.6 2.6 2.3 2.3
Real oil GDP growth (percent) 2.1 4.0 0.6 1.1 1.2 1.2 1.1 1.1
Real non-oil GDP growth (percent) 4.8 3.1 1.6 2.7 3.6 3.6 3.2 3.1
-12.5 3.0 3.3 0.9 1.8 0.7 -1.4 8.2
13.2 11.4 3.2 0.5 3.1 0.6 -1.0 17.7
Fiscal Adjustment Scenario
Overall balance -3.4 -15.9 -13.0 -8.8 -5.3 -2.2 -0.3 0.0
Non-oil primary balance
(Percent of non-oil GDP) -64.0 -50.8 -39.3 -34.2 -29.7 -24.5 -21.8 -20.4
Non-oil primary revenue 3.9 4.9 5.9 7.2 9.9 11.8 12.9 13.8
Primary spending 40.2 41.2 35.4 32.5 32.2 30.4 29.8 29.8
(1) Total government debt 1.6 5.0 14.3 19.3 21.7 21.9 20.7 19.5
(2) Government Deposits with SAMA 50.0 43.3 39.4 33.2 28.9 26.3 24.5 22.9
Net government financial assets (2-1) 48.4 38.3 25.1 13.9 7.3 4.5 3.7 3.4
Current account balance 9.8 -8.3 -6.4 -2.6 -0.7 1.2 2.7 4.1
Central Bank gross reserves (in months of imports) 35.4 32.3 28.1 25.2 23.4 22.3 21.9 22.3
Credit to the private sector (percentage change) 11.8 9.2 6.0 5.8 6.5 6.9 8.6 8.6
Real GDP growth (percent) 3.6 3.5 1.2 1.3 1.3 1.5 1.5 1.7
Real oil GDP growth (percent) 2.1 4.0 0.6 -0.1 -0.4 -1.0 -1.4 -1.5
Real non-oil GDP growth (percent) 4.8 3.1 1.6 2.4 2.6 3.2 3.5 3.8
Fiscal Adjustment Under the adjustment Scenario
Annual change in overall balance to GDP .. -12.5 3.0 4.2 3.5 3.1 1.9 0.3 15.9
.. 13.2 11.4 5.1 4.5 5.2 2.6 1.4 30.4
Sources: Ministry of Finance; and IMF staff estimates and projections.
Annual change in non-oil primary balance to non-oil GDP
Prel./Est. Proj.
Annual change in non-oil primary balance to non-oil GDP
Annual change in overall balance to GDP
Fiscal Adjustment Under the Baseline:

SAUDI ARABIA
INTERNATIONAL MONETARY FUND 21
Net Fiscal Savings Under the Baseline and Adjustment Scenarios
(SAR billion)
31. Staff welcomed the authorities’ commitment to further increase energy and water
prices. The plan is to gradually raise these prices to international prices/cost recovery levels over
the next 5 years—the government has said that having a compensation mechanism in place for
lower-income households is a prerequisite for further price increases. On the corporate side,
providing support to increase energy efficiency will go some way to offsetting the impact of higher
prices. The net revenue impact of these price increases after compensation is estimated by staff at
about 5 percent of GDP in 2021 (Box 5).
32. Containing the government wage bill is essential. Government spending on wages and
salaries is high by international standards. The
authorities explained that the government has
been restricting new hiring and this resulted in
a net decline in civil service employment last
year. The NTP set an objective of reducing civil
service employment by 20 percent by 2020. It
has also initiated a program that is being
piloted in a number of ministries to improve
human resource practices within government,
including by devolving recruitment decisions.
Staff called for a civil service review to identify
additional savings including through attrition
and reforms of the salary and allowance
structure. The government is also looking for
other current expenditure savings including through a review of procurement processes and the
benchmarking of service costs against best practices.
0
2
4
6
8
10
12
14
16
MENA MENA Oil Exporters GCC Saudi Arabia
Government Expenditures on Wages
(in percent of GDP)
Avg 2000-2010
Avg 2011-2015
Sources: IMF,World Economic Outlook; and IMF staff calculations.
2016 2017 2018 2019 2020 2021
Baseline reforms
Energy price reform 28 29 29 30 30 30
Fees, fines, and tax collection improvement 6 11 17 22 28
VAT 35 53 56 59
Excise tax 6 5 5 5 5
Increase in spending on VAT 13 -20 -21 -22
Total 28 40 94 85 92 100
Additional reforms under the adjustment scenario
Energy price reform 1/ 2/ 35 78 125 168 208
Wage control 1/ 1 15 19 25 36
Household compensation -22 -31 -43 -55 -65
Capital spending control 1/ 5 34 42 51 60
Other 3/ -3 -5 -5 -3 14
Total 1/ 16 91 138 187 253
Grand total (baseline and adjustment) 28 56 185 223 279 352
Memo item:
Annual savings from additional reforms as a percent of GDP 4/ 0.6 2.6 1.5 1.5 1.8
Sources: Ministry of Finance; and IMF staff estimates and projections.
1 / In addition to the baseline.
2/ Net gains after accounting for long-term energy contracts with private firms, government's own energy
consumption and government support to companies to adjust to higher energy prices, estimated at
SR 104.6 billion by 2021.
3/ Includes changes in interest payments, investment income and fees and charges and
other automatic changes associated with changes in inflation and GDP growth.
4/ Using GDP under adjustment scenario.

SAUDI ARABIA
22 INTERNATIONAL MONETARY FUND
Box 5. Energy and Water Price Reforms: What Has Happened and What’s Next?
In December 2015, the authorities announced an increase in prices across most major energy and water
products without compensation to businesses or households (Table 1). These price increases are expected
to generate revenues of SR 28 billion ($7.5 billion) for
Aramco in 2016 and will be reflected as higher revenues
for the government (Table 2). Electricity and water tariffs
were either raised or made applicable to lower
consumption users, with the estimated revenue gains
from these tariff increases expected to offset the higher
fuel input cost of the producers.
In the 2016 budget, the government indicated that
energy and water prices could be raised gradually
over the next 5 years, while “minimizing negative
effects on low and mid-income households and
business competitiveness”. Staff estimates suggest that
increasing energy and water prices to international /cost
recovery levels over a 5-year period would generate
additional gross revenue gains by end-2021 of
SR 314 billion or about 10 percent of GDP (Table 2).
To ensure the success and sustainability of the price
increases, the following issues need to be resolved:
A clear and transparent mechanism to compensate
households. The authorities are developing
“household accounts” through which compensation
will be paid. While targeted transfers to low-income
households are preferable, a universal compensation
mechanism targeted at a level that only fully
compensates low-income households could be
considered if it eases the implementation of the
reforms.
A far-reaching communication campaign is
essential to help generate broad political and public
support, and should be undertaken throughout the
reform process. The information campaign should
explain the rational, objectives, and benefits of the
reform, and inform the public of the pace of price
increase and the compensating measures.
Establishing an automatic pricing formula, once
prices reach market/cost recovery levels, will distance
the government from the pricing of energy products,
thus reducing the chances of reform reversal, and
ensure that changes in international prices are reflects
in domestic prices. Oman and UAE have already
introduced automatic pricing formula.
Strengthening operational efficiency of energy
producing State Owned Enterprises (SOEs) would
help them remain profitable at higher input costs.
Gasoline 2.6 17.8Diesel (Gas oil) 1.7 36.1LPG
Public 0.04 1.1Oil Industry 0.01 0.4Fuel Oil
Public 0.23 18.4Oil Industry 0.02 1.9
Asphalt 0.06 0.3Jet Fuel 0.28 2.1Natural GasPublic 2.2 4.6Oil Industry 0.5 1.0
Total/ Gross revenue gains (US$) 7.5 83.8
Gross revenue gains (SR) 28.3 314.3
Household: Cash transfers
Wealth sharing (per capita) 37.1
Social protection (based on
household size and targeted)28.3
Non-Households: Mitigating
measures/offsetting factors 1/ 104.6
Net revenue gains (SR) 28.3 144.3
Source: IMF staff estimates.
in US$ billion
1/. Offsetting factors for non-households takes into account
that firms with long-term energy supply contracts will
continue to receive low prices, government's own energy
consumption and government support to companies to adjust
to higher energy prices.
Table 2. Saudi Arabia: Revenue Gains from
Energy price reform by 2021
2016 2017-2021
Table 1. Increases in Saudi Domestic Price of Energy Products
Old Domestic
prices
New Domestic
prices
Change
in pricesUS$ per unit 1/ US$ per unit 1/ Percent
Gasoline95 octane 0.16 0.24 50%
91 octane 0.12 0.20 67%
Diesel
Transportation sector 0.07 0.12 80%
Industrial sector 0.07 0.09 32%
Natural GasMethane 0.75 1.25 67%
Ethane 0.75 1.75 134%
Fuel Oil 0.01 0.02 83%
ALCO 0.03 0.04 50%
Butane 0.15 0.17 14%
Jet A-1 0.07 0.15 120%
JP-8 0.07 0.16 120%
Kerosene 0.11 0.16 53%
Natural Gasoline 0.22 0.24 10%
Propane 0.13 0.14 11%
Sources: Country authorities and IMF staff calculations.
1/. Energy products are measured in l iters for all energy products, except for
natural gas which is measured in mmbtu.

SAUDI ARABIA
INTERNATIONAL MONETARY FUND 23
33. The government is strengthening the management of public investment. The National
Project Management Office (NPMO) was
recently established to take the lead role in
improving project management standards
across ministries, and the project approval
process has been strengthened which
should result in more targeted and efficient
spending. Staff noted that despite the
sharp cutbacks in 2015 and 2016, capital
spending remains high by international
standards and they welcomed the steps the
authorities are taking to strengthen public
investment management.
34. More broadly, the authorities explained that one of the central goals of their reform
plan is to improve the efficiency, accountability and transparency of government spending.
They saw this as being essential in supporting the broader reforms that are being undertaken. To
this end, a performance management program has been introduced for ministries. Key performance
indicators (KPIs) have been established, including through the NTP, and will be reported to and
monitored by the recently established performance management agency.
35. Staff stressed that reforms to the fiscal framework would need to be an integral part
of the fiscal adjustment process to reduce implementation risks. The priorities should be to
develop a medium-term fiscal framework, strengthen the annual budget process, and increase
transparency and accountability. The fiscal framework should include fiscal targets to guide the
medium-term adjustment, and a formal fiscal rule could eventually be considered to support the
accumulation of substantial financial buffers during periods of high oil prices and delink
expenditures from oil revenue volatility. The framework should also assess risks to the fiscal outlook,
including from the future pension commitments of PPA and GOSI. Staff believes that a review of the
public expenditure management system should be undertaken to ensure that the deferred
payments to contractors are not repeated, and suggested that while the “budget support provision”
may help in facilitating adjustment in 2016, it is not consistent with effective budgeting over the
medium-term. The authorities saw the establishment of a macro-fiscal unit and the appointment of
the unit head as important steps in strengthening their macro-fiscal analysis.
36. Staff emphasized the importance of improving fiscal transparency and better
integrating key public entities into the budget. While welcoming the recent move to GFSM2014
format for the 2016 fiscal data, staff emphasized that fiscal transparency is lagging compared to
other G-20 countries. The 2016 budget published more details about revenues and expenditures
than previous years, but still did not provide full information about the 2015 outturn or 2016
budgeted revenues and expenditures. A step toward enhancing fiscal transparency would be to start
publishing full details of annual budgeted revenues and expenditures and within-year quarterly
fiscal updates on budget execution. The Public Investment Fund (PIF) and Aramco should be better
integrated in the fiscal framework and their operations made more transparent. The government
BHR
KWT
OMN
QAT
SAU
UAE
CAN
AUS IDN
NOR
CHL
RUS
AZE
IRN
DZA
MYSKAZ PER
0
2
4
6
8
10
12
14
16
18
0 20 40 60 80 100 120
Ca
pit
al E
xpe
nd
itu
re
(Avg
. 2
01
0-1
4, P
erc
en
t o
f G
DP
)
Infrastructure Quality Ranking
Infrastructure Quality Rankings and Capital Expenditure
Sources: IMF staff calculations; WEF Global Competitiveness Report 2015-16
Note: Infrastructure quality rankings among 140 countries; lower number
indicates higher quality/ranking.

SAUDI ARABIA
24 INTERNATIONAL MONETARY FUND
should clarify the rules and the level of transfers between the budget and the PIF, and it should
receive its share of oil revenues from Aramco and then make transparent payments for expenditures
carried out by Aramco on its behalf. These steps to increase fiscal transparency will be needed to
effectively monitor progress toward the NTP objectives.
Asset-liability management and budget financing
37. The government is continuing to assess its options for financing the fiscal deficit. The
authorities have finalized a $10 billion loan from international banks and they are now considering
issuing a sovereign bond. Domestically, they are continuing to issue bonds to banks and non-bank
institutions, and have expanded issuance beyond fixed rate instruments to include floating rate
notes and murabaha (a common form of Islamic financing). Staff indicated that the choice of fiscal
financing strategy will have important implications for the domestic economy and the financial
sector. In particular, relying on a combination of asset drawdown and domestic and external
borrowing is likely to best strike a balance between addressing risk/return tradeoffs and minimizing
the macro-fiscal-financial implications of domestic debt issuance on credit provision in an
environment of more difficult bank funding conditions (Selected Issues paper on “Financing the
Fiscal Deficit—Possible Options and Their Potential Implications”).
38. The authorities are setting up a Debt Management Office (DMO) within the Ministry of
Finance. Staff urged the authorities to quickly make the DMO operational and start developing a
medium-term debt management strategy (MTDS) to guide the government’s borrowing program.
In staff’s view, the debt issuance program should encourage the development of a deep and liquid
domestic debt market, including for the private sector. Improving communication with the market,
including by announcing an issuance calendar in advance, and developing a secondary market for
government securities will help in this regard. Staff encouraged the authorities to introduce auctions
for government debt whereby yields are market determined and better reflect market liquidity
conditions.
39. Saudi Arabia needs to develop an integrated approach to managing its balance sheet.
Without looking at both sides of the balance sheet, mismatches in assets and liabilities might pose
undue risks, while there will always be trade-offs between incurring debt and selling assets. The
authorities noted that they are taking steps to clarify asset management responsibilities. The PIF’s
mandate is being changed towards a more typical sovereign wealth fund, with a longer-term
horizon and higher risk tolerance level, and focused only on returns rather than development
objectives. SAMA will continue to manage gross reserves which are held more for precautionary
purposes.
B. External and Financial Sector Policies
External adjustment will depend on fiscal policy
40. The external position weakened substantially in 2015, more than suggested by
fundamentals and desirable medium-term policy settings. Substantial fiscal adjustment—

SAUDI ARABIA
INTERNATIONAL MONETARY FUND 25
consistent with the staff’s fiscal adjustment scenario and the government’s objective of balancing
the budget—will be necessary over the medium-term to reduce the current account deficit, stem the
loss of reserves, and support the exchange rate peg (Appendices II and III).
41. As long as a credible fiscal adjustment is in place, staff agreed with the authorities that
the exchange rate peg remains the best option for Saudi Arabia. The international investment
position (IIP) position is very strong and reserves remain comfortable according to standard Fund
metrics (32 months of imports, 129 percent
of broad money and 700 percent of the
Fund’s reserve metric at end-2015). The
potential benefits of moving away from
the peg do not outweigh the potential
costs. Depreciation would boost fiscal
revenues in riyal terms and support fiscal
adjustment if nominal expenditures were
not raised in the face of higher inflation,
could support the development of the
non-oil tradable sector, and would enable
a more independent interest rate policy.
However, depreciation would entail
significant risks given the longstanding anchor provided by the peg, increase uncertainty with
potentially wider implications for the region, and would have very limited benefits for
competitiveness. Most exports are oil or oil-related products and the substitutability between
imports and domestically-produced products, which in turn have significant labor and intermediate
input content, is limited. Further, maintaining unchanged nominal expenditures following
a depreciation would be difficult as the cut in real public sector wages could result in social
pressures. In addition, it would be undesirable to have a large upfront and across-the-board cut in
real spending that an exchange rate depreciation would entail when the large fiscal buffers allow for
a smoother and better-targeted adjustment through fiscal policy.
42. Nevertheless, the peg should be reviewed periodically in coordination with other GCC
countries. This will ensure it remains appropriate given the desired evolution of the economy to
develop a greater role for the tradable sector. Meanwhile, reforms that would support a move to a
more flexible regime, if this became appropriate in the future, would be desirable (including in
liquidity management and debt and money market development).
Financial sector reforms should continue
43. The banking sector remains strong, although it is being affected by lower oil prices
(Table 7). Profitability growth has slowed and is expected to slow further as economic growth
weakens and provisioning increases. NPLs are likely to rise (although from a low level of 1.2 percent),
but banks are well-positioned to absorb losses using their provisions and capital ratios should
remain around current levels. Staff expressed concern about the rapid growth in credit to the
construction sector (8 percent of bank credit). SAMA responded that much of this increase was due
0
200
400
600
800
1000
0
200
400
600
800
1000
3 Months Imports Greenspan-Guidotti 2/
Broad Money Fund ARA Metric
Reserve Coverage in Saudi Arabia and Emerging Markets, 2015
(Percent)
1/ Excludes top three values
2/ Excludes negative values
Source: Country authorities and IMF staff estimates.
Top 1/
Median
Saudi (2015)
Interquartile
Range
Saudi (2021)

SAUDI ARABIA
26 INTERNATIONAL MONETARY FUND
to liquidity-constrained construction companies drawing on existing credit lines as they waited for
delayed government payments and was expected to slow as these payments are made. The Liquidity
Coverage ratio (LCR) is high and banks are in a strong position to manage a decline in deposits.
44. Tightening liquidity conditions put a premium on strengthening liquidity forecasting
and liquidity management operations. Three-month SIBOR has risen above 2 percent and spreads
to U.S. LIBOR have widened as banks have competed more aggressively for deposits, raising their
funding costs. At the current pace of drawdown, bank excess liquidity will be depleted within 2 to 3
quarters. If liquidity pressures are a source of banking sector stress, easing reserve requirements
would be appropriate, but reserve requirements are too inflexible a tool for effective daily liquidity
management while the standing facility is a passive instrument. Staff therefore suggested that SAMA
review its liquidity forecasting framework and its tools for day-to-day liquidity management. SAMA
responded that to ease liquidity pressures they could if necessary place government institution
deposits with individual banks as they have done in the past. In considering liquidity provision to the
market, consideration will need to be given to the impact this could have on financial outflows.
45. Banks generally appear able to absorb further negative shocks to asset quality and
liquidity. Rising interest rates and weaker profits will adversely affect corporates, but most sectors
are well-positioned to manage such developments (see Appendix I). While NPLs would rise further
if non-oil growth were to weaken more than in the baseline, high bank capital ratios provide a
substantial cushion against these losses (Appendix IV). SAMA is continuing to regularly monitor
and assess bank capital and liquidity, including by using stress tests to assess the impact of slowing
growth and rising interest rates on banks. SAMA noted that their stress tests—which were published
in the 2016 Financial Stability Report—show less deterioration in asset quality than the staff’s, but
nevertheless they are working continuously with banks to analyze and mitigate risks as they emerge.
If this analysis were to show that capital or liquidity of a bank may decline below regulator minima,
plans should be put in place to strengthen these buffers proactively.
46. Strengthening the macroprudential framework will further support financial stability.
Staff called for the National Financial Stability Committee (NFSC) to be made operational to
formalize ongoing coordination between SAMA, the Capital Markets Authority (CMA), and the MoF.
They also suggested that the Specialized Credit Institutions (SCIs) be considered in macroprudential
policy deliberations given some overlaps with banks. SAMA noted that the publication of the annual
Financial Stability Report has increased the transparency of its macroprudential policies.
47. Within a strong and transparent framework, staff suggested that the authorities could
make greater use of countercyclical macroprudential policies to manage systemic risks if they
emerge. Reserve requirements, capital, and provisioning ratios have moved countercyclically in the
past, although for the latter two this seems to have been an outcome of the supervisory process
with individual banks rather than macroprudential policy decisions. Within a macroprudential
framework, a relaxation of policies will need to be based on the careful monitoring of indicators of
risks to financial stability and an assessment that systemic risk has materialized and financial
conditions have tightened, seriously affecting activity. It will also depend on available policy space
and sources of systemic risks. A countercyclical capital buffers (CCB) framework is now in place.

SAUDI ARABIA
INTERNATIONAL MONETARY FUND 27
SAMA has recently relaxed the loan-to-deposit ratio to 90 percent (from 85 percent) to prevent a
sharp across-the-board credit squeeze given the decline in deposits, but staff stressed that it is
important that this additional room is not used to extend credit to weak companies.
48. SAMA is continuing to strengthen its regulation and supervision of banks. It has
implemented the Basel III risk-based capital regulations, and its prudential regulations are compliant
with the standards prescribed under the Basel framework. An aggregate large exposure limit of
400 percent of capital has been introduced, and single borrower exposure limits are being reduced
from 25 percent of capital to 15 percent by 2019. Capital surcharges for Domestic-Systemically
Important Banks (D-SIB) are being introduced in 2016 in line with the previously announced
framework. The crisis management framework is also being strengthened. A deposit insurance
scheme has been introduced (funded by levies on banks and will protect deposits up to SAR
200,000), a draft of the bank resolution framework legislation is being discussed, and a framework
for emergency liquidity provision is being designed and tested by SAMA. SAMA has been working
with Saudi banks to manage the implications of de-risking. While Saudi banks have a comfortable
number of correspondent banking relationships, SAMA is nevertheless concerned about the
potential for the withdrawal of correspondent banking relationships to adversely affect Saudi banks.
They have therefore been active in bringing domestic banks together with major foreign banks and
regulators to make sure they are clear about home supervisor requirements and ensure that
channels of communication are open. On shadow-banking, when defined as being outside the
regulatory perimeter, this is relatively small in Saudi Arabia. Overall, good progress has been made
in implementing the recommendations of the 2011 FSAP Update (see Appendix V) and an FSAP
Update has been requested by the authorities for 2017.
49. The authorities updated staff on their work to strengthen the effectiveness of the
AML/CFT regime. They are working to finalize the money laundering and terrorist financing
national risk assessment and communicate its results, and enhance national coordination between
concerned agencies. Saudi Arabia’s AML/CFT regime is expected to be assessed in late 2017 for
compliance with the revised international standards, and thereafter, the FATF will deliberate on the
country’s application for full membership.
Statistical Issues
50. Efforts are continuing to strengthen economic statistics, but important gaps remain.
Staff stressed that good statistics are essential to support policymaking, and are particularly
important in areas where Vision 2030 has set goals that will need to be monitored. The authorities
agreed, and noted that fiscal data for 2016 is being prepared in GFSM2014 format and that they are
working on the FDI, external debt, and real estate price data (see informational annex for details).
Staff suggested that fiscal data for 2015 at least should be made available in GFSM2014 format to
allow an adequate assessment of fiscal policy developments.

SAUDI ARABIA
28 INTERNATIONAL MONETARY FUND
STAFF APPRAISAL
51. The decline in oil prices is affecting the Saudi Arabian economy. Activity in the non-oil
sector is slowing, equity prices and corporate profits have fallen, and real GDP growth is expected to
moderate to 1.2 percent this year, from 3.5 percent in 2015, before recovering to 2.3-2.6 percent
over the medium-term. The fiscal and current account balances have moved into large deficits, and
bank deposits are declining (although credit growth has remained strong). Nevertheless, the fiscal
and financial buffers that were built-up over the past decade have helped cushion the impact on the
economy and provided time for the government to develop its policy response. Upside risks to the
growth outlook include the possibility of higher oil prices and a stronger impact of structural
reforms on growth, while lower oil prices or the failure to implement needed fiscal adjustment
present downside risks.
52. Saudi Arabia has now begun a fundamental policy shift to respond to low oil prices
with Vision 2030 announcing an ambitious plan to transform the economy over the next
15 years. The goals and objectives in Vision 2030 and the NTP are bold and far-reaching. Full details
of how the goals will be achieved have not been released, and it will be important that the
authorities clearly lay out, prioritize, and sequence the policy measures that will help achieve these
goals and objectives to reduce the risk of implementation bottlenecks and limit the possibility of
reform fatigue. With fiscal reforms likely to have a negative short-term effect on growth and
employment, accompanying growth-enhancing structural reforms will be needed.
53. Increasing the role of the private sector in the economy will be important to spur
growth, productivity, and diversification. The government’s focus on privatization and PPPs will
reduce the footprint of the government in the economy and should lead to productivity gains in key
sectors over time. The success of the privatization program will depend on establishing a clear
timetable, developing the required legal and institutional framework, ensuring a transparent sales
process, and ensuring sufficient competition in the post-privatization market. Given the proposed
sale of a stake in Aramco, now is an opportune time to review the tax regime as it applies to the oil
sector to ensure it is in line with international best practices. Reforms to strengthen the business
environment, encourage foreign direct investment, support the development of the SME sector, and
deepen the domestic capital markets are also important.
54. Continued labor market reforms are needed to encourage the employment of
nationals in the private sector. With fiscal consolidation affecting growth and the availability of
public sector jobs, the challenge of generating employment for the growing number of young
Saudis is significant. Policies will need to clearly set expectations about the future availability of
public sector jobs, increase the competitiveness of Saudi nationals in the private sector, and
strengthen education and training programs so nationals acquire the skills needed for private sector
jobs. Proposed changes to Nitaqat may make the program more difficult and costly to implement.
Reducing barriers to female participation is important to better integrate these educated and skilled
workers into the labor force.

SAUDI ARABIA
INTERNATIONAL MONETARY FUND 29
55. A gradual, but sizable and sustained further fiscal consolidation is needed. The 2016
budget makes a good start and a key priority is to achieve the targets set therein. Vision 2030 sets
the goal of balancing the budget, and a credible medium-term fiscal consolidation plan consistent
with achieving this objective in the coming years should be developed. The consolidation should be
based on both revenue and expenditure measures including a gradual increase in energy prices, the
introduction of the VAT and excises, firm control of the government wage bill, and further reforms
to enhance public investment efficiency. Regarding the VAT, the GCC agreement should be finalized
as soon as possible and administrative preparations need to start. It is important, however, that the
fiscal measures introduced are calibrated to achieve the government’s overall fiscal objectives—an
excessively rapid tightening of fiscal policy would damage growth and employment prospects.
56. A stronger fiscal framework should be an integral part of the fiscal adjustment.
Developing a medium-term fiscal framework, strengthening the annual budget process, and
enhancing fiscal transparency and accountability are priorities. The establishment of the macro-
fiscal unit and developing a fiscal rule would help improve macro-fiscal analysis and guide fiscal
adjustment. A public expenditure management review should also be undertaken to ensure that
spending commitments are controlled and payments are not deferred as happened last year. Given
their size and importance, Aramco and the PIF should be better integrated into the budget. Fiscal
transparency should be improved by publishing full details of budgeted revenues and expenditures
and budget outcomes, and providing regular quarterly updates on budget execution.
57. The financing of the fiscal deficit needs to be considered within an integrated asset-
liability management strategy. The decision whether to draw down assets or issue domestic or
external debt needs to be carefully assessed to avoid undue risks and costs to the budget and to
minimize the risks of crowding-out credit to the private which would have a negative effect on
economic activity. Government debt issuance provides an opportunity to develop the domestic debt
market. Introducing auctions for government debt and developing a secondary market would help
establish a risk-free yield curve and support the development of the corporate debt market.
58. As long as a credible fiscal adjustment is in place, the exchange rate peg remains the
best option for Saudi Arabia given the structure of its economy. The peg has served Saudi
Arabia well and the potential costs of moving away from the peg outweigh the possible benefits.
The peg should, however, be reviewed periodically in coordination with other GCC countries to
ensure it remains appropriate given the desired evolution of the economy away from its current
reliance on oil.
59. The banking sector is well positioned to absorb the effects of lower oil prices and
fiscal consolidation. Capital buffers are strong, NPLs low, and banks are well provisioned against
loan losses. While NPLs are likely to rise, banks have sufficient buffers to comfortably absorb these
losses, but SAMA should still continue to monitor credit quality closely, particularly in the
construction sector. Liquidity conditions have tightened. SAMA can ease reserve requirements as
needed, and should also develop a robust liquidity forecasting and management framework to
manage day-to-day liquidity.

SAUDI ARABIA
30 INTERNATIONAL MONETARY FUND
60. The macroprudential framework would be strengthened by operationalizing the
National Financial Stability Committee (NFSC). This would formalize coordination across the key
stakeholders. The SCIs should be included in macroprudential decisions given their overlaps with
banks in some areas and their size and influence on the domestic financial system. Within a
macroprudential framework, the relaxation of policy tools will be guided by the results of the careful
monitoring of risk indicators to financial stability and triggered by the assessment that systemic risk
has materialized and financial conditions have tightened, seriously affecting activity.
61. Further progress is needed to improve economic statistics. The move to GFSM2014 is
welcome, but further work is needed, particularly in the areas of fiscal, external, monetary, real
estate, and labor market statistics. The objective of subscribing to SDDS should be announced as
soon as possible.
62. It is recommended that the next Article IV consultation take place on the standard
12-month cycle.

SAUDI ARABIA
INTERNATIONAL MONETARY FUND 31
Figure 1. Real Sector Developments
Sources: Country authorities; Haver; Markit; World Steel Association; and IMF staff calculations.
-10
-5
0
5
10
15
20
2007 2008 2009 2010 2011 2012 2013 2014 2015
Contribution to Real GDP Growth
(Percent)
Public consumption Private consumption
Public investment Private investment
Change in stocks Net exports
GDP
-6
-4
-2
0
2
4
6
8
10
12
2008 2009 2010 2011 2012 2013 2014 2015
Oil
Non-oil: private
Non-oil: public
GDP growth
Contribution to Real GDP Growth
(Percent)
50
55
60
65
70
75
Jan-1
1
May-
11
Sep
-11
Jan-1
2
May-
12
Sep
-12
Jan-1
3
May-
13
Sep
-13
Jan-1
4
May-
14
Sep
-14
Jan-1
5
May-
15
Sep
-15
Jan-1
6
May-
16
Purchasing Managers' Index
New Orders
Business Conditions
(Index)
-10
0
10
20
30
40
50
2011-J
an
2011
-May
2011
-Sep
20
12-J
an
2012-M
ay
2012-S
ep
2013-J
an
2013
-May
2013
-Sep
2014-J
an
2014-M
ay
2014-S
ep
20
15-J
an
2015
-May
2015
-Sep
2016-J
an
Transaction growth
ATM withdrawals growth
Indicators of Consumer Spending
(3 month moving average, y-o-y percent change)
-10
-5
0
5
10
15
20
25
Ma
r-1
1
Se
p-1
1
Ma
r-1
2
Se
p-1
2
Ma
r-1
3
Se
p-1
3
Ma
r-1
4
Se
p-1
4
Ma
r-1
5
Se
p-1
5
Oil
Non-oil
Overall GDP
Real GDP Growth
(y-o-y percent change)
-2
0
2
4
6
8
10
Petr
och
em
.
Real E
state
Dev.
Ag
ricu
ltu
re &
Fo
od
Cem
ent
Tele
com
s
Reta
il
Ind
ust
rials
Tra
nsp
ort
Energ
y &
Uti
lities
Bu
ild
ing
& …
Ho
tel &
To
uri
sm
Mult
i-in
vest
ment
Med
ia &
Pub
lish
ing
2014 2015
Net Incomes of Listed Saudi Corporates by Sector
(US$ billion)

SAUDI ARABIA
32 INTERNATIONAL MONETARY FUND
Figure 2. Oil Market Developments
Sources: Jonit Oil Data Initiative (JODI); Bloomberg; International Energy Agency (IEA); Baker Hughes; Energy
consensus forecast; and IMF staff calculations.
1/ Time T correponds to the month of oil price peak in each episodes.
2/ Derived from prices of futures options on May 31, 2016.
0
2
4
6
8
10
12
Jan
-11
May-
11
Sep
-11
Jan-1
2
May-
12
Sep
-12
Jan-1
3
May-
13
Sep
-13
Jan
-14
May-
14
Sep
-14
Jan-1
5
May-
15
Sep
-15
Jan-1
6
Exports:Crude Oil Exports:Refined products
Oil production
Oil Production and Exports
(Million barrels per day)
0
200
400
600
800
1000
1200
1400
1600
Jun-1
2
Oct
-12
Feb
-13
Jun-1
3
Oct
-13
Feb
-14
Jun-1
4
Oct
-14
Feb
-15
Jun-1
5
Oct
-15
Feb
-16
Saudi Arabia
Middle East
Global
Indicator of Oil Investment
(BHI International Rig Counts)
0
10
20
30
40
50
60
70
80
Mar-
15
Jul-
15
No
v-15
Mar-
16
Jul-
16
No
v-16
Mar-
17
Jul-
17
No
v-17
Mar-
18
HistoricalConsensus ForecastsHighLow
Consensus Oil Price Forecasts
(Brent Crude Oil Forecasts, US$/barrel)
0
2
4
6
8
10
12
T-36 T T+36
1981-1986
1998-1999
2008-2009
2014-2016
Oil Production in Periods of Falling Oil Prices 1/
(Monthly Crude Oil Production, mbd)
0
2
4
6
8
10
12
Jan-1
1
May-
11
Sep
-11
Jan-1
2
May-
12
Sep
-12
Jan-1
3
May-
13
Sep
-13
Jan-1
4
May-
14
Sep
-14
Jan-1
5
May-
15
Sep
-15
Jan-1
6
Russia
Saudi Arabia
US
Iran
Iraq
Out put of Major Oil Producers
(Million barrels per day)
0
20
40
60
80
100
120
140
160
14 15 16 17 18 19 20
Brent Crude Oil 2/
(U.S. dollars a barrel)
95% confidence interval
86% confidence interval
68% confidence interval
Futures

SAUDI ARABIA
INTERNATIONAL MONETARY FUND 33
Figure 3. Fiscal Developments
Sources: Country authorities; and IMF staff calculations.
1Real expenditures are deflated by the CPI.
2Structural revenues are estimated by assuming that the long-term oil price is the average oil price from past five
years. Long-term oil output is computed as a three year moving average including the current year. The
structural balance is then computed as structural revenues less total expenditures.
3The sustainable level of fiscal spending from the oil wealth is defined as an annuity constant in real per capita
terms. The shaded area represents the sustainable level of fiscal spending conditional on oil prices remaining
-20
-15
-10
-5
0
5
10
15
2010 2011 2012 2013 2014 2015 2016
Fiscal Balance
(Percent of GDP)
Projected
Bahrain
Kuwait
Oman
Qatar
Saudi
Arabia
U.A.E.
0
20
40
60
80
100
120
140
0 20 40 60 80 100 120
Fisc
al B
ala
nce
External Balance
2014
2015
Break-even Oil Prices
(U.S. dollars per barrel)
Average crude
price in 2015:
$51
-20
-15
-10
-5
0
5
10
15
20
25
0
20
40
60
80
100
2010 2011 2012 2013 2014 2015 2016
Non-oil deficit (% non-oil GDP)
Real government spending growth (RHS)
Real Government Spending 1/
(Percent)
Projected
0
2
4
6
8
10
12
0
2
4
6
8
10
12
2010 2011 2012 2013 2014 2015 2016
Non-oil Revenue
(Percent)
Non-oil Revenue (% of non-oil GDP)
Projected
-20
-10
0
10
20
30
40
2007 2009 2011 2013 2015 2017 2019 2021
Overall balance (% GDP)
Structural balance (% non-oil GDP)
Structural and Overall Fiscal Balance 2/
Projected

SAUDI ARABIA
34 INTERNATIONAL MONETARY FUND
Figure 4. External Sector Developments
Sources: Haver; ICIS; and IMF staff calculations.
0
50
100
150
200
250
300
350
400
0
20
40
60
80
100
120
140
Jan-1
0M
ay-
10
Sep
-10
Jan-1
1M
ay-
11
Sep
-11
Jan-1
2M
ay-
12
Sep
-12
Jan-1
3M
ay-
13
Sep
-13
Jan-1
4M
ay-
14
Sep
-14
Jan-1
5M
ay-
15
Sep
-15
Jan-1
6M
ay-
16
Spot Crude Price: Dubai
($/BBL,DOE)
Petrochemical Price Index (RHS)
Oil and Petrochemical Prices
-400
0
400
800
1,200
1,600
2009 2010 2011 2012 2013 2014 2015
International Investment Position
(US$ billion)
Liab: Other Investment Liab: Port. Investment
Liab: FDI in SAU Asset: Reserves
Asset: Other Investment Asset: Port. Investment
Asset: FDI Abroad Net IIP
-20
-10
0
10
20
30
40
50
60
2007 2008 2009 2010 2011 2012 2013 2014 2015
other Re-exports
Machinery & Electrical Metal Products
Plastic products Petrochemicals
Foodstuff Total
Contribution to Non-oil Export Growth
(Percent)
-20
-10
0
10
20
30
40
50
60
2007 2008 2009 2010 2011 2012 2013 2014 2015
Machinery and Equipment Transportation
Base metals Chemical products
Agricultural products Plastic products
Mineral products Others
Total imports
Contribution to Import Growth
(Percent)

SAUDI ARABIA
INTERNATIONAL MONETARY FUND 35
Figure 5. Monetary and Financial Developments
Sources: Haver; Reuters; and IMF staff calculations.
-5
5
15
25
35
45
2007Q
1
2007Q
3
2008Q
1
2008Q
3
2009Q
1
2009Q
3
2010Q
1
2010Q
3
2011Q
1
2011Q
3
2012Q
1
2012Q
3
2013Q
1
2013Q
3
2014Q
1
2014Q
3
2015Q
1
2015Q
3
SCI credit growth
Bank credit to private sector
growth
Total credit growth
Credit Growth
(y-o-y percent change)
-15
-10
-5
0
5
10
15
20
2010Q
1
2010Q
3
2011Q
1
2011Q
3
2012Q
1
2012Q
3
2013Q
1
2013Q
3
2014Q
1
2014Q
3
2015Q
1
2015Q
3
2016Q
1
Other (incl Agriculture) Services
Govt & Quasi Govt Consumer loans
Finance Transportation
Commerce Building and Construction
Manufacturing/Processing/Mining
Sectoral Decomposition of Credit Growth
(Percent)
0
2
4
6
8
10
12
14
16
0
5
10
15
20
25
30
35
40
2010Q
1
2010Q
3
2011Q
1
2011Q
3
2012Q
1
2012Q
3
2013Q
1
2013Q
3
2014Q
1
2014Q
3
2015Q
1
2015Q
3
2016Q
1Real Estate Loans Growth
(y-o-y percent change)
Real Estate Loan Growth (y-o-y
percent change)Share of Total Lending to Private
Sector (RHS)
0
2
4
6
8
10
12
14
16
18
Jan-1
0
May-
10
Sep
-10
Jan-1
1
May-
11
Sep
-11
Jan-1
2
May-
12
Sep
-12
Jan-1
3
May-
13
Sep
-13
Jan-1
4
May-
14
Sep
-14
Jan-1
5
May-
15
Sep
-15
Jan-1
6
Excess Liquidity in Banking Sector
(Percent of bank assets)
70
75
80
85
90
-5
0
5
10
15
20
Jan-1
0
May-
10
Sep
-10
Jan-1
1
May-
11
Sep
-11
Jan-1
2
May-
12
Sep
-12
Jan-1
3
May-
13
Sep
-13
Jan-1
4
May-
14
Sep
-14
Jan-1
5
May-
15
Sep
-15
Jan-1
6
Loan to Deposit Ratio (RHS)
Growth
Commercial Bank Deposits
(y-o-y percent change)
0.0
0.5
1.0
1.5
2.0
2.5
Jan
-10
May-
10
Sep
-10
Jan
-11
May-
11
Sep
-11
Jan
-12
May-
12
Sep
-12
Jan
-13
May-
13
Sep
-13
Jan
-14
May-
14
Sep
-14
Jan
-15
May-
15
Sep
-15
Jan
-16
May-
16
Policy and Interbank Interest Rates
(Percent, daily closing rates)
Repo Rate
3-month SIBOR
Reverse Repo Rate

SAUDI ARABIA
36 INTERNATIONAL MONETARY FUND
Figure 6. Labor Market Developments
Sources: Country authorities; Haver; IMF staff calculations.
0
5
10
15
20
25
30
35
40
2000 2002 2004 2006 2008 2010 2012 2014
Male Female Total
Unemployment Rate of Nationals by Gender
(Percent of total labor force for each gender)
0
10
20
30
40
50
60
70
80
90
100
0
2
4
6
8
10
12
14
2000 2002 2004 2006 2008 2010 2012 2014
Total
Saudis
Growth Rate of Employment in Saudi Arabia
(Annual percent change, unless otherwise stated)
New Saudi Jobs (in
percent of total new
jobs), RHS
-100
-50
0
50
100
150
200
250
Co
nst
ruct
ion
Who
lesa
le/R
eta
il
Manufa
cturi
ng
Tra
nsp
ort
ati
on
Ag
ricu
lture
Min
ing
Acc
om
mo
dat
ion
Info
r&C
om
m
Finance
Real E
state
Sci
ence
Ad
min
istr
ati
on
Ente
rtain
ment
Uti
liti
es
Oth
ers
(th
ou
san
d e
mp
loye
d)
Non-Saudi Saudi
2015 Employment in Private Sector
(y-o-y change)
0
10
20
30
40
50
60
70
2012 2013 2014 2015
Male Female
Labor Force Participation Rates of Saudi Nationals
(Percent of total population of each gender)

SAUDI ARABIA
INTERNATIONAL MONETARY FUND 37
Figure 7. Inflation and Asset Price Developments
Sources: Country authorities; Haver Analytics; Markit; Bloomberg; and IMF staff calculations.
1/ Contribution to headline CPI inflation.
0
1
2
3
4
5
20
09
Feb
-12
Jun-1
2
Oct
-12
Feb
-13
Jun-1
3
Oct
-13
Feb
-14
Jun-1
4
Oct
-14
Feb
-15
Jun-1
5
Oct
-15
Feb
-16
Rent 1/ Other 1/ Food 1/
Headline
CPI Inflation
(y-o-y percent change or contribution)
-40
-30
-20
-10
0
10
20
30
40
50
60
-2
0
2
4
6
8
10
12
14
16
18
20
Jan-0
8
Jul-
08
Jan-0
9
Jul-
09
Jan-1
0
Jul-
10
Jan-1
1
Jul-
11
Jan-1
2
Jul-
12
Jan-1
3
Jul-
13
Jan-1
4
Jul-
14
Jan-1
5
Jul-
15
Jan-1
6
Saudi Arabia
World index (RHS)
Food Price Indices
(y-o-y percent change)
85
95
105
115
125
135
85
95
105
115
125
135
Jan
-00
Jan
-01
Jan
-02
Jan
-03
Jan
-04
Jan
-05
Jan
-06
Jan
-07
Jan
-08
Jan
-09
Jan
-10
Jan
-11
Jan
-12
Jan
-13
Jan
-14
Jan
-15
Jan
-16
Real and Nominal Effective Exchange Rates
(Index, 2010=100; increase =appreciation)
REER
NEER
47
49
51
53
55
57
59
61
Aug
-09
Dec-
09
Ap
r-10
Aug
-10
Dec-
10
Ap
r-11
Aug
-11
Dec-
11
Ap
r-12
Aug
-12
Dec-
12
Ap
r-13
Aug
-13
Dec-
13
Ap
r-14
Aug
-14
Dec-
14
Ap
r-15
Aug
-15
Dec-
15
Ap
r-16
Input price index
Output price index
PMI Input and Output Index
-80
-60
-40
-20
0
20
40
60
80
100
120
140
Jan
-10
May-
10
Sep
-10
Jan
-11
May-
11
Sep
-11
Jan
-12
May-
12
Sep
-12
Jan
-13
May-
13
Sep
-13
Jan
-14
May-
14
Sep
-14
Jan
-15
May-
15
Sep
-15
Jan
-16
May-
16
All shares
Petrochemicals
Constructions
Equity Prices
(y-o-y percent change)
0
20
40
60
80
100
120
140
3.65
3.70
3.75
3.80
3.85
3.90
Jan-1
0
May-
10
Sep
-10
Jan-1
1
May-
11
Sep
-11
Jan-1
2
May-
12
Sep
-12
Jan-1
3
May-
13
Sep
-13
Jan-1
4
May-
14
Sep
-14
Jan-1
5
May-
15
Sep
-15
Jan-1
6
May-
16
Spot exchange rate
12M forward exchange rate
Oil prices (RHS, US$ per barrel)
Spot and Forward Exchange Rates, and Oil Prices
(Saudi Riyal per US$)

SAUDI ARABIA
38 INTERNATIONAL MONETARY FUND
Figure 8. Indicators of the Business Climate
Sources: Global Competitiveness Report 2015–16, World Economic Forum; Economic Freedom of the
World 2015 report, the Fraser Institute; Doing Business 2014–15, 2015–16, World Bank; and IMF staff
calculations.
Bahrain
Kuwait
Oman
Qatar
Saudi
Arabia
UAE0
20
40
60
80
100
120
140
160
0 10 20 30
Trad
e B
arr
ier R
anin
g (1
=le
ast
rest
rict
ive)
Trade Tariffs, % duty
Trade Restrictions
0
20
40
60
80
100
120
UA
E
Bahra
in
Qat
ar
Om
an
Sau
di
Ara
bia
Kuw
ait
Doing Business Rankings: GCC
(Global Ranking, 1=best)
2015 2016
0
50
100
150
200
Starting aBusiness
Dealing withConstruction
Permits
GettingElectricity
RegisteringProperty
Getting Credit
ProtectingInvestors
Paying Taxes
TradingAcross
Borders
EnforcingContracts
ResolvingInsolvency
Doing Business Indicators
2015
2016
0 20 40
Crime and theft
Government instability/coups
Poor public health
Inflation
Corruption
Tax regulations
Foreign currency regulations
Inadequate supply of infrastructure
Tax rates
Policy instability
Insufficient capacity to innovate
Poor work ethic in national labor force
Access to financing
Inefficient government bureaucracy
Inadequately educated workforce
Restrictive labor regulations
Most Problematic Factors for Doing Business
(Percent of Responses)
5
5.5
6
6.5
7
7.5
8
8.5
0
20
40
60
80
100
120
140Prevalence of trade barriers rank
Economic Freedom Summary Index
Degree of Competition in Domestic Market
(The lower rank, the smaller index, the better)
0
20
40
60
80
100
120
Bahrain Kuwait Oman Qatar Saudi
Arabia
Overall Financial
Telecommunications Retail
Professional Transportation
Service Trade Restrictions Index
(Higher value indicates more restrictions)

SAUDI ARABIA
INTERNATIONAL MONETARY FUND 39
Figure 9. Upside/Downside Oil Price and External Borrowing Scenarios
Figure 9. Upside/Downside Oil Price and External Borrowing Scenarios
1/ High (low) oil price scenario assumes oil price to be 25 percent above (below) the WEO oil
price.
2/ High (low) borrowing scenario under the low oil price scenario assumes external borrowing to
be 50 percent higher (lower) than the external borrowing assumed under the baseline.
Source: IMF staff calculations.
-20
-15
-10
-5
0
5
10
2014 2015 2016 2017 2018 2019 2020 2021
Fiscal Balance
(in percent of GDP)
High oil price 1/
Low oil price 1/
WEO oil price
-60
-40
-20
0
20
40
60
2014 2015 2016 2017 2018 2019 2020 2021
Net Financial Assets
(in percent of GDP)
-20
-15
-10
-5
0
5
10
2014 2015 2016 2017 2018 2019 2020 2021
Fiscal Balance
(in percent of GDP)
-60
-40
-20
0
20
40
60
2014 2015 2016 2017 2018 2019 2020 2021
Net Financial Assets
(in percent of GDP)
Baseline Scenario
Adjustment Scenario
-15
-10
-5
0
5
10
15
2014 2015 2016 2017 2018 2019 2020 2021
Current Account Balance
(in percent of GDP)
0
5
10
15
20
25
30
35
40
2014 2015 2016 2017 2018 2019 2020 2021
Reserves
(in months of imports)
High borrowing under low oil price 2/
Low borrowing under low oil price 2/
-15
-10
-5
0
5
10
15
2014 2015 2016 2017 2018 2019 2020 2021
Current Account Balance
(in percent of GDP)
0
5
10
15
20
25
30
35
40
2014 2015 2016 2017 2018 2019 2020 2021
Reserves
(in months of imports)
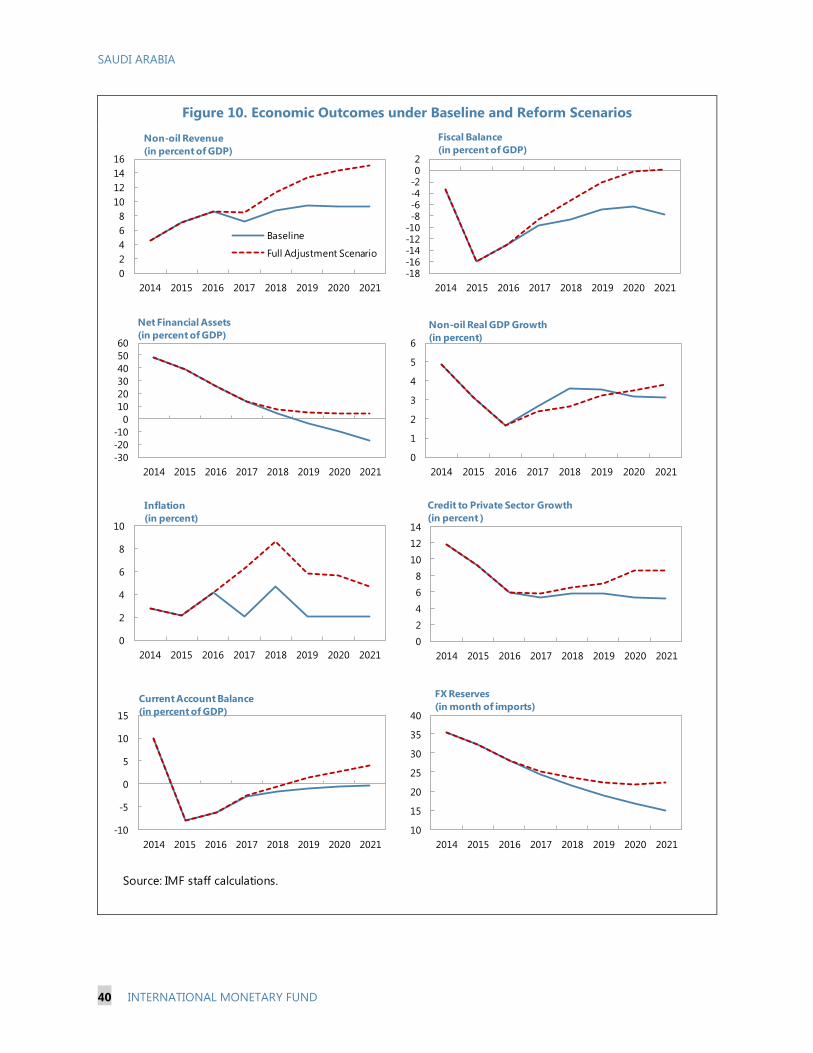
SAUDI ARABIA
40 INTERNATIONAL MONETARY FUND
Figure 10. Economic Outcomes under Baseline and Reform Scenarios
Source: IMF staff calculations.
0
2
4
6
8
10
12
14
16
2014 2015 2016 2017 2018 2019 2020 2021
Non-oil Revenue
(in percent of GDP)
Baseline
Full Adjustment Scenario
-18-16-14-12-10-8-6-4-202
2014 2015 2016 2017 2018 2019 2020 2021
Fiscal Balance
(in percent of GDP)
-30
-20
-10
0
10
20
30
40
50
60
2014 2015 2016 2017 2018 2019 2020 2021
Net Financial Assets
(in percent of GDP)
0
1
2
3
4
5
6
2014 2015 2016 2017 2018 2019 2020 2021
Non-oil Real GDP Growth
(in percent)
0
2
4
6
8
10
2014 2015 2016 2017 2018 2019 2020 2021
Inflation
(in percent)
0
2
4
6
8
10
12
14
2014 2015 2016 2017 2018 2019 2020 2021
Credit to Private Sector Growth
(in percent )
-10
-5
0
5
10
15
2014 2015 2016 2017 2018 2019 2020 2021
Current Account Balance
(in percent of GDP)
10
15
20
25
30
35
40
2014 2015 2016 2017 2018 2019 2020 2021
FX Reserves
(in month of imports)

SAUDI ARABIA
INTERNATIONAL MONETARY FUND 41
Table 1. Selected Economic Indicators, 2012–21
Prel. Prel.
2012 2013 2014 2015 2016 2017 2018 2019 2020 2021
National income and prices
Crude oil production (million of barrels per day)1
9.8 9.6 9.7 10.2 10.2 10.3 10.4 10.5 10.5 10.6
Average oil export price (U.S. dollars per barrel)2
109.4 105.4 95.7 49.8 43.1 50.1 52.0 54.0 55.9 57.5
Nominal GDP (SAR billions) 2,752 2,791 2,827 2,423 2,424 2,609 2,798 2,952 3,102 3,252
Nominal GDP (US$ billions) 734 744 754 646 646 696 746 787 827 867
Nominal non-oil GDP (SAR billions) 1,354 1,479 1,606 1,731 1,821 1,905 2,057 2,173 2,287 2,405
Nominal GDP per capita (US$) 25,139 24,816 24,499 20,583 20,194 21,308 22,403 23,174 23,873 24,531
Real GDP 5.4 2.7 3.6 3.5 1.2 2.0 2.6 2.6 2.3 2.3
Oil 5.1 -1.6 2.1 4.0 0.6 1.1 1.2 1.2 1.1 1.1
Non-oil 5.5 6.4 4.8 3.1 1.6 2.7 3.6 3.6 3.2 3.1
Real GDP—public sector 5.3 5.1 3.7 2.5 0.5 1.9 2.0 1.1 1.1 1.0
Real GDP—private sector 5.5 7.0 5.4 3.4 2.1 3.0 4.2 4.6 4.0 3.9
Consumer price index (avg) 2.9 3.5 2.7 2.2 4.2 2.0 4.7 2.0 2.0 2.0
External sector
Exports 6.5 -3.2 -8.9 -40.9 -9.1 16.0 6.5 5.8 6.4 5.9
Oil 6.2 -4.6 -11.6 -46.8 -12.4 16.7 4.4 4.4 3.9 3.3
Non-oil 8.5 6.0 7.2 -12.3 0.8 14.1 12.0 9.2 12.2 11.7
Imports f.o.b. 18.2 8.1 3.3 -2.2 -3.6 5.5 5.7 5.4 5.0 4.5
Current account balance (percent of GDP) 22.4 18.2 9.8 -8.3 -6.4 -2.7 -1.9 -1.2 -0.7 -0.3
Export volume 5.5 1.4 1.6 4.1 3.3 3.3 4.3 3.3 4.7 4.9
Import volume 18.4 10.9 6.4 5.5 -0.3 5.2 5.3 4.7 4.3 4.2
Terms of trade 3.2 -1.9 -7.7 -43.4 -10.0 13.7 2.3 2.4 1.5 1.2
Money and credit
Net foreign assets 19.7 10.2 1.8 -12.7 -10.3 -7.4 -8.7 -8.4 -8.1 -7.8
Credit to government (net) 31.1 7.4 -6.8 -29.1 -17.5 -16.1 -21.4 -22.4 -27.3 -49.8
Credit to private sector 16.4 12.5 11.8 9.2 6.0 5.3 5.9 5.9 5.3 5.2
Credit to state enterprises 24.4 11.5 3.8 -15.3 0.0 0.0 0.0 0.0 0.0 0.0
Money and quasi-money (M3) 13.9 10.9 11.9 2.5 2.2 3.4 4.1 4.6 4.3 4.2
3-month Interbank rate (percent p.a.)4
0.92 0.95 0.94 0.87 2.2 … … … … …
Central government finances
Revenue 45.3 41.4 36.9 25.4 22.7 23.2 25.6 26.1 26.8 26.5
Of which: oil 41.6 37.1 32.3 18.4 14.2 16.0 16.9 16.7 17.4 17.1
Expenditure 33.3 35.6 40.3 41.3 35.7 32.8 34.3 33.1 33.1 34.2
Expense 22.2 21.3 23.7 27.7 26.1 24.0 25.4 24.2 24.2 25.3
Net acquisition of non-financial assets 11.1 14.4 16.7 13.7 9.6 8.8 8.9 8.9 8.9 8.9
Net lending (+)/borrowing (-) 12.0 5.8 -3.4 -15.9 -13.0 -9.6 -8.8 -7.0 -6.3 -7.7
Excluding oil revenue -29.6 -31.3 -35.7 -34.3 -27.1 -25.6 -25.6 -23.7 -23.7 -24.9
Non-oil primary balance/non-oil GDP -60.4 -59.7 -64.0 -50.8 -39.3 -36.2 -35.7 -32.6 -32.0 -33.1
Government deposits at SAMA 50.9 54.0 50.0 43.3 39.4 33.7 28.8 25.2 22.1 18.8
Central government's gross debt 3.6 2.2 1.6 5.0 14.3 20.2 25.1 28.8 32.0 36.1
Central government's net financial assets 47.3 51.9 48.4 38.3 25.1 13.6 3.7 -3.6 -9.9 -17.3
Memorandum items:
SAMA's total net foreign assets (US$ billions) 647.6 716.7 724.3 608.9 542.9 500.9 455.1 415.3 380.4 349.9
In months of imports of goods and services3
33.8 33.2 35.4 32.3 27.9 24.4 21.4 18.8 16.6 14.7
Imports goods & services/GDP 29.3 30.9 34.4 38.0 35.0 33.5 33.0 32.4 32.0 31.7
Real effective exchange rate (2010=100, end of period)4
99.7 102.6 112.1 121.4 121.8 … … … … …
Average exchange rate Saudi riyal/U.S. dollar4
3.75 3.75 3.75 3.75 … … … … … …
Population (millions) 29.2 30.0 30.8 31.4 32.0 32.7 33.3 34.0 34.7 35.3
Unemployment rate (nationals, in percent of total) 12.1 11.7 11.7 11.5 … … … … … …
Unemployment rate (overall, in percent of total) 5.5 5.6 5.7 5.6
Employment Growth 4.6 3.3 3.2 3.8 … … … … … …
All-Shares Price Index (TASI)4
6801 8536 8333 6912 6516 … … … … …
Sources: Saudi Arabian authorities; and IMF staff estimates and projections.1 Includes production from the Neutral Zone.
2 Includes refined products.
3 Next 12 months.
4 For 2016, data is latest available.
Proj.
(Percent of GDP)
(Percent change; unless otherwise indicated)
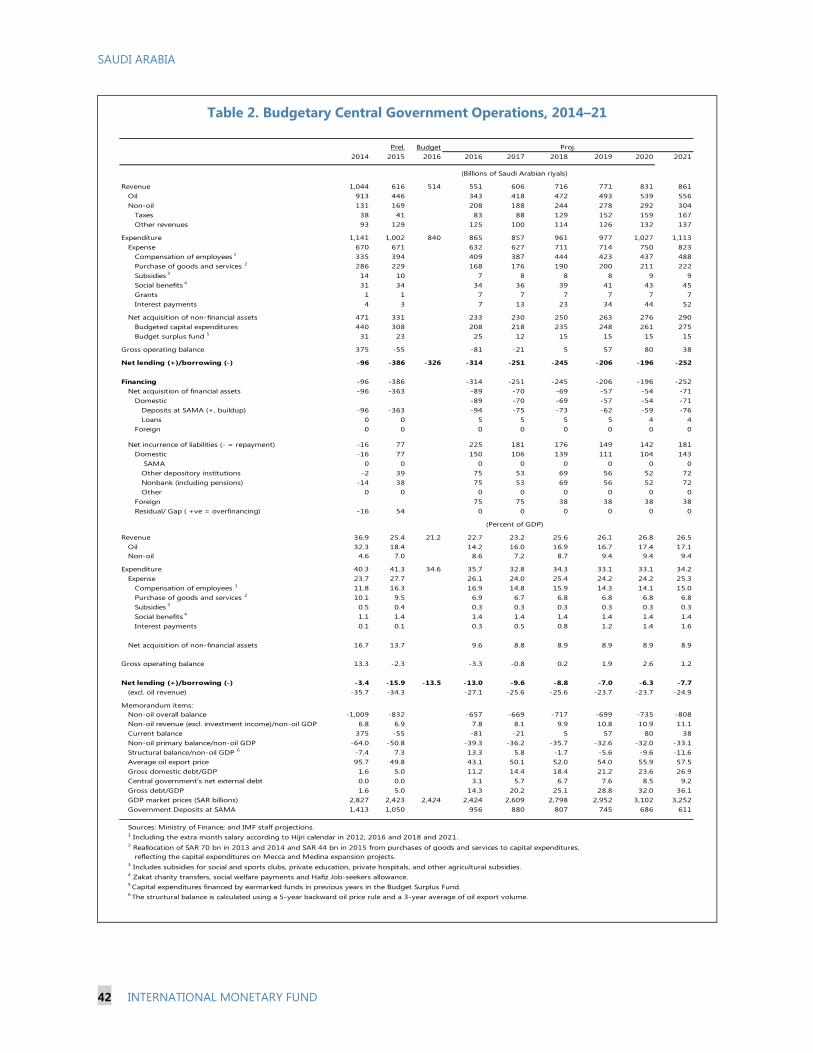
SAUDI ARABIA
42 INTERNATIONAL MONETARY FUND
Table 2. Budgetary Central Government Operations, 2014–21
Prel. Budget
2014 2015 2016 2016 2017 2018 2019 2020 2021
Revenue 1,044 616 514 551 606 716 771 831 861
Oil 913 446 343 418 472 493 539 556
Non-oil 131 169 208 188 244 278 292 304
Taxes 38 41 83 88 129 152 159 167
Other revenues 93 129 125 100 114 126 132 137
Expenditure 1,141 1,002 840 865 857 961 977 1,027 1,113
Expense 670 671 632 627 711 714 750 823
Compensation of employees 1
335 394 409 387 444 423 437 488
Purchase of goods and services 2
286 229 168 176 190 200 211 222
Subsidies 3
14 10 7 8 8 8 9 9
Social benefits 4
31 34 34 36 39 41 43 45
Grants 1 1 7 7 7 7 7 7
Interest payments 4 3 7 13 23 34 44 52
Net acquisition of non-financial assets 471 331 233 230 250 263 276 290
Budgeted capital expenditures 440 308 208 218 235 248 261 275
Budget surplus fund 5
31 23 25 12 15 15 15 15
Gross operating balance 375 -55 -81 -21 5 57 80 38
Net lending (+)/borrowing (-) -96 -386 -326 -314 -251 -245 -206 -196 -252
Financing -96 -386 -314 -251 -245 -206 -196 -252
Net acquisition of financial assets -96 -363 -89 -70 -69 -57 -54 -71
Domestic -89 -70 -69 -57 -54 -71
Deposits at SAMA (+, buildup) -96 -363 -94 -75 -73 -62 -59 -76
Loans 0 0 5 5 5 5 4 4
Foreign 0 0 0 0 0 0 0 0
Net incurrence of liabilities (- = repayment) -16 77 225 181 176 149 142 181
Domestic -16 77 150 106 139 111 104 143
SAMA 0 0 0 0 0 0 0 0
Other depository institutions -2 39 75 53 69 56 52 72
Nonbank (including pensions) -14 38 75 53 69 56 52 72
Other 0 0 0 0 0 0 0 0
Foreign 75 75 38 38 38 38
Residual/ Gap ( +ve = overfinancing) -16 54 0 0 0 0 0 0
Revenue 36.9 25.4 21.2 22.7 23.2 25.6 26.1 26.8 26.5
Oil 32.3 18.4 14.2 16.0 16.9 16.7 17.4 17.1
Non-oil 4.6 7.0 8.6 7.2 8.7 9.4 9.4 9.4
Expenditure 40.3 41.3 34.6 35.7 32.8 34.3 33.1 33.1 34.2
Expense 23.7 27.7 26.1 24.0 25.4 24.2 24.2 25.3
Compensation of employees 1
11.8 16.3 16.9 14.8 15.9 14.3 14.1 15.0
Purchase of goods and services 2
10.1 9.5 6.9 6.7 6.8 6.8 6.8 6.8
Subsidies 3
0.5 0.4 0.3 0.3 0.3 0.3 0.3 0.3
Social benefits 4
1.1 1.4 1.4 1.4 1.4 1.4 1.4 1.4
Interest payments 0.1 0.1 0.3 0.5 0.8 1.2 1.4 1.6
Net acquisition of non-financial assets 16.7 13.7 9.6 8.8 8.9 8.9 8.9 8.9
Gross operating balance 13.3 -2.3 -3.3 -0.8 0.2 1.9 2.6 1.2
Net lending (+)/borrowing (-) -3.4 -15.9 -13.5 -13.0 -9.6 -8.8 -7.0 -6.3 -7.7
(excl. oil revenue) -35.7 -34.3 -27.1 -25.6 -25.6 -23.7 -23.7 -24.9
Memorandum items:
Non-oil overall balance -1,009 -832 -657 -669 -717 -699 -735 -808
Non-oil revenue (excl. investment income)/non-oil GDP 6.8 6.9 7.8 8.1 9.9 10.8 10.9 11.1
Current balance 375 -55 -81 -21 5 57 80 38
Non-oil primary balance/non-oil GDP -64.0 -50.8 -39.3 -36.2 -35.7 -32.6 -32.0 -33.1
Structural balance/non-oil GDP 6
-7.4 7.3 13.3 5.8 -1.7 -5.6 -9.6 -11.6
Average oil export price 95.7 49.8 43.1 50.1 52.0 54.0 55.9 57.5
Gross domestic debt/GDP 1.6 5.0 11.2 14.4 18.4 21.2 23.6 26.9
Central government's net external debt 0.0 0.0 3.1 5.7 6.7 7.6 8.5 9.2
Gross debt/GDP 1.6 5.0 14.3 20.2 25.1 28.8 32.0 36.1
GDP market prices (SAR billions) 2,827 2,423 2,424 2,424 2,609 2,798 2,952 3,102 3,252
Government Deposits at SAMA 1,413 1,050 956 880 807 745 686 611
Sources: Ministry of Finance; and IMF staff projections. 1 Including the extra month salary according to Hijri calendar in 2012, 2016 and 2018 and 2021.
2 Reallocation of SAR 70 bn in 2013 and 2014 and SAR 44 bn in 2015 from purchases of goods and services to capital expenditures,
reflecting the capital expenditures on Mecca and Medina expansion projects.3 Includes subsidies for social and sports clubs, private education, private hospitals, and other agricultural subsidies.
4 Zakat charity transfers, social welfare payments and Hafiz Job-seekers allowance.
5 Capital expenditures financed by earmarked funds in previous years in the Budget Surplus Fund.
6 The structural balance is calculated using a 5-year backward oil price rule and a 3-year average of oil export volume.
Proj.
(Percent of GDP)
(Billions of Saudi Arabian riyals)

SAUDI ARABIA
INTERNATIONAL MONETARY FUND 43
Table 3. Fiscal Operations of the General Government, 2010–15
(Percent of GDP)
2010 2011 2012 2013 2014 2015 1
I. Budgetary central government
Revenue 37.5 44.5 45.3 41.4 36.9 25.4
Expenditure 34.0 33.4 33.3 35.6 40.3 41.3
Overall balance 3.6 11.2 12.0 5.8 -3.4 -15.9
Primary balance 4.1 11.5 12.2 6.0 -3.3 -15.8
II. Autonomous Government Institutions (AGIs)
Public Pension Agency (PPA)
Revenue 1.9 1.4 3.2 3.3 2.0 1.3
Expenditure 1.9 1.5 1.6 1.6 1.8 2.3
Overall balance 0.0 -0.2 1.6 1.6 0.2 -1.0
General Organization for Social Insurance (GOSI)
Revenue 1.3 1.0 1.0 1.3 1.7 ….
Expenditure 0.5 0.4 0.5 0.7 0.6 ….
Overall balance 0.8 0.6 0.5 0.7 1.1 ….
III. Public Investment Fund (PIF)
Revenue 0.9 0.6 0.7 0.7 1.4 ….
Expenditure 0.0 0.2 0.1 0.04 0.0 ….
Overall balance 0.8 0.4 0.6 0.6 1.4 ….
IV. General government (=I+II+III)
Overall balance 5.2 12.0 14.7 8.7 -0.7 ….
Primary balance 5.7 12.3 15.0 8.9 -0.6 ….
Memorandum items: net assets(+)/debt (-)
i. Central government debt -8.4 -5.4 -3.6 -2.2 -1.6 -5.0
ii. Autonomous government institutions 38.9 31.0 30.5 33.6 34.4 ….
Of which: PPA 21.3 17.1 17.2 18.6 18.6 19.5
Of which: GOSI 17.6 13.9 13.2 15.0 15.8 ….
iii. Public Investment Fund 10.0 8.3 9.3 9.8 11.0 ….
iv. General government (=i+ ii+iii) 40.4 33.9 36.1 41.2 43.9 ….
v. Government Deposits in the Banking System 46.2 43.2 50.9 54.0 50.0 43.3
vi. Net assets (iv + v) 86.7 77.0 87.0 95.3 93.8 ….
Sources: Ministry of Finance; PPA; GOSI; PIF; and IMF staff estimates.
1 PIF data is unavailable for 2015 as the accounts have not been completed due to the ongoing move from cash to accruals accounting.
GOSI data has not been received.

SAUDI ARABIA
44 INTERNATIONAL MONETARY FUND
Table 4. Balance of Payments, 2012–21
(USS billion)
Prel.
2012 2013 2014 2015 2016 2017 2018 2019 2020 2021
Current account 164.8 135.4 73.8 -53.5 -41.1 -18.9 -14.0 -9.2 -5.6 -2.6
(Percent of GDP) 22.4 18.2 9.8 -8.3 -6.4 -2.7 -1.9 -1.2 -0.7 -0.3
Trade balance 246.6 222.6 184.0 47.3 34.5 55.6 60.4 64.6 71.2 77.9
Exports 388.4 375.9 342.5 202.3 183.9 213.2 227.0 240.2 255.6 270.7
Oil exports 337.2 321.7 284.4 151.3 132.6 154.7 161.4 168.6 175.2 180.9
Other exports 51.1 54.2 58.1 50.9 51.3 58.6 65.6 71.6 80.3 89.7
Imports (f.o.b.) -141.8 -153.3 -158.5 -155.0 -149.4 -157.6 -166.6 -175.6 -184.4 -192.7
Services -62.4 -64.8 -88.0 -75.7 -59.9 -58.3 -61.7 -61.3 -61.7 -63.2
Transportation -15.6 -16.6 -17.0 -16.7 -14.1 -14.7 -15.3 -15.9 -16.5 -17.0
Travel -9.6 -10.0 -15.9 -10.6 -7.2 -7.4 -7.6 -7.9 -7.6 -7.3
Other private services -37.2 -38.2 -55.1 -48.4 -38.6 -36.3 -38.9 -37.6 -37.6 -38.9
Income 11.0 13.6 16.5 15.7 20.6 20.1 26.4 28.1 27.1 26.5
Of which: Investment income1
11.6 14.2 17.2 16.3 21.2 20.8 27.1 28.8 27.8 27.2
Current transfers -30.4 -35.9 -38.7 -40.7 -36.3 -36.3 -39.1 -40.7 -42.2 -43.8
Of which : Workers' remittances -28.6 -34.1 -36.0 -37.8 -33.4 -33.4 -36.2 -37.8 -39.3 -40.9
Capital Account -0.3 -0.3 -0.3 -0.5 0.0 0.0 0.0 0.0 0.0 0.0
Financial account -6.4 -57.4 -57.4 -42.0 -12.3 -10.4 -19.1 -18.0 -16.7 -15.2
Direct Investment 7.8 3.9 2.6 2.6 2.6 3.1 3.6 3.9 4.4 4.9
Abroad -4.4 -4.9 -5.4 -5.5 -5.5 -5.9 -6.3 -6.5 -6.8 -7.1
In Saudi economy 12.2 8.9 8.0 8.1 8.1 9.0 9.8 10.5 11.2 12.0
Portfolio investments -3.2 -6.6 -26.8 -10.0 0.9 0.3 -5.4 -6.0 -6.5 -7.1
Assets -4.1 -8.4 -27.0 -10.3 -9.4 -10.1 -10.8 -11.4 -12.0 -12.6
Liabilities 0.9 1.8 0.2 0.3 10.3 10.4 5.4 5.5 5.5 5.5
Other investments -11.0 -54.7 -33.2 -34.7 -15.8 -13.8 -17.3 -15.9 -14.5 -13.1
Assets -10.3 -52.3 -39.2 -38.6 -28.0 -26.0 -24.5 -23.1 -21.7 -20.3
Liabilities -0.7 -2.4 6.0 3.9 12.2 12.2 7.2 7.2 7.2 7.2
Net errors and omissions -45.6 -8.6 -9.4 -20.0 -12.7 -12.7 -12.7 -12.7 -12.7 -12.7
Overall balance 112.6 69.2 6.6 -115.9 -66.0 -42.0 -45.8 -39.8 -34.9 -30.5
Financing -112.6 -69.2 -6.6 115.9 66.0 42.0 45.8 39.8 34.9 30.5
Change in SAMA's NFA (- increase) -112.5 -69.7 -8.4 115.0 66.0 42.0 45.8 39.8 34.9 30.5840.0
Memorandum items:
SAMA's total net foreign assets 647.6 716.7 724.3 608.9 542.9 500.9 455.1 415.3 380.4 349.9
(In months of imports) 2
33.8 33.2 35.4 32.3 27.9 24.4 21.4 18.8 16.6 14.7
Non-oil current account/GDP -23.5 -25.0 -27.9 -31.7 -26.9 -25.0 -23.5 -22.6 -21.9 -21.2
WEO oil price (US$/barrel) 105.0 104.1 96.2 50.8 43.9 51.0 53.0 55.1 57.0 58.5
Average Saudi oil price (US$/barrel)3
109.4 105.4 95.7 49.8 43.1 50.1 52.0 54.0 55.9 57.5
Oil production (mbd) 9.8 9.6 9.7 10.2 10.2 10.3 10.4 10.5 10.5 10.6
Oil exports (mbd) 8.4 8.4 8.1 8.3 8.4 8.5 8.5 8.5 8.6 8.6
Oil exports/total exports 86.8 85.6 83.0 74.8 72.1 72.5 71.1 70.2 68.6 66.8
Imports of goods/GDP 19.3 20.6 21.0 24.0 23.1 22.7 22.3 22.3 22.3 22.2
GDP (US$ billion) 734.0 744.3 753.8 646.0 646.5 695.8 746.2 787.3 827.3 867.1
External Debt (US$ billion) 0.0 0.0 0.0 0.0 20.0 40.0 50.0 60.0 70.0 80.0
Sources: Saudi Arabian Monetary Agency; and IMF staff estimates and projections.1 Represents the return on NFA of SAMA, AGIs, and private sector.
2 Imports of goods and services over the next 12 months excluding imports for transit trade.
3 The average price of all oil exports, including refined products.
Proj.

SAUDI ARABIA
INTERNATIONAL MONETARY FUND 45
Table 5. Monetary Survey, 2012–21
2012 2013 2014 2015 2016 2017 2018 2019 2020 2021
Foreign assets (net) 2,562 2,824 2,875 2,509 2,251 2,084 1,902 1,743 1,602 1,478
SAMA 2,429 2,688 2,716 2,283 2,036 1,878 1,707 1,557 1,426 1,312
Commercial banks 133 136 159 226 216 206 196 186 176 166
Domestic credit (net) -320 -291 -57 447 698 903 1,136 1,349 1,550 1,791
Net claims on government -1,358 -1,459 -1,360 -964 -795 -666 -524 -406 -295 -148
Claims on government 42 50 53 86 161 214 283 339 391 462
Government deposits with SAMA -1,401 -1,508 -1,413 -1,050 -956 -880 -807 -745 -686 -611
Claims on state enterprises 40 44 46 39 39 39 39 39 39 39
Claims on private sector 999 1,124 1,256 1,372 1,454 1,531 1,621 1,716 1,807 1,901
Money and quasi-money (M3) 1,394 1,545 1,729 1,773 1,812 1,873 1,950 2,040 2,127 2,216
Money (M1) 887 1,000 1,143 1,145 1,170 1,209 1,259 1,317 1,373 1,431
Currency outside banks 133 143 154 169 172 178 185 194 202 211
Demand deposits 754 857 989 976 998 1,031 1,073 1,123 1,171 1,220
Quasi-money 507 545 586 629 642 664 691 723 754 786
Time and savings deposits 324 345 399 435 444 459 478 500 521 543
Other quasi-money deposits 182 200 188 194 198 205 213 223 233 243
Other items (net liabilities) 849 988 1,088 1,183 1,138 1,115 1,089 1,052 1,025 1,053
Foreign assets (net) 34.5 18.8 3.3 -21.2 -14.5 -9.2 -9.7 -8.2 -6.9 -5.8
Domestic credit (net) -14.2 2.1 15.1 29.2 14.2 11.3 12.4 10.9 9.9 11.3
Net claims on government -26.4 -7.2 6.4 22.9 9.5 7.1 7.6 6.0 5.4 6.9
Claims on government -0.4 0.5 0.2 1.9 4.2 2.9 3.7 2.9 2.6 3.4
Government deposits (increase -) -26.0 -7.7 6.2 21.0 5.3 4.2 3.9 3.2 2.9 3.6
Claims on state enterprises 0.6 0.3 0.1 -0.4 0.0 0.0 0.0 0.0 0.0 0.0
Claims on private sector 11.5 8.9 8.6 6.7 4.6 4.2 4.8 4.9 4.4 4.4
Money and quasi-money 13.9 10.9 11.9 2.5 2.2 3.4 4.1 4.6 4.3 4.2
Other items (net liabilities) 6.3 10.0 6.5 5.4 -2.5 -1.3 -1.4 -1.9 -1.3 1.3
Foreign assets (net) 19.7 10.2 1.8 -12.7 -10.3 -7.4 -8.7 -8.4 -8.1 -7.8
Domestic credit (net) 119.6 -9.0 -80.2 -877.8 56.2 29.3 25.8 18.7 14.9 15.5
Net claims on government 31.1 7.4 -6.8 -29.1 -17.5 -16.1 -21.4 -22.4 -27.3 -49.8
Claims on government -10.6 16.8 7.1 62.2 86.9 32.8 32.4 19.6 15.4 18.3
Government deposits at SAMA (increase -) -29.3 -7.7 6.3 25.7 9.0 7.9 8.3 7.7 7.9 11.0
Claims on state enterprises 24.4 11.5 3.8 -15.3 0.0 0.0 0.0 0.0 0.0 0.0
Claims on private sector 16.4 12.5 11.8 9.2 6.0 5.3 5.9 5.9 5.3 5.2
Money and quasi-money 13.9 10.9 11.9 2.5 2.2 3.4 4.1 4.6 4.3 4.2
Other items (net liabilities) 10.0 16.4 10.2 8.7 -3.8 -2.0 -2.3 -3.4 -2.6 2.7
Memorandum items:
Specialized Credit Institutions credit (SAR billions) 249.3 271.2 310.9 351.8 … … … … … …
Ratio of M3-to-GDP 50.6 55.4 61.2 73.2 74.7 71.8 69.7 69.1 68.6 68.2
Ratio of Claims on private sector-to-non-oil GDP 73.8 76.0 78.2 79.2 79.8 80.4 78.8 79.0 79.0 79.0
Sources: Saudi Arabian Monetary Agency (SAMA); and IMF staff estimates.
Proj.
(Changes in percent of beginning broad money stock)
(Percent changes, unless otherwise indicated)
(Percent; unless otherwise indicated)

SAUDI ARABIA
46 INTERNATIONAL MONETARY FUND
Table 6. Fiscal Assumptions in the Baseline and Adjustment Scenarios
Baseline scenario
The baseline scenario is based on policies in the 2016 budget and other policies that have an announced
implementation schedule.
Oil revenues are projected using the WEO oil price assumptions, forecast oil export volumes, and the
assumption that the share of total oil revenues transferred from Aramco to the budget returns to its
historic average over the medium-term.
Revenues from higher energy and water price reforms are estimated at SAR 28 billion in 2016 and are
assumed to accrue to the budget via Aramco.
Non-oil revenues are assumed to increase in line with non-oil GDP except: (i) transfers from SAMA and
PIF; (iii) an assumed transfer of SAR25 billion from HRDF in 2016; and (iii) some increase in fees and fines
to a total of SAR 28 billion by 2021.
Excise taxes on tobacco and sugary drinks are assumed to be introduced at the beginning of 2017 and a
VAT (5 percent rate) at the beginning of 2018, although collections in the first year are assumed to be
lower given it may take some time to reach full collection.
In 2016, expenditures are assumed to be in line with the budget. The 13th month wage payment and
payments to contractors delayed from 2015 to 2016 are assumed to be met within this budget envelope.
Spending of SAR 25 billion from the budget surplus fund is also assumed.
From 2017-2021, all expenditures except wages and salaries are assumed to grow in line with non-oil
GDP. Wages and salaries grow in line with inflation and 1 percent employment growth is assumed. In
2018 and 2021, the 13th month salary is paid.
Adjustment scenario
The staff’s adjustment scenario targets a balanced budget by 2021 (the objective of “achieving budgetary
balance” is set out in Vision 2030 and the NTP).
Further to the baseline, energy and water prices are assumed to gradually increase to international or cost
recovery levels by 2021. Higher prices reduce the growth in energy consumption over time.
Compensation is assumed to be paid to households (SAR 65 billion) and is reflected in expenditure.
Additional government expenditure on energy prices is excluded from the revenue gains (netted out) and
long-term price contracts in the corporate sector are honored. Net revenue gains (baseline plus
adjustment scenario) are estimated to reach SAR 173 billion by 2021.
Capital spending is reduced to about 6.5 percent of GDP in 2021, in line with investment levels in
countries with similar income and infrastructure quality.
The growth in the nominal government wage bill is limited to 2 percent a year.
Additional spending on the national transformation plan (SAR 270 billion during 2016-2021) is assumed
to be met within the expenditure envelope of the adjustment scenario.

SAUDI ARABIA
INTERNATIONAL MONETARY FUND 47
Table 7. Financial Soundness Indicators, 2007–15
(Percent, unless otherwise indicated)
2007 2008 2009 2010 2011 2012 2013 2014 2015
Banking sector
Structure of the banking sector
Number of licensed banks 22.0 22.0 23.0 23.0 23.0 23.0 24.0 24.0 24.0
Number of banks accounting for:
25 percent of total assets 2.0 2.0 2.0 2.0 2.0 2.0 2.0 2.0 2.0
75 percent of total assets 6.0 6.0 6.0 6.0 6.0 6.0 6.0 6.0 6.0
Total assets (percent of GDP) 69.0 66.8 85.2 71.6 61.5 63.0 67.8 75.4 90.2
Of which: Foreign currency-denominated (as percent of total assets) 13.7 11.8 15.4 13.6 13.5 12.3 11.1 11.8 14.3
Total loans (percent of GDP) 38.2 38.2 45.8 39.2 39.8 36.3 40.1 44.2 55.6
Credit to private sector (percent of GDP) 35.8 36.6 44.0 37.6 30.0 34.9 38.6 42.6 54.0
Total deposits, excluding interbank (as percent of GDP) 46.0 43.4 58.5 49.9 44.0 45.8 50.2 55.7 65.5
Central bank credit to banks (as percent of GDP) … … … … … … … … …
Capital adequacy
Regulatory capital to risk-weighted assets 20.7 16.0 16.9 17.6 17.6 18.2 17.9 17.9 18.1
Asset quality
Net loans to total assets 52.0 57.9 57.4 55.1 55.8 58.2 59.8 60.3 63.0
Gross NPLs to gross loans 2.1 1.4 3.3 3.0 2.2 1.7 1.3 1.1 1.2
Total provisions to gross NPLs 142.9 153.3 89.8 115.7 132.8 145.1 157.4 182.9 164.4
Net NPLs to total capital 1
-3.5 -3.8 1.4 -2.7 -3.0 -3.7 -3.4 -4.1 -3.7
Total provisions for loan losses (as percent of total loans) 3.0 2.1 3.0 3.5 3.1 2.8 2.2 2.1 2.1
Loans to property and construction sector to total loans 7.3 7.3 6.1 7.2 8.1 7.5 6.8 6.7 7.8
Loans to domestic manufacturing sector to total loans 9.1 10.7 10.2 11.6 13.0 12.6 12.5 12.7 12.7
Contingent and off-balance sheet accounts to total assets 96.6 96.0 81.0 91.4 96.2 91.7 90.8 100.2 100.8
Profitability
Profits (percent change) -12.7 -1.1 -10.4 -2.6 18.4 8.4 6.5 12.5 6.2
Average pretax return on assets 2.8 2.7 1.9 2.0 2.1 2.1 2.0 2.0 2.0
Return on equity 22.3 20.5 14.2 13.6 15.0 15.1 14.6 15.0 14.5
Noninterest expenses to total income 2
38.7 51.1 55.4 52.7 46.9 47.0 47.7 45.5 37.1
Average lending spread 3.2 4.0 4.1 4.3 4.1 3.8 3.7 3.5 3.4
Liquidity
Liquid assets to total assets 21.7 22.0 25.3 24.8 23.7 23.7 21.6 22.3 17.5
Liquid assets to short-term liabilities 3
27.7 30.6 36.5 36.5 37.2 36.4 33.2 33.6 27.3
Customer deposits to net loans 136.3 124.0 128.5 135.9 135.9 131.9 129.3 127.7 121.7
Demand deposits to total deposits 43.4 40.5 46.1 53.8 58.1 59.8 61.1 62.8 60.8
Sensitivity to market risk
Foreign currency-denominated deposits to total deposits 13.9 13.2 17.0 12.6 12.2 13.0 12.6 10.3 10.0
Foreign currency-denominated loans to total loans 12.5 14.0 14.1 13.4 12.4 11.7 10.6 9.9 8.9
Foreign currency-denominated contingent and 53.0 54.5 39.2 42.2 47.9 41.3 34.6 39.1 35.3
off-balance sheet accounts to total assets
Net open foreign currency position to capital 3.1 4.5 8.6 10.2 6.7 1.7 6.4 3.6 4.0
Stock market
Stock market capitalization (percent of GDP) 124.8 47.4 74.3 67.1 50.6 50.9 62.8 64.0 64.4
Overall stock market price index (change in percent) 39.1 -56.5 27.5 8.2 -3.1 6.0 25.5 -2.4 -17.1
Bank stock price index (change in percent) 31.0 -55.6 15.3 6.6 -12.7 0.4 22.0 2.5 -14.9
Source: Saudi Arabian Monetary Agency.
1 The negative sign reflects that provisions exceed gross NPLs.
2 Total income includes net interest income and gross noninterest income.
3 Short-term liabilities include demand deposits maturing in 90 days or less. Liquid assets include cash, gold, Saudi government bonds and treasury,
bills and interbank deposits maturing within 30 days.
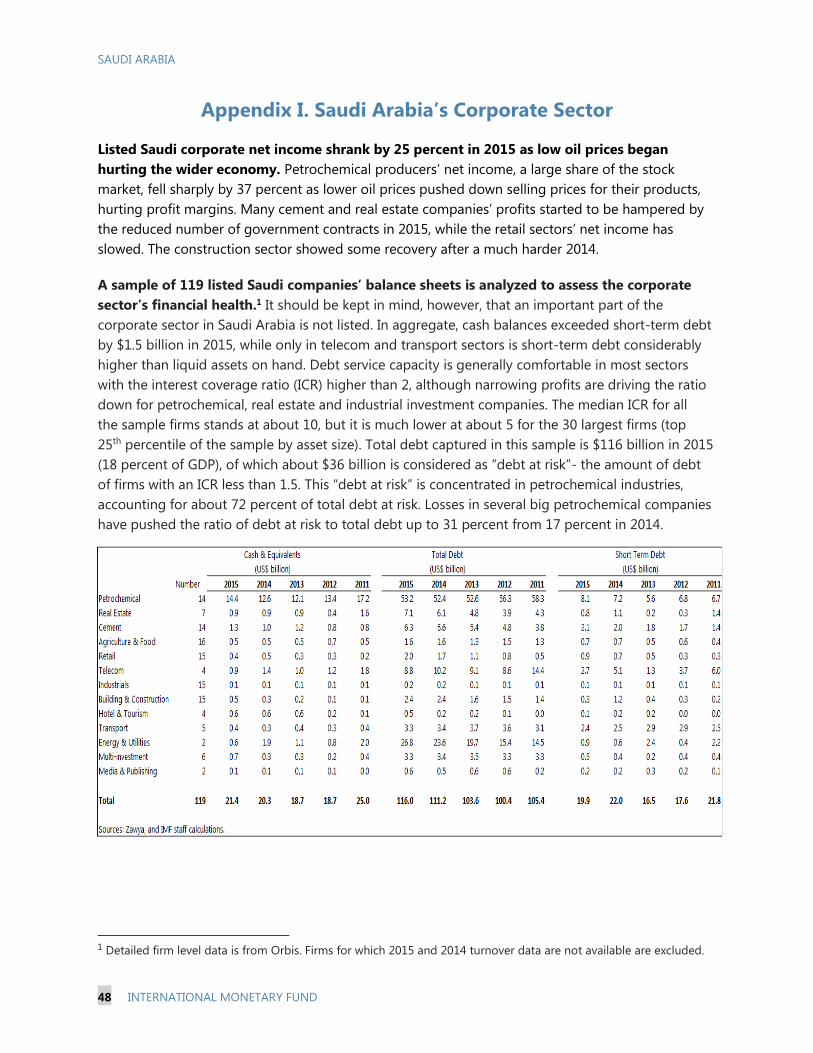
SAUDI ARABIA
48 INTERNATIONAL MONETARY FUND
Appendix I. Saudi Arabia’s Corporate Sector
Listed Saudi corporate net income shrank by 25 percent in 2015 as low oil prices began
hurting the wider economy. Petrochemical producers’ net income, a large share of the stock
market, fell sharply by 37 percent as lower oil prices pushed down selling prices for their products,
hurting profit margins. Many cement and real estate companies’ profits started to be hampered by
the reduced number of government contracts in 2015, while the retail sectors’ net income has
slowed. The construction sector showed some recovery after a much harder 2014.
A sample of 119 listed Saudi companies’ balance sheets is analyzed to assess the corporate
sector’s financial health.1 It should be kept in mind, however, that an important part of the
corporate sector in Saudi Arabia is not listed. In aggregate, cash balances exceeded short-term debt
by $1.5 billion in 2015, while only in telecom and transport sectors is short-term debt considerably
higher than liquid assets on hand. Debt service capacity is generally comfortable in most sectors
with the interest coverage ratio (ICR) higher than 2, although narrowing profits are driving the ratio
down for petrochemical, real estate and industrial investment companies. The median ICR for all
the sample firms stands at about 10, but it is much lower at about 5 for the 30 largest firms (top
25th percentile of the sample by asset size). Total debt captured in this sample is $116 billion in 2015
(18 percent of GDP), of which about $36 billion is considered as “debt at risk”- the amount of debt
of firms with an ICR less than 1.5. This “debt at risk” is concentrated in petrochemical industries,
accounting for about 72 percent of total debt at risk. Losses in several big petrochemical companies
have pushed the ratio of debt at risk to total debt up to 31 percent from 17 percent in 2014.
1 Detailed firm level data is from Orbis. Firms for which 2015 and 2014 turnover data are not available are excluded.

SAUDI ARABIA
INTERNATIONAL MONETARY FUND 49
With the sharp drop in equity prices, the TASI’s price to earnings (P/E) ratio has fallen below
its historical average since the second half of 2015. A combination of higher oil prices and
positive sentiment related to the announcement of the “Saudi Vision 2030” has helped with a
stronger performance of TASI and rebound in the P/E since early 2016. Compared with several
regional and emerging markets indices, the TASI P/E ratio remains on the higher side.
To assess the vulnerability of the nonfinancial corporate sector, a sensitivity analysis is
conducted under three scenarios of corporate earnings and borrowing costs shocks:
Scenario 1: a 70 basis point increase in borrowing costs (in line with the observed increase of
SIBOR from end-2014 to end-2015) and 16 percent decrease in corporate’ earnings (actual
changes from 2014 to 2015).2
Scenario 2: a 150 basis point increase in borrowing costs and 20 percent decrease in earnings
given the potential impact of lower government spending and the recent downgrade of Saudi
Arabia’s credit rating.
Scenario 3: an extreme scenario with a 300 basis point increase in borrowing costs (in line with
the standard deviation of SIBOR from 1993 to 2016) and 38 percent decrease in earnings
(largest annual change in the past 10 years observed in 2009).
The nonfinancial corporate sector shows moderate vulnerability to these shocks, with the
exposures and impacts varying between sectors. The median ICR drops, but remains above
2 under all scenarios. About half of the total debt will be at risk, most of which will be in
petrochemicals, telecommunications and multi-investment sectors. Industrial investment companies
which have low levels of ICR to begin with will also be hit and their debt accounts for more than
30 percent of total debt at risk after the shocks.
2 Corporate earnings here is defined as earnings before interest & tax (EBIT).
4000
5000
6000
7000
8000
9000
10000
11000
12000
5
10
15
20
25
1/1
/2011
7/1
/2011
1/1
/2012
7/1
/2012
1/1
/2013
7/1
/2013
1/1
/2014
7/1
/2014
1/1
/2015
7/1
/2015
1/1
/2016
Saudi Stock Price and PE Ratio
(Jan 2011 to May 2016)
PE ratio
Price Index (1985=100,rhs)
PE historical avergae
9 911 11 11
14 15
18
21
0
5
10
15
20
25
Comparative Price-to-Earnings Ratio
(as of May 31,2016)
1/ Shanghai Stock Exchange 50 A share index (SSE50).2/ New York Stock Exchange Composite index (NYA).
Source: Bloomberg.

SAUDI ARABIA
50 INTERNATIONAL MONETARY FUND
Besides the risk of higher interest payments, some sectors also face potential principal
rollover risk. Over 70 percent of total Saudi corporate bond issuance since 2003 is concentrated in
the petrochemicals, utilities, real estate, and food sectors. Petrochemical and real estate companies
have approximately $8 billion principal repayments due over the next five years, while the maturity
profile for utilities and food companies is spread out over a longer period.
-
10
20
30
40
50
60
70
80
Sce
nar
io 3
Sce
nar
io 2
Sce
nar
io 1
20
15
20
14
20
13
20
12
20
11
20
10
Impact on Debt Profile(percent of total debt)
2<ICR<3 1<ICR<2 ICR<1 Debt-at-Risk (ICR<1.5)
0246810121416
Sce
nar
ios
20
15
20
14
20
13
20
12
20
11
20
10
Median Interest Coverage Ratio
Sample Sc 1 Sc 2 Sc 3
0% 20% 40% 60% 80% 100%
Scenario 3
Scenario 2
Scenario 1
2015
Impact on Debt at Risk Distribution(percent of total debt at risk)
Petrochemical Industries Agriculture & Food IndustriesCement ConstructionReal Estate Hotels & TourismIndustrial Investment Wholesale & retail tradeTransport TelecommunicationsMulti-investment Media & Publishing
0
2
4
6
8
10
12
14
Med
ia &
Pub
lish
ing
Mul
ti-i
nves
tmen
t
Pet
roch
emic
alIn
du
stri
es
Ind
ust
rial
Inve
stm
ent
Tele
com
s
Co
nstr
uct
ion
Rea
l Est
ate
Median Interest Coverage Ratio
2014
2015
0
2
4
6
8
10
12
14
20
05
20
06
20
07
20
08
20
09
20
10
20
11
20
12
20
13
20
14
20
15
20
16
1/
20
16
20
17
20
18
20
19
20
20
20
21
20
22
20
23
20
24
20
25
-
Saudi Corporate Bond Issuance and Principal Rollover Needs(billions US$)
Others
Food Industry
Real Estate
Utilities
Petrochemicals
Issuances Rollover Needs
Sources: Oribis; Bloomberg; and IMF staff estimates.1/ Issuance in 2016 is as of June 21.

SAUDI ARABIA
INTERNATIONAL MONETARY FUND 51
Appendix II. Fiscal and External Debt Sustainability
Saudi Arabia Public Sector Debt Sustainability Analysis (DSA) – Baseline Scenario
(In percent of GDP unless otherwise indicated)
As of June 10, 20162/
2014 2015 2016 2017 2018 2019 2020 2021 Sovereign Spreads
Nominal gross public debt 14.0 1.6 5.0 14.3 20.2 25.1 28.8 31.9 36.1 EMBIG (bp) 3/ n.a.
Public gross financing needs -7.3 4.0 16.8 12.9 9.6 8.7 6.9 6.2 7.7 5Y CDS (bp) 180
Real GDP growth (in percent) 4.1 3.6 3.5 1.2 2.0 2.6 2.6 2.3 2.3 Ratings Foreign Local
Inflation (GDP deflator, in percent) 8.6 -2.3 -17.2 -1.1 5.5 4.5 2.8 2.7 2.5 Moody's A1 A1
Nominal GDP growth (in percent) 13.4 1.3 -14.3 0.1 7.6 7.2 5.5 5.1 4.8 S&Ps A- A-
Effective interest rate (in percent) 4/ 5.3 5.8 5.9 5.2 3.9 4.2 4.6 4.9 5.2 Fitch AA- AA-
2014 2015 2016 2017 2018 2019 2020 2021 cumulative
Change in gross public sector debt -6.8 -0.6 3.4 9.3 5.9 4.9 3.7 3.1 4.2 31.1
Identified debt-creating flows -8.1 0.0 1.2 9.5 6.1 5.1 3.8 3.2 4.0 31.7
Primary deficit -12.9 3.3 15.8 12.7 9.1 7.9 5.8 4.9 6.2 46.6
Primary (noninterest) revenue and grants 43.6 36.9 25.4 22.7 23.2 25.6 26.1 26.8 26.5 150.9
Primary (noninterest) expenditure 30.7 40.2 41.2 35.4 32.3 33.5 31.9 31.7 32.6 197.5
Automatic debt dynamics 5/
-2.0 0.1 0.4 0.3 -0.5 -0.6 -0.2 -0.1 -0.1 -1.2
Interest rate/growth differential 6/
-2.0 0.1 0.4 0.3 -0.5 -0.6 -0.2 -0.1 -0.1 -1.2
Of which: real interest rate -1.3 0.2 0.4 0.3 -0.2 -0.1 0.4 0.6 0.6 1.6
Of which: real GDP growth -0.7 -0.1 -0.1 -0.1 -0.3 -0.5 -0.6 -0.6 -0.7 -2.7
Exchange rate depreciation 7/
0.0 0.0 0.0 … … … … … … …
Other identified debt-creating flows 6.8 -3.4 -15.0 -3.5 -2.5 -2.3 -1.8 -1.6 -2.1 -13.7
Accumulation of deposits 6.8 -3.4 -15.0 -3.7 -2.7 -2.5 -1.9 -1.8 -2.2 -14.7
Loans 0.0 0.0 0.0 0.2 0.2 0.2 0.2 0.1 0.1 1.0
Residual, including asset changes 8/
1.3 -0.6 2.2 -0.2 -0.2 -0.2 -0.1 -0.1 0.2 -0.6
in the projection period
Source: IMF staff.
1/ Public sector is defined as central government.
2/ Based on available data.
3/ Long-term bond spread over U.S. bonds.
4/ Defined as interest payments divided by debt stock (excluding guarantees) at the end of previous year.
5/ Derived as [(r - π(1+g) - g + ae(1+r)]/(1+g+π+gπ)) times previous period debt ratio, with r = interest rate; π = growth rate of GDP deflator; g = real GDP growth rate;
a = share of foreign-currency denominated debt; and e = nominal exchange rate depreciation (measured by increase in local currency value of U.S. dollar).
6/ The real interest rate contribution is derived from the numerator in footnote 5 as r - π (1+g) and the real growth contribution as -g.
7/ The exchange rate contribution is derived from the numerator in footnote 5 as ae(1+r).
8/ Includes asset changes and interest revenues (if any). For projections, includes exchange rate changes during the projection period.
9/ Assumes that key variables (real GDP growth, real interest rate, and other identified debt-creating flows) remain at the level of the last projection year.
balance 9/
-2.2
Contribution to Changes in Public Debt
Actual Projections
2005-2013 debt-stabilizing
primary
2005-2013
Debt, Economic and Market Indicators 1/
Actual Projections
-40
-30
-20
-10
0
10
20
30
40
2005 2006 2007 2008 2009 2010 2011 2012 2013 2014 2015 2016 2017 2018 2019 2020 2021
Debt-Creating Flows
Primary deficit Real GDP growth Real interest rate
Exchange rate depreciation Other identified debt-creating flows Residual
Change in gross public sector debt
projection
(Percent of GDP)
-30.0
-20.0
-10.0
0.0
10.0
20.0
30.0
40.0
50.0
60.0
cumulative

SAUDI ARABIA
52 INTERNATIONAL MONETARY FUND
Saudi Arabia Public DSA – Composition of Public Debt and Alternative Scenarios
0
Baseline Scenario 2016 2017 2018 2019 2020 2021 Historical Scenario 2016 2017 2018 2019 2020 2021
Real GDP growth 1.2 2.0 2.6 2.6 2.3 2.3 Real GDP growth 1.2 3.9 3.9 3.9 3.9 3.9
Inflation from GDP defl -1.1 5.5 4.5 2.8 2.7 2.5 Inflation from GDP defl -1.1 5.5 4.5 2.8 2.7 2.5
CPI inflation 4.2 2.0 4.7 2.0 2.0 2.0 CPI inflation 4.2 2.0 4.7 2.0 2.0 2.0
Primary Balance -12.7 -9.1 -7.9 -5.8 -4.9 -6.2 Primary Balance -12.7 7.7 7.7 7.7 7.7 7.7
Effective interest rate 5.2 3.9 4.2 4.6 4.9 5.2 Effective interest rate 5.2 3.9 4.5 4.3 4.2 4.6
Constant Primary Balance Scenario
Real GDP growth 1.2 2.0 2.6 2.6 2.3 2.3
Inflation from GDP defl -1.1 5.5 4.5 2.8 2.7 2.5
CPI inflation 4.2 2.0 4.7 2.0 2.0 2.0
Primary Balance -12.7 -12.7 -12.7 -12.7 -12.7 -12.7
Effective interest rate 5.2 6.8 7.0 6.9 7.0 7.1
Source: IMF staff.
Note: The constant primary balance scenario assumes all financing needs are met through the issuance of short-term debt and is rolled over in full each year, adding to pressures on gross
financing needs.
Underlying Assumptions(in percent)
Saudi Arabia Public DSA - Composition of Public Debt and Alternative Scenarios
Alternative Scenarios
Composition of Public Debt
Baseline Historical Constant Primary Balance
0.0
10.0
20.0
30.0
40.0
50.0
60.0
70.0
80.0
2014 2015 2016 2017 2018 2019 2020 2021
Gross Nominal Public Debt
(Percent of GDP)
projection
-10
-5
0
5
10
15
20
25
2014 2015 2016 2017 2018 2019 2020 2021
Public Gross Financing Needs
(Percent of GDP)
projection
0
5
10
15
20
25
30
35
40
0
5
10
15
20
25
30
35
40
2005 2007 2009 2011 2013 2015 2017 2019 2021
By Maturity
Medium and long-term
Short-term
projection
(Percent of GDP)
0
5
10
15
20
25
30
35
40
0
5
10
15
20
25
30
35
40
2005 2007 2009 2011 2013 2015 2017 2019 2021
By Currency
Local currency-denominated
Foreign currency-denominated
projection
(Percent of GDP)

SAUDI ARABIA
INTERNATIONAL MONETARY FUND 53
External Debt Sustainability: Bound Tests 1/ 2/
(External debt in percent of GDP)
i-rate
shock 23
Baseline22
0
20
40
60
80
100
120
2011 2013 2015 2017 2019 2021
Interest rate shock (in percent)
Sources: International Monetary Fund, Country desk data, and staff estimates.
1/ Shaded areas represent actual data. Individual shocks are permanent one-half standard deviation
shocks. Figures in the boxes represent average projections for the respective variables in the baseline
and scenario being presented. Ten-year historical average for the variable is also shown.
2/ For historical scenarios, the historical averages are calculated over the ten-year period, and the
information is used to project debt dynamics five years ahead.
3/ Permanent 1/4 standard deviation shocks applied to real interest rate, growth rate, and current
account balance.
4/ One-time real depreciation of 30 percent occurs in 2010.
Historical-42
Baseline
22
-20
-15
-10
-5
0
5
10
15
20
-60
-40
-20
0
20
40
60
80
100
120
2011 2013 2015 2017 2019 2021
Baseline and historical scenarios
CA shock
50
Baseline22
0
20
40
60
80
100
120
2011 2013 2015 2017 2019 2021
Combine
d shock
38
Baseline22
0
20
40
60
80
100
120
2011 2013 2015 2017 2019 2021
Combined shock 3/
30 %
depreciati
on
34
Baseline22
0
20
40
60
80
100
120
2011 2013 2015 2017 2019 2021
Real depreciation shock 4/
Growth
shock 24
Baseline22
0
20
40
60
80
100
120
2011 2013 2015 2017 2019 2021
Gross financing need
under baseline
(right scale)
Non-interest current account shock
(in percent of GDP)
Baseline:
Scenario:
Historical:
4.3
5.3
3.8
Growth shock
(in percent per year)
Baseline:
Scenario:
Historical:
2.3
0.8
3.9
Baseline:
Scenario:
Historical:
-0.5
-6.1
16.2

External Debt Sustainability Framework, 2011–21
(In percent of GDP, unless otherwise indicated)
Projections
2011 2012 2013 2014 2015 2016 2017 2018 2019 2020 2021 Debt-stabilizing
non-interest
current account 6/
Baseline: External debt 13.5 12.0 11.6 12.5 15.2 18.7 20.5 20.8 21.2 21.7 22.1 1.7
Change in external debt -4.3 -1.5 -0.4 0.9 2.7 3.4 1.9 0.2 0.5 0.4 0.4
Identified external debt-creating flows (4+8+9) -24.0 -22.0 -16.8 -7.3 11.9 7.6 3.8 2.9 2.2 1.7 1.4
Current account deficit, excluding interest payments -24.0 -22.8 -18.5 -10.1 7.9 5.9 2.2 1.2 0.3 -0.4 -0.8
Deficit in balance of goods and services -26.6 -25.1 -21.2 -12.7 4.4 3.9 0.4 0.2 -0.4 -1.1 -1.7
Exports 56.2 54.4 52.1 47.1 33.6 31.1 33.1 32.8 32.8 33.1 33.4
Imports 29.6 29.3 30.9 34.4 38.0 35.0 33.5 33.0 32.4 32.0 31.7
Net non-debt creating capital inflows (negative) 3.5 1.7 1.6 2.7 1.5 1.4 1.4 1.5 1.5 1.5 1.6
Automatic debt dynamics 1/ -3.5 -0.9 0.1 0.1 2.5 0.3 0.1 0.2 0.4 0.6 0.6
Contribution from nominal interest rate 0.4 0.3 0.3 0.3 0.4 0.4 0.5 0.7 0.9 1.1 1.1
Contribution from real GDP growth -1.4 -0.7 -0.3 -0.4 -0.5 -0.2 -0.3 -0.5 -0.5 -0.5 -0.5
Contribution from price and exchange rate changes 2/ -2.4 -0.5 0.1 0.3 2.6 ... ... ... ... ... ...
Residual, incl. change in gross foreign assets (2-3) 3/ 19.7 20.5 16.3 8.2 -9.2 -4.2 -2.0 -2.6 -1.7 -1.3 -1.0
External debt-to-exports ratio (in percent) 24.1 22.1 22.3 26.6 45.4 60.0 62.0 63.3 64.7 65.5 66.2
Gross external financing need (in billions of US dollars) 4/ -115.9 -129.8 -85.7 -32.4 107.3 97.3 79.6 81.5 83.3 86.3 89.9
in percent of GDP -17.3 -17.7 -11.5 -4.3 16.6 10-Year 10-Year 15.1 11.4 10.9 10.6 10.4 10.4
Scenario with key variables at their historical averages 5/ 18.7 5.5 -7.8 -20.1 -31.5 -42.2 6.4
Historical Standard
Key Macroeconomic Assumptions Underlying Baseline Average Deviation
Real GDP growth (in percent) 10.0 5.4 2.7 3.6 3.5 3.9 3.1 1.2 2.0 2.6 2.6 2.3 2.3
GDP deflator in US dollars (change in percent) 15.6 4.0 -1.2 -2.3 -17.2 3.8 12.8 -1.1 5.5 4.5 2.8 2.7 2.5
Nominal external interest rate (in percent) 2.5 2.7 2.4 2.3 2.5 3.8 2.0 2.9 2.9 3.5 4.4 5.2 5.3
Growth of exports (US dollar terms, in percent) 43.7 6.2 -2.9 -8.5 -38.9 4.9 27.6 -7.3 14.8 6.2 5.5 6.1 5.6
Growth of imports (US dollar terms, in percent) 13.6 8.7 6.9 12.6 -5.3 11.5 12.6 -7.7 3.1 5.5 3.6 3.8 3.9
Current account balance, excluding interest payments 24.0 22.8 18.5 10.1 -7.9 16.2 11.1 -5.9 -2.2 -1.2 -0.3 0.4 0.8
Net non-debt creating capital inflows -3.5 -1.7 -1.6 -2.7 -1.5 -4.8 3.1 -1.4 -1.4 -1.5 -1.5 -1.5 -1.6
1/ Derived as [r - g - r(1+g) + ea(1+r)]/(1+g+r+gr) times previous period debt stock, with r = nominal effective interest rate on external debt; r = change in domestic GDP deflator in US dollar terms, g = real GDP growth rate,
e = nominal appreciation (increase in dollar value of domestic currency), and a = share of domestic-currency denominated debt in total external debt.
2/ The contribution from price and exchange rate changes is defined as [-r(1+g) + ea(1+r)]/(1+g+r+gr) times previous period debt stock. r increases with an appreciating domestic currency (e > 0) and rising inflation (based on GDP deflator).
3/ For projection, line includes the impact of price and exchange rate changes.
4/ Defined as current account deficit, plus amortization on medium- and long-term debt, plus short-term debt at end of previous period.
5/ The key variables include real GDP growth; nominal interest rate; dollar deflator growth; and both non-interest current account and non-debt inflows in percent of GDP.
6/ Long-run, constant balance that stabilizes the debt ratio assuming that key variables (real GDP growth, nominal interest rate, dollar deflator growth, and non-debt inflows in percent of GDP) remain at their levels
of the last projection year.
Actual
SA
UD
I AR
AB
IA
54
IN
TER
NA
TIO
NA
L MO
NETA
RY F
UN
D

SAUDI ARABIA
INTERNATIONAL MONETARY FUND 55
Appendix III. External Sustainability Assessment
for Saudi Arabia
Staff believes the peg to the U.S. dollar serves Saudi Arabia well. Staff’s assessment is that the
external position in 2015 was substantially weaker than suggested by fundamentals and desirable
medium-term policy settings. Substantial fiscal adjustment will be needed over the medium term to
bring the current account back in line with fundamentals and support the exchange rate peg. As
long as credible fiscal adjustment is in place, the exchange rate peg remains the best option for
Saudi Arabia.
The current account moved into a deficit in 2015 due to falling oil prices. From a surplus of
9.8 percent of GDP in 2014, the current account moved into a deficit of 8.3 percent of GDP in
2015 as oil prices declined by over
50 percent and despite an increase
in oil export volumes for the year of
around 6 percent. The current
account deficit is projected to
improve in 2016 to 6.4 percent of
GDP and then narrow further to close
to zero balance by 2021 as oil prices
partially recover. From a savings-
investment perspective, the current
account deterioration in 2015 was
due to a sharp decline in public sector
saving which more than offset lower
public sector investment and a smaller positive private sector saving-investment gap, likely due
to lower corporate saving.
-20
-15
-10
-5
0
5
10
15
20
25
30
2010 2011 2012 2013 2014 2015
SI gap Private SI gap Public
Saving - Investment Gap Fiscal balance
Savings-Investment Balance
percent of GDP
-60
-40
-20
0
20
40
60
80
2010 2011 2012 2013 2014 2015
Transfers (net) Investment income (net)
Workers' compensation Services (net)
Imports Non-oil exports
Oil exports Trade balance
Current Account
Contribution to Current Account, 2010-2015(in percent of GDP)
-12
-10
-8
-6
-4
-2
0
2
4
6
8
2010 2011 2012 2013 2014 2015
Other investment liabilities Other investment assets
Portfolio Liabilities Portfolio Assets
FDI in Saudi Arabia FDI abroad
Financial account
Contribution to Financial Account, 2010-2015(in percent of GDP)

SAUDI ARABIA
56 INTERNATIONAL MONETARY FUND
Financial outflows continued in 2015 even as
the current account balance moved into
deficit. In the 1990s, a current account deficit was
associated with financial inflows (including errors
and omissions), thus limiting the effect on
reserves. In 2015, while the current account
moved into a deficit, the non-government sector
continued to accumulate assets. Both portfolio
and other investment outflows continued to rise,
and SAMA’s net foreign reserves fell substantially
by $115 billion to $609 billion at end-2015.
Foreign exchange reserves remain large when compared to standard coverage metrics. In the
absence of a sovereign wealth fund, reserves play a dual role – for precautionary motives and as
savings for future generation. SAMA’s
net foreign assets stood at $609 billion
(94 percent of GDP, 32 months of
imports, 129 percent of broad money
and 700 percent of the Fund’s reserve
metric) at end-2015. The fund’s
composite metric to measure adequacy
of precautionary reserves (developed
for emerging markets) is calculated as a
weighted sum of four components
reflecting potential sources of reserves
pressures. In the case of Saudi Arabia,
exports of goods and services and
broad money contribute the most to the ARA metric, while short term external debt and other
liabilities represent a much smaller share. The reserve coverage, of 700 percent of the metric in 2015
declining to 273 percent of the metric by 2021, compares to the Fund’s recommended range of
reserves of 100 to 150 percent.
Saudi Arabia has a sizable positive net IIP position despite the substantial drawdown of
reserves in 2015. Net external assets were an estimated 109 percent of GDP at end-2015, with
external assets at 154 percent of GDP and external liabilities at 45 percent of GDP. Net external
assets declined by 12 percent of GDP in 2015 after increasing significantly over the previous
decade. International reserves account for 62 percent of external assets, while portfolio and other
investments constitute a 20 and 11 percent share respectively. No details are available on the
composition of external assets. The average return on assets has been relatively low at
2.7 percent compared to 3.3 percent on liabilities during 2014-2015.
-25
-20
-15
-10
-5
0
5
10
15
20
25
30
20
05
20
06
20
07
20
08
20
09
20
10
20
11
20
12
20
13
20
14
20
15
20
16
Current account
Financial account including net errors and omissions
change in Reserves
Current and Financial Account Balancespercent of GDP
0
200
400
600
800
1000
0
200
400
600
800
1000
3 Months Imports Greenspan-Guidotti 2/
Broad Money Fund ARA Metric
Reserve Coverage in Saudi Arabia and Emerging Markets, 2015
(Percent)
1/ Excludes top three values
2/ Excludes negative values
Source: Country authorities and IMF staff estimates.
Top 1/
Median
Saudi (2015)
Interquartile
Range
Saudi (2021)
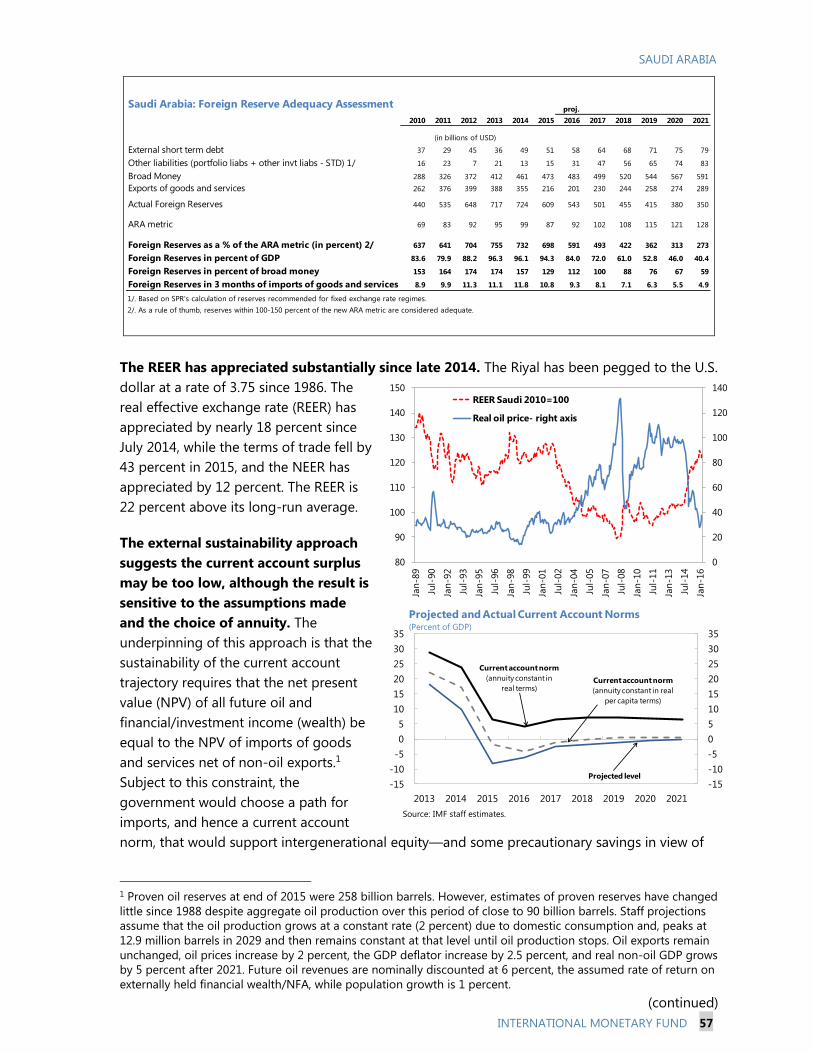
SAUDI ARABIA
INTERNATIONAL MONETARY FUND 57
The REER has appreciated substantially since late 2014. The Riyal has been pegged to the U.S.
dollar at a rate of 3.75 since 1986. The
real effective exchange rate (REER) has
appreciated by nearly 18 percent since
July 2014, while the terms of trade fell by
43 percent in 2015, and the NEER has
appreciated by 12 percent. The REER is
22 percent above its long-run average.
The external sustainability approach
suggests the current account surplus
may be too low, although the result is
sensitive to the assumptions made
and the choice of annuity. The
underpinning of this approach is that the
sustainability of the current account
trajectory requires that the net present
value (NPV) of all future oil and
financial/investment income (wealth) be
equal to the NPV of imports of goods
and services net of non-oil exports.1
Subject to this constraint, the
government would choose a path for
imports, and hence a current account
norm, that would support intergenerational equity—and some precautionary savings in view of
1 Proven oil reserves at end of 2015 were 258 billion barrels. However, estimates of proven reserves have changed
little since 1988 despite aggregate oil production over this period of close to 90 billion barrels. Staff projections
assume that the oil production grows at a constant rate (2 percent) due to domestic consumption and, peaks at
12.9 million barrels in 2029 and then remains constant at that level until oil production stops. Oil exports remain
unchanged, oil prices increase by 2 percent, the GDP deflator increase by 2.5 percent, and real non-oil GDP grows
by 5 percent after 2021. Future oil revenues are nominally discounted at 6 percent, the assumed rate of return on
externally held financial wealth/NFA, while population growth is 1 percent.
(continued)
-15
-10
-5
0
5
10
15
20
25
30
35
-15
-10
-5
0
5
10
15
20
25
30
35
2013 2014 2015 2016 2017 2018 2019 2020 2021
Projected and Actual Current Account Norms (Percent of GDP)
Source: IMF staff estimates.
Current account norm
(annuity constant in
real terms)Current account norm
(annuity constant in real
per capita terms)
Projected level
0
20
40
60
80
100
120
140
80
90
100
110
120
130
140
150
Jan
-89
Jul-
90
Jan
-92
Jul-
93
Jan
-95
Jul-
96
Jan
-98
Jul-
99
Jan
-01
Jul-
02
Jan
-04
Jul-
05
Jan
-07
Jul-
08
Jan
-10
Jul-
11
Jan
-13
Jul-
14
Jan
-16
REER Saudi 2010=100
Real oil price- right axis
Saudi Arabia: Foreign Reserve Adequacy Assessmentproj.
2010 2011 2012 2013 2014 2015 2016 2017 2018 2019 2020 2021
External short term debt 37 29 45 36 49 51 58 64 68 71 75 79
Other liabilities (portfolio liabs + other invt liabs - STD) 1/ 16 23 7 21 13 15 31 47 56 65 74 83
Broad Money 288 326 372 412 461 473 483 499 520 544 567 591
Exports of goods and services 262 376 399 388 355 216 201 230 244 258 274 289
Actual Foreign Reserves 440 535 648 717 724 609 543 501 455 415 380 350
ARA metric 69 83 92 95 99 87 92 102 108 115 121 128
Foreign Reserves as a % of the ARA metric (in percent) 2/ 637 641 704 755 732 698 591 493 422 362 313 273
Foreign Reserves in percent of GDP 83.6 79.9 88.2 96.3 96.1 94.3 84.0 72.0 61.0 52.8 46.0 40.4
Foreign Reserves in percent of broad money 153 164 174 174 157 129 112 100 88 76 67 59
Foreign Reserves in 3 months of imports of goods and services 8.9 9.9 11.3 11.1 11.8 10.8 9.3 8.1 7.1 6.3 5.5 4.9
1/. Based on SPR's calculation of reserves recommended for fixed exchange rate regimes.
2/. As a rule of thumb, reserves within 100-150 percent of the new ARA metric are considered adequate.
(in billions of USD)

SAUDI ARABIA
58 INTERNATIONAL MONETARY FUND
volatile oil prices—through an appropriate pace of accumulation of net foreign assets. Import
trajectories (“annuities or allocation rules)” are calculated under two different policy scenarios:
(i) constant real per capita annuity; and (ii) constant real annuity. Both types of annuities are used
in the literature, and can be derived from the optimization of plausible government utility
functions.2 These estimated CA norms suggest that the projected current account balance
(baseline) is below the two norms- see chart below. The current account deficit in 2015
was 8.3 percent of GDP, while the current account norms under the external sustainability (ES)
approach are estimated at 6.5 percent of GDP and 0.5 percent of GDP under the constant real
per capita annuity and constant real annuity allocation rules respectively (these estimates are
subject to considerable uncertainty and sensitive to the parameters assumed). The corresponding
current account gaps are estimated to be large at, respectively, -14.8 percent and -8.8 percent of
GDP. The estimated fiscal gap is -19.7 percent of GDP (constant real per capita allocation rule)
and -14.6 percent of GDP (constant real annuity allocation rule), with both derived as the
difference between the actual fiscal balance and that consistent with intergenerational equity
under the respective allocation rule. If the large fiscal gap is closed, the current account gap is
largely eliminated.
Estimates based on the EBA-lite methodology suggest that the current account balance is
below the norm for 2015. The current account norm was 1.5 percent of GDP compared with an
actual level of -8.3 percent of GDP, producing an estimated current account gap of -9.8 percent
of GDP which is primarily driven by
current fiscal policy settings (difference
between the actual and desired fiscal
policy). The EBA-lite methodology builds
on the EBA approach and is applied to a
wider group of countries. The EBA and
EBA-lite approaches provide regression-
based estimates of current account and
real effective exchange norms and gaps
for countries. Norms are the estimated
levels of the current account based on
underlying fundamentals, while gaps are
the deviations of observed values from
the norms. The EBA-lite methodology is
estimated on a wide group of countries with very different characteristics and therefore does not
adequately account for the specifics of oil exporting countries (such as the need for
intergenerational savings because oil resources are non-renewable).
2 See Bems, R., and I. de Carvalho Filho, 2009, “Exchange Rate Assessments: Methodologies for Oil Exporting
Countries,” IMF Working Paper 09/281.
In percent of GDP
Annuity real
per capita
Annuity
real
External sustainability approach
Current account norm 6.5 0.5
Actual current account balance -8.3 -8.3
Current account gap -14.8 -8.8
Fiscal balance norm 3.8 -1.3
Actual fiscal balance -15.9 -15.9
Fiscal balance gap -19.7 -14.6
EBA-lite approach
Current account norm 1.5
Current account gap -9.8
Policy gap -7.4
Current and Fiscal Account Actuals and Norms
Source. IMF staff calculations.

SAUDI ARABIA
INTERNATIONAL MONETARY FUND 59
The impact of exchange rate depreciation on the external and fiscal accounts
Exchange rate depreciation is likely to have a small impact on the current account position
in Saudi Arabia given the structure of the economy. Due to the limited substitutability
between domestic and imported goods, the
volume of imports is unlikely to be
significantly affected by exchange rate
depreciation while higher local-currency price
of imports increases import costs. Also,
domestically-produced products have
significant imported labor and intermediate
input content. Non-oil goods and services
exports are much smaller than oil exports, but
depreciation would increase demand for these
exports. Calculations using the volume
elasticity estimates from Hakura and Billmeier
(2008) (assumes non-oil export volume
elasticity of 0.67 and import volume elasticity of -0.09 and no change in volume of oil exports)
suggest a 10 percent depreciation in 2016 would improve the goods and services balance by
0.6 percentage points of GDP. Using a higher import volume elasticity of -0.243 would suggest
that the goods and services balance would improve by 1.1 percentage points of GDP following a
10 percent depreciation.
Depreciation would improve the fiscal balance if nominal expenditure allocations do not
change. On the revenue side, exchange rate adjustment would translate into revenue gains in
local currency (given oil exports are priced in
dollars) and there would be small increases in
nonoil revenue (mainly from the increase in
custom revenues). A 10 percent depreciation
is estimated to increase revenues and improve
the fiscal balance by about 1.5 percent of GDP
in 2016 (scenario 1). As prices change with
depreciation and inflationary pressures build
up, it may be politically difficult and
economically undesirable to keep
expenditures unchanged as this would result
in an upfront and across the board reduction
in real spending. Allowing nominal
expenditures to rise to permit full pass-
through of higher import prices (assuming a
50 percent share of imported goods in
expenditures) would see the fiscal balance worsen by 0.1 percentage points of GDP (Scenario 2).
The negative impact of a depreciation on the fiscal balance when expenditures increase is driven
by the fact that nominal expenditures in 2016 are some 2.5 times higher than oil revenues.
3 IMF, World Economic Outlook, October 2015, Chapter 3, “Exchange Rates and Trade Flows: Disconnected?”
0.60
1.09
-4
-3
-2
-1
0
1
2
3
4
1
Additional Impact on Imports (G&S) 1/Oil exports
Non-oil exports (G&S)
Imports (G&S) 2/
Trade balance (G&S) 2/
Trade balance (G&S) 1/
Impact of a 10 percent exchange rate depreciation of
on the trade balance in 2016
(semi-elasticity, percentage point of GDP)
1/ Import volume elasticity of -0.09 is used.
2/ Import volume elasticity of -0.24 is used.
Baseline Scenario 1 1/ Scenario 2 2/
in SR billionRevenueTotal 551 588 588Oil 343 377 377Nonoil 208 210 210
ExpenditureTotal 865 865 905Wages 409 409 429Goods and services 168 168 176Capital 208 208 218Others 80 80 80
Fiscal Balance -314 -278 -317
GDP 2424 2424 2424
Balance/GDP -13.0 -11.4 -13.1
10% depreciation
Impact of exchange rate depreciation on the
fiscal balance in 2016
2/ Assume a 50 percent passthrough of higher relative prices on
nominal expenditure (assuming a 50 percent share of imports in
non-oil GDP).
1/ Assume no change in nominal expenditure.
Impact of Exchange Rate Depreciation on the
Fiscal Balance in 2016

Saudi Arabia Overall Assessment
Foreign asset and
liability position
and trajectory
Background. Net external assets were estimated at 109 percent of GDP at end-2015, with external assets
at 154 percent of GDP and external liabilities at 45 percent of GDP.1/ Net external assets declined by 12
percent of GDP during 2015 after increasing significantly over the previous decade. This was largely due
to a decline in central bank fx reserves. Projections suggest that the NIIP-to-GDP ratio will decline further
over the medium-term under the current oil price baseline and current fiscal policy settings, but would
remain above 60 percent of GDP in 2021. No details are available on the composition of external assets.
Assessment. The external balance sheet is very strong at present. Substantial accumulated assets
represent both savings of the exhaustible resource revenues for future generations and protection
against vulnerabilities from oil price volatility given the high reliance on oil revenues.
Overall Assessment:
The external position in 2015 was substantially
weaker than suggested by fundamentals and
desirable medium-term fiscal policy settings.
Substantial fiscal adjustment is needed over the
medium-term to reduce the current account deficit
and support the peg.
Given the close link between the fiscal and external
balance and the structure of the Saudi Arabian
economy, with exports dominated by oil and oil-
related products and a limited substitutability
between imports and domestically produced
goods, external adjustment will be driven by fiscal
policy rather than the exchange rate.
The external balance sheet remains very strong at
present. Despite the substantial drawdown in 2015,
reserves remain very comfortable when judged
against standard Fund metrics. Nevertheless, under
current fiscal policy settings, reserves will continue
to decline over the medium-term if oil prices stay
low, and substantial fiscal adjustment is therefore
needed.
Potential policy responses:
A substantial and sustained fiscal consolidation is
necessary to strengthen the CA over the medium-
term and support the exchange rate peg. This
consolidation is underway, but more is needed. The
government should set out a credible medium-
term fiscal consolidation plan based on further
energy price reforms, non-oil revenue measures,
and continued expenditure compression. Despite
recent adjustment, the non-oil primary fiscal deficit
remains significantly above the level implied by
intergenerational equity models. Fiscal adjustment
should be supported by reforms to strengthen the
fiscal framework.
Current account Background. Preliminary estimates suggest the current account (CA) recorded a deficit in 2015 of 8.3
percent of GDP compared to a surplus of 9.8 percent of GDP in 2014. This change largely reflected lower
oil revenues (down by 14 percent of GDP) and weaker petrochemical prices. The CA deficit is projected at
6.4 percent of GDP this year, and then it narrows further as oil prices increase (to about 0.3 percent of
GDP in 2021).2/
Assessment. The heavy reliance on oil subjects the CA to wide swings and the assessment of its external
position to considerable uncertainty. The estimated size of the CA gap varies with the methodology used
and is largely driven by current fiscal policy settings being away from those seen as desirable by staff
over the medium-term. The estimated gap varies from -9.8 percent of GDP using EBA-lite to -8.8 and -
14.8 percent of GDP using the external sustainability (ES) approach).3/ In line with these estimates and
considerable uncertainties, staff assesses a large negative CA gap within this range of estimates. The CA
gap is largely driven by the fiscal policy gap.
Real exchange
rate
Background. The Riyal has been pegged to the U.S. dollar at a rate of 3.75 since 1986. As the U.S. dollar
has appreciated, the NEER and REER have strengthened by 14 percent and 18 percent respectively since
July 2014. The terms of trade fell by 43 percent in 2015 and has declined further in 2016. The REER is
currently 22 percent above its average over the past decade.
Assessment. Most exports are oil or oil-related products, and exchange rate movements have a limited
impact on competitiveness. With a limited substitutability between imports and domestically-produced
products, which in turn have significant imported labor and intermediate input content, exchange rate
movements are expected to have a small impact on the demand for imports through the substitution
channel given the very limited availability of domestically-produced goods.
Capital and
financial
accounts:
flows and policy
measures
Background. Inflows are dominated by FDI, while outflows are largely trade credits, accumulation of
foreign assets by banks, and portfolio investment overseas. The equity market was opened to direct
investment by registered foreign investors in mid-2015, but activity to date has been limited. In mid-
January, SAMA instructed banks to halt the sale of foreign exchange options contracts on riyal forwards.
Assessment. While financial outflows remained high in 2015 despite the decline in oil prices, the strong
reserves position limits immediate risks or vulnerabilities associated with capital flows.
SA
UD
I AR
AB
IA
INTER
NA
TIO
NA
L MO
NETA
RY F
UN
D
63
SA
UD
I AR
AB
IA
60
IN
TER
NA
TIO
NA
L MO
NETA
RY F
UN
D

Saudi Arabia (concluded) Overall Assessment
FX intervention
and reserves
level
Background. Saudi Arabia does not have a SWF. The government’s foreign assets are held at the central bank
within international reserves. Reserves were $609 billion (94 percent of GDP, 32 months of imports, and 700
percent of the IMF’s reserve metric) at end-2015. Reserves fell by $115 billion during 2015.
Assessment. Reserves play a dual role—for both precautionary motives and as savings for future generations.
Reserves are more than adequate for precautionary purposes (measured by the Fund’s metrics) at present.
Nevertheless, a substantial fiscal adjustment is needed to help moderate the decline in reserves and support the
exchange rate peg. A return to a CA surplus and the resulting NIIP accumulation will be needed over the
medium-term to ensure an equitable intergenerational transfer of oil revenues.
Technical
Background
Notes
1/ The NIIP may be underestimated given large errors and omissions in the balance of payments data and
inconsistencies between the BoP and IIP data. Errors and omissions have exceeded 6 percent of GDP in some
years and stood at 3 percent of GDP in 2015. These likely reflect either an under-recording of imports and/or
financial outflows.
2/At current oil production levels, a $1 change in the oil price results in a 0.5 percent of GDP first round change
in the current account balance. Historically, the current account and fiscal balance have been closely related
(correlation of 0.9 from 1995 to 2014).
3/ EBA methodology assessments are not available for Saudi Arabia. Staff considered two methodologies,
including one that incorporates the special intertemporal considerations that are dominant in economies in
which exports of non-renewable resources are a very high share of output and exports. Estimates suggest that
CA norms under the external sustainability (ES) approach were 6.5 percent of GDP and 0.5 percent of GDP under
the constant real per capita annuity and constant real annuity allocation rules respectively. The norm was
1.5 percent of GDP under the EBA-lite approach. The preliminary estimate of the CA deficit in 2015 is 8.3 percent
of GDP. The corresponding CA gaps are estimated at, respectively, -14.8, -8.8, and -9.8 percent of GDP. The
estimated fiscal gap is -19.7 percent of GDP (constant real per capita allocation rule) and -14.6 percent of GDP
(constant real annuity allocation rule), with both derived as the difference between the actual fiscal balance and
that consistent with intergenerational equity under the respective allocation rule.
20
SA
UD
I AR
AB
IA
IN
TER
NA
TIO
NA
L MO
NETA
RY F
UN
D 6
1

SAUDI ARABIA
62 INTERNATIONAL MONETARY FUND
APPENDIX IV. THE RESILIENCE OF SAUDI BANKS TO LOWER ASSET
QUALITY AND DEPOSIT WITHDRAWALS
This Annex updates the scenario analyses of asset quality and liquidity risk conducted in conjunction
with the 2015 Article IV mission (see IMF (2015)).1
Asset quality scenarios
Using the same parameter estimates as in IMF (2015) and the most recent projections of oil prices
and nonoil private sector GDP growth, the future estimated path of bank-level NPLs is derived.
Three scenarios are considered.
Scenario I assumes that oil prices decline from an average of $50 a barrel in 2015 to $43 a
barrel in 2016, and recover to $56 a barrel in 2020. Nonoil private sector GDP growth moderates
from 3.4 percent in 2015, to 2.1 percent in 2016 and recovers to 4 percent in 2020. Bank
profitability moderates and new NPLs are assumed to be provisioned at 120 percent, above
regulatory requirements of 100 percent.
In Scenario II, oil prices fall from $50 a barrel in 2015 to $32 a barrel in 2016 and recover to
$36 a barrel in 2020. Nonoil private sector GDP growth declines into negative territory in 2016,
before recovering to 1.5 percent in 2020 (these are 1 standard deviation below the levels
assumed in Scenario I, respectively).2 Bank profitability moderates further and banks provision
100 percent of new NPLs.
Scenario III is constructed to estimate the extent of a growth slowdown that would be needed
to reduce the average capital ratio to 12 percent in 2020. All assumptions other than the
trajectory of nonoil private sector GDP growth remain unchanged.
Simulation results suggest that Saudi banks can generally withstand higher NPLs and lower profits
under the economic scenarios considered.
Scenario I: The aggregate NPL ratio rises to 3.9 percent by 2020. The aggregate capital ratio
remains above 18 percent. This is despite 120 percent of new NPLs being provisioned, which
dents profits but helps maintain provisions at above 130 percent of total NPLs.
In Scenario II, the NPL ratio rises to 10 percent and provisions cover about 1.1 times the stock
of NPLs in 2020. Profitability declines and provisioning needs increase, but the capital ratio
remains at around 14 percent. For five banks, the capital ratio declines below 12 percent, but
remains above the 8 percent international regulatory minimum. Resources required to bring
1 “Assessing the Resilience of Saudi Banks to Weaker Economic Conditions,” IMF Country Report No. 15/286. The
results should be interpreted with a range of caveats elaborated in the referenced note in mind.
2 For nonoil private sector GDP growth, historical standard deviation during 2005–15 is used. For oil prices, one
standard deviation forecast errors reported in the IMF WEO through 2017 is applied to the central forecasts through
2020.

SAUDI ARABIA
INTERNATIONAL MONETARY FUND 63
the 5 banks’ capital ratios back to 12 percent are small, equivalent to 0.2 percent of GDP (about
SAR 5 billion).
In Scenario III, to push the average capital ratio to 12 percent, nonoil private sector GDP growth
would need to contract by about 4 percent in 2016 and 1 percent in 2017, respectively, before
recovering to 1.5 percent in 2020. The NPL ratio would increase to about 14 percent in 2020.
Bank level capital ratios would fall below 12 percent for 7 banks, of which 4 banks would
maintain their capital ratios above 8 percent. Resources required to bring the 7 banks’ capital
ratios back to 12 percent are equivalent to 0.8 percent of GDP (about SAR 22 billion).
NPL ratio and its key determinants, 1995–2020: Historical and Scenarios I-III
Oil prices
(US dollars)
Nonoil private sector
GDP growth (Percent)
NPL ratio
(Percent)
Source: Bankscope, Haver, IMF WEO, and IMF staff estimates.
Note: Oil prices represent the simple average of prices of U.K. Brent, Dubai Fateh, and West Texas Intermediate crude oil in
nominal terms. The purpose of this analysis is to explore the resilience of the banking system in Saudi Arabia under alternative
macro-financial scenarios. They are not detailed stress tests as conducted in the 2011 FSAP Update, nor do they preempt those
that may be carried out in a future FSAP.
Liquidity scenarios:
The extent to which banks can accommodate deposit reductions by selling liquid (and to some
extent illiquid) assets within a 30-day window (divided into five periods, six days each) is
investigated using the same parameter values as in IMF (2015) and end-2015 bank balance sheet
data. Two scenarios are parameterized to calibrate Saudi Arabia’s historical experience, guided to
some extent by Schmieder et al. (2012).3
In Scenario A, demand and time deposits decline by 2 percent and 1 percent per period,
respectively, or by an average of 8 percent over the 30-day period. This is higher than the largest
monthly declined seen since 1993 which was 6 percent. 10 percent of liquid assets are
3 Schmieder C et al. 2012. “Next Generation System-Wide Liquidity Stress Testing,” IMF Working Paper 12/3.
0
20
40
60
80
100
120
95 00 05 10 15 20
HistoricalScenario IScenarios II & III
-5
0
5
10
15
20
95 00 05 10 15 20
Historical
Scenario I
Scenario II
Scenario III
0
2
4
6
8
10
12
14
16
95 00 05 10 15 20
Historical
Scenario I
Scenario II
Scenario III

SAUDI ARABIA
64 INTERNATIONAL MONETARY FUND
encumbered (25 percent of illiquid assets) and 95 percent of the remaining liquid assets are
available for sale in each 5-day period (2 percent for illiquid assets), both reducing the capacity
of banks to generate cash. Furthermore, liquid assets are sold with a 1 percent haircut
(15 percent for illiquid assets).
Scenario B is characterized by a faster deposit run and tighter market liquidity conditions.
Deposits decline by more than 10 percent during a 30-day window, a rate similar to the
11 percent reduction within a week seen in 1990 (when the run was triggered by a military
conflict rather than an oil price decline). Smaller shares of assets are available for sale
(85 percent for liquid assets and 1 percent for illiquid assets). Banks face higher rates of haircut
(5 percent and 30 percent) and encumbrance (20 percent and 50 percent).
Estimated Net Cash Flows
(Percent of initial total assets)
Scenario A Scenario B
Source: Bankscope, Haver, IMF WEO, IMF staff estimates.
Note: The purpose of this analysis is to explore the resilience of the banking system in Saudi Arabia under alternative macro-
financial scenarios. They are not detailed stress tests as conducted in the 2011 FSAP Update, nor do they preempt those that
may be carried out in a future FSAP.
The results suggest that the banking sector is generally resilient to the deposit withdrawals,
although some liquidity shortfall emerges in scenario B. In scenario A, there is no liquidity shortfall
for the banking sector as a whole or for any individual bank. In scenario B, the aggregate banking
system remains liquid, but four banks suffer liquidity shortages by 1-3 percent of initial assets (banks
# 4, 8, 10, 12).
-5
0
5
10
15
20
All 1 2 3 4 5 6 7 8 9 10 11 12
After period 1 After period 5
Individual banks
-5
0
5
10
15
20
All 1 2 3 4 5 6 7 8 9 10 11 12
After period 1 After period 5
Individual banks

SAUDI ARABIA
INTERNATIONAL MONETARY FUND 65
Appendix V. Status of Key Recommendations of the 2011
FSAP Update
Key Recommendations of 2011 FSAP Update
Recommendation Progress
Bank and Securities Regulation
Update the Banking Control Law (BCL) and
remove need for ministerial approval of certain
SAMA decisions.
The existing BCL has provided a strong basis for effective supervision.
Ministerial approval is only required in times of extreme stress and is
viewed by the Saudi Arabian Monetary Agency (SAMA) as a means of
ensuring communication with Cabinet.
No longer allow single large exposure up to 50
percent of bank’s own capital.
SAMA does not allow single large exposure up to 50 percent of bank’s own
capital. Revised regulations on large exposures require banks to ensure
that, by 2019, single exposure does not exceed 15 percent of bank’s own
capital. An aggregate large exposure limit of 400 percent of capital has
been introduced.
Strengthen the Capital Market Authority (CMA)’s
regulatory transparency by fully disclosing all
enforcement actions, interpretation, and
funding rules.
CMA has established an internal committee to discuss relevant Financial
Sector Assessment Program (FSAP) recommendations, including disclosure
policies.
Systemic Stability
Introduce a formal liquidity forecasting
framework.
SAMA is working on a liquidity forecasting framework.
Enhance data on cross-border financial activities
of banks and corporate.
SAMA submits a monthly reserves template to the IMF, publishes
International Investment Position (IIP) data on a quarterly basis, and
submits 12 core Financial Soundness Indicators (FSI) to the IMF. SAMA has
started collecting International Banking Statistics (IBS) data. These are
being reviewed with the Bank for International Settlement (BIS).
Maintain a stable stock of government securities
and regular issues to help anchor a robust yield
curve.
The government restarted issuing domestic bonds in mid-2015 to fund the
budget deficit. Public sector entities have been issuing sukuk. The
government signed a syndicated loan for $10 billion with international
banks in the second quarter of 2016.
Introduce a payment system law. SAMA has drafted a legal covering note based on the powers included in
the SAMA Charter. The note provides more explicit legal support to SAMA
as owner, operator, and regulator of the payment systems regarding the
variety of rules and regulations already in place.
Conduct stress tests with a wider range of
shocks, including liquidity shocks, on regular
basis and incorporate lessons into supervision.
SAMA is enhancing its top-down stress test model in collaboration with
IMF Technical Assistance (TA). Banks are required to conduct their own
bottom-up stress tests which are reviewed every year as part of the Internal
Capital Adequacy Assessment Process (ICAAP).
Establish a formal early warning system (EWS)
for the banking sector.
A EWS has become operational, guiding policy discussion at SAMA’s
Financial Stability Committee. The system includes a macroprudential
dashboard and an excel-based early warning model. The latter monitors a
range of variables including the credit-to-GDP ratio. The EWS will be
reviewed and adapted as necessary. SAMA publishes quarterly FSIs.
Develop a more formal and transparent
macroprudential policy framework, drawing on
work in international fora.
Within SAMA, a Financial Stability Committee and a Micro-Macro
Engagement sub-Committee have been established. The D-SIB framework
is being introduced in 2016 in line with previous announcements and the
second financial stability report was released in May. SAMA participates in
FSB peer reviews.
Strengthen the legal framework for bank
resolution.
A draft law on resolution (DLR) has been prepared and is currently going
through the legislative approval process. Once promulgated detailed
implementing regulations will be issued.

SAUDI ARABIA
66 INTERNATIONAL MONETARY FUND
Expanding Access to Finance and Preserving Financial Stability
As housing finance expands in the future,
ensure loan soundness through strong
prudential measures, notably lowering
permissible loan-to-value and debt service
ratios.
The loan-to-value ratio (LTV) was increased from 70 percent to
85 percent in early-2016 for residential real estate finance provided
by banks and finance companies. Finance companies are subject to a
cap on total financing assets at 5 times capital and reserves (which
can be increased up to 7 times capital and reserves with SAMA’s
permission). SAMA is engaging an external consulting firm to
develop responsible lending principles, including debt burden ratios.
Contract banks to manage both the existing and
new Real Estate Development Fund (REDF)
portfolio.
The Ministry of Housing and REDF are working closely with Saudi
Banks and Real Estate Finance Companies to develop and explore
various funding schemes. A number of alternative proposals are
being considered.
Complement mortgage reform by establishing a
housing market observatory, developing
consumer guidance options, and strengthening
the developer industry.
SAMA is coordinating with related government entities to facilitate
collection and publication of housing market data. SAMA has issued
the Consumer Protection Principles for banking and insurance,
emphasizing fair treatment, honesty, and financial inclusiveness. A
draft Consumer Protection Principles for finance companies is under
public consultation.
Prepare long-term funding solution for
mortgage finance, starting with a refinance
facility.
Public Investment Fund (PIF) is in the process of establishing the
Saudi Real Estate Refinance Company (fully owned by PIF and
supervised by SAMA), which is expected to provide long-term
funding solutions for mortgage finance.
Create a modern, electronic and unified registry
for movable collateral.
Assessment of the feasibility of establishing a financial lease registry
in the form of a company owned by licensed lessors has been
finalized. SAMA is coordinating with the Ministry of Justice to ensure
that registration certificates issued by the financial lease registry will
be admissible by courts and enforceable.
Enact and implement the draft Enforcement law
that introduces specialized enforcement courts
operating with strict time-bound procedures.
The Enforcement Law and its implementing regulation have been
issued and implemented by the Ministry of Justice and courts.
Closely supervise the quality of SME units in the
banks, including the robustness or their internal
rating systems and automated procedures.
Starting from 2012, SAMA has been collecting bank-level SME
exposures data. In the recent Supervisory review visits including the
ICAAP meetings with banks, SAMA followed up on the progress on
SME lending with each bank.
Insurance, Institutional Investors, and Capital Markets
Finalize and issue the outstanding functional
regulations for insurance.
SAMA has expedited all outstanding regulations, except corporate
governance regulations which are in draft phase. Three regulations -
actuarial, policyholders protection scheme and audit committee -
are in the final stage for publication.
Improve enforcement of mandatory motor third
party liability insurance.
A committee comprising representatives from the General
Department of Traffic, Najm for Insurance Services, and SAMA has
been established to address challenges facing the motor insurance
business in the Kingdom. Legislation has been issued requiring
insurance on all government (non-military) vehicles by the Council
of Ministers. A committee has been established to proceed with
implementation.
Disclose the investment policies, portfolio, and
portfolio performance of the Public Pension
Agency (PPA) and General Organization for
Social Insurance (GOSI).
As part of its policy to gradually increase disclosures, the GOSI Board
of Directors has recently approved a more active disclosure policy by
which GOSI will commit to disclosing elements of its investment
policy and performance.
Further outsource the management of portfolio
of the PPA and GOSI.
GOSI’s investment division has been spun off as Hasanah, which is
fully owned by GOSI and manages GOSI’s domestic and foreign
assets.
Permit foreign investors to invest directly in
Saudi Stock Exchange (Tadawul)
Qualified Foreign Financial Institutions are allowed to directly own
listed shares from June 15, 2015. Several initiatives to help improve
foreign participation and the settlement infrastructure of Tadawul
were announced in May 2016 and will be implemented in 2017.

SAUDI ARABIA
STAFF REPORT FOR THE 2016 ARTICLE IV
CONSULTATION—INFORMATIONAL ANNEX
Prepared By
Middle East and Central Asia Department
(In consultation with other departments)
FUND RELATIONS _______________________________________________________________________ 2
RELATIONS WITH THE WORLD BANK GROUP _________________________________________ 5
STATISTICAL ISSUES ____________________________________________________________________ 7
CONTENTS
July 29, 2016

SAUDI ARABIA
2 INTERNATIONAL MONETARY FUND
FUND RELATIONS (As of June 15, 2016)
Membership Status: Joined August 26, 1957; Article VIII.
General Resources Account: SDR Million Percent Quota
Quota 9,992.60 100.00
Fund holdings of currency 9,536.88 95.44
Reserve tranche position
Lending to the Fund
New Arrangement to Borrow
455.73
997.75
4.56
SDR Department SDR Million Percent Allocation
Net cumulative allocation 6,682.50 100.00
Holdings 5,746.23 85.99
Outstanding Purchases and Loans: None
Latest Financial Arrangements: None
Projected Payments to the Fund
(SDR Million; based on existing use of resources and present holdings of SDRs)
Forthcoming
2014 2015 2016 2017 2018
Principal 0.00 0.00 0.00 0.00 0.00
Charges/interest 0.33 0.70 0.70 0.70 0.70
Total 0.33 0.70 0.70 0.70 0.70
Lending to the Fund and Grants:
Saudi Arabia is a participant of the New Arrangements to Borrow (NAB), whose credit arrangement
under the NAB amounts SDR 5.7 billion. The current outstanding amount under the credit
arrangement as of June 15, 2016 is SDR 997.8 million. The Fund also has a borrowing agreement
with Saudi Arabia in association with the General Arrangements to Borrow (GAB), for an
amount equivalent to SDR 1.5 billion, which was renewed for another five-year period from
December 26, 2013. In October 2012, Saudi Arabia entered into a note purchase agreement with the
Fund under the 2012 Borrowing Agreements, with the amount of SDR 9.71 billion, to provide a
second line of defense after quota and NAB resources. In March 2001, Saudi Arabia agreed to
support the PRG-HIPC Trust with investments totaling SDR 94.4 million. In April 2006, these
investments were extended with an additional investment of SDR 38.2 million, to provide SDR
40 million (end-2005 NPV terms) in subsidy resources to support the Exogenous Shocks Facility.
Additionally, in April 2005, Saudi Arabia agreed to provide a grant contribution of US$4 million
(equivalent to SDR 2.6 million) to subsidize Emergency Natural Disaster Assistance to low-income

SAUDI ARABIA
INTERNATIONAL MONETARY FUND 3
countries. In May 2012, Saudi Arabia pledged a new grant contribution of SDR 16.7 million in
subsidy resources to the PRGT, which will be disbursed at end-December 2021. In October 2012 and
October 2013, Saudi Arabia provided subsidy resources to the PRGT through the transfer of its full
share in the distributions of the general reserve attributed to windfall gold sale profits, totaling SDR
71.87 million. As regards loan resources, the Fund as Trustee of the Poverty Reduction and Growth
Trust (PRGT) entered into a borrowing agreement with the Saudi Arabian Monetary Agency in May
2011, by which Saudi Arabia would provide new loan resources of up to SDR 500 million.
Exchange Rate Arrangement
Saudi Arabia maintains an exchange rate system free of restrictions on the making of payments and
transfers for current international transactions. The Saudi Arabian riyal was formally pegged to the
U.S. dollar, effective January 2003 and the exchange arrangement is classified as a conventional peg.
Prior to that, it was officially pegged to the SDR at the rate of SAR 5.2625=SDR 1, with margins of
7.25 percent even though in practice it has been pegged to the U.S. dollar since 1986, with a middle
rate of SAR 3.7450=$1. Saudi Arabia maintains security-related exchange restrictions pursuant to UN
Security Council resolutions 1267 and 1373.
Last Article IV Consultation
Saudi Arabia is on the standard 12-month consultation cycle. The last Article IV consultation was
held during May 17–28, 2015 in Riyadh. The staff report was considered by the Executive Board on
July 29, 2015 and published on September 9, 2015.
(http://www.imf.org/external/pubs/cat/longres.aspx?sk=43261.0)
Technical Assistance:
STA GDDS Meta Data Development January 26–February 6, 2008.
G20 Data Gap Initiative, January 22–23, 2011.
Balance of Payment Statistics, March 12–23, 2011.
National Accounts Statistics, April 8–18, 2012.
Balance of Payment Statistics, November 11–22, 2012.
SDDS Assessment, March 9–19, 2013.
G20 Data Gap Initiative, May 27–28, 2014.
Monetary and Financial Statistics, December 6-17,2015
MCM
Stress testing, January 9–21, 2010.
Stress testing, February 1–5, 2015.
Establishing a Debt Management Office, March 20–27, 2016
FAD Options for Indirect Taxation, February 25–March 11, 2006.
Public Financial Management and Statistics, jointly with STA, September 16–30, 2006.
Tax Administration, November 6–19, 2006.
Enhancing Budget Process Reforms January 22–February 2, 2008.
SAUDI ARABIA
4 INTERNATIONAL MONETARY FUND
Budget Institutions and GFSM2001 (with participation of STA), June 2–5, 2012.
GFSM2001 Training Course, April 2013.
Training workshop on structural fiscal balance rules as a guide for policy, February 2014.
Establishing a Macro-Fiscal Unit, January 26–31, 2016.
Introduction of VAT and Excises: Key Policy Design Issues, May 2016.
Tax Administration (VAT), May 17–30, 2016.
FSAP
LEG
The main FSAP mission took place in January 2004.
The FSSA was published on June 5, 2006. The FSSA-update was published on April 18,
2012. (http://www.imf.org/external/pubs/ft/scr/2006/cr06199.pdf)
FSAP-update, April 16–30, 2011. Detailed Assessment of Observance was published on
July 19, 2013. (http://www.imf.org/external/pubs/cat/longres.aspx?sk=40793.0)
(http://www.imf.org/external/pubs/cat/longres.aspx?sk=40794.0)
AML/CFT Diagnostic Mission, November 1–12, 2015
AML/CFT threat analysis workshop, March 6–10, 2016
VAT Policy design, May 30–June 12, 2016
Resident Representative
No resident representative is stationed in Saudi Arabia.

SAUDI ARABIA
INTERNATIONAL MONETARY FUND 5
RELATIONS WITH THE WORLD BANK GROUP (As of May 15, 2016)
World Bank
The World Bank’s Technical Cooperation Program (TCP) has been providing policy advice, capacity
development, and implementation support to development efforts in Saudi Arabia on a
reimbursable basis since 1975.
The Reimbursable Advisory Services (RAS) aim to advise Saudi Arabia in addressing its development
challenges of generating productive jobs for a fast growing population; improving the performance
of its education and health system to meet evolving needs; improving its business climate and
investment appeal; enhancing the provision of public services including water, electricity, and
transport; and strengthening capacity in national, municipal institutions, and tourism.
Areas of ongoing World Bank advisory work include: public financial management; business climate
and foreign direct investment; small and medium enterprise strategy; urban development and
city institutional strengthening capacity building; poverty and social protection issues; work on
employment policy including a focus on unemployment assistance; enhancing quality and relevance
of the education system; health sector efficiency; energy efficiency; electricity sector legislation and
policies; developing an implementation plan for the national ports strategy; advising in developing
the understanding of the financial and economic cost/value of water resources in the Kingdom; and
providing advice and support to the implementation of the national transport strategy and the
helped on the creation of the Public Transport Authority.
International Finance Corporation
IFC activities in the country, as well as with Saudi investors outside the country, have increased
significantly in recent years. They are in line with the following three objectives:
Promoting Selective Business in Saudi Arabia
IFC’s strategy for investments in Saudi Arabia is to invest in selective transactions that can add value
in terms of institution building, development of new financial instruments, and SME development.
Specific investments in the financial sector include housing finance, insurance, leasing and
microfinance (with total commitments of around $200 million). IFC also provides advisory services in
mortgage finance, SME finance, corporate governance, risk management, and PPP transactions. IFC
PPP is actively engaged in the Kingdom with two new PPP mandates signed in FY14 (Taif Airport and
King Abdul Aziz International (Jeddah) Airport). These engagements build upon IFC’s earlier success
of Medina Airport PPP where IFC helped mobilize over $1 billion, as well as the successes on the Hajj
Terminal and a captive desalination project at Jeddah Airport.

SAUDI ARABIA
6 INTERNATIONAL MONETARY FUND
Promoting South-South Investments from Saudi Arabia
Saudi Arabian investors have been a key part of IFC’s South-South program to promote greater
regional integration. Since 2007, IFC has been able to mobilize around $2 billion from Saudi
sponsors for investments in the rest of MENA as well as in emerging markets including in Africa and
East Asia. IFC continues to work closely with Saudi sponsors to further facilitate cross border
investment in the region.
Mobilizing Funds
IFC is working closely with Saudi public institutions and IFIs to undertake global initiatives that
benefit private sector activities in developing countries. So far, these efforts have resulted in
obtaining commitments of over $1 billion.

SAUDI ARABIA
INTERNATIONAL MONETARY FUND 7
STATISTICAL ISSUES (As of June 14, 2016)
Assessment of Data Adequacy for Surveillance
General: Data provision has some shortcomings, but is broadly adequate for surveillance. Most
affected areas are: labor markets, government finance statistics, monetary and financial statistics
and external sector statistics.
Real sector statistics:
National accounts: The estimates of annual GDP were rebased to 2010 from the previous base
year of 1999. The revised GDP data are more comprehensive in terms of coverage of services,
specifically distribution and financial services. The revision has resulted in upward revisions to the
level of GDP as well as the relative contributions by economic activity to GDP. This rebasing
increased the share of the oil GDP in 2013 to 43 percent from 21 percent previously.
Price statistics: The weight reference period for the wholesale price index appears outdated
(1988 according to the publicly available information) and would need to be updated, ideally at
least every five years. There is no official real estate price series or other data on housing market
activity. There is also uncertainty about owner-occupation rates.
Labor Markets statistics: At present there is no official data providing a breakdown of
employment between the private and public sector. There is also no official data on private and
public sector wages and salaries.
Government finance statistics: The authorities are in the process of reclassifying the budget in
line with GFSM 2014. Most chapters have been completed and the Ministry of Finance is planning
on using the GFSM 2014 framework to report fiscal data and publish it going forward.
Monetary and financial statistics: The quality of monetary data has improved and additional
information is made available in the Saudi Arabian Monetary Agency (SAMA) Monthly Statistical
Bulletin. SAMA reported monetary data for the central bank and deposit money banks to the
Fund, which are published in the IFS. However, the authorities have not yet adopted the
Standardized Report Forms (SRFs) as recommended in the Monetary and Financial Statistics
(MFS) Manual and Compilation Guide. A TA mission on MFS took place in December 2015 to
assist SAMA to migrate monetary data to the SRFs. The mission’s medium-term
recommendations are aimed mainly at (1) more fundamental improvements in the report form
for commercial banks and recording practices for SAMA accounts; (2) improving the data
dissemination formats to better align with the terminology of the MFSM and best international
practices; and (3) extending the coverage of monetary statistics to include other financial
corporations (OFCs), with a view to eventually compile a financial corporations survey (FCS)
covering the entire financial corporations sector. SAMA’s published balance sheet has a large and
growing “other liabilities” item that hinders analysis.
Financial sector surveillance: SAMA reports quarterly financial soundness indicators (FSIs) to
the IMF, which are published on the IMF’s FSI website (fsi.imf.org). The reported FSIs comprise
12 core FSIs and 8 encouraged FSIs for deposit takers.
External sector statistics: Quarterly IIP data are published although IIP statistics are highly

SAUDI ARABIA
8 INTERNATIONAL MONETARY FUND
aggregated and the coverage in the capital and financial accounts, particularly for the private
sector, needs to be improved. The official data likely substantially underestimates the net
international investment position of Saudi Arabia, which likely reflects unrecorded private
financial outflows on the asset side along with under-recording of debt liabilities. Errors and
omissions in balance of payments data remain large. The authorities are working on
strengthening financial account data, where data on FDI flows and other investment flows are
weak. There are inconsistencies between the BOP and IIP data.
Data Standards and Quality
Participant in the General Data Dissemination
System (now the enhanced GDDS) since 2008.
No data ROSC is available.

SAUDI ARABIA
INTERNATIONAL MONETARY FUND 9
Saudi Arabia: Table of Common Indicators Required for Surveillance
(As of June 15, 2016)
Date of
latest
observation
Date
received
Frequenc
y of
Data6
Frequency
of
Reporting6
Frequency of
publication6
Exchange rates 6/15/2016 6/15/2016 D D D
International reserve assets and reserve liabilities of the monetary
authorities1
4/2015 5/29/2016 M M M
Reserve/base money 4/2015 5/29/2016 M M M
Broad Money 4/2015 5/29/2016 M M M
Central Bank balance sheet 4/2015 5/29/2016 M M M
Consolidated balance sheet of the banking system 4/2015 5/29/2016 M M M
Interest rates2 6/15/2016 6/15/2016 D D D
Consumer price index 4/2015 5/24/2016 M M M
Revenue, expenditure, balance and composition of financing3—
central government
Q1 2016 5/8/2016 Q Q A
Stocks of central government and central government-guaranteed
debt4
2015 12/28/2015 A A A
External current account balance Q4 2015 4/28/2016 Q Q Q
Exports and imports of goods and services Q4 2015 4/28/2016 Q Q Q
GDP/GNP Q4 2015 1/06/2016 Q Q Q
Gross external debt (BIS) Q4 2015 Q Q Q
International investment position5 Q4 2015 4/28/2016 Q Q Q
1 Any reserve assets that are pledged or otherwise encumbered should be specified separately. Also, data should comprise short-term liabilities linked to a foreign currency but
settled by means as well as the notional values of derivatives to pay and to receive foreign currency, including those linked to a foreign currency but settled by other means.
2 Both market-based and officially determined, including discount rates, money market rates, rates on treasury bills, notes and bonds.
3 Foreign, domestic bank, and domestic nonbank financing.
4 Including currency and maturity composition.
5 Includes external gross financial asset and liability positions vis-à-vis nonresidents.
6 Daily (D), Monthly (M), Quarterly (Q), Annually (A), Irregular (I); Not Available (NA).