IMF Country Report No. 15/232 SPAIN · 2 However, deep structural problems limit Spain’s growth...
64
© 2015 International Monetary Fund IMF Country Report No. 15/232 SPAIN 2015 ARTICLE IV CONSULTATION—PRESS RELEASE; STAFF REPORT; AND STATEMENT BY THE EXECUTIVE DIRECTOR FOR SPAIN Under Article IV of the IMF’s Articles of Agreement, the IMF holds bilateral discussions with members, usually every year. In the context of the 2015 Article IV consultation with Spain, the following documents have been released and are included in this package: A Press Release summarizing the views of the Executive Board as expressed during its July 27, 2015 consideration of the staff report that concluded the Article IV consultation with Spain. The Staff Report prepared by a staff team of the IMF for the Executive Board’s consideration on July 27, 2015, following discussions that ended on June 8, 2015, with the officials of Spain on economic developments and policies. Based on information available at the time of these discussions, the staff report was completed on July 10, 2015. An Informational Annex prepared by the IMF staff. A Staff Statement updating information on recent developments. A Statement by the Executive Director for Spain. The documents listed below have been or will be separately released. Selected Issues The IMF’s transparency policy allows for the deletion of market-sensitive information and premature disclosure of the authorities’ policy intentions in published staff reports and other documents. Copies of this report are available to the public from International Monetary Fund Publication Services PO Box 92780 Washington, D.C. 20090 Telephone: (202) 623-7430 Fax: (202) 623-7201 E-mail: [email protected] Web: http://www.imf.org Price: $18.00 per printed copy International Monetary Fund Washington, D.C. August 2015
Transcript of IMF Country Report No. 15/232 SPAIN · 2 However, deep structural problems limit Spain’s growth...
© 2015 International Monetary Fund
IMF Country Report No. 15/232
SPAIN 2015 ARTICLE IV CONSULTATION—PRESS RELEASE; STAFF REPORT; AND STATEMENT BY THE EXECUTIVE DIRECTOR FOR SPAIN
Under Article IV of the IMF’s Articles of Agreement, the IMF holds bilateral discussions
with members, usually every year. In the context of the 2015 Article IV consultation with
Spain, the following documents have been released and are included in this package:
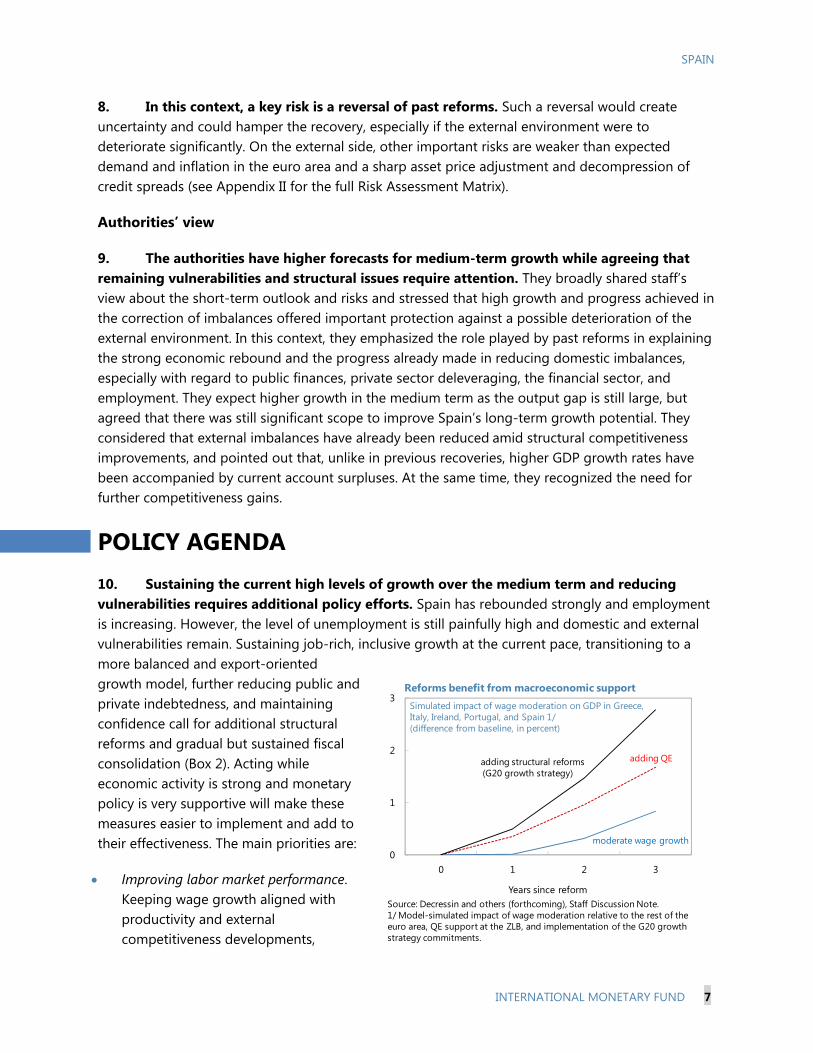
A Press Release summarizing the views of the Executive Board as expressed
during its July 27, 2015 consideration of the staff report that concluded the Article IV
consultation with Spain.
The Staff Report prepared by a staff team of the IMF for the Executive Board’s
consideration on July 27, 2015, following discussions that ended on June 8, 2015, with
the officials of Spain on economic developments and policies. Based on information
available at the time of these discussions, the staff report was completed on July 10,
2015.
An Informational Annex prepared by the IMF staff.
A Staff Statement updating information on recent developments.
A Statement by the Executive Director for Spain.
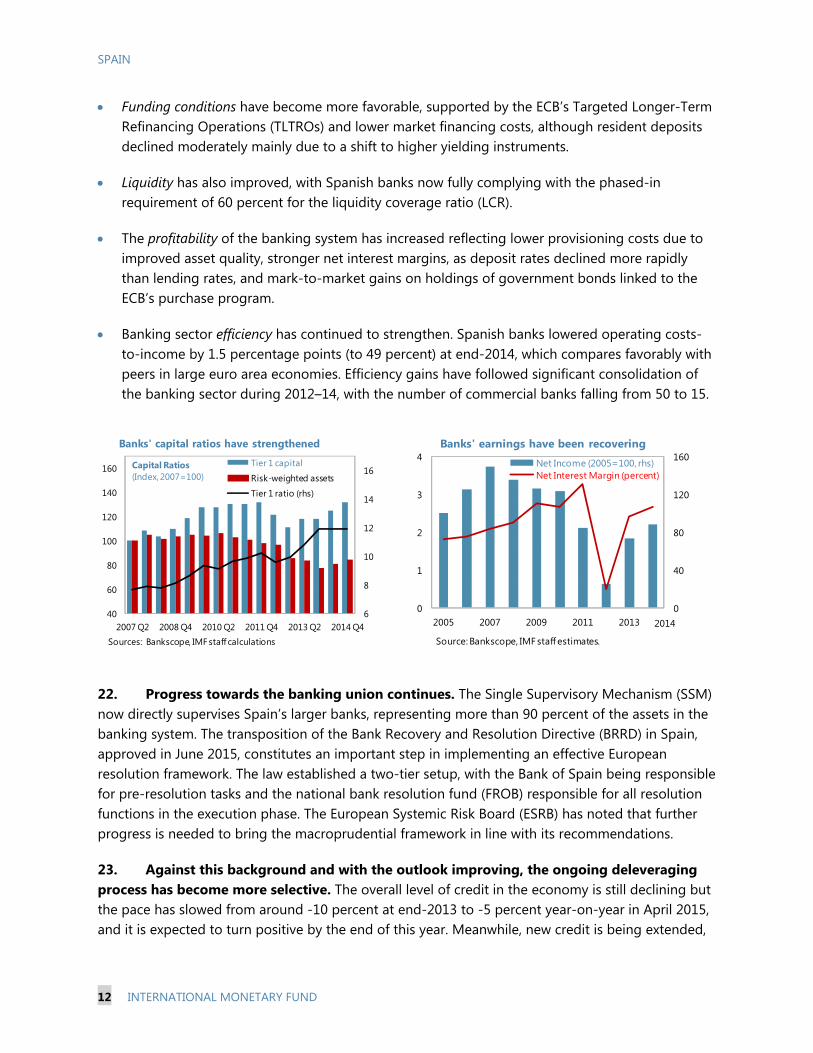
The documents listed below have been or will be separately released.
Selected Issues
The IMF’s transparency policy allows for the deletion of market-sensitive information
and premature disclosure of the authorities’ policy intentions in published staff reports
and other documents.
Copies of this report are available to the public from
International Monetary Fund Publication Services
PO Box 92780 Washington, D.C. 20090
Telephone: (202) 623-7430 Fax: (202) 623-7201
E-mail: [email protected] Web: http://www.imf.org
Price: $18.00 per printed copy
International Monetary Fund
Washington, D.C.
August 2015
Press Release No. 15/378FOR IMMEDIATE RELEASE
August 14, 2015
IMF Executive Board Concludes 2015 Article IV Consultation with Spain
On July 27, 2015, the Executive Board of the International Monetary Fund (IMF) concluded the
Article IV consultation1 with Spain.
Spain’s recovery has gathered speed, but unemployment is still very high. Growth has picked up
and is expected at 3.1 percent in 2015 and 2.5 percent in 2016, well above the euro area average.
Strong policy implementation has supported the return of confidence, and significant external
tailwinds are helping the rebound. The current account maintains a small surplus while financial
conditions remain supportive. The pace of private sector deleveraging has slowed and new credit
is being extended. Job creation has picked up, but more than 5 million people remain
unemployed and new jobs still rely heavily on temporary and part-time contracts.
Past reforms are contributing to the recovery. Spain’s labor market reforms and moderate wage
growth have supported employment and helped regain competitiveness. The Market Unity Law
has begun to address some of the obstacles for firms to grow and raise productivity. The positive
report card from the European Central Bank’s comprehensive assessment confirmed that the
country’s financial sector reform efforts have progressed well, supported by the European
Stability Mechanism. These reforms, together with continued fiscal consolidation, have
reassured markets and boosted consumer and investor confidence.
1 Under Article IV of the IMF's Articles of Agreement, the IMF holds bilateral discussions with members, usually every year. A
staff team visits the country, collects economic and financial information, and discusses with officials the country's economic
developments and policies. On return to headquarters, the staff prepares a report, which forms the basis for discussion by the
Executive Board.
International Monetary Fund
700 19th Street, NW
Washington, D. C. 20431 USA

2
However, deep structural problems limit Spain’s growth potential going forward and
vulnerabilities remain. The high structural unemployment and pervasive labor market duality,
and the lack of economies of scale of Spain’s many small firms hold back medium-term growth.
Public and private debt levels are still high and are likely to keep weighing on consumption and
investment. Spain has a large negative net international investment position, which adds to its
external vulnerabilities. In this context, a key risk is a reversal of reforms already carried out,
which would create uncertainty and could hamper the recovery, especially if the external
environment were to deteriorate sharply.
Executive Board Assessment2
Executive Directors commended the authorities for their strong policy implementation and
reform efforts, which, complemented by easier financing conditions, have enhanced confidence
and underpinned Spain’s remarkable rebound from the crisis. They noted in particular that labor
market reforms and wage moderation have boosted jobs and competitiveness. However, despite
significant adjustments in key economic flows over the past few years, the persistently high level
of unemployment, low productivity, and still sizable public and private debts continue to pose
policy challenges for the period ahead.
Against this background, Directors emphasized that sustaining the growth momentum over the
medium term requires continued fiscal consolidation and steadfast reforms to address remaining
structural rigidities, as well as favorable demand conditions in the broader euro area. Financial
volatility and uncertainty in the region warrant continued vigilance, although Spain’s improved
resilience, along with policy measures at the euro-area level, has reduced contagion risks.
Directors saw merit in further improving the labor market and the conditions for small- and
medium-sized enterprises (SMEs) to grow, with a view to generating jobs and fostering higher,
more inclusive growth. They recommended keeping wages in line with productivity and business
2 At the conclusion of the discussion, the Managing Director, as Chairman of the Board, summarizes the views of Executive
Directors, and this summary is transmitted to the country's authorities. An explanation of any qualifiers used in summings up can
be found here: http://www.imf.org/external/np/sec/misc/qualifiers.htm.
3
conditions at the firm level, lowering labor market duality, and strengthening the skills of the
long-term unemployed. Directors welcomed initiatives to promote competition, especially in the
services sector, support the internationalization of SMEs, and improve their access to finance.
Directors noted that Spain’s financial sector continues to strengthen, with improved liquidity,
efficiency, and profitability. They welcomed the recent insolvency reforms, including the
approval of a “fresh start” for entrepreneurs and consumers. With effective implementation and
clarity on some key elements, these reforms can facilitate private sector deleveraging while
ensuring that a strong payment culture is protected. Directors supported ongoing efforts to
encourage banks to boost their high-quality capital and reduce nonperforming loans, thereby
facilitating credit growth.
Directors emphasized the importance of placing the public debt-to-GDP ratio firmly on a
downward path by pursuing gradual growth-friendly fiscal consolidation and saving any windfall
from higher nominal growth and lower borrowing costs. They called for ambitious and well-
specified budget measures, while protecting the most vulnerable. Improvements to the regional
fiscal framework and close coordination across all levels of the government are also critical to
these consolidation efforts.

4
Main Economic Indicators
(Percent change unless otherwise indicated)
Projections
2011 2012 2013 2014 2015 2016 2017 2018 2019 2020
Demand and supply in constant prices
Gross domestic product -0.6 -2.1 -1.2 1.4 3.1 2.5 2.2 2.0 1.9 1.8
Private consumption -2.0 -2.9 -2.3 2.4 4.4 2.6 2.5 2.3 1.8 1.6
Public consumption -0.3 -3.7 -2.9 0.1 0.3 -0.7 -0.3 -0.3 0.0 0.0
Gross fixed investment -6.3 -8.1 -3.8 3.4 5.2 3.2 2.7 2.5 2.4 2.2
Total domestic demand -2.7 -4.2 -2.7 2.3 3.5 2.1 2.0 1.9 1.6 1.4
Net exports (contribution to growth) 2.1 2.2 1.4 -0.8 -0.4 0.5 0.3 0.2 0.4 0.4
Exports of goods and services 7.4 1.2 4.3 4.2 6.5 5.8 5.6 5.4 4.9 4.4
Imports of goods and services -0.8 -6.3 -0.5 7.6 8.3 4.7 5.3 5.1 4.2 3.8
Savings-Investment Balance (percent of GDP)
Gross domestic investment 21.4 19.7 18.5 18.9 19.1 19.3 19.4 19.4 19.4 19.4
Private 17.7 17.4 16.4 16.9 17.2 17.3 17.4 17.5 17.5 17.5
Public 3.7 2.4 2.1 2.0 1.9 1.9 1.9 1.9 1.9 1.9
National savings 18.3 19.5 20.0 19.7 20.0 20.2 20.5 20.6 20.7 20.9
Private 24.0 27.4 24.6 23.5 22.5 21.3 21.0 20.6 20.3 20.5
Public -5.7 -7.9 -4.7 -3.8 -2.5 -1.1 -0.5 -0.1 0.4 0.5
Foreign savings 3.2 0.3 -1.4 -0.8 -0.9 -1.0 -1.1 -1.2 -1.3 -1.5
Household saving rate (percent of gross disposable income) 11.9 9.5 10.4 9.7 9.5 9.8 10.1 10.2 10.2 10.3
Private sector debt (percent of GDP) 276 263 249 236 229 225 220 216 212 207
Corporate debt 189 177 168 159 156 154 151 149 147 143
Household debt 87 85 81 77 73 71 69 67 65 64
Credit to private sector 1/ -3.2 -9.9 -10.2 -6.5 0.4 0.7 0.8 1.0 1.1 1.2
Potential output growth 0.0 -0.2 -0.3 0.6 1.1 1.1 1.2 1.3 1.3 1.3
Output gap (percent of potential) -3.1 -4.9 -5.8 -5.0 -3.2 -1.8 -0.9 -0.2 0.4 0.8
Prices
GDP deflator 0.1 0.2 0.7 -0.5 0.8 0.6 0.9 1.1 1.3 1.6
HICP (average) 3.1 2.4 1.5 -0.2 -0.2 1.0 1.0 1.3 1.4 1.5
HICP (end of period) 2.4 3.0 0.3 -1.0 1.0 1.0 1.0 1.2 1.5 1.5
Employment and wages
Unemployment rate (percent) 21.4 24.8 26.1 24.5 22.0 20.1 18.8 17.6 16.6 15.8
Labor productivity 2/ 2.0 2.4 2.1 0.2 0.2 0.5 0.6 0.6 0.6 0.6
Labor costs, private sector 2.8 1.0 0.3 0.3 0.4 0.6 0.9 1.0 1.0 1.1
Employment growth -1.6 -4.3 -2.8 1.2 2.8 2.0 1.6 1.4 1.3 1.2
Labor force growth 0.3 0.0 -1.1 -1.0 -0.5 -0.4 -0.1 -0.1 0.1 0.2
Balance of payments (percent of GDP)
Trade balance (goods and services) -0.2 1.6 3.4 2.6 2.7 2.8 3.0 3.1 3.4 3.8
Current account balance -3.2 -0.3 1.4 0.8 0.9 1.0 1.1 1.2 1.3 1.5
Net international investment position -89 -90 -94 -93 -90 -86 -82 -78 -74 -70
Public finance (percent of GDP)
General government balance 3/ -8.9 -6.6 -6.3 -5.7 -4.4 -3.0 -2.5 -2.0 -1.5 -1.5
Primary balance -7.5 -7.9 -4.0 -2.9 -1.8 -0.6 -0.1 0.2 0.7 0.7
Structural balance -7.3 -4.0 -3.2 -2.6 -2.4 -1.9 -1.9 -1.9 -1.8 -1.9
General government debt 69 84 92 98 98 99 98 97 96 94
Sources: IMF, World Economic Outlook; data provided by the authorities; and IMF staff estimates
1/ Excludes loans transferred to SAREB.
2/ Output per worker.
3/ The headline deficit for Spain excludes financial sector support measures equal to 0.5 percent of GDP for 2011 and 2013, 3¾ percent of GDP for
2012,and 0.1 percent of GDP for 2014.
SPAIN STAFF REPORT FOR THE 2015 ARTICLE IV CONSULTATION
KEY ISSUES Context. The recovery has strengthened and employment is increasing, driven by the rebound in consumption and investment. Reforms and strong policy implementation have supported the return of confidence, and significant external tailwinds are helping. However, the level of unemployment remains very high and without further reforms the growth momentum is expected to slow in the medium-term. This reflects still sizable public and private debt overhangs and persistent structural problems, including remaining impediments in the labor market and the low productivity of Spain’s many small firms. Policies. Sustaining the current high levels of growth and job creation over the medium term and further reducing vulnerabilities will require additional policy efforts. Key priorities include the following: Enhancing labor market performance. Maintaining wage growth in line with
developments in productivity and external competitiveness, ensuring wages adequately reflect differing business conditions across firms, lowering duality, and enhancing the skills of the long-term unemployed will improve prospects for higher and more inclusive growth also in the medium term.
Supporting growth of small firms. Removing obstacles for Spain’s many small firms to grow will allow them to benefit from economies of scale both in domestic and external markets and raise productivity.
Facilitating private deleveraging. Continuing to reduce firm and, especially, household debt will foster investment and growth. Further strengthening the banking system will ensure that banks can support growth as credit demand recovers.
Anchoring confidence. Sustaining a gradual and growth-friendly fiscal consolidation, well coordinated across all levels of governments, will help maintain strong market confidence and put public debt on a firmly declining path.
July 10, 2015

SPAIN
2 INTERNATIONAL MONETARY FUND
Approved By Philip Gerson and Mark Flanagan
A staff team comprising H. Berger (Head), Nina Budina, Sebastián Sosa (all EUR), M. Saiyid (MCM), H. Hesse (SPR), V. Lledo (FAD), M. Dao (RES), and C. DeLong (LEG) visited Madrid on May 26–June 8, 2015, to conduct the 2015 Article IV Consultation discussions. The mission was supported by an expert (M. Balz). A. Adriano (COM) joined for the concluding meetings. Mr. Jimenez Latorre, Mr. Lopez, and Ms. Sanchez Rodriguez from the Executive Director’s office attended the discussions. V. Boranova, O. Ftomova, C. Borisova, and A. Myaing supported the mission from Headquarters. The mission met Economy and Competitiveness Minister De Guindos, Finance and Public Administration Minister Montoro, Bank of Spain Governor Linde, and other senior officials. The mission also met with representatives of the financial sector, industry, academia, think tanks, parliament, political parties, and trade union representatives.
CONTENTS
CONTEXT AND OUTLOOK _______________________________________________________________________ 4
POLICY AGENDA _________________________________________________________________________________ 7
A. Further Strengthening Labor Market Performance ______________________________________________8
B. Boosting Small Firm Growth ___________________________________________________________________ 10
C. Further Strengthening Banks While Reducing Debt ___________________________________________ 11
D. Ensuring a Coordinated and Credible Fiscal Consolidation ____________________________________ 14
STAFF APPRAISAL ______________________________________________________________________________ 17 BOXES 1. Household Deleveraging and Growth _________________________________________________________ 19 2. Potential Output Growth in Spain: What Is the Scope for Improvement? _____________________ 21 3. Public Stakes in the Financial Sector ___________________________________________________________ 22 FIGURES 1.The Recovery Has Gathered Speed _____________________________________________________________ 23 2. The Housing Sector Appears to Have Bottomed Out __________________________________________ 24 3. Despite the Current Account Surplus, Net External Liabilities Remain High ___________________ 25 4. The Crisis’ Legacy and Structural Problems Limit Medium-Term Growth ______________________ 26 5. Labor Market Reforms Are Helping, but Further Efforts Needed ______________________________ 27 6. Structural Obstacles to Firm Growth ___________________________________________________________ 28 7. Financial Sector Performance Has Improved __________________________________________________ 29
SPAIN
INTERNATIONAL MONETARY FUND 3
8. Fiscal Consolidation Continues, but Challenges Remain _______________________________________ 30 9. Regional Fiscal Framework _____________________________________________________________________ 31 TABLES 1. Main Economic Indicators, 2011–20 ___________________________________________________________ 32 2. General Government Operations, 2012–20 ____________________________________________________ 33 3. General Government Balance Sheet2009–14 __________________________________________________ 34 4. Selected Financial Soundness Indicators, 2006–14 ____________________________________________ 35 5. Balance of Payments, 2011–20 _________________________________________________________________ 36 APPENDICES I. External Stability Report (ESR) __________________________________________________________________ 37 II. Risk Assessment Matrix ________________________________________________________________________ 38 III. Debt Sustainability Analysis ___________________________________________________________________ 40
SPAIN
4 INTERNATIONAL MONETARY FUND
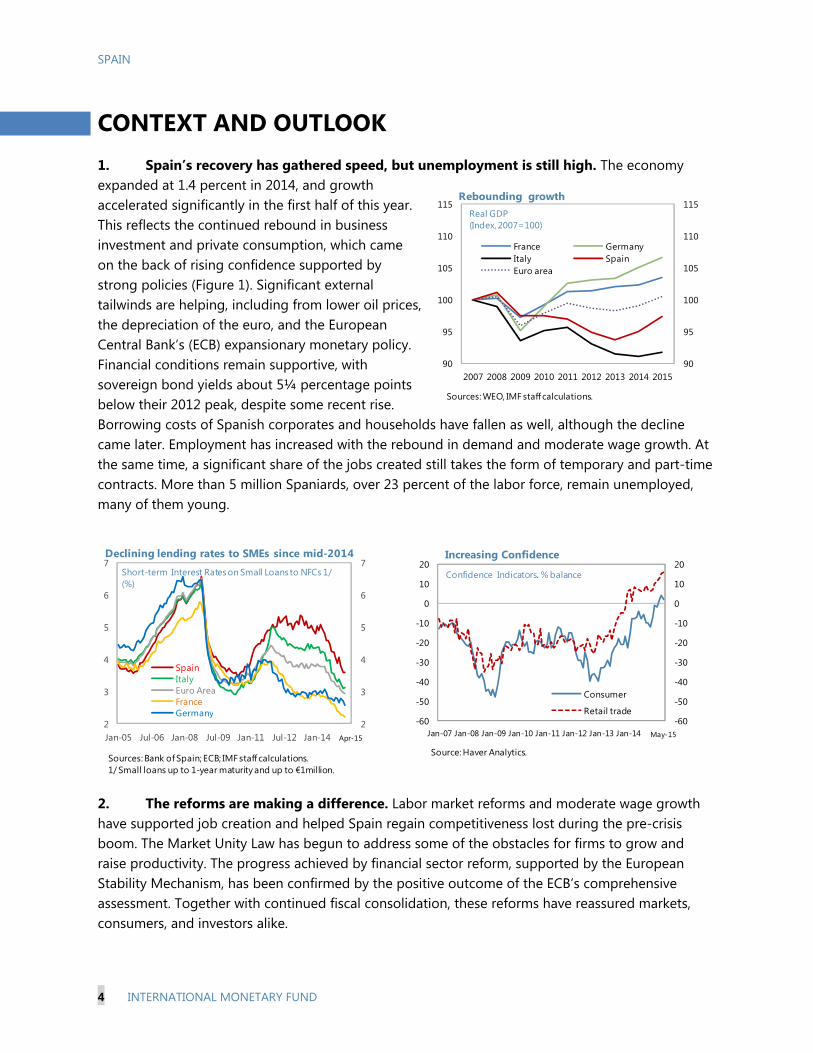
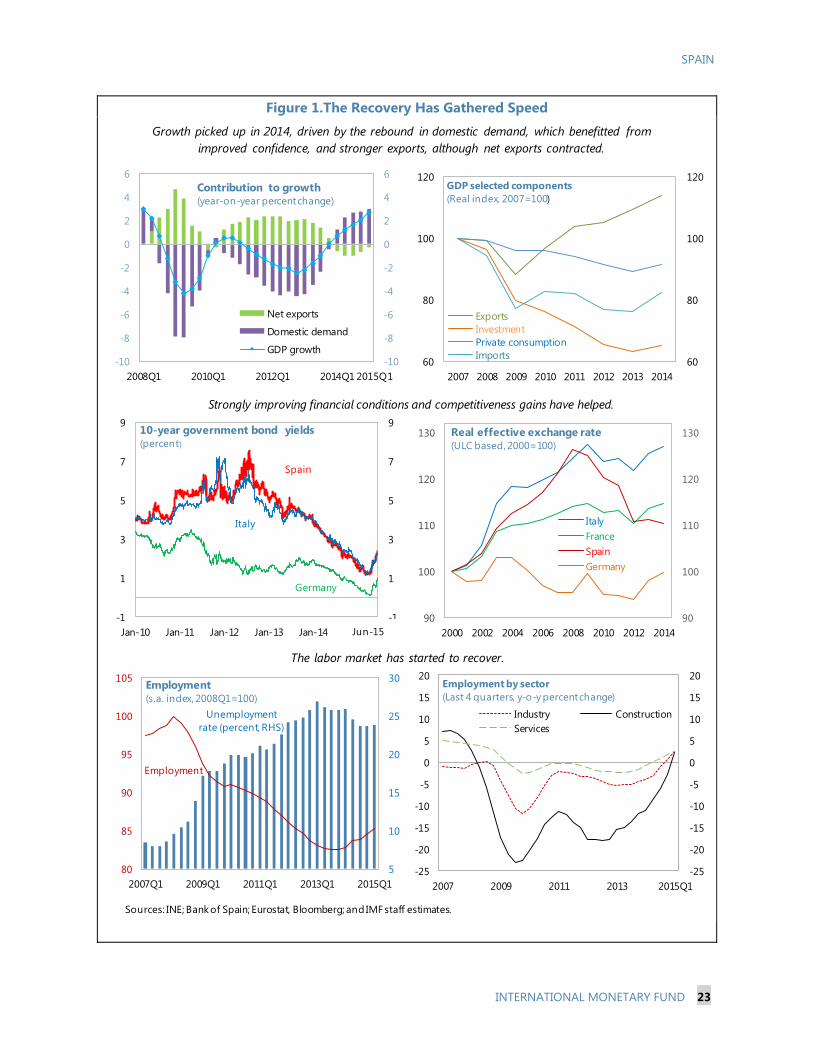
CONTEXT AND OUTLOOK 1. Spain’s recovery has gathered speed, but unemployment is still high. The economy expanded at 1.4 percent in 2014, and growth accelerated significantly in the first half of this year. This reflects the continued rebound in business investment and private consumption, which came on the back of rising confidence supported by strong policies (Figure 1). Significant external tailwinds are helping, including from lower oil prices, the depreciation of the euro, and the European Central Bank’s (ECB) expansionary monetary policy. Financial conditions remain supportive, with sovereign bond yields about 5¼ percentage points below their 2012 peak, despite some recent rise. Borrowing costs of Spanish corporates and households have fallen as well, although the decline came later. Employment has increased with the rebound in demand and moderate wage growth. At the same time, a significant share of the jobs created still takes the form of temporary and part-time contracts. More than 5 million Spaniards, over 23 percent of the labor force, remain unemployed, many of them young.
2. The reforms are making a difference. Labor market reforms and moderate wage growth have supported job creation and helped Spain regain competitiveness lost during the pre-crisis boom. The Market Unity Law has begun to address some of the obstacles for firms to grow and raise productivity. The progress achieved by financial sector reform, supported by the European Stability Mechanism, has been confirmed by the positive outcome of the ECB’s comprehensive assessment. Together with continued fiscal consolidation, these reforms have reassured markets, consumers, and investors alike.
2
3
4
5
6
7
2
3
4
5
6
7
Jan-05 Jul-06 Jan-08 Jul-09 Jan-11 Jul-12 Jan-14 Jul-15
SpainItalyEuro AreaFranceGermany
Declining lending rates to SMEs since mid-2014
Apr-15
Short-term Interest Rates on Small Loans to NFCs 1/(%)
Sources: Bank of Spain; ECB; IMF staff calculations.1/ Small loans up to 1-year maturity and up to €1million.
90
95
100
105
110
115
90
95
100
105
110
115
2007 2008 2009 2010 2011 2012 2013 2014 2015
France GermanyItaly SpainEuro area
Real GDP (Index, 2007=100)
Sources: WEO, IMF staff calculations.
Rebounding growth
-60
-50
-40
-30
-20
-10
0
10
20
-60
-50
-40
-30
-20
-10
0
10
20
Jan-07 Jan-08 Jan-09 Jan-10 Jan-11 Jan-12 Jan-13 Jan-14 Jan-15
Increasing Confidence
Consumer
Retail trade
Source: Haver Analytics.
Confidence Indicators, % balance
May-15
SPAIN
INTERNATIONAL MONETARY FUND 5
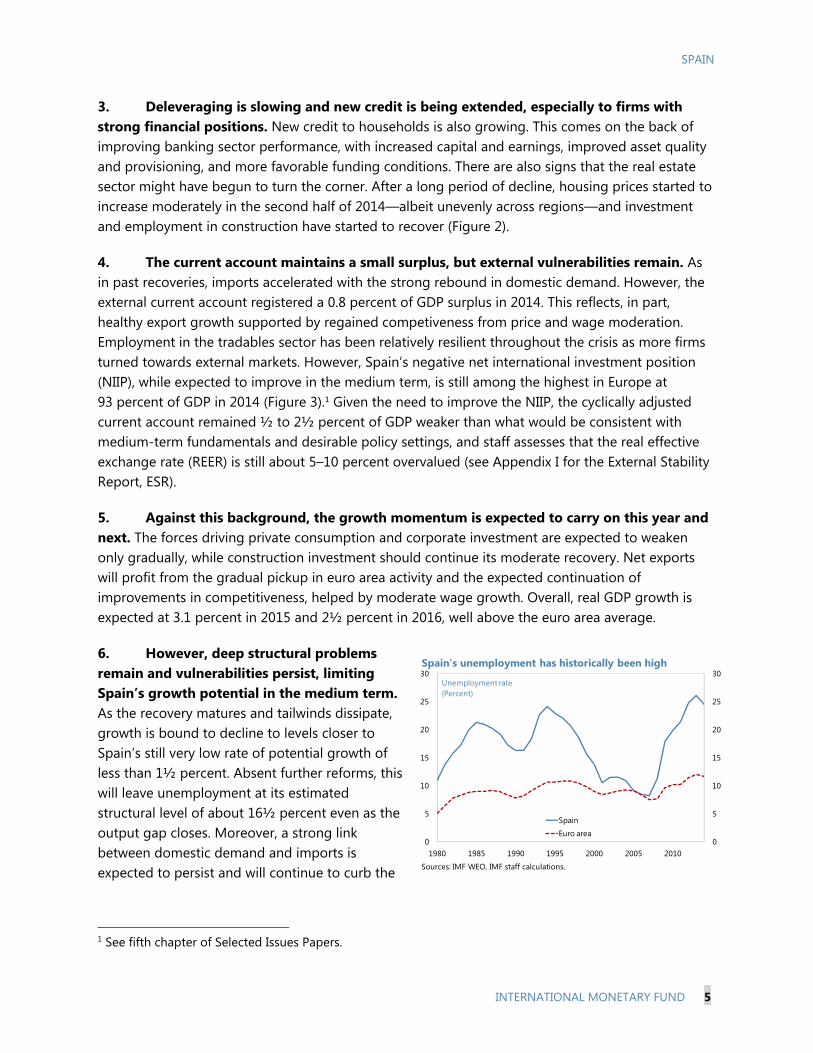
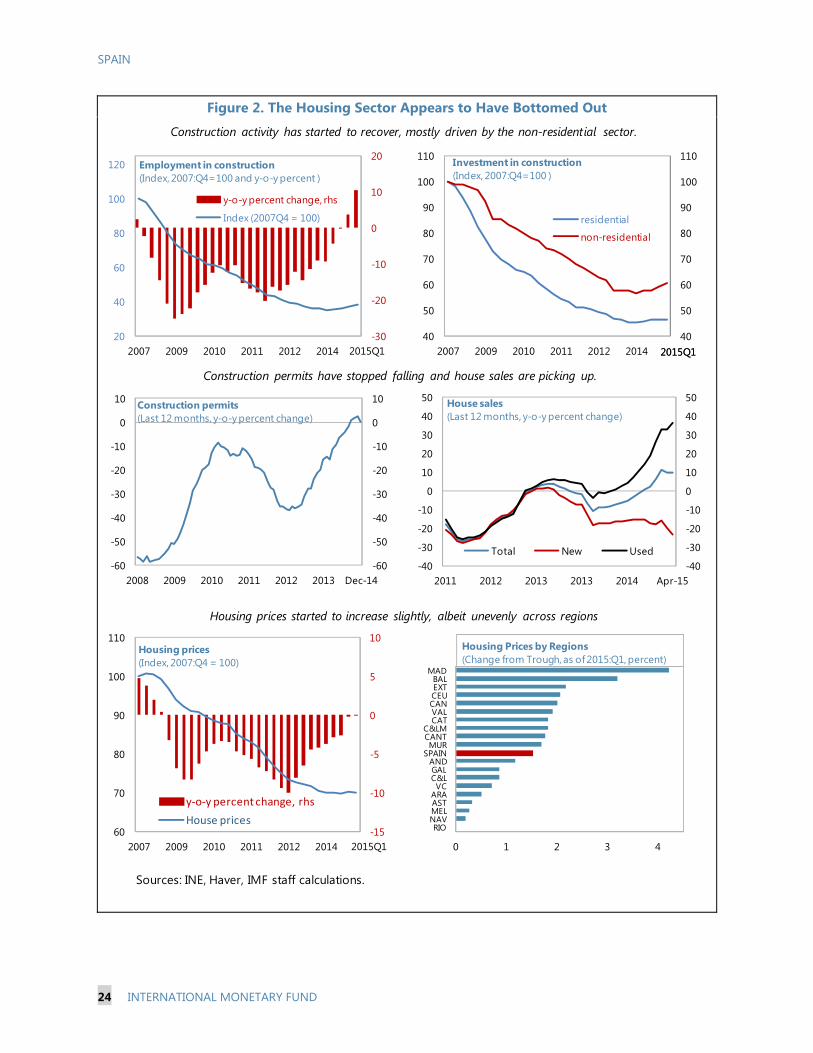
3. Deleveraging is slowing and new credit is being extended, especially to firms with strong financial positions. New credit to households is also growing. This comes on the back of improving banking sector performance, with increased capital and earnings, improved asset quality and provisioning, and more favorable funding conditions. There are also signs that the real estate sector might have begun to turn the corner. After a long period of decline, housing prices started to increase moderately in the second half of 2014—albeit unevenly across regions—and investment and employment in construction have started to recover (Figure 2).
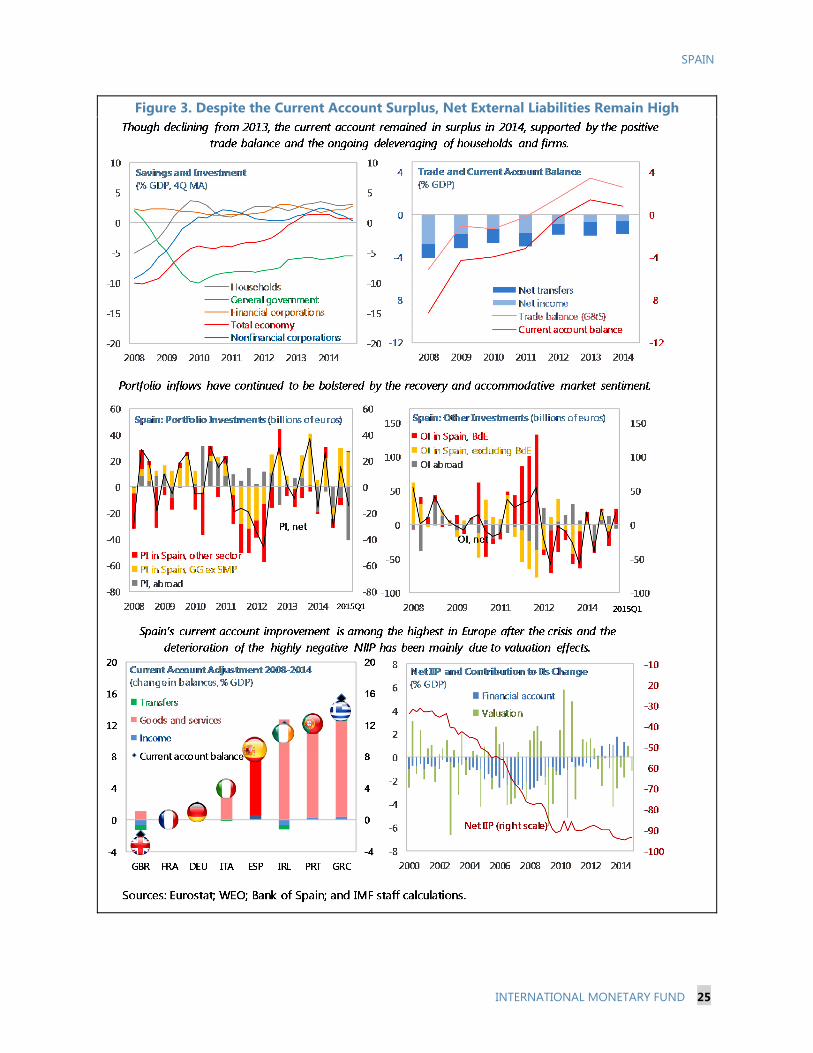
4. The current account maintains a small surplus, but external vulnerabilities remain. As in past recoveries, imports accelerated with the strong rebound in domestic demand. However, the external current account registered a 0.8 percent of GDP surplus in 2014. This reflects, in part, healthy export growth supported by regained competiveness from price and wage moderation. Employment in the tradables sector has been relatively resilient throughout the crisis as more firms turned towards external markets. However, Spain’s negative net international investment position (NIIP), while expected to improve in the medium term, is still among the highest in Europe at 93 percent of GDP in 2014 (Figure 3).1 Given the need to improve the NIIP, the cyclically adjusted current account remained ½ to 2½ percent of GDP weaker than what would be consistent with medium-term fundamentals and desirable policy settings, and staff assesses that the real effective exchange rate (REER) is still about 5–10 percent overvalued (see Appendix I for the External Stability Report, ESR).
5. Against this background, the growth momentum is expected to carry on this year and next. The forces driving private consumption and corporate investment are expected to weaken only gradually, while construction investment should continue its moderate recovery. Net exports will profit from the gradual pickup in euro area activity and the expected continuation of improvements in competitiveness, helped by moderate wage growth. Overall, real GDP growth is expected at 3.1 percent in 2015 and 2½ percent in 2016, well above the euro area average.
6. However, deep structural problems remain and vulnerabilities persist, limiting Spain’s growth potential in the medium term. As the recovery matures and tailwinds dissipate, growth is bound to decline to levels closer to Spain’s still very low rate of potential growth of less than 1½ percent. Absent further reforms, this will leave unemployment at its estimated structural level of about 16½ percent even as the output gap closes. Moreover, a strong link between domestic demand and imports is expected to persist and will continue to curb the
1 See fifth chapter of Selected Issues Papers.
0
5
10
15
20
25
30
0
5
10
15
20
25
30
1980 1985 1990 1995 2000 2005 2010
Spain
Euro area
Spain's unemployment has historically been high
Sources: IMF WEO, IMF staff calculations.
Unemployment rate(Percent)
SPAIN
6 INTERNATIONAL MONETARY FUND
scope for current account improvement as growth strengthens. Multiple factors are holding back the prospect for well balanced growth in the medium-term:
Labor market challenges. Structural unemployment is persistently high and the crisis has lengthened unemployment spells and aggravated skill deficits, especially for the young. Moreover, duality is still pervasive, and labor market participation is declining. A lack of differentiation in wage dynamics across firms slows the reallocation of labor toward more productive sectors.
Low productivity. Spanish firms tend to be smaller, less productive, and less export-oriented than their European peers. A number of obstacles prevent them from generating economies of scale domestically as well as externally, which would allow them to compete more successfully in global markets and against imports.
Continuing deleveraging. Private and public debt levels remain high, at 235 and 98 percent of GDP, respectively. Household debt, in particular, is still significantly above its pre-crisis levels (Figures 4 and 8). Hence, deleveraging is likely to proceed, continuing to weigh on domestic demand (Box 1).
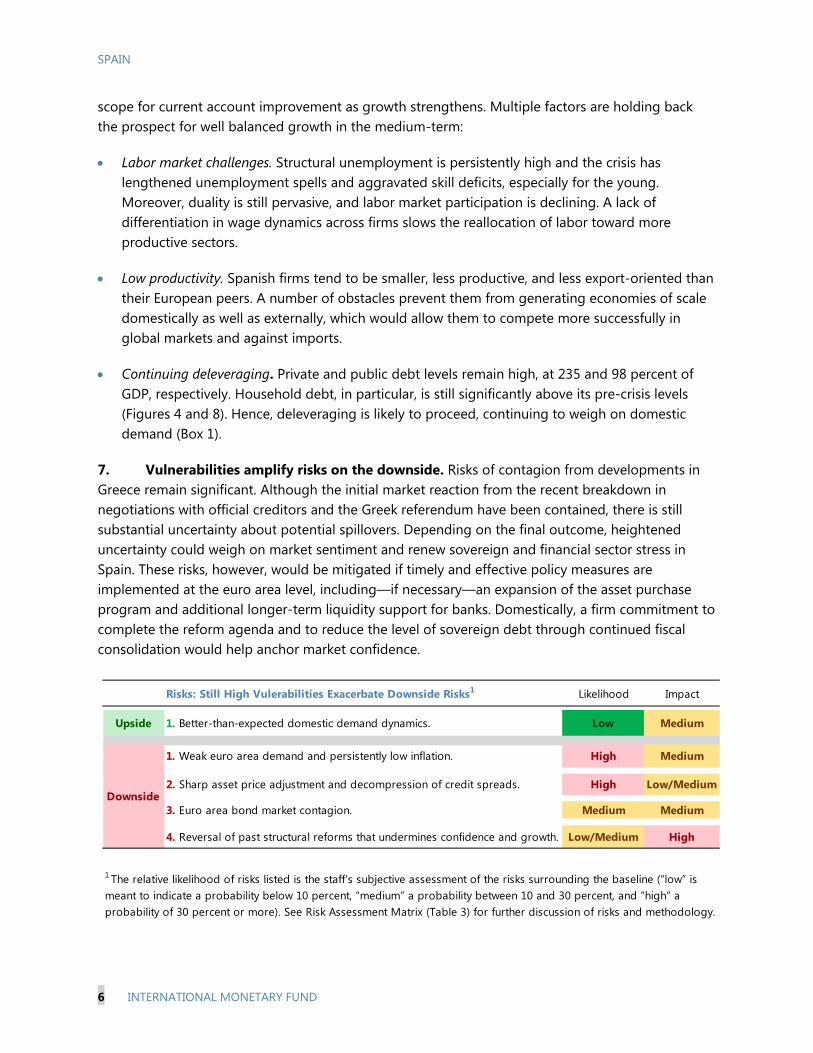
7. Vulnerabilities amplify risks on the downside. Risks of contagion from developments in Greece remain significant. Although the initial market reaction from the recent breakdown in negotiations with official creditors and the Greek referendum have been contained, there is still substantial uncertainty about potential spillovers. Depending on the final outcome, heightened uncertainty could weigh on market sentiment and renew sovereign and financial sector stress in Spain. These risks, however, would be mitigated if timely and effective policy measures are implemented at the euro area level, including—if necessary—an expansion of the asset purchase program and additional longer-term liquidity support for banks. Domestically, a firm commitment to complete the reform agenda and to reduce the level of sovereign debt through continued fiscal consolidation would help anchor market confidence.
Risks: Still High Vulerabilities Exacerbate Downside Risks1 Likelihood Impact
Upside 1. Better-than-expected domestic demand dynamics. Low Medium
1. Weak euro area demand and persistently low inflation. High Medium
2. Sharp asset price adjustment and decompression of credit spreads. High Low/Medium
3. Euro area bond market contagion. Medium Medium
4. Reversal of past structural reforms that undermines confidence and growth. Low/Medium High
1 The relative likelihood of risks listed is the staff’s subjective assessment of the risks surrounding the baseline (“low” is meant to indicate a probability below 10 percent, “medium” a probability between 10 and 30 percent, and “high” a probability of 30 percent or more). See Risk Assessment Matrix (Table 3) for further discussion of risks and methodology.
Downside
SPAIN
INTERNATIONAL MONETARY FUND 7
8. In this context, a key risk is a reversal of past reforms. Such a reversal would create uncertainty and could hamper the recovery, especially if the external environment were to deteriorate significantly. On the external side, other important risks are weaker than expected demand and inflation in the euro area and a sharp asset price adjustment and decompression of credit spreads (see Appendix II for the full Risk Assessment Matrix).
Authorities’ view
9. The authorities have higher forecasts for medium-term growth while agreeing that remaining vulnerabilities and structural issues require attention. They broadly shared staff’s view about the short-term outlook and risks and stressed that high growth and progress achieved in the correction of imbalances offered important protection against a possible deterioration of the external environment. In this context, they emphasized the role played by past reforms in explaining the strong economic rebound and the progress already made in reducing domestic imbalances, especially with regard to public finances, private sector deleveraging, the financial sector, and employment. They expect higher growth in the medium term as the output gap is still large, but agreed that there was still significant scope to improve Spain’s long-term growth potential. They considered that external imbalances have already been reduced amid structural competitiveness improvements, and pointed out that, unlike in previous recoveries, higher GDP growth rates have been accompanied by current account surpluses. At the same time, they recognized the need for further competitiveness gains.
POLICY AGENDA 10. Sustaining the current high levels of growth over the medium term and reducing vulnerabilities requires additional policy efforts. Spain has rebounded strongly and employment is increasing. However, the level of unemployment is still painfully high and domestic and external vulnerabilities remain. Sustaining job-rich, inclusive growth at the current pace, transitioning to a more balanced and export-oriented growth model, further reducing public and private indebtedness, and maintaining confidence call for additional structural reforms and gradual but sustained fiscal consolidation (Box 2). Acting while economic activity is strong and monetary policy is very supportive will make these measures easier to implement and add to their effectiveness. The main priorities are:
Improving labor market performance. Keeping wage growth aligned with productivity and external competitiveness developments,
0
1
2
3
0 1 2 3
Years since reform
Reforms benefit from macroeconomic supportSimulated impact of wage moderation on GDP in Greece, Italy, Ireland, Portugal, and Spain 1/(difference from baseline, in percent)
adding QEadding structural reforms(G20 growth strategy)
moderate wage growth
Source: Decressin and others (forthcoming), Staff Discussion Note.1/ Model-simulated impact of wage moderation relative to the rest of the euro area, QE support at the ZLB, and implementation of the G20 growthstrategy commitments.

SPAIN
8 INTERNATIONAL MONETARY FUND
ensuring wages reflect differing business conditions across firms, and strengthening the skills of the long-term unemployed will enhance prospects for higher and more inclusive growth.
Enhancing small firm growth. Removing obstacles for Spain’s many small firms to grow will allow them to scale up both domestically and externally, and raise productivity.
Facilitating private debt reduction. Further reducing firm and household debt will support investment and growth going forward. Continued strengthening of banks will ensure they support growth as credit demand recovers.
Anchoring confidence. Continued gradual and growth-friendly fiscal consolidation, well coordinated across all levels of governments, will help maintain strong market confidence.
A. Further Strengthening Labor Market Performance
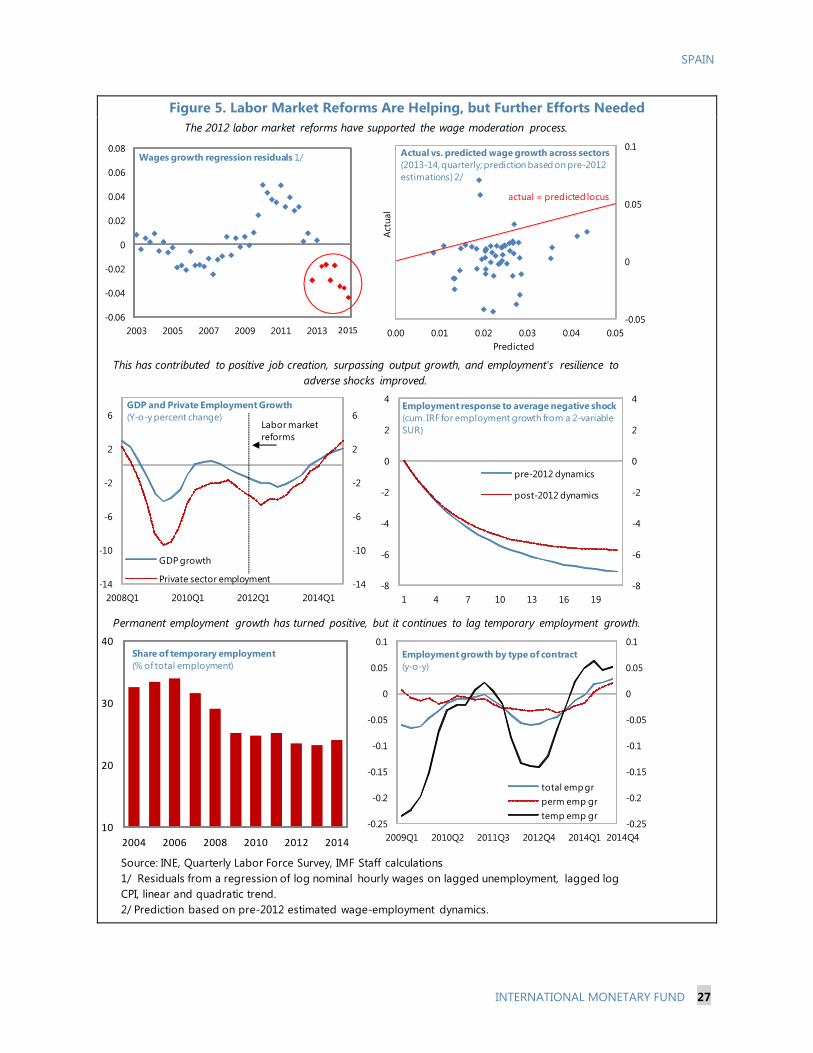
11. The labor market reforms are helping, but unemployment remains very high. The 2012 reforms increased room for workers and firms to adjust wages and hours worked, and staff analysis suggests that this helped protect employment during the recession and promoted job creation during the recovery (Figure 5).2 In 2014, average real wages increased very moderately and employment growth strengthened considerably, reaching over 3 percent by end-2014—a pace not seen since 2007—and exceeding output growth. The unemployment rate has come down, but remains too high. As of the first quarter of 2015, more than 23 percent of the active labor force and more than half of those under 24 years old were looking for a job. Moreover, about 60 percent of the unemployed have been jobless for over a year, many of them low-skilled, and risks of poverty and social exclusion have been rising with the level of unemployment since the crisis.
12. Despite the reforms, wage dynamics still do not adequately reflect differences in business conditions across firms. Not enough firms are yet making use of the flexibility clauses introduced by the reforms to deviate from sector-level wage agreements. This reflects, among other things, administrative and legal costs to firm-level wage agreements, and uncertainties over the abolishment of the automatic extension of expiring collective wage agreements (ultra-activity), where recent court decision could limit firm-level adjustment going forward. As a result, it remains difficult for the labor market to adjust to variations in sectoral or regional demand. This also reduces
2 See first chapter of Selected Issues Papers.
10
11
12
13
14
0
5
10
15
20
25
30
2005 2006 2007 2008 2009 2010 2011 2012 2013 2014
Unemployment
Risk of poverty and social exc. (RHS)
Unemployment rate (percent) and population at risk of poverty and social exclusion (million)
Social indicators tightly linked to unemployment
Source: Eurostat.
SPAIN
INTERNATIONAL MONETARY FUND 9
the incentives for workers and capital to move from low- to high-productivity firms, including in the tradables sector, which slows Spain’s much needed adjustment towards a model of faster and more export-oriented growth.
13. Labor market duality remains high. Measures to reduce duality, including statutory limitations on the use of temporary contracts and hiring subsidies for new permanent workers—which were modified earlier this year to benefit low-income earners more—appear to have contributed to a pickup in employment based on permanent contracts. However, after dropping sharply during the recession, the share of temporary jobs in overall employment has remained fairly steady at around 25 percent, still among the highest among European peers. Such high duality in the labor market exacerbates downward wage rigidity, lowers workers’ productivity, and concentrates the burden of market adjustment on those temporarily employed.
14. This suggests there is still significant scope for measures that will foster high-quality job creation. Further action in this direction will help reduce unemployment and, thereby, raise Spain’s longer-term potential for inclusive growth. Steps toward this goal include the following:
Setting the right labor market conditions. Keeping wage growth in line with developments in productivity and external competitiveness is key for promoting strong and sustainable employment growth in the medium-term.
Promoting firm-level adjustment. Making sure that wage dynamics reflect differences in firm- and sector-specific conditions will boost aggregate productivity and income. To this end, it is important that the existing options for firm-level adjustment are used as needed, and that remaining obstacles to firm-level wage bargaining and opt-out, particularly for small firms, are removed.
Lowering duality. The new incentives for permanent hires are better targeted but temporary in nature. At the same time, the cost of dismissing a permanent worker is still materially higher than that for a temporary one. This gap should be closed, for example by introducing a single contract with tenure-based dismissal costs in sectors without high seasonal turnover. Alternatively, other approaches could be considered—for example, uniformly financing dismissal costs through regular employer contributions to a common fund so that workers are adequately protected and employers’ hiring decision are not distorted toward excessive reliance on temporary contracts. Finally, reducing legal and administrative uncertainties in collective dismissals and streamlining the application of objective criteria for fair dismissals would also help support permanent hiring.
Making Active Labor Market Policies count. The recent measures to improve the skills of the long-term unemployed and low-skill youth are important. However, to be effective these programs need to be closely monitored, evaluated, and, if needed, fine-tuned, starting with the more transparent use of regional coverage and enforcement data. Steps to increase the effectiveness of public and private job-placement agencies also deserve consideration.
SPAIN
10 INTERNATIONAL MONETARY FUND
Authorities’ view
15. The authorities broadly agreed with the assessment of the impact of labor market reforms and most of the remaining challenges. They stressed that the reforms have been a crucial driver of the Spanish recovery and the pickup in employment. They shared the view that firm and sector-level adjustment should improve further and suggested that, given the significant scope of recent reforms, more time is needed for the social partners to adapt to the new rules before considering additional measures. The authorities recognized that duality is still a problem but noted that the solutions to address it are complex.
B. Boosting Small Firm Growth
16. Productivity growth is fundamentally weak, partly reflecting the dominance of small firms. Spanish firms tend to be more numerous, smaller, less productive, innovative, and export-oriented than those of most European peers. Firms with fewer than 50 workers employ nearly two thirds of the labor force while generating only about half of the value added in the economy. At the same time, the productivity gap between small and large companies is wider than in many other European countries. Staff analysis suggests that, for example, lowering the share of small firms to match that of Germany and closing the productivity gap between small and large firms to German levels could raise the level of aggregate total factor productivity (TFP) by as much as 9 percent, with most of the improvement coming from the reallocation of employment between firms.3
17. A number of obstacles prevent firms from expanding to exploit economies of scale. Staff analysis shows substantial variation of TFP across firms’ size, sector, and region. This regional heterogeneity could point to market fragmentation from the proliferation of regulatory requirements and practices (such as permits and standards) at the regional and local level, which constitute barriers to entry and inhibit competition. Other obstacles to growth include size-dependent thresholds in regulation (e.g., in reporting, auditing, and labor-related regulation) and taxation, as well as limited financing access (Figure 6).
18. Creating the conditions for small- and medium-size enterprises (SME) to grow is critical. A number of measures can help generate crucial economies of scale, both in domestic and external markets. Exploiting these would increase productivity, long-term growth, and employment.
Fostering competition. Fast and effective implementation of the Market Unity Law and moving ahead with the long-delayed liberalization of professional services would facilitate market entry and allocation of resources to their most productive uses.
Lowering constraints. The recent corporate tax reform is set to reduce fiscal disincentives for companies to expand. However, a careful review and assessment of all size-related rules and regulations is needed to identify and eliminate other unwarranted obstacles to growth.
3 See second chapter of Selected Issues Papers.

SPAIN
INTERNATIONAL MONETARY FUND 11
Supporting exports. While the number of exporting firms has increased significantly since the crisis, the degree of internationalization of SMEs is still relatively low. Against this background, the government strategy for boosting internationalization could do more to help SMEs enter export markets and remain competitive, for example by helping reduce the high fixed costs of exporting—including market penetration and other trade costs, and fostering innovation.
19. In this context, efforts to strengthen smaller firms’ access to finance are still important. While bank lending will remain dominant, efforts to increase market-based financing for SMEs, including via alternative exchanges, venture capital, and securitization should continue. The accuracy of financial reporting and transparency could be increased, for example by incorporating consolidated financial information of SMEs in the centralized database and register. For the financing of new firms, the ongoing program providing guarantees and direct financing through ICO, a state-owned financial institution, remains highly relevant and could be complemented by European efforts (including by guarantees extended under the Juncker plan), while making sure they support all SMEs lacking market access.
Authorities’ view
20. The authorities agreed on the need to help firms grow and stressed recent progress in this area. They noted that the implementation of the Market Unity Law is ongoing and that differences in regulatory norms and practices across Spain, which among other factors limit firm growth, are being addressed. They emphasized the link between firm size and export orientation, pointing out that, despite recent advances, additional efforts are necessary to support the internationalization of Spanish SMEs.
C. Further Strengthening Banks While Reducing Debt
21. Banking system indicators have improved in the last year:
Banks’ asset quality and specific provisioning have strengthened. The domestic non-performing loans (NPL) ratio fell to 12.1 percent at end-March 2015 from 13.4 percent one year earlier, while provisions rose to 57 percent of NPLs—significantly above the euro area average (Figure 7).
Banks have increased nominal capital, mostly through reinvested earnings and equity issuance. The phased-in Basel III CET1 capital ratio of the system has increased, reaching 11.8 percent (ranging between 9.7 and 12.7 in the case of the 10 largest banks), comfortably above the minimum regulatory levels. Spain’s large banks are on track to complete the fully-loaded Basel III capital schedule on schedule—or ahead of time in case of the two systemically important financial institutions (SIFIs), which are benefiting from globally-diversified earnings.
Australia
Austria
Belgium
CanadaChile
Czech Republic
Denmark
Estonia
Finland
France
Germany
Greece
Hungary
Iceland
Ireland
IsraelItaly
Japan
Korea
Mexico
Netherlands
New Zealand
Norway
Poland
Portugal
Slovak Republic
Slovenia
SpainSweden
Switzerland
Turkey
United Kingdom
United States
0
20
40
60
80
100
120
0
20
40
60
80
100
120
0 0.5 1 1.5 2
Expo
rts
of g
oods
and
ser
vice
s,
perc
ent
of G
DP
Total labor force (Logs)
Relatively low export-to-GDP ratio
Sources: WEO, IMF staff calculations
GDP share of exports and total labor force, 2014(OECD countries)
SPAIN
12 INTERNATIONAL MONETARY FUND
Funding conditions have become more favorable, supported by the ECB’s Targeted Longer-Term Refinancing Operations (TLTROs) and lower market financing costs, although resident deposits declined moderately mainly due to a shift to higher yielding instruments.
Liquidity has also improved, with Spanish banks now fully complying with the phased-in requirement of 60 percent for the liquidity coverage ratio (LCR).
The profitability of the banking system has increased reflecting lower provisioning costs due to improved asset quality, stronger net interest margins, as deposit rates declined more rapidly than lending rates, and mark-to-market gains on holdings of government bonds linked to the ECB’s purchase program.
Banking sector efficiency has continued to strengthen. Spanish banks lowered operating costs-to-income by 1.5 percentage points (to 49 percent) at end-2014, which compares favorably with peers in large euro area economies. Efficiency gains have followed significant consolidation of the banking sector during 2012–14, with the number of commercial banks falling from 50 to 15.
22. Progress towards the banking union continues. The Single Supervisory Mechanism (SSM) now directly supervises Spain’s larger banks, representing more than 90 percent of the assets in the banking system. The transposition of the Bank Recovery and Resolution Directive (BRRD) in Spain, approved in June 2015, constitutes an important step in implementing an effective European resolution framework. The law established a two-tier setup, with the Bank of Spain being responsible for pre-resolution tasks and the national bank resolution fund (FROB) responsible for all resolution functions in the execution phase. The European Systemic Risk Board (ESRB) has noted that further progress is needed to bring the macroprudential framework in line with its recommendations.
23. Against this background and with the outlook improving, the ongoing deleveraging process has become more selective. The overall level of credit in the economy is still declining but the pace has slowed from around -10 percent at end-2013 to -5 percent year-on-year in April 2015, and it is expected to turn positive by the end of this year. Meanwhile, new credit is being extended,
6
8
10
12
14
16
40
60
80
100
120
140
160
2007 Q2 2008 Q4 2010 Q2 2011 Q4 2013 Q2 2014 Q4
Tier 1 capital
Risk-weighted assets
Tier 1 ratio (rhs)
Banks' capital ratios have strengthened
Sources: Bankscope, IMF staff calculations
Capital Ratios (Index, 2007=100)
0
40
80
120
160
0
1
2
3
4
2005 2007 2009 2011 2013
Net Income (2005=100, rhs)Net Interest Margin (percent)
Source: Bankscope, IMF staff estimates.
Banks' earnings have been recovering
2014

SPAIN
INTERNATIONAL MONETARY FUND 13
especially to non-financial corporations outside real estate and construction with healthy financial positions. New household credit is also growing. The improved credit outlook is mostly demand driven. In the meantime, the process of dealing with the public legacy of the financial crisis continues (see Box 3).
24. However, banks still face challenging operating conditions. Upcoming international regulations on fully-loaded Basel III capital, total loss-absorbing capital (TLAC), and minimum requirements for own funds and eligible liabilities (MREL) will likely demand additional loss-absorbing capacity, including capital, for most banks. A change in the treatment of deferred tax assets (DTAs) might require additional capital buffers for some banks. A prolonged low-interest rate environment in the euro area could compress lending margins, while some banks continue to face significant costs from foreclosed assets and high levels of NPLs. In this context, pressures to cut operational costs are likely to persist.
25. Continued strengthening of the Spanish banking sector will support growth as credit demand picks up. It remains important to further encourage banks to increase high-quality capital (e.g., through equity and restraint on dividends and bonuses) and reduce the carrying costs (e.g., for administration, capital, and funding charges) associated with high levels of NPLs. This will ensure more favorable credit conditions for financially-sound households and corporates, and make it less likely that credit growth will be constrained by supply as the recovery matures.
26. The recent insolvency reforms are significant steps to help facilitate private sector deleveraging. Consistent with previous staff recommendations, in early 2015 Spain introduced a “fresh start” for individual entrepreneurs and consumers. The new mechanism allows for a conditional discharge of individuals’ residual debt after liquidation of assets in bankruptcy. This could encourage liquidation of nonviable businesses whose debt is inseparable from that of individuals (e.g., sole proprietorships) and help households reduce debt to sustainable levels. Other reforms include amendments to the out-of-court restructuring mechanism for SMEs and the restructuring and liquidation procedures within insolvency to facilitate restructuring of viable firms and the sale of businesses as going concerns.
27. Implemented effectively, the “fresh start” can encourage demand and entrepreneurial activity in the formal sector, while preserving Spain’s strong payment culture. Staff analysis suggests that this could potentially reduce the stock of household debt by around 3–4 percent and the level of corporate debt by about 1–2 percent relative to the baseline, which would contribute to higher private consumption and investment (Box 1).4 At the same time, the negative effects on bank earnings are estimated to be limited. Correspondingly, banks are unlikely to face significant impact on their ability to extend credit.
4 See fourth chapter of Selected Issues Papers.
SPAIN
14 INTERNATIONAL MONETARY FUND
28. However, there are critical challenges related to implementation, including:
Achieving the greatest possible clarity regarding the post-liquidation payment plan and conditions that would lead to a revocation of the fresh start would reduce uncertainty for debtors and limit potential for abuse, ultimately maximizing the positive effects of the reform.
The inclusion of public creditors—fully involving them in all restructuring processes of the insolvency regime and making at least those public claims considered ordinary (i.e., 50 percent of tax and social security claims) subject to discharge after liquidation—would increase the effectiveness of the system and avoid creating incentives for debtors to strategically prioritize payments to public creditors at the expense of private ones, with negative effect on payment culture.
Staff estimates that the possible immediate impact on the public sector will likely be small, and it could be positive in the longer term if formal-sector activity increases.
Authorities’ view
29. There was broad agreement on the assessment of banks. The authorities stressed the progress made in dealing with crisis legacies and the continued strengthening of the banking system in terms of capital ratios, profitability, asset quality, funding and liquidity conditions, while acknowledging the challenges coming from a prolonged low interest rate environment and new regulatory issues, including the prospects for higher international loss-absorbency requirements in the coming years.
30. The authorities also generally concurred with staff’s views on the reforms to the insolvency regime. They agreed with the need to clarify certain key elements in the “fresh start” reform, and pointed out that Parliament has already approved amendments to do so. While taking note of staff’s concerns regarding the exclusion of public creditors, they did not consider that this would limit the reform’s effect, and pointed to potential fiscal repercussions of excusing even bankrupt firms from their obligations to the public sector and the harmful impact on the current tax deferment policy. The authorities broadly agreed that the short-term impact of the recent insolvency reforms on banks’ earnings was likely to be limited while stressing that the effects on Spain’s strong payment culture deserved careful monitoring.
D. Ensuring a Coordinated and Credible Fiscal Consolidation
31. Deficit reduction is continuing, supported by higher growth and lower interest rates, but public debt is close to 100 percent of GDP and still increasing. Deficit reduction over the last four years has been critical for underpinning confidence. However, the pace of consolidation has slowed and is stalling this year in structural terms, although significant tailwinds from higher than expected nominal growth and relatively low interest rates are helping to meet the 2015 deficit target of 4.2 percent (Figure 8). Bringing the headline deficit below 3 percent to exit the Excessive Deficit Procedure (EDP) in 2016 and reaching structural balance in 2020 in line with European Union and

SPAIN
INTERNATIONAL MONETARY FUND 15
national rules will be challenging. One reason is that measures specified so far fall short of the required structural adjustment.
32. Fiscal risks at the regional level are particularly high.5 The contribution of regional governments to post-crisis consolidation has been significant, helped by reforms in fiscal governance—in particular the adoption of Spain’s Budget Stability Law (BSL) in 2012 and subsequent improvements in regional budget practices and fiscal transparency. However, fiscal efforts have been uneven across regions and the overall regional target has been systematically missed, threatening to undermine the credibility of the overall consolidation effort going forward (Figure 9). Regional liquidity mechanisms in the form of conditional loans at low interest rates from the central government have helped regions but also raised moral hazard risks.
33. Continued coordinated and credible fiscal consolidation will help protect confidence and reduce vulnerabilities to potential adverse shocks.6 Any windfalls from higher nominal growth and lower borrowing costs should be used to bring the deficit down further. A pace of structural adjustment of around ½ percent of GDP per year would ensure debt is put firmly on a downward path. This will require a concerted effort across all government levels through more ambitious and better-specified measures than currently envisaged, while protecting the most vulnerable. Specifically:
Raising excise duties and environmental levies, and gradually phasing out value added tax (VAT) preferential treatments would bring Spain’s collection efforts more in line with those of other European countries. It would also support a growth-friendly fiscal consolidation by completing the tax shift from direct to indirect taxes initiated with the recent tax reform. In this context, it remains important to protect vulnerable groups by strengthening the support provided by the transfer and tax system.
At the regional level, there is scope for additional efficiency gains and fiscal savings—for example, by reducing the costs of providing public health and education services and, as recommended by the Tax Reform Expert Committee last year, by increasing the regions’ regulatory power to establish copayments for these services. To maintain access and affordability of public education and health services, copayments could be reduced
5 See sixth chapter of Selected Issues Paper for more details. 6 The Debt Sustainability Analysis (DSA) suggests that sustainability risks remain significant, despite the reduction of the fiscal deficit over the last four years (see Appendix III).
65
70
75
80
85
90
95
100
105
2011 2012 2013 2014 2015 2016 2017 2018 2019 2020
Baseline Scenario 1 Scenario 2
Stronger consolidation would accelerate public debt reduction
Sources: Haver, Ministry of Finance, Bank of Spain, and IMF Staff calculations.Note: Baseline scenario based on July 2015 WEO projections. Scenario 1 assumes windfalls from higher growth rate, comparing forecasts in July vs. April WEO vintages and from saving the lower interest rates. Scenario 2 assumes a structural primary balance adjustment of 1/2 percent per annum over the projection period.
Gross public debt under different fiscal strategies (Percent of GDP)
12
16
20
24
28
5
6
7
8
9
10
11
FIN
CYP
EST
PRT
SVN
AUT
MLT
LUX
DEU LVA
ND
LBE
LFR
AG
RC SVK
IRL
ITA
ESP
VAT revenues (left scale)
Standard tax rate (right scale)
Spain's collection from VAT is relatively small
Source: Eurostat.
Gap
VAT Revenues, 2013(percent of GDP)
SPAIN
16 INTERNATIONAL MONETARY FUND
or eliminated for vulnerable groups on the basis of means testing as well as for specific health services (e.g., chronic diseases, preventive care, and immunization).
34. Further improving the regional fiscal framework would help with these efforts. While post-crisis reforms have strengthened regional fiscal autonomy and governance, there is scope for further advances:
The monitoring and enforcement of regional fiscal targets, rules, and access to regional liquidity mechanisms under the BSL and related instruments could be enhanced. This could be achieved, for example, by introducing pre-agreed intra-year targets and corrective measures, stressing regional best budgeting practices, and improving the responsiveness to the independent fiscal council’s recommendations.
Risk sharing and discipline could be rebalanced. Consideration could be given to strengthening the conditionality of existing regional liquidity mechanisms (for example, by making access to all mechanisms conditional to the approval of an adjustment plan and disbursements to compliance with intra-year fiscal targets under this plan) or by adding new conditional credit facilities to help finance regions in bad times (e.g., tax-based rainy day funds).
Fiscal equalization and settlement procedures under the current regional finance system could be improved. A more effective way of equalizing the regions’ resources to meet their spending needs would increase their capacity to reach their fiscal targets. Reviewing the rules determining how intergovernmental transfers are advanced and settled would reinforce their incentives to follow through with fiscal adjustment.
Consideration could also be given to allowing regions’ fiscal targets to differ—in a rules-based and transparent fashion—taking into account structural differences in adjustment needs and capacity.
Authorities’ view
35. The authorities are confident that they can achieve the deficit targets. The planned reduction in the headline deficit this year and next is supported by the strong economic recovery, lower interest rates, and the measures envisaged under the Stability Program. They stressed that the BSL and, in particular, the expenditure rule should help ensure regional fiscal targets are met. They saw public debt on a clear downward path and argued that historical sustainability scenarios based on an extraordinary difficult period including the recent crisis period could be misleading.
36. The authorities broadly agreed with the need to strengthen the regional financing system. They saw merit in a review of the financing system of the regions pointing out the complexity of the issue. They felt that monitoring and enforcement rules under the BSL have supported achieving general government deficit targets and that the conditionality requirements under existing regional financing mechanisms are sufficient to mitigate moral hazard risks.

SPAIN
INTERNATIONAL MONETARY FUND 17
STAFF APPRAISAL 37. Spain’s recovery has accelerated. Stronger confidence is supporting the rebound of domestic demand, aided by the ECB’s expansionary policies and external tailwinds. Employment is growing, even though, at more than 5 million people, unemployment remains painfully high.
38. Past reforms and strong policy implementation are contributing to the recovery. Labor market reforms and moderate wage growth, the Market Unity Law, financial sector reform, and continued fiscal consolidation have reassured financial markets and underpinned confidence.
39. However, it will take additional efforts to sustain growth at current levels. In the medium term, the expansion is constrained by still sizable public and private debt overhangs that are weighing on consumption and investment and deep structural problems, including high structural unemployment and the notoriously low productivity of Spain’s many small firms.
40. There is still significant room for improving labor market performance. Keeping aggregate wage increases in line with productivity and competitiveness while allowing firm-level wages to better reflect business conditions will promote job-rich growth and encourage resources to move to more productive and export oriented sectors. Reducing duality and implementing more effective active labor market policies would improve skills and help the long-term unemployed find work.
41. Reducing obstacles for small firms to grow can unlock productivity. Accelerating the implementation of the Market Unity Law and opening up professional services would foster market entry and competition. A careful review of size-related rules and regulations, supporting SME internationalization, and further developing access to finance would allow firms to scale up and significantly improve Spain’s growth potential.
42. Further strengthening banks will support growth as credit demand recovers. The ECB’s comprehensive assessment confirmed the much stronger position of the banking system, but operating conditions remain challenging. This calls for continuing to build high-quality capital and reducing the carrying costs of high NPLs.
43. The “fresh start” reform facilitates private sector deleveraging. Implemented effectively, it can boost demand and future entrepreneurial activity while protecting Spain’s strong payment culture. Fully involving public creditors would add to the impact of the reform.
44. Credible, coordinated, and growth-friendly fiscal consolidation needs to continue. The deficit has been declining, but consolidation efforts have slowed. A pace of structural adjustment of around ½ percent of GDP per year should be ensured to put debt on a firmly declining path. Any windfalls from lower interest rates and higher-than-expected growth should be saved. Additional measures will be required at all government levels to achieve EDP and Medium-Term Budgetary Objective (MTO) targets. These should be implemented in such a manner as to protect the vulnerable.
SPAIN
18 INTERNATIONAL MONETARY FUND
45. The regional fiscal framework can be strengthened further. Regions contributed significantly but unevenly to post-crisis consolidation. To reduce implementation risks, monitoring and enforcement of fiscal targets and access to regional liquidity mechanisms could be improved and design drawbacks in the regional finance system addressed, including by allowing fiscal targets to vary in line with adjustment needs and capacities.
46. It is recommended that Spain remain on the standard 12-month Article IV consultation cycle.

SPAIN
INTERNATIONAL MONETARY FUND 19
Box 1. Household Deleveraging and Growth
What are the implications of household debt deleveraging for private savings and consumption dynamics? Private consumption has rebounded recently and there is much upside potential. The level of consumption is still 11 percent below its 2007 peak and lagging GDP, which has recovered to about 7½ percent below the pre-crisis peak. The household savings ratio has declined to 9.7 percent in 2014 and could, in principle, fall further. However, the savings rate is already well below its 2000–14 average of 10.6 percent and, at 109 percent of disposable income, Spanish household debt is still high—both in historical and international comparison.
Household savings decisions will also be affected by the need to rebuild assets and wealth. Household wealth has declined substantially since the pre-crisis peak. While the household debt-to-disposable income ratio dropped by 25 percentage points since 2007, household wealth-to-disposable income fell by nearly 30 percent, with house wealth, the bulk of household assets, losing about a third of its value since 2007. Empirical evidence suggests that households’ debt and asset position have had a major influence on consumption in Spain and elsewhere since the crisis.
Simulations illustrate the link between deleveraging, asset accumulation, and household savings. In a baseline scenario, households reduce their gross debt/GDI ratio to its 2004 level within 20 years while house prices are assumed to rise such that the gross asset/GDI ratio improves by 3¼ percent by 2020. With GDI growing at 3½ percent per annum over 2015–20, on average, this would require an increase in household saving ratio from current levels to slightly below the long run historical average. However, achieving the same deleveraging target in just 10 years would require higher savings of ½ percentage point of GDI per year, on average, compared to the baseline (scenario 1). An even more ambitious strategy to rebuild
95
100
105
110
115
95
100
105
110
115
2000 2002 2004 2006 2008 2010 2012 2014
Consumption per capita
GDP per capita
Private consumption is back to 2000 levels(Constant prices, per capita, 2000=100)
Source: INE.
400
600
800
1000
1200
400
600
800
1000
1200
2000 2002 2004 2006 2008 2010 2012 2014
Total wealth/GDI ratio House wealth/GDI Ratio
Household Wealth (In percent of GDI)
Sources: Bank of Spain, Haver and IMF Staff calculations.
-0.30
-0.25
-0.20
-0.15
-0.10
-0.05
0.00
0.05
0.10
0.15
0.20
IRL
ES
P
ND
L
GB
R
DN
K
ITA
JPN
FR
A
US
A
DE
U
CA
N
FIN
SW
E
AU
S
Residual Other
Wealth variables Fiscal variables
Labor income Actual
Consumption Growth: Underlying Determinants(Cumulative change 2008Q1-2011Q4, in real logs)
Source: Jaramillo and Chailloux (forthcoming), IMF Working Paper.Note: For Canada, right panel corresponds to change 2008Q1-2010Q4.
0
20
40
60
80
100
120
140
0
20
40
60
80
100
120
140
UnitedKingdom
Spain France Germany Italy
Households Debt (Percent of gross disposable income)
Sources: Bbk, BdE, BdF,BdI, ONS, Haver Analytics.

SPAIN
20 INTERNATIONAL MONETARY FUND
Box 1. Household Deleveraging and Growth (concluded)
household net wealth by achieving the same deleveraging target in 10 years, while maintaining a constant share of financial assets-to-GDI would require higher savings of 1¼ percentage points of GDI per year, on average, compared to the baseline (scenario 2). If implemented effectively, the recent insolvency reforms, allowing for a “fresh start” for individual entrepreneurs and consumers, could facilitate a decline in household debt and reduce savings. Depending on the speed at which the reform’s effects unfold, it could lower savings by up to a ½ to a third of a percentage point of GDI per year, on average, over a 10 to 20 year period, respectively. This, for example, would at least partially offset the hypothetical increase in the savings ratio vis-à-vis the baseline modeled in scenario 1.
The alternative scenarios would imply lower household consumption than under the baseline, but the effects on aggregate demand depend on the circumstances. For example, aggregate demand would remain unchanged if the higher household savings would finance higher net-exports or be channeled into higher investment, with possible benefits for potential growth going forward. Conversely, to the extent that these additional savings would be used to pay down existing external debt and to lower the very high negative NIIP (see fifth chapter of Selected Issues Papers), aggregate demand would be lower.
8
9
10
11
12
13
2011 2012 2013 2014 2015 2016 2017 2018 2019 2020
Scenario 1 Scenario 2 Baseline
Deleveraging impacts savings and consumption
Sources: Haver and IMF staff calculations.Note: Baseline assumes a return of the gross debt to gross domestic income (GDI) ratio to its 2004 level within 20 years; and an improvement in house prices of 3 percent of GDI by 2020. Scenario 1 achieves the same debt deleveraging in only 10 years, while Scenario 2, in addition, assumes that the financial asset to GDI ratio is brought back to its 2006 level in 6 years.
Household Saving Simulations(In percent of GDI)
SPAIN
INTERNATIONAL MONETARY FUND 21
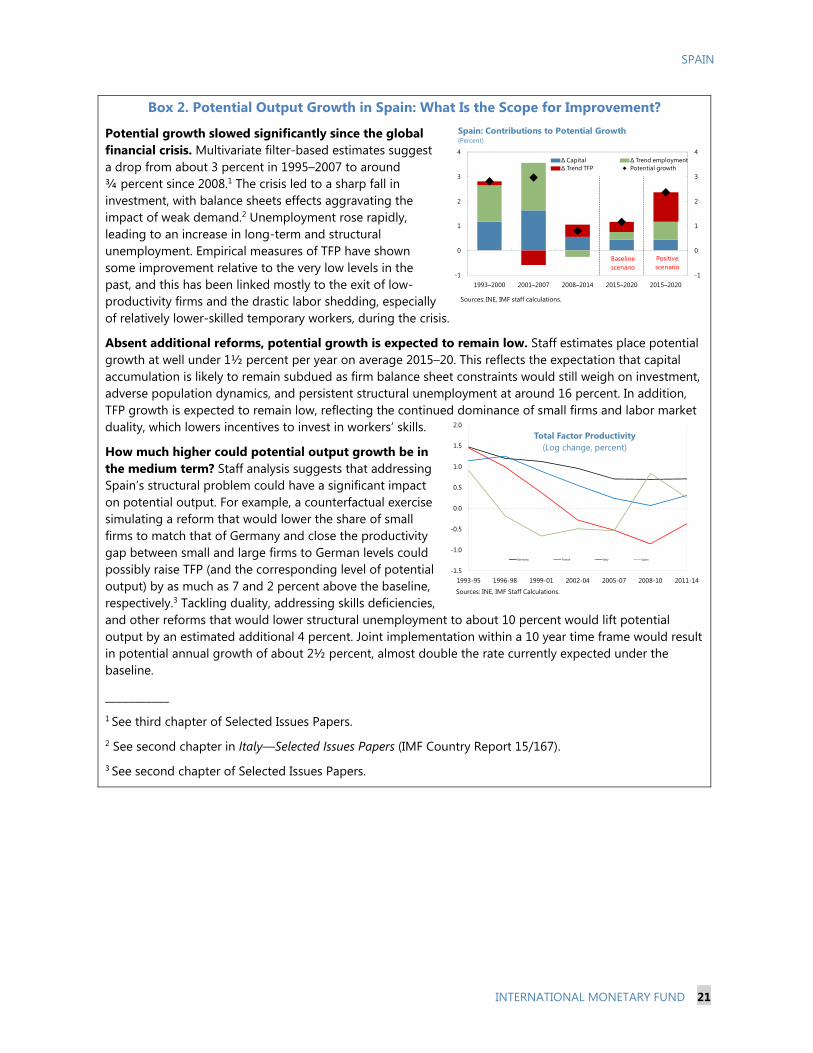
Box 2. Potential Output Growth in Spain: What Is the Scope for Improvement?
Potential growth slowed significantly since the global financial crisis. Multivariate filter-based estimates suggest a drop from about 3 percent in 1995–2007 to around ¾ percent since 2008.1 The crisis led to a sharp fall in investment, with balance sheets effects aggravating the impact of weak demand.2 Unemployment rose rapidly, leading to an increase in long-term and structural unemployment. Empirical measures of TFP have shown some improvement relative to the very low levels in the past, and this has been linked mostly to the exit of low-productivity firms and the drastic labor shedding, especially of relatively lower-skilled temporary workers, during the crisis.
Absent additional reforms, potential growth is expected to remain low. Staff estimates place potential growth at well under 1½ percent per year on average 2015–20. This reflects the expectation that capital accumulation is likely to remain subdued as firm balance sheet constraints would still weigh on investment, adverse population dynamics, and persistent structural unemployment at around 16 percent. In addition, TFP growth is expected to remain low, reflecting the continued dominance of small firms and labor market duality, which lowers incentives to invest in workers’ skills.
How much higher could potential output growth be in the medium term? Staff analysis suggests that addressing Spain’s structural problem could have a significant impact on potential output. For example, a counterfactual exercise simulating a reform that would lower the share of small firms to match that of Germany and close the productivity gap between small and large firms to German levels could possibly raise TFP (and the corresponding level of potential output) by as much as 7 and 2 percent above the baseline, respectively.3 Tackling duality, addressing skills deficiencies, and other reforms that would lower structural unemployment to about 10 percent would lift potential output by an estimated additional 4 percent. Joint implementation within a 10 year time frame would result in potential annual growth of about 2½ percent, almost double the rate currently expected under the baseline.
___________ 1 See third chapter of Selected Issues Papers. 2 See second chapter in Italy—Selected Issues Papers (IMF Country Report 15/167). 3 See second chapter of Selected Issues Papers.
-1
0
1
2
3
4
-1
0
1
2
3
4
1993–2000 2001–2007 2008–2014 2015–2020 2015–2020
∆ Capital ∆ Trend employment∆ Trend TFP Potential growth
Spain: Contributions to Potential Growth (Percent)
Sources: INE, IMF staff calculations.
Positive scenario
Baseline scenario
-1.5
-1.0
-0.5
0.0
0.5
1.0
1.5
2.0
1993-95 1996-98 1999-01 2002-04 2005-07 2008-10 2011-14
Total Factor Productivity (Log change, percent)
Germany France Italy Spain
Sources: INE, IMF Staff Calculations.

SPAIN
22 INTERNATIONAL MONETARY FUND
Box 3. Public Stakes in the Financial Sector Spain’s bank resolution fund, FROB, is making progress in the sale of public stakes in the financial sector, but remaining divestments appear more challenging in the near term. Since 2009, FROB provided €53.5 billion of public support to banks in the form of equity stakes. In 2014, the fund sold its holdings in NCG Banco and Catalunya Banc, as well as a 7.5 percent stake in Bankia, resulting in about €3.5 billion of revenue over a number of years as payments are being received in installments. Buyers of banking stakes have been mainly domestic banks, while portfolios have been acquired by private equity funds. Selling the two remaining stakes (in Bankia and BMN), worth about €11 billion, ahead of the end-2017 and early-2018 deadlines could be more difficult. Although these banks’ earnings have increased, their share price valuations remain below target sale prices, in part due to potential concerns about a large share of deferred tax assets (DTAs) in capital. The FROB also maintains a 45 percent equity stake in SAREB, Spain’s Asset Management Company, amounting to approximately €½ billion, which is expected to be divested by 2027.
SAREB has continued to face losses. Losses amounted to €0.3 billion in 2013 and €0.6 billion in 2014, mainly owing to optimistic valuations of the assets transferred—even though the real estate market has now stabilized after a roughly 40 percent decline. The original portfolio (€50.7 billion) has been reduced by almost 15 percent, broadly in line with the targeted 15-year unwinding schedule. The business plan has recently been updated to reflect more realistic assumptions and SAREB has also hired 4 investment companies, including distressed debt funds, as servicing companies, to manage the cash flow and sales of the bulk of its portfolio assets.
SPAIN
INTERNATIONAL MONETARY FUND 23
Figure 1.The Recovery Has Gathered Speed
Sources: INE; Bank of Spain; Eurostat, Bloomberg; and IMF staff estimates.
-1
1
3
5
7
9
-1
1
3
5
7
9
Jan-10 Jan-11 Jan-12 Jan-13 Jan-14 Jan-15
10-year government bond yields (percent)
Spain
Germany
Italy
Jun-15
Growth picked up in 2014, driven by the rebound in domestic demand, which benefitted from improved confidence, and stronger exports, although net exports contracted.
Strongly improving financial conditions and competitiveness gains have helped.
-10
-8
-6
-4
-2
0
2
4
6
-10
-8
-6
-4
-2
0
2
4
6
2008Q1 2010Q1 2012Q1 2014Q1
Net exports
Domestic demand
GDP growth
Contribution to growth(year-on-year percent change)
2015Q1
5
10
15
20
25
30
80
85
90
95
100
105
2007Q1 2009Q1 2011Q1 2013Q1 2015Q1
Employment (s.a. index, 2008Q1=100)
Employment
Unemployment rate (percent, RHS)
90
100
110
120
130
90
100
110
120
130
2000 2002 2004 2006 2008 2010 2012 2014
ItalyFranceSpainGermany
Real effective exchange rate (ULC based, 2000=100)
60
80
100
120
60
80
100
120
2007 2008 2009 2010 2011 2012 2013 2014
ExportsInvestmentPrivate consumptionImports
GDP selected components(Real index, 2007=100)
-25
-20
-15
-10
-5
0
5
10
15
20
-25
-20
-15
-10
-5
0
5
10
15
20
2007 2009 2011 2013 2015Q1
Industry ConstructionServices
Employment by sector (Last 4 quarters, y-o-y percent change)
The labor market has started to recover.
SPAIN
24 INTERNATIONAL MONETARY FUND
Figure 2. The Housing Sector Appears to Have Bottomed Out
Sources: INE, Haver, IMF staff calculations.
-30
-20
-10
0
10
20
20
40
60
80
100
120
2007 2009 2010 2011 2012 2014
y-o-y percent change, rhs
Index (2007Q4 = 100)
Employment in construction (Index, 2007:Q4=100 and y-o-y percent )
2015Q140
50
60
70
80
90
100
110
40
50
60
70
80
90
100
110
2007 2009 2010 2011 2012 2014
residential
non-residential
Investment in construction (Index, 2007:Q4=100 )
2015Q12015Q1
-60
-50
-40
-30
-20
-10
0
10
-60
-50
-40
-30
-20
-10
0
10
2008 2009 2010 2011 2012 2013 Dec-14
Construction permits(Last 12 months, y-o-y percent change)
-40
-30
-20
-10
0
10
20
30
40
50
-40
-30
-20
-10
0
10
20
30
40
50
2011 2012 2013 2013 2014 Apr-15
Total New Used
House sales (Last 12 months, y-o-y percent change)
-15
-10
-5
0
5
10
60
70
80
90
100
110
2007 2009 2010 2011 2012 2014
y-o-y percent change, rhs
House prices
Housing prices (Index, 2007:Q4 = 100)
2015Q1 0 1 2 3 4
MADBALEXTCEUCANVALCAT
C&LMCANTMUR
SPAINANDGALC&L
VCARAASTMELNAVRIO
Housing Prices by Regions (Change from Trough, as of 2015:Q1, percent)
Construction activity has started to recover, mostly driven by the non-residential sector.
Construction permits have stopped falling and house sales are picking up.
Housing prices started to increase slightly, albeit unevenly across regions
SPAIN
INTERNATIONAL MONETARY FUND 25
Figure 3. Despite the Current Account Surplus, Net External Liabilities Remain High

SPAIN
26 INTERNATIONAL MONETARY FUND
Figure 4. The Crisis’ Legacy and Structural Problems Limit Medium-Term Growth
SPAIN
INTERNATIONAL MONETARY FUND 27
Figure 5. Labor Market Reforms Are Helping, but Further Efforts Needed
Source: INE, Quarterly Labor Force Survey, IMF Staff calculations1/ Residuals from a regression of log nominal hourly wages on lagged unemployment, lagged log CPI, linear and quadratic trend.2/ Prediction based on pre-2012 estimated wage-employment dynamics.
-0.06
-0.04
-0.02
0
0.02
0.04
0.06
0.08
2003 2005 2007 2009 2011 2013
Wages growth regression residuals 1/
2015
-14
-10
-6
-2
2
6
-14
-10
-6
-2
2
6
2008Q1 2010Q1 2012Q1 2014Q1
GDP growth
Private sector employment
GDP and Private Employment Growth (Y-o-y percent change)
Labor marketreforms
-8
-6
-4
-2
0
2
4
-8
-6
-4
-2
0
2
4
1 4 7 10 13 16 19
pre-2012 dynamics
post-2012 dynamics
Employment response to average negative shock(cum. IRF for employment growth from a 2-variable SUR)
-0.25
-0.2
-0.15
-0.1
-0.05
0
0.05
0.1
-0.25
-0.2
-0.15
-0.1
-0.05
0
0.05
0.1
2009Q1 2010Q2 2011Q3 2012Q4 2014Q1
total emp grperm emp grtemp emp gr
Employment growth by type of contract(y-o-y)
2014Q4
The 2012 labor market reforms have supported the wage moderation process.
This has contributed to positive job creation, surpassing output growth, and employment's resilience to adverse shocks improved.
Permanent employment growth has turned positive, but it continues to lag temporary employment growth.
-0.05
0
0.05
0.1
0.00 0.01 0.02 0.03 0.04 0.05
Actu
al
Predicted
Actual vs. predicted wage growth across sectors(2013-14, quarterly; prediction based on pre-2012 estimations) 2/
actual = predicted locus
10
20
30
40
2004 2006 2008 2010 2012 2014
Share of temporary employment(% of total employment)
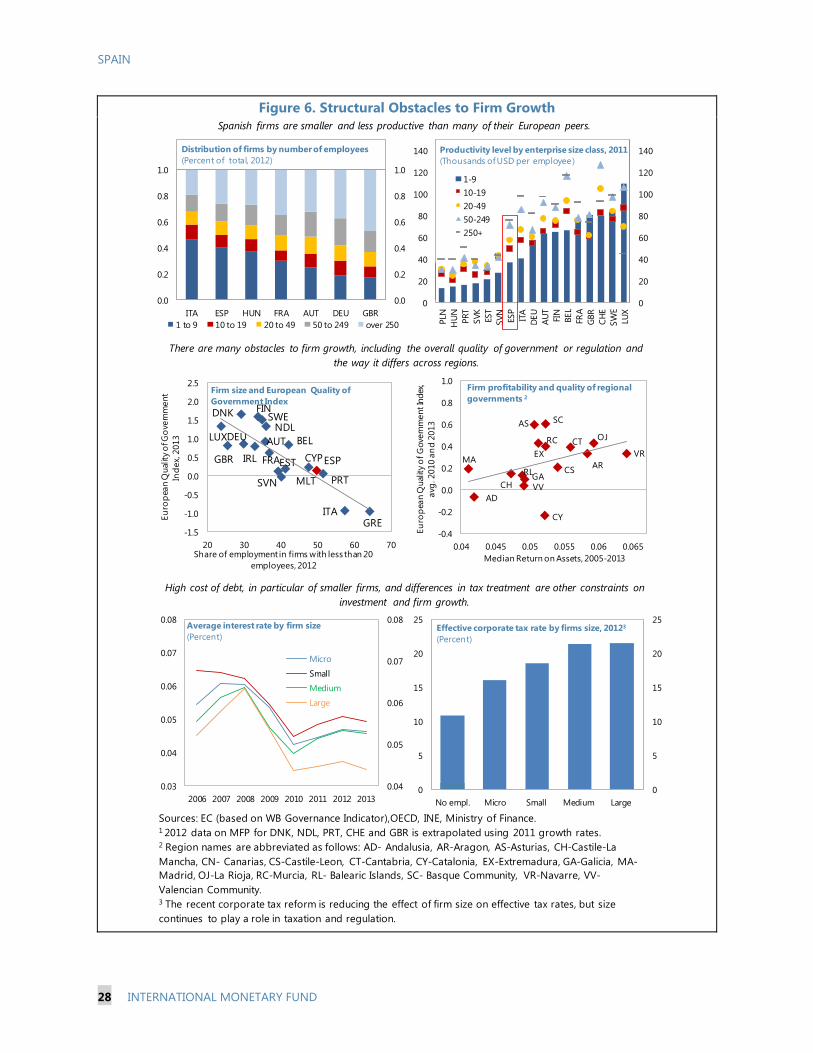
SPAIN
28 INTERNATIONAL MONETARY FUND
Figure 6. Structural Obstacles to Firm Growth
Sources: EC (based on WB Governance Indicator),OECD, INE, Ministry of Finance.1 2012 data on MFP for DNK, NDL, PRT, CHE and GBR is extrapolated using 2011 growth rates. 2 Region names are abbreviated as follows: AD- Andalusia, AR-Aragon, AS-Asturias, CH-Castile-La Mancha, CN- Canarias, CS-Castile-Leon, CT-Cantabria, CY-Catalonia, EX-Extremadura, GA-Galicia, MA-Madrid, OJ-La Rioja, RC-Murcia, RL- Balearic Islands, SC- Basque Community, VR-Navarre, VV-Valencian Community. 3 The recent corporate tax reform is reducing the effect of firm size on effective tax rates, but size continues to play a role in taxation and regulation.
0
20
40
60
80
100
120
140
0
20
40
60
80
100
120
140
PLN
HUN PR
TSV
KES
TSV
NES
PIT
ADE
UAU
TFI
NBE
LFR
AGB
RCH
ESW
ELU
X
1-910-1920-4950-249250+
Productivity level by enterprise size class, 2011(Thousands of USD per employee )
AS
CT OJRC
SC
VRMA
CS
EXAR
RL
AD
CY
CH VVGA
-0.4
-0.2
0.0
0.2
0.4
0.6
0.8
1.0
0.04 0.045 0.05 0.055 0.06 0.065
Euro
pean
Qua
lity o
f Gov
ernm
ent I
ndex
, av
g. 2
010
and
2013
Median Return on Assets, 2005-2013
Firm profitability and quality of regional governments 2
0
5
10
15
20
25
0
5
10
15
20
25
No empl. Micro Small Medium Large
Effective corporate tax rate by firms size, 20123
(Percent)
Spanish firms are smaller and less productive than many of their European peers.
There are many obstacles to firm growth, including the overall quality of government or regulation and the way it differs across regions.
AUT BEL
DNK
DEU
FRA
GREITA
NDL
PRT
ESP
SWE
GBR CYPEST
FIN
IRL
LUX
MLTSVN
-1.5
-1.0
-0.5
0.0
0.5
1.0
1.5
2.0
2.5
20 30 40 50 60 70
Euro
pean
Qua
lity o
f Gov
ernm
ent
Inde
x, 2
013
Share of employment in firms with less than 20 employees, 2012
Firm size and European Quality of Government Index
0.0
0.2
0.4
0.6
0.8
1.0
0.0
0.2
0.4
0.6
0.8
1.0
ITA ESP HUN FRA AUT DEU GBR1 to 9 10 to 19 20 to 49 50 to 249 over 250
Distribution of firms by number of employees (Percent of total, 2012)
High cost of debt, in particular of smaller firms, and differences in tax treatment are other constraints on investment and firm growth.
0.04
0.05
0.06
0.07
0.08
0.03
0.04
0.05
0.06
0.07
0.08
2006 2007 2008 2009 2010 2011 2012 2013
Micro
Small
Medium
Large
Average interest rate by firm size(Percent)

SPAIN
INTERNATIONAL MONETARY FUND 29
Figure 7. Financial Sector Performance Has Improved
Sources: BdE; Haver Analytics; Bankscope; IMF FSI; SNL;and IMF staff estimates.
700
750
800
850
900
950
1,000
0
100
200
300
400
500
600
2007 2009 2011 2013
ECB refinancing and Deposits(Billions of euros)
Mar-15
ECB refinancing
Non-residentdeposits
Resident private
deposits, rhs
0
4
8
12
16
0
60
120
180
240
2007 2008 2009 2010 2011 2012 2013 2014
NPLs
NPL ratio (percent, rhs)
Banks' Asset Quality (Amounts, billions of euros)
Mar-15
30
35
40
45
50
50
60
70
80
Mar-10 Mar-11 Mar-12 Mar-13 Mar-14 Mar-15
Provisions (Percent of NPLs)
Specific + genericprovisions
Specific provisions (rhs)
Banks' NPLs are high but declined in 2014 for the first time since the crisis, helping to improve profitability and strengthen capital of banks.
Overall provisions remain above the euro area average and specific provisions have continued to increase.
Domestic deposits declined modestly in 2014, and the contraction of banks' loan books is slowing.
-10
-5
0
5
10
15
20
25
30
35
-10
-5
0
5
10
15
20
25
30
35
Jun-07 Dec-08 Jun-10 Dec-11 Jun-13 Dec-14
HouseholdsCredit to private sectorNonfinancial corporates
Bank Credit to Private Sector(Percentage annual growth)
0
20
40
60
80
100
0
20
40
60
80
100
LVA
AUT
SVN
PRT
ESP
FRA
SVK
IRL
GRE BE
LIT
A EAM
LT EST
LUX
CYP
2008
2014 or latest
Euro Area: Provisions to NPLs(Percent of NPLs)
2
3
4
5
6
7
8
9
4
6
8
10
12
14
16
18
B1 B2 B3 B4 B5 B6 B7 B8 B9 B10
Phased-in Basel III CET1 Ratio
2014 RoE (rhs)
Capital and Profitability of Spain's 10 Largest Banks(Percent)
Avg of overall banking system=11.8%
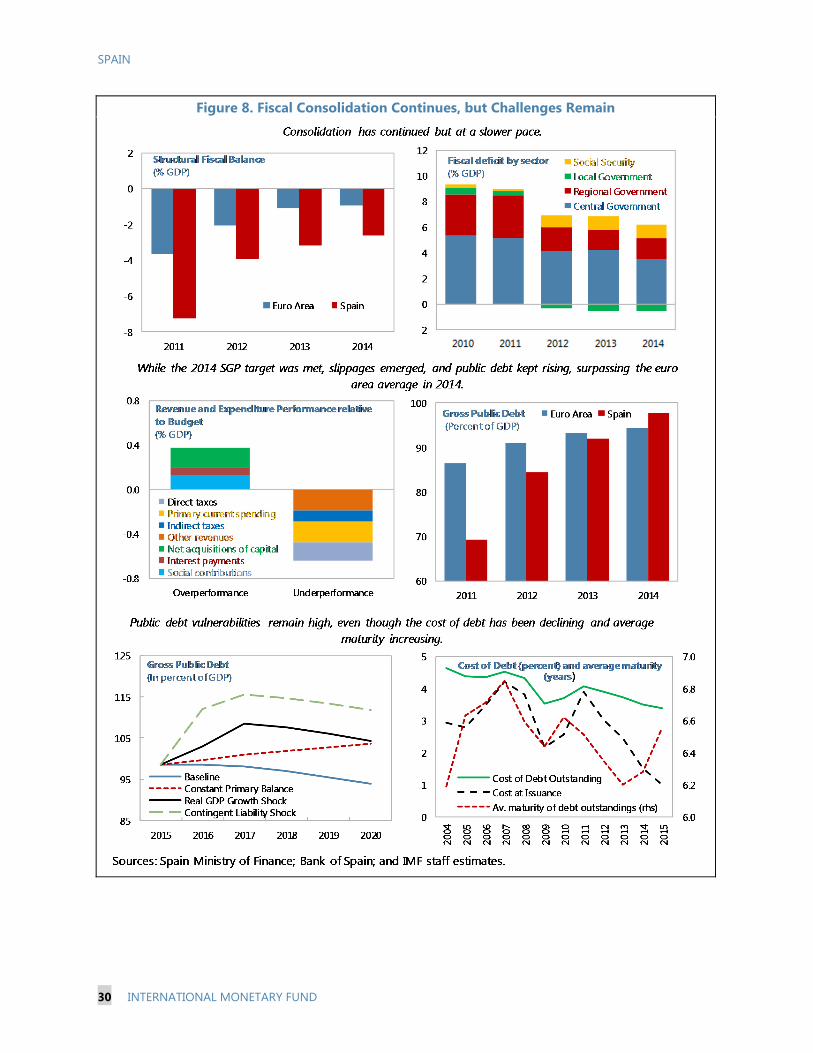
SPAIN
30 INTERNATIONAL MONETARY FUND
Figure 8. Fiscal Consolidation Continues, but Challenges Remain

SPAIN
INTERNATIONAL MONETARY FUND 31
Figure 9. Regional Fiscal Framework
Sources: Ministry of Finance; IGAE; European Comission, Fiscal Rules Database; Bank o f Spain; and Bloomberg.Note: AND = Andalusia; ARA = Aragón; AST = Asturias; BaC = Basque Country; BAL = Baleares; CaL = Castilla y León; CAN = Canarias; CAB = Cantabria; CAT = Catalonia; CCAA = Total CCAA; CLM = Castilla-La Mancha; EXT = Extremadura; GAL = Galicia; LaR = La Rioja; MAD = Madrid; MUR = Murcia; NAV = Navarra; PaV = País Vasco; VAL = Valencia.1/ Positive deviations: under-compliance. Negative deviations: over-compliance.2/ Savings estimates from lower interest obtained under the FLA and FFPP.3/ Yellow bars represent the total debt burden of regions benefitting from RLM (FLA) between 2012-14.
-2
-1
0
1
2
3
4
2010 2011 2012 2013 2014
Fiscal deficit target deviations by sector 1/( percent of GDP) Social Security
MunicipalitiesRegionsCentral Government
-3.5
-3.0
-2.5
-2.0
-1.5
-1.0
-0.5
0.0
0.5
NAV
CAN
BaC
GAL
CaL
AND
LaR
AST
MAD CA
BAR
ABA
LCL
MVA
LEX
TCA
TM
UR
Targeted and Actual Deficit by Region, 2014(Percent of GDP)
2014 Target
6
7
8
9
10
2006 2007 2008 2009 2010 2011 2012
Stric
tnes
s Ind
ex Spain
Median Federal Countries
Median Unitary Countries
Balanced Budget Rules, EU Regional Governments
-5
-3
-1
1
3
5
7
9
11
2007M01 2009M01 2011M01 2012M08 2014M06
Valencia Madrid
Spreads of 10-year regional bonds to soverign maturing 2015-16
RLM (FLA) introduced → (August 2012)
0
5
10
15
20
25
2011 2012 2013 2014
non-RLM regions
RLM regions
Regional Debt Burden 3/(% GDP)
0
200
400
600
800
NAV Pa
VGA
LLa
REX
TAR
ACA
NCa
LAS
TM
AD BAL
CAN
MUR
CLM
AND
VAL
CAT
Savings from Regional Liquidity Mechanisms,2012-14 2/(Millions of euros)
Total CCAA Savings = 2,292 millions
Regions contributed to fiscal consolidation in the past, but continued to miss their target in 2014, with non-compliance being significant...
...notwithstanding reforms that strengthened subnational rules. Acess to regional liquidity mechanisms (RLMs) improved fiscal resilience…
…but bears a risk of increasing moral hazard.
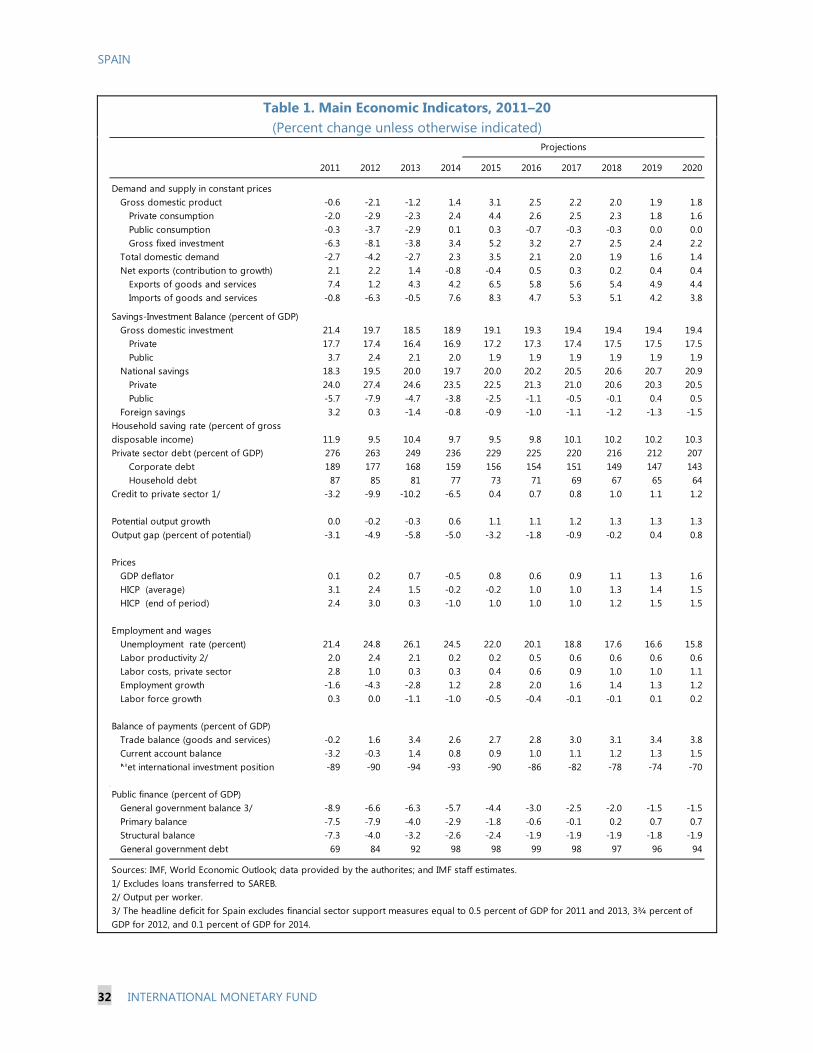
SPAIN
32 INTERNATIONAL MONETARY FUND
Table 1. Main Economic Indicators, 2011–20 (Percent change unless otherwise indicated)
2011 2012 2013 2014 2015 2016 2017 2018 2019 2020
Demand and supply in constant pricesGross domestic product -0.6 -2.1 -1.2 1.4 3.1 2.5 2.2 2.0 1.9 1.8
Private consumption -2.0 -2.9 -2.3 2.4 4.4 2.6 2.5 2.3 1.8 1.6Public consumption -0.3 -3.7 -2.9 0.1 0.3 -0.7 -0.3 -0.3 0.0 0.0Gross fixed investment -6.3 -8.1 -3.8 3.4 5.2 3.2 2.7 2.5 2.4 2.2
Total domestic demand -2.7 -4.2 -2.7 2.3 3.5 2.1 2.0 1.9 1.6 1.4Net exports (contribution to growth) 2.1 2.2 1.4 -0.8 -0.4 0.5 0.3 0.2 0.4 0.4
Exports of goods and services 7.4 1.2 4.3 4.2 6.5 5.8 5.6 5.4 4.9 4.4Imports of goods and services -0.8 -6.3 -0.5 7.6 8.3 4.7 5.3 5.1 4.2 3.8
Savings-Investment Balance (percent of GDP) Gross domestic investment 21.4 19.7 18.5 18.9 19.1 19.3 19.4 19.4 19.4 19.4 Private 17.7 17.4 16.4 16.9 17.2 17.3 17.4 17.5 17.5 17.5 Public 3.7 2.4 2.1 2.0 1.9 1.9 1.9 1.9 1.9 1.9 National savings 18.3 19.5 20.0 19.7 20.0 20.2 20.5 20.6 20.7 20.9 Private 24.0 27.4 24.6 23.5 22.5 21.3 21.0 20.6 20.3 20.5 Public -5.7 -7.9 -4.7 -3.8 -2.5 -1.1 -0.5 -0.1 0.4 0.5 Foreign savings 3.2 0.3 -1.4 -0.8 -0.9 -1.0 -1.1 -1.2 -1.3 -1.5Household saving rate (percent of gross disposable income) 11.9 9.5 10.4 9.7 9.5 9.8 10.1 10.2 10.2 10.3Private sector debt (percent of GDP) 276 263 249 236 229 225 220 216 212 207
Corporate debt 189 177 168 159 156 154 151 149 147 143Household debt 87 85 81 77 73 71 69 67 65 64
Credit to private sector 1/ -3.2 -9.9 -10.2 -6.5 0.4 0.7 0.8 1.0 1.1 1.2
Potential output growth 0.0 -0.2 -0.3 0.6 1.1 1.1 1.2 1.3 1.3 1.3Output gap (percent of potential) -3.1 -4.9 -5.8 -5.0 -3.2 -1.8 -0.9 -0.2 0.4 0.8
PricesGDP deflator 0.1 0.2 0.7 -0.5 0.8 0.6 0.9 1.1 1.3 1.6HICP (average) 3.1 2.4 1.5 -0.2 -0.2 1.0 1.0 1.3 1.4 1.5HICP (end of period) 2.4 3.0 0.3 -1.0 1.0 1.0 1.0 1.2 1.5 1.5
Employment and wagesUnemployment rate (percent) 21.4 24.8 26.1 24.5 22.0 20.1 18.8 17.6 16.6 15.8Labor productivity 2/ 2.0 2.4 2.1 0.2 0.2 0.5 0.6 0.6 0.6 0.6Labor costs, private sector 2.8 1.0 0.3 0.3 0.4 0.6 0.9 1.0 1.0 1.1Employment growth -1.6 -4.3 -2.8 1.2 2.8 2.0 1.6 1.4 1.3 1.2Labor force growth 0.3 0.0 -1.1 -1.0 -0.5 -0.4 -0.1 -0.1 0.1 0.2
Balance of payments (percent of GDP)Trade balance (goods and services) -0.2 1.6 3.4 2.6 2.7 2.8 3.0 3.1 3.4 3.8Current account balance -3.2 -0.3 1.4 0.8 0.9 1.0 1.1 1.2 1.3 1.5Net international investment position -89 -90 -94 -93 -90 -86 -82 -78 -74 -70
Public finance (percent of GDP)General government balance 3/ -8.9 -6.6 -6.3 -5.7 -4.4 -3.0 -2.5 -2.0 -1.5 -1.5Primary balance -7.5 -7.9 -4.0 -2.9 -1.8 -0.6 -0.1 0.2 0.7 0.7Structural balance -7.3 -4.0 -3.2 -2.6 -2.4 -1.9 -1.9 -1.9 -1.8 -1.9General government debt 69 84 92 98 98 99 98 97 96 94
Sources: IMF, World Economic Outlook; data provided by the authorites; and IMF staff estimates.1/ Excludes loans transferred to SAREB.2/ Output per worker.
Projections
3/ The headline deficit for Spain excludes financial sector support measures equal to 0.5 percent of GDP for 2011 and 2013, 3¾ percent of GDP for 2012, and 0.1 percent of GDP for 2014.
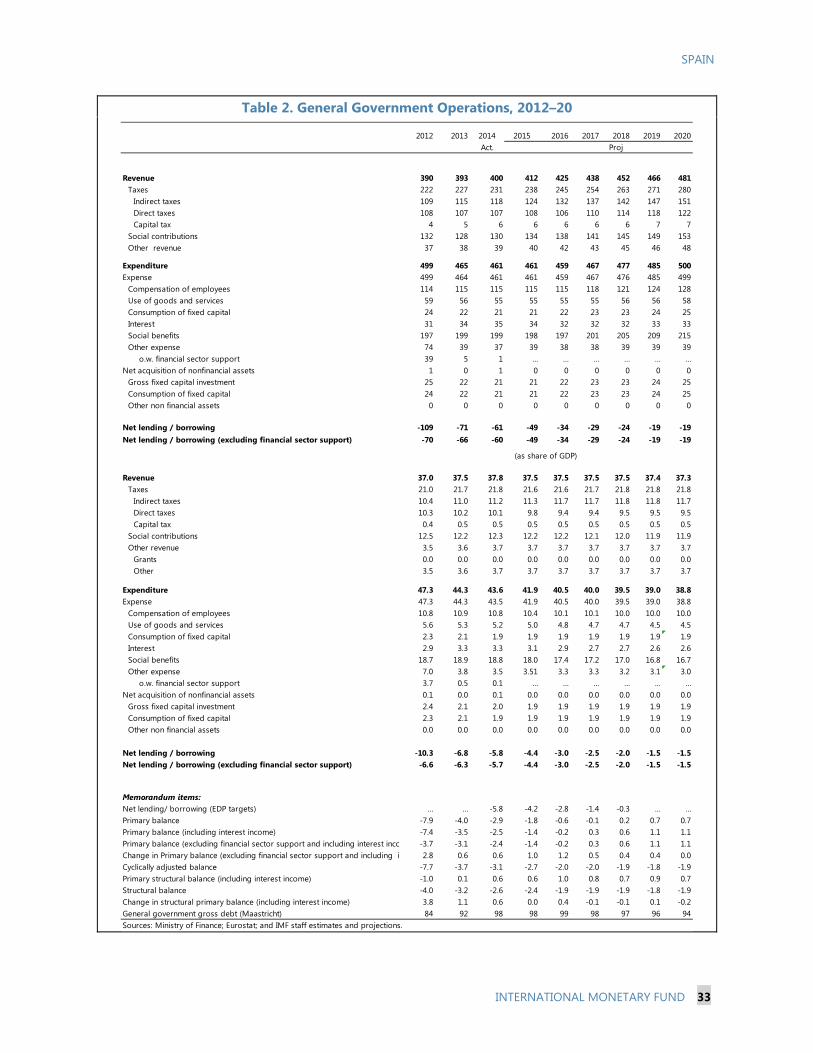
SPAIN
INTERNATIONAL MONETARY FUND 33
Table 2. General Government Operations, 2012–20
2012 2013 2016 2017 2018 2019 2020Act.
Revenue 390 393 400 412 425 438 452 466 481Taxes 222 227 231 238 245 254 263 271 280
Indirect taxes 109 115 118 124 132 137 142 147 151Direct taxes 108 107 107 108 106 110 114 118 122Capital tax 4 5 6 6 6 6 6 7 7
Social contributions 132 128 130 134 138 141 145 149 153Other revenue 37 38 39 40 42 43 45 46 48
Expenditure 499 465 461 461 459 467 477 485 500Expense 499 464 461 461 459 467 476 485 499
Compensation of employees 114 115 115 115 115 118 121 124 128Use of goods and services 59 56 55 55 55 55 56 56 58Consumption of fixed capital 24 22 21 21 22 23 23 24 25Interest 31 34 35 34 32 32 32 33 33Social benefits 197 199 199 198 197 201 205 209 215Other expense 74 39 37 39 38 38 39 39 39
o.w. financial sector support 39 5 1 … … … … … …Net acquisition of nonfinancial assets 1 0 1 0 0 0 0 0 0
Gross fixed capital investment 25 22 21 21 22 23 23 24 25Consumption of fixed capital 24 22 21 21 22 23 23 24 25Other non financial assets 0 0 0 0 0 0 0 0 0
Net lending / borrowing -109 -71 -61 -49 -34 -29 -24 -19 -19Net lending / borrowing (excluding financial sector support) -70 -66 -60 -49 -34 -29 -24 -19 -19
Revenue 37.0 37.5 37.8 37.5 37.5 37.5 37.5 37.4 37.3Taxes 21.0 21.7 21.8 21.6 21.6 21.7 21.8 21.8 21.8
Indirect taxes 10.4 11.0 11.2 11.3 11.7 11.7 11.8 11.8 11.7Direct taxes 10.3 10.2 10.1 9.8 9.4 9.4 9.5 9.5 9.5Capital tax 0.4 0.5 0.5 0.5 0.5 0.5 0.5 0.5 0.5
Social contributions 12.5 12.2 12.3 12.2 12.2 12.1 12.0 11.9 11.9Other revenue 3.5 3.6 3.7 3.7 3.7 3.7 3.7 3.7 3.7
Grants 0.0 0.0 0.0 0.0 0.0 0.0 0.0 0.0 0.0Other 3.5 3.6 3.7 3.7 3.7 3.7 3.7 3.7 3.7
Expenditure 47.3 44.3 43.6 41.9 40.5 40.0 39.5 39.0 38.8Expense 47.3 44.3 43.5 41.9 40.5 40.0 39.5 39.0 38.8
Compensation of employees 10.8 10.9 10.8 10.4 10.1 10.1 10.0 10.0 10.0Use of goods and services 5.6 5.3 5.2 5.0 4.8 4.7 4.7 4.5 4.5Consumption of fixed capital 2.3 2.1 1.9 1.9 1.9 1.9 1.9 1.9 1.9Interest 2.9 3.3 3.3 3.1 2.9 2.7 2.7 2.6 2.6Social benefits 18.7 18.9 18.8 18.0 17.4 17.2 17.0 16.8 16.7Other expense 7.0 3.8 3.5 3.51 3.3 3.3 3.2 3.1 3.0
o.w. financial sector support 3.7 0.5 0.1 … … … … … …Net acquisition of nonfinancial assets 0.1 0.0 0.1 0.0 0.0 0.0 0.0 0.0 0.0
Gross fixed capital investment 2.4 2.1 2.0 1.9 1.9 1.9 1.9 1.9 1.9Consumption of fixed capital 2.3 2.1 1.9 1.9 1.9 1.9 1.9 1.9 1.9Other non financial assets 0.0 0.0 0.0 0.0 0.0 0.0 0.0 0.0 0.0
Net lending / borrowing -10.3 -6.8 -5.8 -4.4 -3.0 -2.5 -2.0 -1.5 -1.5Net lending / borrowing (excluding financial sector support) -6.6 -6.3 -5.7 -4.4 -3.0 -2.5 -2.0 -1.5 -1.5
Memorandum items:Net lending/ borrowing (EDP targets) … … -5.8 -4.2 -2.8 -1.4 -0.3 … …Primary balance -7.9 -4.0 -2.9 -1.8 -0.6 -0.1 0.2 0.7 0.7Primary balance (including interest income) -7.4 -3.5 -2.5 -1.4 -0.2 0.3 0.6 1.1 1.1Primary balance (excluding financial sector support and including interest inco -3.7 -3.1 -2.4 -1.4 -0.2 0.3 0.6 1.1 1.1Change in Primary balance (excluding financial sector support and including i 2.8 0.6 0.6 1.0 1.2 0.5 0.4 0.4 0.0Cyclically adjusted balance -7.7 -3.7 -3.1 -2.7 -2.0 -2.0 -1.9 -1.8 -1.9Primary structural balance (including interest income) -1.0 0.1 0.6 0.6 1.0 0.8 0.7 0.9 0.7Structural balance -4.0 -3.2 -2.6 -2.4 -1.9 -1.9 -1.9 -1.8 -1.9Change in structural primary balance (including interest income) 3.8 1.1 0.6 0.0 0.4 -0.1 -0.1 0.1 -0.2General government gross debt (Maastricht) 84 92 98 98 99 98 97 96 94Sources: Ministry of Finance; Eurostat; and IMF staff estimates and projections.
(as share of GDP)
Proj2014 2015
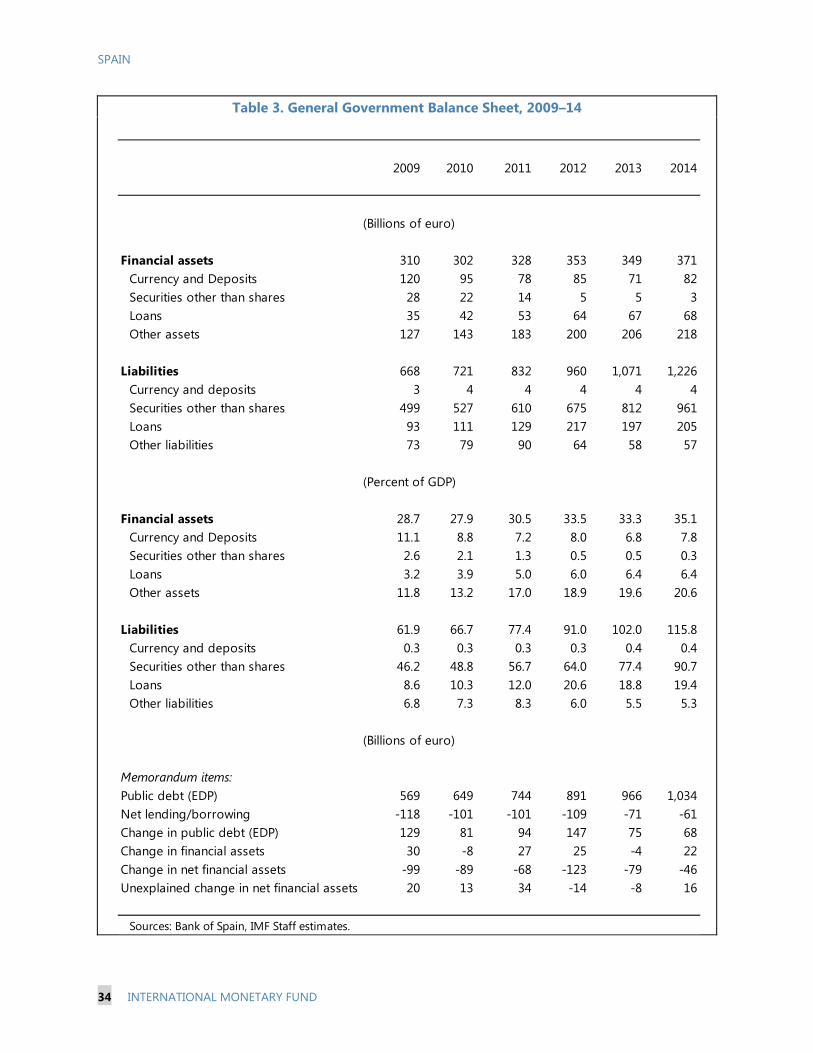
SPAIN
34 INTERNATIONAL MONETARY FUND
Table 3. General Government Balance Sheet, 2009–14
2009 2010 2011 2012 2013 2014
Financial assets 310 302 328 353 349 371
Currency and Deposits 120 95 78 85 71 82Securities other than shares 28 22 14 5 5 3Loans 35 42 53 64 67 68Other assets 127 143 183 200 206 218
Liabilities 668 721 832 960 1,071 1,226Currency and deposits 3 4 4 4 4 4Securities other than shares 499 527 610 675 812 961Loans 93 111 129 217 197 205Other liabilities 73 79 90 64 58 57
Financial assets 28.7 27.9 30.5 33.5 33.3 35.1Currency and Deposits 11.1 8.8 7.2 8.0 6.8 7.8Securities other than shares 2.6 2.1 1.3 0.5 0.5 0.3Loans 3.2 3.9 5.0 6.0 6.4 6.4Other assets 11.8 13.2 17.0 18.9 19.6 20.6
Liabilities 61.9 66.7 77.4 91.0 102.0 115.8Currency and deposits 0.3 0.3 0.3 0.3 0.4 0.4Securities other than shares 46.2 48.8 56.7 64.0 77.4 90.7Loans 8.6 10.3 12.0 20.6 18.8 19.4Other liabilities 6.8 7.3 8.3 6.0 5.5 5.3
Memorandum items:Public debt (EDP) 569 649 744 891 966 1,034Net lending/borrowing -118 -101 -101 -109 -71 -61Change in public debt (EDP) 129 81 94 147 75 68Change in financial assets 30 -8 27 25 -4 22Change in net financial assets -99 -89 -68 -123 -79 -46Unexplained change in net financial assets 20 13 34 -14 -8 16
Sources: Bank of Spain, IMF Staff estimates.
(Percent of GDP)
(Billions of euro)
(Billions of euro)

SPAIN
INTERNATIONAL MONETARY FUND 35
Table 4. Selected Financial Soundness Indicators, 2006–14 (Percent or otherwise indicated)
2006 2007 2008 2009 2010 2011 2012 2013 2014
SolvencyRegulatory capital to risk-weighted assets 1/ 11.9 11.4 11.3 12.2 11.9 12.2 11.6 13.3 13.7Tier 1 capital to risk-weighted assets 1/ 7.5 7.9 8.2 9.4 9.7 10.3 10.0 11.9 11.9Capital to total assets 6.0 6.3 5.5 6.1 5.8 5.7 5.8 6.8 7.2
ProfitabilityReturns on average assets 1.0 1.1 0.7 0.5 0.5 0.0 -1.4 0.4 0.4Returns on average equity 19.5 19.5 12.0 8.8 7.2 -0.5 -21.0 5.4 5.7Interest margin to gross income 50.3 49.4 53.0 63.7 54.2 51.8 54.1 52.3 57.9Operating expenses to gross income 47.5 43.1 44.5 43.5 46.5 49.8 45.4 53.8 55.8
Asset quality 2/Non performing loans (billions of euro) 10.9 16.3 63.1 93.3 107.2 139.8 167.5 197.2 172.6Non-performing to total loans 0.7 0.9 3.4 5.1 5.8 7.8 10.4 13.6 12.5Specific provisions to non-performing loans 43.6 39.2 29.9 37.7 39.6 37.1 42.6 46.9 48.9Exposure to construction sector (billions of euro) 3/ 378.4 457.0 469.9 453.4 430.3 396.9 300.4 237.0 209.6
of which : Non-performing (percent) 0.3 0.6 5.7 9.6 13.5 20.6 28.2 37.1 36.3Households - House purchase (billions of euro) 523.6 595.9 626.6 624.8 632.4 626.6 605.3 580.8 564.3
of which: Non-performing (percent) 0.4 0.7 2.4 4.9 2.4 2.9 4.0 6.0 6.0Households - Other spending (billions of euro) 203.4 221.2 226.3 220.9 226.3 211.9 199.1 148.3 151.3
of which: Non-performing (percent) 1.7 2.3 4.8 6.1 5.4 5.5 7.5 11.2 10.4
LiquidityUse of ECB refinancing (billions of euro) 4/ 21.2 52.3 92.8 81.4 69.7 132.8 357.3 206.8 141.6
in percent of total ECB refin. operations 4.9 11.6 11.6 12.5 13.5 21.0 32.0 28.8 26.2in percent of total assets of Spanish MFIs 0.8 1.7 2.7 2.4 2.0 3.7 10.0 6.6 4.8
Loan-to-deposit ratio 5/ 165.0 168.2 158.0 151.5 149.2 150.0 137.3 123.0 119.0
Market indicators (end-period)
Stock market (percent changes)IBEX 35 31.8 7.3 -39.4 29.8 -17.4 -13.4 -6.4 21.4 3.7
Santander 26.8 4.6 -51.0 73.0 -30.5 -26.3 2.2 6.7 -8.2
BBVA 21.0 -8.1 -48.3 49.4 -38.2 -12.1 2.4 28.6 -24.2
Popular 33.3 -14.8 -48.0 -13.9 -24.1 -9.1 -69.9 49.7 -5.1
CDS (spread in basis points) 6/Spain 2.7 12.7 90.8 103.8 284.3 466.3 294.8 154.0 96.9
Santander 8.7 45.4 103.5 81.7 252.8 393.1 270.0 120.0 79.5
BBVA 8.8 40.8 98.3 83.8 267.9 407.1 285.0 122.0 75.5
Sources: Bank of Spain; ECB; WEO; Bloomberg; and IMF staff estimates.
2/ Refers to domestic operations.3/ Including real estate developers.4/ Sum of main and long-term refinancing operations and marginal facility.5/ Ratio between loans to and deposits from other resident sectors.6/ Senior 5 years in euro.
1/ Starting 2008, solvency ratios are calculated according to CBE 3/2008 transposing EU Directives 2006/48/EC and 2006/49/EC (based on Basel II). In particular, the Tier 1 ratio takes into account the deductions from Tier 1 and the part of the new general deductions from total own funds which are attributable to Tier 1.
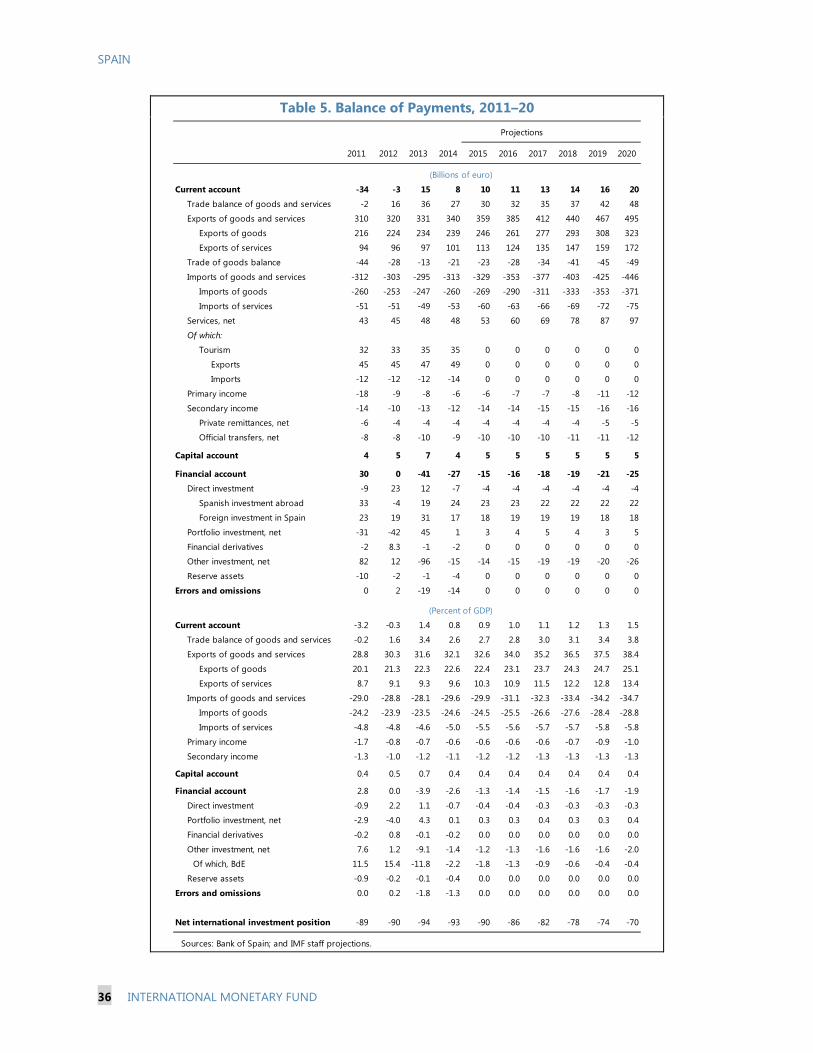
SPAIN
36 INTERNATIONAL MONETARY FUND
Table 5. Balance of Payments, 2011–20
2011 2012 2013 2014 2015 2016 2017 2018 2019 2020
Current account -34 -3 15 8 10 11 13 14 16 20
Trade balance of goods and services -2 16 36 27 30 32 35 37 42 48
Exports of goods and services 310 320 331 340 359 385 412 440 467 495
Exports of goods 216 224 234 239 246 261 277 293 308 323
Exports of services 94 96 97 101 113 124 135 147 159 172
Trade of goods balance -44 -28 -13 -21 -23 -28 -34 -41 -45 -49
Imports of goods and services -312 -303 -295 -313 -329 -353 -377 -403 -425 -446
Imports of goods -260 -253 -247 -260 -269 -290 -311 -333 -353 -371
Imports of services -51 -51 -49 -53 -60 -63 -66 -69 -72 -75
Services, net 43 45 48 48 53 60 69 78 87 97
Of which:
Tourism 32 33 35 35 0 0 0 0 0 0
Exports 45 45 47 49 0 0 0 0 0 0
Imports -12 -12 -12 -14 0 0 0 0 0 0
Primary income -18 -9 -8 -6 -6 -7 -7 -8 -11 -12
Secondary income -14 -10 -13 -12 -14 -14 -15 -15 -16 -16
Private remittances, net -6 -4 -4 -4 -4 -4 -4 -4 -5 -5
Official transfers, net -8 -8 -10 -9 -10 -10 -10 -11 -11 -12
Capital account 4 5 7 4 5 5 5 5 5 5
Financial account 30 0 -41 -27 -15 -16 -18 -19 -21 -25
Direct investment -9 23 12 -7 -4 -4 -4 -4 -4 -4
Spanish investment abroad 33 -4 19 24 23 23 22 22 22 22
Foreign investment in Spain 23 19 31 17 18 19 19 19 18 18
Portfolio investment, net -31 -42 45 1 3 4 5 4 3 5
Financial derivatives -2 8.3 -1 -2 0 0 0 0 0 0
Other investment, net 82 12 -96 -15 -14 -15 -19 -19 -20 -26
Reserve assets -10 -2 -1 -4 0 0 0 0 0 0
Errors and omissions 0 2 -19 -14 0 0 0 0 0 0
Current account -3.2 -0.3 1.4 0.8 0.9 1.0 1.1 1.2 1.3 1.5
Trade balance of goods and services -0.2 1.6 3.4 2.6 2.7 2.8 3.0 3.1 3.4 3.8
Exports of goods and services 28.8 30.3 31.6 32.1 32.6 34.0 35.2 36.5 37.5 38.4
Exports of goods 20.1 21.3 22.3 22.6 22.4 23.1 23.7 24.3 24.7 25.1
Exports of services 8.7 9.1 9.3 9.6 10.3 10.9 11.5 12.2 12.8 13.4
Imports of goods and services -29.0 -28.8 -28.1 -29.6 -29.9 -31.1 -32.3 -33.4 -34.2 -34.7
Imports of goods -24.2 -23.9 -23.5 -24.6 -24.5 -25.5 -26.6 -27.6 -28.4 -28.8
Imports of services -4.8 -4.8 -4.6 -5.0 -5.5 -5.6 -5.7 -5.7 -5.8 -5.8
Primary income -1.7 -0.8 -0.7 -0.6 -0.6 -0.6 -0.6 -0.7 -0.9 -1.0
Secondary income -1.3 -1.0 -1.2 -1.1 -1.2 -1.2 -1.3 -1.3 -1.3 -1.3
Capital account 0.4 0.5 0.7 0.4 0.4 0.4 0.4 0.4 0.4 0.4
Financial account 2.8 0.0 -3.9 -2.6 -1.3 -1.4 -1.5 -1.6 -1.7 -1.9
Direct investment -0.9 2.2 1.1 -0.7 -0.4 -0.4 -0.3 -0.3 -0.3 -0.3
Portfolio investment, net -2.9 -4.0 4.3 0.1 0.3 0.3 0.4 0.3 0.3 0.4
Financial derivatives -0.2 0.8 -0.1 -0.2 0.0 0.0 0.0 0.0 0.0 0.0
Other investment, net 7.6 1.2 -9.1 -1.4 -1.2 -1.3 -1.6 -1.6 -1.6 -2.0
Of which, BdE 11.5 15.4 -11.8 -2.2 -1.8 -1.3 -0.9 -0.6 -0.4 -0.4
Reserve assets -0.9 -0.2 -0.1 -0.4 0.0 0.0 0.0 0.0 0.0 0.0
Errors and omissions 0.0 0.2 -1.8 -1.3 0.0 0.0 0.0 0.0 0.0 0.0
Net international investment position -89 -90 -94 -93 -90 -86 -82 -78 -74 -70
Sources: Bank of Spain; and IMF staff projections.
(Billions of euro)
(Percent of GDP)
Projections
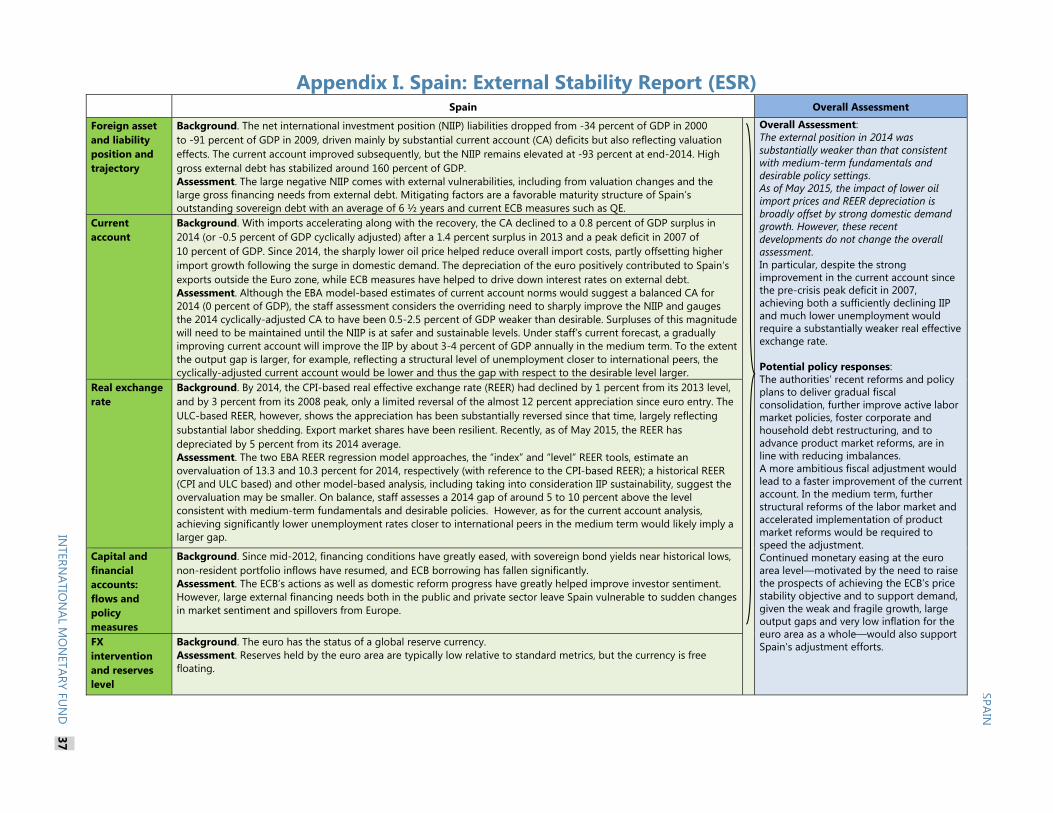
Appendix I. Spain: External Stability Report (ESR) Spain Overall Assessment
Foreign asset and liability position and trajectory
Background. The net international investment position (NIIP) liabilities dropped from -34 percent of GDP in 2000 to -91 percent of GDP in 2009, driven mainly by substantial current account (CA) deficits but also reflecting valuation effects. The current account improved subsequently, but the NIIP remains elevated at -93 percent at end-2014. High gross external debt has stabilized around 160 percent of GDP. Assessment. The large negative NIIP comes with external vulnerabilities, including from valuation changes and the large gross financing needs from external debt. Mitigating factors are a favorable maturity structure of Spain’s outstanding sovereign debt with an average of 6 ½ years and current ECB measures such as QE.
Overall Assessment: The external position in 2014 was substantially weaker than that consistent with medium-term fundamentals and desirable policy settings. As of May 2015, the impact of lower oil import prices and REER depreciation is broadly offset by strong domestic demand growth. However, these recent developments do not change the overall assessment. In particular, despite the strong improvement in the current account since the pre-crisis peak deficit in 2007, achieving both a sufficiently declining IIP and much lower unemployment would require a substantially weaker real effective exchange rate. Potential policy responses: The authorities’ recent reforms and policy plans to deliver gradual fiscal consolidation, further improve active labor market policies, foster corporate and household debt restructuring, and to advance product market reforms, are in line with reducing imbalances. A more ambitious fiscal adjustment would lead to a faster improvement of the current account. In the medium term, further structural reforms of the labor market and accelerated implementation of product market reforms would be required to speed the adjustment. Continued monetary easing at the euro area level—motivated by the need to raise the prospects of achieving the ECB’s price stability objective and to support demand, given the weak and fragile growth, large output gaps and very low inflation for the euro area as a whole—would also support Spain’s adjustment efforts.
Current account
Background. With imports accelerating along with the recovery, the CA declined to a 0.8 percent of GDP surplus in 2014 (or -0.5 percent of GDP cyclically adjusted) after a 1.4 percent surplus in 2013 and a peak deficit in 2007 of 10 percent of GDP. Since 2014, the sharply lower oil price helped reduce overall import costs, partly offsetting higher import growth following the surge in domestic demand. The depreciation of the euro positively contributed to Spain’s exports outside the Euro zone, while ECB measures have helped to drive down interest rates on external debt. Assessment. Although the EBA model-based estimates of current account norms would suggest a balanced CA for 2014 (0 percent of GDP), the staff assessment considers the overriding need to sharply improve the NIIP and gauges the 2014 cyclically-adjusted CA to have been 0.5-2.5 percent of GDP weaker than desirable. Surpluses of this magnitude will need to be maintained until the NIIP is at safer and sustainable levels. Under staff’s current forecast, a gradually improving current account will improve the IIP by about 3-4 percent of GDP annually in the medium term. To the extent the output gap is larger, for example, reflecting a structural level of unemployment closer to international peers, the cyclically-adjusted current account would be lower and thus the gap with respect to the desirable level larger.
Real exchange rate
Background. By 2014, the CPI-based real effective exchange rate (REER) had declined by 1 percent from its 2013 level, and by 3 percent from its 2008 peak, only a limited reversal of the almost 12 percent appreciation since euro entry. The ULC-based REER, however, shows the appreciation has been substantially reversed since that time, largely reflecting substantial labor shedding. Export market shares have been resilient. Recently, as of May 2015, the REER has depreciated by 5 percent from its 2014 average. Assessment. The two EBA REER regression model approaches, the “index” and “level” REER tools, estimate an overvaluation of 13.3 and 10.3 percent for 2014, respectively (with reference to the CPI-based REER); a historical REER (CPI and ULC based) and other model-based analysis, including taking into consideration IIP sustainability, suggest the overvaluation may be smaller. On balance, staff assesses a 2014 gap of around 5 to 10 percent above the level consistent with medium-term fundamentals and desirable policies. However, as for the current account analysis, achieving significantly lower unemployment rates closer to international peers in the medium term would likely imply a larger gap.
Capital and financial accounts: flows and policy measures
Background. Since mid-2012, financing conditions have greatly eased, with sovereign bond yields near historical lows, non-resident portfolio inflows have resumed, and ECB borrowing has fallen significantly. Assessment. The ECB’s actions as well as domestic reform progress have greatly helped improve investor sentiment. However, large external financing needs both in the public and private sector leave Spain vulnerable to sudden changes in market sentiment and spillovers from Europe.
FX intervention and reserves level
Background. The euro has the status of a global reserve currency. Assessment. Reserves held by the euro area are typically low relative to standard metrics, but the currency is free floating.
SPAIN
INTERN
ATION
AL MO
NETARY FU
ND
37
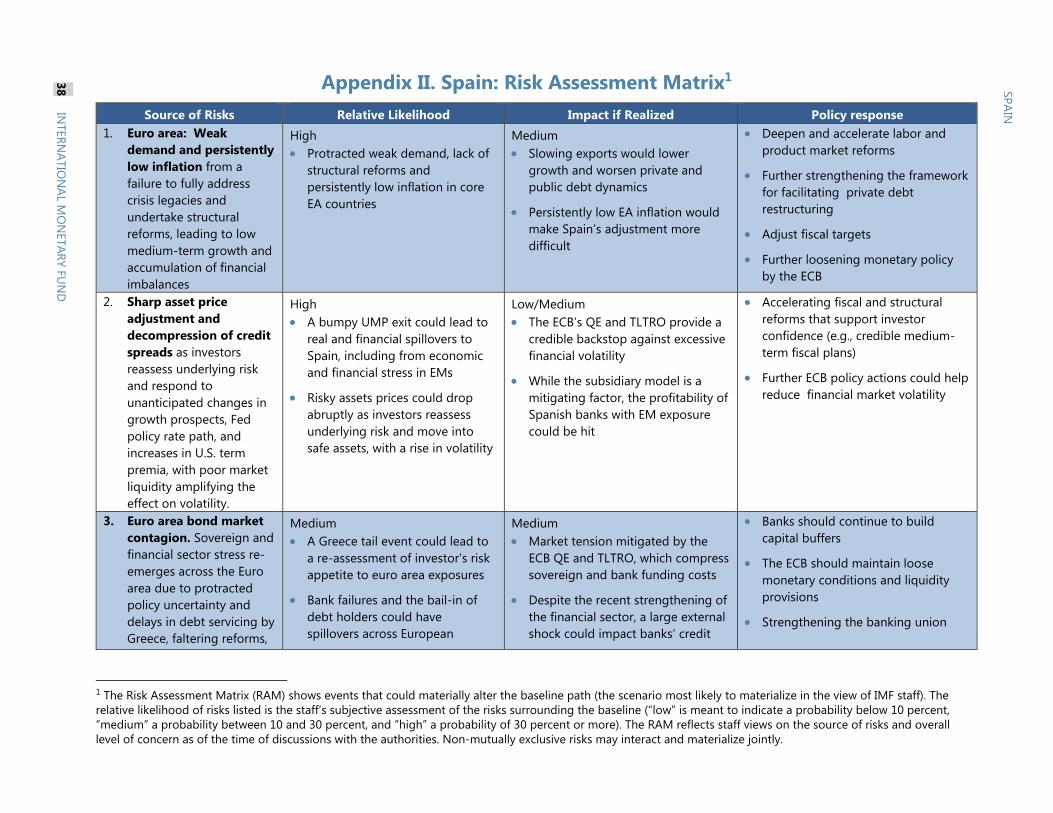
Appendix II. Spain: Risk Assessment Matrix1
1 The Risk Assessment Matrix (RAM) shows events that could materially alter the baseline path (the scenario most likely to materialize in the view of IMF staff). The relative likelihood of risks listed is the staff’s subjective assessment of the risks surrounding the baseline (“low” is meant to indicate a probability below 10 percent, “medium” a probability between 10 and 30 percent, and “high” a probability of 30 percent or more). The RAM reflects staff views on the source of risks and overall level of concern as of the time of discussions with the authorities. Non-mutually exclusive risks may interact and materialize jointly.
Source of Risks Relative Likelihood Impact if Realized Policy response 1. Euro area: Weak
demand and persistently low inflation from a failure to fully address crisis legacies and undertake structural reforms, leading to low medium-term growth and accumulation of financial imbalances
High Protracted weak demand, lack of
structural reforms and persistently low inflation in core EA countries
Medium Slowing exports would lower
growth and worsen private and public debt dynamics
Persistently low EA inflation would make Spain’s adjustment more difficult
Deepen and accelerate labor and product market reforms
Further strengthening the framework for facilitating private debt restructuring
Adjust fiscal targets
Further loosening monetary policy by the ECB
2. Sharp asset price adjustment and decompression of credit spreads as investors reassess underlying risk and respond to unanticipated changes in growth prospects, Fed policy rate path, and increases in U.S. term premia, with poor market liquidity amplifying the effect on volatility.
High A bumpy UMP exit could lead to
real and financial spillovers to Spain, including from economic and financial stress in EMs
Risky assets prices could drop abruptly as investors reassess underlying risk and move into safe assets, with a rise in volatility
Low/Medium The ECB’s QE and TLTRO provide a
credible backstop against excessive financial volatility
While the subsidiary model is a mitigating factor, the profitability of Spanish banks with EM exposure could be hit
Accelerating fiscal and structural reforms that support investor confidence (e.g., credible medium-term fiscal plans)
Further ECB policy actions could help reduce financial market volatility
3. Euro area bond market contagion. Sovereign and financial sector stress re-emerges across the Euro area due to protracted policy uncertainty and delays in debt servicing by Greece, faltering reforms,
Medium A Greece tail event could lead to
a re-assessment of investor’s risk appetite to euro area exposures
Bank failures and the bail-in of debt holders could have spillovers across European
Medium Market tension mitigated by the
ECB QE and TLTRO, which compress sovereign and bank funding costs
Despite the recent strengthening of the financial sector, a large external shock could impact banks’ credit
Banks should continue to build capital buffers
The ECB should maintain loose monetary conditions and liquidity provisions
Strengthening the banking union
SPAIN
38 IN
TERNATIO
NAL M
ON
ETARY FUN
D
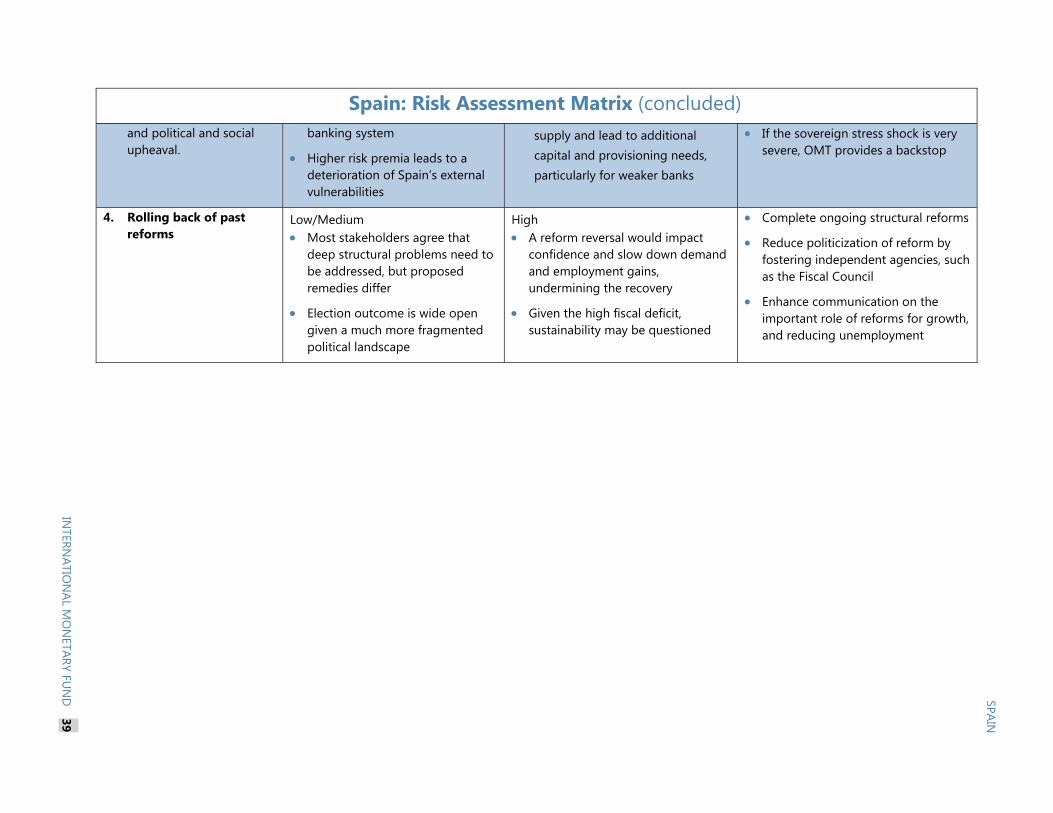
Spain: Risk Assessment Matrix (concluded) and political and social upheaval.
banking system
Higher risk premia leads to a deterioration of Spain’s external vulnerabilities
supply and lead to additional capital and provisioning needs, particularly for weaker banks
If the sovereign stress shock is very severe, OMT provides a backstop
4. Rolling back of past reforms
Low/Medium Most stakeholders agree that
deep structural problems need to be addressed, but proposed remedies differ
Election outcome is wide open given a much more fragmented political landscape
High A reform reversal would impact
confidence and slow down demand and employment gains, undermining the recovery
Given the high fiscal deficit, sustainability may be questioned
Complete ongoing structural reforms
Reduce politicization of reform by fostering independent agencies, such as the Fiscal Council
Enhance communication on the important role of reforms for growth, and reducing unemployment
INTERN
ATION
AL MO
NETARY FU
ND
39
SPAIN
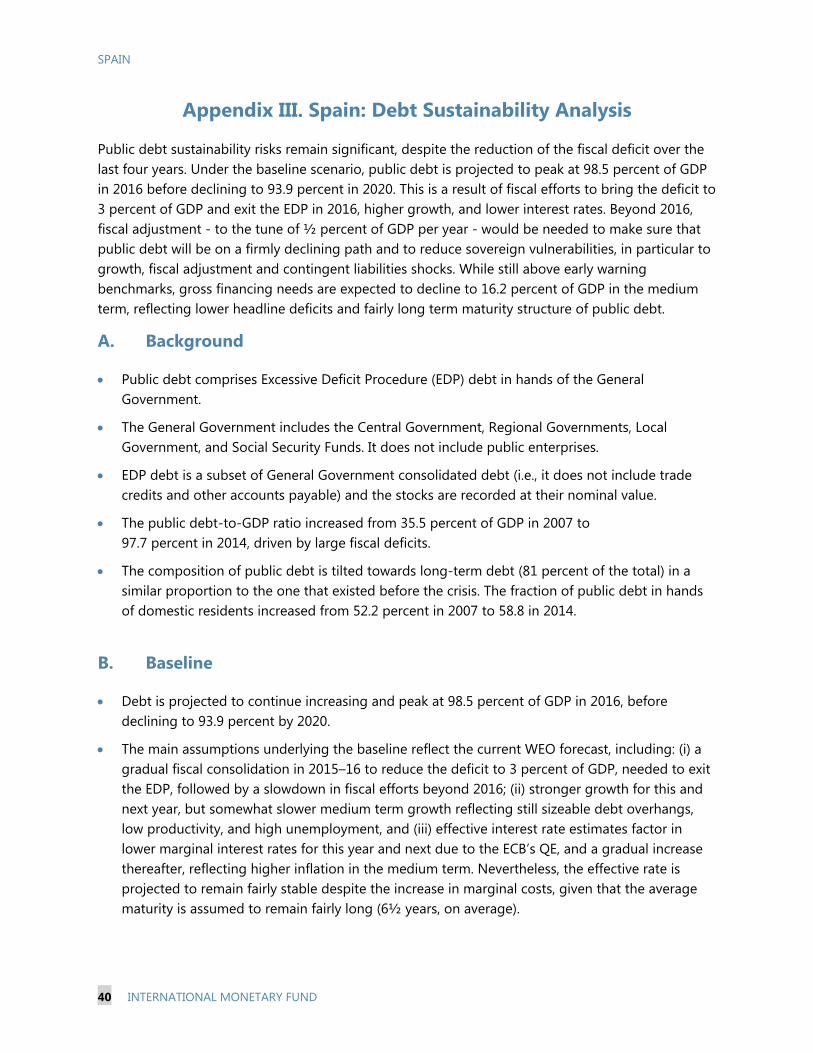
SPAIN
40 INTERNATIONAL MONETARY FUND
Appendix III. Spain: Debt Sustainability Analysis
Public debt sustainability risks remain significant, despite the reduction of the fiscal deficit over the last four years. Under the baseline scenario, public debt is projected to peak at 98.5 percent of GDP in 2016 before declining to 93.9 percent in 2020. This is a result of fiscal efforts to bring the deficit to 3 percent of GDP and exit the EDP in 2016, higher growth, and lower interest rates. Beyond 2016, fiscal adjustment - to the tune of ½ percent of GDP per year - would be needed to make sure that public debt will be on a firmly declining path and to reduce sovereign vulnerabilities, in particular to growth, fiscal adjustment and contingent liabilities shocks. While still above early warning benchmarks, gross financing needs are expected to decline to 16.2 percent of GDP in the medium term, reflecting lower headline deficits and fairly long term maturity structure of public debt.
A. Background
Public debt comprises Excessive Deficit Procedure (EDP) debt in hands of the General Government.
The General Government includes the Central Government, Regional Governments, Local Government, and Social Security Funds. It does not include public enterprises.
EDP debt is a subset of General Government consolidated debt (i.e., it does not include trade credits and other accounts payable) and the stocks are recorded at their nominal value.
The public debt-to-GDP ratio increased from 35.5 percent of GDP in 2007 to 97.7 percent in 2014, driven by large fiscal deficits.
The composition of public debt is tilted towards long-term debt (81 percent of the total) in a similar proportion to the one that existed before the crisis. The fraction of public debt in hands of domestic residents increased from 52.2 percent in 2007 to 58.8 in 2014.
B. Baseline
Debt is projected to continue increasing and peak at 98.5 percent of GDP in 2016, before declining to 93.9 percent by 2020.
The main assumptions underlying the baseline reflect the current WEO forecast, including: (i) a gradual fiscal consolidation in 2015–16 to reduce the deficit to 3 percent of GDP, needed to exit the EDP, followed by a slowdown in fiscal efforts beyond 2016; (ii) stronger growth for this and next year, but somewhat slower medium term growth reflecting still sizeable debt overhangs, low productivity, and high unemployment, and (iii) effective interest rate estimates factor in lower marginal interest rates for this year and next due to the ECB’s QE, and a gradual increase thereafter, reflecting higher inflation in the medium term. Nevertheless, the effective rate is projected to remain fairly stable despite the increase in marginal costs, given that the average maturity is assumed to remain fairly long (6½ years, on average).
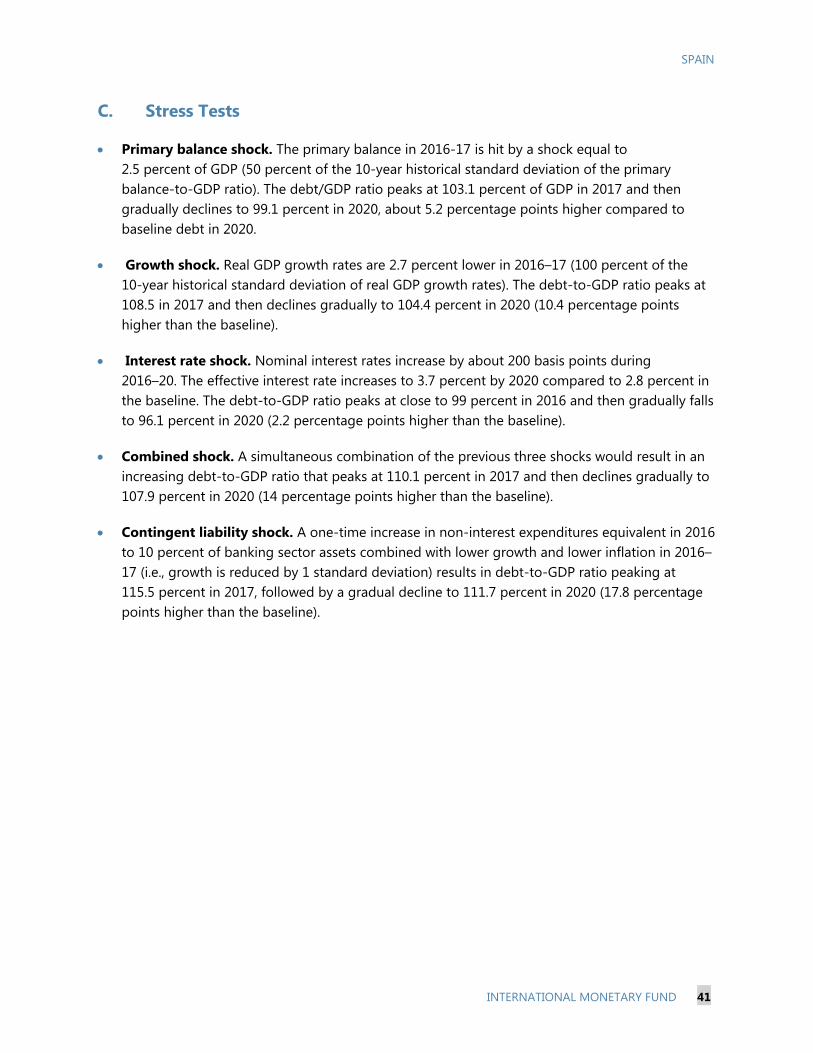
SPAIN
INTERNATIONAL MONETARY FUND 41
C. Stress Tests
Primary balance shock. The primary balance in 2016-17 is hit by a shock equal to 2.5 percent of GDP (50 percent of the 10-year historical standard deviation of the primary balance-to-GDP ratio). The debt/GDP ratio peaks at 103.1 percent of GDP in 2017 and then gradually declines to 99.1 percent in 2020, about 5.2 percentage points higher compared to baseline debt in 2020.
Growth shock. Real GDP growth rates are 2.7 percent lower in 2016–17 (100 percent of the 10-year historical standard deviation of real GDP growth rates). The debt-to-GDP ratio peaks at 108.5 in 2017 and then declines gradually to 104.4 percent in 2020 (10.4 percentage points higher than the baseline).
Interest rate shock. Nominal interest rates increase by about 200 basis points during 2016–20. The effective interest rate increases to 3.7 percent by 2020 compared to 2.8 percent in the baseline. The debt-to-GDP ratio peaks at close to 99 percent in 2016 and then gradually falls to 96.1 percent in 2020 (2.2 percentage points higher than the baseline).
Combined shock. A simultaneous combination of the previous three shocks would result in an increasing debt-to-GDP ratio that peaks at 110.1 percent in 2017 and then declines gradually to 107.9 percent in 2020 (14 percentage points higher than the baseline).
Contingent liability shock. A one-time increase in non-interest expenditures equivalent in 2016 to 10 percent of banking sector assets combined with lower growth and lower inflation in 2016–17 (i.e., growth is reduced by 1 standard deviation) results in debt-to-GDP ratio peaking at 115.5 percent in 2017, followed by a gradual decline to 111.7 percent in 2020 (17.8 percentage points higher than the baseline).
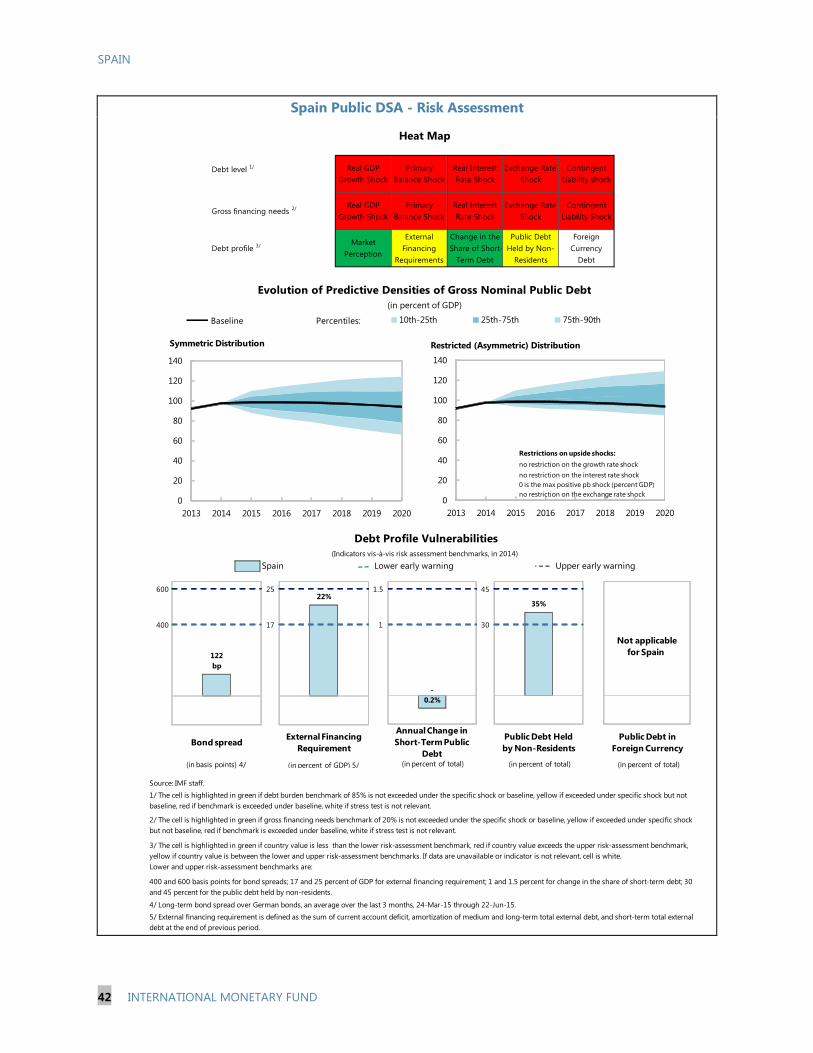
SPAIN
42 INTERNATIONAL MONETARY FUND
Spain
Source: IMF staff.
5/ External financing requirement is defined as the sum of current account deficit, amortization of medium and long-term total external debt, and short-term total external
debt at the end of previous period.
4/ Long-term bond spread over German bonds, an average over the last 3 months, 24-Mar-15 through 22-Jun-15.
2/ The cell is highlighted in green if gross financing needs benchmark of 20% is not exceeded under the specific shock or baseline, yellow if exceeded under specific shock
but not baseline, red if benchmark is exceeded under baseline, white if stress test is not relevant.
400 and 600 basis points for bond spreads; 17 and 25 percent of GDP for external financing requirement; 1 and 1.5 percent for change in the share of short-term debt; 30
and 45 percent for the public debt held by non-residents.
Market
Perception
Debt level 1/ Real GDP
Growth Shock
Primary
Balance Shock
3/ The cell is highlighted in green if country value is less than the lower risk-assessment benchmark, red if country value exceeds the upper risk-assessment benchmark,
yellow if country value is between the lower and upper risk-assessment benchmarks. If data are unavailable or indicator is not relevant, cell is white.
Lower and upper risk-assessment benchmarks are:
Change in the
Share of Short-
Term Debt
Foreign
Currency
Debt
Public Debt
Held by Non-
Residents
Primary
Balance Shock
Real Interest
Rate Shock
Exchange Rate
Shock
Contingent
Liability Shock
Exchange Rate
Shock
Contingent
Liability shock
Spain Public DSA Risk Assessment
1/ The cell is highlighted in green if debt burden benchmark of 85% is not exceeded under the specific shock or baseline, yellow if exceeded under specific shock but not
baseline, red if benchmark is exceeded under baseline, white if stress test is not relevant.
Real Interest
Rate Shock
External
Financing
Requirements
Real GDP
Growth Shock
Heat Map
Upper early warning
Evolution of Predictive Densities of Gross Nominal Public Debt
(in percent of GDP)
Debt profile 3/
Lower early warning
(Indicators vis-à-vis risk assessment benchmarks, in 2014)
Debt Profile Vulnerabilities
Gross financing needs 2/
1 2
Not applicable
for Spain
400
600
122
bp
1 2
17
2522%
1 2
1
1.5
-
0.2%1 2
Bond spreadExternal Financing
Requirement
Annual Change in
Short-Term Public
Debt
Public Debt in
Foreign Currency
(in basis points) 4/ (in percent of GDP) 5/ (in percent of total) (in percent of total)
0
20
40
60
80
100
120
140
2013 2014 2015 2016 2017 2018 2019 2020
10th-25th 25th-75th 75th-90thPercentiles:Baseline
Symmetric Distribution
0
20
40
60
80
100
120
140
2013 2014 2015 2016 2017 2018 2019 2020
Restricted (Asymmetric) Distribution
no restriction on the growth rate shock
no restriction on the interest rate shock
0 is the max positive pb shock (percent GDP)
no restriction on the exchange rate shock
Restrictions on upside shocks:
30
45
35%
1 2
Public Debt Held
by Non-Residents
(in percent of total)
Spain Public DSA - Risk Assessment
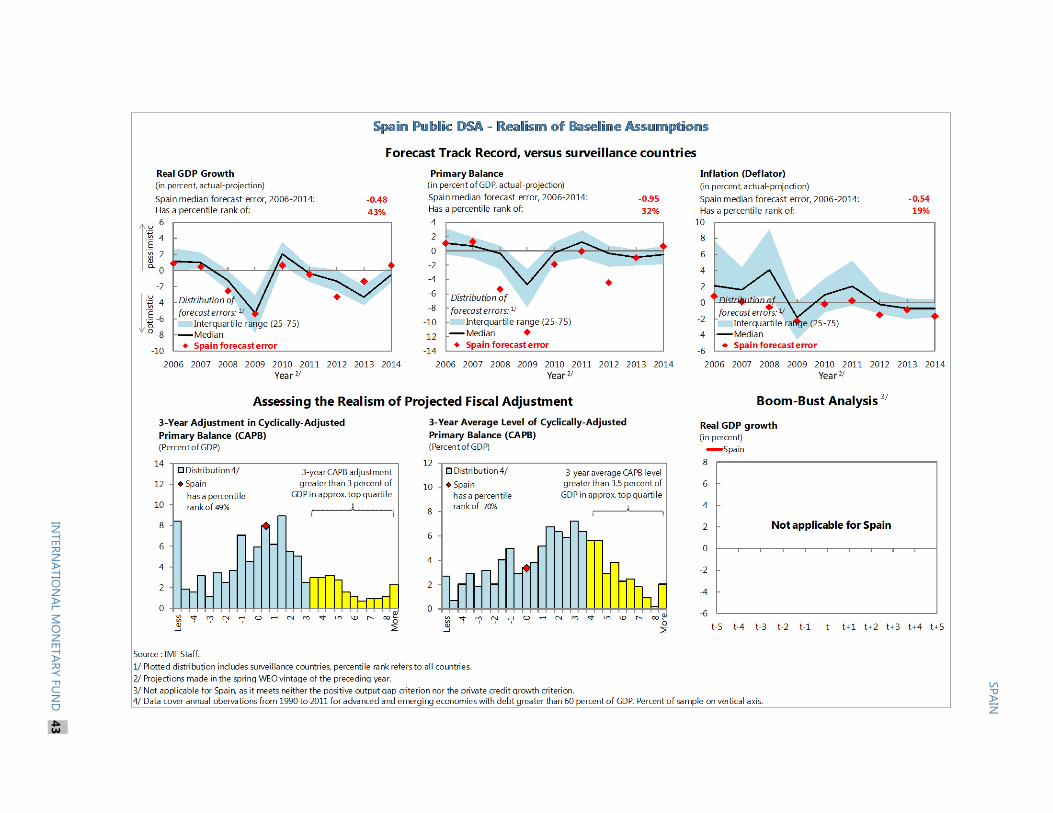
SP
AIN
IN
TER
NA
TIO
NA
L MO
NETA
RY F
UN
D 4
3
IN
TER
NA
TIO
NA
L MO
NETA
RY F
UN
D
43
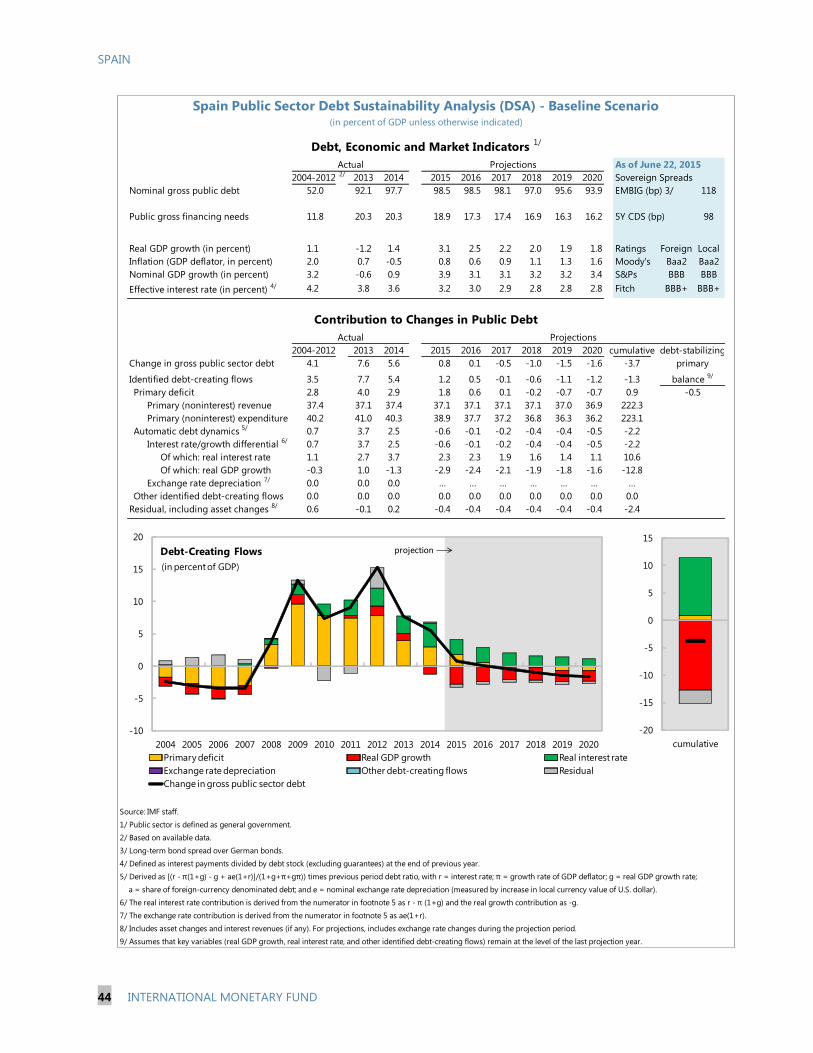
SPAIN
44 INTERNATIONAL MONETARY FUND
As of June 22, 20152/
2013 2014 2015 2016 2017 2018 2019 2020 Sovereign Spreads
Nominal gross public debt 52.0 92.1 97.7 98.5 98.5 98.1 97.0 95.6 93.9 EMBIG (bp) 3/ 118
Public gross financing needs 11.8 20.3 20.3 18.9 17.3 17.4 16.9 16.3 16.2 5Y CDS (bp) 98
Real GDP growth (in percent) 1.1 -1.2 1.4 3.1 2.5 2.2 2.0 1.9 1.8 Ratings Foreign Local
Inflation (GDP deflator, in percent) 2.0 0.7 -0.5 0.8 0.6 0.9 1.1 1.3 1.6 Moody's Baa2 Baa2
Nominal GDP growth (in percent) 3.2 -0.6 0.9 3.9 3.1 3.1 3.2 3.2 3.4 S&Ps BBB BBB
Effective interest rate (in percent) 4/ 4.2 3.8 3.6 3.2 3.0 2.9 2.8 2.8 2.8 Fitch BBB+ BBB+
2013 2014 2015 2016 2017 2018 2019 2020 cumulative
Change in gross public sector debt 4.1 7.6 5.6 0.8 0.1 -0.5 -1.0 -1.5 -1.6 -3.7
Identified debt-creating flows 3.5 7.7 5.4 1.2 0.5 -0.1 -0.6 -1.1 -1.2 -1.3
Primary deficit 2.8 4.0 2.9 1.8 0.6 0.1 -0.2 -0.7 -0.7 0.9
Primary (noninterest) revenue 37.4 37.1 37.4 37.1 37.1 37.1 37.1 37.0 36.9 222.3
Primary (noninterest) expenditure 40.2 41.0 40.3 38.9 37.7 37.2 36.8 36.3 36.2 223.1
Automatic debt dynamics 5/
0.7 3.7 2.5 -0.6 -0.1 -0.2 -0.4 -0.4 -0.5 -2.2
Interest rate/growth differential 6/
0.7 3.7 2.5 -0.6 -0.1 -0.2 -0.4 -0.4 -0.5 -2.2
Of which: real interest rate 1.1 2.7 3.7 2.3 2.3 1.9 1.6 1.4 1.1 10.6
Of which: real GDP growth -0.3 1.0 -1.3 -2.9 -2.4 -2.1 -1.9 -1.8 -1.6 -12.8
Exchange rate depreciation 7/
0.0 0.0 0.0 … … … … … … …
Other identified debt-creating flows 0.0 0.0 0.0 0.0 0.0 0.0 0.0 0.0 0.0 0.0
Residual, including asset changes 8/
0.6 -0.1 0.2 -0.4 -0.4 -0.4 -0.4 -0.4 -0.4 -2.4
Source: IMF staff.
1/ Public sector is defined as general government.
2/ Based on available data.
3/ Long-term bond spread over German bonds.
4/ Defined as interest payments divided by debt stock (excluding guarantees) at the end of previous year.
5/ Derived as [(r - π(1+g) - g + ae(1+r)]/(1+g+π+gπ)) times previous period debt ratio, with r = interest rate; π = growth rate of GDP deflator; g = real GDP growth rate;
a = share of foreign-currency denominated debt; and e = nominal exchange rate depreciation (measured by increase in local currency value of U.S. dollar).
6/ The real interest rate contribution is derived from the numerator in footnote 5 as r - π (1+g) and the real growth contribution as -g.
7/ The exchange rate contribution is derived from the numerator in footnote 5 as ae(1+r).
8/ Includes asset changes and interest revenues (if any). For projections, includes exchange rate changes during the projection period.
9/ Assumes that key variables (real GDP growth, real interest rate, and other identified debt-creating flows) remain at the level of the last projection year.
Spain Public Sector Debt Sustainability Analysis (DSA) - Baseline Scenario
-0.5
balance 9/
primary
(in percent of GDP unless otherwise indicated)
Debt, Economic and Market Indicators 1/
2004-2012
Actual
Projections
Contribution to Changes in Public Debt
Projections
2004-2012
Actual
debt-stabilizing
-10
-5
0
5
10
15
20
2004 2005 2006 2007 2008 2009 2010 2011 2012 2013 2014 2015 2016 2017 2018 2019 2020
Debt-Creating Flows
Primary deficit Real GDP growth Real interest rate
Exchange rate depreciation Other debt-creating flows Residual
Change in gross public sector debt
projection
(in percent of GDP)
-20
-15
-10
-5
0
5
10
15
cumulative
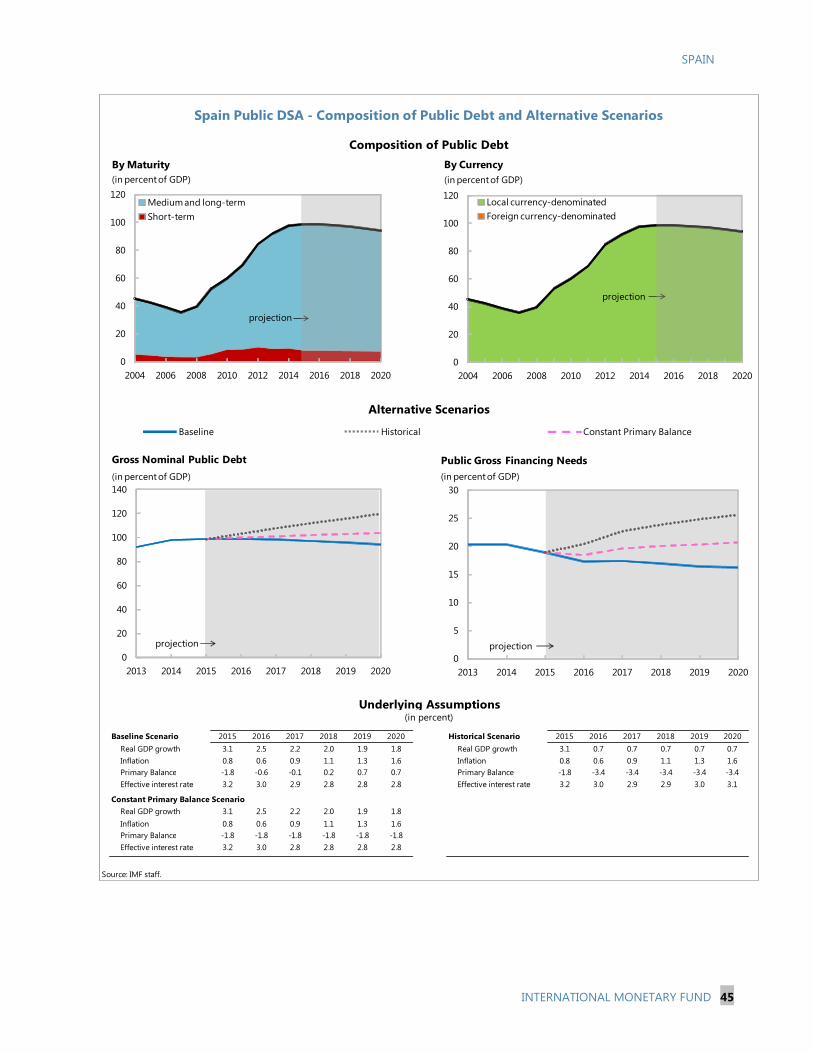
SPAIN
INTERNATIONAL MONETARY FUND 45
INTERNATIONAL MONETARY FUND 45
Baseline Scenario 2015 2016 2017 2018 2019 2020 Historical Scenario 2015 2016 2017 2018 2019 2020
Real GDP growth 3.1 2.5 2.2 2.0 1.9 1.8 Real GDP growth 3.1 0.7 0.7 0.7 0.7 0.7
Inflation 0.8 0.6 0.9 1.1 1.3 1.6 Inflation 0.8 0.6 0.9 1.1 1.3 1.6
Primary Balance -1.8 -0.6 -0.1 0.2 0.7 0.7 Primary Balance -1.8 -3.4 -3.4 -3.4 -3.4 -3.4
Effective interest rate 3.2 3.0 2.9 2.8 2.8 2.8 Effective interest rate 3.2 3.0 2.9 2.9 3.0 3.1
Constant Primary Balance Scenario
Real GDP growth 3.1 2.5 2.2 2.0 1.9 1.8
Inflation 0.8 0.6 0.9 1.1 1.3 1.6
Primary Balance -1.8 -1.8 -1.8 -1.8 -1.8 -1.8
Effective interest rate 3.2 3.0 2.8 2.8 2.8 2.8
Source: IMF staff.
Underlying Assumptions(in percent)
Spain Public DSA - Composition of Public Debt and Alternative Scenarios
Alternative Scenarios
Composition of Public Debt
Baseline Historical Constant Primary Balance
0
20
40
60
80
100
120
140
2013 2014 2015 2016 2017 2018 2019 2020
Gross Nominal Public Debt
(in percent of GDP)
projection
0
5
10
15
20
25
30
2013 2014 2015 2016 2017 2018 2019 2020
Public Gross Financing Needs
(in percent of GDP)
projection
0
20
40
60
80
100
120
2004 2006 2008 2010 2012 2014 2016 2018 2020
By Maturity
Medium and long-term
Short-term
projection
(in percent of GDP)
0
20
40
60
80
100
120
2004 2006 2008 2010 2012 2014 2016 2018 2020
By Currency
Local currency-denominated
Foreign currency-denominated
projection
(in percent of GDP)

SPAIN
46 INTERNATIONAL MONETARY FUND
Primary Balance Shock 2015 2016 2017 2018 2019 2020 Real GDP Growth Shock 2015 2016 2017 2018 2019 2020
Real GDP growth 3.1 2.5 2.2 2.0 1.9 1.8 Real GDP growth 3.1 -0.1 -0.4 2.0 1.9 1.8
Inflation 0.8 0.6 0.9 1.1 1.3 1.6 Inflation 0.8 -0.1 0.2 1.1 1.3 1.6
Primary balance -1.8 -3.1 -2.6 0.2 0.7 0.7 Primary balance -1.8 -1.8 -2.6 0.2 0.7 0.7
Effective interest rate 3.2 3.0 2.9 2.9 2.9 2.9 Effective interest rate 3.2 3.0 2.9 2.9 2.9 2.9
Real Interest Rate Shock Real Exchange Rate Shock
Real GDP growth 3.1 2.5 2.2 2.0 1.9 1.8 Real GDP growth 3.1 2.5 2.2 2.0 1.9 1.8
Inflation 0.8 0.6 0.9 1.1 1.3 1.6 Inflation 0.8 0.9 0.9 1.1 1.3 1.6
Primary balance -1.8 -0.6 -0.1 0.2 0.7 0.7 Primary balance -1.8 -0.6 -0.1 0.2 0.7 0.7
Effective interest rate 3.2 3.0 3.2 3.3 3.5 3.7 Effective interest rate 3.2 3.0 2.9 2.8 2.8 2.8
Combined Shock Contingent Liability Shock
Real GDP growth 3.1 -0.1 -0.4 2.0 1.9 1.8 Real GDP growth 3.1 -0.1 -0.4 2.0 1.9 1.8
Inflation 0.8 -0.1 0.2 1.1 1.3 1.6 Inflation 0.8 -0.1 0.2 1.1 1.3 1.6
Primary balance -1.8 -3.1 -2.6 0.2 0.7 0.7 Primary balance -1.8 -10.6 -0.1 0.2 0.7 0.7
Effective interest rate 3.2 3.0 3.2 3.3 3.5 3.7 Effective interest rate 3.2 3.1 3.2 3.0 3.0 3.0
Source: IMF staff.
(in percent)
Real Exchange Rate Shock
Combined Macro-Fiscal Shock
Additional Stress Tests
Baseline
Underlying Assumptions
Contingent Liability Shock
Spain Public DSA - Stress Tests
Macro-Fiscal Stress Tests
Baseline Primary Balance Shock
Real GDP Growth Shock
Real Interest Rate Shock
85
90
95
100
105
110
2015 2016 2017 2018 2019 2020
Gross Nominal Public Debt(in percent of GDP)
230
240
250
260
270
280
290
300
2015 2016 2017 2018 2019 2020
Gross Nominal Public Debt
(in percent of Revenue)
0
5
10
15
20
25
2015 2016 2017 2018 2019 2020
Public Gross Financing Needs
(in percent of GDP)
0
20
40
60
80
100
120
140
2015 2016 2017 2018 2019 2020
Gross Nominal Public Debt(in percent of GDP)
200
220
240
260
280
300
320
2015 2016 2017 2018 2019 2020
Gross Nominal Public Debt
(in percent of Revenue)
0
5
10
15
20
25
30
2015 2016 2017 2018 2019 2020
Public Gross Financing Needs
(in percent of GDP)
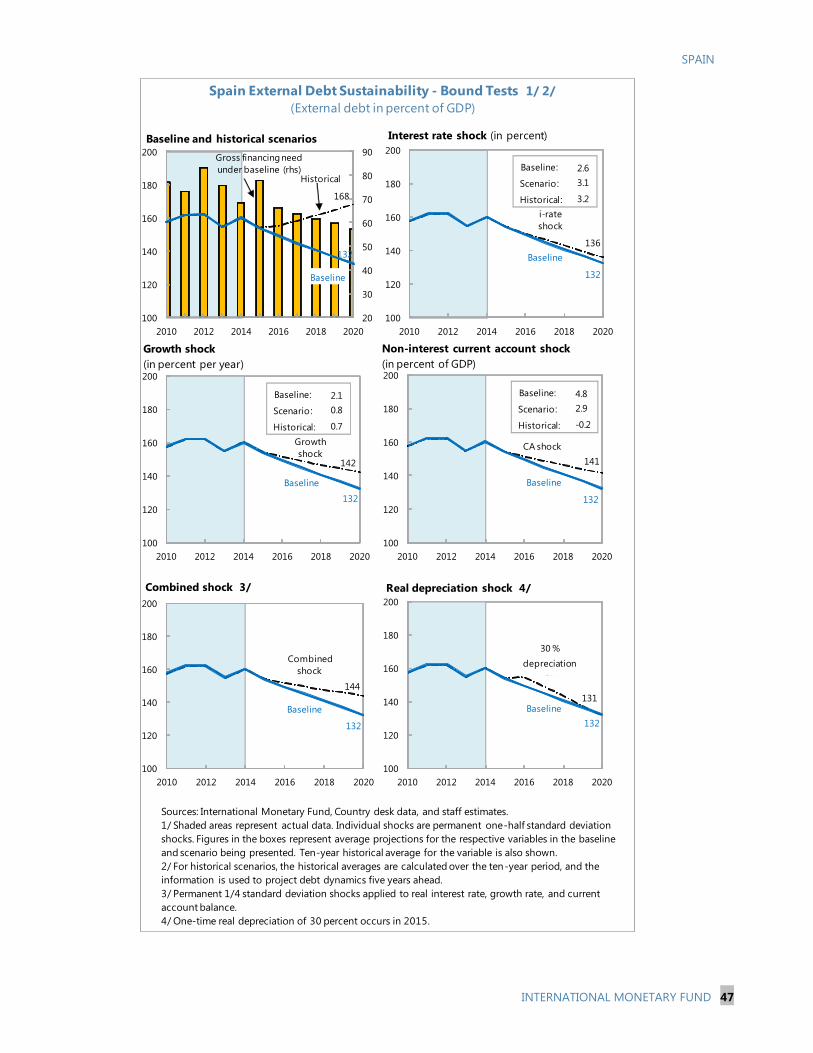
SPAIN
INTERNATIONAL MONETARY FUND 47
INTERNATIONAL MONETARY FUND 47
Growth
shock 142
Baseline
132
100
120
140
160
180
200
2010 2012 2014 2016 2018 2020
i-rate
shock
136
Baseline
132
100
120
140
160
180
200
2010 2012 2014 2016 2018 2020
Interest rate shock (in percent)
Spain External Debt Sustainability - Bound Tests 1/ 2/
(External debt in percent of GDP)
Sources: International Monetary Fund, Country desk data, and staff estimates.
1/ Shaded areas represent actual data. Individual shocks are permanent one-half standard deviation
shocks. Figures in the boxes represent average projections for the respective variables in the baseline
and scenario being presented. Ten-year historical average for the variable is also shown.
2/ For historical scenarios, the historical averages are calculated over the ten-year period, and the
information is used to project debt dynamics five years ahead.
3/ Permanent 1/4 standard deviation shocks applied to real interest rate, growth rate, and current
account balance.
4/ One-time real depreciation of 30 percent occurs in 2015.
Historical
168
Baseline
132
20
30
40
50
60
70
80
90
100
120
140
160
180
200
2010 2012 2014 2016 2018 2020
Baseline and historical scenarios
Gross financing need
under baseline (rhs)
CA shock
141
Baseline
132
100
120
140
160
180
200
2010 2012 2014 2016 2018 2020
Combined
shock
144
Baseline
132
100
120
140
160
180
200
2010 2012 2014 2016 2018 2020
Combined shock 3/
Combined
shock
30 %
depreciati
on
132
Baseline131
100
120
140
160
180
200
2010 2012 2014 2016 2018 2020
Real depreciation shock 4/
depreciation
Non-interest current account shock
(in percent of GDP)
Baseline:
Scenario:
Historical:
2.6
3.1
3.2
Baseline:
Scenario:
Historical:
2.1
0.8
0.7
Baseline:
Scenario:
Historical:
4.8
2.9
-0.2
Growth shock
(in percent per year)
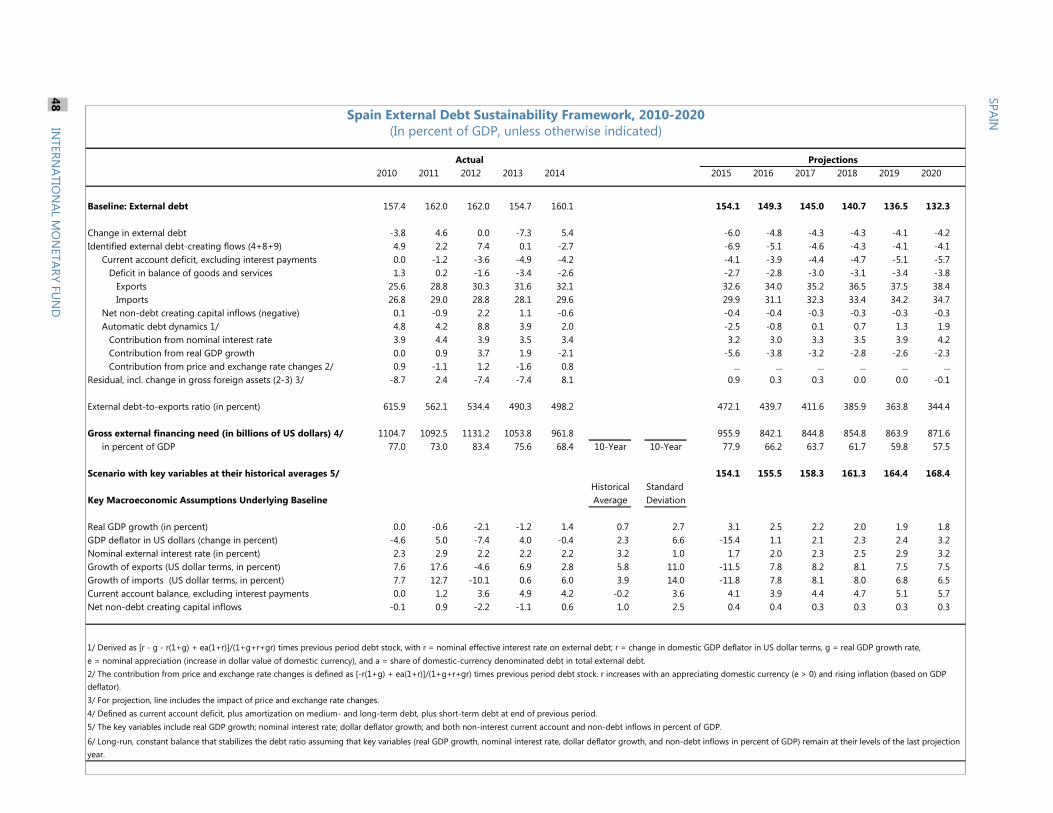
SP
AIN
48
IN
TER
NA
TIO
NA
L MO
NETA
RY F
UN
D
Projections
2010 2011 2012 2013 2014 2015 2016 2017 2018 2019 2020
Baseline: External debt 157.4 162.0 162.0 154.7 160.1 154.1 149.3 145.0 140.7 136.5 132.3
Change in external debt -3.8 4.6 0.0 -7.3 5.4 -6.0 -4.8 -4.3 -4.3 -4.1 -4.2
Identified external debt-creating flows (4+8+9) 4.9 2.2 7.4 0.1 -2.7 -6.9 -5.1 -4.6 -4.3 -4.1 -4.1
Current account deficit, excluding interest payments 0.0 -1.2 -3.6 -4.9 -4.2 -4.1 -3.9 -4.4 -4.7 -5.1 -5.7
Deficit in balance of goods and services 1.3 0.2 -1.6 -3.4 -2.6 -2.7 -2.8 -3.0 -3.1 -3.4 -3.8
Exports 25.6 28.8 30.3 31.6 32.1 32.6 34.0 35.2 36.5 37.5 38.4
Imports 26.8 29.0 28.8 28.1 29.6 29.9 31.1 32.3 33.4 34.2 34.7
Net non-debt creating capital inflows (negative) 0.1 -0.9 2.2 1.1 -0.6 -0.4 -0.4 -0.3 -0.3 -0.3 -0.3
Automatic debt dynamics 1/ 4.8 4.2 8.8 3.9 2.0 -2.5 -0.8 0.1 0.7 1.3 1.9
Contribution from nominal interest rate 3.9 4.4 3.9 3.5 3.4 3.2 3.0 3.3 3.5 3.9 4.2
Contribution from real GDP growth 0.0 0.9 3.7 1.9 -2.1 -5.6 -3.8 -3.2 -2.8 -2.6 -2.3
Contribution from price and exchange rate changes 2/ 0.9 -1.1 1.2 -1.6 0.8 ... ... ... ... ... ...
Residual, incl. change in gross foreign assets (2-3) 3/ -8.7 2.4 -7.4 -7.4 8.1 0.9 0.3 0.3 0.0 0.0 -0.1
External debt-to-exports ratio (in percent) 615.9 562.1 534.4 490.3 498.2 472.1 439.7 411.6 385.9 363.8 344.4
Gross external financing need (in billions of US dollars) 4/ 1104.7 1092.5 1131.2 1053.8 961.8 955.9 842.1 844.8 854.8 863.9 871.6
in percent of GDP 77.0 73.0 83.4 75.6 68.4 10-Year 10-Year 77.9 66.2 63.7 61.7 59.8 57.5
Scenario with key variables at their historical averages 5/ 154.1 155.5 158.3 161.3 164.4 168.4
Historical Standard
Key Macroeconomic Assumptions Underlying Baseline Average Deviation
Real GDP growth (in percent) 0.0 -0.6 -2.1 -1.2 1.4 0.7 2.7 3.1 2.5 2.2 2.0 1.9 1.8
GDP deflator in US dollars (change in percent) -4.6 5.0 -7.4 4.0 -0.4 2.3 6.6 -15.4 1.1 2.1 2.3 2.4 3.2
Nominal external interest rate (in percent) 2.3 2.9 2.2 2.2 2.2 3.2 1.0 1.7 2.0 2.3 2.5 2.9 3.2
Growth of exports (US dollar terms, in percent) 7.6 17.6 -4.6 6.9 2.8 5.8 11.0 -11.5 7.8 8.2 8.1 7.5 7.5
Growth of imports (US dollar terms, in percent) 7.7 12.7 -10.1 0.6 6.0 3.9 14.0 -11.8 7.8 8.1 8.0 6.8 6.5
Current account balance, excluding interest payments 0.0 1.2 3.6 4.9 4.2 -0.2 3.6 4.1 3.9 4.4 4.7 5.1 5.7
Net non-debt creating capital inflows -0.1 0.9 -2.2 -1.1 0.6 1.0 2.5 0.4 0.4 0.3 0.3 0.3 0.3
e = nominal appreciation (increase in dollar value of domestic currency), and a = share of domestic-currency denominated debt in total external debt.
3/ For projection, line includes the impact of price and exchange rate changes.
4/ Defined as current account deficit, plus amortization on medium- and long-term debt, plus short-term debt at end of previous period.
5/ The key variables include real GDP growth; nominal interest rate; dollar deflator growth; and both non-interest current account and non-debt inflows in percent of GDP.
2/ The contribution from price and exchange rate changes is defined as [-r(1+g) + ea(1+r)]/(1+g+r+gr) times previous period debt stock. r increases with an appreciating domestic currency (e > 0) and rising inflation (based on GDP
deflator).
6/ Long-run, constant balance that stabilizes the debt ratio assuming that key variables (real GDP growth, nominal interest rate, dollar deflator growth, and non-debt inflows in percent of GDP) remain at their levels of the last projection
year.
Actual
Spain External Debt Sustainability Framework, 2010-2020
(In percent of GDP, unless otherwise indicated)
1/ Derived as [r - g - r(1+g) + ea(1+r)]/(1+g+r+gr) times previous period debt stock, with r = nominal effective interest rate on external debt; r = change in domestic GDP deflator in US dollar terms, g = real GDP growth rate,
SPAIN STAFF REPORT FOR THE 2015 ARTICLE IV CONSULTATION—INFORMATIONAL ANNEX
Prepared By
European Department (In Consultation with Other Departments)
FUND RELATIONS _________________________________________________________________________ 2 STATISTICAL ISSUES _______________________________________________________________________ 4
CONTENTS
July 10, 2015

SPAIN
2 INTERNATIONAL MONETARY FUND
FUND RELATIONS(As of June 30, 2015)
Membership Status: Joined September 15, 1958.
General Resources Account: SDR Million Percent of Quota Quota 4,023.40 100.00 Fund holdings of currency 3,457.18 85.93 Reserve position in Fund 566.22 14.07 Lending to the Fund New Arrangements to Borrow 640.10
SDR Department: SDR Million Percent of Allocation
Net cumulative allocation 2,827.56 100.00 Holdings 2,729.36 96.53
Outstanding Purchases and Loans: None
Latest Financial Arrangements: None
Projected Payments to Fund
(SDR Million; based on existing use of resources and present holdings of SDRs): Forthcoming
2015 2016 2017 2018 2019 Principal Charges/Interest 0.03 0.10 0.10 0.10 0.10
Total 0.03 0.10 0.10 0.10 0.10
2015 Article IV Consultation: A staff team comprising H. Berger (Head), Nina Budina, Sebastián Sosa (all EUR), M. Saiyid (MCM), H. Hesse (SPR), V. Lledo (FAD), M. Dao (RES), and C. DeLong (LEG) visited Madrid on May 26–June 8, 2015, to conduct the 2015 Article IV Consultation discussions. The mission was supported by an expert (M. Balz). A. Adriano (COM) joined for the concluding meetings. Mr. Jimenez Latorre, Mr. Lopez, and Ms. Sanchez Rodriguez from the Executive Director’s office attended the discussions. V. Boranova, O. Ftomova, C. Borisova, and A. Myaing supported the mission from Headquarters. The mission met Economy and Competitiveness Minister De Guindos, Finance and Public Administration Minister Montoro, Bank of Spain Governor Linde, and other senior officials. The mission also met with representatives of the financial sector, industry, academia, think tanks, parliament, political parties, and trade union representatives. The concluding statement was published and the staff report is expected to be published as well. Spain is on a standard 12-month cycle. The last Article IV consultation discussions were concluded on June 20, 2014 (EBM/14/64). A Financial Sector Assessment Program (FSAP) Update was conducted in two missions
SPAIN
INTERNATIONAL MONETARY FUND 3
(February 1–21 and April 12–25, 2012). On June 8, 2012, the FSAP discussions were concluded and the documents published.
Exchange Rate Arrangements and Restrictions: Spain’s currency is the euro, which floats freely and independently against other currencies. Spain has accepted the obligations of Article VIII, Sections 2, 3, and 4, and maintains an exchange rate system free of restrictions on payments and transfers for current international transactions, other than restrictions notified to the Fund under Decision No. 144 (52/51).

SPAIN
4 INTERNATIONAL MONETARY FUND
STATISTICAL ISSUES(As of July 10, 2015)
I. Assessment of Data Adequacy for Surveillance General: Data provision is adequate for surveillance.
II. Data Standards and Quality Subscriber to the Fund’s Special Data Dissemination Standard (SDDS) since September 1996. In 2015, Spain subscribed to SDDS Plus, together with the first group of adherents.
No data ROSC available.
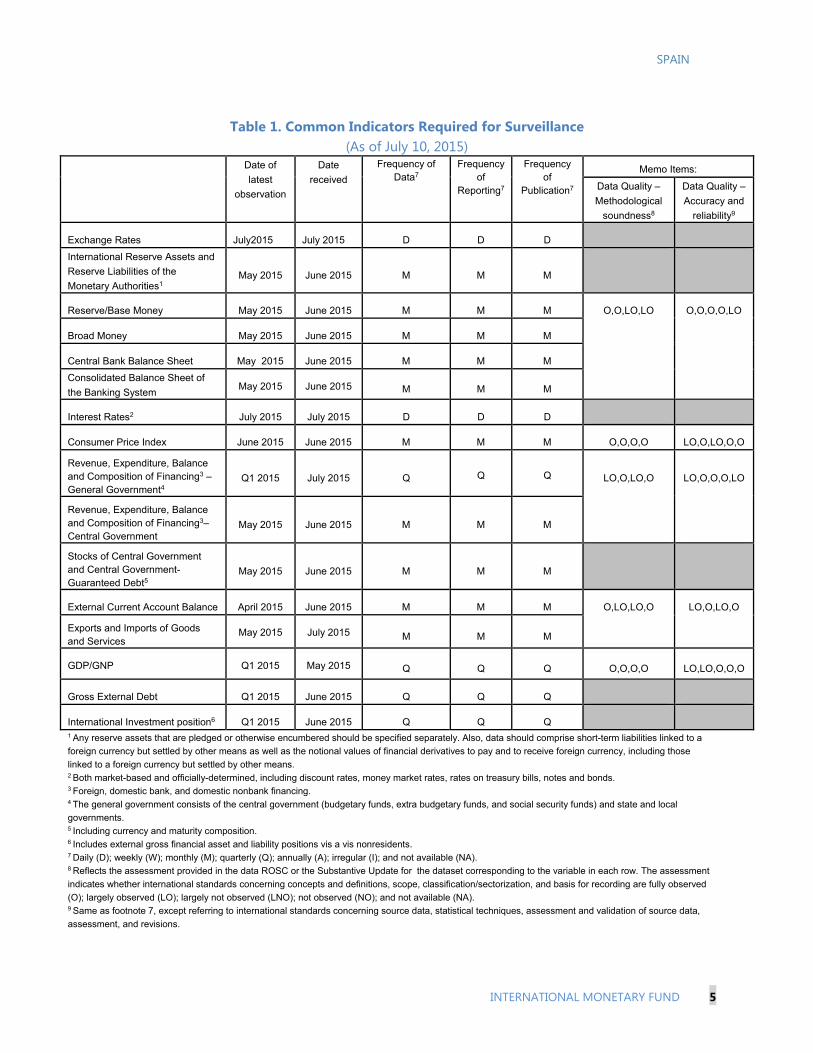
SPAIN
INTERNATIONAL MONETARY FUND 5
Table 1. Common Indicators Required for Surveillance
(As of July 10, 2015) Date of
latest
observation
Date
received
Frequency of Data7
Frequency of
Reporting7
Frequency of
Publication7
Memo Items:
Data Quality –
Methodological
soundness8
Data Quality –
Accuracy and
reliability9
Exchange Rates July2015 July 2015 D D D
International Reserve Assets and
Reserve Liabilities of the
Monetary Authorities1 May 2015 June 2015 M M M
Reserve/Base Money May 2015 June 2015 M M M O,O,LO,LO O,O,O,O,LO
Broad Money May 2015 June 2015 M M M
Central Bank Balance Sheet May 2015 June 2015 M M M
Consolidated Balance Sheet of
the Banking System May 2015 June 2015 M M M
Interest Rates2 July 2015 July 2015 D D D
Consumer Price Index June 2015 June 2015 M M M O,O,O,O LO,O,LO,O,O
Revenue, Expenditure, Balance and Composition of Financing3 – General Government4
Q1 2015 July 2015 Q Q Q LO,O,LO,O LO,O,O,O,LO
Revenue, Expenditure, Balance and Composition of Financing3– Central Government
May 2015 June 2015 M M M
Stocks of Central Government and Central Government-Guaranteed Debt5
May 2015 June 2015 M M M
External Current Account Balance April 2015 June 2015 M M M O,LO,LO,O LO,O,LO,O
Exports and Imports of Goods and Services
May 2015 July 2015 M M M
GDP/GNP Q1 2015 May 2015 Q Q Q O,O,O,O LO,LO,O,O,O
Gross External Debt Q1 2015 June 2015 Q Q Q
International Investment position6 Q1 2015 June 2015 Q Q Q 1 Any reserve assets that are pledged or otherwise encumbered should be specified separately. Also, data should comprise short-term liabilities linked to a
foreign currency but settled by other means as well as the notional values of financial derivatives to pay and to receive foreign currency, including those
linked to a foreign currency but settled by other means. 2 Both market-based and officially-determined, including discount rates, money market rates, rates on treasury bills, notes and bonds. 3 Foreign, domestic bank, and domestic nonbank financing. 4 The general government consists of the central government (budgetary funds, extra budgetary funds, and social security funds) and state and local
governments. 5 Including currency and maturity composition. 6 Includes external gross financial asset and liability positions vis a vis nonresidents.
7 Daily (D); weekly (W); monthly (M); quarterly (Q); annually (A); irregular (I); and not available (NA). 8 Reflects the assessment provided in the data ROSC or the Substantive Update for the dataset corresponding to the variable in each row. The assessment
indicates whether international standards concerning concepts and definitions, scope, classification/sectorization, and basis for recording are fully observed
(O); largely observed (LO); largely not observed (LNO); not observed (NO); and not available (NA). 9 Same as footnote 7, except referring to international standards concerning source data, statistical techniques, assessment and validation of source data,
assessment, and revisions.

Statement by the Staff Representative on the Spain Executive Board Meeting
July 27, 2015
This statement updates information in the staff report without altering the thrust of the staff appraisal.
The situation in Greece has been evolving rapidly. Since the issuance of the staff report, the Greek parliament passed a package of reforms as the basis for starting negotiations on a new ESM program. National parliaments in several euro area countries have endorsed these reforms. Market developments in the euro area have been broadly positive. Spanish sovereign bond yields and spreads relative to the German Bund have declined, while equity prices, especially bank stocks, have risen.
Nonetheless, further episodes of significant uncertainty and volatility arising from the situation in Greece cannot be ruled out. As noted in the staff report, these risks can be mitigated by timely and effective policy measures at the euro area level. In Spain, a clear commitment to continue structural reforms and to put the level of sovereign debt on a firmly declining path would help anchor confidence.
Statement by Mr. Jimenez Latorre, Executive Director for Spain, Ms. Sanchez Rodriguez, Advisor to the Executive Director, and Mr. Lopez, Alternate
Executive Director for Spain July 27, 2015
After an unprecedented deep and long lasting recession, Spain is now reaping the benefits of a very ambitious policy agenda. Spain is currently among the fastest growing advanced economies, with leading employment creation in the Euro area. These very welcome developments are underpinned by a strong commitment to reforms and fiscal consolidation, which need to be sustained so as to address the still significant challenges ahead. We thank staff for the candid dialogue held during the mission and for its hard work, including the seven high quality and well balanced selected issues papers. We agree with staff’s assessment that “reforms make a difference” and that their reversal would have a negative economic impact. We also agree with their many constructive and useful economic policy recommendations, which are in line with the authorities’ goals. Correction of macroeconomic imbalances and the improving picture of the Spanish Economy The Spanish economy is in a much better position now than three years ago. Confidence has been restored, and this includes foreign and domestic investors, consumers and entrepreneurs alike. This improvement stems from the correction of macroeconomic flow imbalances, which has played a major role in the change of perception towards the Spanish economy:
- Spain has regained the competitiveness lost after joining the euro vis-à-vis main trading partners through a sizable internal devaluation process. Unit labor costs have come down substantially, and other relative competitiveness indicators, such as CPIs or REERs, are also showing important gains. Alongside with demand compression, there has been a major structural reallocation of production towards the external market: the export sector is thriving, with exports now accounting for 32 percent of GDP vs. 23 percent of GDP in 2009.
- The sheer size of the adjustment in the current account surplus, over 11 points in 5 years,
is unprecedented by historical standards for an advanced large non-commodity exporting economy, as staff rightly acknowledged in last year’s Art. IV consultation. Spain has been running a current account surplus since 2013; and, more importantly, this surplus is expected to be maintained over the coming years despite a fast growing domestic demand environment, which signals the structural nature of the adjustment. This is no lesser feat: 2015 will be the third consecutive year with current account surplus, which is unprecedented by historical standards.
- The deleveraging process is ongoing, with significant progress both in the corporate and household sectors. Private debt has fallen by 38.2 percentage points from its peak, and household debt as a share of net assets stands at 69.9 percent of GDP, a level last seen in 2006, suggesting that consumption growth could be sustained well into the future. The analysis of household debt in terms of net assets is very relevant in the case of Spain, where there is a deep culture of home ownership; the use of this metric should be promoted within the Fund, as has been the case in other European countries’ Art. IV consultations, and for the 2015 WEO.
Economic performance is finally reflecting these corrections: output is growing at an annualized rate of around 4 percent and Spain is profiting from an employment-rich recovery. No analyst or economic institution envisaged this improvement two years ago. As a matter of fact, in 2013 the IMF forecasted 0 percent growth for 2014 and 0.3 percent for 2015, as well as negative potential output, depicting Spain as the example of a stagnant economy saddled by the legacies of the crisis. A recovery underpinned by a strong policy agenda An appropriate fiscal consolidation strategy and an ambitious structural reform program have underpinned the turnaround of the Spanish economy. Fiscal consolidation From its peak, the fiscal deficit is expected to be reduced by 6.6 percentage points of GDP in nominal terms in 2015, against the backdrop of a severe recession, with a sizable structural effort. The authorities remain firmly committed to delivering on fiscal targets, bringing down the fiscal deficit below 3 percent in 2016 and reaching the medium-term objective (MTO) of a balanced budgetary position in structural terms by 2019. Structural reforms have also been implemented on the fiscal side: the fiscal framework has been strengthened under the Budget Stability Law and a new independent fiscal institution is now operational. Commercial arrears to public sector suppliers have been cleared and efforts have been made to streamline and increase the efficiency of the public sector, with structural reform has also had a positive impact on the fiscal consolidation process, putting the Spanish pension system on a sustainable footing for the future. On the revenue side, progress has been made to rebalance direct and indirect taxation so as to promote an employment rich recovery. Structural reforms The Spanish authorities have forcefully implemented a comprehensive policy agenda to recover competitiveness and increase the flexibility of the Spanish economy. The 2012 labor market reform has helped firms navigate difficult economic times while at the same time preventing

labor shedding in the scale seen before the reform. Now that the economy is growing, the reform has spurred faster job creation and good employment prospects. Other important reforms include the Market Unity Law, curbing red tape and market fragmentation; an overhaul of insolvency regulations to facilitate deleveraging and encourage ‘fresh start’ while at the same time preserving payment culture; and a broad range of other measures to improve SMEs’ financing, corporate governance and competition. Financial sector and credit Over the last few years Spain has completed deep and comprehensive reforms in the financial sector that have included strengthened provisioning requirements and transparency, asset quality reviews, stress tests, recapitalization and transfer of impaired real estate assets to an asset management company. These reforms have also encompassed an overhaul of corporate governance, the savings banks regime, investor protection rules and prudential requirements (such as a narrower definition of capital and stricter forbearance criteria, to name a few). As a result of all these efforts, the Spanish banking sector has notably strengthened its situation in terms of solvency, profitability, asset quality, provisioning, funding and liquidity, as the staff report acknowledges. Consequently, the Spanish banking system obtained the best result in the asset quality review, and the second best result in the stress test of the Comprehensive Assessment run by the ECB in 2014. The Spanish economy is already reaping the benefits of a sounder financial system in terms of credit flows and, hence, growth and job creation. Specifically, flows of new credit for SMEs and households have been positive for the last year and a half, and the overall figure for credit to non-financial corporations also turned positive at the beginning of 2015. Non-financial private sector deleveraging is well advanced and has become compatible with new credit. The aggregate amount of credit is now contracting less sharply than in previous years, both in terms of lending to households and to non-financial corporations, reflecting both net amortization of old loans and dynamic creation of new ones. This aspect is extremely positive, as deleveraging is ongoing while at the same time banks are capable of extending new credit, which is being allocated to more productive and financially solvent borrowers, therefore increasing the quality of banks’ assets. Stock vs. flow adjustment Despite the significant correction achieved in terms of flows, the Spanish authorities see no room for complacency, in so far as the adjustment of stocks needs to continue. It should be noted that correction of stock imbalances, particularly coming from high levels, takes time.
Staff’s report rightly focuses on the importance of correcting stock imbalances, but gives less attention to the remarkable and historically exceptional ongoing correction of flows that is taking place in the Spanish economy. As an example, we would have welcomed a mention to employment creation numbers, a major achievement of the Spanish economy that stems from the 2012 labor market reform: according to data from the first quarter of 2015 around 500,000 new jobs were created over last year (on seasonally adjusted terms), reducing unemployment by more than 2 percentage points. In the same vein, a reference is made to the high level of structural unemployment and the low level of potential growth. Two years ago the estimate for structural unemployment, at 20 percent, was almost 4 percentage points higher and, at the same time, potential growth was deemed to be close to nil, around 1 percentage point both lower than current estimates. Flow adjustments matter, and they are a precondition for stock adjustments. Lack of attention to the extraordinarily significant flow adjustments can lead to bias in risk assessment. Staff concludes that Greek contagion risks on the Spanish economy “remain significant” and could lead to “renewed sovereign and financial sector stress.” A closer look at the resilience of flow developments (strong growth, employment creation, external surplus, fiscal prudence) would suggest otherwise. We would have also welcomed a stronger mention to the reinforcing of euro institutions, such as the ESM, the banking union or the ECB’s initiatives. Staff’s pessimistic assessment is also at odds with the assessments contained in the Art. IV report for the Eurozone as well as in recent Art. IV reports for other Eurozone countries. External sector The performance of the external sector has been very positive since the beginning of the crisis. After many years of demand compression and high unemployment, domestic demand started to recover last year without a significant deterioration of the current account, which is still in surplus. Moreover, this recovery of domestic demand has happened in a context of continued credit contraction and deleveraging, which shows that the recovery is not a return to a credit-fuelled absorption boom. Favorable developments of energy prices and the euro have also contributed to a more positive evolution of the current account. NIIP has worsened substantially since 2000, mainly driven by sustained current account deficits during the boom years—which have now been corrected—and, as staff rightly acknowledges, by substantial valuation effects that are expected to subside. However, there are mitigating factors to the assessment of the net debtor position, correctly considered in the external sector SIP—although not mentioned in the body of the report. The NIIP has a large FDI component (20 percent of GDP), and significant large gross equity liabilities and assets (60 percent of GDP). Debt is in domestic currency in net terms and its maturity is predominantly long term; as for assets, they are diversified. Both authorities and staff expect the NIIP to improve substantially over the coming years.
The prospects for the Spanish economy The Spanish economy has corrected its flow imbalances and stock imbalances have improved significantly. These corrections attest to the effectiveness of an economic policy agenda based on fiscal discipline and supply side reforms. However, there is no room for complacency. Spain still faces significant challenges ahead. The sizable imbalances accumulated prior to the deep and long lasting recession, together with those created by the economic crisis, cannot be corrected in a couple of years; the Spanish authorities are convinced that fiscal consolidation and reform momentum should continue going forward.