IMF Country Report No. 13/339 PAPUA NEW GUINEA · IMF Country Report No. 13/339 PAPUA NEW GUINEA...
68
©2013 International Monetary Fund IMF Country Report No. 13/339 PAPUA NEW GUINEA STAFF REPORT FOR THE 2013 ARTICLE IV CONSULTATION Under Article IV of the IMF’s Articles of Agreement, the IMF holds bilateral discussions with members, usually every year. In the context of the 2013 Article IV consultation with Papua New Guinea, the following documents have been released and are included in this package: The Staff Report for the 2013 Article IV consultation, prepared by a staff team of the IMF for the Executive Board’s consideration on November 11, 2013, following discussions that ended on September 3, 2013, with the officials of Papua New Guinea on economic developments and policies. Based on information available at the time of these discussions, the staff report was completed on October 24, 2013. An Informational Annex prepared by the IMF. A Press Release summarizing the views of the Executive Board as expressed during its November 11, 2013 consideration of the staff report that concluded the Article IV consultation with Papua New Guinea. A Statement by the Executive Director for Papua New Guinea. The publication policy for staff reports and other documents allows for the deletion of market-sensitive information. Copies of this report are available to the public from International Monetary Fund Publication Services P.O. Box 92780 Washington, D.C. 20090 Telephone: (202) 623-7430 Telefax: (202) 623-7201 E-mail: [email protected] Internet: http://www.imf.org International Monetary Fund Washington, D.C. December 2013
Transcript of IMF Country Report No. 13/339 PAPUA NEW GUINEA · IMF Country Report No. 13/339 PAPUA NEW GUINEA...

©2013 International Monetary Fund
IMF Country Report No. 13/339
PAPUA NEW GUINEA STAFF REPORT FOR THE 2013 ARTICLE IV CONSULTATION Under Article IV of the IMF’s Articles of Agreement, the IMF holds bilateral discussions with members, usually every year. In the context of the 2013 Article IV consultation with Papua New Guinea, the following documents have been released and are included in this package: The Staff Report for the 2013 Article IV consultation, prepared by a staff team of the IMF
for the Executive Board’s consideration on November 11, 2013, following discussions that ended on September 3, 2013, with the officials of Papua New Guinea on economic developments and policies. Based on information available at the time of these discussions, the staff report was completed on October 24, 2013.
An Informational Annex prepared by the IMF.
A Press Release summarizing the views of the Executive Board as expressed during its November 11, 2013 consideration of the staff report that concluded the Article IV consultation with Papua New Guinea.
A Statement by the Executive Director for Papua New Guinea.
The publication policy for staff reports and other documents allows for the deletion of market-sensitive information.
Copies of this report are available to the public from
International Monetary Fund Publication Services
P.O. Box 92780 Washington, D.C. 20090 Telephone: (202) 623-7430 Telefax: (202) 623-7201
E-mail: [email protected] Internet: http://www.imf.org
International Monetary Fund Washington, D.C.
December 2013

PAPUA NEW GUINEA
STAFF REPORT FOR THE 2013 ARTICLE IV CONSULTATION
KEY ISSUES
Context. After a decade of strong growth, Papua New Guinea (PNG) now faces a sharp
slowdown in the nonmineral sector as construction winds down on a large liquefied
natural gas (LNG) project. LNG revenue increases are expected to be modest and one-
off over the near to medium term, posing challenges to meet the country’s huge
development needs while trying to maintain debt sustainability. PNG needs to create
an enabling environment for sustained, inclusive growth in the post-boom era.
Outlook and risks. Overall growth prospects remain generally positive, but the
slowdown of the nonmineral sector has increased headwinds for job-creating growth.
Inflation is expected to stabilize at lower levels than in the recent past. Risks to
economic growth in 2013-15 are broadly balanced, but they are increasingly tilted
toward the downside over the longer term, reflecting uncertainty over mineral prices
and investment and global shale gas development.
Policy assessment. Policy discussions focused on resource revenue management,
macroeconomic and financial stability, and structural reforms to engender sustained,
inclusive growth. Key recommendations include:
Target a moderate fiscal deficit in 2014 in line with absorptive capacity and focus
on improvement in spending quality. Over the medium term, constrain and smooth
spending to stay below the government’s debt ceiling of 30 percent of GDP.
Strengthen the interest rate channel of monetary policy transmission by reducing
excess liquidity. Closely monitor financial sector risks arising from possible price
corrections in certain segments of the property market.
Improve transparency in the management of resource revenue; safeguard
resources for the sovereign wealth fund; continue to reform public enterprises;
improve the business environment; and strengthen the agricultural sector.
Take early action to address long-standing issues on economic statistics and anti-
money laundering and combating the financing of terrorism.
October 24, 2013
PAPUA NEW GUINEA
2 INTERNATIONAL MONETARY FUND
Approved By David Cowen (APD)
and Ranil Salgado
(SPR)
Discussions took place in Port Moresby during August 20−September 3,
2013. The team comprised Mr. Yang (Head and resident representative),
Mses. Hunter, Rauqeuqe, Messrs. Oh, Wu (all APD), Bulman (World
Bank), and Batten (ADB). Ms. Luu (OED) participated in the discussions.
CONTENTS
BACKGROUND AND OUTLOOK _________________________________________________________________ 3
PRESERVING FISCAL SPACE AND IMPROVING SPENDING EFFICIENCY ______________________ 6
ENSURING PRICE AND FINANCIAL STABILITY ________________________________________________ 11
MAINTAINING THE STRONG EXTERNAL POSITION __________________________________________ 13
ENABLING SUSTAINED, INCLUSIVE GROWTH ________________________________________________ 15
IMPROVING ECONOMIC STATISTICS AND STRENGTHENING ANTI-MONEY
LAUNDERING EFFORTS ____________________________________________________________________ 19
STAFF APPRAISAL ______________________________________________________________________________ 19
BOXES
1. Trends in Living Standards in Papua New Guinea ______________________________________________ 5
2. Medium-Term Fiscal Strategies and 2014 Budget Strategy _____________________________________ 8
3. The Sovereign Wealth Fund ___________________________________________________________________ 10
4. Exchange Rate Assessment____________________________________________________________________ 14
5. Public Investment and State-Owned Enterprise Reform _______________________________________ 18
FIGURES
1. Macro Performance ___________________________________________________________________________ 21
2. Fiscal Performance ____________________________________________________________________________ 22
3. The Monetary Stance _________________________________________________________________________ 23
4. The External Position __________________________________________________________________________ 24
5. The Banking Sector ___________________________________________________________________________ 25
6. The Cross-Country Context ___________________________________________________________________ 26
TABLES
1. Selected Economic and Financial Indicators, 2009–14 _________________________________________ 27
2. Summary Operations of the Central Government, 2009–14 ___________________________________ 28
3. Balance of Payments, 2009–14 ________________________________________________________________ 29
4. Summary Accounts of the Depository Corporations, 2009–14 ________________________________ 30
5. Medium-Term Scenario, 2009–18 _____________________________________________________________ 31
6. Indicators of External Vulnerability, 2009–13 __________________________________________________ 32
7. Financial Soundness Indicators of Deposit-taking Institutions, 2009–13 _______________________ 33
8. State of Millennium Development Goals ______________________________________________________ 34
APPENDICES
I. Risk Assessment Matrix ________________________________________________________________________ 35
II. Authorities’ Response to Fund Policy Advice __________________________________________________ 36
III. Debt Sustainability Analysis Update __________________________________________________________ 37
IV. Draft Press Release ___________________________________________________________________________ 47

PAPUA NEW GUINEA
INTERNATIONAL MONETARY FUND 3
BACKGROUND AND OUTLOOK
While the expected commencement of LNG production next year will bring increases in mineral output
and fiscal revenues over the near to medium term, the slowdown of the nonmineral sector as a result
of the ending of project construction makes it more challenging to engender inclusive growth
1. Over the past decade, Papua New Guinea (PNG) has achieved strong economic
growth, supported by high commodity prices, large mineral investment inflows, sound
macroeconomic policies, and a healthy banking
sector. Real GDP growth averaged 6 percent per
year over the period 2003-12 (Table 1; Figure 1).1
With the commencement of the construction of a
large-scale liquefied natural gas (LNG) project in
2010,2 average annual growth has since increased to
nearly 9 percent. However, economic activity is
projected to slow significantly in 2013, as
nonmineral sector growth decelerates sharply with
the growth-intensive construction phase of the LNG
project drawing to a close.
2. Inflation eased sharply in 2012, but has
rebounded steadily since the beginning of 2013. Measured by the official consumer price index
(CPI),3 inflation (annual average) was about 2 percent in 2012, falling from almost 8½ percent in
2011, owing to moderating food prices, lagged pass-through of the kina appreciation in 2011,
expanded tuition fee subsidies, and import tariff reductions. As the effects of these one-off factors
faded out, inflation rose to 2.8 percent in the first quarter of 2013 and 3.2 percent in the second
quarter, and is expected to reach an average of 4 percent for the year as a whole largely due to
pass-through effects from kina depreciation.
3. The current account deficit is expected to narrow sharply in 2013 as imports and
income outflows decline with construction winding down on the LNG project (Tables 3 and 5;
Figure 4). Capital inflows (mostly in the form of foreign direct investment and medium-long term
loans) associated with the project are also expected to decline over the next two years. Large capital
inflows over the past three years and the expected revenue associated with the project have led the
real effective exchange rate (REER) to appreciate by around 30 percent over the past three years.
1 PNG’s national accounts estimates suffer from an outdated base year (1998) and poor source data. In addition, the
current estimation methodology is inadequate in capturing the rapid structural change of the economy. The
authorities plan to introduce a new estimation methodology for the 2014 Article IV consultation.
2 The project, operated by a subsidiary of ExxonMobil, is expected to produce LNG for about 20 years beginning in
the second half of 2014. Total investment amounts to US$19 billion, equivalent to 120 percent of PNG’s 2012 GDP.
3 PNG’s official CPI tends to understate true inflation as a result of an outdated base year and data weaknesses.
-2
0
2
4
6
8
10
12
14
2003 2004 2005 2006 2007 2008 2009 2010 2011 2012
Contribution to GDP Growth(In Percent)
Agriculture Mineral
Construction Other industry
Other sectors Real GDP growth rate
Sources: PNG authorities; and IMF staff calculations.

PAPUA NEW GUINEA
4 INTERNATIONAL MONETARY FUND
The Bank of Papua New Guinea’s (BPNG) foreign reserves were equivalent to 4½ months of imports
at the end of 2012, and are expected to decline to about 4 months of imports by the end of 2013
before an expected large rebound in 2014 when LNG exports commence.
4. Despite the strong growth performance, PNG faces daunting development challenges.
The country still lags far behind most of its peers in the region in key infrastructure services, mainly
transportation, electricity, and water supply. Basic education and health services are undersupplied,
with key health and education indicators well below
Pacific island country averages (Box 1). PNG
considered that the global Millennium Development
Goals (MDGs) would not be achievable and hence
set its own national targets, which correspond to
the first seven global MDGs. Of these national
targets, two are on track and three are off track,
with mixed results for the remaining two (Table 8).
Staff’s Views
5. PNG’s overall growth prospects remain generally positive, but a change in the
composition of growth sources will pose significant challenges for inclusive growth. With the
winding down of LNG project construction, economic activity is expected to slow to about
5½ percent in 2013 (Table 5). It is projected to rise to about 6⅓ percent in 2014 and surge to
21½ percent in 2015 as LNG production peaks, but slow to around 3½ percent over the medium
term as the nonmineral sector converges to its potential growth of around 4½ percent while output
growth in mature mines continues to slow. Headline inflation is likely to rise somewhat in the short
run, but underlying price pressures should be moderate with slowing domestic demand. Over the
medium term, inflation is expected to stabilize at levels slightly above the BPNG’s reference value of
5 percent4—barring any major increases in global food and fuel prices.
6. Risks to economic growth in 2013-15 are broadly balanced, but they are increasingly
tilted toward the downside over the longer term (see the Risk Assessment Matrix in Appendix I).
The continued high level of government spending planned for 2014 will offset part of slowing
domestic demand as LNG project construction-related activities wind down. Risks of delays in the
completion of the LNG project have diminished significantly as it enters the final stage of
construction. However, a weak global economy could further dampen external demand and
commodity prices. Over the longer term, shale gas development around the world could reduce
LNG prices, exerting pressure on government revenue, export earnings, and the kina. Lower LNG
and mineral prices, together with uncertainty surrounding the ending of quantitative easing in
advanced economies, may also reduce future inflows of foreign direct investment.
4 The inflation reference value is not a formal inflation target, as the BPNG does not have an inflation-targeting
regime.
Logistics Performance Index Rankings (of 184 countries)
Country Overall Rank Infrastructure
Papua New Guinea 155 155
Solomon Islands 152 166
Fiji 148 150
Indonesia 67 101
Vietnam 62 84
Phillippines 60 70
Malaysia 33 32
Source: World Bank, 2012.

PAPUA NEW GUINEA
INTERNATIONAL MONETARY FUND 5
Box 1. Trends in Living Standards in Papua New Guinea
The recently released 2009-10 PNG Household Income Expenditure Survey (HIES) data indicate that 40 percent
of Papua New Guineans consumed less than a minimum basket of food and other goods and services in 2010.
This basket, which includes both items households purchase and those they produce themselves, is the sum of
the costs of attaining a minimum number of daily calories (2200 per day for each adult-equivalent) based on
prevailing local diets and food prices, plus an allowance for the purchase of essential nonfood items.
Other measures of welfare corroborate this analysis. For example, more than 40 percent of children under
five years of age suffer from moderate to severe chronic undernutrition. Life expectancy at birth is 63 years,
considerably below the Pacific islands1 average of 70 years; the infant mortality rate is 48 per thousand
compared to a regional average of 26.5;2 and the maternal mortality ratio is very high at 230 per 100,000 live
births. PNG’s composite Human Development Index (HDI) was 0.462 in 2011, placing it 153 out of 187 countries
and among the least developed. Food poverty rates—the share of households consuming less than the value
of 2200 calories of moderate nutritional quality—are estimated at nearly one-quarter of the population
nationally.
The share of the population in poverty varies considerably across regions. Poverty is significantly more
prevalent in rural areas of PNG. Poverty rates range from 24 percent in the Southern region (outside of the
National Capital District—NCD) and 27 percent in urban Momase to 46 percent in rural Momase and 45
percent in the New Guinea Islands. Reflecting their greater populations, the Highlands and rural Momase
account for more than two-thirds of all the poor. Only 8.5 percent of PNG’s poor population lives in urban
areas, and these households appear to be only just below the poverty line, unlike rural Momase in particular
where poor households report very low consumption levels.
Average living standards changed little between 1996 and 2010 for most Papua New Guineans. Material
poverty rates were not statistically significantly different between the two survey years, either nationally or in
any region apart from the NCD, where it rose from 31 percent of the population in 1996 to 42 percent in 2010.
Other indicators also generally corroborate this finding. For example, child malnutrition rates were also little
different between 1996 and 2010. In contrast, the HDI improved modestly, from 0.405 in 1995 to 0.458 in 2010.
Comparing the 2010 and 1996 snapshots of living standards is likely to mask significant changes over
this fifteen-year period. Macroeconomic conditions deteriorated significantly between the early 1990s and
the early 2000s, before PNG entered a decade of strong growth, and these trends are likely to have brought
worsening living standards and rising poverty rates until the low-point around 2002, and improvements in
subsequent years. Using GDP growth and inflation data, the World Bank simulated the poverty rate to have
risen from near 40 percent in 1996 to at least 50 percent in the early 2000s, before returning to 40 percent at
the time of the 2010 survey. Consistent with this pattern, formal sector employment declined by 2.8 percent
between 1996 and 2002 before rising by 46 percent between 2002 and 2010 (and a further 14 percent between
2010 and 2012), while nominal kina cash crop export receipts rose by 88 percent between 1996 and 2002 but
by 173 percent between 2002 and 2010.
__________________________
1/ Include Cook Islands, Fiji, Kiribati, Marshall Islands, Federated States of Micronesia, Nauru, Niue, Palau, Papua New
Guinea, Samoa, Solomon Islands, Tonga, Tuvalu, and Vanuatu.
2/ Average of Fiji, Kiribati, Palau, Papua New Guinea, Samoa, and Vanuatu. Source: Compiled by World Bank staff, drawing on an analysis prepared by John Gibson.

PAPUA NEW GUINEA
6 INTERNATIONAL MONETARY FUND
Authorities’ Views
7. The authorities broadly agreed with staff’s assessment of the economic outlook and
inflation. Their growth outlook in 2013 is aligned with staff’s view, revised up from the 4 percent
projected in the 2013 budget to reflect the rebound in the mining and quarrying sector and longer-
than-expected LNG project construction phase. The authorities recognized the risks posed by the
external environment, but noted mitigating factors, including the LNG project’s long-term supply
contracts, which link the LNG sales price to oil prices. The BPNG agreed that inflation is likely to rise
over the course of 2013 and noted that a weakening kina is the main source of inflationary pressure.
PRESERVING FISCAL SPACE AND IMPROVING
SPENDING EFFICIENCY
In light of the weaker revenue prospects and recent spending increases, a moderate fiscal deficit in
2014 and a gradual reduction in real per capita spending over the medium term are needed to stay
below the government’s debt ceilings. Improvement in spending quality should be a key policy focus.
8. Following a fiscal expansion in 2012, the government has further loosened its policy
stance in 2013. The budget slipped into a deficit of 3.3 percent of GDP in 2012 as a result of lower-
than-expected commodity-related tax revenues and election-related spending. To counter the
expected slowdown in nonmineral sector growth and deliver quicker development outcomes, the
government adopted an expansionary fiscal stance for 2013, with a targeted fiscal deficit of
7.3 percent of GDP. Government expenditure is budgeted to increase by nearly 25 percent to target
the so-called “development enablers” as identified in the 2013-17 Medium-Term Development Plan
(Box 2). The 2013 Budget also featured a strong move to devolve spending, with an increasing share
of it carried out at subnational levels (provinces,
districts, and local governments).
9. With the fiscal expansion of the past
two years and lower commodity prices, PNG’s
fiscal space has been reduced significantly.
Gross central government debt, which had fallen
to about 22 percent of GDP in 2011, rebounded
to around 27 percent in 2012 and is expected to
surpass 31 percent in 2013 (Table 2). Taking into
account arrears to superannuation funds5 and
the financing of the government’s LNG equity
stake through a loan from a state-owned
5 These funds are private pension funds managing contributions from employees and employers (including the
government). Seven funds are currently in operation and their total assets at the end of March 2013 were 7.8 billion
kina, accounting for 22 percent of total financial sector assets.
0
10
20
30
40
50
60
70
80
90
2008 2009 2010 2011 2012 2013 2014 2015 2016 2017 2018
Public debt and liabilities(In percent of GDP)
Contingent liabilities 1/
Other non-contingent liabilities 2/
Central government external debt
Central government domestic debt
Sources: PNG authorities; Asian Development Bank; and IMF staff calculations.1/ Government completion guarantee for LNG project.2/ Superannuation arrears and loan for underwriting LNG equity share.

PAPUA NEW GUINEA
INTERNATIONAL MONETARY FUND 7
enterprise (SOE), gross public debt and non-contingent liabilities are expected to amount to about
50 percent of GDP at end 2013. Main contingent liabilities are the LNG project completion
guarantee of 15 percent of GDP (ending effectively by 2015) and public enterprise liabilities of about
7½ of GDP.
Staff’s Views
10. The 2013 fiscal deficit is likely to be about 6.3 percent of GDP, lower than the
budgeted 7.3 percent of GDP, on account of under-spending. There are concerns that capacity
constraints have led to major delays in project implementation and mixed spending quality,
especially at subnational levels. Staff therefore advised that spending should not be rushed toward
the end of the year for the sake of showing a higher budget implementation rate; any unused
resources should be saved for reallocation in the 2014 budget (January/December). Action should
also be taken to rein in provincial spending on personnel emoluments, which are at risk of
exceeding budget allocations.
11. Staff recommended an overall fiscal deficit of 4 percent of GDP for 2014 (including
any expenditure rollover from 2013), with the budget focused on improving the quality of
spending. While there is a need to improve public services and support nonmineral sector growth
to absorb thousands of workers being released from the LNG project, due consideration should be
given to capacity constraints and the need to retain fiscal buffers to deal with external shocks.
Greater attention should also be given to a clear identification of bottlenecks to spending and
service delivery—including in priority areas such as health, education, and roads—and to proper
appraisal, design and planning, and rigorous costing of development projects.
12. Over the medium term, staff agreed that the fiscal framework should aim to keep
public debt below the government’s ceiling of 30 percent of GDP. To achieve this, the
government will need to target a gradual decline in real per capita spending over the medium term
from current elevated levels. Staff noted that the primary fiscal deficit had increased significantly
over the past two years and is expected to reach nearly 5 percent of GDP in 2013 (a similar trend is
observed for the nonmineral primary deficit), which is unsustainable. In this light, staff
-10.0
-8.0
-6.0
-4.0
-2.0
0.0
2.0
4.0
2010 2011 2012 2013
Proj.
2014 2015 2016 2017 2018
Overall fiscal deficit
(In percent of GDP)
2014 Budget Strategy Paper
Baseline
Staff-preferred scenario
Sources: PNG authorities; and IMF staff calculations and projections.
15
20
25
30
35
40
2007 2008 2009 2010 2011 2012 2013
Proj.
2014 2015 2016 2017 2018
Debt-to-GDP ratio
(In percent of GDP)
2014 Budget Strategy Paper
Baseline
Staff-preferred scenario

PAPUA NEW GUINEA
8 INTERNATIONAL MONETARY FUND
recommended a more prudent fiscal path (see the “staff-preferred scenario” in the figures above)
than the scenario proposed in the 2014 Budget Strategy Paper (BSP) to reduce the risk of breaching
the debt ceiling should there be expenditure slippages or adverse shocks, This more conservative
scenario would provide some buffer for the debt ceiling and enhance its credibility. With an
increased focus on spending quality, it would still allow ample space for the government to fund its
development enablers.
13. Greater efforts on revenue collection will be essential to keep the fiscal deficit in check
and stay below the debt ceilings. As nonmineral activity slows over the course of 2013, it will be
challenging to achieve the government’s revenue target this year. Over time, the authorities will
need to improve tax administration, including clearance of tax arrears, and rationalize tax
Box 2. Papua New Guinea: Medium-Term Fiscal Strategies and 2014 Budget Strategy
Over the past decade policymakers have been guided by three successive medium-term fiscal
strategies (MTFS). The 2002–07 MTFS was a stabilization and structural reform program. Its target for
a balanced budget was achieved in 2004, three years ahead of schedule, but progress on structural
reforms was slow. The 2008–12 MTFS added rules to limit the fiscal impact of volatility in resource
revenue. It required that resource revenue above a ‘normal’ level (4 percent of GDP) be used for debt
reduction and pre-financing of development expenditure through trust accounts. Annual spending out
of trust accounts was capped at 4 percent of GDP. Together, these rules imposed an 8 percent of GDP
limit on the nonmineral budget deficit. Broad adherence to both strategies led to a reduction in
government debt from 74 percent of GDP in 2002 to about 27 percent of GDP in 2012.
The 2013-17 MTFS gives greater attention to supporting development priorities identified in the
Medium-Term Development Plan (MTDP). This move reflects the anticipated large inflows of
resource revenue from the LNG project beginning in 2014. The MTFS aims to allocate, by 2017, two-
thirds of total budget resources to the key development “enablers”—health, education, infrastructure
and law and order. The operational rules for the nonmineral budget deficit have been replaced by a
ceiling of government debt set at 30 percent of GDP, apart from in 2013 and 2014, when it will be
capped at 35 percent. The MTFS also sets a target to return the budget to surplus by 2017.
The 2014 Budget Strategy Paper (BSP) aims to support the MTDP development priorities but has
to take into account a much reduced fiscal space. Since the launch of the 2013-17 MTFS, revenue
prospects have become much weaker owing to significant falls in commodity prices and fiscal deficits in
2012 and 2013 have turned out to be much larger than expected. The BSP thus proposes to relax MTFS
budget balance targets by allowing a maximum deficit of 2½ percent of GDP from 2015 onward,
although the debt targets set in the 2013-17 MTFS have been retained.
The BSP plans to rely mainly on domestic debt issuance and on additional borrowing through
foreign currency denominated concessional loans to finance the 2014 deficit. To reduce
refinancing and interest rate risks, the government intends to increase the average debt maturity. The
government also plans to improve taxpayer compliance by simplifying tax administration and
introducing a new computerized system.

PAPUA NEW GUINEA
INTERNATIONAL MONETARY FUND 9
exemptions and concessions, particularly given the expected moderate increases in mineral
revenues from the LNG project over the near-medium term. Staff encouraged the authorities to
expeditiously implement IMF technical assistance (TA) recommendations on extractive industries
fiscal regimes, with a view to increasing government revenue over time. In particular, the authorities
should aim to increase the progressivity of PNG’s resource revenue regime—moving toward less
reliance on dividends from state equity shares and more on rent-based taxes—and remove some of
the tax incentives, such as income tax holidays and the double deduction for exploration.
14. Staff welcomed the government’s initiatives to improve public financial management.
The proposed integration of recurrent and development budgets for 2014 and continued
implementation of multiyear budgeting are a major step forward and should help improve
expenditure mix and prioritization. The establishment of a branch in the Department of Finance to
monitor statutory bodies, including through standardizing financial reporting, is also a positive step.
Continued proliferation of such statutory bodies could undermine budget integrity and reduce the
coherence of national resource allocation. Efforts should be made to improve the
comprehensiveness of reporting in the budget on all resources available to each department and
statutory body—including those resources that are currently “off-budget.” Staff also welcomed the
publication of monthly expenditure warrants this year and encourages timely audit of public
accounts.
15. The integrity of the sovereign wealth fund (SWF) should be safeguarded for it to play
a key role in managing PNG’s resource revenues. PNG’s original SWF design has generally
followed sound principles, in particular with regard to the fund’s full integration with the budget
(Box 3). At present, the SWF is not operational due to the need to amend the original SWF law and
an ongoing process to finalize governance and revenue arrangements. Any significant diversion of
mineral resource revenues from the SWF could undermine the role of the fund in macroeconomic
stabilization and development. Moreover, staff noted that current withdrawal rules could risk leaving
the SWF under-funded and that the government should revisit the rules to ensure that sufficient
resources are accumulated in the SWF.
Authorities’ Views
16. The authorities acknowledged the challenges in effective spending in 2013 and agreed
to focus on improving the quality of spending in the 2014 budget. However, they stressed the
importance of continued increases in expenditure on the development enablers while adhering to
the debt target. To increase revenue, the authorities are considering the IMF TA recommendations
on resource revenue regimes and have set up a committee to review the overall tax regime, with a
view to focusing on compliance and restricting tax exemptions and special arrangements and to
maintain an equitable tax regime. The amendments to the current SWF law are expected to be
approved by Parliament this year, with the SWF to become operational in 2014. The authorities
agreed that the withdrawal rules need to be reexamined.

PAPUA NEW GUINEA
10 INTERNATIONAL MONETARY FUND
Box 3. Papua New Guinea: The Sovereign Wealth Fund
In February 2012, the PNG Parliament approved an organic law to establish a sovereign wealth
fund (SWF). The purpose of the SWF is to smooth government expenditure and decouple it from the
short-term volatility of resource revenues. The SWF model, design, and institutional framework were
guided by international best practice: offshore investment and onshore management, integration with
the fiscal framework and the budget, and accountability and transparency rules based on the Santiago
principles. The law envisaged a consolidated pool of two offshore funds with a single governance
framework: a stabilization fund (SF) and a development fund (DF). The authorities have recently
proposed to rename the DF to the “Future Fund.” Amendments to the organic law are expected to be
tabled in Parliament in November, together with the 2014 budget, paving the way for the operation of
the SWF in 2014.
While the organic law provides broad guidelines for the structure and governance of the SWF, it
also allows some operational flexibility. Under the law, an independent board will exercise oversight
over the operation of the SWF, and a secretariat headed by an Executive Officer will advise the board to
facilitate its investment decisions through external investment managers. The law also stipulates that
contributions to the SF will include all mineral and petroleum revenues, earnings from its investments,
and other government contributions. Withdrawals from the SF will go through the budget process,
capped at the 15-year moving average of mineral and petroleum revenues as a share of non-mining
revenues. Annual contributions to the DF will be no less than a guaranteed minimum allocation based
on the expected average of the LNG project dividends determined by the parliament, earnings from its
investments, and other government contributions. It is envisaged that trust accounts will be folded into
the DF once it is operational. There are no clear rules governing withdrawals from the DF, but funds
must be used to support the country’s development plans in accordance with an act of Parliament.
Several issues need to be addressed before the SWF can operate effectively. Projections based on
current global commodity prices show that revenue inflows to the SF will be limited under the currently
stipulated withdrawal rules, suggesting the need to revisit the maximum amount of allowable
withdrawal. If the rules are modified and/or expected revenue inflows increase, the authorities will need
to establish guidelines on how to support the government’s fiscal targets set in the 2013-17 Medium-
Term Fiscal Strategy (MTFS) as well as to achieve the SWF’s stabilization and development objectives.
The authorities will also need to carefully define the relationship between the SWF and the proposed
Kumul Trust (see Box 5) in order to protect the integrity and revenue sources of the SWF. The
authorities have recently indicated that buffers will be established to protect against depletion of the
SWF. They are also working on the governance/institutional structure of the SWF as well as capacity
building to effectively implement the fund’s investment mandate and strategy. The Fund has recently
provided technical assistance in this area.

PAPUA NEW GUINEA
INTERNATIONAL MONETARY FUND 11
ENSURING PRICE AND FINANCIAL STABILITY
While the current monetary policy stance is appropriate given the inflation outlook, BPNG should
stand ready to tighten its policy stance should inflationary pressure reemerge. Excess liquidity needs to
be reduced, and financial sector risk closely monitored as nonmineral activity slows.
17. The BPNG began easing its monetary policy stance in the second half of 2012, with
declining inflation the main factor. Until then, it had maintained a relatively tight policy stance,
raising the Kina Facility Rate (KFR) to a peak of 7¾ percent in September 2011, hiking the Cash
Reserve Requirement (CRR) to 8 percent from 7 percent in June 2012 and stepping up open market
operations. However, as inflation began to fall, the Bank reduced the KFR to 6¾ percent in
September 2012 and further to 6¼ percent in March 2013. Private sector credit grew strongly over
the second half of 2012 and the first half of 2013 (by about 25 percent (y/y) at June 2013), due
largely to growth in business lending.
18. Concerns persist over the structurally high levels of excess liquidity in the banking
system. Until recently, unsterilized foreign exchange reserves had accumulated at the BPNG, as it
purchased the government’s foreign exchange revenues. This has added liquidity in the system, as
the government put the majority of its kina deposits at commercial banks. Excess liquidity has
dragged money market rates significantly below the KFR, weakening the monetary policy
transmission mechanism. Despite the efforts to mop up liquidity, including through the sales of
foreign exchange reserves, a divergence between market rates and the KFR has persisted. Limited
participation in the formal economy and financial sector also restricts the effectiveness of the
interest rate channel of monetary policy transmission.
19. The financial sector remains sound, underpinned by comfortable capital adequacy
ratios, stable profitability, and deposit-based funding. Banks have maintained capital adequacy
ratios above 25 percent and continue to post handsome profits. They maintain strong liquidity
positions, with more than half of their assets held in government securities or cash. As banks have
not underwritten loans to LNG projects, their direct exposure to the ongoing resource boom has
been limited. However, authorized superannuation funds have significant exposure to the property
market that has been buoyed by the LNG project. Anecdotal evidence suggests that the prices of
high-end properties have declined by about 20 percent over the past few months, albeit from very
high levels.
20. Work on implementing the 2011 financial sector stability assessment (FSSA)
recommendations has continued in several areas, guided by the BPNG’s Strategic Plan 2012-
2015. Important progress is being made on payment system reform, with the BPNG conducting
industry testing of the Kina Automated Transfer System, which will enable real time gross
settlement. In addition, small investor participation in government debt markets has been supported
by the introduction of the Central Bank Bill Tap facility, and the BPNG intends to develop regulations
and standards on mobile phone banking. With regard to financial system supervision, the BPNG is
working to improve its analysis of systemically important institutions and overall financial system

PAPUA NEW GUINEA
12 INTERNATIONAL MONETARY FUND
stability. A new prudential standard for the superannuation sector was issued in 2012, which focused
on corporate governance.
Staff’s Views
21. Given the moderate underlying inflationary pressure, the BPNG should maintain its
current policy stance, but stand ready to tighten policy should price pressures reemerge. The
BPNG should be prepared to tighten policies in the event of fiscal slippages and/or balance of
payments pressures, which could raise inflation and put downward pressure on the kina. In light of
slower domestic demand in the post-boom era, staff advised the BPNG to return to its 5 percent
inflation reference value. This would help anchor inflation expectations and strengthen the central
bank’s policy credibility.
22. Continued efforts will be needed to reduce excessive liquidity to minimize inflation
risks down the road and strengthen monetary policy transmission. Staff recommended that the
Treasury Department move, to the extent possible, its commercial bank deposits and trust accounts
to the BPNG to mute their liquidity impact. If this is not sufficient, the BPNG could conduct further
open market operations by issuing additional Central Bank Bills (CBBs) as well as hike the CRR as
needed. The BPNG should drain market liquidity to the point where the policy rate would begin to
influence money market rates and become an effective signal of the monetary policy stance.
23. The exposure of superannuation funds to heated segments of the real estate sector
warrants close monitoring. The BPNG should continue to monitor the funds’ investment
concentration in LNG project-related industries as well as in the real estate sector, which, after
experiencing a period of tight supply, may face price corrections in certain market segments as
supply catches up with demand. Even though banks have limited exposure to the real estate sector,
their loan portfolios in construction, transportation, and communication should be examined as
these industries have to varying degrees benefited from the LNG project-induced demand and are
unlikely to continue to grow at the same pace as the past few years. The BPNG should explore ways
to introduce macroprudential policies to prevent negative feedback between the macroeconomic
and financial sectors, based on the recent Fund TA recommendations. Stress tests of banks should
be conducted regularly
Authorities’ Views
24. The BPNG is actively considering options to withdraw further liquidity from the
financial system. These include further open market operations, raising the CRR, and working on
transferring trust account funds from commercial banks to the BPNG. The authorities regard
financial sector risk arising from the real estate market to be reasonably contained, as loan-to-value
ratios for residential property lending have been relatively low, and according to stress tests, banks
are expected to remain robust even under extreme stress scenarios. Superannuation funds have
sought to diversify their assets including through foreign investment because of increased attention
to risk in the property sector and the limited domestic market.

PAPUA NEW GUINEA
INTERNATIONAL MONETARY FUND 13
MAINTAINING THE STRONG EXTERNAL POSITION
Despite a strong external position and low risk of external debt distress, a continued prudent approach
to external borrowing is advisable. It is important to monitor developments in private sector external
debt and analyze its potential flow-on effects on the economy from LNG price declines.
Staff’s Views
25. PNG’s external position is sound despite large current account deficits in recent years.
As LNG production comes on stream and imports related to the LNG project subside, the current
account deficit is expected to narrow quickly and turn into a surplus in 2015. The foreign reserves
cover (in months of nonmineral imports) remains adequate to absorb external shocks despite the
recent declines reflecting weaker commodity prices. Standard cross-country CGER assessment of the
kina and other information indicates no evidence of kina misalignment (Box 4). Staff recommended
that the BPNG continue to maintain a floating exchange rate regime to help absorb external shocks.
26. Debt sustainability analysis suggests that PNG continues to face low debt distress risk
for external public debt under its medium-term policy setting. However, this provisional finding
assumes that the government will adhere to its debt target of 30 percent of GDP over the medium
term. Staff encouraged the authorities to continue to take a prudent approach to external
borrowing, focusing on available concessional loans and taking into account conditions that may
increase implicit costs of loans, such as those associated with procurement restrictions. Should the
government decide to float a sovereign bond in the future, it should carefully plan the move in
advance and seek independent advice.
27. The rapid increase in private sector external debt warrants close monitoring. PNG’s
private sector external debt has grown rapidly in recent years, reaching around 120 percent of GDP
at end 2012 based on official data. The majority of the debt is owed by LNG project partners and
subcontractors. However, the sheer volume of the debt highlights the risk that a large decline in
LNG prices could pose to project profitability, the capacity of borrowers to service their debts, and
the impact on export earnings, the kina, and government revenue (through dividend and tax
receipts).
Authorities’ Views
28. The BPNG considers the current exchange rate to be in line with PNG’s economic
situation. Bank officials noted that its intervention in the foreign exchange market over the past
year was motivated by the desire to smooth volatility, as well as to support liquidity management.
However, they expressed concern that a strong kina would adversely affect external competitiveness,
putting pressure on the nonmineral sector. With regard to PNG’s external private debt, while
acknowledging the need for close monitoring, the authorities considered that the debt is largely
liabilities of foreign companies that have little connection with the domestic financial system.
Moreover, debt repayment should begin next year when LNG exports commence.

PAPUA NEW GUINEA
14 INTERNATIONAL MONETARY FUND
Box 4. Papua New Guinea: Exchange Rate Assessment
The kina has experienced large fluctuations over the past few years. The real effective exchange rate
(REER) appreciated by 37 percent over the period from October 2009 to June 2012, driven by strong
commodity prices, particularly those for gold and cooper, two of PNG’s key exports. However, as
commodity prices softened and capital inflows associated with the LNG project passed their peak, the kina
depreciated by 9 percent from April 2012 to August 2013.
CGER methodologies have produced mixed results on where the kina stands relative to its
equilibrium value. The macroeconomic balance (MB) approach indicates that the kina is undervalued by
25 percent, while the external sustainability approach suggests an even higher undervaluation—around
30 percent. However, the purchasing power parity (PPP) approach indicates an overvaluation of around
27 percent, and the equilibrium real exchange rate (ERER) approach shows a kina overvaluation of around
34 percent. These results demonstrate the difficulties in using standard cross-country CGER methodologies
to assess the equilibrium value of a commodity currency such as the kina, particularly with uncertain data
quality.
Overall, there seems to be no evidence of kina misalignment, but this conclusion is subject to
uncertainty. The last Article IV consultation conducted in early 2012 suggested that the kina was
undervalued, but the weaker prospects for commodity prices and recent foreign reserves developments are
less supportive of this observation. Recent business surveys indicate the kina exchange rate is not regarded
as a top impediment to nonmineral exports, suggesting the kina is broadly in line with PNG’s current
productivity levels.
Source: IMF staff estimates and projections.
REER
Norm Underlying 1/ Overvaluation
PPP approach … … 27.1
MB approach 2/ -0.4 8.3 -25.2
ERER approach 3/ … … 34.3
External sustainability approach 2/ 4/ -2.0 7.9 -29.7
1/ Staff projection over 2018 (last year of medium-term WEO projections)
2/ Based on a semi-elasticity of the CA/GDP with respect to the REER of -0.25.
3/ Overvaluation is assessed relative to 2013 Q2.
Exchange Rate Assessment: Baseline Results 1/
CA/GDP
4/ CA norm stabilizing NFA at -30.8 percent of GDP, assuming a nominal GDP growth rate of 7.1
percent.
(In percent)
-75%
-60%
-45%
-30%
-15%
0%
15%
30%
45%
-50%
-40%
-30%
-20%
-10%
0%
10%
20%
30%
20
06
20
07
20
08
20
09
20
10
20
11
20
12
20
13
20
14
20
15
20
16
20
17
20
18
Papua New Guinea: MB Approach
Fixed effect Old age dependencyPopulation growth Income growthOil and gas trade balance Fiscal balanceNorm current account Actual current account (RHS)
20
60
100
140
180
220
260
300
60
80
100
120
140
160
180
200
19
96
19
97
19
98
19
99
20
00
20
01
20
02
20
03
20
04
20
05
20
06
20
07
20
08
20
09
20
10
20
11
20
12
20
13
20
14
20
15
20
16
20
17
20
18
Papua New Guinea: ERER Approach
Actual
Equilibrium
Terms of trade (RHS)
-0.7
-0.6
-0.5
-0.4
-0.3
-0.2
-0.1
0.0
0.1
0.2
0.3
0.4
0.5
0.6
0.7
-0.7
-0.6
-0.5
-0.4
-0.3
-0.2
-0.1
0.0
0.1
0.2
0.3
0.4
0.5
0.6
0.7
19
94
19
95
19
96
19
97
19
98
19
99
20
00
20
01
20
02
20
03
20
04
20
05
20
06
20
07
20
08
20
09
20
10
20
11
20
12
20
13
20
14
20
15
20
16
20
17
20
18
Fixed effect Government consumption
Terms of trade
Upper quantile Equilibrium REER
Lower quantile Actual REER
ERER Approach: Contributions to Equilibrium REER(Log scale)

PAPUA NEW GUINEA
INTERNATIONAL MONETARY FUND15
ENABLING SUSTAINED, INCLUSIVE GROWTH
To counter increasing headwinds for inclusive growth, structural reforms must be accelerated to make
better use of resource revenues and improve the business climate, concentrating on transparency,
public enterprise reform, and the development enablers. Greater attention should be given to the
development of small and medium sized enterprises and agriculture.
29. Past resource booms have not benefited the population as widely as expected, with
much of the resource revenues wasted.
However, expectations are high that the
current resource boom, particularly those
from the LNG project, will represent a break
from the past and lead to substantial
improvement in public services. However,
while the expected commencement of LNG
production will bring a large increase in
measured GDP, the projected increase in
government revenue over the near-medium
term is one-off and quite modest (about 2
billion kina or 5 percent of 2013 GDP)
compared with historical booms because the LNG project is approximately four-fifths owned by
nonresidents and accelerated depreciation is expected to delay tax payments until early next
decade. PNG has great potential to develop its resource sector, but the job creation effect of this
development is likely to be limited.
30. Making the most of available resource revenues will be critical to boosting long-term
growth in the nonmineral sector. Over the past decade, the strong growth of the nonmineral
sector has enabled formal employment to
expand by an average of 5½ percent per
year. With the nonmineral sector returning
to its long-term growth trend without the
boost from major resource projects, the
pace of job creation is likely to slow
significantly, making it even more
challenging to improve the inclusiveness of
future growth and reduce poverty.
Staff’s Views
31. Staff welcomed the authorities’
plans to join the Extractive Industries
Transparency Initiative (EITI) and encouraged completion of required follow-on steps. EITI
membership provides a unique vehicle to demonstrate the government’s determination to improve
0
5
10
15
20
25
30
35
40
45
2000 2002 2004 2006 2008 2010 2012 2014
Proj.
2016 2018
Resource revenue
Resource revenue/total revenue
Resource revenue/GDP
(In percent)
Sources: PNG authorities; and IMF staff calculations and projections.
0
10
20
30
40
50
60
70
50
70
90
110
130
150
170
1995 1997 1999 2001 2003 2005 2007 2009 2011
Poverty rate (Basic needs, RHS)
GDP per capita (LHS)
Employment (LHS)
(In percent)(Index, year 2000 = 100)
Sources: PNG authorities; and World Bank staff calculations.

PAPUA NEW GUINEA
16 INTERNATIONAL MONETARY FUND
revenue transparency and integrity, and supports the larger goals of fighting corruption, which is
perceived to be pervasive and imposing significant drains on scarce public resources. Together with
the SWF and general improvements in public financial management, EITI membership should put
PNG in a stronger position to improve its use of resource revenues for more inclusive and broad-
based growth.
32. Staff supported increased resource allocation to medium-term development enablers.
Addressing law and order problems and other key obstacles to doing business should be a top
priority. A significant improvement in law and order and investments in PNG’s human resources
would help create a vibrant private sector and more job opportunities, driven by the expansion of
small and medium-sized enterprises (SMEs). Reforms to secured lending arrangements, together
with steps to facilitate the development of more customary-held land, should encourage more
investment and help reduce business costs.
33. The development of agriculture will also be critical to inclusive growth as it is the key
source of income for some 80 percent of PNG’s population. Staff welcomed the government’s
plans to tap the country’s agricultural potential, including cash crops, by improving extension
services, market access (both domestic and international), and logistic services such as distribution
and storage.
34. Improvements in access to finance should be integral part of the strategy to support
economic diversification for inclusive growth. PNG’s banking sector is dominated by three banks,
and like other Pacific island countries, there is room to improve competition in the sector. Staff
welcomes the BPNG’ intention to license more banks and commends the authorities for launching
several financial inclusion initiatives, including a microfinance expansion project, a
mobile/branchless banking program, and a financial literacy program. Continued efforts will be
needed to increase the benefits of these initiatives for the rural communities and the SME sector. In
this regard, the establishment of the Centre for Excellence in Financial Inclusion to coordinate
financial inclusion activities is a major step forward. Staff encourages the authorities to examine
ways to reduce the large foreign exchange spreads, including through a review of current trading
practices in the industry with a view to increasing competition.
35. A robust regulatory framework will be critical to creating a vibrant private sector and
improve the welfare of PNG’s citizens. Staff commended the authorities for pushing for greater
competition, which has resulted in lower prices and greater product variety to the benefit of
consumers and economic efficiency. Nevertheless, more remains to be done to increase competition
in many sectors, including telecommunications, power generation, aviation, and petroleum products,
including through opening access to entry. The government should avoid reserving industries for
domestic businesses except where the country’s security interest is at stake. Instead, the focus
should be on addressing the issues that constrain entrepreneurs’ ability to grow, such as law and
order, infrastructure, and skills development. Further streamlining of business registration and
licensing arrangements would also help attract investment. With regard to the newly nationalized

PAPUA NEW GUINEA
INTERNATIONAL MONETARY FUND17
Ok Tedi mine,6 staff encourages the authorities to reaffirm their commitment to respecting property
rights and contracts by adequately compensating the PNG Sustainable Development Program for its
stake in the mine. This would help make entrepreneurs more willing to make long-term investment
that is essential for sustained and inclusive development in PNG.
36. Improvements in the efficiency of public enterprises require proper governance and
strong accountability. Despite significant government support, state-owned enterprises (SOEs)
continue to produce low financial returns and provide poor-quality services to households and firms
(Box 5). Recent proposals to consolidate and reorganize SOEs and public investments in mining and
hydrocarbon companies through the Kumul Trust have the potential to enhance transparency and
improve the management efficiency of state assets. However, the success of this initiative will hinge
on adoption of governance structures at both the trust and company levels that will ensure their
political independence and focus on stated corporate goals.
Authorities’ Views
37. The authorities recognized the need to improve governance in managing resource
revenues and the importance of structural reforms for inclusive growth. PNG is now targeting
to become an EITI candidate by December. To improve the business environment, efforts are being
made under the National Land Development Program to increase access to customary land for
productive purposes and to improve housing and finance access. The authorities plan to strengthen
the national electricity company as a commercially oriented business and to improve electricity
supply and services by linking tariffs to service quality. The government is currently developing
various policies to improve the performance of SOEs, including providing guidance on the dividend
policy and clarifying the community service obligations (CSOs) of SOEs.
6 The Ok Tedi mine is a copper and gold mine located in the Western Province. After the mine caused widespread
environmental damage during 1980s-90s, BHP, then major owner and operating company, divested its shares to a
charitable trust called the PNG Sustainable Development Program (SDP) to help affected communities and in return
was granted legal immunity from liabilities on environmental damages in 2002. However, the PNG parliament passed
legislation in September 2013 authorizing the government to take over SDP’s shares and revoking BHP’s immunity.

PAPUA NEW GUINEA
18 INTERNATIONAL MONETARY FUND
Box 5. Papua New Guinea: Public Investment and State-Owned Enterprise Reform1
Historically, state-owned enterprises (SOEs) have generated poor rates of return for the
government. In 2012, dividend payments were estimated at K 239.1 million, representing an overall
return of 3.2 percent on the estimated assets of K 9.5 billion (or 31 percent of GDP). However, more
than 81 percent of these dividend payments came from the government’s minority shareholdings in
Oil Search, Ok Tedi and the Bank South Pacific. In addition to poor financial returns and soaking up
capital resources, majority-owned SOEs have tended to provide poor-quality services to the people of
PNG. Just 12 percent of households have access to power, and only 15 percent of schools are
connected to the electricity grid.
In mid-2012 the government of PNG proposed a major reorganization of its public investment
holding and management structures. The reform program proposes to consolidate all of the
government’s public investments under the umbrella of a single ‘Kumul’ Trust. Within the Kumul Trust
will be three holding companies: Kumul Mining; Kumul Petroleum; and Kumul Corporations. There are
some positive aspects to this reform approach. The proposed restructuring may bring with it some
enhanced transparency through stronger public disclosure requirements. Consolidation of
hydrocarbon and mining assets into single holding companies may also help to improve the efficiency
and coherence of their management.
However, the restructuring of public investments is unlikely to address the underlying reasons
for the poor SOE performance, which will require a renewed commitment to a number of
uncompleted reforms. These include legislating an obligation for SOEs to operate on a commercial
basis; setting out the government’s dividend expectations for all SOEs; finalizing a community service
obligations (CSO) framework to ensure that SOEs deliver CSOs on a commercial basis; adopting public
private partnership (PPP) legislation to facilitate the private investment in infrastructure and related
services; and an on-lending policy to ensure a level playing field between SOEs and the private sector.
The governance structures will also be critical if the Kumul Trust initiative is to succeed. Current
proposals suggest that the Kumul Trust will be controlled by two shares—one veto share held by the
current Prime Minister, and another share held jointly by all ex-Prime Ministers. This structure appears
inconsistent with the intention of setting up independent corporate boards and seems unlikely to
deliver the corporate focus or political independence that is required for effective management of
public investments.
Further, the proposed SOE reforms could be strengthened by ensuring that future dividend
flows are fully integrated into the national budget process. Requiring funds to pass through the
national budget process will ensure any future equity injections into public assets and state-owned
enterprises are appraised and balanced against other spending priorities. It will also strengthen the
transparency of funding and ensure that Parliament can maintain accountability over fund usage.
________________________________
1/ This box was contributed by Aaron Batten (Asian Development Bank).

PAPUA NEW GUINEA
INTERNATIONAL MONETARY FUND19
IMPROVING ECONOMIC STATISTICS AND
STRENGTHENING ANTI-MONEY LAUNDERING
EFFORTS
38. Shortcomings in CPI and national accounts statistics—among others—make it
challenging to formulate appropriate policies in PNG. PNG’s CPI basket has not been updated
for more than 35 years and is likely to be a poor representation of today’s consumption pattern.
Moreover, data collection for compilation needs to be improved. The National Statistical Office has
not released estimates of GDP since 2007. While the Treasury Department provides GDP estimates
based on data collected through business surveys, this is only a temporary remedy and there is
considerable room for improvement. Staff encouraged the authorities to take urgent action to
address these long-standing issues.
39. PNG is at risk of being gray-listed by the Financial Action Task Force (FATF) for failing
to comply with requirements for anti-money laundering and combating the financing of
terrorism (AML/CFT). Staff encouraged the authorities to move expeditiously to address the
weaknesses in this area.
Authorities’ Views
40. The authorities recognized the urgency of addressing the issues of economic statistics
and AML/CFT. On the former, they indicated a willingness to take action and would request TA
from development partners after preparing a strategic plan. On the latter, an action plan has been
prepared for the Cabinet’s consideration. Australia is helping the authorities to analyze financial
transaction data and to submit related reports to the FATF, and the Asian Development Bank also
plans to provide TA in this area.
STAFF APPRAISAL
41. After a decade of commendable performance, the PNG economy now faces a more
challenging environment. Although overall GDP will increase significantly when LNG production
commences in 2014, the nonmineral sector is expected to slump in the short run and only revert to
moderate growth over the medium term. At the same time, increases in resource revenue are
expected to be one-off over the near-medium term and modest by historical standards, with
considerable uncertainty. PNG will have to manage this reality in addressing its huge development
needs.
42. A prudent fiscal policy and a steadfast focus on spending quality are needed to
maintain the hard-won macroeconomic stability and improve development outcomes. In the
short run, the government should provide support to nonmineral sector growth, but given the
country’s limited absorptive capacity, it should aim for a moderate fiscal deficit in 2014 to avoid
waste of resources. A fiscal consolidation will be necessary over the medium term to stay within the
PAPUA NEW GUINEA
20 INTERNATIONAL MONETARY FUND
government’s debt ceiling of 30 percent of GDP, which appears appropriate. However, considerable
scope exists to improve spending efficiency, which should be the central focus for improvement in
service delivery.
43. Progress has been made in establishing the SWF, but more work remains to be done to
ensure its most effective operation. The SWF can play an important role in macroeconomic
stabilization and development, but its integrity must be safeguarded by avoiding diversion of
resource revenues or bypassing the budget process. The authorities’ efforts to make the SWF
operational soon are commendable, but an early review of the withdrawal rules should be
undertaken to ensure the fund is adequately resourced.
44. Monetary policy is broadly appropriate, but continued efforts are needed to
strengthen monetary policy transmission and monitor financial sector risks. In the short run,
the BPNG should watch potential inflationary pressures arising from a weaker kina and government
spending, and it should withdraw excess liquidity to strengthen the signaling effect of the Kina
Facility Rate. As economic activity slows and price corrections in the property market take place, it is
important to closely monitor risks facing the superannuation funds and banks.
45. PNG’s external position is sound despite the large current account deficits in recent
years. PNG’s external public debt is sustainable under its medium-term policy setting. However, the
authorities should continue with their prudent approach to external borrowing. The rapid increase in
private sector external debt should be closely monitored given its sheer size.
46. The authorities’ increased focus on inclusive growth is welcomed. Continued efforts will
be needed to ensure better use of resource revenues, and the initiatives to make PNG an EITI
candidate by December is an encouraging step. The development of the agriculture and the SME
sector is also essential for broad-based growth, and the authorities are appropriately targeting an
enabling business environment and human resource development, including through improving law
and order, health, education and infrastructure. To contain fiscal risks and improve economic
efficiency, SOE reforms should be accelerated and appropriate governance structures should be
established in reorganized and consolidated public assets entities.
47. Urgent action is needed to address the long-standing shortcomings in CPI and
national accounts statistics, among others. Formulation of a strategic plan on economic statistics
is an important step. An early approval of an action plan on AML/CFT is also needed to ensure
compliance with international standards.
48. It is recommended that the next Article IV consultation be held on the standard 12-
month cycle.

PAPUA NEW GUINEA
INTERNATIONAL MONETARY FUND21
Figure 1. Papua New Guinea: Macro Performance
Economic growth is projected to slow in 2013…
…as the construction phase of the LNG project draws to a
close…
…and commodity prices fall.
Meanwhile, inflation has moved to lower levels…
…on account of low international food prices and
expanded tuition-free policy… …and low domestic demand pressure is expected to help
stabilize inflation.
Sources: Bank of Papua New Guinea; IMF, International Financial Statistics, World Economic Outlook; and IMF staff estimates and projections.
-15
-10
-5
0
5
10
15
-15
-10
-5
0
5
10
15
2006 2007 2008 2009 2010 2011 2012 2013
Proj.
Mineral
Nonmineral
GDP
Real GDP Growth
(In percent)
-2
-1
0
1
2
3
4
5
-2
-1
0
1
2
3
4
520112012 Est.2013 Proj.
Sector Contribution to Real GDP Growth
(In percent of GDP)
1/ Wholesale and retail trade.
2/ Transportation and communication.
0
20
40
60
80
100
120
140
160
0
20
40
60
80
100
120
140
160
2006 2007 2008 2009 2010 2011 2012 2013
Proj.
Copper
Gold
Oil
Terms of trade
Commodity Price Index
(2010=100)
-5
0
5
10
15
-5
0
5
10
15
Headline
Trimmed mean
CPI Inflation
(Year-on-year percent change)
-5
0
5
10
15
-5
0
5
10
15
Sep-08 Jun-09 Mar-10 Dec-10 Sep-11 Jun-12 Mar-13
Other Transportation
Fuel, rent and electricity Food
Contribution to CPI Inflation
(In percentage points)
-30
-20
-10
0
10
20
30
40
-30
-20
-10
0
10
20
30
40
2006 2007 2008 2009 2010 2011 2012 2013
Proj.
Net exports
Domestic demand
Real Domestic Demand and Net Exports
(Contribution to GDP growth)

PAPUA NEW GUINEA
22 INTERNATIONAL MONETARY FUND
Figure 2. Papua New Guinea: Fiscal Performance
Overall balance has turned into deficit from 2012.
Compared with the previous cautious stance, the
recent fiscal balance has deteriorated distinctly...
…but public debt remains low compared with most
other Pacific Island countries.
After a sharp tightening in 2010, the fiscal stance has
been loose…
…while mineral revenues and reserves fell… with trust account funds withdrawn to support
development projects.
Sources: Papua New Guinea authorities; IMF, APD Low-Income Small Countries database, and IMF staff estimates and projections.
-15
-10
-5
0
5
10
15
0
5
10
15
20
25
30
35
40
45
2006 2007 2008 2009 2010 2011 2012 2013 Proj.
Overall balance (RHS)
Nonmineral balance (RHS)
Public debt (LHS)
Fiscal Balance(In percent of GDP)
Fiji
Kiribati
Marshall
Islands
MicronesiaPalau
Samoa
Solomon
Islands
Tonga
Tuvalu
Vanuatu
Papua New
Guinea
-25
-20
-15
-10
-5
0
5
10
-25 -20 -15 -10 -5 0 5 10
Fiscal Balance(In percent of GDP)
20
13
45° line
Higher fiscal deficit in
2013 than in 2004-07
2004-07 average
0
10
20
30
40
50
60
70
80
0
10
20
30
40
50
60
70
80
Kir
ibati
Pala
u
So
lom
on
Isla
nd
s
Van
uatu
PN
G
FSM
Ton
ga
Fiji
MH
L
Sam
oa
2003 2012 Asian LICs average (2012)
Public Debt(In percent of GDP)
Source: APD LISC database.
-14
-12
-10
-8
-6
-4
-2
0
2
4
6
8
-14
-12
-10
-8
-6
-4
-2
0
2
4
6
8
2008 2009 2010 2011 2012 2013proj.
Revenue impulse
Expenditure impulse
1/ Adjusted for cycle and mineral revenues.
Looser
Tighter
Fiscal Impulse 1/(In percent of nonmineral GDP)
-15
-10
-5
0
5
10
15
-15
-10
-5
0
5
10
15
2006 2007 2008 2009 2010 2011 2012 2013 Proj.
Change in mineral revenue 1/
Change in overall balance 1/
1/ Compared to the previous year.
Mineral Revenue(In percent of GDP)
0
2
4
6
8
10
12
0
2
4
6
8
10
12
2006 2007 2008 2009 2010 2011 2012 2013Proj.
Deposits
Withdrawals
Trust Accounts Movements (In percent of GDP)

PAPUA NEW GUINEA
INTERNATIONAL MONETARY FUND23
Figure 3. Papua New Guinea: The Monetary Stance
Policy stance has been loosened as inflation falls…
…but real interest rates have increased as a result.
Ample liquidity remains but money growth has slowed
owing to the exchange market intervention by the BPNG…
…allowing the BPNG’s sterilization efforts to taper.
Broad money growth rate has also fallen, but private
sector credit has picked up.
Stable food prices have greatly contributed to low
inflation.
Sources: Bank of Papua New Guinea; IMF, International Financial Statistics, and IMF staff calculations.
0
2
4
6
8
10
12
0
2
4
6
8
10
12Policy Rate
Central Bank bills 63 days
30-day deposits weighted average
Policy Rate
(In percent)
-5
0
5
10
15
20
-5
0
5
10
15
20Nominal lending rate
Deflated by headline
Deflated by trimmed mean
Real Lending Rate
(In percent)
-20
-10
0
10
20
30
40
50
-20
-10
0
10
20
30
40
50
Liquid assets (in percent of
GDP)
M1 growth (year-on-year
percentage change)
Liquid Assets and Money Supply
0
15
30
45
60
75
90
105
0
1
2
3
4
5
6
7
8
9
10
11Central Bank bills (in billions of kina; lhs)
CRR ratio (in percent; lhs)
Sterilization ratio (in percent; rhs)
Central Bank's Sterilization
0
5
10
15
20
25
30
35
40
0
5
10
15
20
25
30
35
40
Broad money
Private sector credit
Credit Growth and Broad Money
(Year-on-year percentage change)
-30
-15
0
15
30
45
60
75
-30
-15
0
15
30
45
60
75Global food prices
Domestic food prices
Kina NEER
Food Prices and Nominal Effective Exchange Rate
(Year-on-year percentage change)

PAPUA NEW GUINEA
24 INTERNATIONAL MONETARY FUND
Figure 4. Papua New Guinea: The External Position
Exchange rates have stabilized after rapid appreciation for
several years…
…but the terms of trade worsened as both mineral and
nonmineral export prices fell.
The current account deficit is expected to narrow sharply
as imports and income outflows related to the LNG project
decline.
Official reserves have declined but remain adequate.
Sources: Bank of Papua New Guinea; Bloomberg; Information Notice System; and IMF staff estimates and projections.
60
80
100
120
140
160
60
80
100
120
140
160
2001 2003 2005 2007 2009 2011 2013
NEER
REER
AU$/kina
US$/kina
Exchange Rates(2005 =100)
0
200
400
600
800
1,000
1,200
1,400
0
200
400
600
800
1,000
1,200
1,400
2003 2005 2007 2009 2011 2013
Nonmineral
Mineral
Total
Export Price Indices
(1994=100)
-60
-40
-20
0
20
40
60
80
-60
-40
-20
0
20
40
60
80
2003 2005 2007 2009 2011 2013
Proj.
Trade balance
Income balance
Services balance
Current account balance
External Trade and Current Account
(In percent of GDP)
0.0
0.5
1.0
1.5
2.0
2.5
3.0
3.5
4.0
4.5
5.0
0
2
4
6
8
10
12
14
16
18
20
2003 2005 2007 2009 2011 2013
Proj.
In billions of US$ (rhs)
In months of nonmineral
imports (lhs)
In months of total G&S
imports (lhs)
Gross Official Reserves

PAPUA NEW GUINEA
INTERNATIONAL MONETARY FUND25
Figure 5. Papua New Guinea: The Banking Sector
The banking sector is dominated by three banks…
…and they continue to be quite profitable.
…with low NPLs and high capital adequacy… …while provisioning also remains high.
The loan-to-deposit ratio has stayed low reflecting
deposit-based funding structure and excess liquidity.
Meanwhile, earnings of superannuation funds improved a
little after a big drop in 2011.
Sources: Bank of Papua New Guinea; IMF, International Financial Statistics, and IMF staff calculations.
0
20
40
60
80
100
0
5
10
15
20
Australia and New
Zealand Banking
Group Limited
Bank South
Pacific
Westpac
Total deposits (lhs)
Total assets (lhs)
Total loans (lhs)
Total assets (in
percent of GDP; rhs)
Banks' Assets and Liabilities, March 2013
(In billions of kina)
0
5
10
15
20
25
30
35
40
0
1
2
3
4
5Return on assets (lhs)
Return on equity (rhs)
Banks' Return on Assets and Equity
(In percent)
0
10
20
30
40
50
60
70
80
0
0.5
1
1.5
2
2.5
3
3.5
4NPLs to total loans (lhs)
Loan-to-deposit ratio (rhs)
Capital adequacy ratio (rhs)
Bank Vulnerability Ratios
(In percent)
0
50
100
150
200
250
0
50
100
150
200
250
Bank Provisioning to NPLs
(In percent)
-20
-10
0
10
20
30
40
50
60
70
80
-20
-10
0
10
20
30
40
50
60
70
80Loan-to-deposit ratioLoan growthDeposit growth
Growth of Bank Loans and Deposits
(Year-on-year percentage change)
0
1,000
2,000
3,000
4,000
5,000
6,000
7,000
8,000
9,000
10,000
0.0
0.5
1.0
1.5
2.0
2.5
3.0
3.5
4.0
4.5
5.0
2007 2008 2009 2010 2011 2012
ASF Earnings (in percent of GDP;
lhs)
Kina Securities Index (2000=100;
rhs)
Earnings of Superannuation Funds
(In percent of GDP)

PAPUA NEW GUINEA
26 INTERNATIONAL MONETARY FUND
Figure 6. Papua New Guinea: The Cross-Country Context
Papua New Guinea is among the lowest income countries in the
region…
…with a large share of subsistence farming and an
underdeveloped tourism industry.
However, it does not depend much on foreign aid.
The trade account is more balanced than peer countries.
Government spending is moderate in regional comparison…
…while there is scope for improving the business climate.
Sources: Bank of Papua New Guinea; IMF, International Financial Statistics, World Economic Outlook; country authorities, and IMF staff calculations.
0 1,500 3,000 4,500 6,000 7,500 9,000 10,500
Palau
Fiji
Tonga
Samoa
Tuvalu
Marshall Islands
Micronesia
Vanuatu
Papua New Guinea
Solomon Islands
Kiribati Pacific
Islands
(median)
GDP per Capita, 2012 (In U.S. dollars)
Other small states
(median)
0
20
40
60
80
100
PN
G
Tim
or-
Lest
e
Tuvalu
Kir
ibati
Bh
uta
n
Mars
hall Is
lan
ds
So
lom
on
Isla
nd
s
Mic
ron
esi
a
Ton
ga
Fiji
Sam
oa
Van
uatu
Mald
ives
Pala
u
Agriculture, Forestry and Fishing Tourism
Real GDP - Selected Industries, 20111
1For Timor-Leste, Kiribati and Palau 2010; and for Solomon Islands, PNG and Tuvalu
2012.
0
10
20
30
40
Mars
hall
Isla
nd
s, R
ep
.
Mic
ron
esi
a
Kir
ibati
Tuvalu
So
lom
on
Isla
nd
s
Pala
u
Sam
oa
Pap
ua N
ew
Gu
inea
Ton
ga
Van
uatu Fiji
PICs average
Other small states
External Grants, 2005-2012(In percent of GDP)
0
20
40
60
80
100
120
140
Tuvalu
Kir
ibati
Mars
hall Is
lan
ds
Mic
ron
esi
a
Ton
ga
Sam
oa
So
lom
on
Isla
nd
s
Pala
u
Fiji
Van
uatu
Pap
ua N
ew
Gu
inea
Exports
Imports
Trade Goods and Services, 2005-2012(In percent of GDP)
0
10
20
30
40
50
60
70
80
Tuvalu
Kir
ibati
Mars
hall
Isla
nd
s
Mic
ron
esi
a
Pala
u
Sam
oa
So
lom
on
Isla
nd
s
Van
uatu Fiji
Ton
ga
Pap
ua N
ew
Gu
inea
Others
Wage expenditures
Current Government Expenditure, 2012(In percent of GDP)
Small states average
-1.0
0.0
1.0
2.0
3.0
0 50 100 150
Re
al G
DP
pe
r C
ap
ita
Gro
wth
(2
00
0-2
01
2)
(In
pe
rce
nt)
Starting Business Rank, 2012(A lower number indicates a more-friendly business environment)
Samoa
Tonga
Marshall Islands
Palau
FijiSolomon
Islands
Kiribati
Vanuatu
Micronesia
Business Environment and Real GDP per Capita Growth
Papua New Guinea

PAPUA NEW GUINEA
INTERNATIONAL MONETARY FUND 27
Table 1. Papua New Guinea: Selected Economic and Financial Indicators, 2009–14
Nominal GDP (2012): US$15.4 billion 1/
Population (2012): 7.2 million
GDP per capita (2012): US$2,146
Quota: SDR 131.6 million
2009 2010 2011 2012 2013 2014
Est.
Real GDP growth 6.1 7.7 10.7 8.1 5.4 6.3
-1.7 -2.0 -11.8 -6.9 5.3 80.7
7.0 8.7 12.8 9.2 5.4 1.7
6.9 6.0 8.4 2.2 4.0 6.0
5.7 7.2 6.9 1.6 5.5 6.0
27.3 31.3 30.4 29.6 27.6 25.4
36.9 28.2 28.7 32.8 33.9 31.3
-9.6 3.1 1.7 -3.2 -6.3 -5.8
-13.3 -3.6 -5.7 -6.7 -9.3 -9.3
37.3 4.9 -5.2 37.7 24.6 20.3
15.1 18.1 7.9 12.1 11.2 9.6
21.3 10.2 17.5 11.0 10.1 9.2
7.2 6.4 6.7 4.9 … …
4.5 5.9 6.9 6.1 6.0 7.2
3.4 4.4 4.9 4.5 4.5 5.5
-3.3 -4.3 -6.3 -7.4 -5.4 -4.4
-1.2 -2.1 -3.0 -7.7 -4.4 -0.4
-15.2 -21.4 -23.5 -51.0 -27.0 -2.0
2.6 3.1 4.3 4.0 3.0 4.3
10.9 10.6 13.5 10.3 7.5 11.4
6.0 5.0 5.2 4.0 4.1 7.1
31.3 25.3 22.3 26.7 31.6 33.6
12.5 10.4 7.5 7.5 7.9 8.2
1.8 1.4 1.3 0.7 1.4 1.2
0.3700 0.3785 0.4665 0.4755 … …
106.9 100.7 108.6 125.4 … …
116.4 113.1 127.5 147.0 … …
22.3 26.4 30.5 32.1 34.6 40.2
Sources: Department of Treasury; Bank of Papua New Guinea; and IMF staff estimates and projections.
1/ Based on period average exchange rate.
2/ Includes staff's estimates related to the PNG LNG project.
3/ Public external debt includes external debt of the central government, the central bank, and statutory authorities.
(In percent of GDP)
(Percentage change)
(In percent of GDP)
(Percentage change)
(In billions of U.S. dollars)
Proj.
Real sector
Mineral
Nonmineral
CPI (annual average)
CPI (end-period)
Central government operations
Revenue and grants
Expenditure and net lending
Net lending(+)/borrowing(-) [Overall balance] (Revenue - expenditure)
Nonmineral net lending(+)/borrowing(-)
Money and credit (percentage change)
Domestic credit
Credit to the private sector
Broad money
Interest rate (182-day Treasury bills; period average)
Balance of payments 2/
Exports, f.o.b.
Of which: Mineral
Imports, c.i.f.
Current account (including grants)
(In percent of GDP)
Gross official international reserves
(In months of nonmining imports, c.i.f.)
(In months of goods and services imports)
NEER (2005=100, end-period)
REER (2005=100, end-period)
Nominal GDP (in billions of kina)
Government debt
External debt-to-GDP ratio (in percent) 3/
External debt-service ratio (percent of exports) 3/
Exchange rates
US$/kina (end-period)

PAPUA NEW GUINEA
28 INTERNATIONAL MONETARY FUND
Table 2. Papua New Guinea: Summary Operations of the Central Government, 2009-14
2009 2010 2011
Revenue and grants 6,097 8,261 9,280 9,497 9,561 10,233
Nonmineral revenue 4,388 5,095 5,991 7,302 7,835 8,097
Mineral revenue 831 1,775 2,264 1,103 1,022 1,380
Grants 878 1,391 1,025 1,091 704 756
Expenditure 8,238 7,441 8,764 10,535 11,748 12,577
Expense 4,184 4,162 5,348 6,200 7,053 7,436
Net acquisition of nonfinancial assets 4,054 3,279 3,416 4,335 4,695 5,141
Gross operating balance (Revenue - expenditure) 1,912 4,099 3,932 3,297 2,508 2,797
Net lending(+)/borrowing(-) [Overall balance] -2,141 820 516 -1,039 -2,187 -2,344
Nonmineral net lending(+)/borrowing(-) [Nonmineral overall balance] -2,972 -955 -1,748 -2,142 -3,209 -3,724
CASH FLOWS FROM FINANCING ACTIVITIES:
Net acquisition of financial assets 1,066 -697 -1,763 359 33 104
Net incurrence of liabilities 171 -330 954 2,333 2,214 2,380
Revenue and grants 27.3 31.3 30.4 29.6 27.6 25.4
Nonmineral revenue 19.7 19.3 19.6 22.7 22.6 20.1
Mineral revenue 3.7 6.7 7.4 3.4 3.0 3.4
Grants 3.9 5.3 3.4 3.4 2.0 1.9
Expenditure 36.9 28.2 28.7 32.8 33.9 31.3
Expense 18.7 15.8 17.5 19.3 20.4 18.5
Net acquisition of nonfinancial assets 18.2 12.4 11.2 13.5 13.6 12.8
Gross operating balance (Revenue - expenditure) 8.6 15.5 12.9 10.3 7.2 6.9
Net lending(+)/borrowing(-) [Overall balance] -9.6 3.1 1.7 -3.2 -6.3 -5.8
Nonmineral net lending(+)/borrowing(-) [Nonmineral overall balance] -13.3 -3.6 -5.7 -6.7 -9.3 -9.3
CASH FLOWS FROM FINANCING ACTIVITIES:
Net acquisition of financial assets 4.8 -2.6 -5.8 1.1 0.1 0.3
Net incurrence of liabilities 0.8 -1.3 3.1 7.3 6.4 5.9
Revenue and grants 34.6 40.3 37.4 34.5 31.8 31.6
Nonmineral revenue 24.9 24.8 24.1 26.5 26.1 25.0
Taxes on income, profits, and capital gains 9.0 8.3 7.7 8.1 7.8 7.7
Taxes on payroll and workforce 7.0 7.3 8.7 9.6 8.9 8.8
Taxes on property 0.0 0.2 0.2 0.2 0.4 0.3
Taxes on goods and services 6.0 5.8 4.2 5.7 5.8 5.8
Taxes on international trade and transactions 2.2 2.8 2.9 2.5 2.4 1.9
Other taxes 0.6 0.5 0.4 0.4 0.8 0.5
Mineral revenue 4.7 8.7 9.1 4.0 3.4 4.3
Mineral and petroleum taxes 3.9 7.2 8.3 3.6 3.0 3.8
Mining and petroleum dividends 0.8 1.5 0.8 0.4 0.4 0.5
Grants 5.0 6.8 4.1 4.0 2.3 2.3
Expenditure 46.8 36.3 35.3 38.3 39.1 38.9
Expense 23.8 20.3 21.5 22.5 23.5 23.0
Compensation of employees 10.1 9.0 9.2 8.8 10.0 9.5
Purchases of goods and services 7.6 6.2 7.8 8.7 6.6 6.3
Interest 2.5 1.7 1.7 1.6 1.7 2.7
Subsidies 1.5 1.4 1.2 1.4 0.4 0.4
Grants 0.8 0.7 0.7 0.8 1.0 1.0
Other payments 1.2 1.2 1.0 1.3 3.6 3.2
Net acquisition of nonfinancial assets 23.0 16.0 13.8 15.7 15.6 15.9
Gross operating balance (Revenue - expenditure) 10.9 20.0 15.8 12.0 8.3 8.6
Net lending(+)/borrowing(-) [Overall balance] -12.2 4.0 2.1 -3.8 -7.3 -7.2
Nonmineral net lending(+)/borrowing(-) [Nonmineral overall balance] -16.9 -4.7 -7.0 -7.8 -10.7 -11.5
Memorandum items:
Additional priority expenditure (in percent of GDP) 10.6 3.3 4.7 3.9 1.3 0.0
Government deposits (in percent of GDP) 11.5 12.3 15.8 11.7 10.8 9.0
Gross government debt (in percent of GDP) 31.3 25.3 22.3 26.7 31.6 33.6
Domestic (in percent of GDP) 19.1 15.2 15.5 19.3 23.5 25.3
External (in percent of GDP) 12.3 10.1 6.8 7.4 8.1 8.3
Non-contingent liabilities (in percent of GDP) 26.5 23.6 19.5 17.6 16.5 15.1
Net public debt (in percent of GDP) 1/ 29.0 20.1 13.3 21.5 27.3 31.2
Nonmineral GDP at current prices (in millions of kina) 17,616 20,504 24,842 27,537 30,063 32,355
GDP at current prices (in millions of kina) 22,331 26,421 30,511 32,132 34,605 40,244
Sources: Department of Treasury; and IMF staff estimates and projections.
1/ Gross public debt and non-contingent liabilities less government assets including LNG equity stake.
(In millions of kina, unless otherwise indicated)
(In percent of GDP)
(In percent of nonmineral GDP)
2012 2013 2014
Proj.

PAPUA NEW GUINEA
INTERNATIONAL MONETARY FUND 29
Table 3. Papua New Guinea: Balance of Payments, 2009–14
(In millions of U.S. dollars)
2009 2010 2011 2012 2013 2014
Est.
Current account balance 1/ -1,233 -2,080 -3,021 -7,717 -4,355 -357
Mineral 587 -204 -2,684 -4,987 -1,235 2,025
Nonmineral -1,819 -1,876 -1,546 -2,758 -3,120 -2,383
Trade balance 1,264 1,564 628 -1,207 609 2,719
Exports (f.o.b.) 4,526 5,857 6,906 6,144 5,965 7,154
Mineral 3,441 4,444 4,854 4,470 4,477 5,467
Nonmineral 1,085 1,413 2,052 1,674 1,487 1,686
Imports (c.i.f.) -3,262 -4,293 -6,278 -7,351 -5,355 -4,435
Mineral -1,356 -1,939 -3,625 -4,726 -2,797 -1,700
Nonmineral -1,907 -2,354 -2,654 -2,626 -2,559 -2,735
Services -1,813 -2,765 -3,342 -4,226 -3,637 -2,287
Income -857 -1,068 -553 -2,450 -1,454 -997
Current Transfers 173 190 246 167 126 208
Capital and financial account balance 1,636 2,552 4,398 7,595 3,351 1,635
Direct investment 1,382 554 1,024 1,883 904 2,100
Other investment 254 1,998 3,374 5,712 2,447 -1,465
Medium- and long-term loans 956 1,808 4,299 8,329 -175 -918
Commercial banks 98 89 76 -88 -6 -47
Other -800 100 -1,000 -2,528 2,628 -500
Net errors and omissions -71 -3 -147 -199 0 0
Overall balance 333 469 1,231 -321 -1,004 1,277
Financing -333 -469 -1,231 321 1,004 -1,277
Reserve assets -529 -469 -1,231 321 1,004 -1,277
Other foreign liabilities 196 0 0 0 0 0
Memorandum items:
Current account (in percent of GDP) -15.2 -21.4 -23.5 -51.0 -27.0 -2.0
Mineral 7.2 -2.1 -20.9 -33.0 -7.7 11.2
Nonmineral -22.4 -19.3 -12.0 -18.2 -19.3 -13.2
Net international reserves (end-year)
In millions of U.S. dollars 2,426 2,895 4,126 3,804 2,800 4,077
Gross official reserves (end-year)
In millions of U.S. dollars 2,623 3,092 4,323 4,001 2,997 4,275
In months of imports of goods and services 6.0 5.0 5.2 4.0 4.1 7.1
Public external debt-service-exports ratio (in percent) 2/ 1.8 1.4 1.3 0.7 1.4 1.2
Public external debt-GDP ratio (in percent) 2/ 12.5 10.4 7.5 7.5 7.9 8.2
Sources: Data provided by the Papua New Guinea authorities; and IMF staff estimates and projections.
1/ Includes staff's estimates related to the PNG LNG project.
2/ Public external debt includes external debt of the central government, the central bank, and statutory authorities.
Proj.

PAPUA NEW GUINEA
30 INTERNATIONAL MONETARY FUND
Table 4. Papua New Guinea: Summary Accounts of the Depository Corporations, 2009–14
2009 2010 2011 2012 2013 2014
Bank of Papua New Guinea
Net foreign assets 6,554 7,652 8,844 8,000 5,965 8,851
Foreign assets 7,091 8,170 9,266 8,415 6,397 9,299
Foreign liabilities 536 518 423 415 431 448
Net domestic assets -4,741 -5,636 -5,585 -4,167 -1,710 -4,127
Domestic credit -220 -639 -1,423 -438 -708 -700
Net credit to government -261 -652 -1,501 -487 -757 -749
Claims 333 367 431 499 752 990
Central government deposits 593 1,019 1,933 985 1,508 1,738
Credit to other sectors 40 13 79 49 49 49
Other items, net -4,520 -4,997 -4,162 -3,729 -1,002 -3,427
Of which: Central bank securities -4,117 -4,594 -5,687 -5,149 -1,383 -5,110
Reserve money 1,814 2,016 3,259 3,834 4,255 4,723
Currency in circulation 1,002 1,193 1,532 1,679 1,809 2,103
Deposits of other depository corporations 808 810 1,724 2,142 2,434 2,607
Required reserves 369 514 945 1,391 1,529 1,668
Excess reserves 440 296 779 751 905 940
Other deposits 3 13 3 13 13 13
Depository Corporations Survey
Net foreign assets 7,924 8,968 10,114 9,472 7,551 10,694
Net domestic assets 3,846 3,999 5,118 7,432 11,054 9,631
Domestic credit 6,665 6,993 6,630 9,131 11,378 13,690
Net credit to central government 574 -202 -1,077 297 1,599 3,005
Claims on other sectors 6,091 7,195 7,707 8,834 9,779 10,684
Claims on the private sector 5,902 6,971 7,522 8,434 9,377 10,279
Other items, net -2,820 -2,994 -1,513 -1,699 -324 -4,058
Broad money 11,770 12,967 15,231 16,904 18,605 20,325
Narrow money 6,233 7,644 9,620 11,148 12,158 13,105
Currency outside other depository corporations 789 955 1,188 1,214 1,360 1,523
Demand deposits 5,444 6,689 8,431 9,934 10,798 11,582
Quasi-money 5,537 5,323 5,612 5,756 6,447 7,220
Net foreign assets 28.9 13.2 12.8 -6.3 -20.3 41.6
Net domestic assets 8.2 4.0 28.0 45.2 48.7 -12.9
Net domestic credit 37.3 4.9 -5.2 37.7 25 20.3
Of which: Private sector 15.1 18.1 7.9 12.1 11.2 9.6
Broad money 21.3 10.2 17.5 11.0 10.1 9.2
Memorandum items:
Reserve money (percentage change) 11.9 11.1 61.7 17.6 11.0 11.0
Gross international reserves (in millions of U.S. dollars) 2,623 3,092 4,323 4,001 2,997 4,275
Nominal nonmineral GDP/Broad money 1.5 1.6 1.6 1.6 1.6 1.6
Sources: Bank of Papua New Guinea; and IMF staff estimates and projections.
(In millions of kina; end of period)
(In millions of kina; end of period)
(Annual percentage change)
Proj.

PAPUA NEW GUINEA
INTERNATIONAL MONETARY FUND 31
Table 5. Papua New Guinea: Medium-Term Scenario, 2009–18
2009 2010 2011 2012 2013 2014 2015 2016 2017 2018
Est.
Growth and prices (percentage change)
Real GDP 1/ 6.1 7.7 10.7 8.1 5.4 6.3 21.4 3.3 3.4 3.5
Mineral -1.7 -2.0 -11.8 -6.9 5.3 80.7 178.3 -0.7 -0.6 -0.6
Nonmineral 7.0 8.7 12.8 9.2 5.4 1.7 4.2 4.5 4.5 4.5
CPI (period average) 6.9 6.0 8.4 2.2 4.0 6.0 6.0 6.0 6.0 6.0
CPI (end-period) 5.7 7.2 6.9 1.6 5.5 6.0 6.0 6.0 6.0 6.0
Central government operations (in percent of GDP)
Total revenue and grants 27.3 31.3 30.4 29.6 27.6 25.4 22.4 22.6 22.9 23.1
Total revenue 23.4 26.0 27.1 26.2 25.6 23.5 20.9 21.1 21.4 21.7
Of which: Mineral revenue 3.7 6.7 7.4 3.4 3.0 3.4 5.2 4.8 4.5 4.4
Grants 3.9 5.3 3.4 3.4 2.0 1.9 1.4 1.5 1.5 1.4
Total expenditure 36.9 28.2 28.7 32.8 33.9 31.3 24.8 24.7 24.6 24.8
Primary balance -7.6 4.4 3.1 -1.9 -4.8 -3.7 -0.6 -0.2 0.2 0.2
Nonmineral net lending(+)/borrowing(-) (Revenue - expenditure) -13.3 -3.6 -5.7 -6.7 -9.3 -9.3 -7.6 -6.9 -6.2 -6.1
Net lending(+)/borrowing(-) [Overall balance] -9.6 3.1 1.7 -3.2 -6.3 -5.8 -2.4 -2.1 -1.7 -1.7
Gross public debt (in percent of GDP) 2/ 31.3 25.3 22.3 26.7 31.6 33.6 26.7 27.7 27.9 28.9
Domestic 18.8 14.9 14.7 19.2 23.7 25.5 19.5 19.3 18.3 18.2
External 12.5 10.4 7.5 7.5 7.9 8.2 7.1 8.4 9.7 10.7
Balance of payments (in millions of U.S. dollars) 3/
Exports, f.o.b. 4,526 5,857 6,906 6,144 5,965 7,154 12,063 11,799 11,916 12,003
Of which: Mineral 3,441 4,444 4,854 4,470 4,477 5,467 10,177 9,888 9,936 10,010
Imports, c.i.f. -3,262 -4,293 -6,278 -7,351 -5,355 -4,435 -4,837 -4,865 -5,011 -5,161
Current account -1,233 -2,080 -3,021 -7,717 -4,355 -357 3,021 2,323 2,263 2,095
(In percent of GDP) -15.2 -21.4 -23.5 -51.0 -27.0 -2.0 12.3 9.3 8.8 7.9
Overall balance (including exceptional financing) 333 469 1,231 -321 -1,004 1,277 1,549 894 610 1,390
Net official reserves (in millions of U.S. dollars) 2,426 2,895 4,126 3,804 2,800 4,077 5,626 6,520 7,130 8,520
(In months of goods and services imports, c.i.f.) 6.0 5.0 5.2 4.0 4.1 7.1 9.2 10.8 11.6 13.4
(In months of nonmining imports, c.i.f.) 10.1 9.9 12.8 9.8 7.0 10.8 14.0 15.6 16.9 19.6
Public external debt service-export ratio (in percent) 4/ 1.8 1.4 1.3 0.7 1.4 1.2 0.8 0.7 0.7 0.8
Memorandum items:
Nominal GDP (in millions of U.S. dollars) 8,105 9,716 12,869 15,134 16,145 18,062 24,489 24,977 25,705 26,659
Assumed commodity prices: 5/
Gold (U.S. dollars per ounce) 973 1,225 1,569 1,669 1,462 1,396 1,413 1,433 1,459 1,490
Copper (U.S. dollars per ton) 5,165 7,538 8,823 7,959 7,446 7,403 7,456 7,503 7,550 7,615
Oil (U.S. dollars per barrel) 62 79 104 105 104 101 95 91 89 87
Sources: Department of Treasury; Bank of Papua New Guinea; and IMF staff estimates and projections.
1/ Real GDP growth projections are based on the chained Laspeyres measure.
2/ Public external debt includes external debt of the central government, the central bank, and statutory authorities.
3/ Includes staff's estimates related to the PNG LNG project.
4/ Public external debt service includes changes in check float.
5/ August 2013 IMF WEO projections.
Projections

PAPUA NEW GUINEA
32 INTERNATIONAL MONETARY FUND
Table 6. Papua New Guinea: Indicators of External Vulnerability, 2009–13
(In percent of GDP, unless otherwise indicated)
2009 2010 2011 2012 2013
Est. Proj.
Financial indicators
Gross public debt 1/ 2/ 31.3 25.3 22.3 26.7 31.6
Broad money (percentage change, 12-month basis) 21.3 10.2 17.5 11.0 10.1
Private sector credit (percentage change, 12-month basis) 15.1 18.1 7.9 12.1 11.2
Interest rate (182-day Treasury bills; period average) 7.2 6.4 6.7 4.9 …
External indicators
Exports (percentage change, 12-month basis in U.S. dollars) -20.6 29.4 17.9 -11.0 -2.9
Imports (percentage change, 12-month basis in U.S. dollars) 3.7 31.6 46.2 17.1 -27.2
Current account balance -15.2 -21.4 -23.5 -51.0 -27.0
Capital and financial account balance (in millions of U.S. dollars) 1,636.3 2,551.9 4,398.2 7,594.7 3,351.3Of which: Inward foreign direct investment 1,382.1 554.2 1,023.7 1,882.8 903.9
Gross official reserves (in millions of U.S. dollars) 2,623.5 3,092.2 4,322.8 4,001.5 2,997.4
Central Bank short-term foreign liabilities (in millions of U.S. dollars) 1.7 2.7 194.5 197.2 197.2
Commerical bank foreign assets (in millions of U.S. dollars) 578.1 579.0 646.2 793.0 821.9
Commerical bank foreign liabilities (in millions of U.S. dollars) 71.2 80.9 61.9 93.1 96.5
Gross official reserves (in months of nonmineral imports, c.i.f.) 10.9 10.6 13.5 10.3 7.5
Broad money to gross reserves (ratio) 1.7 1.6 1.6 2.0 2.8
Total short-term external debt to reserves (in percent) 3/ 2.7 2.6 1.4 2.3 3.2
Public external debt-to-GDP ratio (in percent) 12.5 10.4 7.5 7.5 7.9
Exchange rate (kina per U.S. dollar; period average) 2.7 2.6 2.1 2.1 ..
Financial market indicators
Foreign currency long-term government debt rating 1/
Moody's Ba2 Ba2 Ba2 Ba2 ..
Standard & Poors B+ B+ B+ B+ ..
Sources: Department of Treasury; Bank of Papua New Guinea; and IMF staff estimates and projections.
1/ End of period.
2/ Public external debt includes external debt of the central government, the central bank, and statutory authorities.
3/ Short-term external debt covers only the banking system.

PAPUA NEW GUINEA
INTERNATIONAL MONETARY FUND 33
Table 7. Papua New Guinea: Financial Soundness Indicators of Deposit-taking Institutions,
1/ 2009–13
(In percent)
2009 2010 2011 2012 2013
Capital Adequacy
Capital to risk-weighted assets 2/ 25.7 28.3 26.9 28.0 29.7
Tier 1 capital to risk-weighted assets 18.5 21.1 19.6 20.1 23.6
Asset Quality
Nonperforming loans to total loans 1.8 1.7 2.0 2.0 1.5
Past due loans to total loans 2.8 2.2 5.1 2.8 2.8
Provision for losses to NPL 129.6 173.6 158.2 170.9 232.1
Earnings and Profitability
Return on assets 2.1 2.5 2.8 2.6 2.4
Return on equity 3/ 26.9 29.8 32.5 30.0 26.0
Liquidity
Liquid assets to total assets 58.0 56.6 58.5 56.6 55.9
Loan-to-deposit ratio 47.0 49.9 46.3 46.9 48.2
Other
Capital to total assets 2/ 12.4 13.7 12.8 13.6 14.4
Risk-weighted assets to total assets 48.5 48.5 47.5 48.7 48.4
Sources: Bank of Papua New Guinea; and IMF staff calculations.
1/ Fourth quarter data for each year. For 2013, as of March 2013.
2/ Capital base includes Tier 1 and 2 capital.
3/ Return on equity is calculated with Tier 1 capital.

PAPUA NEW GUINEA
34 INTERNATIONAL MONETARY FUND
Table 8. Papua New Guinea: State of Millennium Development Goals
Global targets Papua New Guinea’s National Targets
Goal 1: Eradicate extreme poverty and hunger Off track On track
Goal 2: Achieve universal primary education Off track Mixed
Goal 3: Promote gender equality and empower women Off track Mixed
Goal 4: Reduce child mortality Off track On track
Goal 5: Improve maternal health Off track Off track
Goal 6: Combat HIV/AIDS, malaria and other diseases Off track Off track
Goal 7: Ensure environmental sustainability Off track Off track
Goal 8: Develop a global partnership for development Off track Not a national target
Sources: UNDP Papua New Guinea; and Pacific Islands Forum Secretariat, 2012 and 2013 Pacific Regional MDGs Tracking Reports.
Progress on Millennium Development Goals (MDGs)

PAPUA NEW GUINEA
INTERNATIONAL MONETARY FUND 35
Appendix I. Papua New Guinea—Risk Assessment Matrix1
Main Sources of
Risks
Likelihood
(high, medium, or
low)
Expected Impact on Economy
(high, medium, or low) Possible Policy Responses
Lower than
anticipated
emerging market
growth potential
Medium
A significant growth
shock to emerging
markets, especially a
further slowdown in
China, could result in a
large drop in world
commodity prices.
High
A sharp decline in PNG’s
exports would worsen the trade
balance. It would also reduce
fiscal revenue and weaken the
reserves buffer and the kina.
FDI inflows would also be
adversely affected.
Introduce temporary fiscal and
monetary stimulus; allow the kina
to depreciate to boost exports
and protect foreign reserves;
redirect expenditure further to the
vulnerable.
LNG price drop
owing to shale gas
development
Low/Medium
Shale gas development
around the world could
depress LNG prices in
the medium to long
run.
High
Lower LNG prices would reduce
fiscal revenue and export
proceeds. Development of
future LNG projects would
become less likely.
Allow the kina to depreciate to
boost nonmineral exports;
increase tax rates and/or broaden
revenue base; lower expenditure
over time.
Protracted
economic and
financial volatility,
especially for
emerging markets
High
Capital flows to
emerging markets
would reverse as
advanced economies
unwind credit easing.
Low/Medium
Higher funding costs would
adversely affect the mining
sector with flow-on effects on
nonmining activities.
Allow the kina to depreciate to
support exporting firms; intensify
monitoring of the financial sector
as activity slows.
Property market
corrections
Low/Medium
Property prices in Port
Moresby and Lae could
fall sharply.
Medium
Authorized superannuation
funds and local banks could be
adversely affected.
Accelerate clearance of
superannuation arrears; write
down losses in the funds; ensure
banks’ capital adequacy; and
provide emergency liquidity
support if needed.
Political instability
and worsening
security
Low/Medium
Tensions could arise
within the ruling
coalition; regional and
tribal tensions could
increase and law and
order worsen.
Medium/High
Rent-seeking behavior could
intensify and more
nonproductive expenditures
could arise. Confidence would
fall and investment would be
discouraged.
Increase spending to improve
security, but with greater fiscal
transparency; resist monetary
accommodation of fiscal
expansion; highlight economic
importance of political and social
stability.
Natural disasters
Low/Medium
PNG is prone to
earthquakes and
cyclones.
Medium/High
Given PNG’s poor infrastructure
and weak capacity, the
economic impact can be
significant.
Ensure fiscal buffers are adequate
to support affected groups and
spend more on preparation and
prevention; encourage take-up of
disaster insurance.
1 The Risk Assessment Matrix (RAM) shows events that could materially alter the baseline path (the scenario most
likely to materialize in the view of IMF staff). The relative likelihood of risks listed is the staff’s subjective assessment
of the risks surrounding the baseline (“low” is meant to indicate a probability below 10 percent, “medium” a
probability between 10 and 30 percent, and “high” a probability of 30 percent or more). The RAM reflects staff views
on the source of risks and overall level of concern as of the time of discussions with the authorities.

PAPUA NEW GUINEA
36 INTERNATIONAL MONETARY FUND
Appendix II. Papua New Guinea—Authorities’ Response to Fund Policy Advice
Fund Recommendation Policy Actions
Monetary Policy
To enhance the effectiveness of monetary policy,
the operation should move to interest rate-based
policy and the liquidity abundant situation has to
be addressed.
Even though the BPNG has frequently used its policy rate as a
monetary policy tool, its effectiveness appears to be limited
due to the existence of large excess liquidity. Money market
rates remain weakly anchored by the policy rate.
To absorb possible external shocks, the exchange
rate needs to be more flexible.
The kina began to depreciate in the second half of 2012. The
BPNG’s intervention has aimed to stabilize the kina from
fluctuating widely from trends while also assisting liquidity
management.
Monetary policy cost for BPNG to drain excess
liquidity in the market has to be reduced by
transferring trust accounts from commercial
banks to BPNG.
The trust accounts are expected to be phased out over time as
the government implements multiyear budgeting and the
SWF begins to operate, but early steps to move them to BPNG
could aid monetary policy effectiveness.
Fiscal Policy
The fiscal policy framework should move from a
quasi-balanced budget approach toward a
steady real expenditure path.
Based on the new 2013-17 Medium-Term Fiscal Strategy, the
authorities target annual fiscal deficits and a debt ceiling of 30
percent of GDP in the medium term. This does not guarantee
a steady expenditure path, but it does allow more flexibility for
countercyclical policy and expenditure management.
To secure taxes from the resource sector
efficiently, the related tax codes need to be
reviewed and existing tax concessions need to be
streamlined.
After Fund TA, a comprehensive review of the tax regime is in
progress with a view to maximizing revenue and encouraging
new investments.
The withdrawal rules for SWF should be set in
conjunction with the new MTFS. Moreover, the
integration of the Development Fund with the
budget process should be clarified. Existing trust
accounts should be consolidated with the fund.
The withdrawal rules were clarified. However, the maximum
amount allowed to be withdrawn appears to be too high, such
that funds accumulated in the SWF may not ultimately be
enough to serve its stabilization purposes. The authorities
agreed to revisit the withdrawal rules again.
Structural Reform
Further measures to improve competition are
needed in sectors with established monopolies,
especially in rice production.
Several regulatory and industry reviews have been undertaken
to encourage greater private sector participation in areas such
as information and communications technology and
electricity. The rice monopoly issue has been resolved.
Financial Sector Policy
AML/CFT recommendations need to be
implemented.
PNG is at risk of being “gray-listed” by the Financial Action
Task Force (FATF). The government has prepared a draft
action plan for Cabinet approval.

PAPUA NEW GUINEA
INTERNATIONAL MONETARY FUND 37
Appendix III. Papua New Guinea: Debt Sustainability Analysis Update1
This debt sustainability analysis (DSA) indicates that Papua New Guinea remains at low risk of debt
distress. Baseline projections suggest that PNG’s overall public debt is sustainable. Scenario analysis
highlights the need to exercise fiscal discipline and to control broad public liabilities—including
contingent liabilities—as well as the importance of successfully completing the LNG project to
maintain PNG’s debt sustainability.
A. Background
PNG has been reducing its public and external debt burden over the past decade.2 Public
sector debt declined from 62 percent of GDP at end-2004 to about 27 percent of GDP at end-2012
(Table 1a). Public and publicly guaranteed (PPG) external debt has also declined sharply, from a peak
of over 50 percent of GDP in 2001 to the current 7½ percent of GDP (Table 3a). Around 70 percent
of current public external debt is owed to the Asian Development Bank and the World Bank, with the
rest mainly to China and Japan.
B. Economic Outlook and Underlying DSA Assumptions
PNG’s growth prospects and current account developments over the medium term will be
heavily influenced by its extractive sector. Box 1 summarizes the medium-term macroeconomic
framework underlying this DSA update. Economic activity is projected to slow significantly in 2013,
as the construction phase of the LNG project draws to a close. When LNG production starts in the
second half of 2014, real GDP growth is expected to rise to more than 6 percent in 2014 and 21
percent in 2015 when LNG production reaches full capacity. The current account deficit has widened
sharply in recent years, largely as a result of increased imports and income outflows related to the
LNG project, which are funded by corresponding FDI and medium and long-term loans. The deficit
is expected to narrow significantly in 2013, and with LNG exports coming on stream next year, it is
set to decline quickly and turn into a surplus in 2015.
1 As Papua New Guinea is an IBRD/IDA blend country, this DSA update is prepared by Fund staff in close consultation
with the World Bank and the Asian Development Bank (AsDB) using the IMF-World Bank DSA framework for Low-
Income Countries. The fiscal year for Papua New Guinea is the calendar year. An IMF country team visited Papua New
Guinea for the 2013 Article IV consultation from late August to early September 2013.
2 Papua New Guinea is rated as a medium performer for its policies and institutions for the purposes of the IMF-
World Bank low-income country DSA framework. Consequently, the applicable thresholds for PNG for external public
debt are: 40 percent for the present value (PV) of the debt-to-GDP ratio; 150 percent for the PV of the debt-to-
exports ratio; 250 percent for the PV of the debt-to-revenue ratio; 20 percent for the debt service-to-exports ratio;
and 20 percent for the debt service-to-revenue ratio.

PAPUA NEW GUINEA
38 INTERNATIONAL MONETARY FUND
C. External Debt Sustainability Analysis
The baseline scenario indicates that all PPG external debt ratios stay well below the indicative
thresholds. The external debt burden registers a small increase in the medium term, peaking at
around 10 percent before declining in the long run (Figure A1; Table 3). Since additional financing
needs for the LNG project and the current account deficit would be met with projected large FDI
inflows and medium- and long-term debt drawdowns, the need for public external borrowing is
relatively small. PNG’s public external debt service ratios are also very low, reflecting its relatively
small debt stock as well as the fact that most of its public external debt is highly concessional.
PNG is vulnerable to shocks under the historical scenario despite the current low debt burden,
but this scenario has a low probability of materializing. There is a protracted breach of the PV of
debt-to-GDP ratio under the historical scenario (Figure A1-b), which could be thought of as
circumstances where the LNG project has completely failed or suffered a major delay. In this
scenario, when the current account deficit is fixed at the ten-year average of 2003-12, the simulation
effectively keeps imports at levels elevated by the LNG project and rules out the expected large
increases in LNG exports over time. Given that the LNG project is over 90 percent complete, this
scenario represents an unlikely event.
D. Public Debt Sustainability Analysis3
The overall public debt dynamics for PNG is favorable, but there are risks. The public debt
burden is expected to decline continuously over the projection period under the baseline (Figure A2;
Table 1). However, the projected debt path is particularly sensitive to assumptions of GDP growth
and fiscal policy. For example, if the expected primary fiscal deficit in 2013 (a year of large fiscal
expansion) is assumed to be maintained for the projection period, the PV of the public debt-to-GDP
ratio would be above 100 percent by 2030. A scenario to analyze the debt dynamics implied by the
authorities’ recently released 2014 Budget Strategy Paper (BSP) is also considered. This BSP scenario
assumes that the unspent portion of expenditure from 2013 will be rolled over to 2014 and spent.
The analysis shows that gross government debt could rise to 37 percent of GDP in 2014, exceeding
the 35 percent ceiling set by the government for that year.4
Other country-specific liabilities increase risks to debt sustainability. The unfunded
superannuation liabilities, estimated to be about 9 percent of GDP at end-2012, remain sizable
despite the recent partial payment. Contingent liabilities related to the LNG project are estimated to
be about 15 percent of GDP and public enterprise liabilities are about 7½ of GDP. Should these
contingent liabilities materialize, there would be a significant increase in the public debt burden over
the medium term (Figure 2).
3 Public debt includes domestic central government debt and external public and publicly guaranteed debt.
4 The authorities’ own projections suggest that the 35 percent of GDP debt ceiling will be observed.

PAPUA NEW GUINEA
INTERNATIONAL MONETARY FUND 39
E. Conclusion
Papua New Guinea’s public external debt remains at low risk of debt stress. The baseline
scenario indicates that all external PPG debt burden indicators are well below their indicative
thresholds. While PNG’s external debt dynamics is vulnerable under the historical scenario, the
increased debt burden simulated in this scenario is distorted by sharp increases in the current
account deficit in recent years related to the LNG project, and thus unlikely to materialize. On the
broader public debt, while the government debt burden is relatively low, the existence of large
contingent liabilities has significantly increased PNG’s debt vulnerability.
This DSA highlights the importance of pursuing a prudent fiscal policy and the need to
control broad public liabilities. Staff encourages the authorities to adhere to the government’s
debt target while focusing on improving spending quality to overcome constrained fiscal space in
meeting the country’s development needs. Continued structural reforms to increase PNG’s growth
potential and diversify the economy will also help reduce its vulnerability to external shocks.
BOX 1. MACROECONOMIC ASSUMPTIONS UNDERLYING THE DSA UPDATE
Real GDP growth is projected at 7.6 percent on average over the medium term, and to
slow to 3.5 percent in the long run.
Inflation is expected to stabilize over the medium term at about 6 percent and is
maintained at this level in the long run.
The current account (including grants) will remain in deficit until 2014, primarily reflecting
the strong import growth related to the construction phase of the LNG project. It will turn
into a surplus in 2015 as LNG production comes on stream and imports related to the LNG
project subside, and is projected to be 7 percent of GDP on average during 2015-25.
The grant element of loans is expected to decline. As per capita income rises, the share
of external financing provided on concessional terms is expected to decline gradually over
the projection period.
The primary fiscal balance is estimated to be in deficit of 5.2 percent of GDP in 2013.
During the current medium-term fiscal strategy period (2013-2017), a continuous primary
deficit of 3 percent of GDP on average is expected. After 2023, the primary fiscal balance
is projected to turn into surplus, with an average of 0.5 percent of GDP during 2023-33.

PAPUA NEW GUINEA
40 INTERNATIONAL MONETARY FUND
Sources: Papua New Guinea authorities; and IMF staff estimates and projections.
Figure A1. Papua New Guinea: Indicators of Public and Publicly Guaranteed External
Debt under Alternative Scenarios, 2013-2033 1/
1/ The most extreme stress test is the test that yields the highest ratio in 2023. In figure b. it corresponds to a Combination shock; in c. to an Exports shock; in d. to a Combination shock; in e. to an Exports shock and in figure f. to a Combination shock
0
5
10
15
20
25
2013 2018 2023 2028 2033
Baseline Historical scenario Most extreme shock 1/ Threshold
f.Debt service - to - revenue ratio
31 32 33 34 35 36 37 38 39 40 41
- 0.5
0.0
0.5
1.0
1.5
2.0
2.5
3.0
2013 2018 2023 2028 2033
Rate of Debt Accumulation Grant - equivalent financing (% of GDP) Grant element of new borrowing (% right scale)
a. Debt Accumulation
0
5
10
15
20
25
30
35
40
45
2013 2018 2023 2028 2033
b.PV of debt - to GDP ratio
0
20
40
60
80
100
120
140
160
2013 2018 2023 2028 2033
c.PV of debt - to - exports ratio
0
50
100
150
200
250
300
2013 2018 2023 2028 2033
d.PV of debt - to - revenue ratio
0
5
10
15
20
25
2013 2018 2023 2028 2033
e.Debt service - to - exports ratio

PAPUA NEW GUINEA
INTERNATIONAL MONETARY FUND 41
Sources: Papua New Guinea authorities; and IMF staff estimates and projections. 1/ The most extreme stress test is the test that yields the highest ratio in 2023. 2/ Revenues are defined inclusive of grants.
Figure A2.Papua New Guinea: Indicators of Public Debt Under Alternative Scenarios,
2013-2033 1/
- 400
- 300
- 200
- 100
0
100
200
300
400
500
600
2013 2015 2017 2019 2021 2023 2025 2027 2029 2031 2033
PV of Debt - to - Revenue Ratio 2/
- 100
- 50
0
50
100
150
2013 2015 2017 2019 2021 2023 2025 2027 2029 2031 2033
Baseline Fix Primary Balance Most extreme shock Growth Historical scenario Contingent liabilities realization
PV of Debt - to - GDP Ratio
- 100
- 50
0
50
100
150
2013 2015 2017 2019 2021 2023 2025 2027 2029 2031 2033
Debt Service - to - Revenue Ratio 2/
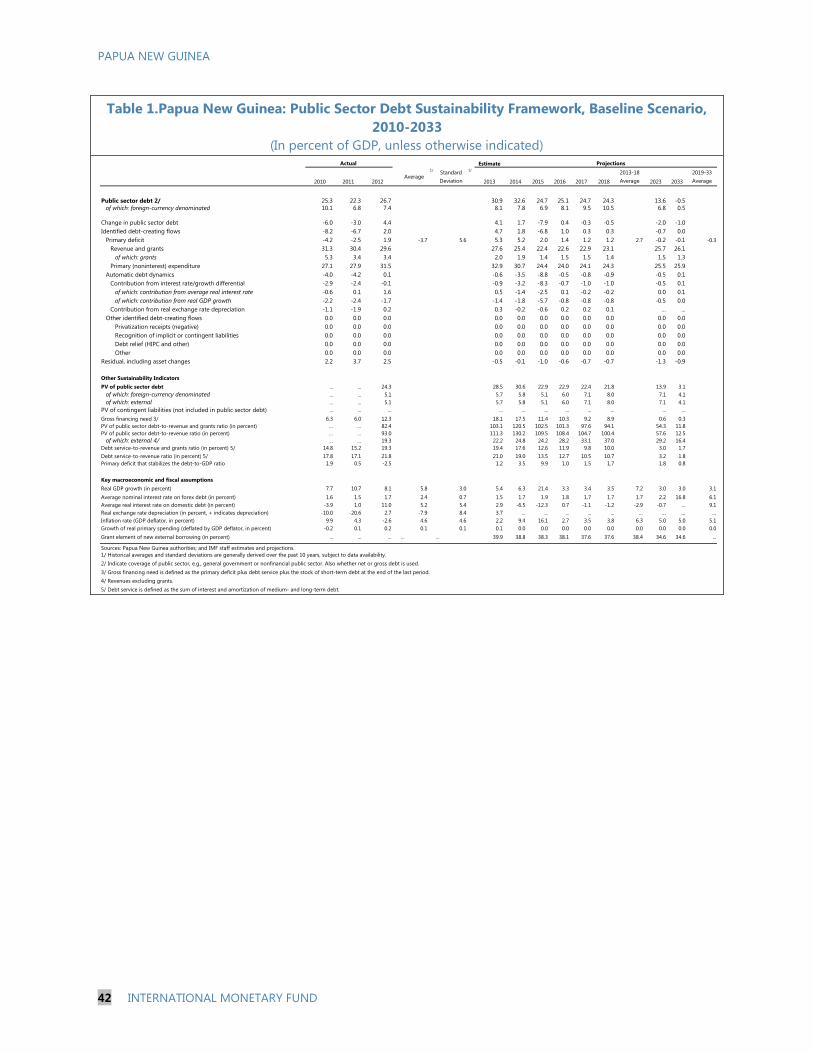
PAPUA NEW GUINEA
42 INTERNATIONAL MONETARY FUND
Table 1.Papua New Guinea: Public Sector Debt Sustainability Framework, Baseline Scenario,
2010-2033
(In percent of GDP, unless otherwise indicated)
Estimate
2010 2011 2012Average
1/Standard
Deviation
1/
2013 2014 2015 2016 2017 2018
2013-18
Average 2023 2033
2019-33
Average
Public sector debt 2/ 25.3 22.3 26.7 30.9 32.6 24.7 25.1 24.7 24.3 13.6 -0.5
of which: foreign-currency denominated 10.1 6.8 7.4 8.1 7.8 6.9 8.1 9.5 10.5 6.8 0.5
Change in public sector debt -6.0 -3.0 4.4 4.1 1.7 -7.9 0.4 -0.3 -0.5 -2.0 -1.0
Identified debt-creating flows -8.2 -6.7 2.0 4.7 1.8 -6.8 1.0 0.3 0.3 -0.7 0.0
Primary deficit -4.2 -2.5 1.9 -3.7 5.6 5.3 5.2 2.0 1.4 1.2 1.2 2.7 -0.2 -0.1 -0.3
Revenue and grants 31.3 30.4 29.6 27.6 25.4 22.4 22.6 22.9 23.1 25.7 26.1
of which: grants 5.3 3.4 3.4 2.0 1.9 1.4 1.5 1.5 1.4 1.5 1.3
Primary (noninterest) expenditure 27.1 27.9 31.5 32.9 30.7 24.4 24.0 24.1 24.3 25.5 25.9
Automatic debt dynamics -4.0 -4.2 0.1 -0.6 -3.5 -8.8 -0.5 -0.8 -0.9 -0.5 0.1
Contribution from interest rate/growth differential -2.9 -2.4 -0.1 -0.9 -3.2 -8.3 -0.7 -1.0 -1.0 -0.5 0.1
of which: contribution from average real interest rate -0.6 0.1 1.6 0.5 -1.4 -2.5 0.1 -0.2 -0.2 0.0 0.1
of which: contribution from real GDP growth -2.2 -2.4 -1.7 -1.4 -1.8 -5.7 -0.8 -0.8 -0.8 -0.5 0.0
Contribution from real exchange rate depreciation -1.1 -1.9 0.2 0.3 -0.2 -0.6 0.2 0.2 0.1 ... ...
Other identified debt-creating flows 0.0 0.0 0.0 0.0 0.0 0.0 0.0 0.0 0.0 0.0 0.0
Privatization receipts (negative) 0.0 0.0 0.0 0.0 0.0 0.0 0.0 0.0 0.0 0.0 0.0
Recognition of implicit or contingent liabilities 0.0 0.0 0.0 0.0 0.0 0.0 0.0 0.0 0.0 0.0 0.0
Debt relief (HIPC and other) 0.0 0.0 0.0 0.0 0.0 0.0 0.0 0.0 0.0 0.0 0.0
Other 0.0 0.0 0.0 0.0 0.0 0.0 0.0 0.0 0.0 0.0 0.0
Residual, including asset changes 2.2 3.7 2.5 -0.5 -0.1 -1.0 -0.6 -0.7 -0.7 -1.3 -0.9
Other Sustainability Indicators
PV of public sector debt ... ... 24.3 28.5 30.6 22.9 22.9 22.4 21.8 13.9 3.1
of which: foreign-currency denominated ... ... 5.1 5.7 5.8 5.1 6.0 7.1 8.0 7.1 4.1
of which: external ... ... 5.1 5.7 5.8 5.1 6.0 7.1 8.0 7.1 4.1
PV of contingent liabilities (not included in public sector debt) ... ... ... ... ... ... ... ... ... ... ...
Gross financing need 3/ 6.3 6.0 12.3 18.1 17.5 11.4 10.3 9.2 8.9 0.6 0.3
PV of public sector debt-to-revenue and grants ratio (in percent) … … 82.4 103.1 120.5 102.5 101.3 97.6 94.1 54.3 11.8
PV of public sector debt-to-revenue ratio (in percent) … … 93.0 111.3 130.2 109.5 108.4 104.7 100.4 57.6 12.5
of which: external 4/ … … 19.3 22.2 24.8 24.2 28.2 33.1 37.0 29.2 16.4
Debt service-to-revenue and grants ratio (in percent) 5/ 14.8 15.2 19.3 19.4 17.6 12.6 11.9 9.8 10.0 3.0 1.7
Debt service-to-revenue ratio (in percent) 5/ 17.8 17.1 21.8 21.0 19.0 13.5 12.7 10.5 10.7 3.2 1.8
Primary deficit that stabilizes the debt-to-GDP ratio 1.9 0.5 -2.5 1.2 3.5 9.9 1.0 1.5 1.7 1.8 0.8
Key macroeconomic and fiscal assumptions
Real GDP growth (in percent) 7.7 10.7 8.1 5.8 3.0 5.4 6.3 21.4 3.3 3.4 3.5 7.2 3.0 3.0 3.1
Average nominal interest rate on forex debt (in percent) 1.6 1.5 1.7 2.4 0.7 1.5 1.7 1.9 1.8 1.7 1.7 1.7 2.2 16.8 6.1
Average real interest rate on domestic debt (in percent) -3.9 1.0 11.0 5.2 5.4 2.9 -6.5 -12.3 0.7 -1.1 -1.2 -2.9 -0.7 ... 9.1
Real exchange rate depreciation (in percent, + indicates depreciation) -10.0 -20.6 2.7 -7.9 8.4 3.7 ... ... ... ... ... ... ... ... ...
Inflation rate (GDP deflator, in percent) 9.9 4.3 -2.6 4.6 4.6 2.2 9.4 16.1 2.7 3.5 3.8 6.3 5.0 5.0 5.1
Growth of real primary spending (deflated by GDP deflator, in percent) -0.2 0.1 0.2 0.1 0.1 0.1 0.0 0.0 0.0 0.0 0.0 0.0 0.0 0.0 0.0
Grant element of new external borrowing (in percent) ... ... ... … … 39.9 38.8 38.3 38.1 37.6 37.6 38.4 34.6 34.6 ...
Sources: Papua New Guinea authorities; and IMF staff estimates and projections.
1/ Historical averages and standard deviations are generally derived over the past 10 years, subject to data availability.
2/ Indicate coverage of public sector, e.g., general government or nonfinancial public sector. Also whether net or gross debt is used.
3/ Gross financing need is defined as the primary deficit plus debt service plus the stock of short-term debt at the end of the last period.
4/ Revenues excluding grants.
5/ Debt service is defined as the sum of interest and amortization of medium- and long-term debt.
Actual Projections

PAPUA NEW GUINEA
INTERNATIONAL MONETARY FUND 43
Table 2.Papua New Guinea: Sensitivity Analysis for Key Indicators of Public Debt
2013-2033
(In percent)
2013 2014 2015 2016 2017 2018 2023 2033
Baseline 28 31 23 23 22 22 14 3
A. Alternative scenarios
A1. Real GDP growth and primary balance are at historical averages 28 22 11 5 -1 -7 -37 -77
A2. Primary balance is unchanged from 2013 28 31 26 30 34 38 58 125
A3. Permanently lower GDP growth 1/ 28 31 24 24 24 25 24 44
B. Bound tests
B1. Real GDP growth is at historical average minus one standard deviation in 2014-2015 28 33 34 39 43 47 68 129
B2. Primary balance is at historical average minus one standard deviation in 2014-2015 28 27 20 20 19 19 10 -1
B3. Combination of B1-B2 using one half standard deviation shocks 28 25 17 21 25 28 43 88
B4. One-time 30 percent real depreciation in 2014 28 33 25 25 24 23 17 9
B5. 10 percent of GDP increase in other debt-creating flows in 2014 28 41 32 32 32 31 24 16
Baseline 103 121 102 101 98 94 54 12
A. Alternative scenarios
A1. Real GDP growth and primary balance are at historical averages 103 85 50 23 -4 -31 -145 -298
A2. Primary balance is unchanged from 2013 103 121 118 134 150 165 227 478
A3. Permanently lower GDP growth 1/ 103 122 105 106 106 106 92 168
B. Bound tests
B1. Real GDP growth is at historical average minus one standard deviation in 2014-2015 103 128 148 168 185 203 262 488
B2. Primary balance is at historical average minus one standard deviation in 2014-2015 103 107 89 87 84 80 40 -5
B3. Combination of B1-B2 using one half standard deviation shocks 103 98 77 93 106 120 164 335
B4. One-time 30 percent real depreciation in 2014 103 130 110 109 105 101 68 36
B5. 10 percent of GDP increase in other debt-creating flows in 2014 103 161 142 141 138 135 94 60
Baseline 19 18 13 12 10 10 3 2
A. Alternative scenarios
A1. Real GDP growth and primary balance are at historical averages 19 18 8 3 -7 -14 -43 -72
A2. Primary balance is unchanged from 2013 19 18 13 13 15 20 39 112
A3. Permanently lower GDP growth 1/ 19 18 13 12 11 11 10 36
B. Bound tests
B1. Real GDP growth is at historical average minus one standard deviation in 2014-2015 19 18 16 17 19 25 46 114
B2. Primary balance is at historical average minus one standard deviation in 2014-2015 19 18 11 9 6 6 -1 -3
B3. Combination of B1-B2 using one half standard deviation shocks 19 18 10 7 2 5 22 77
B4. One-time 30 percent real depreciation in 2014 19 18 13 13 11 11 6 7
B5. 10 percent of GDP increase in other debt-creating flows in 2014 19 18 19 21 20 21 13 14
Sources: Papua New Guinea authorities; and IMF staff estimates and projections.
1/ Assumes that real GDP growth is at baseline minus one standard deviation divided by the square root of the length of the projection period.
2/ Revenues are defined inclusive of grants.
PV of Debt-to-GDP Ratio
Projections
PV of Debt-to-Revenue Ratio 2/
Debt Service-to-Revenue Ratio 2/

PAPUA NEW GUINEA
44 INTERNATIONAL MONETARY FUND
Table 3a.: External Debt Sustainability Framework, Baseline Scenario, 2010-2033 1/
(In percent of GDP, unless otherwise indicated)
Historical2/
Standard2/
Average Deviation 2013-2018 2019-2033
2010 2011 2012 2013 2014 2015 2016 2017 2018 Average 2023 2033 Average
External debt (nominal) 1/ 71.0 86.5 129.1 120.2 101.8 68.8 61.5 53.2 48.6 20.3 0.6
of which: public and publicly guaranteed (PPG) 10.1 6.8 7.4 8.1 7.8 6.9 8.1 9.5 10.5 6.8 0.5
Change in external debt 34.8 15.5 42.6 -8.9 -18.4 -33.0 -7.3 -8.3 -4.6 -4.7 -0.1
Identified net debt-creating flows 9.7 -1.9 25.6 14.8 -16.4 -31.0 -14.1 -13.4 -12.2 -8.2 -3.2
Non-interest current account deficit 19.5 22.5 49.5 7.0 19.5 25.7 0.8 -12.9 -9.7 -9.2 -8.2 -5.5 -1.5 -3.8
Deficit in balance of goods and services 12.4 21.1 35.9 14.7 -2.4 -21.5 -20.8 -20.3 -19.2 -15.0 -10.2
Exports 63.5 56.5 43.5 39.7 42.5 52.4 50.8 49.9 48.6 41.6 32.1
Imports 75.8 77.6 79.4 54.4 40.1 30.9 30.0 29.6 29.4 26.6 21.9
Net current transfers (negative = inflow) -2.0 -1.9 -1.1 -3.6 2.4 -0.8 -1.1 -0.7 -0.7 -0.7 -0.8 -1.2 0.1 -0.6
of which: official -2.8 -3.1 -2.8 -2.5 -2.1 -1.5 -1.5 -1.5 -1.5 -1.5 -1.3
Other current account flows (negative = net inflow) 9.0 3.3 14.7 11.8 4.4 9.3 11.8 11.8 11.8 10.7 8.6
Net FDI (negative = inflow) -5.7 -8.0 -12.4 -5.8 5.6 -5.6 -11.6 -2.6 -2.6 -2.6 -2.5 -2.2 -1.8 -2.1
Endogenous debt dynamics 3/ -4.1 -16.4 -11.4 -5.3 -5.6 -15.5 -1.8 -1.6 -1.4 -0.5 0.1
Contribution from nominal interest rate 1.9 1.0 1.5 1.2 1.1 0.6 0.4 0.4 0.3 0.2 0.1
Contribution from real GDP growth -2.3 -5.7 -6.0 -6.6 -6.8 -16.1 -2.2 -2.0 -1.8 -0.7 0.0
Contribution from price and exchange rate changes -3.7 -11.7 -7.0 … … … … … … … …
Residual (3-4) 4/ 25.1 17.4 17.0 -23.8 -2.0 -2.0 6.9 5.1 7.5 3.5 3.1
of which: exceptional financing 0.0 0.0 0.0 0.0 0.0 0.0 0.0 0.0 0.0 0.0 0.0
PV of external debt 5/ ... ... 126.7 117.8 99.9 67.0 59.3 50.8 46.1 20.7 4.1
In percent of exports ... ... 291.5 296.7 234.9 127.7 116.8 101.7 94.8 49.6 12.8
PV of PPG external debt ... ... 5.1 5.7 5.8 5.1 6.0 7.1 8.0 7.1 4.1
In percent of exports ... ... 11.6 14.3 13.7 9.7 11.7 14.2 16.5 17.0 12.7
In percent of government revenues ... ... 19.3 22.2 24.8 24.2 28.2 33.1 37.0 29.2 16.4
Debt service-to-exports ratio (in percent) 15.5 16.2 15.4 9.0 31.6 15.8 15.7 17.5 9.9 9.2 1.5
PPG debt service-to-exports ratio (in percent) 1.4 1.2 1.4 1.4 1.2 0.7 0.7 0.7 0.9 1.1 1.4
PPG debt service-to-revenue ratio (in percent) 3.3 2.4 2.4 2.1 2.2 1.7 1.6 1.6 2.0 1.9 1.8
Total gross financing need (Billions of U.S. dollars) 2.3 3.0 6.6 3.8 0.5 -1.8 -1.1 -0.8 -1.6 -1.3 -1.5
Non-interest current account deficit that stabilizes debt ratio -15.3 6.9 6.8 34.7 19.2 20.1 -2.5 -0.9 -3.6 -0.8 -1.4
Key macroeconomic assumptions
Real GDP growth (in percent) 7.7 10.7 8.1 5.8 3.0 5.4 6.3 21.4 3.3 3.4 3.5 7.2 3.0 3.0 3.1
GDP deflator in US dollar terms (change in percent) 11.3 19.7 8.8 11.2 6.9 1.2 5.3 11.7 -1.3 -0.5 0.2 2.8 1.9 1.8 1.8
Effective interest rate (percent) 6/ 6.4 1.9 2.1 3.2 1.3 1.0 1.1 0.8 0.7 0.7 0.7 0.8 0.9 16.2 5.2
Growth of exports of G&S (US dollar terms, in percent) 30.9 17.9 -9.6 14.5 17.4 -2.6 19.8 67.2 -1.2 1.1 0.9 14.2 2.2 2.3 2.1
Growth of imports of G&S (US dollar terms, in percent) 40.1 35.5 20.3 21.6 13.0 -26.9 -17.5 4.5 -1.1 1.5 3.0 -6.1 3.0 2.8 2.9
Grant element of new public sector borrowing (in percent) ... ... ... ... ... 39.9 38.8 38.3 38.1 37.6 37.6 38.4 34.6 34.6 34.6
Government revenues (excluding grants, in percent of GDP) 26.0 27.1 26.2 25.6 23.5 20.9 21.1 21.4 21.7 24.2 24.7 24.4
Aid flows (in Billions of US dollars) 7/ 0.6 0.5 0.8 0.5 0.6 0.6 0.8 0.9 0.9 0.6 0.8
of which: Grants 0.5 0.4 0.5 0.3 0.3 0.4 0.4 0.4 0.4 0.5 0.7
of which: Concessional loans 0.1 0.0 0.2 0.2 0.2 0.3 0.4 0.5 0.5 0.1 0.1
Grant-equivalent financing (in percent of GDP) 8/ ... ... ... 2.8 2.5 2.0 2.1 2.3 2.2 1.6 1.4 1.6
Grant-equivalent financing (in percent of external financing) 8/ ... ... ... 71.7 71.5 68.9 66.7 63.9 62.8 86.1 91.3 87.3
Memorandum items:
Nominal GDP (Billions of US dollars) 9.7 12.9 15.1 16.1 18.1 24.5 25.0 25.7 26.7 34.1 55.1
Nominal dollar GDP growth 19.9 32.4 17.6 6.7 11.9 35.6 2.0 2.9 3.7 10.5 4.9 4.9 5.0
PV of PPG external debt (in Billions of US dollars) 0.8 0.9 1.0 1.2 1.5 1.8 2.1 2.4 2.2
(PVt-PVt-1)/GDPt-1 (in percent) 0.9 0.8 1.0 1.0 1.3 1.3 1.0 0.1 -0.1 0.0
Gross workers' remittances (Billions of US dollars) -0.1 -0.2 -0.3 -0.3 -0.2 -0.2 -0.2 -0.2 -0.2 -0.1 -0.8
PV of PPG external debt (in percent of GDP + remittances) ... ... 5.1 5.8 5.9 5.1 6.0 7.1 8.1 7.1 4.1
PV of PPG external debt (in percent of exports + remittances) ... ... 12.1 15.0 14.1 9.8 11.9 14.4 16.8 17.1 13.3
Debt service of PPG external debt (in percent of exports + remittances) ... ... 1.5 1.4 1.2 0.7 0.7 0.7 0.9 1.1 1.4
Sources: Papua New Guinea authorities; and IMF staff estimates and projections.0
1/ Includes both public and private sector external debt.
2/ Historical averages and standard deviations are generally derived over the past 10 years, subject to data availability.
3/ Derived as [r - g - ρ(1+g)]/(1+g+ρ+gρ) times previous period debt ratio, with r = nominal interest rate; g = real GDP growth rate, and ρ = growth rate of GDP deflator in U.S. dollar terms.
4/ Includes exceptional financing (i.e., changes in arrears and debt relief); changes in gross foreign assets; and valuation adjustments. For projections also includes contribution from price and exchange rate changes.
5/ Assumes that PV of private sector debt is equivalent to its face value.
6/ Current-year interest payments divided by previous period debt stock.
7/ Defined as grants, concessional loans, and debt relief.
8/ Grant-equivalent financing includes grants provided directly to the government and through new borrowing (difference between the face value and the PV of new debt).
Actual Projections

PAPUA NEW GUINEA
INTERNATIONAL MONETARY FUND 45
Table 3b.Papua New Guinea: Sensitivity Analysis for Key Indicators of Public and Publicly
Guaranteed External Debt, 2013-2033
(In percent)
2013 2014 2015 2016 2017 2018 2023 2033
Baseline 6 6 5 6 7 8 7 4
A. Alternative Scenarios
A1. Key variables at their historical averages in 2013-2033 1/ 6 13 24 30 35 39 40 25
A2. New public sector loans on less favorable terms in 2013-2033 2/ 6 6 6 7 8 10 9 7
B. Bound Tests
B1. Real GDP growth at historical average minus one standard deviation in 2014-2015 6 6 6 7 8 10 9 5
B2. Export value growth at historical average minus one standard deviation in 2014-2015 3/ 6 11 27 29 30 31 27 13
B3. US dollar GDP deflator at historical average minus one standard deviation in 2014-2015 6 6 5 6 7 9 8 4
B4. Net non-debt creating flows at historical average minus one standard deviation in 2014-2015 4/ 6 13 12 13 14 15 13 7
B5. Combination of B1-B4 using one-half standard deviation shocks 6 14 31 32 34 35 30 15
B6. One-time 30 percent nominal depreciation relative to the baseline in 2014 5/ 6 8 7 8 10 11 10 6
Baseline 14 14 10 12 14 17 17 13
A. Alternative Scenarios
A1. Key variables at their historical averages in 2013-2033 1/ 14 31 45 60 71 81 97 79
A2. New public sector loans on less favorable terms in 2013-2033 2/ 14 14 11 14 17 20 23 22
B. Bound Tests
B1. Real GDP growth at historical average minus one standard deviation in 2014-2015 14 13 9 11 14 16 17 12
B2. Export value growth at historical average minus one standard deviation in 2014-2015 3/ 14 32 111 120 127 136 136 86
B3. US dollar GDP deflator at historical average minus one standard deviation in 2014-2015 14 13 9 11 14 16 17 12
B4. Net non-debt creating flows at historical average minus one standard deviation in 2014-2015 4/ 14 31 23 25 28 31 31 21
B5. Combination of B1-B4 using one-half standard deviation shocks 14 37 87 95 101 108 107 68
B6. One-time 30 percent nominal depreciation relative to the baseline in 2014 5/ 14 13 9 11 14 16 17 12
Baseline 22 25 24 28 33 37 29 16
A. Alternative Scenarios
A1. Key variables at their historical averages in 2013-2033 1/ 22 56 113 143 166 181 166 102
A2. New public sector loans on less favorable terms in 2013-2033 2/ 22 26 27 33 40 46 39 28
B. Bound Tests
B1. Real GDP growth at historical average minus one standard deviation in 2014-2015 22 25 29 34 40 45 35 20
B2. Export value growth at historical average minus one standard deviation in 2014-2015 3/ 22 47 130 135 140 143 110 52
B3. US dollar GDP deflator at historical average minus one standard deviation in 2014-2015 22 25 26 30 35 39 31 17
B4. Net non-debt creating flows at historical average minus one standard deviation in 2014-2015 4/ 22 56 57 61 66 69 53 27
B5. Combination of B1-B4 using one-half standard deviation shocks 22 58 147 153 158 162 124 59
B6. One-time 30 percent nominal depreciation relative to the baseline in 2014 5/ 22 34 33 39 45 51 40 23
PV of debt-to-exports ratio
PV of debt-to-revenue ratio
PV of debt-to GDP ratio
Projections

PAPUA NEW GUINEA
46 INTERNATIONAL MONETARY FUND
Table 3b.Papua New Guinea: Sensitivity Analysis for Key Indicators of Public and Publicly
Guaranteed External Debt, 2013-2033 (concluded)
(In percent)
Baseline 1 1 1 1 1 1 1 1
A. Alternative Scenarios
A1. Key variables at their historical averages in 2013-2033 1/ 1 1 1 2 2 2 4 4
A2. New public sector loans on less favorable terms in 2013-2033 2/ 1 1 1 1 1 1 2 2
B. Bound Tests
B1. Real GDP growth at historical average minus one standard deviation in 2014-2015 1 1 1 1 1 1 1 1
B2. Export value growth at historical average minus one standard deviation in 2014-2015 3/ 1 1 2 4 4 5 11 10
B3. US dollar GDP deflator at historical average minus one standard deviation in 2014-2015 1 1 1 1 1 1 1 1
B4. Net non-debt creating flows at historical average minus one standard deviation in 2014-2015 4/ 1 1 1 1 1 1 2 2
B5. Combination of B1-B4 using one-half standard deviation shocks 1 1 2 3 3 4 8 8
B6. One-time 30 percent nominal depreciation relative to the baseline in 2014 5/ 1 1 1 1 1 1 1 1
Baseline 2 2 2 2 2 2 2 2
A. Alternative Scenarios
A1. Key variables at their historical averages in 2013-2033 1/ 2 2 3 4 4 5 7 5
A2. New public sector loans on less favorable terms in 2013-2033 2/ 2 2 2 2 2 2 3 3
B. Bound Tests
B1. Real GDP growth at historical average minus one standard deviation in 2014-2015 2 2 2 2 2 2 2 2
B2. Export value growth at historical average minus one standard deviation in 2014-2015 3/ 2 2 2 5 5 5 9 6
B3. US dollar GDP deflator at historical average minus one standard deviation in 2014-2015 2 2 2 2 2 2 2 2
B4. Net non-debt creating flows at historical average minus one standard deviation in 2014-2015 4/ 2 2 2 3 3 3 4 3
B5. Combination of B1-B4 using one-half standard deviation shocks 2 2 3 5 5 6 10 7
B6. One-time 30 percent nominal depreciation relative to the baseline in 2014 5/ 2 3 2 2 2 3 3 2
Memorandum item:
Grant element assumed on residual financing (i.e., financing required above baseline) 6/ 34 34 34 34 34 34 34 34
Sources: Papua New Guinea authorities; and IMF staff estimates and projections.
1/ Variables include real GDP growth, growth of GDP deflator (in U.S. dollar terms), noninterest current account in percent of GDP, and non-debt-creating flows.
2/ Assumes that the interest rate on new borrowing is 2 percentage points higher than in the baseline, while grace and maturity periods are the same as in the baseline.
3/ Export values are assumed to remain permanently at the lower level, but the current account as a share of GDP is assumed to return to its baseline level after
the shock (implicitly assuming an offsetting adjustment in import levels).
4/ Includes official and private transfers and FDI.
5/ Depreciation is defined as percentage decline in dollar/local currency rate, such that it never exceeds 100 percent.
6/ Applies to all stress scenarios except for A2 (less favorable financing) in which the terms on all new financing are as specified in footnote 2.
Debt service-to-revenue ratio
Debt service-to-exports ratio

INTERNATIONAL MONETARY FUND 1
PAPUA NEW GUINEA
STAFF REPORT FOR THE 2013 ARTICLE IV
CONSULTATION—INFORMATIONAL ANNEX
Prepared By
Asia and Pacific Department
(In collaboration with other departments, the World Bank
and the Asian Development Bank)
FUND RELATIONS _______________________________________________________________________ 2
RELATIONS WITH THE PACIFIC FINANCIAL TECHNICAL ASSISTANCE CENTRE ______ 5
JOINT MATRIX OF BANK-FUND COLLABORATION ___________________________________ 7
RELATIONS WITH THE ASIAN DEVELOPMENT BANK _________________________________ 8
STATISTICAL ISSUES ___________________________________________________________________ 10
CONTENTS
October 24, 2013

PAPUA NEW GUINEA
2 INTERNATIONAL MONETARY FUND
FUND RELATIONS (As of September 30, 2013)
Membership Status
Joined: October 9, 1975; Article VIII
General Resources Account
SDR Million Percent Quota
Quota 131.60 100.00
Fund holdings of currency 131.16 99.67
Reserve position in Fund 0.44 0.33
SDR Department
SDR Million Percent Allocation
Net cumulative allocation 125.49 100.00
Holdings 9.35 7.45
Outstanding Purchases and Loans
SDR Million Percent Quota
0.00 0.00
Latest Financial Arrangements
Type
Approval
Date
Expiration
Date
Amount
Approved
(SDR million)
Amount
Drawn
(SDR
million)
Stand-by 3/29/2000 9/28/2001 85.54 85.54
Stand-by 7/14/1995 12/15/1997 71.48 35.34
Stand-by 7/31/1991 9/30/1992 26.36 0.00
Projected Payments to Fund1
(SDR million; based on existing use of resources and present
holding of SDRs):
Forthcoming
2013 2014 2015 2016 2017
Principal
Charges/interest 0.02 0.08 0.08 0.08 0.08
Total 0.02 0.08 0.08 0.08 0.08
1 When a member has overdue financial obligations outstanding for
more than three months, the amount of such arrears will be shown
in this section.

PAPUA NEW GUINEA
INTERNATIONAL MONETARY FUND 3
Safeguards Assessments
Under the Fund's Safeguards Assessments policy, the Bank of Papua New Guinea (BPNG) was
subject to a transitional assessment based on its Stand-By Arrangement with the Fund, which was
approved in March 2000 and expired in September 2001. The transitional assessment was
completed on May 4, 2001 and recommendations were made to alleviate identified weaknesses.
Currently, the BPNG is not subject to the Safeguards Assessments policy.
Exchange Rate Arrangement
Papua New Guinea has a floating exchange rate arrangement; the exchange rate of the kina is
determined in the interbank market in which authorized banks participate. Papua New Guinea has
accepted the obligations of Article VIII, Sections 2, 3, and 4, and maintains an exchange system free
of restrictions on payments and transfers for current international transactions.
Article IV Consultations
The 2012 Article IV consultation discussions were held during February 16–28, 2012. It was
concluded by the Executive Board on May 14, 2012 (IMF Country Report No. 12/126). Papua New
Guinea is on the 12–month cycle.
Technical Assistance from Headquarters
FAD: A joint FAD/PFTAC mission in March 2000 assisted the authorities in preparing a Report on the
Observance of Standards and Codes Fiscal Transparency Module, published in October 2000. A
mission in December 2000 provided advice on the reconciliation of large and volatile differences in
fiscal reporting based on information provided by the Treasury Department and information
reported by the Bank of Papua New Guinea. A mission in February 2002 assessed progress in
improving fiscal transparency. A joint FAD/PFTAC mission visited PNG to provide advice on the
sovereign wealth fund management in May 2011. A mission in March 2013 provided advice on
reform of the extractive industries fiscal regime.
LEG: A mission in November 2005 provided advice on the drafting of a tax administration law. A
mission in July 2006 provided a comprehensive program of assistance in the development of the
AML/CFT regime, including legislative drafting and capacity building. A mission in August-
September 2007 assisted the authorities in finalizing the terms of the Revenue Administration Bill.
MFD/MCM: Technical assistance through peripatetic visits was delivered on bank regulation and
supervision (2001, February-March 2007, July–August 2009, and February 2010), medium-term
monetary policy formulation (October 2004 and September 2005), reserve management (June 2006,
September 2007, March/July–August 2009, January–February 2010), internal audits (2004, August
2007), accounting (September-October 2006, February 2007, February–March/June–July/November
2009), liquidity management (January 2009), monetary and forex operations (July–August 2009,
February 2010), macroprudential oversight and financial stability (September 2012), and the
sovereign wealth fund (July 2013).

PAPUA NEW GUINEA
4 INTERNATIONAL MONETARY FUND
STA: A mission reviewed monetary and financial statistics in April 2005 and a follow-up mission took
place in May 2006. Subsequently, a multisector statistics mission visited in September 2006 followed
by a high-level STA visit in December 2007. Two follow-up missions in balance of payments took
place in June 2008 and November 2009 and three follow-up missions in monetary and financial
statistics took place in April 2008, November 2009, and May 2010. In 2012, three missions provided
advice on GDDS metadata, government finance statistics, and the balance of payments. In May-June
2013, a mission reviewed balance of payments and the international investment position. To support
migration to GFSM 2001, a training mission was conducted in May 2013.
Resident Representative:
The Regional Resident Representative Office for Pacific Island Countries based in Suva, Fiji was
opened on September 13, 2010 and the office covers Fiji, Kiribati, Marshall Islands, Micronesia,
Palau, Papua New Guinea, Samoa, Solomon Islands, Tonga, Tuvalu, and Vanuatu. Mr. Yongzheng
Yang is the resident representative.

PAPUA NEW GUINEA
INTERNATIONAL MONETARY FUND 5
RELATIONS WITH THE PACIFIC FINANCIAL TECHNICAL
ASSISTANCE CENTRE
(As of September 2013)
The Pacific Financial Technical Assistance Centre (PFTAC) in Suva, Fiji, is a regional technical
assistance institution operated by the IMF with financial support of the Asian Development Bank,
Australia, Korea, the European Union, and New Zealand. The Center’s aim is to build skills and
institutional capacity for effective economic and financial management that can be sustained at the
national level. Member countries are: Cook Islands, Federated States of Micronesia, Fiji, Kiribati,
Marshall Islands, Nauru, Niue, Palau, Papua New Guinea, Samoa, Solomon Islands, Timor Leste,
Tokelau, Tonga, Tuvalu, and Vanuatu.
A. Public Financial Management
The PFTAC assisted in the preparation of a ROSC, which was published in October 2000. The PFTAC
PFM Advisor has participated in occasional FAD technical assistance missions, and an attachment of
one PNG official to PFTAC was completed in April 2007. PNG participated, with four officials, in the
U.S. Treasury study visit in September 2008. In May 2011, the PFTAC macroeconomic advisor
participated in an FAD mission on advising PNG on the SWF. In July 2013, a PFTAC PFM Advisor
visited PNG at the request of the Treasury Minister to review the budget preparation process, and
discuss with authorities plans for training in the PEFA methodology, and tentative scheduling for a
PEFA in 2014.
B. Tax Administration and Policy
PNG is supported by the Australian Taxation Office (ATO) and has a number of long-term in-country
ATO advisers. The Internal Revenue Commission (IRC) has additional support under the ATO / IRC
twinning program and several other internationally and locally funded international advisers. IMF
HQ has provided strategic advice to the IRC in the Natural Resources area and support will continue
in this area should the authorities wish to undertake reform. PNG will be encouraged to take a
stronger role in supporting regional tax reform and sharing training opportunities provided by the
ATO with fellow PIC tax administrators.
C. Financial Sector Regulation and Supervision
There is no current PFTAC involvement in this area. In October 2005, the BPNG hosted the annual
meeting of the Association of Financial Supervisors of Pacific Countries, for which PFTAC is the
secretariat. In March 2007, PFTAC funded an attachment for two supervisors from the Bank of Papua
New Guinea to assist the Cook Islands’ supervisory authority to undertake an on-site examination of
a domestic bank. In 2008, PFTAC funded an attachment of one supervisor to assist the Reserve Bank
of Fiji under an on-site examination of a local branch of a PNG-based bank.
PAPUA NEW GUINEA
6 INTERNATIONAL MONETARY FUND
D. Economic and Financial Statistics
In February 2006, an Advisor briefly assessed the BOP compilation with a view to improving its
quality, and to assessing progress with regard to recommendations made by previous missions. A
multisector statistics mission in September 2006 assessed the statistical systems (BOP, national
accounts, prices statistics, government finance statistics, and monetary statistics), with the PFTAC
Advisor assessing the national accounts and providing overall coordination. In 2008 and 2009 the
Advisor undertook BOP statistics missions to review statistics prerequisites, progress in improving
compilation methods and source data, as well as to assist BPNG statistics staff in assessing the
feasibility of electronic data collection. A PFTAC Advisor conducted a mission during August 2013 to
start reviewing the methodologies and data sources used for the compilation of national accounts
statistics.
E. Macroeconomic Analysis
Following a request by the BPNG for assistance in building up financial programming capacity,
starting in 2011 a PFTAC work program together with BPNG staff created a number of tools such as
empirical output gap measures and inflation models as inputs into a financial programming
framework, followed by the development of a PNG-specific financial programming framework in
2012 and 2013. Training in the use and updating of the framework was provided to staffs of both
BPNG and the Department of Treasury, most recently in August 2013. Staffs from both institutions
also benefited from training in financial programming techniques provided jointly by PFTAC and the
Singapore Regional Training Institute during a regional workshop in Fiji in December 2012. A
separate work program with the Department of Treasury and BPNG developed in collaboration with
the APD country team and the IMF’s Research Department modeling tools for exploring the
macroeconomic impact of the surge in natural resource revenues that is expected as the LNG
project enters into production. Two workshops for rolling out the resulting model and providing
training in its use were held in 2011 and 2012 respectively. Results were shared with a broader
public through a seminar organized by a local research institute in 2013.

PAPUA NEW GUINEA
INTERNATIONAL MONETARY FUND 7
JOINT MATRIX OF BANK-FUND COLLABORATION
Papua New Guinea: JMAP Implementation Table
Title Products Provisional Timing
of Missions
Delivery Date (tentative)
A. Mutual Information on Relevant Work Programs
Bank work
program
Papua New Guinea Economic Briefing
(two per year)
Published online in Q2 2012, Q1 2013 and
Q4 2013.
Papua New Guinea Economic Policy
Notes
Ongoing irregular series of notes. Note
presented to the PNG government
December 2012.
Support for analysis and dissemination of
the 2009-2010 Papua New Guinea
Household Income and Expenditure
Survey
Ongoing Statistical abstract disseminated August
2012. Ongoing series of notes and materials
presented to GoPNG (June 2012, October
2012, May 2013, August 2013).
Support for the development and
implementation of the PNG Sovereign
Wealth Fund
Ongoing October 2012, January 2013.
Social protection technical assistance Ongoing Policy Brief highlighting key considerations
with regard to social pensions presented
September 2013.
Cost of crime and violence Ongoing Notes presented July 2012, October 2013,
with further notes expected H1 2014.
Education public expenditure review Ongoing Notes disseminated in December 2012 and
August 2013. Further dissemination
expected in January 2014.
Health financing and resourcing analysis:
(1) analysis of rural health financing; (2)
review of expenditure by provincial
administrations on front line rural health
Ongoing Dissemination of policy notes and report on
expenditure by provincial administrations
October 2013, and rural health financing by
December 2013.
IMF work
program
2013 Staff Visit June 2013
2013 Article IV mission August-September 2013 Board discussion expected in December
2013
B. Request for Work Program Inputs
Fund request to Bank Information sharing Semi-annual or more frequent Ongoing
Bank request to Fund Information sharing Semi-annual or more frequent Ongoing

PAPUA NEW GUINEA
8 INTERNATIONAL MONETARY FUND
RELATIONS WITH THE ASIAN DEVELOPMENT BANK
(As of August 31, 2013)
Papua New Guinea (PNG) joined the Asian Development Bank (AsDB) in 1971. The AsDB has
approved 79 loans to PNG totaling $1,624.3 million for 54 projects, of which 32 loans ($824.1million)
have been extended from Ordinary Capital Resources (OCR) and 47 loans ($800.3 million) from the
Asian Development Fund (ADF). ADF resources were also used for one grant amounting to $15
million. In addition, $63.4 million has been provided for 149 technical assistance projects. The AsDB’s
active portfolio in PNG is $867.6 million comprising 20 public sector loans to finance 10 projects
($716.4 million); eight grants ($76.9 million); 9 technical assistance projects ($8.3 million); two private
sector loans ($58 million); and a private sector equity investment ($8.0 million).
In August 2010, the AsDB and the Government of PNG agreed on a new country partnership
strategy, 2011–2015. The strategy was developed in close consultation with the government and
other stakeholders, and is well aligned to the government’s Development Strategic Plan (DSP),
2010–2030 and the Medium-Term Development Plan, 2011–2015. It centers on infrastructure
improvements and other measures to help PNG plan and implement a successful transition through
the conversion of its natural resources wealth into inclusive economic growth.
In 2012 and 2013, the AsDB approved 3 public sector loans of $107.9 million to finance two projects;
i) the Maritime and Waterways Safety Project, and ii) the Port Moresby Power Grid Development
Project. The AsDB’s ongoing lending activities support road, seaport, and airport rehabilitation and
improvement; community water transport; renewable power generation and transmission; rural
health services delivery; access to microfinance; and expansion of telecommunication services. The
AsDB provides technical assistance in all these areas to improve policy, capacity, and knowledge. The
AsDB also finances experts and programs to improve the government’s public financial
management, and to mitigate and adapt to climate change risks.
The AsDB’s lending to PNG for 2013–2015 is expected to remain a blend of OCR and ADF resources.
The AsDB's ADF allocation for PNG for 2013–2015 totals approximately $180 million and OCR
lending is expected to be approximately $230 million. Indicative Nonlending assistance for 2013–
2015 totals $6 million.
Creating a conducive environment for private sector development is also a strategic priority. The
AsDB’s Pacific Private Sector Development Initiative (PSDI) is currently working with the Government
of PNG to (i) expand access to finance through branchless banking and the implementation of a
secured transactions framework; (ii) increase the efficiency of services provided by state-owned
enterprises through performance benchmarking, policy reforms, capacity building and advocacy; (iii)
promote greater use of public private partnerships (PPPs) through the development of a legal
framework and associated institutions; and (iv) support the assessment of PPP opportunities for
major infrastructure projects. PSDI has recently been funded for a further six years of operation and

PAPUA NEW GUINEA
INTERNATIONAL MONETARY FUND 9
will be expanding its work areas including business law reform, promotion of competition, and
economic empowerment of women.
Papua New Guinea: Public Sector Loan Approvals and Disbursements, 2004–2013
(In millions of U.S. dollars)
2004 2005 2006 2007 2008 2009 2010 2011 2012 20131
Loan approvals 19.0 0.0 53.0 100.0 100.0 120.0 70.3 195.8 41.5 66.5
Loan disbursements 19.2 21.5 29.3 27.4 19.8 17.4 27.9 26.2 89.3 89.1
Source: Asian Development Bank 1 2013 disbursements are as at August 31, 2013.

PAPUA NEW GUINEA
10 INTERNATIONAL MONETARY FUND
STATISTICAL ISSUES
(As of September 30, 2013)
A. Assessment of Data Adequacy for Surveillance
General: Data provision has significant shortcomings, but is broadly adequate for surveillance. Most
affected areas are: national accounts, fiscal accounts, and balance of payments.
National accounts: The accuracy and reliability of the statistics are affected by inadequate source
data. The most recent official national accounts statistics were published by the National Statistical
Office (NSO) for National Income, Expenditure and Product, for reference years 1993–98. These
estimates were compiled using the 1968 System of National Accounts (SNA). Subsequently, a
preliminary set of national accounts (NA) estimates using the 1993 SNA for 1994–2004, rebased to
1998 prices, was compiled. However, as these estimates were still in need of substantial
improvements, the 2006 STA multisector mission recommended against publication of the new GDP
statistics until the needed revisions were made. No further data have been provided by the NSO to
STA since that time. In an attempt to fill the vacuum, the Treasury department began estimating the
NA since reference year 2002. The Bank of Papua New Guinea also compiles, but does not publish,
its own estimates of GDP. A technical assistance mission was conducted by PFTAC during August
2013 to start reviewing the methodologies and the data sources used to compile the national
accounts statistics. The mission identified significant shortcomings. In the short term, PFTAC will
provide TA to strengthen capacities and improve cooperation between compiling organizations.
Reforming the NSO will be necessary to resume regular data collection and compilation of national
accounts statistics by the official agency.
Price statistics: The NSO currently compiles a quarterly wholesale price index (which it does not
publish) and a quarterly consumer price index that is based on weights that are thirty-five years old.
These out-of-date weights have significantly reduced the accuracy of CPI estimates. With assistance
from the Secretariat of the Pacific Community, the NSO has recently completed price data collection,
documentation, and publication of the survey results for the 2009-10 Household Income
Expenditure Survey (HIES) that is needed to rebase the CPI.
Government finance statistics: Annual GFS have not been reported to STA since 2002. Data
received to that point in time suffered from insufficient coverage and timeliness. Central
government tax revenue, nontax revenue, and public expenditure data are deficient. Development
budget expenditures and the utilization of grants and project loans are recorded with long lags, and
few records on the use of trust accounts are available. Tax revenues collected by authorities (extra-
budgetary units) are generally not reflected in the central government’s financial information; this
includes the portion of value-added tax directly transferred to provinces by the revenue agency.
While interest payment records are accurate, there are timing issues regarding the recording of
interest on discounted securities. These weaknesses contribute to discrepancies in domestic
financing between estimates from monetary and debt data and those derived from fiscal records. In

PAPUA NEW GUINEA
INTERNATIONAL MONETARY FUND 11
the 2013 Budget report, the Papua New Guinea Government announced that it intends to migrate
to GFSM 2001, with a goal of using this methodology for budget estimate and outturn presentations
in the future. As part of this commitment, the authorities are participating in the Japan Administered
Account (JSA)-funded three-year regional GFS capacity-building project. It is anticipated that a total
of 6 missions to PNG will be conducted under this project, the first of which was a training mission
conducted in May 2013.
Monetary statistics: Monetary data are now being produced and reported to STA on a regular
basis. Progress has been achieved by the BPNG in many areas in the collection, compilation, and
dissemination of monetary and financial statistics (MFS), leading to the introduction of the
standardized report form (SRF) for the central bank, other depository corporations (ODCs), and the
other financial corporations (OFCs). The 2013 mission introduced general insurance companies in
the institutional coverage of the other financial corporations and also introduced the improved SRF
for OFCs. Most of the monetary statistics are currently aligned to the Monetary and Financial
Statistics Manual (MFSM) in International Financial Statistics.
Balance of payments statistics: Annual balance of payments data are derived from the
International Transactions Reporting System (ITRS), which is not tightly monitored despite the BPNG
reporting requirements. There are marked differences between the official data on exports and
imports of goods and those reported by trading partners. The financial accounts data are of poor
quality because of major deficiencies in data collection, especially in the area of private external debt
and foreign direct investment. Quarterly data are also published by the BPNG. The 2006 STA
multisector mission identified as a priority the strengthening of current account estimates, including
through improved classification of investment earnings, trade credits, and grant receipts as well as
enhancing source data for imports and exports. Progress is being made in implementing the
recommendations from the PFTAC’s BOP missions in June 2008 and November 2009. PNG has been
one of the beneficiaries of the Japan Administered Account Project on the improvement of external
sector statistics. A TA mission under this project was conducted in 2013, with more missions
planned.
B. Standards and Quality
PNG participated in the General Data Dissemination System (GDDS) in 2012.
C. Reporting to STA
Papua New Guinea last reported government finance statistics for publication in the Government
Finance Statistics Yearbook and in International Financial Statistics for 1999–2002; cover only the
budgetary central government.
Monetary data are reported to STA for publication in IFS on a regular monthly basis.
Balance of payments data for 2010 were reported to STA for publication in IFS and BOPSY.
National accounts data for 2004 were reported to STA for publication in IFS.

PAPUA NEW GUINEA
12 INTERNATIONAL MONETARY FUND
Papua New Guinea: Table of Common Indicators Required for Surveillance
(As of September 19, 2013)
Date of
Latest
Observation
Date
Received
Frequency
of Data1
Frequency
of
Reporting1
Frequency
of
Publication1
Exchange Rates 09/18/13 09/18/13 D W W
International Reserve Assets and Reserve Liabilities of
the Monetary Authorities2
03/13 07/13 W W Q
Reserve/Base Money 06/13 08/13/13 M M Q
Broad Money 06/13 08/13/13 M M Q
Central Bank Balance Sheet 07/13 08/13/13 M M Q
Consolidated Balance Sheet of the Banking System 06/13 08/13/13 M M Q
Interest Rates3
07/13 08/13/13 W W Q
Consumer Price Index 06/13 07/13 Q Q Q
Revenue, Expenditure, Balance and Composition of
Financing4—General Government
5, 6 N/A N/A N/A N/A N/A
Revenue, Expenditure, Balance and Composition of
Financing4—Central Government
2012 09/12/13 A A A
Stocks of Central Government and Central
Government-Guaranteed Debt7
03/13 07/13 Q Q Q
External Current Account Balance 03/13 07/13 Q Q Q
Exports and Imports of Goods and Services 03/13 07/13 Q Q Q
GDP/GNP 2012 09/12/13 A A A
Gross External Debt
12/2012 07/13 Q A A
International Investment Position7, 8
N/A N/A N/A N/A N/A
1 Daily (D), Weekly (W), Monthly (M), Quarterly (Q), Annually (A), Irregular (I); and Not Available (N/A).
2 Includes reserve assets pledged or otherwise encumbered as well as net derivative positions.
3 Both market-based and officially determined, including discount rates, money market rates, rates on treasury bills, notes,
and bonds.
4 Foreign, domestic bank, and domestic nonbank financing.
5 The general government consists of the central government (budgetary funds, extra-budgetary funds, and social security funds)
and state and local governments.
6 Lack of capacity prevented the authorities from providing the data.
7 Including currency and maturity composition.
8 Includes external gross financial asset and liability positions vis-à-vis nonresidents.

PAPUA NEW GUINEA
Press Release No. 13/457
FOR IMMEDIATE RELEASE
November 18, 2013
IMF Executive Board Concludes 2013 Article IV Consultation with Papua New Guinea
On November 11, 2013, the Executive Board of the International Monetary Fund (IMF)
concluded the Article IV consultation1 with Papua New Guinea.
Papua New Guinea has achieved strong economic growth over the past decade, benefitting from
high commodity prices, mineral investment inflows, sound macroeconomic policies, and
financial sector stability. The construction of a large-scale liquefied natural gas (LNG) project
has boosted growth and employment over the past few years. However, as the LNG project
moves from the construction to production phase, the nonmineral sector faces a sharp
slowdown, spotlighting the need for structural reforms and financial deepening to support more
inclusive growth.
The current account deficit is expected to narrow sharply in 2013 as imports and income
outflows decline with the winding down of LNG project construction. Capital inflows associated
with the LNG project are also declining, and, together with falling commodity prices, have led
to the depreciation of the kina since mid 2012. Pass-through effects from kina depreciation and
increased government spending are likely to raise inflation to about 4 percent in 2013 from 2
percent in 2012, but underlying price pressure remains moderate. The Bank of Papua New
Guinea has kept the policy interest rate unchanged since early 2013 given weakening
nonmineral sector demand, but has issued central bank bills and raised cash reserve
requirements to absorb excess liquidity in the banking system.
Papua New Guinea continues to face daunting development challenges, with power and
transport infrastructure and basic education and health services remaining undersupplied. The
change in growth composition further increases the need to accelerate structural reforms to
diversify the economy. To deliver quicker development results and counter the slowdown in the
1 Under Article IV of the IMF's Articles of Agreement, the IMF holds bilateral discussions with members, usually
every year. A staff team visits the country, collects economic and financial information, and discusses with officials the country's economic developments and policies. On return to headquarters, the staff prepares a report, which forms the basis for discussion by the Executive Board.
International Monetary Fund
700 19th
Street, NW
Washington, D. C. 20431 USA

nonmineral sector, the government increased expenditure substantially in 2013 to target its
development enablers—law and order, health, education, and infrastructure. The 2013 budget
envisages a fiscal deficit of 7.3 percent of GDP with a strong push to devolve spending to
provincial, district, and local governments. However, capacity constraints have delayed project
implementation and the quality of spending has been mixed.
Risks to economic growth in 2013-15 are broadly balanced, but tilted toward the downside over
the longer term. A weak global economy could further dampen external demand and commodity
prices, while global shale gas development could reduce LNG prices, with each potentially
exerting pressure on government revenue, export earnings, and the kina. Lower LNG and
mineral prices, together with uncertainty surrounding the ending of easy global monetary
conditions, may also reduce future inflows of foreign direct investment.
Executive Board Assessment2
Executive Directors agreed with the thrust of the staff appraisal. They commended the
authorities for achieving a strong economic performance over the past decade. While growth
prospects remain favorable in the medium term, the expected slowdown in the nonmineral
sector, uncertain mineral prices, and large development needs pose challenges. Structural
reforms, accompanied by a prudent fiscal stance, will be needed to reduce vulnerabilities and
promote more inclusive growth.
Directors saw some scope for fiscal support to growth in the short term, but cautioned that
spending should stay in line with PNG’s absorptive capacity. While noting the need to allocate
significant resources for development, they stressed the importance of fiscal consolidation over
the medium term and improvements in spending quality. In this context, they welcomed the
commitment to keeping public debt below 30 percent of GDP over the medium term.
Directors agreed that the current monetary policy stance is appropriate given low inflation and
the slowdown in the nonmineral sector, but advised the authorities to stand ready to tighten
policy should inflationary pressures arise. They welcomed efforts to absorb excess liquidity to
strengthen monetary policy transmission and encouraged continued vigilance on financial sector
risks in light of possible price corrections in the property market.
Directors noted the role of PNG’s floating exchange rate regime in helping absorb external
shocks and maintaining a strong external position. They recommended close monitoring of
private sector external debt and associated risks should LNG prices decline significantly.
2 At the conclusion of the discussion, the Managing Director, as Chairman of the Board, summarizes the views of
Executive Directors, and this summary is transmitted to the country's authorities. An explanation of any qualifiers used in summings up can be found here: http://www.imf.org/external/np/sec/misc/qualifiers.htm.

Directors welcomed the authorities’ continued efforts to ensure better use of resource revenues,
and their intention to join the Extractive Industries Transparency Initiative. They also supported
plans to make the Sovereign Wealth Fund operational soon, while ensuring that resource
revenues are not diverted away from the fund.
Directors encouraged the authorities to accelerate structural reforms to promote more inclusive
growth. Priorities are to strengthen the agriculture and small- and medium-size enterprise
sectors, broaden access to finance, create an enabling business environment, and develop human
resources. It will also be important to improve the efficiency and ensure appropriate governance
of public enterprises.
Directors called for efforts to address long-standing shortcomings in CPI and national accounts
statistics and supported the provision of technical assistance in this area. They also encouraged
swift action to ensure compliance with international standards for anti-money laundering and
combating the financing of terrorism.
The next Article IV consultation with Papua New Guinea is expected to take place on the
standard 12-month cycle.

Papua New Guinea: Selected Economic and Financial Indicators, 2009–14
Nominal GDP (2012): US$15.4 billion 1/
Population (2012): 7.2 million
GDP per capita (2012): US$2,146
Quota: SDR 131.6 million
2009 2010 2011 2012 2013 2014
Est. Proj.
(Percentage change)
Real sector
Real GDP growth
6.1 7.7 10.7 8.1 5.4 6.3
Mineral
-1.7 -2.0 -11.8 -6.9 5.3 80.7
Nonmineral
7.0 8.7 12.8 9.2 5.4 1.7
CPI (annual average)
6.9 6.0 8.4 2.2 4.0 6.0
CPI (end-period)
5.7 7.2 6.9 1.6 5.5 6.0
(In percent of GDP)
Central government operations
Revenue and grants
27.3 31.3 30.4 29.6 27.6 25.4
Expenditure and net lending
36.9 28.2 28.7 32.8 33.9 31.3
Net lending(+)/borrowing(-) [Overall balance] (Revenue -
expenditure) -9.6 3.1 1.7 -3.2 -6.3 -5.8
Nonmineral net lending(+)/borrowing(-) -13.3 -3.6 -5.7 -6.7 -9.3 -9.3
(Percentage change)
Money and credit (percentage change)
Domestic credit
37.3 4.9 -5.2 37.7 24.6 20.3
Credit to the private sector
15.1 18.1 7.9 12.1 11.2 9.6
Broad money
21.3 10.2 17.5 11.0 10.1 9.2
Interest rate (182-day Treasury bills; period average) 7.2 6.4 6.7 4.9 … …
(In billions of U.S. dollars)
Balance of payments 2/
Exports, f.o.b.
4.5 5.9 6.9 6.1 6.0 7.2
Of which: Mineral
3.4 4.4 4.9 4.5 4.5 5.5
Imports, c.i.f.
-3.3 -4.3 -6.3 -7.4 -5.4 -4.4
Current account (including grants) -1.2 -2.1 -3.0 -7.7 -4.4 -0.4
(In percent of GDP)
-15.2 -21.4 -23.5 -51.0
-
27.0 -2.0
Exceptional financing (net)
0.0 0.0 0.0 0.0 0.0 0.0
Gross official international reserves 2.6 3.1 4.3 4.0 3.0 4.3
(In months of nonmining imports, c.i.f.) 10.9 10.6 13.5 10.3 7.5 11.4
(In months of goods and services imports) 6.0 5.0 5.2 4.0 4.1 7.1
(In percent of GDP)
Government debt
31.3 25.3 22.3 26.7 31.6 33.6
External debt-to-GDP ratio (in percent) 3/ 12.5 10.4 7.5 7.5 7.9 8.2
External debt-service ratio (percent of exports) 3/ 1.8 1.4 1.3 0.7 1.4 1.2
Exchange rates
US$/kina (end-period)
0.3700 0.3785 0.4665 0.4755 … …
NEER (2005=100, end-period)
107.0 100.7 108.6 125.5 … …
REER (2005=100, end-period)
116.4 113.0 127.6 147.0 … …
Nominal GDP (in billions of kina) 22.3 26.4 30.5 32.1 34.6 40.2
Sources: Department of Treasury; Bank of Papua New Guinea; and IMF staff estimates and projections.
1/ Based on period average exchange rate.
2/ Includes staff's estimates related to the PNG LNG project.
3/ Public external debt includes external debt of the central government, the central bank, and statutory authorities.

Statement by Jong-Won Yoon, Executive Director for Papua New Guinea
and Nghi Luu, Senior Advisor to Executive Director
November 11, 2013
Papua New Guinea is now in its 12th year of consecutive economic growth. For this period of
strong growth to continue, our PNG authorities recognize that sustained effort to implement
structural reforms is needed to strengthen the fundamental building blocks for growth. There are
significant challenges ahead, but our PNG authorities are sanguine about the opportunities and
economic outlook and are strongly committed to improving the living standards of all Papua New
Guineans.
PNG has significant infrastructure needs, which is further compounded by the geographical
dispersion of the population. In addition to improving the quality of investment spending, the
challenge will be to prioritize the provision of basic services (water, electricity, sewerage) and
infrastructure (roads, ports and housing), both of which are critical to support broad-based growth.
PNG has enormous unrealized potential. In addition to being a resource-rich country, PNG is
strategically located in the Asian region to service the growing demand of emerging market
economies. The PNG government has set ambitious targets to capitalize on the recent reform
momentum. The authorities welcome the significant technical assistance they are receiving from the
IMF, World Bank, the Asian Development Bank (ADB) and donor partners in advancing the
substantial structural reform agenda.
Economic Outlook
GDP growth is expected to moderate this year as the construction phase of the LNG project
comes to an end. Nonetheless, economic activity remains buoyant, underpinned by fiscal stimulus
and strong credit growth. Growth is forecast to pick up in 2014 with the first shipment of LNG
exports scheduled for delivery in the second half of the year.
Risks to growth are broadly balanced between domestic and external sources. Fluctuations in
commodity prices and the exchange rate continue to pose significant risks to the outlook and
reinforce the importance of fiscal and external buffers for a small open economy such as PNG.
The key sources of domestic risk include (1) the process of demobilizing PNG workers from the
construction of the LNG project back into the workforce, and (2) spillovers from the high-end
housing market in Port Moresby, where a correction in prices has begun.

Sovereign Wealth Fund (SWF)
The SWF will become operational in 2014, once the Organic Law is passed by the
Parliament. As outlined in the recent Budget Strategy Paper, the overall objective of the SWF is
to support macroeconomic stabilization, support long-term economic and social development; and
to support asset management in relation to financial assets accrued from natural resources revenue.
The SWF provides a possible source of funding to ensure infrastructure activities receive
greater priority. The design of the SWF is consistent with international best practice and all funds
withdrawn from the Fund will be accounted for through the national budget. The authorities have
agreed to reexamine the withdrawal rules to ensure that they are consistent with the Government’s
medium-term fiscal strategy. They are also acutely aware of the importance of safeguarding the
integrity of the SWF so that it can play a key role in managing PNG’s resource revenues.
The authorities are currently considering the IMF TA recommendations on extractive
industries fiscal regimes. These recommendations will be examined by a recently established
committee, tasked with undertaking a comprehensive review of the tax system. The PNG authorities
would like to express their appreciation for the valuable TA provided by MCM and FAD on the
SWF.
Fiscal Policy
Fiscal prudence has been an important anchor for PNG’s development. Political commitment to
a sustainable fiscal strategy is set out in the Medium-Term Fiscal Strategy (MTFS) and is designed to
ensure ongoing confidence in the Government’s fiscal position. The MTFS is underpinned by a
number of guiding principles including: maintaining a gross government debt-to-GDP ratio of less
than 30 percent, apart from 2013 and 2014 when it will not exceed 35 percent; and to limit gross
government liabilities to less than 60 percent of GDP. The MTFS is also focused on improving
expenditure effectiveness, transparency reporting, public accountability, and ensuring that no new
infrastructure programs will be funded unless they have gone through proper design and costing
process. On the revenue side, the MTFS will focus on maintaining equitable taxation regimes with a
focus on compliance and restricting tax exemptions and special arrangements.

The 2014 Budget will require additional debt issuance to meet the government’s financing
needs. The financing task will comprise: additional borrowing through concessional loans from
development partners to fund key projects, issuance of domestic debt to finance the budget deficit,
and restructuring the portfolio of domestic debt to increase the average term of maturity and to
reduce rollover risks.
For the first time in several decades, the 2014 Budget will integrate the recurrent budget with
the development budget. The government will also continue with the implementation of multi-year
budgeting which commenced last year. Multi-year budgeting will enhance the ability of agencies to
plan expenditure over time as well as give individual departments the ability to better manage their
budget allocations from year to year. The move to multi-year budgeting can also help reduce the
end-of-year surge in expenditure where agencies simply spend money to avoid losing it. The
carry-over will be modest to create better incentives for quality spending.
Monetary Policy
Inflation has edged up, but remains manageable and under control. Inflation is expected to
remain modest in 2013, even after accounting for the lagged effects from the depreciation of the kina.
If inflationary pressures emerge, the Bank of Papua New Guinea (BPNG) stands ready to tighten
monetary policy as necessary. The BPNG will assess the appropriateness of returning to a 5 percent
inflation reference rate in light of the significant structural changes to the economy.
Excess liquidity is complicating monetary policy and impairing the transmission mechanism.
The authorities have taken steps to remove liquidity from the system but agree that further action is
needed. They remain open to considering a suite of options including moving the government’s
trust accounts from commercial banks to the BPNG, issuing Central Bank Bills and raising the
CRR.
External Sector
The authorities continue to support a floating exchange rate. The kina has stabilized in 2013,
following strong appreciation over the past two years. BPNG’s foreign exchange intervention is
guided by its price stability objective, and is targeted at smoothing volatility and providing liquidity
support to reflect market conditions. The kina is expected to remain relatively stable, but to
gradually decline over the next two years as capital inflows slow down from the completion of the
PNG LNG project.
The PNG authorities agree that a continued prudent approach to external borrowing is
important to preserve the government’s debt reduction efforts over the past decade.
They welcome the findings that PNG’s external position is sound and that the risk of debt distress is
low, as suggested by the debt sustainability analysis. Foreign reserves remain adequate at four
months of import coverage, and are expected to surge in the second half of 2014 with the first
shipment of LNG. The commencement of LNG exports will also drive a sharp turnaround in the
current account as it moves into a surplus position from 2015.

Structural Reforms
A key priority in the upcoming 2014 Budget will be expanding funding for education and
health. The government recognizes the limitations on growth from the severe skills shortage within
PNG’s labor force. They also recognize that investment in human capital must begin in early
childhood and are continuing their commitment to providing free education up to grade 10 and
subsidizing tuition fees for grades 11 and higher. In terms of other key development areas, the
government will focus on unlocking land and providing affordable housing for development;
improving law and order; establishing national transport corridors that connect rural populations to
markets and services; and improving the provision of key utilities of electricity, clean water and
sanitation, and communications.
Improving the business environment for the agriculture sector and SMEs is an important
priority for the government. There is significant untapped potential to increase the scale of
agricultural production and to improve supporting services and logistics to the sector. The
commercialization of agriculture remains a long term opportunity and can drive sustained growth
and employment. The development of the agriculture sector will also contribute to the government’s
goal of diverse and inclusive growth.
The development of a sound financial sector is also critical for PNG’s development.
Financial penetration is low, and the government is actively exploring ways to encourage greater
financial participation, particularly for those living in rural areas where access to financial
services is limited. The authorities remain committed to the ongoing implementation of the 2011
financial sector stability assessment recommendations, as evidenced by the advancement of a
number of initiatives including the Kina Automated Transfer System and the Central Bank Bill
Tap facility.
The authorities are committed to improving service delivery through reform of poor work
practices across the public service. The government will ensure that Heads of agencies exercise
their managerial powers to improve service delivery and to hold them accountable for poor
performance. As noted earlier, expenditure reporting will be strengthened, as well as project
planning and costing to ensure effective project planning early on.

Statistics and Anti-Money Laundering
The government recognizes the need to improve economic statistics. Following years of
underperformance, the government has recently appointed a new acting National Statistician and
head of the National Statistic Office (NSO). The government is developing a strategic plan to
expedite improvements in the quality and timeliness of statistics. Once the strategic plan is completed,
and following organizational changes to the NSO, our PNG authorities will formally request TA
from the IMF and other development partners in the areas of national accounts and the CPI.
On AML/CFT, our PNG authorities have prepared an action plan for Cabinet’s consideration.
As noted in the staff report, Australia and the ADB will work with the PNG authorities to prepare
the necessary reports for submission to the Financial Action Task Force.