
IMF Commodity Market Monthly, July 16, 2015
12
1 July 16, 2015 www.imf.org/commodities [email protected] Commodity prices fell by 1.6 percent in June, the first decline in three months, driven by price drops in metals and energy, due to macroeconomic risks in Greece and China. Agricultural prices registered a slight increase, mainly the result of weak supply. During the first six months (Dec 14 – Jun 15), commodity prices fell by 5.8 percent, with declines recorded in all main indices, led by 10 percent drops in both metals and food. Crude oil prices fell 1.9 percent in June, averaging $61.3/bbl and reversing gains from the previous months, due to strong OPEC production and possible suspension of sanctions against Iran. Global growth in oil consumption had somewhat increased in response to the cold winter; however, relatively low prices have so far stimulated consumption very modestly. Natural gas prices in the U.S. declined by 2.4 percent in June, averaging $2.77/mmbtu, due to weak seasonal demand and ample supply. Coal prices fell 2.9 percent in June, erasing gains from the last month, due to persistent oversupply. Commodity Market Monthly Research Department, Commodities Team 75 95 115 135 155 175 195 215 Jan-12 Jan-13 Jan-14 Jan-15 Metals Agrilculture Energy IMF Commodity Price Indices (2005 = 100) 75 95 115 135 155 175 195 215 Jan-12 Jan-13 Jan-14 Jan-15 Non-Energy Total Energy IMF Commodity Price Indices (2005 = 100) 40 50 60 70 80 90 100 110 120 130 Jan-12 Jan-13 Jan-14 Jan-15 Dubai Brent WTI Crude Oil Prices ($/barrel)
-
Upload
nguyenhanh -
Category
Documents
-
view
213 -
download
0
Transcript of IMF Commodity Market Monthly, July 16, 2015

1
July 16, 2015 www.imf.org/commodities [email protected]
Commodity prices fell by 1.6 percent in June, the first decline in three months, driven by price drops in metals and energy, due to macroeconomic risks in Greece and China. Agricultural prices registered a slight increase, mainly the result of weak supply. During the first six months (Dec 14 – Jun 15), commodity prices fell by 5.8 percent, with declines recorded in all main indices, led by 10 percent drops in both metals and food.
Crude oil prices fell 1.9 percent in June, averaging $61.3/bbl and reversing gains from the previous months, due to strong OPEC production and possible suspension of sanctions against Iran. Global growth in oil consumption had somewhat increased in response to the cold winter; however, relatively low prices have so far stimulated consumption very modestly.
Natural gas prices in the U.S. declined by 2.4 percent in June, averaging $2.77/mmbtu, due to weak seasonal demand and ample supply. Coal prices fell 2.9 percent in June, erasing gains from the last month, due to persistent oversupply.
Commodity Market Monthly
Research Department, Commodities Team
75
95
115
135
155
175
195
215
Jan-12 Jan-13 Jan-14 Jan-15
Metals Agrilculture Energy
IMF Commodity Price Indices(2005 = 100)
75
95
115
135
155
175
195
215
Jan-12 Jan-13 Jan-14 Jan-15
Non-Energy Total Energy
IMF Commodity Price Indices(2005 = 100)
40
50
60
70
80
90
100
110
120
130
Jan-12 Jan-13 Jan-14 Jan-15
Dubai Brent WTI
Crude Oil Prices ($/barrel)

2
Agriculture prices increased 0.1 percent in June, the first gain in seven months, mainly reflecting supply constraints. The largest increase was for tea prices, which rose 13 percent and to the highest level in over 2 years, on lower production in Kenya due to dry weather. Rapeseed oil price increased 6 percent owing to dryness in Europe and Canada as well as lower production prospects in other major exporters like the Black Sea and Australia. Coarse and fine wool prices rose 5 and 2 percent, respectively, due to higher demand from China and declining Australian production. Cocoa prices increased 5 percent on dry weather conditions in Ghana, although demand remains high. Partly offsetting these increases, sugar prices fell 5 percent and to the lowest level in over 6 years, on persistent abundance of stocks and continued strong supply, particularly in Brazil and India. Fish meal prices declined 5 percent as Peruvian anchovy production continues recovering from shortfalls in 2014 because of high sea temperatures. Rice prices fell 3 percent on steady supply, although there have been concerns over a recent drought in Thailand. Metals prices fell by 4.6 percent in June, reversing gains in May, due to turmoil in Greece and weak demand in China, as well as continued
increases in new supply. The largest decline was for zinc, down 9 percent, followed by lead, down 8 percent. Copper, aluminum, nickel, had all dropped more than 5 percent. Partly offsetting these declines, iron ore rose another 3 percent in June, following the sharp rally in May, as China’s port stockpiles fell. Uranium prices also rebound 2 percent, but is still unstable.
100
120
140
160
180
200
220
240
260
280
Jan-12 Jan-13 Jan-14 Jan-15
Vegetable Oils & MealCerealsBeveragesMeatSeafood
IMF Commodity Price Indices(2005 = 100)
-10 -5 0 5 10 15
Zinc
Lead
Copper
Aluminum
Nickel
Tin
Sugar
Fish Meal
Barley
Rice
Coal, Australia
Lamb
Wheat
Natural Gas, US
Beef
Hides
Crude Oil
Bananas
Groundnuts
Natural gas, Germany
Cotton
Rubber
Poultry
Swine
Corn
Sawnwood Hard
Soybeans
Palm Oil
Fish (Salmon)
Coffee, Arabica
Olive Oil
Shrimp
Uranium
Sunflower Oil
Wool, Fine
Coffee, Robustas
Soybeans Oil
Gasoline
Iron Ore
Orange
Soybean Meal
Cocoa
Wool, Coarse
Rapeseed Oil
Tea
June Commodity Prices Changes(percent from previous month)
3
Units 2012 2013 2014 2014Q3 2014Q4 2015Q1 2015Q2 May-15 Jun-15
Food
Cereals
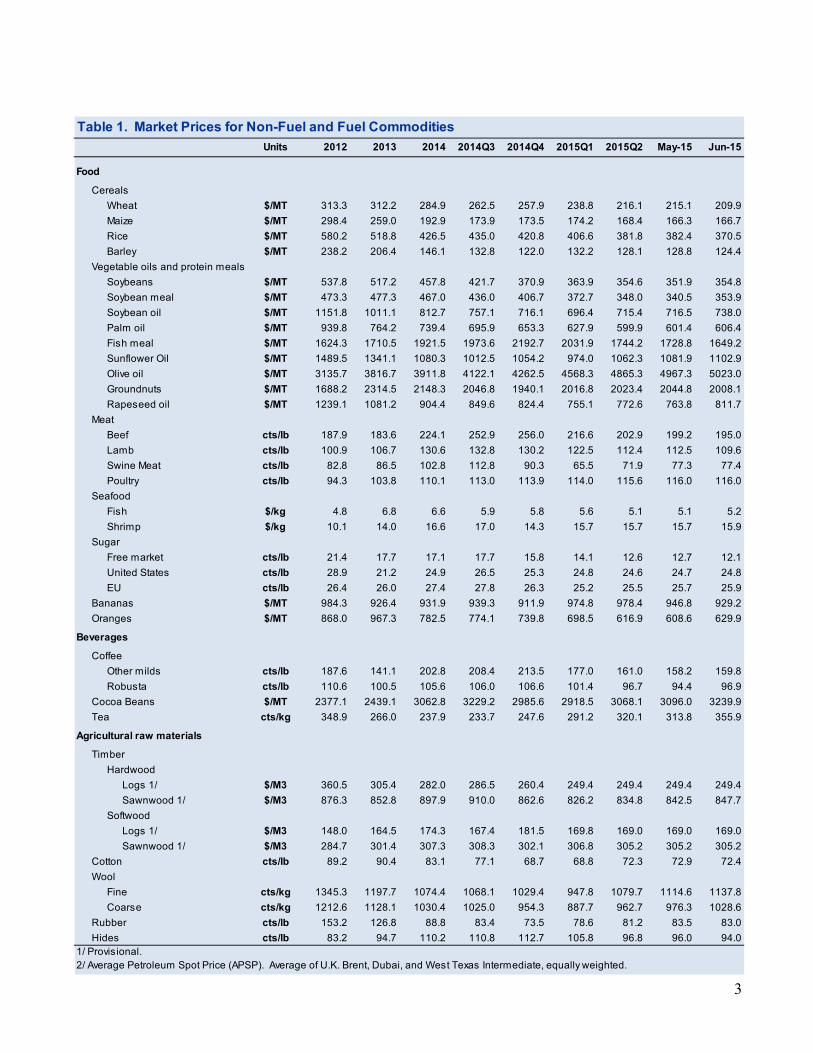
Wheat $/MT 313.3 312.2 284.9 262.5 257.9 238.8 216.1 215.1 209.9
Maize $/MT 298.4 259.0 192.9 173.9 173.5 174.2 168.4 166.3 166.7
Rice $/MT 580.2 518.8 426.5 435.0 420.8 406.6 381.8 382.4 370.5
Barley $/MT 238.2 206.4 146.1 132.8 122.0 132.2 128.1 128.8 124.4
Vegetable oils and protein meals
Soybeans $/MT 537.8 517.2 457.8 421.7 370.9 363.9 354.6 351.9 354.8
Soybean meal $/MT 473.3 477.3 467.0 436.0 406.7 372.7 348.0 340.5 353.9
Soybean oil $/MT 1151.8 1011.1 812.7 757.1 716.1 696.4 715.4 716.5 738.0
Palm oil $/MT 939.8 764.2 739.4 695.9 653.3 627.9 599.9 601.4 606.4
Fish meal $/MT 1624.3 1710.5 1921.5 1973.6 2192.7 2031.9 1744.2 1728.8 1649.2
Sunflower Oil $/MT 1489.5 1341.1 1080.3 1012.5 1054.2 974.0 1062.3 1081.9 1102.9
Olive oil $/MT 3135.7 3816.7 3911.8 4122.1 4262.5 4568.3 4865.3 4967.3 5023.0
Groundnuts $/MT 1688.2 2314.5 2148.3 2046.8 1940.1 2016.8 2023.4 2044.8 2008.1
Rapeseed oil $/MT 1239.1 1081.2 904.4 849.6 824.4 755.1 772.6 763.8 811.7
Meat
Beef cts/lb 187.9 183.6 224.1 252.9 256.0 216.6 202.9 199.2 195.0
Lamb cts/lb 100.9 106.7 130.6 132.8 130.2 122.5 112.4 112.5 109.6
Swine Meat cts/lb 82.8 86.5 102.8 112.8 90.3 65.5 71.9 77.3 77.4
Poultry cts/lb 94.3 103.8 110.1 113.0 113.9 114.0 115.6 116.0 116.0
Seafood
Fish $/kg 4.8 6.8 6.6 5.9 5.8 5.6 5.1 5.1 5.2
Shrimp $/kg 10.1 14.0 16.6 17.0 14.3 15.7 15.7 15.7 15.9
Sugar
Free market cts/lb 21.4 17.7 17.1 17.7 15.8 14.1 12.6 12.7 12.1
United States cts/lb 28.9 21.2 24.9 26.5 25.3 24.8 24.6 24.7 24.8
EU cts/lb 26.4 26.0 27.4 27.8 26.3 25.2 25.5 25.7 25.9
Bananas $/MT 984.3 926.4 931.9 939.3 911.9 974.8 978.4 946.8 929.2
Oranges $/MT 868.0 967.3 782.5 774.1 739.8 698.5 616.9 608.6 629.9
Beverages
Coffee
Other milds cts/lb 187.6 141.1 202.8 208.4 213.5 177.0 161.0 158.2 159.8
Robusta cts/lb 110.6 100.5 105.6 106.0 106.6 101.4 96.7 94.4 96.9
Cocoa Beans $/MT 2377.1 2439.1 3062.8 3229.2 2985.6 2918.5 3068.1 3096.0 3239.9
Tea cts/kg 348.9 266.0 237.9 233.7 247.6 291.2 320.1 313.8 355.9
Agricultural raw materials
Timber
Hardwood
Logs 1/ $/M3 360.5 305.4 282.0 286.5 260.4 249.4 249.4 249.4 249.4
Sawnwood 1/ $/M3 876.3 852.8 897.9 910.0 862.6 826.2 834.8 842.5 847.7
Softwood
Logs 1/ $/M3 148.0 164.5 174.3 167.4 181.5 169.8 169.0 169.0 169.0
Sawnwood 1/ $/M3 284.7 301.4 307.3 308.3 302.1 306.8 305.2 305.2 305.2
Cotton cts/lb 89.2 90.4 83.1 77.1 68.7 68.8 72.3 72.9 72.4
Wool
Fine cts/kg 1345.3 1197.7 1074.4 1068.1 1029.4 947.8 1079.7 1114.6 1137.8
Coarse cts/kg 1212.6 1128.1 1030.4 1025.0 954.3 887.7 962.7 976.3 1028.6
Rubber cts/lb 153.2 126.8 88.8 83.4 73.5 78.6 81.2 83.5 83.0
Hides cts/lb 83.2 94.7 110.2 110.8 112.7 105.8 96.8 96.0 94.0
Table 1. Market Prices for Non-Fuel and Fuel Commodities
1/ Provisional.2/ Average Petroleum Spot Price (APSP). Average of U.K. Brent, Dubai, and West Texas Intermediate, equally weighted.
4
Units 2012 2013 2014 2014Q3 2014Q4 2015Q1 2015Q2 May-15 Jun-15
Metals
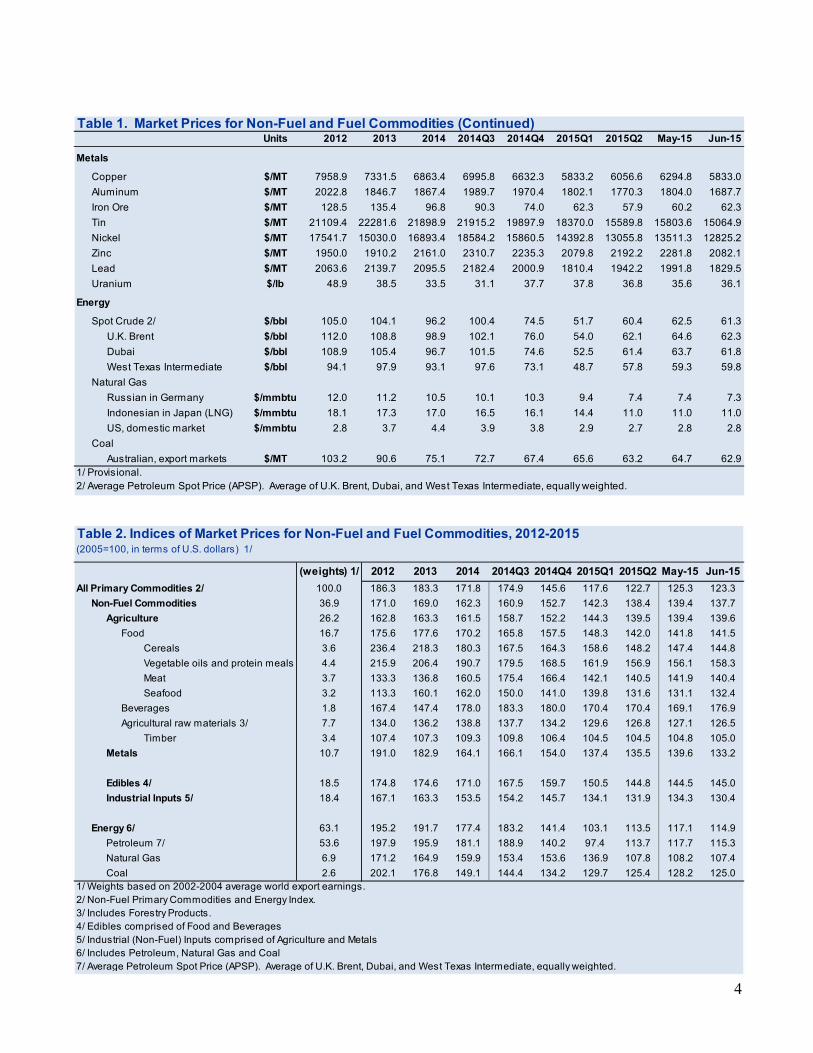
Copper $/MT 7958.9 7331.5 6863.4 6995.8 6632.3 5833.2 6056.6 6294.8 5833.0
Aluminum $/MT 2022.8 1846.7 1867.4 1989.7 1970.4 1802.1 1770.3 1804.0 1687.7
Iron Ore $/MT 128.5 135.4 96.8 90.3 74.0 62.3 57.9 60.2 62.3
Tin $/MT 21109.4 22281.6 21898.9 21915.2 19897.9 18370.0 15589.8 15803.6 15064.9
Nickel $/MT 17541.7 15030.0 16893.4 18584.2 15860.5 14392.8 13055.8 13511.3 12825.2
Zinc $/MT 1950.0 1910.2 2161.0 2310.7 2235.3 2079.8 2192.2 2281.8 2082.1
Lead $/MT 2063.6 2139.7 2095.5 2182.4 2000.9 1810.4 1942.2 1991.8 1829.5
Uranium $/lb 48.9 38.5 33.5 31.1 37.7 37.8 36.8 35.6 36.1
Energy
Spot Crude 2/ $/bbl 105.0 104.1 96.2 100.4 74.5 51.7 60.4 62.5 61.3
U.K. Brent $/bbl 112.0 108.8 98.9 102.1 76.0 54.0 62.1 64.6 62.3
Dubai $/bbl 108.9 105.4 96.7 101.5 74.6 52.5 61.4 63.7 61.8
West Texas Intermediate $/bbl 94.1 97.9 93.1 97.6 73.1 48.7 57.8 59.3 59.8
Natural Gas
Russian in Germany $/mmbtu 12.0 11.2 10.5 10.1 10.3 9.4 7.4 7.4 7.3
Indonesian in Japan (LNG) $/mmbtu 18.1 17.3 17.0 16.5 16.1 14.4 11.0 11.0 11.0
US, domestic market $/mmbtu 2.8 3.7 4.4 3.9 3.8 2.9 2.7 2.8 2.8
Coal
Australian, export markets $/MT 103.2 90.6 75.1 72.7 67.4 65.6 63.2 64.7 62.91/ Provisional.2/ Average Petroleum Spot Price (APSP). Average of U.K. Brent, Dubai, and West Texas Intermediate, equally weighted.
Table 1. Market Prices for Non-Fuel and Fuel Commodities (Continued)
(weights) 1/ 2012 2013 2014 2014Q3 2014Q4 2015Q1 2015Q2 May-15 Jun-15
All Primary Commodities 2/ 100.0 186.3 183.3 171.8 174.9 145.6 117.6 122.7 125.3 123.3
Non-Fuel Commodities 36.9 171.0 169.0 162.3 160.9 152.7 142.3 138.4 139.4 137.7
Agriculture 26.2 162.8 163.3 161.5 158.7 152.2 144.3 139.5 139.4 139.6
Food 16.7 175.6 177.6 170.2 165.8 157.5 148.3 142.0 141.8 141.5
Cereals 3.6 236.4 218.3 180.3 167.5 164.3 158.6 148.2 147.4 144.8
Vegetable oils and protein meals 4.4 215.9 206.4 190.7 179.5 168.5 161.9 156.9 156.1 158.3
Meat 3.7 133.3 136.8 160.5 175.4 166.4 142.1 140.5 141.9 140.4
Seafood 3.2 113.3 160.1 162.0 150.0 141.0 139.8 131.6 131.1 132.4
Beverages 1.8 167.4 147.4 178.0 183.3 180.0 170.4 170.4 169.1 176.9
Agricultural raw materials 3/ 7.7 134.0 136.2 138.8 137.7 134.2 129.6 126.8 127.1 126.5
Timber 3.4 107.4 107.3 109.3 109.8 106.4 104.5 104.5 104.8 105.0
Metals 10.7 191.0 182.9 164.1 166.1 154.0 137.4 135.5 139.6 133.2
Edibles 4/ 18.5 174.8 174.6 171.0 167.5 159.7 150.5 144.8 144.5 145.0
Industrial Inputs 5/ 18.4 167.1 163.3 153.5 154.2 145.7 134.1 131.9 134.3 130.4
Energy 6/ 63.1 195.2 191.7 177.4 183.2 141.4 103.1 113.5 117.1 114.9
Petroleum 7/ 53.6 197.9 195.9 181.1 188.9 140.2 97.4 113.7 117.7 115.3
Natural Gas 6.9 171.2 164.9 159.9 153.4 153.6 136.9 107.8 108.2 107.4
Coal 2.6 202.1 176.8 149.1 144.4 134.2 129.7 125.4 128.2 125.0
3/ Includes Forestry Products.4/ Edibles comprised of Food and Beverages5/ Industrial (Non-Fuel) Inputs comprised of Agriculture and Metals6/ Includes Petroleum, Natural Gas and Coal7/ Average Petroleum Spot Price (APSP). Average of U.K. Brent, Dubai, and West Texas Intermediate, equally weighted.
Table 2. Indices of Market Prices for Non-Fuel and Fuel Commodities, 2012-2015(2005=100, in terms of U.S. dollars) 1/
1/ Weights based on 2002-2004 average world export earnings.2/ Non-Fuel Primary Commodities and Energy Index.

5
Commodity Prices Movements (Continued)
Monthly (from 2005) Daily (from 2011)
25
50
75
100
125
150
05 07 09 11 13 15
Crude oil ($/bbl)
Brent
WTI
25
50
75
100
125
150
11 12 13 14 15
Crude oil ($/bbl)
Brent
WTI
0
5
10
15
20
05 07 09 11 13 15
Natural Gas ($/mmbtu)
Germany
United States
Sources: Energy Intelligence; Bloomberg , L.P.
Japan
0
5
10
15
11 12 13 14 15
Natural Gas ($/mmbtu)
Source: Bloomberg , L.P.
United States
Germany
0
25
50
75
100
125
150
175
200
05 07 09 11 13 15
Iron Ore ($/ton)
25
50
75
100
125
150
175
200
11 12 13 14 15
Iron Ore ($/ton)

6
Commodity Prices Movements (Continued)
Monthly (from 2005) Daily (from 2011)
2500
3500
4500
5500
6500
7500
8500
9500
05 07 09 11 13 15
Copper ($/ton)
5000
6000
7000
8000
9000
10000
11000
11 12 13 14 15
Copper ($/ton)
1000
1500
2000
2500
3000
3500
05 07 09 11 13 15
Aluminium ($/ton)
1600
1800
2000
2200
2400
2600
2800
11 12 13 14 15
Aluminium ($/ton)
0
10000
20000
30000
40000
50000
60000
05 07 09 11 13 15
Nickel ($/ton)
11000
13000
15000
17000
19000
21000
23000
25000
27000
29000
11 12 13 14 15
Nickel ($/ton)

7
Commodity Prices Movements (Continued)
Monthly (from 2005) Daily (from 2011)
0
5000
10000
15000
20000
25000
30000
35000
05 07 09 11 13 15
Tin ($/ton)
50
100
150
200
250
300
350
05 07 09 11 13 15
Corn ($/ton)
12000
17000
22000
27000
32000
11 12 13 14 15
Tin ($/ton)
180
230
280
330
380
11 12 13 14 15
Wheat ($/ton)
120
170
220
270
320
370
11 12 13 14 15
Corn ($/ton)
100
200
300
400
500
05 07 09 11 13 15
Wheat ($/ton)

8
Commodity Prices Movements (Continued)
Monthly (from 2005) Daily (from 2011)
1000
1500
2000
2500
3000
3500
4000
05 07 09 11 13 15
Cocoa ($/ton)
0
50
100
150
200
250
300
350
05 07 09 11 13 15
Coffee (cents/lb)
0
20
40
60
80
100
120
140
05 07 09 11 13 15
Swine (cents/lb)
40
50
60
70
80
90
100
110
120
130
140
11 12 13 14 15
Swine (cents/lb)
100
150
200
250
300
350
11 12 13 14 15
Coffee (cents/lb)
1800
2000
2200
2400
2600
2800
3000
3200
3400
3600
3800
11 12 13 14 15
Cocoa ($/ton)

9
Commodity Prices Movements (Continued)
Monthly (from 2005) Daily (from 2011)
100
125
150
175
200
225
250
275
05 07 09 11 13 15
Beef (cents/pound)
Source: Meat & Livestock Australia.
150
250
350
450
550
650
05 07 09 11 13 15
Soybeans ($/ton)
0
50
100
150
200
250
05 07 09 11 13 15
Cotton (cents/pound)
90
100
110
120
130
140
150
160
170
180
11 12 13 14 15
Beef (cents/lb)
Source: Bloomberg , L.P.
300
350
400
450
500
550
600
650
700
11 12 13 14 15
Soybeans ($/ton)
50
70
90
110
130
150
170
190
210
230
250
11 12 13 14 15
Cotton (cents/lb)

10
Commodity Prices Movements (Continued)Monthly (from 2005)
1000
1500
2000
2500
3000
3500
4000
4500
05 07 09 11 13 15
Zinc ($/ton)
0
50
100
150
200
05 07 09 11 13 15
Coal ($/ton)
Australia
South Africa
0
20
40
60
80
100
120
140
160
05 07 09 11 13 15
Uranium($/lb)
100
200
300
400
500
05 07 09 11 13 15
Logs ($/cubic meter)
Soft
Hard
0
50
100
150
200
250
300
05 07 09 11 13 15
Rubber ($/lb)
250
500
750
1000
1250
1500
1750
2000
05 07 09 11 13 15
Wool (cents/kg)
Fine
Coarse

11
Commodity Prices Movements (Continued)Monthly (from 2005)
200
400
600
800
1000
1200
05 07 09 11 13 15
Rice ($/ton)
300
400
500
600
700
800
900
1000
1100
1200
05 07 09 11 13 15
Bananas ($/ton)
300
500
700
900
1100
1300
05 07 09 11 13 15
Palm Oil ($/ton)
6
8
10
12
14
16
18
20
05 07 09 11 13 15
Shrimp ($/kg)
5
10
15
20
25
30
05 07 09 11 13 15
Sugar (cents/pound)
150
200
250
300
350
400
05 07 09 11 13 15
Tea (cents/kg)

12
Commodity Prices Movements (Continued)
Daily (from 2011)
1000
1100
1200
1300
1400
1500
1600
1700
1800
1900
2000
11 12 13 14 15
Gold ($/troy ounce)
1000
1100
1200
1300
1400
1500
1600
1700
1800
1900
2000
11 12 13 14 15
Platinum ($/ounce)
10
15
20
25
30
35
40
45
50
55
11 12 13 14 15
Silver ($/troy ounce)
500
550
600
650
700
750
800
850
900
950
11 12 13 14 15
Palladium ($/ounce)


