IMARES Wageningen UR - Informatiehuis Marien...This report has been made on the request of the...
90
Shortlist Masterplan Wind Ship-based monitoring of seabirds and cetaceans Rob van Bemmelen, Steve Geelhoed & Mardik Leopold Report number C099/11 IMARES Wageningen UR (IMARES - Institute for Marine Resources & Ecosystem Studies) Client: Paul Boers Rijkswaterstaat Waterdienst Postbus 17 8200 AA LELYSTAD Publication date: 15 August 2011
Transcript of IMARES Wageningen UR - Informatiehuis Marien...This report has been made on the request of the...

Shortlist Masterplan Wind Ship-based monitoring of
seabirds and cetaceans
Rob van Bemmelen, Steve Geelhoed & Mardik Leopold
Report number C099/11
IMARES Wageningen UR (IMARES - Institute for Marine Resources & Ecosystem Studies)
Client: Paul Boers
Rijkswaterstaat Waterdienst
Postbus 17
8200 AA LELYSTAD
Publication date: 15 August 2011
2 of 90 Report number C099/11
IMARES is:
• an independent, objective and authoritative institute that provides
knowledge necessary for an integrated sustainable protection,
exploitation and spatial use of the sea and coastal zones;
• an institute that provides knowledge necessary for an integrated
sustainable protection, exploitation and spatial use of the sea and
coastal zones;
• a key, proactive player in national and international marine networks
(including ICES and EFARO).
P.O. Box 68 P.O. Box 77 P.O. Box 57 P.O. Box 167
1970 AB Ijmuiden 4400 AB Yerseke 1780 AB Den Helder 1790 AD Den Burg
Texel
Phone: +31 (0)317 48 09 00 Phone: +31 (0)317 48 09 00 Phone: +31 (0)317 48 09 00 Phone: +31 (0)317
48 09 00
Fax: +31 (0)317 48 73 26 Fax: +31 (0)317 48 73 59 Fax: +31 (0)223 63 06 87 Fax: +31 (0)317 48
73 62
E-Mail: [email protected] E-Mail: [email protected] E-Mail: [email protected] E-Mail:
www.imares.wur.nl www.imares.wur.nl www.imares.wur.nl www.imares.wur.nl
Cover photo: Red-throated Diver (Steve Geelhoed)
© 2010 IMARES Wageningen UR
IMARES, institute of Stichting DLO
is registered in the Dutch trade
record nr. 09098104,
BTW nr. NL 806511618
The Management of IMARES is not responsible for resulting
damage, as well as for damage resulting from the application of
results or research obtained by IMARES, its clients or any claims
related to the application of information found within its research.
This report has been made on the request of the client and is
wholly the client's property. This report may not be reproduced
and/or published partially or in its entirety without the express
written consent of the client.
A_4_3_2-V11.2

Report number C099/11 3 of 90
Contents
Summary ................................................................................................................. 5
Samenvatting ............................................................................................................ 6
1. Introduction ..................................................................................................... 7
2. Materials and Methods ....................................................................................... 8
Distance sampling for swimming birds ............................................................... 10
Flying birds .................................................................................................. 11
Behaviour .................................................................................................. 11
3. Results .......................................................................................................... 12
Effort, sea states and fishing activities ............................................................... 12
Fishing activities ............................................................................................. 17
Collected data ................................................................................................ 17
Detection probabilities ..................................................................................... 17
Species accounts ............................................................................................ 23
Wind farm sensitivity index ................................................................. 23
Conservation status ........................................................................... 23
Divers ........................................................................................ 25
White-billed Diver Gavia adamsii ......................................................... 25
Red-throated Diver Gavia stellata ........................................................ 25
Black-throated Diver Gavia arctica ....................................................... 25
Tubenoses ........................................................................................ 28
Northern Fulmar Fulmarus glacialis ...................................................... 28
Sooty Shearwater Puffinus griseus ....................................................... 31
Manx Shearwater Puffinus puffinus ...................................................... 31
Balearic Shearwater Puffinus mauretanicus ........................................... 31
European Storm-petrel Hydrobates pelagicus - .................................... 31
Gannets ........................................................................................ 33
Northern Gannet Morus bassanus ........................................................ 33
Skuas ........................................................................................ 37
Arctic Skua Stercorarius parasiticus ..................................................... 37
Pomarine Skua Stercorarius pomarinus ................................................ 37
Great Skua Stercorarius skua .............................................................. 37
Gulls ........................................................................................ 39
Little Gull Hydrocoloeus minutus .......................................................... 39
Black-legged Kittiwake Rissa tridactyla ................................................. 41
Common Gull Larus canus .................................................................. 45
Herring Gull Larus argentatus ............................................................. 47
Lesser Black-backed Gull Larus fuscus .................................................. 49
Great Black-backed Gull Larus marinus ................................................. 53
Terns ........................................................................................ 55
Sandwich Tern Sterna sandvicensis ...................................................... 55
Common Tern Sterna hirundo ............................................................. 57
Arctic Tern Sterna paradisaea ............................................................. 57
Alcids ........................................................................................ 60
Common Guillemot Uria aalge ............................................................. 60
Razorbill Alca torda............................................................................ 60
Atlantic Puffin Fratercula arctica .......................................................... 68
Little Auk Alle alle ............................................................................. 68
Other species ........................................................................................ 72

4 of 90 Report number C099/11
Marine Mammals ................................................................................... 73
White-beaked Dolphin Lagenorhynchus albirostris .................................. 73
Bottlenose Dolphin Tursiops truncates .................................................. 73
Short-beaked Common Dolphin Delphinus delphinus .............................. 73
Minke Whale Balaenoptera acutorostrata .............................................. 73
Harbour Porpoise Phocoena phocoena .................................................. 74
Grey Seal Halichoerus grypus .............................................................. 77
Harbour Seal Phoca vitulina ................................................................ 77
Balloons ........................................................................................ 78
4. Discussion and conclusions ............................................................................... 81
5. Quality Assurance ........................................................................................... 83
References .............................................................................................................. 84
Justification ............................................................................................................. 87
Appendix A. Wind farm sensitivity index ...................................................................... 88
Appendix B. Mapped Wind farm Sensitivity Index .......................................................... 90

Report number C099/11 5 of 90
Summary
During April 2010 – February 2011, monthly surveys of seabirds and marine mammals were conducted
aboard ships engaged in plankton surveys. After many years of little or no effort in far offshore areas of
the DCS, this series of surveys provided the first recent ship-based data on seabirds, covering a large
area (the entire Dutch Continental Shelf (DCS), including some Belgian and British waters) almost year-
round. Due to changes in the design of the survey grid, the use of several ships, spells of bad weather
conditions and seasonal differences in the number of daylight hours, the resulting coverage is not evenly
spread in space and time. Still, both in terms of areas covered and detailed data gathered, this series of
surveys complement the aerial surveys carried out under the same programme Shortlist Masterplan
Wind. By surveying beyond the designated areas for round II offshore wind farms on the DCS, areas that
might be targeted for round III, such as the shallow Dogger Bank area, got a first boost in T-zero survey
effort.
From April 2010 till February 2011 11 surveys, totalling to 48 at-sea days, 4610 5-minute counts were
conducted over a distance of 9021 km. At a counting strip width of mostly 300 m (200 m over a very
small percentage of the counts), this amounts to a total surveyed area of 2706 km2.
The surveys have provided rough data on seabird distribution in far offshore areas. In total, 54,593
individuals of 90 bird species were recorded, from which 15,003 individuals of 36 species were recorded
within the counting strip. Marine mammals were represented by 616 individuals of seven species, of
which 389 individuals of six species were seen within the counting strip. Flying heights were noted for
5044 clusters of individuals, covering 75 species. Behaviour was noted for 1790 (clusters of) individuals.
Apart from birds and marine mammals, 352 balloons were counted (of which 164 were within the
counting strip) and proved omnipresent in periods of offshore winds.
These surveys have identified several issues that should be taken into account in future planning of wind
farms. Divers, which are the highest ranked species in terms of sensitivity to wind farms, can be
encountered migrating anywhere in offshore waters and sightings of White-billed Divers at the Dogger
Bank suggest the existence of a small wintering population of this near-threatened species. In relation to
this, potential effects of wind farms on offshore species, such as Northern Fulmars, Atlantic Puffins, Little
Auks and cetaceans, are unknown as current wind farms are located near shore where these species do
not occur in large numbers.

6 of 90 Report number C099/11
Samenvatting
Maandelijkse tellingen van zeevogels en zeezoogdieren zijn uitgevoerd van april 2010 tot en met februari
2011 aan boord van schepen die werden ingezet voor plankton surveys. Na vele jaren waarin weinig
gegevens in offshore gebieden van het NCP konden worden verzameld vanaf schepen, representeert
deze serie van tochten de eerste recente set gegevens over vogelverspreiding in deze wateren. Ook zijn
er gegevens verzameld in Belgisch en Britse wateren. Vanwege tussentijdse veranderingen in de gevaren
route, het gebruik van verschillende schepen, wisselende weersomstandigheden en seizonale verschillen
in daglichtperiode is de resulterende waarnemingsinspanning niet maandelijks gelijk over het
onderzoeksgebied. Zowel wat betreft de bezochte gebieden als wat betreft de verzamelde
detailgegevens, complementeert dit project echter de vliegtuigtellingen zoals uitgevoerd binnen hetzelfde
programma. Door gebieden te dekken die buiten de fase II gebieden vallen, hebben gebieden die
mogelijk in fase III worden geselecteerd, een eerste set t0 gegevens.
Van april 2010 tot en met februari 2011 zijn 11 tochten gevaren, resulterend in 48 zeedagen, 4610 vijf-
minuten tellingen, en een totale afgelegde afstand (tijdens de tellingen) van 9021 km. Bij een telstrook
van doorgaans 300 m breed (200 m tijdens een zeer klein deel van de tellingen) komt dit neer op een
geïnventariseerd oppervlak van 2706 km2.
De verzamelde gegevens geven een grofmazig beeld van de verspreiding van vogels in offshore
gebieden. In totaal werden 54.593 individuen van 90 vogelsoorten geteld. Hiervan bevonden zich 15.003
individuen van 36 soorten in het transect. Van zeven soorten zeezoogdieren werden 616 individuen
gezien – hiervan bevonden 389 individuen van zes soorten zich in het transect. Vlieghoogtes werden
genoteerd van 5044 (groepen) vogels van 75 soorten. Gedrag werd genoteerd voor 1790 (groepen)
individuen. Naast vogels en zeezoogdieren werden 352 ballonnen geteld (waarvan 164 in het transect),
welke wijd verspreid in perioden met aflandige wind.
Deze zeevogeltellingen brengen enkele fenomenen aan het licht die van belang zijn bij het plannen van
windmolenparken op zee. Migratie van duikers – een groep soorten met een hoge gevoeligheidsindex
voor windmolenparken – vindt over grote delen van de Noordzee plaats, inclusief gebieden die ver van
de kust verwijderd zijn. Waarnemingen van Geelsnavelduikers op de Doggersbank suggereren een kleine
overwinterende populatie van deze bedreigde soort. Op de Doggersbank komt een soortengemeenschap
voor die typisch is voor offshore gebieden. Omdat huidige windmolenparken – en daarmee het onderzoek
naar de invloed daarvan – zich dicht bij de kust bevinden, zijn de mogelijke effecten in deze gebieden
vooralsnog onbekend.

Report number C099/11 7 of 90
1. Introduction
In the light of the further development of offshore wind power on the Dutch Continental Shelf (DCS), the
Dutch government intends to give out permissions for more wind farms from mid-2011 onwards.
Consequently, there is an urgent need to describe an undisturbed T-zero situation for several biological
parameters. In addition to this time constraint, exact locations of the future wind farms are not yet
known, so data are needed for the total area under Dutch jurisdiction, i.e. the whole DCS. Several of
these knowledge gaps are covered in the Shortlist Masterplan Wind program.
Data on distribution of seabirds and marine mammals on the DCS were published in two atlases in the
previous century; one based on ship-based surveys (Camphuysen & Leopold, 1994), the other based on
aerial surveys part of a monitoring programme that became established in 1989 (Baptist & Wolf, 1993).
For the whole North Sea a distribution atlas based on ship-based surveys was published in the same
period (Stone et al. 1995). After publication of these atlases the aerial monitoring programme continued
to the present day (e.g. Arts, 2010), but the ship-based surveys on the DCS became more ad-hoc,
project based. As a result data on the distribution on seabirds (and marine mammals) on the DCS is
unevenly distributed in time and space, and therefore not suitable for an adequate description of T-zero.
In order to fill this gap aerial surveys and ship-based surveys were conducted to obtain data on the
distribution and abundance of seabirds and marine mammals. In this report the results of monthly ship-
based surveys from April 2010 till March 2011 are presented. This survey was carried out along with
another survey that was part of the Shortlist Masterplan Wind program: the so-called “fish eggs and fish
larvae” surveys, covering the entire Dutch Continental Shelf. The result include a set of distribution maps
per species over 11 months, as well as flying heights, modelled detection probabilities and additional
behavioural and plumage data.

8 of 90 Report number C099/11
2. Materials and Methods
Seabirds and marine mammals were surveyed using standard ESAS ship-based survey techniques, which
are extensively described in Tasker et al. (1984) and Komdeur et al. (1992). Seabirds were counted in
five-minute bouts in a 300 m wide strip at one side of the vessel (the side that offers the best viewing
conditions), by two observers working as a team. For each observed individual (or flock), species,
number, distance class, details on plumage, age, sex, associations and behaviour were recorded.
Environmental conditions may influence detection probabilities of birds and mammals and are therefore
recorded. These include sea state (on the Beaufort scale) and visibility (in four classes). The presence of
fishing activities is recorded in terms of distance to visible vessels and the presence of set nets. The
observers are seated in a box, placed centrally and forward on the top-deck of the ship. The box offers
protection against the wind, seating and a desk for writing down results on pre-designed field sheets.
The box is further equipped with a GPS system so that observers can keep track of the position, speed
and course of the ship; these parameters are logged by the bird surveyors.
The surveys were conducted during another survey under the Shortlist Masterplan Wind umbrella: the
fish eggs and larvae survey. The purpose of the latter is to monitor the spatial distribution and seasonal
patterns in the appearance of fish eggs and larvae on the DCS. To this end, a monthly ship-based survey
has been done, during which ichthyoplankton samples were collected at sampling stations in the entire
DCS and surrounding areas. The 91 sampling stations were distributed along a grid containing three
stations per ICES quadrant. The sampling grid was changed during the project, especially after the May
survey (Figure 1 and Figure 2). At each sampling station samples were collected with a plankton torpedo
towed at a ship’s speed of 5 knots. Haul duration was 10 minutes at minimum. During these sampling
stretches no bird counts were made, and bird surveys were therefore restricted to the transect between
the plankton sampling stations. As the sampling of ichthyoplankton continued 24 hours a day, while the
bird surveys could only be conducted along the transects covered during daylight, only part of the study
area could be surveyed for birds.
Three different ships were assigned to the project: the Tridens II was used during June, October-
December 2010 and January 2011; the Zirfaea during August-September 2010 and the Arca during
April-May and July 2010 and in February 2011.
Report number C099/11 9 of 90
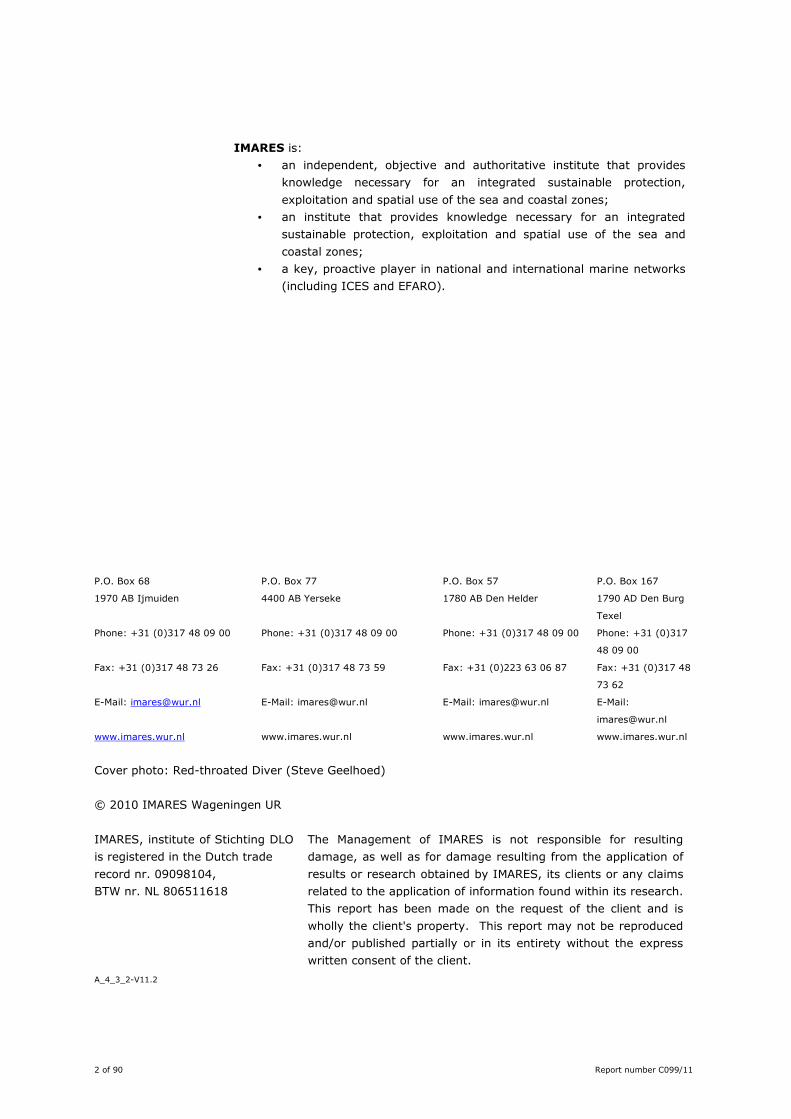
Figure 1 Fish egg and larvae sampling stations during the surveys in April and May 2010 (van Damme et al. 2010)
Figure 2 Fish egg and larvae sampling stations during the surveys in June 2010 – March 2011 (van Damme et al. 2010). Note that effort was greatly reduced in September, November and December due to weather conditions

10 of 90 Report number C099/11
Distance sampling for swimming birds
Objects swimming or floating on the water surface (as opposed to birds in flight) may be hard to detect.
Detection probability is determined by several factors, such as colour, shape and behaviour of the bird.
Especially the distance from the transect line (c.q. the observer) is a major determinant of detection
probability. The technique of distance sampling (Buckland et al. 2001) was used to infer the relationship
between detectability and distance.
All (groups of) birds on the water were assigned to a particular distance class, perpendicular to
the ship’s track line (Table 1). The counting strip consisted of four distance bands: A (0-50m), B (50-
100m), C (100-200m) and D (200-300m). Distance class E contains animals or objects beyond the
counting strip (>300m) and are left out of analyses of distance or detection probability. Birds seen in
distance classes A-D are used to determine the relative probability of detection, in relation to distance,
acknowledging that this probability decreases at increasing distances. In other words, some birds will not
be detected and the probability of missing swimming birds increases as birds are situated further away
from the track line. From the number of individuals counted in bands A-D, a detection function can be
created using the software package Distance (v6.0) (Thomas et al. 2010). Additional effects included in
modelling the detection function were sea state. The detection functions can be used to determine the
so-called effective strip width (ESW) defined as the distance at which the expected number of detected
objects would be the same as for the actual survey (Buckland et al. 2001). Marine mammals were
assigned to the same distance bands, using the position of the first sighting. All balloons sighted on the
water were also noted (per distance band) in order to build a database of sighting of seabirds-sized
objects that would not show behavioural responses (attraction or avoidance) to the ship.
This software offers several model functions that are fitted to the counts per distance band.
These functions are the half-normal, the hazard-rate, the uniform and the negative binomial. Additional
adjustment terms to allow extra flexibility include cosinus, simple polynomial and hermite polynomial
adjustments. First, all combinations of model functions and adjustments were tested. Then, the model
with the lowest AIC was selected.
Note that it is implicitly assumed that all swimming birds will be detected if they swim on the
track line. However, detection probability on the track line (the so-called g(0), Buckland et al. 2001) is
unlikely to be perfect, for example due to escape diving by alcids and Harbour Porpoises. There is
however no correction factor available. Observations using ‘double-platforms’ are needed to assess this
factor.
Note that the assumption of perfect detection of swimming birds at the transect line and of flying
birds within 300m (see below) from the transect line have important consequences in the calculation of
absolute densities but not for distribution patterns.
Table 1 Distance classes for birds seen perpendicular to the ship’s track line
Distance class Distance range (m)
A 0-50
B 50-100
C 100-200
D 200-300
E >300
F Flying birds*
* Flying birds need to fulfil two criteria to be counted as “in transect” and thus to enter the seabird
density calculations. First, they have to pass by the ship at the right side, within 300 m perpendicular
distance. Second, they have to do so at pre-determined snap-shot moments (exactly once every whole
minute) and within a distance forward from the observers which is covered by the steaming ship in one
minute (circa 300 m at 10 knots). For more details, see Tasker et al. 1984) and the next section of this
report.

Report number C099/11 11 of 90
Flying birds
Due to movement of flying birds, and the fact that they usually fly much faster than the sailing speed of
the ship, the density of flying birds is easily overestimated. To account for this overestimation, flying
birds were counted by the so-called snap-shot method (Tasker et al. 1984). This method prescribes that
all birds flying above the transect should be recorded as in the transect at fixed time intervals. Here, we
used a 1-minute interval. The distance travelled within one time interval determines the forward distance
that is regarded as in the transect. For example, at a speed of 12 kt, the distance travelled in one minute
is 370 m, and consequently, all birds flying above the 370 x 300 m rectangle at whole minutes are noted
as within the transect.
All birds in flight were assigned to distance class F. Birds in flight are much more easily detected
than swimming birds and are assumed to be always detected within 300 m. This assumption may not be
necessarily true, but unlike swimming birds, there is no way yet to correct for missed birds. This is an
important issue when it comes to calculating absolute densities, but is of no consequence for relative
measures of abundance. In ship-based seabirds surveys in the North Sea it is commonly assumed that
all flying birds are detected within 300 m but this assumption was never tested. Barbraud & Thiebot
(2009) provided the first data on this issue, during seabirds surveys in the Southern Ocean. They found
that medium-sized seabirds (like gulls and Northern Fulmars in the North Sea situation) were detected
with a probability of circa 0.8 within 300 m, by a single observer watching from the bridge (indoors).
Finally, detection probabilities are influenced by bird behaviour: some birds avoid approaching ships by
diving or by flying off (e.g. divers, auks), while others are attracted to ships (e.g. Fulmars, gulls,
Gannets). The final detection probability is thus dependent from several factors, some working against
each other. We tackled this problem to some extent by always using two observers working as a team
(two observers detect more birds than a single observer, see Evans Mack 2002), and by always carrying
out observations from the top-deck (outdoors). Given the fact that this modus operandi was used, from
relatively large ships offering stable and high vantage points, that always well-trained observers were
used and that most flying birds in the study area are medium-sized, with light coloration, we feel that
detection probability for flying birds within 300 m approached 1.
Behaviour
In addition to recording bird densities, data were collected on bird behaviour (following Camphuysen &
Garthe 2004) and on flying altitudes of birds seen in flight, following methods used for standardized
counts of birds migrating over land (LWVT 1985; Lensink 2002; Leopold et al. 2004) and using altitude
classes as given in Table 2. These additional data were collected for all birds seen and incorporated in the
standard (ESAS) protocol.
Table 2 Altitude classes used to describe the flying height (in meters above sea level) for birds seen in flight
Altitude Class Altitude range (m asl)
1 0-2
2 2-10
3 10-25
4 25-50
5 50-100
6 100-200
7 > 200

12 of 90 Report number C099/11
3. Results
Effort, sea states and fishing activities
From April 2010 till February 2011 11 surveys, totalling to 48 at-sea days, 4610 5-minute counts were
conducted over a distance of 9021 km. At a counting strip width of mostly 300 m (200 m over a very
small percentage of the counts), this amounts to a total surveyed area of 2706 km2 (see Table 3 and
Figure 3). The species specific effective strip width (ESW), however, is smaller than 300 m (see species
accounts). Due to changes in day length and weather conditions, the amount of effort spent differs
between surveys (see Table 3 and Figure 4). During all surveys only part of the transects on the DCS
could be covered. The lowest effort was realised in September and between November and January; the
highest effort between April and August. The effort was mostly determined by sea state. The resulting
spatial coverage is uneven (
Figure 3).
No data were collected during March 2011, although there was a plankton survey. This was due
to changed last-minute planning and the unavailability of professional observers at such short notice.
Observations were conducted only at sea states ranging from 0 to 6 – observations were stopped
at sea states exceeding 6 Bft. The highest sea states were encountered in autumn (see Figure 5).
Table 3 Observer effort per survey
Year Month Ship Observers1 Days 5-min
counts Area
(km2) Distance
(km)
2010 April ms Arca ML & HV 5 562 335.2 1115.8
May ms Arca ML & RvB 7 690 403.6 1343.6
June Tridens II HV & SG 4 551 347.2 1157.7
July ms Arca RvB & GK 5 640 373.7 1245.6
August ms Zirfaea SG & GK 5 590 291.3 971.1
September ms Zirfaea ML & RW 3 277 139.7 465.5
October Tridens II HV & SG 5 412 261.1 870.2
November Tridens II ML & HV 3 148 97.5 325.0
December Tridens II SG & RW 2 130 84.2 280.6
2011 January Tridens II RW & LW 4 207 141.1 470.5
February ms Arca RvB & SG 5 398 230.9 772.4
Total 48 4605 2705.5 9018.1
1 RvB Rob van Bemmelen; SG Steve Geelhoed; GK Guido Keijl; ML Mardik Leopold; HV Hans Verdaat; LW Louis
Witte; RW Richard Witte
Report number C099/11 13 of 90
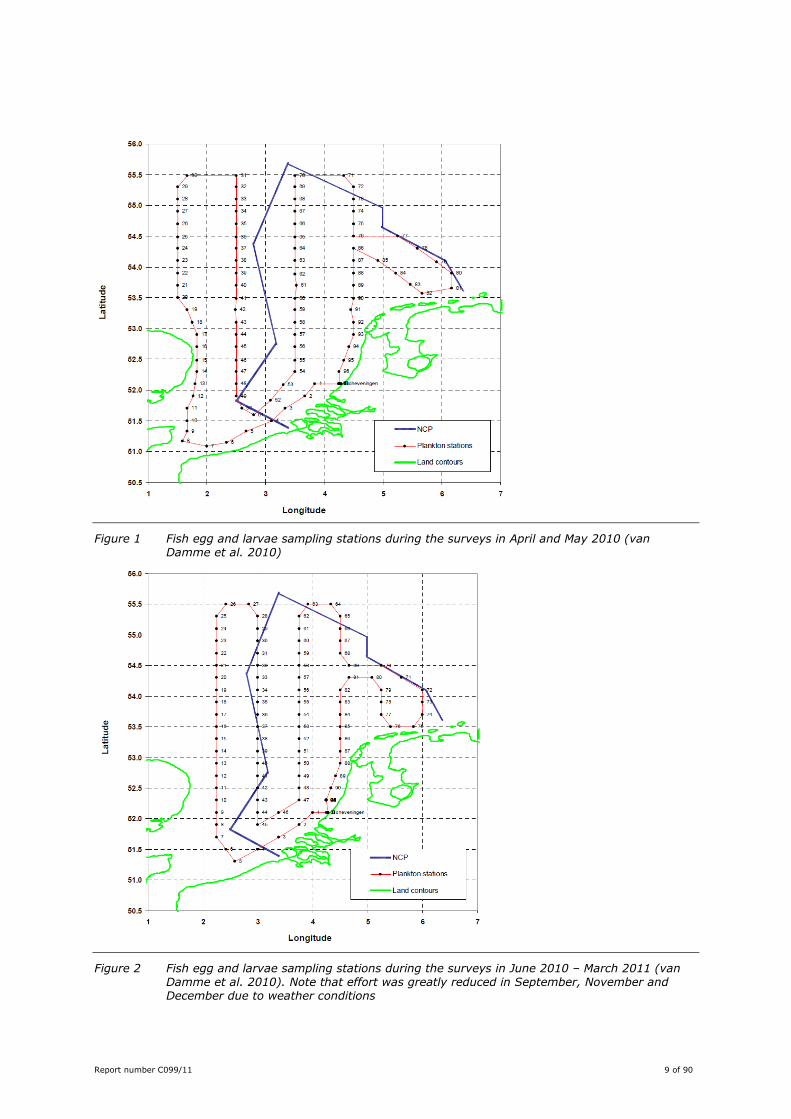
Figure 3 Total surveyed area (km2) per 25x25km block. This is the summation of the area surveyed
during each 5-minute count (which is the distance travelled multiplied by the counting strip
width) of which the midpoints fall within the boundaries of a 25x25 block. Therefore, this
may include segments covered in more than one visit

14 of 90 Report number C099/11
Figure 4 Effort per month, expressed as the number of 5-minute counts and the surveyed area (km2)
Figure 5 Distribution of sea states over travelled distance per survey

Report number C099/11 15 of 90
Figure 6 Sea states (Bft) during the surveys in April 2010 - February 2011
16 of 90 Report number C099/11
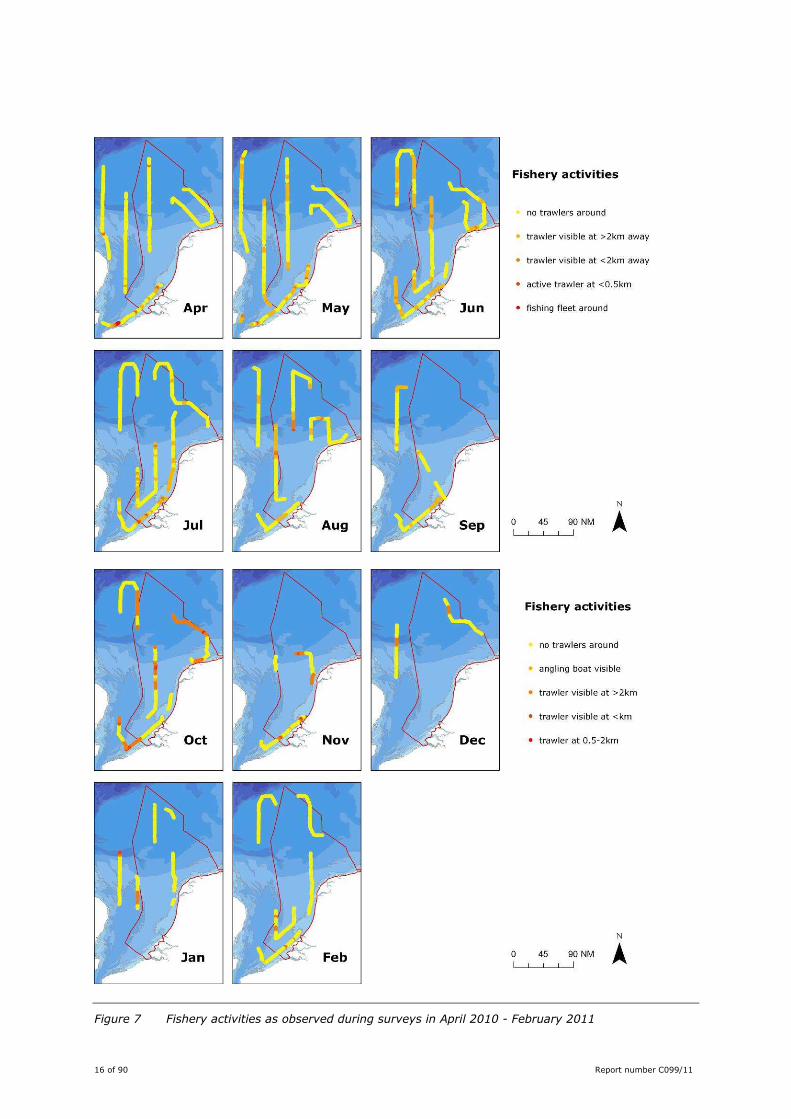
Figure 7 Fishery activities as observed during surveys in April 2010 - February 2011

Report number C099/11 17 of 90
Fishing activities
Active fishery vessels were observed on all surveys, scattered over the entire study area (Figure 7). Set
nets were mainly recorded off the Belgian coast.
Collected data
In total, 54593 individuals of 90 bird species were recorded. Of these, 15003 individuals of 36 species
were recorded within the counting strip. Marine mammals were represented by 616 individuals of seven
species, of which 389 individuals of six species were seen within the counting strip. Flying heights were
noted for 5044 clusters of individuals, covering 75 species. Behaviour and/or associations were noted for
1790 (clusters of) individuals. Apart from birds and marine mammals ‘anthropogenic’ objects were
counted. In total 352 balloons were counted, of which 164 were within the counting strip (see Table 5
and Table 6 for details). Furthermore, 48 set net (flags) were noted, of which 15 within the counting
strip.
Detection probabilities
Detection probability curves have been determined for swimming Northern Fulmars, Northern Gannets,
Lesser Black-backed Gulls, Black-legged Kittiwakes, large alcids (Common Guillemot and Razorbill), small
alcids (Atlantic Puffin and Little Auk), Harbour Porpoises and balloons. Alcids are rather hard to detect on
the water as they often occur singly and are dark-backed, which makes them hard to see in less sunny
conditions and at greater distances. Harbour Porpoises are even harder to detect, as they stay mostly
under water. The latter only surface to breathe, as opposed to auks that only dive to feed: “surfacers”
versus “divers”. Porpoises near the track line are often disturbed by the approaching vessel and might
flee away suddenly, with a conspicuous splash, known as “rooster tail”. Animals at greater perpendicular
distances are less prone to disturbance and are more often missed. Balloons on the other hand, are often
brightly coloured and do not respond to ships. We would therefore expect a flat detection curve for
balloons and steep detection curves for Harbour Porpoise and the smaller alcids (Atlantic Puffin and Little
Auk), with larger alcids (Razorbill and Guillemot) showing intermediate detection curves. The results are
included in the species accounts.
Estimated effective strip widths per sea state per species are presented in Table 4, together with
their associated correction factors used to correct observed numbers for missed individuals.

18 of 90 Report number C099/11
Table 4 Estimated Effective Strip Width, corresponding correction factors and the associated sample size per sea state for swimming seabirds, Harbour Porpoises and balloons. Note that esw and cf have been modelled by using all available data, allowing estimates for all cells, even when samples sizes were zero
Sea state (Bft)
Species 0 1 2 3 4 5 6
Lesser Black-backed Gull ss 48 44 86 77 60 12 7
esw 263 257 250 243 234 224 214
cf 1.14 1.17 1.20 1.24 1.28 1.34 1.40
Black-legged Kittiwake ss 0 2 76 87 135 56 11
esw 267 253 235 212 185 157 130
cf 1.12 1.18 1.28 1.42 1.62 1.91 2.30
Northern Fulmar ss 3 21 83 117 167 70 3
esw 285 273 252 220 179 135 99
cf 1.05 1.10 1.19 1.36 1.68 2.22 3.04
Northern Gannet ss 0 4 50 84 86 45 8
esw 298 295 287 265 216 144 85
cf 1.01 1.02 1.05 1.13 1.39 2.08 3.52
large alcids ss 13 156 412 557 570 390 71
(Common Guillemot & Razorbill) esw 238 225 210 193 176 158 141
cf 1.26 1.34 1.43 1.55 1.71 1.90 2.13
small alcids ss 10 5 13 16 15 35 0
(Atlantic Puffin & Little Auk) esw 195 183 170 157 145 133 122
cf 1.54 1.64 1.77 1.91 2.07 2.26 2.47
Harbour Porpoise ss 12 37 62 55 27 10 9
esw 161 160 158 157 156 155 154
cf 1.86 1.88 1.90 1.91 1.93 1.94 1.95
balloon ss 1 7 35 36 31 9 3
esw 159 159 159 159 159 160 160
cf 1.88 1.88 1.88 1.88 1.88 1.88 1.88
ss = sample size; esw = effective strip width; cf = correction factor

Report number C099/11 19 of 90
Table 5 Species list with total number of recorded individuals and the total number within the
transect strip. Note that the total refers to the number of individuals recorded (as opposed
to the number of detections or clusters)
Species total in transect
Birds Red-throated Diver Gavia stellata 86 17 Black-throated Diver Gavia arctica 15 5 unidentified small diver Gavia stellata / G arctica 25 3 White-billed Diver Gavia adamsii 2 1 unidentified great diver Gavia adamsii / G immer 2 Red-necked Grebe Podiceps grisegena 2 2 Northern Fulmar Fulmarus glacialis 3457 1583 Sooty Shearwater Puffinus griseus 9 4 Manx Shearwater Puffinus puffinus 6 1 Balearic Shearwater Puffinus mauretanicus 1 European Storm-petrel Hydrobates pelagicus 4 2 Northern Gannet Morus bassanus 2669 624 Great Cormorant Phalacrocorax carbo 608 315 Greylag Goose Anser anser 5 Brent Goose Branta bernicla 15 Common Shelduck Tadorna tadorna 42 Eurasian Wigeon Anas penelope 7 Gadwall Anas strepera 2 EurasianTeal Anas crecca 1 Tufted Duck Aythya fuligula 5 2 Black Scoter Melanitta nigra 454 12 Red-breasted Merganser Mergus serrator 5 Osprey Pandion haliaetus 1 Eurasian Oystercatcher Haematopus ostralegus 3 Ringed Plover Charadrius hiaticula 1 Grey Plover Pluvialis squatarola 1 Northern Lapwing Vanellus vanellus 17 Red Knot Calidris canutus 4 Purple Sandpiper Calidris maritima 2 Dunlin Calidris alpina 1 Ruff Philomachus pugnax 1 1 Snipe Gallinago gallinago 19 Eurasian Woodcock Scolopax rusticola 1 Bar-tailed Godwit Limosa lapponica 1 Eurasian Curlew Numenius arquata 3 Common Redshank Tringa totanus 2 1 Common Sandpiper Actitis hypoleucos 1 Ruddy Turnstone Arenaria interpres 2 Pomarine Skua Stercorarius pomarinus 16 5 Arctic Skua Stercorarius parasiticus 37 13 Great Skua Stercorarius skua 72 23 Little Gull Larus minutus 301 124 Black-headed Gull Larus ridibundus 393 259 Common Gull Larus canus 835 349 Lesser Black-backed Gull Larus fuscus 18845 3231 Herring / Lesser Black-backed gull L. fuscus / L. argentatus 4100 Herring Gull Larus argentatus 1652 438 Great Black-backed Gull Larus marinus 2220 591 large gull Larus spec. 226 Black-legged Kittiwake Rissa tridactyla 8137 1714 Sandwich Tern Sterna sandvicensis 555 141 Common Tern Sterna hirundo 214 104 Arctic Tern Sterna paradisaea 208 109 Common / Arctic tern S. hirundo / S. paradisaea 150 8 Little Tern Sterna albifrons 2 2 Black Tern Chlidonias niger 6 4 Common Guillemot Uria aalge 6810 4575 Common Guillemot / Razorbill Alca torda / Uria aalge 56 27 Razorbill Alca torda 768 542 Little Auk Alle alle 23 9 Atlantic Puffin Fratercula arctica 153 120 domestic pigeon Columba livia 7

20 of 90 Report number C099/11
Eurasian Collared Dove Streptopelia decaocto 4 Common Swift Apus apus 7 Sky Lark Alauda arvensis 4 unidentified lark unidentified lark 40 Barn Swallow Hirundo rustica 7 3 Meadow Pipit Anthus pratensis 6 Yellow Wagtail Motacilla flava 1 Grey Wagtail Motacilla cinerea 1 Pied Wagtail Motacilla alba 2 European Robin Erithacus rubecula 2 Common Redstart Phoenicurus phoenicurus 1 Northern Wheatear Oenanthe oenanthe 4 Ring Ouzel Turdus torquatus 1 Common Blackbird Turdus merula 24 Fieldfare Turdus pilaris 3 Song Thrush Turdus philomelos 4 Redwing Turdus iliacus 14 Mistle Thrush Turdus viscivorus 1 Sedge Warbler Acrocephalus schoenobaenus 1 Marsh Warbler Acrocephalus palustris 1 Lesser Whitethroat Sylvia curruca 1 Common Whitethroat Sylvia communis 1 Blackcap Sylvia atricapilla 2 Common Chiffchaff Phylloscopus collybita 5 Willow Warbler Phylloscopus trochilus 1 Goldcrest Regulus regulus 3 Great Tit Parus major 6 Rook Corvus frugilegus 4 Common Starling Sturnus vulgaris 1138 38 Chaffinch Fringilla coelebs 3 Brambling Fringilla montifringilla 1 Common Linnet Carduelis cannabina 1 Snow Bunting Plectrophenax nivalis 1 1 Individuals 54563 15003 Species 90 36
Marine mammals Minke Whale Balaenoptera acutorostrata 3 1 unidentified dolphin Dolphin 3 Bottlenose Dolphin Tursiops truncatus 3 3 Common Dolphin Delphinus delphis 2 White-beaked Dolphin Lagenorhynchus albirostris 15 10 Harbour Porpoise Phocoena phocoena 552 348 unidentified seal unidentified pinniped 5 3 Grey Seal Halichoerus grypus 15 8 Common Seal Phoca vitulina 18 16 Individuals 616 389 Species 7 6
set net (flag) 48 15 Classic balloon 281 131 Foil balloon 71 33 Total 352 164

Report number C099/11 21 of 90
Table 6 List of species and the absolute numbers counted within the transect per survey. Note that
these numbers are lower than those given in the cruise reports, as those included individuals
seen outside the counting strip. Only non-passerines and individuals inside the counting
strips are included in the analyses
2010 2011
Species
Ap
r
May
Ju
n
Ju
l
Au
g
Sep
Oct
No
v
Dec
Jan
Feb
total
Birds
Red-throated Diver 3 1 8 5 17
Black-throated Diver 5 5
White-billed Diver 1 1
unidentified diver 3 3
Red-necked Grebe 2 2
Northern Fulmar 41 1143 260 29 72 8 7 1 1 16 5 1583
Sooty Shearwater 3 1 4
Manx Shearwater 1 1
European Storm-petrel 1 1 2
Northern Gannet 40 20 75 24 60 27 161 30 9 13 165 624
Great Cormorant 5 4 290 11 2 3 315
Tufted Duck 2 2
Black Scoter 8 4 12
Pomarine Skua 1 1 2 1 5
Arctic Skua 6 1 1 5 13
Great Skua 3 5 2 5 3 1 3 1 23
Little Gull 52 45 15 2 10 124
Black-headed Gull 2 2 1 250 4 259
Common Gull 2 2 3 1 1 51 2 4 283 349
Lesser Black-backed Gull 500 696 357 1183 447 23 4 1 20 3231
Herring Gull 10 198 7 165 15 13 11 1 7 11 438
Great Black-backed Gull 50 5 12 10 22 19 355 42 14 13 49 591
Black-legged Kittiwake 81 287 561 48 163 27 53 56 20 64 354 1714
Sandwich Tern 98 20 14 2 5 2 141
Common Tern 3 17 14 1 67 2 104
Arctic Tern 80 14 3 12 109
Common / Arctic tern 7 1 8
Little Tern 2 2
Black Tern 2 2 4
Common Guillemot 337 138 835 505 385 88 665 126 344 305 846 4574
Common Guillemot / Razorbill 17 10 27
Razorbill 83 24 29 2 9 18 50 36 30 261 542
Little Auk 1 1 7 9
Atlantic Puffin 51 17 2 1 1 4 2 42 120
Total (individuals) 1464 2589 2464 1991 1248 239 1637 355 429 472 2072 14960
Total (species) 21 16 15 16 16 21 16 15 10 10 16 33

22 of 90 Report number C099/11
Table 6 (continued)
2010 2011
Species A
pr
May
Ju
n
Ju
l
Au
g
Sep
Oct
No
v
Dec
Jan
Feb
total
Marine mammals
Minke Whale 1 1
Bottlenose Dolphin 3 3
White-beaked Dolphin 10 10
Harbour Porpoise 61 70 83 50 4 20 11 5 2 3 39 348
unidentified seal 1 2 3
Grey Seal 1 1 2 1 1 1 1 8
Common Seal 1 2 8 1 2 1 1 16
Total (individuals) 63 83 93 55 4 21 14 8 3 4 41 389
Total (species) 3 4 3 3 1 2 2 3 2 2 3 6
Objects
Set net (flag) 4 3 4 2 1 1 15
Classic balloon 48 3 45 11 9 2 2 11 131
Foil balloon 11 8 14 33
Total balloons 59 11 0 59 11 9 2 0 0 2 11 164
5-min counts
Count with no birds/mammals 123 162 151 172 215 102 92 9 14 40 51 1131
Count with birds/mammals 439 528 400 468 375 175 320 139 116 167 347 3474
Percentage counts with no
birds/mammals 22 23 27 27 36 37 22 6 11 19 13 25
Total number of counts 562 690 551 640 590 277 412 148 130 207 398 4605

Report number C099/11 23 of 90
Species accounts
Species accounts are presented per species group and contain at least the following information: spatial
distribution, seasonal occurrence and behaviour (including flying heights). If relevant, data on moult and
age-composition is presented and discussed. Detection curves are presented for Northern Gannet,
Northern Fulmar, Black-legged Kittiwake, Lesser Black-backed Gull, large alcids (Common Guillemot and
Razorbill), small alcids (Atlantic Puffin and Little Auk), Harbour Porpoises and balloons. These are the
species for which the sample size (the number of clusters of birds sitting on the water) was large enough
to allow reasonable model output.
For abundant species spatial distribution is illustrated with maps, showing monthly distribution patterns
of birds seen within the transect. For scarcer species, observations are plotted in one map. In case of
divers, rare tubenoses, cetaceans and seals, sightings outside the transect are also plotted.
In addition, the vulnerability to wind farms (see below),and the species conservation status are shown in
the species headings. These are meant to help the reader assess the importance of the particular species
to planning of wind farms.
Wind farm sensitivity index
To quantify the vulnerability of seabirds to wind farms, Garthe & Hüppop (2004) developed a windfarm
sensitivity index for seabirds in German waters. This index is based on nine species-specific factors
grouped in flight behaviour (flight manoeuvrability; flight altitude; percentage of time flying; nocturnal
flight activity), general behaviour (sensitivity towards disturbance by ship and helicopter traffic; flexibility
in habitat use) and status (biogeographical population size; adult survival rate; and European threat and
conservation status). Each factor was scored on a 5-point scale from 1 (low vulnerability) to 5 (high
vulnerability). For all three groups, an average score was calculated, which were multiplied by each other
to give a species specific index (SSI). Since several species were not assigned an index by Garthe &
Hüppop (2004), their work has been extrapolated to Dutch waters by Leopold & Dijkman (2010) for an
assessment of future offshore wind farms in relation to birds on the Dutch Continental Shelf. Apart from
an extension of considered species, the SSIs were adjusted for a number of species by the sensitivity to
ship disturbance (cf. Garthe & Hüppop 2004). The indices are presented in Appendix A.
These indices should be used with caution – low values do not necessarily mean that there is no or little
effect on small scales. Another criticism on these indices is that they do not consider the sensitivity to
wind farms by birds at the sea surface. The physical presence of the turbines or produced (underwater)
sound can cause animals to partly or completely avoid the area. Alternatively, the presence of the
turbines can result in the creation of an artificial reef, in which the foundations of the wind mills act as a
substrate on which animals and plants can grow, thereby attracting fish. Such changes to the fish fauna
and productivity are likely to be neutral or even positive to opportunistic feeders like Cormorants or
Harbour porpoises.
Conservation status
The conservation status is reflected by the status assessment of the International Union for Conservation
of Nature (IUCN) and the listing of the species in appendices of the Bonn Convention and the Bern
Convention. The IUCN is the world's main authority on the conservation status of species. The aim of the
IUCN Red List of threatened species is to assess the risk of extinction. From low to high conservation
status, the following categories are used: Least Concern (LC), Near-threatened (NT), Vulnerable (VU),
Endangered (EN) and Critically Endangered (CR), Extinct in the Wild (EW) and Extinct (EX).

24 of 90 Report number C099/11
The Bonn Convention, also known as the Convention on the Conservation of Migratory Species (CMS),
aims to conserve migratory species. Membership parties strive to protect these species and their
habitats. In Appendix I of the convention, migratory species threatened with extinction are listed.
Appendix II lists species that need or would significantly benefit from international co-operation.
The Bern Convention, in full the Bern Convention on the Conservation of European Wildlife and Natural
Habitats, is aimed at conserving wild flora and fauna and their natural habitats. Strictly protected fauna
species are listed in Appendix II; protected fauna species are listed in Appendix III
Photo 1 Two Northern Gannets. (Guido Keijl)
Report number C099/11 25 of 90
Divers
White-billed Diver Gavia adamsii
SSI = 68.3; Conservation status: IUCN (2009): Near Threatened; Appendix II Bonn Convention
Red-throated Diver Gavia stellata
SSI =45.0; Conservation status: Annex I Birds Directive; Appendix II Bonn Convention; Appendix II Bern Convention; IUCN (2009): Least Concern
Black-throated Diver Gavia arctica
SSI = 49.5; Conservation status: IUCN (2009): Least Concern; Appendix II Bonn Convention
Divers are ranked as the most sensitive species with regards to offshore windfarms (Garthe & Hüppop
2004; Leopold & Dijkman 2010). Red-throated and Black-throated Divers are notoriously difficult to
survey from ships, since they flee at great distance for approaching vessels. Furthermore divers in winter
plumage are difficult to recognize, when seen under less optimal observation conditions. During the
surveys 79,2% of the divers (n = 130) could be identified to species level. The ratio between the two
smaller species Black-throated and Red-throated Diver was 1:5.7 within the transects. Divers were seen
between October and April.
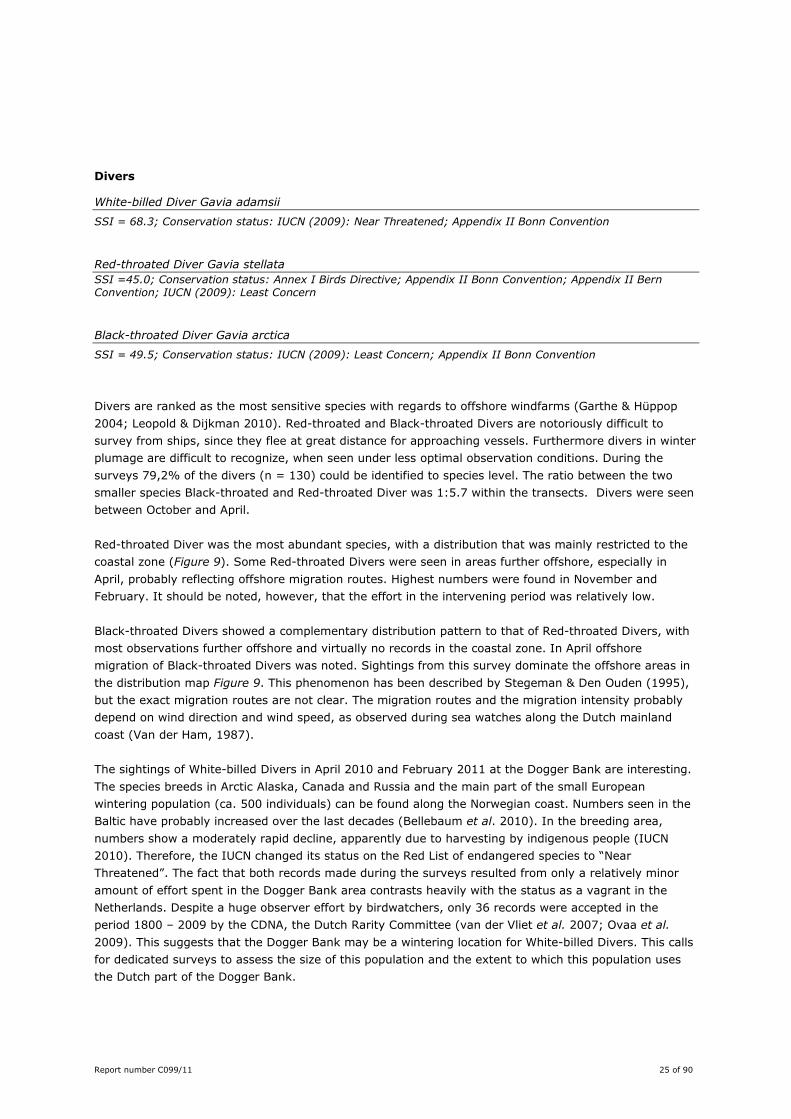
Red-throated Diver was the most abundant species, with a distribution that was mainly restricted to the
coastal zone (Figure 9). Some Red-throated Divers were seen in areas further offshore, especially in
April, probably reflecting offshore migration routes. Highest numbers were found in November and
February. It should be noted, however, that the effort in the intervening period was relatively low.
Black-throated Divers showed a complementary distribution pattern to that of Red-throated Divers, with
most observations further offshore and virtually no records in the coastal zone. In April offshore
migration of Black-throated Divers was noted. Sightings from this survey dominate the offshore areas in
the distribution map Figure 9. This phenomenon has been described by Stegeman & Den Ouden (1995),
but the exact migration routes are not clear. The migration routes and the migration intensity probably
depend on wind direction and wind speed, as observed during sea watches along the Dutch mainland
coast (Van der Ham, 1987).
The sightings of White-billed Divers in April 2010 and February 2011 at the Dogger Bank are interesting.
The species breeds in Arctic Alaska, Canada and Russia and the main part of the small European
wintering population (ca. 500 individuals) can be found along the Norwegian coast. Numbers seen in the
Baltic have probably increased over the last decades (Bellebaum et al. 2010). In the breeding area,
numbers show a moderately rapid decline, apparently due to harvesting by indigenous people (IUCN
2010). Therefore, the IUCN changed its status on the Red List of endangered species to “Near
Threatened”. The fact that both records made during the surveys resulted from only a relatively minor
amount of effort spent in the Dogger Bank area contrasts heavily with the status as a vagrant in the
Netherlands. Despite a huge observer effort by birdwatchers, only 36 records were accepted in the
period 1800 – 2009 by the CDNA, the Dutch Rarity Committee (van der Vliet et al. 2007; Ovaa et al.
2009). This suggests that the Dogger Bank may be a wintering location for White-billed Divers. This calls
for dedicated surveys to assess the size of this population and the extent to which this population uses
the Dutch part of the Dogger Bank.

26 of 90 Report number C099/11
A small proportion of the divers (26,7%, n = 101) was seen at the sea surface; of which one Red-
throated Diver was apparently diving for food. The majority was seen flying, presumably partly disturbed
by the approaching vessel. Of the Red-throated divers 73,5% were seen flying (n = 86), the percentage
of flying Black-throated Divers was 60% (n = 15). The data on flight altitudes were pooled (Figure 8),
and show that flying divers were predominantly seen in the lower height classes (< 25 m), with a median
height of 2-10 m. A small proportion was flying at higher altitudes between 25-50 m. Group size
apparently did not influence the flying height. These findings are in accordance with coastal observations
of migrating divers in the North Sea, which may fly well below 25 meters but predominantly directly
above the sea surface (pers obs). Systematic observations on Wangerooge in autumn 1999 (Krüger &
Garthe, 2001) quantify these findings for Red-throated Divers, showing that migrating individuals mostly
fly at altitudes below 25 m. Flying height is lower with headwinds than with tailwinds. In headwinds the
proportion of low (< 1.5 m) flying birds increased from 60% in light winds to 100% at wind speeds
above 10.8 m/sec. During tail winds the greatest percentage of Red-throated Divers remained low-flyers,
but the proportion of birds flying at medium heights (1.5-12 m) increased with higher wind speed.
Twenty per cent of the ‘small divers’ (Red-throated or Black-throated Divers) remained unidentified
(n=126). Of the proportion identified, 86% was identified as Red-throated and the remainder as Black-
throated Diver (n=101). For comparison: during land-based migration counts, only 16% of the ‘small
divers is identified (Camphuysen 2009b). Also during aerial surveys, only a very small proportion of the
birds can be identified to species level with confidence (e.g. Baptist & Wolf 1993; Arts 2010).
Given their vulnerability to offshore wind farms (Garthe & Hüppop 2004, Leopold & Dijkman 2010), the
offshore spring migration and the likely existence of a wintering population of White-billed Divers call for
special attention during planning of wind farms.
Figure 8 Flying heights of Red-throated and Black-throated Divers (n=40)
Report number C099/11 27 of 90
Figure 9 Maps showing sightings of four groups of rarer species for all surveys combined: divers (Red-throated, Black-throated and White-billed Diver); tubenoses (Sooty, Manx and Balearic Shearwater and British Storm-petrel); cetaceans other than Harbour Porpoise (White-
beaked, Bottlenose and Common Dolphin and Minke Whale); and seals (Grey and Harbour Seal). Unidentified divers, cetaceans and seals are not shown

28 of 90 Report number C099/11
Tubenoses
Northern Fulmar Fulmarus glacialis
SSI = 5.8; Conservation status: IUCN (2009): Least Concern
From the tubenoses, Northern Fulmar ranks among the species with the lowest wind farm sensitivity
index values.
During the surveys Northern Fulmar was by far the most numerous tubenose. Its distribution was limited
to offshore areas, without any observations in the coastal zone. Areas with high densities include the
Dogger Bank, the Cleaver Bank, English Channel and the Frisian Front (Figure 10). Northern Fulmars
showed a clear seasonal pattern with highest densities during May-August and lowest densities during
autumn and winter. Virtually all birds belonged to the light morph (van Franeker & Wattel 1982), that
constitutes the majority of the breeders in southern latitudes. Observations of individuals belonging to
the dark morph, breeding at higher latitudes, were scarce (n = 14) and showed no clear pattern.
The majority of the Fulmars of which the behaviour was recorded, was seen resting or asleep at the sea
surface, 5% was scavenging around fishing vessels, 13% of the animals was actively feeding (either
dipping or surface pecking).
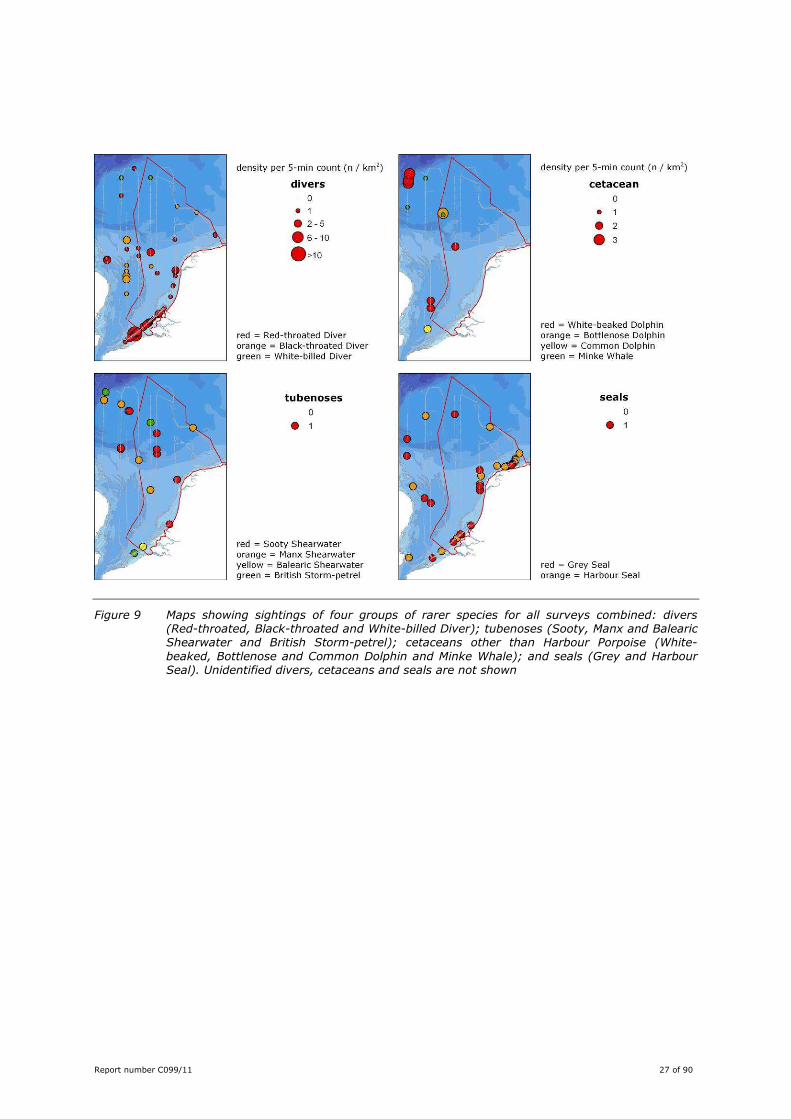
About a third of the Fulmars was seen flying (35.1%, n =1927). Flying Fulmars were predominantly seen
in the lower height classes (< 10 m), with a median height below 2 m. A small proportion of the birds
was flying above 10 m (Figure 12). Group size apparently did not influence the flying height. These
findings are in accordance with observations of migrating individuals along the North Sea coast, which
perform a characteristic flap and glide flight with stiff wings, trailing the sea surface with a wing tip.

Report number C099/11 29 of 90
Figure 10 Distribution of Northern Fulmars during surveys in April 2010 – February 2011
30 of 90 Report number C099/11
Figure 11 Modelled detection functions of (groups of) swimming Northern Fulmars per sea state (Bft) (n=464). The percentage missed increases with sea state
Figure 12 Flying heights of Northern Fulmars (n=557)
Report number C099/11 31 of 90
Sooty Shearwater Puffinus griseus
SSI = -; Conservation status: IUCN (2009): Near Threatened
Manx Shearwater Puffinus puffinus
SSI = -; Conservation status: IUCN (2009): Least Concern
Balearic Shearwater Puffinus mauretanicus
SSI = -; Conservation status: Appendix I Bonn Convention; IUCN (2009): Critically Endangered
European Storm-petrel Hydrobates pelagicus -
SSI = -; Conservation status: IUCN (2009): Least Concern
Apart from Northern Fulmars, observed tubenose species were European Storm-petrel, Sooty, Manx and
Balearic Shearwater. These species were too scarce in German and Dutch waters to warrant a sensitivity
index. These species show similarities in flight behaviour and general behaviour, but show marked
differences in status. Their behavioural sensitivity to wind farms may therefore be roughly similar to
Northern Fulmar, but their vulnerability to habitat loss and/or increased mortality may be different given
their conservation status (see above). Like in Northern Fulmar, no studies on the effect of offshore wind
farms have yet been conducted in areas where densities of these species are high.
The number of sightings is low, totalling 20 for all species together. These species were mainly seen in
offshore areas (Figure 9), the only exception was a Balearic Shearwater off Walcheren, Zeeland, in July
2010. Occurrence in near-shore waters seems typical for this species. Also, in July, two Manx
Shearwaters were seen; other observations of this species were done in May (1), and August-September
(3). Sooty Shearwaters (9) were seen in August-November, with the majority in September. Four
observations of European Storm-petrel were made: three in the north western part of the survey area
(Apr-May, Sep), one in October off the Belgian coast.
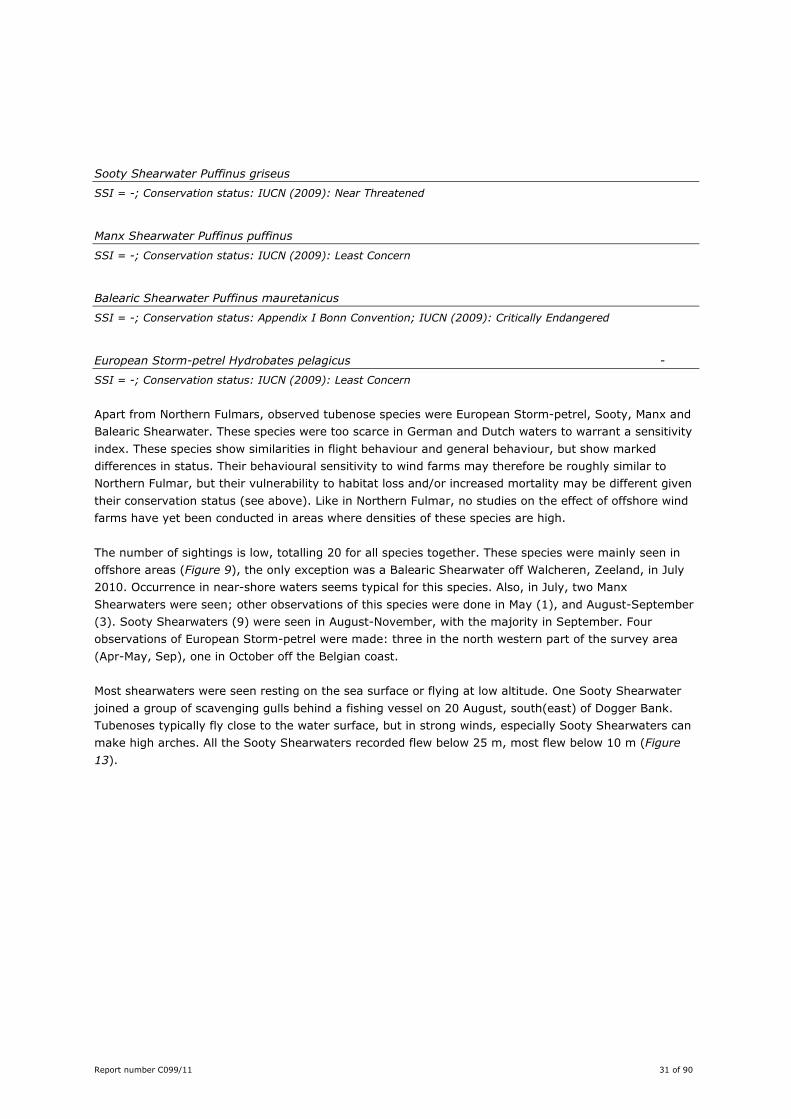
Most shearwaters were seen resting on the sea surface or flying at low altitude. One Sooty Shearwater
joined a group of scavenging gulls behind a fishing vessel on 20 August, south(east) of Dogger Bank.
Tubenoses typically fly close to the water surface, but in strong winds, especially Sooty Shearwaters can
make high arches. All the Sooty Shearwaters recorded flew below 25 m, most flew below 10 m (Figure
13).
32 of 90 Report number C099/11
Figure 13 Flying heights of Sooty Shearwaters (n=7)

Report number C099/11 33 of 90
Gannets
Northern Gannet Morus bassanus
SSI = 11.0; Conservation status: IUCN (2009): Least Concern
The Northern Gannet was assigned a SSI of 11.0, meaning that the species is not particularly sensitive to
wind farms.
Gannets were widespread, with a patchy distribution and temporary areas with high densities (Figure
14). Adults in spring in the north eastern part of the study area, especially during April-July, may
originate from Helgoland. Adults in western areas are likely to originate from colonies of the Bempton
cliffs or Bass Rock, Scotland. Satellite-tagged chick-rearing breeders from Bass Rock made regular
foraging trips well extending to the Outer Silver Pit and the Dutch part of the Dogger Bank or even
further east (Hamer et al. 2000; 2007). Two areas regularly held high concentrations of Gannets. First,
the Dogger Bank and nearby Silver Pit, especially during June, August and October. Second, the Belgian
continental shelf, mainly in April, June, October and February (Figure 14).
Gannets acquire their adult plumage after four or five years. During the surveys the plumage of observed
individuals has been scored according to the classification of Tasker et al. (1986). Immatures (I2-I5)
dominated in April-September. The first juveniles (J1) were seen in August. With progressing autumn
(migration) the proportion of adults increased. This pattern reflects the migration of North Atlantic
Gannets. After the breeding season they migrate to their wintering areas in West-Africa or in the
Mediterranean. Adults stay longer at northern latitudes than juvenile and immature birds, and return
early to the breeding colonies where most stay in the vicinity of the colonies during the breeding season.
Immature birds stay in the wintering grounds or migrate later towards the breeding grounds than adults
(Nelson, 1978). This pattern is reflected in the age composition of the Northern Gannets recorded during
these surveys (Figure 15).
A large part of the Northern Gannets were seen in directional flight (28%), many were resting on the
water surface (21%). Gannets seen actively searching for prey comprised 16% of the individuals, some
of which were associated with cetaceans; 8% were actually seen diving. Gannets associated with
anthropogenic activities, especially with fishing vessels (12%), with the observers’ ship and other ships
(5%) and with offshore platforms (4%).
Flying Gannets were predominantly seen flying at relatively low altitudes (<25 m), with a median height
between 2-10 m. A small proportion of birds was seen flying above 25 m, up to the height class of 100-
200 m (Figure 17).

34 of 90 Report number C099/11
Figure 14 Distribution of Northern Gannets during surveys in April 2010 – February 2011

Report number C099/11 35 of 90
Figure 15 Plumage composition of Northern Gannets, following the age/plumage classification of Tasker et al. (1986). (n=1596)
Figure 16 Modelled detection functions of (groups of) swimming Northern Gannets per sea state (Bft) (n=277). The percentage missed increases dramatically with sea state, but this is probably a result of low sample sizes at high sea states (cf Table 4) and possibly a behavioural effect, in which birds were more prone to alight close to the ship with heavy winds

36 of 90 Report number C099/11
Figure 17 Flying heights of Northern Gannets (n=777)

Report number C099/11 37 of 90
Skuas
Arctic Skua Stercorarius parasiticus
SSI = 13.3; Conservation status: IUCN (2009): Least Concern
Pomarine Skua Stercorarius pomarinus
SSI = 15.0; Conservation status: IUCN (2009): Least Concern
Great Skua Stercorarius skua
SSI = 16.5; Conservation status: IUCN (2009): Least Concern
Sensitivity index values of skuas range from 13.3 for Arctic to 16.5 for Great Skua, ranking them among
species with medium sensitivity to wind farms.
Great Skua was the most numerous skua with observations in almost every month, except May. Most
Arctic Skuas were seen in April and September. In April the distribution was restricted to the Belgian
coastal zone, despite poor coverage the records in September were distributed over the largest area.
Other records were made in June and August. Pomarine Skuas were seen in September-December.
Most skuas were seen flying: ranging from 59.1% for Great Skua, 88.9% for Arctic Skua to 92.8% for
Pomarine Skua. Apart from two resting Great Skuas the behaviour of all skuas was recorded as
kleptoparasitising. Flying skuas were predominantly seen at lower altitudes (<50 m), with a median
height between 2-10 m. A small proportion of birds was seen flying between 50 and 100 m (Figure 18).
Figure 18 Flying heights of Great, Pomarine and Arctic Skua (n=58)

38 of 90 Report number C099/11
Figure 19 Distribution of skuas during surveys in April 2010 - February 2011
Report number C099/11 39 of 90
Gulls
Little Gull Hydrocoloeus minutus
SSI = 16.0; Conservation status: Annex I Birds Directive; Appendix II Bern Convention; IUCN (2009): Least
Concern
The Little Gull was assigned a vulnerability index for wind farms of 16.0, reflecting a medium sensitivity
to wind farms.
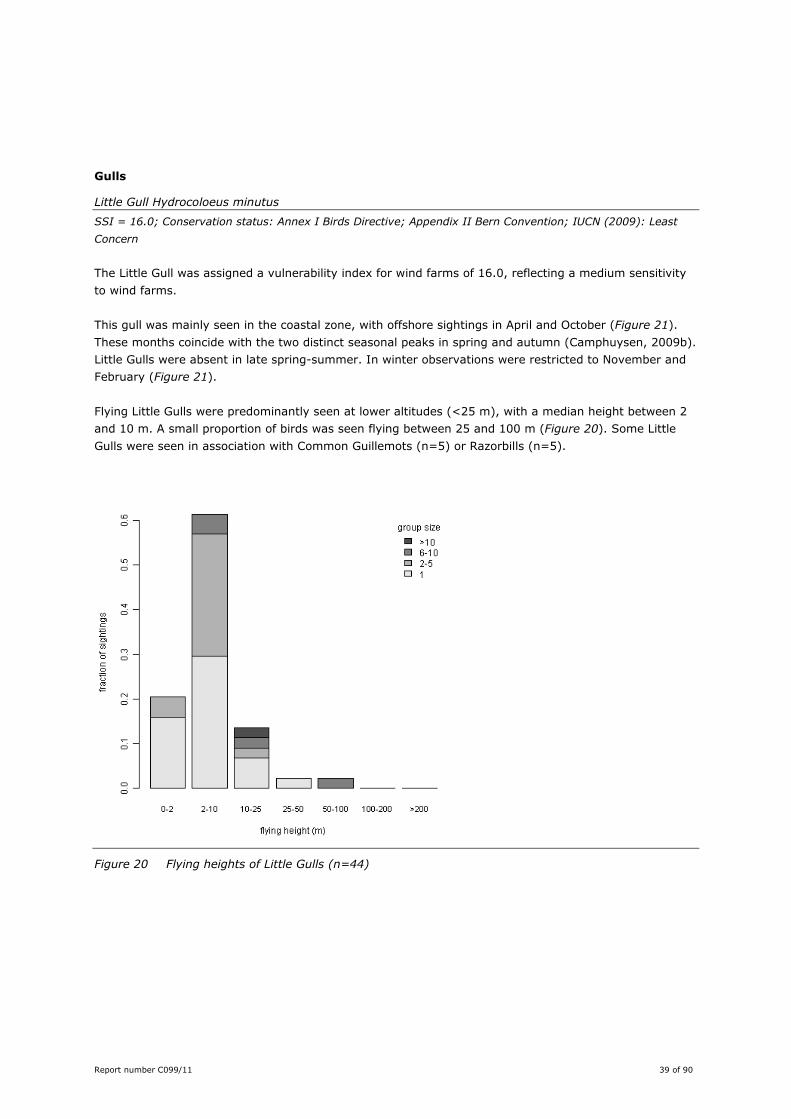
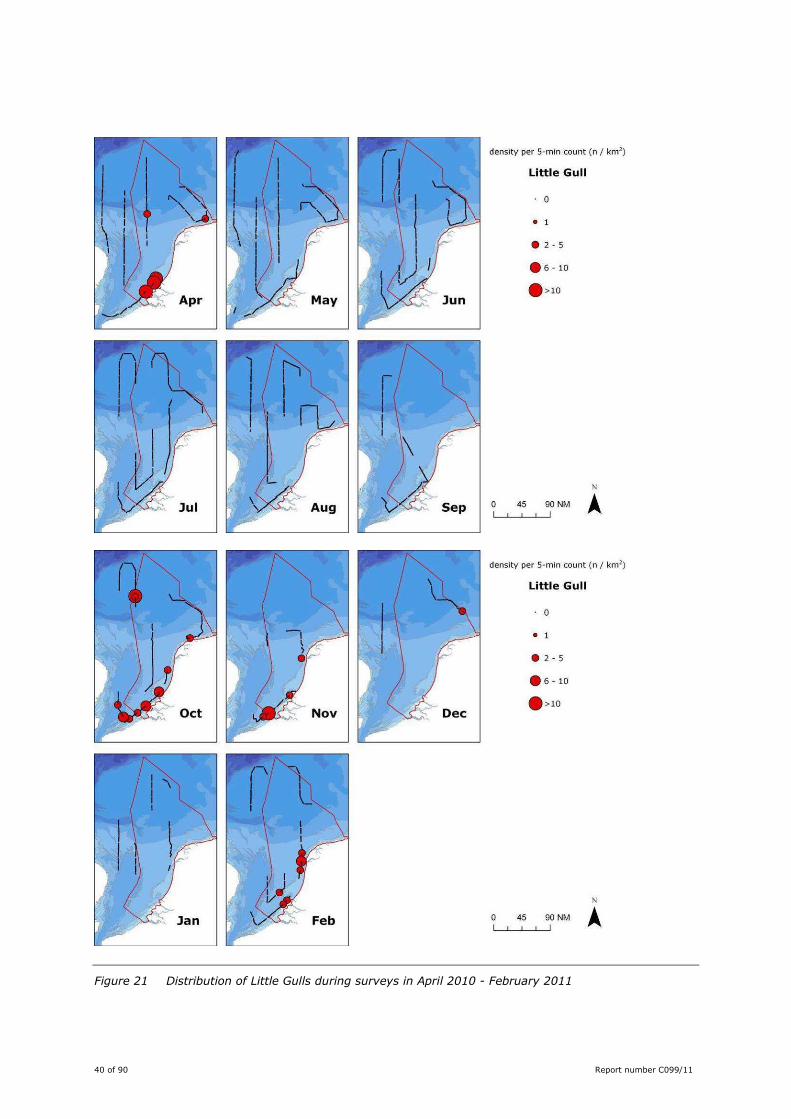
This gull was mainly seen in the coastal zone, with offshore sightings in April and October (Figure 21).
These months coincide with the two distinct seasonal peaks in spring and autumn (Camphuysen, 2009b).
Little Gulls were absent in late spring-summer. In winter observations were restricted to November and
February (Figure 21).
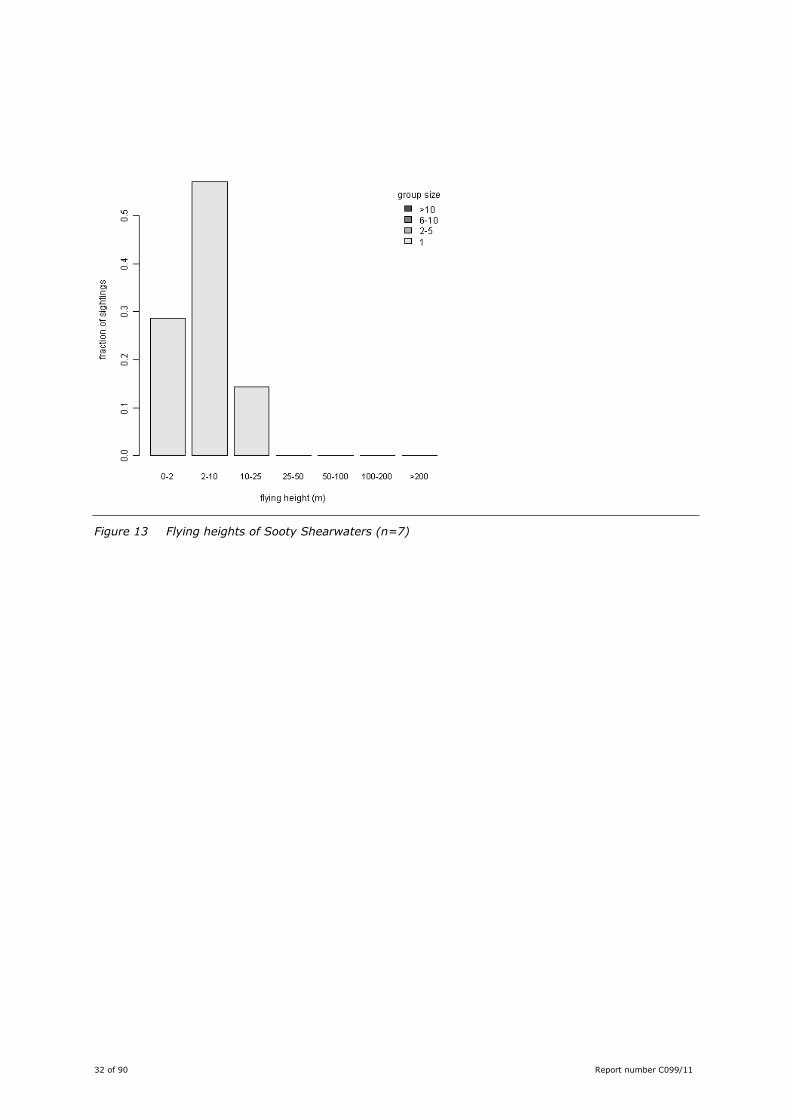
Flying Little Gulls were predominantly seen at lower altitudes (<25 m), with a median height between 2
and 10 m. A small proportion of birds was seen flying between 25 and 100 m (Figure 20). Some Little
Gulls were seen in association with Common Guillemots (n=5) or Razorbills (n=5).
Figure 20 Flying heights of Little Gulls (n=44)
40 of 90 Report number C099/11
Figure 21 Distribution of Little Gulls during surveys in April 2010 - February 2011

Report number C099/11 41 of 90
Black-legged Kittiwake Rissa tridactyla
SSI = 5.6; Conservation status: IUCN (2009): Least Concern
The Black-legged Kittiwake was assigned a wind farm sensitivity index of 5.6, being the lowest of all
considered species.
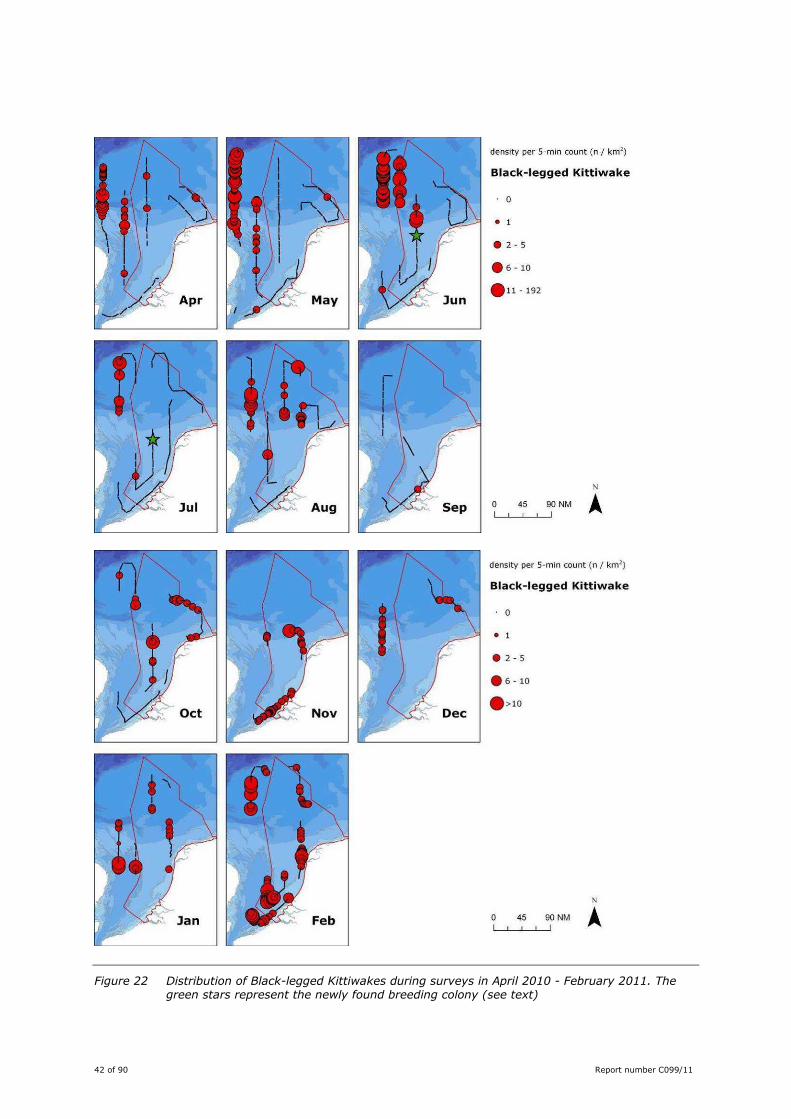
Kittiwakes were the second most numerous gull during the surveys. Birds were seen during all surveys.
Highest densities were recorded offshore in the (north)western part of the study area, especially in April-
August. These months the Dutch coastal zone was devoid of Kittiwakes. From October onwards densities
in coastal waters increased (Figure 22).
On 25 May, in UK waters a group of prospecting birds was seen flocking around an offshore platform
Barque PB (ca. 53˚35′52″ NB; 001˚30′09″ EL), just north of the English Banks. One bird was seen
carrying nest material towards this platform. Subsequent surveys did not visit the vicinity of this
platform, thus rendering it impossible to confirm the first offshore breeding colony in UK waters.
On 23 June 2010 a new breeding colony of Black-legged Kittiwake was discovered on the platform K15-
FC-1 (53˚15′59″ NB; 003˚45′44″ EL), ca. 75 km west of Vlieland. During the July survey successful
breeding could be confirmed as 28 not yet fledged juveniles could be photographed (Figure 23). The
location of the colony is remarkable, since all other breeding sites known to date are situated in the clear
waters north of the Frisian Front (Camphuysen & Leopold 2007). This colony is the first south of it, in
more turbid waters.
Many birds associated with the observer ship (69%). Others foraged behind fishing vessels (17%) or
around offshore platforms (12%). Black-legged Kittiwakes were regularly seen associating with Common
Guillemots (n=85 groups; 390 individual guillemots) and Razorbills (n=73 groups; 253 individual
razorbills).
Kittiwakes were seen flying predominantly at lower heights (< 25m), with a median height between 2-10
m. A small proportion of birds was seen flying above 25 m, with some animals flying high (> 100m,
Figure 25).
42 of 90 Report number C099/11
Figure 22 Distribution of Black-legged Kittiwakes during surveys in April 2010 - February 2011. The green stars represent the newly found breeding colony (see text)

Report number C099/11 43 of 90
Figure 23 Part of the newly discovered breeding colony of Black-legged Kittiwakes (July 2010), showing nests, juveniles and adults (Guido Keijl). The location is marked by a green star on the June and July maps overleaf
Figure 24 Modelled detection functions of (groups of) swimming Black-legged Kittiwakes per sea state (Bft) (n=367). The percentage missed increases with sea state

44 of 90 Report number C099/11
Figure 25 Flying heights of Black-legged Kittiwakes (n=942)

Report number C099/11 45 of 90
Common Gull Larus canus
SSI = 9.0; Conservation status: IUCN (2009): Least Concern
The Common Gull was ranked amongst the less sensitive species in regard to wind farms.
Densities of Common Gulls were usually low in offshore waters. Somewhat higher densities were
encountered in October, January and February. In February, groups of up to 250 birds were seen in near
shore waters just before sunset; these birds seemed to use the area for overnight roosting (Figure 27).
Common Gulls were seen flying predominantly at lower heights (< 50m), with a median height between
10-25 m. A small proportion of birds was seen flying above 50 m (Figure 26).
Figure 26 Flying heights of Common Gulls (n=124)

46 of 90 Report number C099/11
Figure 27 Distribution of Common Gulls during surveys in April 2010 – February 2011

Report number C099/11 47 of 90
Herring Gull Larus argentatus
SSI = 7.3; Conservation status: IUCN (2009): Least Concern
The Herring Gull was ranked among the five least vulnerable species in regard to wind farms.
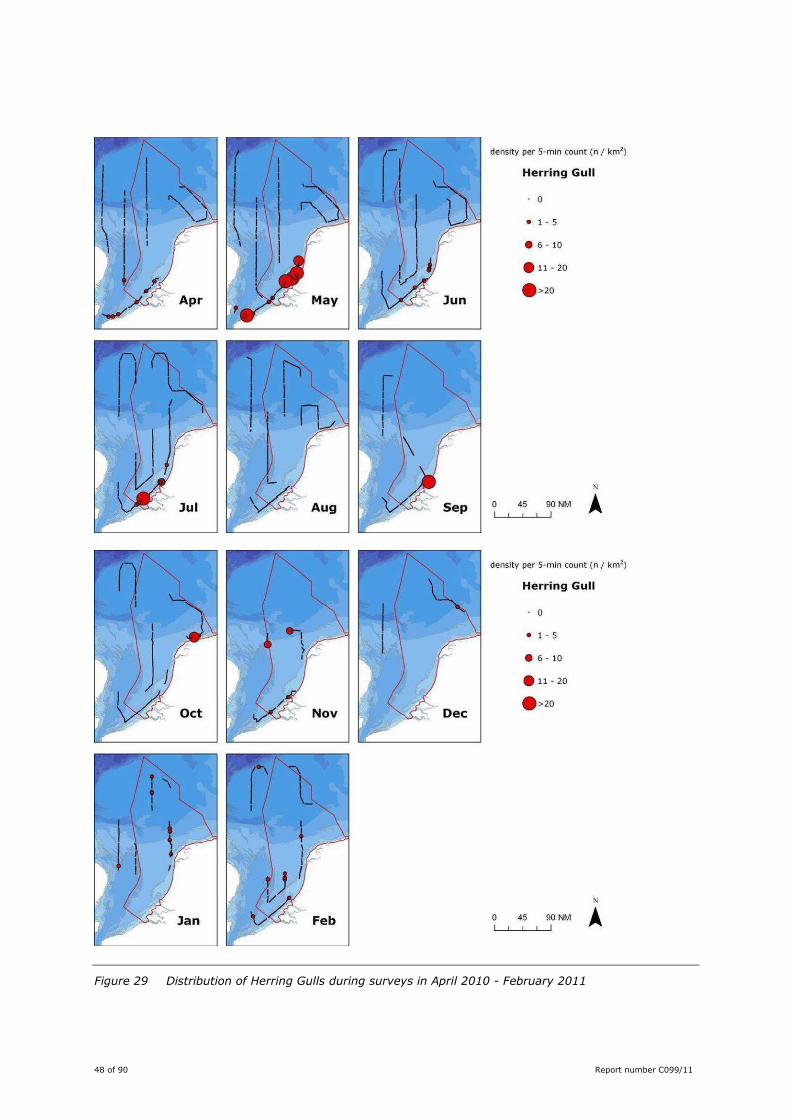
This gull species showed a coastal distribution along the mainland of The Netherlands and Belgium in
April-October; peak densities were recorded in May. North of the Wadden Isles observations were scarce.
From November onwards numbers dropped and the distribution became more offshore, with
observations as far as the Dogger Bank (Figure 29). Although this was not quantified, these offshore
sightings concerned mainly individuals from the Northern subspecies Larus argentatus argentatus. This
subspecies does not breed in The Netherlands, but is a common winter visitor.
Flying Herring Gulls were predominantly seen at lower altitudes (<50 m), with a median height between
10-25 m. A small proportion of birds was seen flying between 50 and 100 m (Figure 28).
Figure 28 Flying heights of Herring Gulls (n=127)
48 of 90 Report number C099/11
Figure 29 Distribution of Herring Gulls during surveys in April 2010 - February 2011

Report number C099/11 49 of 90
Lesser Black-backed Gull Larus fuscus
SSI = 9.2; Conservation status: IUCN (2009): Least Concern
Lesser Black-backed Gull was assigned a wind farm vulnerability index of 9.2, qualifying this species
among the species with medium to low values.
During the surveys Lesser Black-backed Gulls were the most abundant gull species. From April until
August this species was recorded throughout the entire survey area. Densities were highest in the
coastal zone, reflecting the location of large Dutch breeding colonies (e.g. Texel, IJmuiden, Maasvlakte;
Figure 30). In July a steady flow of Lesser Black-backed Gulls was –presumably- flying to and fro the
breeding colonies of Texel and IJmuiden – these were predominantly adult birds (Figure 31). Recently
fledged juveniles appeared at sea in August, and as total numbers dropped in September and from
October, the percentage of juvenile and immature birds increased (Figure 31). From September till
January the DCS was virtually devoid of Lesser Black-backed Gulls. In February birds returning from their
wintering grounds started entering the southern North Sea again (Figure 30).
From all Lesser Black-backed Gulls noted (n=15.738), 15% (n=2.428) did not show any obvious
association with e.g. vessels, platforms or cetaceans. Of the birds of which associations and behaviour
was recorded, 16% (n=2.462) was actively searching or feeding. This number is dominated by huge
feeding flocks off the coast of Noord-Holland in July. These birds (real figures must have numbered in the
thousands) were feeding on small pelagic fish. The majority of birds, however, was seen in association
with fishing activities (63%, n=9.852. Associations with the observers’ ship occurred regularly but always
concerned low numbers (2%; n=288). Platforms were used by 2% of the birds (n=441).
Flying Lesser Black-backed Gulls were predominantly seen at lower altitudes (<50 m), with a median
height between 10-25 m. A small proportion of birds was seen flying between 50 and 200 m (Figure 33).

50 of 90 Report number C099/11
Figure 30 Distribution of Lesser Black-backed Gulls during surveys in April 2010 - February 2011

Report number C099/11 51 of 90
Figure 31 Age composition of Lesser Black-backed Gulls
Figure 32 Modelled detection functions of (groups of) swimming Lesser Black-backed Gulls per sea state (Bft) (n=334). The percentage missed increases with sea state

52 of 90 Report number C099/11
Figure 33 Flying heights of Lesser Black-backed Gulls (n=920)

Report number C099/11 53 of 90
Great Black-backed Gull Larus marinus
SSI = 13.8; Conservation status: IUCN (2009): Least Concern
With a SSI of 13.8, the Great Black-backed Gull ranked amongst the species with medium SSI values.
This species was the third most abundant gull species during the surveys. It showed a distinct seasonal
pattern with low densities and a more or less coastal distribution in May-July (Figure 35). During April-
September, the majority of the recorded individuals was immature (68-100%). Numbers built up from
August onwards, when (adult) birds had reached the Frisian Front. During October-February, adults
predominated with 45-75% of the individuals. The highest densities on the DCS seemed to be present in
October, with an emphasis on the coastal zone (Figure 35).
Of the birds of which the behaviour was recorded 74.8% (n =835) was feeding, either scavenging
(57.7%) or actively feeding (17.2%). Actively searching (9.6%) and resting and preening (14.8%) were
the most common other behaviours. Flying Great Black-backed Gulls were predominantly seen at lower
altitudes (<50 m), with a median height between 10-25 m. A small proportion of birds was seen flying
between 50 and 200 m (Figure 34).
Figure 34 Flying heights of Great Black-backed Gulls

54 of 90 Report number C099/11
Figure 35 Distribution of Great Black-backed Gulls during surveys in April 2010 - February 2011

Report number C099/11 55 of 90
Terns
Sandwich Tern Sterna sandvicensis
SSI = 20.0; Conservation status: Annex I Birds Directive; Appendix II Bonn Convention; Appendix II Bern
Convention; IUCN (2009): Least Concern)
With an SSI value of 20.0, the Sandwich Tern ranks among the more sensitive species with regard to
wind farms.
Sandwich Tern was the most abundant tern during the surveys, with observations between April and
September. In general the encountered numbers were low. The highest numbers were seen in April-June
in near-coastal waters. In July, when Sandwich Terns stay inshore, numbers dropped steeply, and from
October onwards Sandwich Terns had left the North Sea. During the breeding season (Apr-Jun) the
coastal distribution reflects the location of breeding colonies in the Dutch Delta, Belgium, the biggest
colony in the UK: Scolt Head, Norfolk, and to a lesser extent the colonies in the Wadden Sea (Figure 36).
Breeding birds feed mainly in the vicinity of their colony. Stienen (2006), for instance, showed that the
majority of the breeders from the large colony on Griend feed between Texel and Vlieland, thus well
south of the surveyed transects.
Most individuals were seen actively searching for prey (41%; n=229). Plunge dives were seen in 13%
(n=72) of the individuals. Apparent transit flights consisted 32% (n=177) of the individuals – of these,
five were holding a fish.
Flying Sandwich Terns were predominantly seen at lower altitudes (<25 m), with a median height
between 2-10 m. A small proportion of birds was seen flying between 25 and 100 m (Figure 37). On
average Sandwich Terns fly higher than both Common and Arctic Tern: one of the two reasons Sandwich
Tern was assigned a higher vulnerability index by Garthe & Hüppop (2004).

56 of 90 Report number C099/11
Figure 36 Distribution of Sandwich Terns during surveys in April – September 2010; in October 2010 – February 2011 no terns were seen
Figure 37 Flying heights of Sandwich Terns (n=173)

Report number C099/11 57 of 90
Common Tern Sterna hirundo
SSI = 12.0; Conservation status: Annex I Birds Directive; Appendix II Bonn Convention; Appendix II Bern
Convention; IUCN (2009): Least Concern
Arctic Tern Sterna paradisaea
SSI = 10.7; Conservation status: Appendix II Bonn Convention; IUCN (2009): Least Concern
Common and Arctic Tern were ranked intermediate with regard to their sensitivity for wind farms, with a
SSI of 12.0 and 10.7 respectively. The difference between these species is caused by the designation of
Common Terns in a higher flight altitude class than Arctic Tern. Remarkably, our data on flying heights
suggests higher values for Arctic Tern – but the sample size for this species is small (Figure 39; Figure
41).
When not seen well Common Terns and Arctic Terns can be difficult to identify to species level. During
land-based sea watches the name “Commic Tern” became established for unidentified individuals, which
comprise about 45-55% of the individuals seen during these counts (Platteeuw et al. 1994). During aerial
surveys, the two species are hardly ever identifiable (Arts 2010). During the surveys 28% of all Common
and Arctic Terns (n=572) was left unidentified; within the transect this proportion was only 3.6%
(n=221).
Numbers of Common and Arctic Tern were low, but both species are almost equally abundant. Though
Arctic Terns were not seen in May and September, both species were seen between April and September.
Their distribution showed complementary patterns with Common Terns restricted to the Dutch coastal
zone (Figure 40) and the majority of Arctic Terns offshore (Figure 40). In June and August some
Common Terns were seen –outside the transect- as far offshore as the Dogger Bank.
From the Common and Arctic Terns whose behaviour was noted, 61% were actively feeding, mainly by
plunge-diving (61%; n=157). Actively searching terns comprised 24% (n=63). A remarkable
phenomenon described by Camphuysen (1991), was noted in May, when Arctic Terns were seen
displaying offshore (12%; n=32).
Flying Common Terns were predominantly seen at lower altitudes (0-10 m) whereas Arctic Terns were
seen at slightly higher altitudes (mostly between 2-25m). No ‘comic terns’ were recorded above 50 m
(Figure 39, Figure 41). These findings seem contradictory with the designation in height classes by
Garthe & Hüppop (2004), but they confirm that both species commonly fly between 2-10 m high.
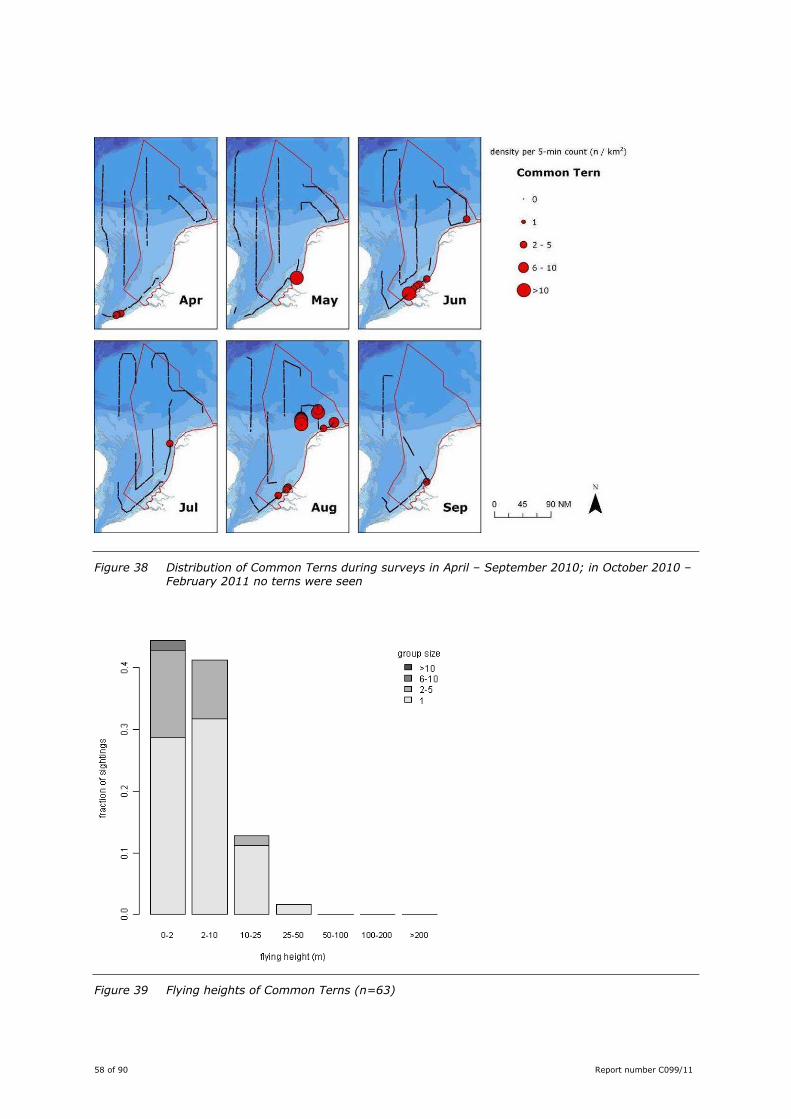
58 of 90 Report number C099/11
Figure 38 Distribution of Common Terns during surveys in April – September 2010; in October 2010 – February 2011 no terns were seen
Figure 39 Flying heights of Common Terns (n=63)

Report number C099/11 59 of 90
Figure 40 Distribution of Arctic Terns during surveys in April – September 2010; in October 2010 – February 2011 no terns were seen
Figure 41 Flying heights of Arctic Terns (n=17)
60 of 90 Report number C099/11
Alcids
Common Guillemot Uria aalge
SSI = 10.0; Conservation status: IUCN (2009): Least Concern
Razorbill Alca torda
SSI = 13.1; Conservation status: IUCN (2009): Least Concern
Common Guillemots and Razorbills were ranked amongst the intermediate species in terms of sensitivity
to wind farms. Due to its smaller population size, the Razorbill was qualified as the more sensitive
species of the two. Unpublished reports suggest partial avoidance of wind farms by these species
(Leopold et al. 2011 in press).
When seen at greater distances Common Guillemots and Razorbills are almost impossible to identify to
species level. During the surveys only 0.8% of the large alcids (n = 7,213) was left unidentified. Of the
remaining alcids 88.7% was identified as Common Guillemot and 10.6% as Razorbill. In other words, the
ratio between Razorbills and Guillemots on average was 1:8.6. However, there are marked temporal
changes in the ratio between both species (see Figure 44). Guillemots dominated throughout the year,
but in November and February high proportions of Razorbills were present. In summer the proportion of
Razorbills was virtually zero.
Guillemots were widely distributed throughout the year, showing a distinct spatial and temporal pattern
(Figure 42). In May densities were at a minimum and the distribution was restricted to offshore areas. In
June downy chicks accompanied by one parent, mainly their father (Harris et al. 1991), entered the
survey area. The first father-chick combination was seen in British waters as far south as IJmuiden on 21
June. Presumably, the first individuals arriving here are from the nearest colony from the Bempton Cliffs,
along the Norfolk coast (Mitchell et al. 2004). In the Dogger Bank and Frisian Front areas relatively high
densities of Guillemots were seen already this month, including tens of father-chick combinations. These
birds probably originated from the colonies of St Abbs Head, Berwickshire, Scotland, and more northerly
(Mitchell et al. 2004), taking advantage of the predominantly south-easterly current. The number of
these combinations increased in July. From August onwards Guillemots spread out over the southern
North Sea. Concentrations in this month were found at Dogger Bank, Cleaver Bank and Brown Ridge.
Unfortunately, the survey effort from September until December was relatively low and unevenly
distributed over the DCS. Therefore only scant data on the distribution in these months is available. High
densities, however, were found on the Dogger Bank, when it was surveyed in October and January. The
Brown Ridge held high densities in January, but the available data does not show when Guillemot
numbers build up in this area. All in all, areas with higher densities of Guillemots were encountered in
different seasons. Throughout the year, however, high densities were found in the Dogger Bank area.
The Frisian Front (and Cleaver Bank) held high densities in summer. The Brown Ridge showed high
densities in winter (Figure 42).
Razorbills showed an even stronger seasonal pattern (Figure 43). In April, high densities were found on
the western flank of the Dogger Bank. Numbers in this area declined in May and some scattered
concentrations were found on the Dogger Bank and the Frisian Front in June. The species was (virtually)
absent during July-August. From September onwards, numbers built up to maximum densities in
February. In this month, there were locally high densities in both offshore and near shore areas
throughout the studied area (Figure 43).

Report number C099/11 61 of 90
Figure 42 Distribution of Common Guillemots during surveys in April 2010 - February 2011

62 of 90 Report number C099/11
Figure 43 Distribution of Razorbills during surveys in April 2010 - February 2011

Report number C099/11 63 of 90
Figure 44 The composition of large alcid species per month. The far majority was positively identified as either Common Guillemot or Razorbill
Identification and species composition
Less than 1% of the total number of large alcids was left unidentified (n=7213). This percentage
ranged from 0% in June-August and October-December to 7.2% in January. For comparison, only about
9% to 27% of the large alcids are identified to species level during coastal sea watches (Camphuysen &
van Dijk 1983; Platteeuw et al. 1994) and only a very small fraction are identified to species level during
aerial surveys (e.g. Arts 2010).
From the identified individuals, the far majority (89%; n=6.396) were Common Guillemots, the
remaining 11% were Razorbills (n=761). The ratio between the two species showed a marked seasonal
pattern, with Razorbills (virtually) absent in June-August. The percentage of Razorbills was particularly
high in November.
Moult
In large alcids, moult of body feathers is mainly noticeable on the head, throat and upper breast. In
summer, these are all dark brown (Common Guillemot) to jet-black (Razorbill), but in winter, a white
patch occurs behind the eye, and the throat and upper breast become white. Adults arrive at the
breeding ledges in full summer plumage and moult into winter plumage after the breeding season. The
timing of moult of immature birds lags behind – they moult into summer plumage later in the season.
The declining percentage of birds in summer plumage after January probably reflects the departure of
adults to the breeding grounds. The subsequent increase partly represents the moult of immature birds
into summer plumage and the return of adults in summer (June-July) (Figure 45).

64 of 90 Report number C099/11
Figure 45 Plumage composition of Common Guillemots (upper panel) and Razorbills (lower panel).
Values above the bars represent sample sizes

Report number C099/11 65 of 90
Multi Species Feeding Associations
Regularly, associations between alcids and Black-legged Kittiwakes or Little Gulls were observed. This
was especially common in offshore areas with higher densities of Razorbills. These data has not been
extensively analysed.
Detection functions
Combining all large alcids noted in the transect strip, the percentage of flying birds on the total number
of birds is 0.81% (sd=0.95; n=5,144). Flying birds are assumed to always be detected when in the
transect strip. Swimming birds are missed at greater distances from the transect line (Figure 46). To
estimate the percentage of birds not seen, detection functions were estimated for swimming individuals.
Sea state heavily influenced the detection of swimming alcids (Figure 47). Detection probability
decreases strongly after 50m. See Table 4 for estimated effective strip width and associated correction
factors.
Figure 46 Histograms of (groups of) Common Guillemots (left panel) and Razorbills (right panel) per distance band. If all clusters of birds were detected, each bar would be equally high. This is clearly not the case. These figures are not corrected for sea state

66 of 90 Report number C099/11
Figure 47 Detection curves of large alcids (Common Guillemots and Razorbills) per sea state (Bft) (n=2169). The percentage missed increases with sea state
Flying Guillemots were predominantly seen at lower altitudes (<10 m), with a median height below 2 m.
A few birds were seen flying between 10 and 50 m (Figure 48). Razorbills showed a similar flying height
distribution, although no birds were seen above 10 m (Figure 49).
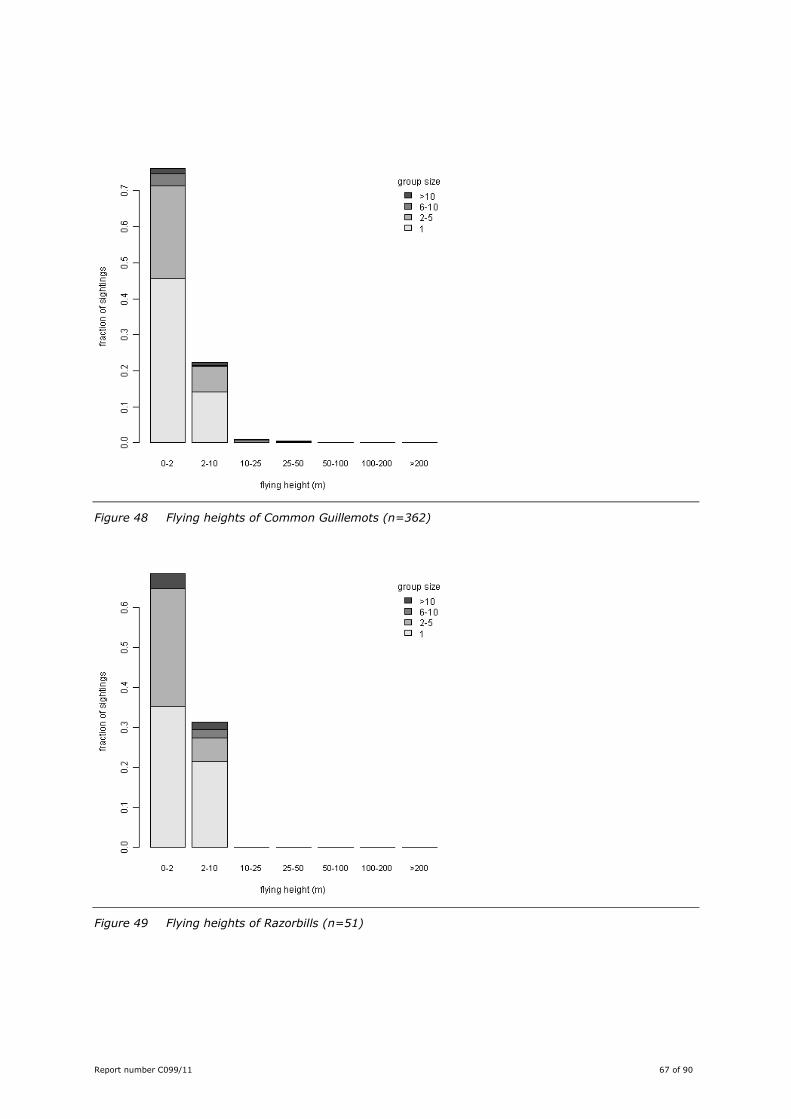
Report number C099/11 67 of 90
Figure 48 Flying heights of Common Guillemots (n=362)
Figure 49 Flying heights of Razorbills (n=51)

68 of 90 Report number C099/11
Atlantic Puffin Fratercula arctica
SSI = 18.0; Conservation status: IUCN (2009): Least Concern
Little Auk Alle alle
SSI = 16.0; Conservation status: IUCN (2009): Least Concern
The Atlantic Puffin was assigned a wind farm sensitivity index equal to that of the Razorbill; the Little Auk
was qualified slightly less sensitive.
During the surveys Atlantic Puffin was the most abundant of the two species. This might be effort-
related, since the northwestern part of the survey area was low in effort during November-January. Little
Auks are known to aggregate in the Dogger Bank area during this period (Camphuysen & Leopold 1994).
The distribution of Atlantic Puffins showed a distinct emphasis on the north western and western part of
the area, with highest numbers in the Dogger Bank area in February and April (Figure 50). These months
the densities as well as the distribution reached their maximum. Puffins stayed far offshore and were not
seen in the Southern Bight. From June till September Puffins almost completely vacated the survey area.
From October onwards very low densities were seen again. In combination with the low survey effort in
November and December this resulted in a lack of records in these months.
Little Auks were much less numerous than Puffins and were noted during the surveys in November –
February, with most records in February. As noted above, effort allocation was not optimal for mapping
Little Auk distribution, as no surveys crossed the Dogger Bank during November – January. All records
except one (November, near Texel) are confined to the Dogger Bank and its surroundings (Figure 53).
Detection of swimming small alcids at greater perpendicular distances from the ship’s transect line is
difficult – especially in harsh weather conditions (Figure 51). Therefore it is not surprising that beyond
100 m, the detection curve for these small alcids is much steeper than for the large alcids (Common
Guillemot and Razorbill) (Figure 52, cf. Figure 47). For the estimated strip width per sea state and the
associated correction factors, see Table 4.
Flying Little Auks were seen below 10 m, with equal numbers flying below and above 2 m (Figure 49).
Puffins were only discovered swimming; hence, no flight altitudes were recorded. However, fleeing birds
typically stayed close to the water surface and would thus not be vulnerable for collisions with turbine
rotors.

Report number C099/11 69 of 90
Figure 50 Distribution of Atlantic Puffins during surveys in April 2010 - February 2011

70 of 90 Report number C099/11
Figure 51 Histograms of (groups of) Little Auk (left panel) and Atlantic Puffin (right panel) per distance band. If all clusters of birds were detected, each bar would be equally high. This is clearly
not the case. Note that no Little Auks were detected beyond 200m distance from the ship. These figures are not corrected for sea state
Figure 52 Modelled detection functions of (groups of) small alcids (Atlantic Puffins and Little Auks) per sea state (Bft) (n=94). The percentage missed increases with sea state
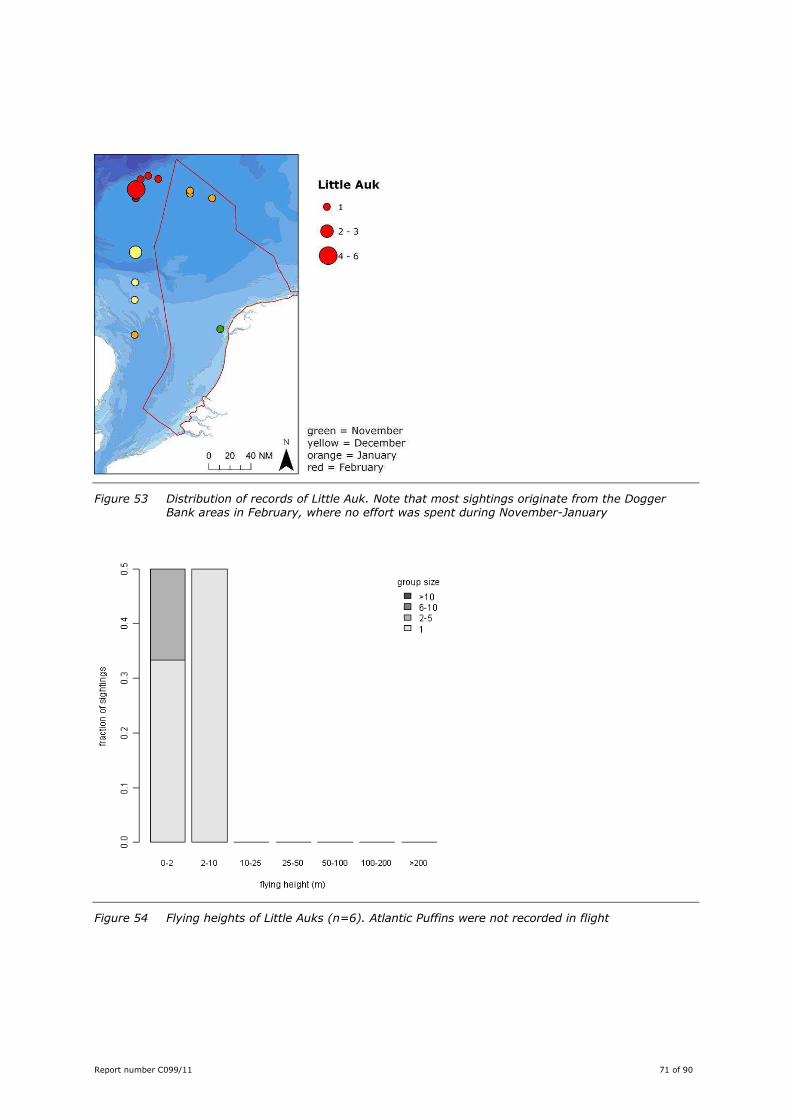
Report number C099/11 71 of 90
Figure 53 Distribution of records of Little Auk. Note that most sightings originate from the Dogger Bank areas in February, where no effort was spent during November-January
Figure 54 Flying heights of Little Auks (n=6). Atlantic Puffins were not recorded in flight
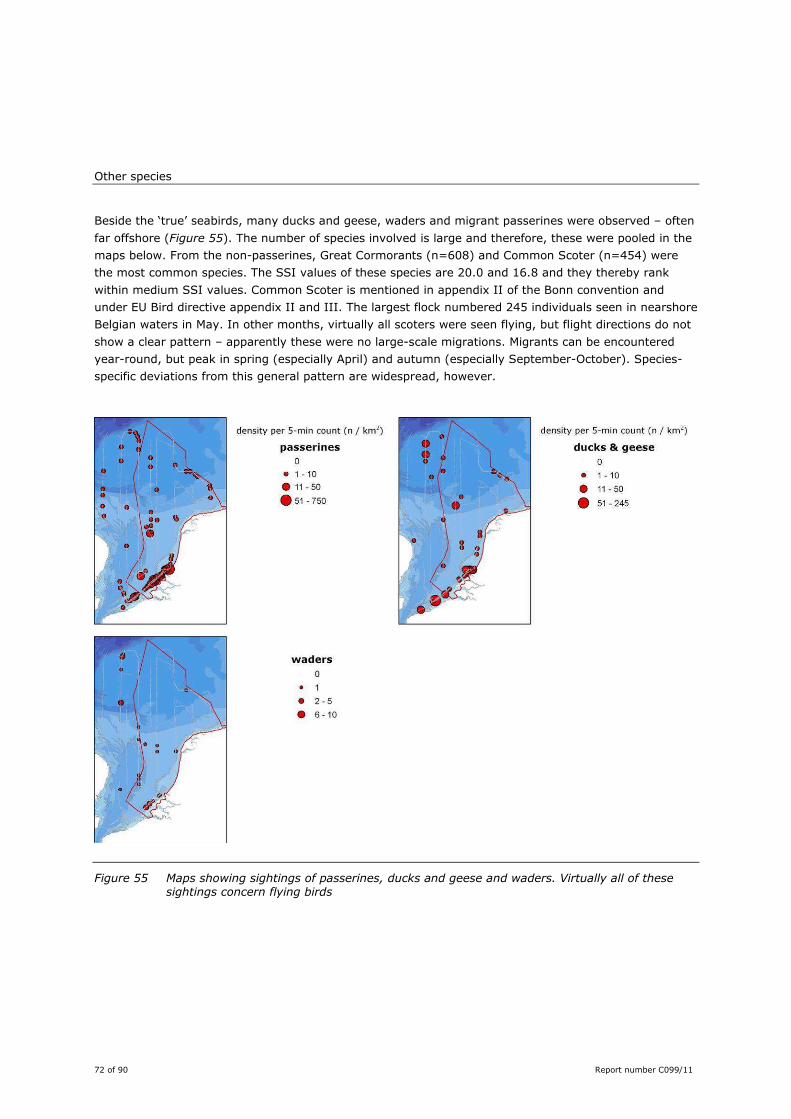
72 of 90 Report number C099/11
Other species
Beside the ‘true’ seabirds, many ducks and geese, waders and migrant passerines were observed – often
far offshore (Figure 55). The number of species involved is large and therefore, these were pooled in the
maps below. From the non-passerines, Great Cormorants (n=608) and Common Scoter (n=454) were
the most common species. The SSI values of these species are 20.0 and 16.8 and they thereby rank
within medium SSI values. Common Scoter is mentioned in appendix II of the Bonn convention and
under EU Bird directive appendix II and III. The largest flock numbered 245 individuals seen in nearshore
Belgian waters in May. In other months, virtually all scoters were seen flying, but flight directions do not
show a clear pattern – apparently these were no large-scale migrations. Migrants can be encountered
year-round, but peak in spring (especially April) and autumn (especially September-October). Species-
specific deviations from this general pattern are widespread, however.
Figure 55 Maps showing sightings of passerines, ducks and geese and waders. Virtually all of these sightings concern flying birds

Report number C099/11 73 of 90
Marine Mammals
White-beaked Dolphin Lagenorhynchus albirostris
Conservation status: IUCN (2009): Least Concern
Bottlenose Dolphin Tursiops truncates
Conservation status: IUCN (2009): Least Concern
Short-beaked Common Dolphin Delphinus delphinus
Conservation status: IUCN (2009): Least Concern
Minke Whale Balaenoptera acutorostrata
Conservation status: IUCN (2009): Least Concern
Apart from Harbour Porpoises, four cetacean species were recorded (Figure 9). Of these, White-beaked
Dolphin was the most abundant species, but records were restricted to May. During this survey three
small pods were seen on the northern slopes of the Dogger Bank (2,1 and 2 animals); two small pods in
the south-western part of the Southern North Sea (1 and 2 animals) and another pod near the Cleaver
Bank (2 animals). In October two Short-beaked Common Dolphins, accompanied by searching Gannets,
were seen off the Belgian coast. A day later three Bottlenose Dolphins were seen southeast of the
Dogger Bank. This pod was associated with a feeding frenzy of Gannets, Kittiwakes and one Great Skua.
Single Minke Whales were seen in May and June, along the flanks of the Dogger Bank. Two animals
surfaced a few times and disappeared, one animal showed more conspicuous behaviour and was seen
breaching on the south(western) slope of the Dogger Bank. These observations are in line with recent
discoveries of concentration areas of Minke whales in the Botney Cut area (Leopold & Camphuysen,
2006; de Boer, 2010).

74 of 90 Report number C099/11
Harbour Porpoise Phocoena phocoena
Conservation status: IUCN (2009): Least Concern
Harbour Porpoise was the most abundant cetacean, seen during every survey, but highest numbers were
seen in winter (Figure 56). In all months the distribution was patchy. In April-May high densities were
found in an offshore area off Norfolk, United Kingdom. In this area many individuals were apparently
feeding. In May several clustered sightings were made at the Botney Cut (Cleaver Bank) and in June a
fair number of sightings was done at the Frisian Front and north of the Wadden Sea Islands. In July most
sightings were done in near shore waters of the Southern Bight. With deteriorating conditions during
August-January, the number of sightings declined and no clear patterns emerge from these surveys. In
February virtually all observations were made in the southern part of the study area.
At greater distances detection probability of Harbour Porpoises declines (Figure 57). Detection of Harbour
Porpoises is heavily influenced by sea state (Figure 58). Detection may be increased by using obvious
cues like searching Northern Gannets, who often associate with Harbour Porpoises. For estimated
effective strip widths per sea state and the associated correction factors, see Table 4.

Report number C099/11 75 of 90
Figure 56 Distribution of Harbour Porpoises during surveys in April 2010 - February 2011

76 of 90 Report number C099/11
Figure 57 Histograms of (groups of) Harbour Porpoise per distance band (n=212). If all clusters of animals were detected, each bar would be equally high – this is clearly not the case. These figures are not corrected for sea state
Figure 58 Modelled detection functions of (groups of) Harbour Porpoises per sea state (n=212)

Report number C099/11 77 of 90
Grey Seal Halichoerus grypus
Conservation status: IUCN (2009): Least Concern
Harbour Seal Phoca vitulina
Conservation status: IUCN (2009): Least Concern
During the surveys both Grey and Harbour Seals were seen; 5 seals could not be identified to species
level. Numbers were low, with 15 and 18 records of individuals respectively.
The distribution showed an emphasis on the coastal zone (Figure 9). South of Scheveningen numbers of
Grey Seal and Harbour Seal were in the same order of magnitude. In the northern part of the DCS
Harbour Seal by far outnumbered Grey Seal. In British waters some scattered observations of both
species were made.

78 of 90 Report number C099/11
Balloons
Apart from November and December balloons were encountered during all surveys. Numbers, however,
fluctuated strongly (Figure 59). Densities were highest in April and July. Beside seasonal effects,
depending on festivities, wind force and direction are likely to be the main factors determining the
densities and distribution of balloons at sea.
By means of digital photographs the origin of some balloons could be determined. Identified origins
included UK or Scandinavia (fast food chain TGI Fridays) in February, UK (restaurant Chiquito Mexican
grill) in August, UK (Lambeth, a London suburb) in July, and UK (Vauxhall, a British car manufacturer) in
April.
Though the expectation was that balloons have a more even detection curve, they “behave” like
seabirds, in that they get more difficult to detect at greater distances (Figure 60), despite their brighter
colours. However, in contrast to alcids and Harbour Porpoises, sea state did not have an effect on
detectability of balloons (Figure 61).
Photo 2 This Great Skua Stercorarius skua apparently ingested a balloon. Brown Ridge, September
2010 (Hans Verdaat)

Report number C099/11 79 of 90
Figure 59 Distribution of balloons during surveys in April 2010 - February 2011
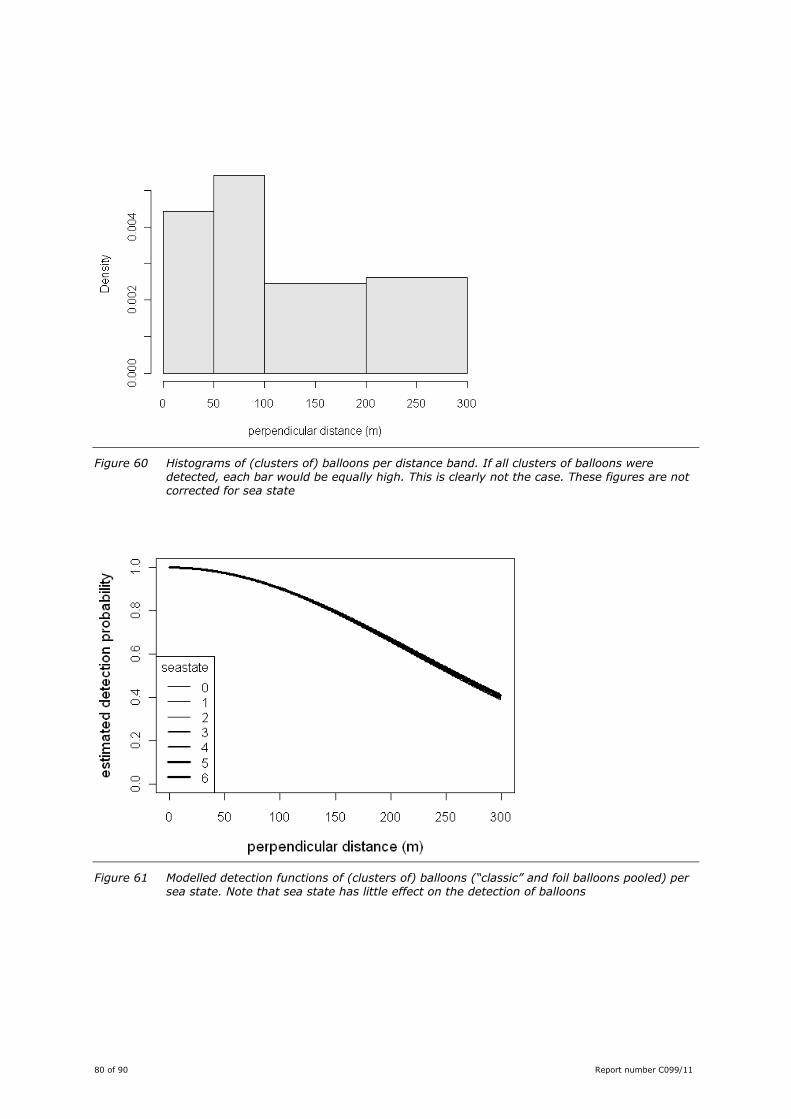
80 of 90 Report number C099/11
Figure 60 Histograms of (clusters of) balloons per distance band. If all clusters of balloons were detected, each bar would be equally high. This is clearly not the case. These figures are not corrected for sea state
Figure 61 Modelled detection functions of (clusters of) balloons (“classic” and foil balloons pooled) per sea state. Note that sea state has little effect on the detection of balloons
Report number C099/11 81 of 90
4. Discussion and conclusions
After many years of little or no ship-based effort in far offshore areas of the DCS, this series of surveys
provided the first recent ship-based data on seabirds, covering a large area (the entire DCS plus some
Belgian, British and German waters) almost year-round. These surveys were conducted on a ship
dedicated to sampling fish eggs and fish larvae, thus acting as a ‘vessel of opportunity’ for the seabird
surveys. Due to changes in the survey design, a larger than expected variance in ships used (with
different sailing speeds), but particularly bad weather during some of the autumn and winter surveys,
the resulting coverage is not evenly spread over space and time. This spatial variation in data
complicates inferences about temporal changes in local bird densities. To tackle these problems,
dedicated bird and marine mammal surveys, using either ship (e.g. Leopold et al. 2004, 2010) or aircraft
(Petersen et al. 2006; Poot et al. 2010) should be conducted. The choice for either platform should
ideally be tailor-made for specific questions. The advantages and disadvantages of ship based and aerial
surveys have been extensively discussed elsewhere (e.g. Camphuysen & Leopold, 1994; Camphuysen et
al. 2004).
Both in terms of areas covered and detailed data gathered, this series of surveys complement the
dedicated, dense, but rather near-shore network of aerial surveys carried out under the same program
Shortlist Masterplan Wind (Poot et al. 2010). Virtually all individuals seen were identified to species level
and a large body of data was collected on ecologically relevant phenomena such as moult and behaviour.
Detailed species identification may be combined with the aerial survey data, to get a better picture of
distribution patterns and densities of several look-alike species, such as guillemots and razorbills. Also
density estimates for various species can be cross-validated between ship and plane survey data. From
the behavioural observations, especially flying heights are of interest for planning of offshore wind farms.
It should be noted, however, that ship-based observers focus on birds at the sea surface and therefore,
high-flying birds may not always be detected. Thus, although the gathered data reflects ‘normal’ flying
heights, there is a bias towards lower-flying birds. Furthermore, flying heights may sometimes be
influenced by the presence of the boat from which the observations were conducted, especially in
opportunistic species (such as gulls) and species exhibiting escape behaviour in relation to the boat.
By surveying beyond the designated areas for round II offshore wind farms on the DCS, areas that might
be targeted for round III, such as the shallow Dogger Bank area, got a first boost in T-zero survey effort.
The UK-parts of the Dogger Bank are currently being surveyed extensively and our surveys are – to
some extent- complementary to that work. This might prove important in the near future as
developments in faraway offshore parts of the North Sea will probably be taken on.
Despite the spatial and temporal variation in effort, hotspots with high bird densities have been
identified, some of which were consistent over time. Most notable in this respect are the Cleaver Bank,
the Dogger Bank, the Frisian Front and the entire Southern Bight. These patterns are consistent with
earlier studies on the distribution of birds and highlight areas with increased bird densities (Camphuysen
& Leopold 1994, Lindeboom et al. 2005, Leopold et al. in prep.). Bird populations of these areas appear
particularly sensitive to the development of offshore wind farms, as is indicated by the Wind farm
Sensitivity Index (WSI), a combination of SSIs and bird densities, which have been mapped by Leopold &
Dijkman (2010) and repeated as Appendix B in this report.

82 of 90 Report number C099/11
These surveys have identified several issues to be dealt with in future planning of wind farms or at least
certain aspects of seabird and cetacean distribution patterns that should be further studied. Migration of
divers, which are the highest ranked species in terms of sensitivity to wind farms, not only takes place
inshore, but can also be intensive anywhere in offshore waters. Furthermore, the indications found of an
wintering population of the near-threatened White-billed Divers at the Dogger Bank calls for dedicated
surveys to assess the size of this population and the extent to which this population uses the Dutch part
of the Dogger Bank. Up till now, wind farms have only been constructed at more or less near shore sites
where abundances of offshore species, such as Northern Fulmars, Atlantic Puffins, Little Auks and Minke
Whales, are low. Therefore, the effect of offshore wind farms on these species is not known while wind
farms might be built in round III in the Dogger Bank area, where concentrations of these animals may
occur.
Photo 3 Adult Northern Gannet Morus bassanus (Hans Verdaat)

Report number C099/11 83 of 90
5. Quality Assurance
IMARES utilises an ISO 9001:2008 certified quality management system (certificate number: 57846-
2009-AQ-NLD-RvA). This certificate is valid until 15 December 2012. The organisation has been certified
since 27 February 2001. The certification was issued by DNV Certification B.V. Furthermore, the chemical
laboratory of the Environmental Division has NEN-AND-ISO/IEC 17025:2005 accreditation for test
laboratories with number L097. This accreditation is valid until 27 March 2013 and was first issued on 27
March 1997. Accreditation was granted by the Council for Accreditation.

84 of 90 Report number C099/11
References
Arts FA, 2010. Trends en verspreiding van zeevogels en zeezoogdieren op het Nederlands Continentaal
Plat 1991 – 2009. Rapport RWS Waterdienst BM 10.17. Rijkswaterstaat waterdienst, Lelystad.
Baptist HJM & Wolf PA, 1993. Atlas van de vogels van het Nederlands Contintentaal Plat. Rapport DGW-
93.013. Rijkswaterstaat, Dienst Getijdewateren, Middelburg.
Barbraud C. & Thiebot J.-B. 2009. On the importance of estimating detection probabilities from at-sea
surveys of flying seabirds. J. Avian Biol. 40: 584-590.
Bellebaum J, Bock C, Garthe S, Kube J, Schilz M & Sonntag N, 2010. Vorkommen des Gelbschnabel-
tauchers Gavia adamsii in der deutschen Ostsee. Vogelwelt 131: 179-184.
de Boer MN, 2010. Spring distribution and density of minke whale Balaenoptera acutorostrata along an
offshore bank in the central North Sea. Mar. Ecol. Prog. Ser. 408: 265-274.
Buckland ST, Anderson DR, Burnham KP, Laake JL, Borchers DL & Thomas L, 2001. Introduction to
Distance Sampling, Vol. Oxford University Press, Oxford
Camphuysen CJ, 1991. Baltsvluchten van Noordse Sterns Sterna paradisaea op open zee [Aerial
courtship display of Arctic Terns at sea]. Sula 5(2): 59-61.
Camphuysen CJ, 2009a Het gebruik van zeetrektellingen bij de analyse van populatie schommelingen
van duikers Gaviidae langs de kust. Sula 22(1): 1-24.
Camphuysen CJ, 2009b. Het gebruik van zeetrektellingen bij de analyse van populatie schommelingen
(2) Dwergmeeuwen Larus minutus langs de kust. Sula 22(2): 49-66.
Camphuysen CJ & van Dijk J, 1983. Zee- en kustvogels langs de Nederlandse kust, 1974-1979.
Camphuysen CJ, Fox TJ, Leopold MF & Petersen IK, 2004. Towards standardised seabirds at sea census
techniques in connection with environmental impact assessments for offshore wind farms in the
U.K. - A comparison of ship and aerial sampling methods for marine birds, and their applicability
to offshore wind farm assessments. NIOZ Report to Cowrie / The Crown Estate.
Camphuysen CJ & Garthe S, 2004. Recording foraging seabirds at sea: standardised recording and
coding of foraging behaviour and multi-species foraging associations. Atlantic Seabirds 5: 1-23.
Camphuysen CJ & Leopold MF, 1994. Atlas of seabirds in the southern North Sea. IBN Research report
94/6, NIOZ Report 1994-8, Institute for Forestry and Nature Research, Netherlands Institute for
Sea Research and Dutch Seabird Group, Texel.
Camphuysen CJ & Leopold MF, 2007. Drieteenmeeuw vestigt zich op meerdere platforms in Nederlandse
wateren. Limosa 80: 153-156.
Van Damme C, Hoek R & Bolle L, 2010. Shortlist Master plan Wind Monitoring fish eggs and larvae in the
Southern North Sea: Progress report. Report number C173/10.
Evans Mack D, Raphael MG & Laake JL, 2002. Probability of detecting Marbled Murrelets at sea: effects of
single versus paired observers. The Journal of Wildlife Management 66(3): 865-873.
Franeker JA van & Wattel J, 1982. Geographical variation of the Fulmar Fulmarus glacialis in the North
Atlantic. Ardea 70:31-44.
Franeker JA, 1995. Kleurfasen van de Noordse Stormvogel Fulmarus glacialis in de Noordatlantische
Oceaan. Sula 9(3): 93-106.
Garthe S & Hüppop O, 2004. Scaling possible adverse effects of marine wind farms on seabirds:
developing and applying a vulnerability index. Journal of Applied Ecology 41: 724–734.
Ham NF van der, 1987. Zomerkleed Parelduikers Gavia arctica voor de Noordhollandse kust. Sula 1: 47-
48.
Hamer KC, Phillips RA, Wanless S, Harris MP & Wood AG, 2000. Foraging ranges, diets and feeding
locations of gannets Morus bassanus in the North Sea: evidence from satellite telemetry. Marine
Ecology Progress Series 200: 257-264.
Hamer K.C., Humphreys E.M., Garthe S., Hennicke J., Peters G., Grémillet D., Phillips R.A., Harris M.P. &
Wanless S. 2007. Annual variation in diets, feeding locations and foraging behaviour of Gannets
in the North Sea: flexibility, consistency and constraint. Mar. Ecol. Prog. Ser. 338: 295-305.

Report number C099/11 85 of 90
Harris MP, Webb A & Tasker ML, 1991. Growth of young Guillemots Uria aalge after leaving the colony.
Seabird 13: 40-44.
Komdeur J, Bertelsen J & Cracknell G (eds), 1992. Manual for aeroplane and ship surveys of waterfowl
and seabirds. IWRB Special Publ. No. 19, Slimbridge, 37pp.
Koschinski S, Culik BM, Henriksen OD, Tregenza N, Ellis G, Jansen C & Kathe G, 2003. Behavioural
reactions of free-ranging porpoises and seals to the noise of a simulated 2 MW windpower
generator. Marine Ecology Progress Series 265: 263-273.
Krüger T & Garthe S, 2001. Flight altitude of coastal birds in relation to wind direction and speed. Atlantic
Seabirds 3(4): 203-216.
Lensink R, Gasteren H van, Hustings F, Buurma L, Duin G van, Linnartz L, Vogelzang F & Witkamp C,
2002. Vogeltrek over Nederland, 1976-1993. Schuyt & Co Uitg., Haarlem, 432.
Leopold MF, Dijkman EM, Gonzalez-Mirelis G & Berrevoets C, in prep. Marine Protected Areas in the
Dutch sector of the North Sea: a bird’s eye view. IMARES report.
Leopold MF, Camphuysen CJ, Lieshout SMJ van, Braak CJF ter & Dijkman EM, 2004. Baseline studies
North Sea wind farms: Lot 5 marine birds in ad around the future site Nearshore Windfarm
(NSW). Alterra-rapport 1047.
Leopold MF & Camphuysen CJ, 2006. SC41 Osterems survey Klaverbank en Friese Front, 24-28 juli 2006.
Unpubl. Rept. to Ministry of LNV.
Leopold MFL & Dijkman EM, 2010. Offshore wind farms and seabirds in the Dutch Sector of the North
Sea: What are the best and the worst locations for future development? Report number C134/10
Leopold MF, Dijkman EM, Teal L & the OWEZ-Team, 2011 in press. Local Birds in and around the
Offshore Wind Farm Egmond aan Zee (OWEZ) (T-0 & T-1, 2002-2010). Report
OWEZ_R_221_T1_20100731_local_birds draft.
Lindeboom HJ, Geurts van Kessel AJM & Berkenbosch L, 2005. Gebieden met bijzondere ecologische
waarden op het Nederlands Continentaal Plat. Rapport RIKZ/2005.008, Alterra Rapport nr. 1109.
LWVT, 1985. Handleiding tellen van zichtbare vogeltrek. LWVT/SOVON, Arnhem.
Madsen PT, Wahlberg M, Tougaard J, Lucke K & Tyack PL, 2006. Wind turbine underwater noise and
marine mammals: Implications of current knowledge and data needs. Marine Ecology Progress
Series 309: 279-295.
Van der Meer J. & Camphuysen C.J. 1996. Effect of observer differences on abundance estimates of
seabirds from ship-based strip transect surveys. Ibis 138: 433-437.
Mitchell PI, Newton SF, Ratcliffe N & Dunn TE, 2004. Seabird populations of Britain and Ireland. T&AD
Poyser, London.
Nelson JB, 1978. The Gannet. T&AD Poyser, Berkhamsted.
Ovaa A, Groenendijk D, Berlijn M & CDNA, 2010. Rare birds in the Netherlands in 2009. Dutch Birding
32(6): 363-383.
Petersen IK, Christensen TK, Kahlert J, Desholm M & Fox AD, 2006. Final results of bird studies at the
offshore wind farms at Nysted and Horns Rev, Denmark. NERI Report, commissioned by DONG
energy and Vattenfall A/S, 161p.
Poot MJM & de Jong J, 2010. Aerial surveys of seabirds in the Dutch North Sea, May – October 2010.
Seabird distribution in relation to future offshore wind farms. INTERIM REPORT – FIRST DRAFT
Southall BL, Bowles AE, Ellison WT, Finneran J, Gentry R, Green CR, Kastak CR, Ketten DR, Miller JH,
Nachtigall PE, Richardson WJ, Thomas JA & Tyack PL, 2007. Marine Mammal Noise Exposure
Criteria. Aquatic Mammals 33: 411–521.
Stegeman L & Ouden JE den, 1995. Parelduiker Gavia arctica in de Nederlandse kustwateren. Sula 9: 65-
74.
Stienen EWM, 2006. Living with gulls. Trading off food and predation in the Sandwich Tern Sterna
sandvicensis. PhD thesis, Rijksuniversiteit Groningen.
Stone CJ, Webb A, Barton C, Ratcliffe N, Reed TC, Tasker ML, Camphuysen CJ & Pienkowski MW, 1995.
An atlas of seabird distribution in north-west European waters. Joint Nature Conservation
Committee, Peterborough.

86 of 90 Report number C099/11
Thomas L, Buckland ST, Rexstad EA, Laake JL, Strindberg S, Hedley SL, Bishop JRB, Marques TA &
Burnham KP 2010. Distance software: design and analysis of distance sampling surveys for
estimating population size. Journal of Applied Ecology 47: 5-14.
Tasker ML, Jones PH, Dixon TJ & Blake BF, 1984. Counting seabirds at sea from ships: a review of
methods employed and a suggestion for a standardized approach. Auk 101: 567-577.
van der Vliet RE, van der Laan J, Berlijn M & CDNA 2007. Rare birds in the Netherlands in 2006. Dutch
Birding 29(6): 347-374.

Report number C099/11 87 of 90
Justification
Rapport C099/11
Project Number: 430.25015.02
The scientific quality of this report has been peer reviewed by the a colleague scientist and the head of
the department of IMARES.
Approved: dr. Ingrid Tulp
Researcher
Signature:
Date: 15 August 2011
Approved: drs. John Schobben
Department Head
Signature:
Date: 15 August 2011

88 of 90 Report number C099/11
Appendix A. Specific sensitivity index for offshore wind farms
Table 1 Summed wind farm sensitivities (last column) for the main North Sea seabirds (first
column), based on underlying factors A-I: A: flight maneuverability, B: flight altitude, C:
percentage flying, D: nocturnal flight activity, E: disturbance by ship traffic; F: habitat use
flexibility, G: biogeographical population size, H: adult survival rate, I: European Threat and
Conservation
Bird species A B C D E F G H I SSI Comment
Red-thr. diver 5 2 2 1 5 4 4 3 5 45.0 Disturbance by shipping put at 5
Black-thr. diver 5 2 3 1 5 4 4 3 5 49.5 Disturbance by shipping put at 5
Gr.Northern Diver 5 2 3 1 5 4 5 3 5 53.6 Not in Garthe & Hüppop
White-billed Diver 5 2 3 1 5 4 5 3 5 53.6 Not in Garthe & Hüppop
Unid. Diver 45.0 Most are Red-throated
Gr. Crested Grebe 4 2 3 2 3 4 4 1 1 19.3 Conform Garthe & Hüppop
Red-necked grebe 4 2 1 1 4 5 5 1 1 21.0 Disturbance by shipping put at 4
Northern Fulmar 3 1 2 4 1 1 1 5 1 5.8 Conform Garthe & Hüppop
Northern Gannet 3 3 3 2 1 1 4 5 3 11.0 Disturbance by shipping put at 1
Great Cormorant 4 1 4 1 3 3 4 3 1 20.0 Disturbance by shipping put at 3
Greater Scaup 3 1 2 3 4 4 5 2 5 36.0 Not in Garthe & Hüppop
Common Eider 4 1 2 3 4 4 2 4 1 23.3 Disturbance by shipping put at 4
Long-tailed Duck 3 1 2 3 4 4 2 2 1 15.0 Not in Garthe & Hüppop
Common Scoter 3 1 2 3 5 4 2 2 1 16.9 Conform Garthe & Hüppop
Velvet Scoter 3 1 2 3 5 4 3 2 3 27.0 Conform Garthe & Hüppop
Goldeneye 3 1 2 3 4 4 4 2 1 21.0 Not in Garthe & Hüppop
Red-br. Merganser 4 1 2 3 4 4 4 2 1 23.3 Not in Garthe & Hüppop
Pomarine Skua 1 3 5 1 2 2 4 3 2 15.0 Not in Garthe & Hüppop
Arctic Skua 1 3 5 1 2 2 4 3 1 13.3 Disturbance by shipping put at 2
Long-tailed Skua 1 3 5 1 2 2 4 3 1 13.3 Not in Garthe & Hüppop
Great Skua 1 3 4 1 2 2 5 4 2 16.5 Disturbance by shipping put at 2
Unid. skua 14.0 Not in Garthe & Hüppop
Mediterranean Gull 1 3 2 3 1 2 5 2 1 9.0 Not in Garthe & Hüppop
Little Gull 1 1 3 2 2 3 5 2 4 16.0 Disturbance by shipping put at 2
Black-headed Gull 1 5 1 2 1 2 1 3 1 5.6 Disturbance by shipping put at 1
Common Gull 1 3 2 3 1 2 2 2 4 9.0 Not in Garthe & Hüppop
Lesser BB Gull 1 4 2 3 1 1 4 5 2 9.2 Disturbance by shipping put at 1
Herring/LBB Gull 8.3 Not in Garthe & Hüppop
Herring Gull 2 4 2 3 1 1 2 5 1 7.3 Disturbance by shipping put at 1
Great BB Gull 2 3 2 3 1 2 4 5 2 13.8 Disturbance by shipping put at 1
Unid. BB Gull 11.5 Not in Garthe & Hüppop
Kittiwake 1 2 3 3 1 2 1 3 1 5.6 Disturbance by shipping put at 1
Unid. gull 8.3 Not in Garthe & Hüppop 5920 6020
Sandwich Tern 1 3 5 1 1 3 4 4 4 20.0 Disturbance by shipping put at 1
Common Tern 1 2 5 1 1 3 3 4 1 12.0 Disturbance by shipping put at 1
Arctic Tern 1 1 5 1 1 3 3 4 1 10.7 Disturbance by shipping put at 1
Commic Tern 11.3 Not in Garthe & Hüppop
Little tern 1 1 4 1 2 3 4 4 4 17.5 Not in Garthe & Hüppop
Black tern 1 1 4 1 2 3 4 4 4 17.5 Conform Garthe & Hüppop
Common Guillemot 4 1 1 2 2 3 1 4 1 10.0 Disturbance by shipping put at 2

Report number C099/11 89 of 90
Razormot 11.6 Not in Garthe & Hüppop
Razorbill 4 1 1 1 2 3 2 5 2 13.1 Disturbance by shipping put at 1
Black Guillemot 3 1 1 2 2 4 3 4 2 15.8 Not in Garthe & Hüppop
Little Auk 3 1 1 3 2 4 2 5 1 16.0 Not in Garthe & Hüppop
Atlantic puffin 3 1 1 1 3 3 2 5 5 18.0 Disturbance by shipping put at 3
Figure 62 Ranked SSI values
Sensitivity of cetaceans to wind farms
Sensitivity values for cetaceans are not given, as the sensitivity to wind farms by cetaceans and the
species in this sensitivity is poorly understood.

90 of 90 Report number C099/11
Appendix B. Wind farm Sensitivity Index
Taken from Leopold & Dijkman (2010). The left panel represents the maximum WSI over six bimonthly
periods, the right panel shows the average over these six maps. Note the dominance of the coastal zone,
the Frisian Front, the Cleaver Bank and surroundings, (parts of) the Dogger Bank and the Southern
Bight. WSI is the summation of the multiplication of bird densities and SSIs.