Imaging of Head and Neck
47
CHAPTER ELEVEN Overview of Diagnostic Imaging of the Head and Neck Nafi Aygun S. James Zinreich Key Points • The choice of imaging modality varies depending on the location and nature of the disease process. • CT is fast and widely available and can be employed as the first and often the only imaging modality in the majority of the disease processes affecting the neck. • CT excels in demonstrating bone detail. • IV contrast administration for CT examinations improves the quantity and quality of information provided. • Radiation exposure from CT examination is substantial and should be taken into account particularly in young patients who require repeat examinations. • MRI provides excellent soft tissue contrast and is the modality of choice in most aggressive processes. • Appropriate use of fat suppression and IV contrast are essential for most MRI examinations of the head and neck. • The accuracy of PET increases when it is used in conjunction with CT. • Successful primary staging of most malignant lesions in the neck can be accomplished with CT or MRI and clinical examination. • PET/CT is superior in identifying distant metastases and postoperative follow-up. • Image interpretation should always be made in conjunction with clinical information. • To provide a practical differential diagnosis for neck mass lesions, an approach based on neck spaces that are defined by the cervical fascia is advised. Diagnostic medical imaging has changed medical and surgical diagno- sis in ways never imagined. Every area of clinical medicine has been affected in a profound way. Radiologists are able, through their con- sultations, to assist the otolaryngologist in a variety of ways, including providing primary diagnosis, confirming a clinical impression, evaluat- ing regional anatomy and extent of disease, assessing response to treat- ment, and assisting in definitive treatment of patients. Neuroradiologists are subspecialty trained radiologists who spe- cialize in the imaging of the head and neck, skull base, temporal bone, brain, and spine. They are the primary imaging consultants for otolaryngologists. This chapter provides an introduction and overview of head and neck imaging for the otolaryngologist. The various available imaging modalities are discussed. Imaging strategies for various regions and clinical questions are reviewed. The basic approach to the radiologist’s image acquisition and interpretation are described so that the referring physician will gain a measure of understanding of this field. This is intended to maximize the usefulness of diagnostic imaging in the care of patients. The scope of head and neck imaging is too broad a topic to be covered in one chapter. The authors provide the clinician with an outline and brief synopsis of the field. Definitive textbooks for each area of head and neck imaging are available. 1-4 Available Imaging Modalities Conventional Radiography Since the discovery of the x-ray, conventional radiography (CR) has been used in imaging the head and neck region. CR in the head and neck imaging has been largely replaced by computed tomography (CT). The traditional projections obtained with CR that are applicable to head and neck imaging are described here. Views of the Facial Bones and Sinuses Lateral, Caldwell, Waters, and submentovertex (SMV or base) views are attainable. The lateral view shows the frontal, maxillary, and sphe- noid sinus. It is best obtained 5 degrees off the true lateral position to avoid superimposition of the posterior walls of the maxillary sinuses. The Caldwell view displays the frontal sinuses and posterior ethmoid air cells. It is obtained in the posteroanterior (PA) projection with 15 degrees of caudal angulation of the x-ray beam. The Waters view can show the maxillary sinuses, anterior ethmoid air cells, and orbital floors. It is obtained in the PA projection with the neck in 33 degrees of extension. The SMV view can show the sphenoid sinuses and the anterior and posterior walls of the frontal sinuses. It is obtained in the anteroposterior (AP) projection with the head in 90 degrees of extension.
Transcript of Imaging of Head and Neck

E
CHAPTER ELEVEN
Overview of Diagnostic Imaging of the Head and NeckNafi Aygun
S. James Zinreich
Key Points
• The choice of imaging modality varies depending on the location and nature of the disease process.• CT is fast and widely available and can be employed as the first and often the only imaging modality in the majority of the disease
processes affecting the neck.• CT excels in demonstrating bone detail.• IV contrast administration for CT examinations improves the quantity and quality of information provided.• Radiation exposure from CT examination is substantial and should be taken into account particularly in young patients who require
repeat examinations.• MRI provides excellent soft tissue contrast and is the modality of choice in most aggressive processes.• Appropriate use of fat suppression and IV contrast are essential for most MRI examinations of the head and neck.• The accuracy of PET increases when it is used in conjunction with CT.• Successful primary staging of most malignant lesions in the neck can be accomplished with CT or MRI and clinical examination.• PET/CT is superior in identifying distant metastases and postoperative follow-up.• Image interpretation should always be made in conjunction with clinical information.• To provide a practical differential diagnosis for neck mass lesions, an approach based on neck spaces that are defined by the
cervical fascia is advised.
Diagnostic medical imaging has changed medical and surgical diagno-sis in ways never imagined. Every area of clinical medicine has been affected in a profound way. Radiologists are able, through their con-sultations, to assist the otolaryngologist in a variety of ways, including providing primary diagnosis, confirming a clinical impression, evaluat-ing regional anatomy and extent of disease, assessing response to treat-ment, and assisting in definitive treatment of patients.
Neuroradiologists are subspecialty trained radiologists who spe-cialize in the imaging of the head and neck, skull base, temporal bone, brain, and spine. They are the primary imaging consultants for otolaryngologists.
This chapter provides an introduction and overview of head and neck imaging for the otolaryngologist. The various available imaging modalities are discussed. Imaging strategies for various regions and clinical questions are reviewed. The basic approach to the radiologist’s image acquisition and interpretation are described so that the referring physician will gain a measure of understanding of this field. This is intended to maximize the usefulness of diagnostic imaging in the care of patients.
The scope of head and neck imaging is too broad a topic to be covered in one chapter. The authors provide the clinician with an outline and brief synopsis of the field. Definitive textbooks for each area of head and neck imaging are available.1-4
Available Imaging Modalities
Conventional RadiographySince the discovery of the x-ray, conventional radiography (CR) has been used in imaging the head and neck region. CR in the head and neck imaging has been largely replaced by computed tomography (CT). The traditional projections obtained with CR that are applicable to head and neck imaging are described here.
Views of the Facial Bones and SinusesLateral, Caldwell, Waters, and submentovertex (SMV or base) views are attainable. The lateral view shows the frontal, maxillary, and sphe-noid sinus. It is best obtained 5 degrees off the true lateral position to avoid superimposition of the posterior walls of the maxillary sinuses. The Caldwell view displays the frontal sinuses and posterior ethmoid air cells. It is obtained in the posteroanterior (PA) projection with 15 degrees of caudal angulation of the x-ray beam. The Waters view can show the maxillary sinuses, anterior ethmoid air cells, and orbital floors. It is obtained in the PA projection with the neck in 33 degrees of extension. The SMV view can show the sphenoid sinuses and the anterior and posterior walls of the frontal sinuses. It is obtained in the anteroposterior (AP) projection with the head in 90 degrees of extension.

E
Chapter 11 n Overview of Diagnostic Imaging of the Head and Neck 131
without image degradation. Images can be reconstructed in any desired plane regardless of the plane at which they are acquired.
CT uses a tightly collimated x-ray beam that is differentially absorbed by the various body tissues to generate highly detailed cross-sectional images. The degree of attenuation of the x-ray photons for each voxel (smallest imaging unit) is assigned a numeric readout. These units of attenuation are known as Hounsfield units (HU) and generally range from −1000 HU to +1000 HU. Water is assigned a value of 0 HU. Fat is approximately −80 to −100 HU. Calcium and bone are in the 100 to 400 HU range, and most fluids are in the 0 to 30 HU range.
To create images from the attenuation values, CT uses complex mathematical reconstruction algorithms. Bone disease and bone trauma are best visualized with a bone detail algorithm whereas a soft tissue algorithm is used to evaluate soft tissue structures (Fig. 11-1).
Computed Tomography Image DisplayImages from a given reconstruction algorithm can be displayed in various ways to highlight differences in attenuation of different struc-tures. The window width refers to the range of attenuation values in HU that make up the gray scale for a given image. The window level refers to the center HU value for that given window width. A narrow window width of 80 HU and a level of 40 HU is frequently used for brain imaging because it centers the density at the common density of brain tissue, and displays only those densities 40 HU greater than and 40 HU less than the window level. Thus any density greater than 80 HU will be displayed as white, and any density less than 0 will be displayed as black on the gray scale. Any intermediate density will be spread out evenly along the gray scale. For imaging of the soft tissues of the head and neck, a window level of approximately 40 to 70 HU is usually chosen, at a midpoint approximately equal to the density of muscle. The window width frequently is in the 250 to 400 HU range, thus displaying a wider range of densities including calcification, intra-
Views of the NeckAP and lateral views of the neck exposed for soft tissue detail are useful for the evaluation of the overall contour of the soft tissues of the neck. These views are essentially the same projections used in the evaluation of cervical trauma, but they are not exposed for bone detail.
Temporal Bone ViewsSeveral projections are acceptable for visualizing portions of the tem-poral bone, including the Schüller projection, a lateral view of the mastoid obtained with 30 degrees of cephalocaudad angulation. The Stenvers projection is an oblique projection of the petrous bone obtained with the patient’s head slightly flexed and rotated 45 degrees toward the side opposite the one under study. The beam is angulated 14 degrees. The transorbital projection is a frontal projection of the mastoids and petrous bones. Conventional imaging of the temporal bone has largely been replaced by CT scanning.
Computed TomographyCT was developed for clinical use in the mid-1970s by Hounsfield. CT scanners have evolved over time such that the most advanced scanners now scan in a “helical” fashion, in which the scanner uses a slip-ring technique. This allows the table to move as the scan is performed, resulting in complete volumes of tissue being imaged without skipping tissue between slices. The ratio of the speed at which the table moves to the time it takes for a complete rotation of the CT tube is called the pitch. Multidetector CT allows scanning of multiple slices during one rotation of the CT tube which significantly increases the speed of examination, which in turn makes it possible to obtain much thinner slices in a short time. At present, CT scanners can obtain slices 0.5 mm thick. A neck examination from skull base to the mediastinum can be performed in less than 30 seconds. More importantly, enhanced com-puter technology permits real-time manipulation of these data, allowing multiplanar and various forms of three-dimensional reconstructions
A B
C D
Figure 11-1. Comparison of various computed tomography algorithms and windows. A, Soft tissue algorithm and B, bone algorithm images of a laryngeal hematoma (arrowheads) using soft tissue windows (350 HU width). The bone algorithm image has a grainier appearance, whereas the standard algorithm gives a smoothed image. Soft tissue algorithm (C) and bone algorithm (D) images of the skull base using bone windows (4000 HU width). Note the improved sharpness of the petrous apex trabeculae (arrowheads) and bony walls of the mastoid and ethmoid sinus air cells (arrows).

E
132 Part 2 n General Otolaryngology
archiving and communication systems (PACS) are becoming the norm for image display and storage.
Patient CooperationPatient cooperation is necessary to obtain optimal image quality. The patient is instructed not to swallow and to stop breathing or to maintain quiet breathing during each slice acquisition to minimize motion arti-fact from the adjacent airway and pharyngeal structures. Occasionally, provocative maneuvers such as blowing through a small straw or using a cheek-puffing (modified Valsalva) maneuver to distend the hypophar-ynx, or phonating to assess vocal cord movement, may be necessary (Figs. 11-2 and 11-3).
Contrast enhancement often is used to opacify blood vessels and to identify regions of abnormal tissue as identified by abnormal enhancement patterns (Fig. 11-4). As it relates to head and neck imaging, contrast is particularly useful in CT scans of the neck and orbits. Contrast often is not needed in evaluation of the temporal bones, although it can be necessary on occasion. CT of the facial bones and paranasal sinuses does not require intravenous contrast for most common applications.
Radiation ExposureAs a brief review, the radiation exposure (dose) that a patient receives is known as the radiation absorbed dose. This radiation absorbed dose is a measure of the total radiation energy absorbed by the tissues, and
venous contrast, muscle, and fat to best advantage. For imaging bony structures such as paranasal sinuses and temporal bone, window levels from 0 to 400 HU and a wide window width of 2000 to 4000 HU may be chosen. The reason for a wide bone window width is that a wide range of densities ranging from cortical bone (approximately +1000 HU) down to gas (−1000 HU) need to be displayed on the same image. However, structures of intermediate density between bone and gas occupy a narrow range on the gray scale at this window width and are poorly discriminated (appear washed out) on these settings. The termi-nology commonly used to describe the previously mentioned windows includes soft tissue windows (window width of 250 to 400 HU) and bone windows (2000 to 4000 HU). It is important to understand that these display windows are completely independent of the mathematical imaging algorithm chosen for creation of the image. In other words, an image created by a soft tissue algorithm can be displayed with soft tissue and bone window widths (see Figs. 11-1A and C). Conversely, the image may be computer reconstructed using a bone algorithm and displayed with either soft tissue or bone window width (see Fig. 11-1B and D). To optimize the imaging of the soft tissue lesion and the adjacent bone, a soft tissue and a bone algorithm may be used, gener-ating images with the appropriate soft tissue and bone windows. (See also Figs. 11-12A and C).
Multiple options for displaying the image (adjusting the window level and width parameters on the imaging console) and recording it permanently on radiographic film or other media are available. Picture
A B
Figure 11-2. Larynx without and with modified Valsalva maneuver. A, Axial contrast-enhanced computed tomography (CECT) performed during quiet breathing does not allow discrimination of the retrocricoid carcinoma (arrow) because the posterior pharyngeal wall is collapsed against the mass. B, Axial CECT in the same patient (a few minutes later) obtained with a modified Valsalva maneuver causes distention of the now air-filled hypopharynx, permitting tumor detection (arrow).
A B
Figure 11-3. Axial contrast-enhancing computed tomography during breath holding and while phonating. A, This axial computed tomography, obtained during breath holding, shows the true vocal cords adducting and approximating each other (arrowheads). Note the superb high-contrast density in common carotid artery (asterisk) and jugular veins. B, Phonating “eeee” causes the vocal cords to partially adduct into the paramedian position. Note that the contrast density has significantly decreased in the common carotid artery (asterisk) and the jugular veins in this delayed image, obtained well after contrast infusion had finished.

E
Chapter 11 n Overview of Diagnostic Imaging of the Head and Neck 133
magnets are electromagnets usually composed of niobium-titanium wire. They require input of energy to start them, but once they are up to strength, they are maintained in a superconductive state by means of an encasing system of liquid nitrogen and liquid helium shells.
The earth has a magnetic field strength of 0.5 Gauss (G). The tesla (T) is another unit of magnetic strength that is related to G by the equation 1 T = 10,000 G. Clinical MRI units usually operate at magnetic field strengths of between 0.3 and 3.0 T. Small-bore research scanners of strengths up to 9.0 T are in use.
Many MR pulse sequences are available to generate images. The most common pulse sequences in MRI are the spin-echo and gradient echo techniques.
MRI is one of the most active areas of development and research within diagnostic radiology. MRI derives its signal from hydrogen protons, most abundant in tissue fat and water. When placed in a high magnetic field, the spinning protons are aligned in the direction of the magnetic field. Radio frequency pulses are transmitted into the subject to excite the spinning protons, changing their orientation with respect to the magnetic field. As the protons realign with the magnetic field, they lose energy and give off a signal, which is picked up by coils and reconstructed into an image. The quality of MRI depends on a high signal-to-noise ratio, which is used to improve image contrast and spatial resolution. In general, the higher the field strength of the magnet, the higher the signal-to-noise ratio.
A surface coil is a receiving antenna for the radio frequency signal that is emitted from the imaging subject after the initial radio frequency stimulation. The standard head coil is usually adequate for studying head and neck disease above the angle of the mandible. A head coil allows imaging of the adjacent brain and orbits, an advantage when head and neck lesions extend intracranially. Neck coils cover a larger area from the skull base to the clavicles and come in various configura-tions, for example, volume neck coil and anterior neck coil. Surface coils significantly improve the quality of head and neck imaging by more effectively collecting the signal hence increasing the signal-to-noise ratio but they are able to collect signal from a smaller body part.
Slice thickness on MRI is most commonly 5 mm, with 3-mm sections used for smaller regions of interest. However, a thinner slice has a smaller signal-to-noise ratio. Occasionally, 1- to 2-mm sections may be needed for small structures (e.g., facial nerve), requiring a volume acquisition technique. The number of slices is limited in MRI (as opposed to CT) by the specific sequence used. Covering the entire neck from skull base to superior mediastinum often requires that two separate acquisitions be obtained.
Magnetic Resonance Imaging ArtifactsMotion artifact, chemical shift artifact, susceptibility artifacts from metallic implants (e.g., amalgam, orthodontic implants), and eyelid mascara degrade MRI (Fig. 11-5). Motion artifact becomes more
v
v
Figure 11-4. Contrast-enhancing computed tomography (CECT) with suboptimal contrast infusion. This axial CECT of a patient with a left piriform sinus tumor was obtained with insufficient contrast infusion, resulting in poor discrimination of the common carotid artery (asterisk) and jugular vein (v) from the isodense adjacent metastatic lymph node (arrow). Inadequate contrast infusion also reduces the likelihood of identifying the focal defect in nodal metastasis.
Table 11-1
Estimated Effective Dose Equivalent of Common Examinations
Examination Effective Dose Equivalent
Chest radiograph 20 mrem
CT, abdomen 1000 mrem
CT, chest 1000 mrem
CT, brain 120 mrem
CT, sinus 70 to 130 mrem
From Nationwide Evaluation of X-Ray Trends (NEXT) 2000 Survey of Computed Tomography. Frankfort, KY: Food and Drug Administration, Center for Devices and Radiological Health; August 2007. CRCPD Publication E-07-2.
it is expressed in an international system (SI) unit known as the Gray (Gy). One Gy is the amount of radiation needed to deposit the energy of 1 Joule (J) in 1 kg of tissue (1 Gy = 1 J/kg). Formerly, the unit used to express radiation absorbed dose was the rad (1 rad = amount of radiation needed to deposit the energy of 100 ergs in 1 g of tissue). The conversion of rads to Gy is 1 Gy = 100 rad.
Radiation dose equivalent is a more useful term as it considers the “quality factor” (Q) of the radiation involved (radiation dose equivalent = radiation absorbed dose Q). The quality factor considers the varying biologic activity of various types of ionizing radiation. For x-rays, Q = 1. Thus when discussing diagnostic x-rays, the radiation dose equivalent equals the radiation absorbed dose. The SI unit for the radiation dose equivalent is the Sievert (Sv). The former unit was the Roentgen equiv-alent for man (rem). In summary, 1 Gy = 1 Sv, and 1 Sv = 100 rem.
The radiation dose equivalent depends on the choice of tube voltage and current settings (kVp and mAs), slice thickness, pitch, and gantry cycle time. For a given kVp, the radiation dose equivalent will vary linearly with the mAs. The actual dose will vary slightly among machines. The radiation dose equivalent for a CT examination can be considerably reduced using a low-mAs technique.
The effective dose equivalent was developed as a means of repre-senting the fraction of the total stochastic risk of fatal cancers and chromosomal abnormalities resulting from the irradiation of a particu-lar body part. A system of weighting is used to consider the individual susceptibility of the body’s major tissues and organs. A full discussion of this is beyond the scope of this chapter. Suffice to say that, for a given examination, the effective dose to the patient is less than the dose (radiation dose equivalent) received by the area under examination. Table 11-1 lists common radiologic procedures and their effective dose equivalents.
Magnetic Resonance ImagingMagnetic resonance imaging (MRI) is an imaging modality that uses the response of biologic tissues to an applied and changing magnetic field to generate images. It is not possible to completely describe the principles of MRI in an introductory chapter of all head and neck imaging. A brief summary of MRI follows.
Two types of magnets are used to perform clinical MRI: perma-nent and superconducting. Permanent magnets do not require con-tinual input of energy to maintain the magnetic field. They are composed of large magnetic metallic elements set up to generate a uniform magnetic field between components. Superconducting

E
134 Part 2 n General Otolaryngology
signal-to-noise ratio, and a moderate imaging time (4 to 5 min), mini-mizing motion artifacts. Fat is high signal intensity (bright or white) on T1WIs and provides natural contrast in the head and neck. Air, rapid blood flow, bone, and fluid-filled structures (e.g., vitreous and cerebrospinal fluid [CSF]) are low signal intensity (dark or black) on T1WIs. Muscle is low to intermediate in signal intensity on T1WIs. The inherent high contrast of fat relative to adjacent structures allows excellent delineation of the muscles, globe, blood vessels, and mass lesions that border on fat. The cortical bone is black, and the enclosed bone marrow is bright from fat within the marrow. The aerated para-nasal sinuses are black, whereas retained mucous or mass lesions are of low to intermediate signal intensity. Most head and neck mass lesions show a comparable signal to muscles on T1WIs. (To quickly identify a T1WI: fat is white, CSF and vitreous are black, and nasal mucosa is low signal.)
T2-Weighted ImagesT2-weighted images (see Fig. 11-6C) use a long TR (2000 to 4000 msec) and a long TE (50 to 90 msec) and are sometimes referred to as long TR/long TE images. Note that spin density and T2WI are acquired simultaneously from a single sequence that produces two sets of images with the same TR but different TEs. For example, spin density = 2000/30 and T2WI = 2000/80. T2WIs are most useful for hig-hlighting pathologic lesions. T2WIs show the vitreous and CSF as high signal intensity (bright) relative to the low to intermediate signal intensity of head and neck fat and muscle. Fat loses signal intensity with increased T2 weighting. Most radiologists use a fast spin-echo (FSE) T2WI for head and neck imaging, which provides a much faster acquisition with improved signal-to-noise. Fat remains bright, however, on FSE images. Most head and neck masses are higher signal intensity on a T2WI compared with their low-to-intermediate signal intensity on T1WI. The combination of the T1WI and T2WI is often useful for characterizing fluid-containing structures, solid components, and hemorrhage. Bone, rapid vascular flow, calcium, hemosiderin, and air-containing sinuses are black. Inflammatory sinus disease and normal airway mucosa appear very bright. (To quickly identify a T2WI: CSF, vitreous, and nasal mucosa are bright. Muscle is low to intermediate in signal.)
Gadolinium EnhancementGadolinium-based contrast material is used in conjunction with T1WI sequences (gadolinium shortens the T1) and, with the dose used, it has little effect on T2WI. The advantages of contrast enhancement are increased lesion conspicuity and improved delineation of the margins of a mass relative to the lower signal of muscle, bone, vessel, or globe.5
prominent with increased field strength, increased length of individual pulse sequences, and the total length of the imaging study. A typical imaging sequence may last from 2 to 8 minutes. To limit motion artifact, sequences fewer than 4 minutes are preferred, and the patient should be instructed not to swallow and to breathe shallowly and quietly.
Chemical shift artifact arises from the differences in resonance frequencies of water and fat protons. The result is an exaggerated interface (spatial misregistration) in areas where fat abuts structures containing predominantly water protons such as the posterior globe or a mass. Chemical shift artifact may produce the appearance of a pseu-docapsule around a lesion or cause obscuration of a small-diameter structure such as the optic nerve. Chemical shift artifact may be identi-fied as a bright band on one side of the structure and a black band on the opposite side. This is usually most noticeable on T1-weighted images (T1WIs).
Metallic artifact from dental work varies in severity depending on amount and composition of the metal in the mouth, as well as the pulse sequence and field strength of the MRI scanner. Most dental amalgam causes mild distortion to the local magnetic field, resulting in a mild dropout of signal around the involved teeth. Extensive dental work, metallic implants, and braces may cause more severe distortion of the image, precluding visualization of the maxilla, mandible, and floor of the mouth. Mascara containing metallic compounds can also cause localized signal loss in the anterior orbit and globe.
Magnetic Resonance Imaging Pulse SequencesNumerous pulse sequences are available on clinical MRI units. The details of the physics of MRI may be found in most radiology and MRI textbooks. Commonly used imaging protocols include T1-weighted, spin (proton) density, T2-weighted, gadolinium-enhanced T1-weighted, fat-suppressed, and gradient echo imaging. Magnetic resonance angi-ography (MRA) is infrequently obtained (Figs. 11-6 and 11-7). The abbreviations used to identify sequence parameters are repetition time (TR), echo time (TE), and inversion time (TI) and are measured in milliseconds. The following description of pulse sequences is intended to assist the clinician in identifying and understanding the commonly performed sequences and in determining their respective use in the head and neck.
T1-Weighted ImagesT1-weighted (short TR) sequences (see Figs. 11-6A and 11-7A) use a short TR (500 to 700 msec) and a short TE (15 to 40 msec). T1-weighted imaging is the fundamental head and neck sequence because it provides excellent soft tissue contrast with a superior display of anatomy, a high
A B
Figure 11-5. Magnetic resonance imaging artifacts. A, Motion during axial short T1 inversion recovery sequence caused significant degradation of the image with anatomic distortion and mismapping of the signal intensity. B, Metallic dental braces cause artifacts distorting anterior facial structures in this T1-weighted image of a boy with juvenile angiofibroma filling the nasal cavity (arrow) and nasopharynx. Anterior maxilla and portion of the nose have been distorted.

E
Chapter 11 n Overview of Diagnostic Imaging of the Head and Neck 135
intensity and thus eliminates fat signal by turning it completely black. STIR images show the mucosa, vitreous, and CSF as very high signal intensity. Most mass lesions in the head and neck have similar high signal intensity on STIR and T2WI. The disad-vantages of STIR are image degradation secondary to a decreased signal-to-noise ratio, and increased vulnerability to motion artifacts including the vessel pulsations. Additional disadvantages of STIR, such as increased scan time and fewer slices, are circumvented by the recently available fast sequences. (To quickly identify a STIR image: fat is almost completely black; CSF, vitreous, and mucosa are very bright. A TI is listed with the TR and TE times on the image.)
2. Frequency selective presaturation sequences (see Fig. 11-7B) typi-cally used with a spin-echo technique selectively suppress fat signal. (Note that for the remainder of this chapter, the terms fat sup-pression and fat saturation are used interchangeably and refer to frequency [chemical shift] selective presaturation techniques). T1-weighted fat saturation sequences take full advantage of gado-linium enhancement. A gadolinium-enhancing lesion within the head and neck retains its high signal intensity and is not obscured, because fat is suppressed to become low to intermediate signal intensity. Enhancing masses within the head and neck and orbit are particularly well imaged with this technique.8 Frequency selective fat suppression is also complementary for FSE T2WIs (see Figs. 11-7C and D). Fat-saturated T2WIs provide excellent fat suppres-sion, optimizing the high signal from normal structures and lesions that are high in water content contrasted against a black background of fat. The disadvantages of fat saturation sequences are that non–gadolinium-enhancing lesions may be less well discriminated, that these sequences are more susceptible to artifacts, and that nonuni-form fat suppression can occur. Also, fewer slices are acquired than with T1WI, unless the TR time is lengthened, which prolongs imaging time. (To quickly identify a gadolinium-enhanced T1WI
However, gadolinium enhancement (without concomitant fat suppres-sion) has had limited usefulness within the head and neck, as well as in the orbit, because of the large amount of fat present within these regions (see Fig. 11-6D). After gadolinium injection, the signal increases within a lesion, often obscuring the lesion within the adjacent high signal intensity fat.6 Therefore, for head and neck imaging, gadolinium is optimally used with specific fat suppression techniques that turn fat dark or black. Gadolinium enhances normal structures including nasal and pharyngeal mucosa, lymphoid tissue in Waldeyer’s ring, extraocu-lar muscles, and slow-flowing blood in veins, all of which may appear surprisingly bright, especially if combined with fat suppression tech-niques. (To quickly identify a gadolinium-enhanced T1WI: nasal mucosa is white, fat is white, and CSF and vitreous are black. Also look for Gd-DTPA printed directly on the image or on adhesive study labels.)
Fat Suppression MethodsSeveral sequences have been developed that suppress fat signal intensity. T2WIs, short TI inversion recovery (STIR), spectral presaturation inversion recovery (SPIR), and chemical shift selective presaturation (fat saturation) are some of the more common clinically available methods of fat suppression. One advantage of fat suppression is reduc-tion or elimination of chemical shift artifacts by removing fat signal from the image while preserving water signal. Additionally, some fat suppression techniques take advantage of gadolinium enhancement by eliminating the surrounding high intensity signal from fat while retain-ing the high intensity enhancement produced by gadolinium. Most pathologic lesions have increased water content, and gadolinium exerts its paramagnetic effects while in blood vessels and in the increased extracellular fluid of the lesion, but gadolinium does not enhance fat. The fat signal can be manipulated in the following ways:
1. STIR (see Fig. 11-7E) provides reliable fat suppression over large body parts.7 The inversion time (e.g., TI = 140 msec) is individually “tuned” for each patient to place fat at the null point of signal
A B
C D
Figure 11-6. Common magnetic resonance imaging pulse sequences without fat suppression. A, Axial T1-weighted image (T1WI) of the left glottic tumor (arrowheads), which is intermediate in signal intensity and thickens the true cord. Note that the cerebrospinal fluid (CSF) surrounding the spinal cord (arrow) is black, indicating that this is a T1WI. B, Spin density-weighted image also reveals high signal intensity (caused by increased water content) of the vocal cord tumor. CSF is now isointense to the spinal cord (arrow), indicating this is a spin density sequence. C, T2-weighted image demonstrates a high signal intensity mass clearly demarcated against the dark background of fat and muscle. D, Postgadolinium T1WI shows enhancement of the cord tumor (arrowheads). CSF remains black (arrow).

E
136 Part 2 n General Otolaryngology
They have a variety of proprietary acronyms, including GRASS, MPGR, SPGR, FLASH, and FISP. Gradient echo sequences take advantage of the phenomenon of flow-related enhancement. That is, any rapidly flowing blood appears extremely bright. These sequences are useful for localizing normal vessels, detecting obstruction of flow in compressed or thrombosed vessels, and showing vascular lesions that have tubular, linear, or tortuous bright signal representing regions of
with fat saturation: mucosa and small veins are white, fat is low to intermediate intensity, and CSF and vitreous are black.)
Gradient Echo TechniquesNumerous gradient echo sequences are available that have a variety of applications. Gradient echo scans have a very short TR (30 to 70 msec), a very short TE (5 to 15 msec), and a flip angle of less than 90 degrees.
A B
C
E
D
Figure 11-7. Magnetic resonance imaging pulse sequences with fat suppression. A, Axial T1-weighted image (T1WI) without contrast in a patient with squamous cell cancer shows a poorly defined mass in the left parotid gland (arrowheads). Suboptimal signal in the image is the result of a signal drop-off at the edge of the anterior neck surface coil. B, Axial postgadolinium T1WI with fat saturation has adequate suppression of sub-cutaneous fat (compared with A) and enhancement of the tumor (arrowheads). Center of the mass enhances less and likely is necrotic. Cerebro-spinal fluid (CSF) is black (arrow), indicating a T1WI. Note the marked enhancement of the inferior turbinates (asterisks) compared with the precontrast T1WI. C, Axial postgadolinium spin density image with fat saturation shows a high signal in the mass (arrowheads) with a lower-intensity necrotic center (asterisk). Fat signal is suppressed and the image is similar to B. CSF is isointense with the spinal cord indicating the use of a spin density sequence. Turbinates are very bright. D, Axial T2-weighted image with fat saturation demonstrates nearly ideal fat suppres-sion, almost as good as a short T1 inversion recovery (STIR) sequence. Necrotic or cystic center of the mass (asterisk) and CSF (arrow) have become very bright. E, On this axial STIR image with excellent fat suppression, the margin and center of the mass are bright.

E
Chapter 11 n Overview of Diagnostic Imaging of the Head and Neck 137
UltrasoundHigh-resolution diagnostic ultrasound uses the properties of reflected high-frequency sound waves to produce cross-sectional images, obtain-able in almost any plane. The transducer, a high-frequency 5- or 10-MHz probe, scans over the skin surface of the region of interest. Fat has a moderate degree of internal echoes (echogenicity). Skeletal muscle is less echogenic than fat. A solid mass has a variable echogenic-ity but is usually less echogenic than fat. A cyst has few, if any, internal echoes, a strongly echogenic back wall, and strong through-transmis-sion of sound behind the cyst. Both calcium and bone are strongly echogenic, thus obscuring adjacent structures by an acoustic shadow. Ultrasound has no known harmful effects and no contraindications. High-resolution ultrasound is quick and accurate. Doppler ultrasound provides information on blood vessels and flow patterns. Furthermore, it is relatively inexpensive compared with CT or MRI. Disadvantages include limited field of view, lack of easily identifiable anatomic land-marks, and operator dependence.
Nuclear Medicine
Positron Emission TomographyAs opposed to the imaging modalities already discussed in this chapter, which allow detailed anatomic information, positron emission tomog-raphy (PET) imaging provides physiologic and biochemical data. A positron emitting radiopharmaceutical is intravenously injected and its distribution in the body is measured. Positron emitting radiopharma-ceuticals can be developed from naturally occurring substances such as 15O water, 11C carbon monoxide, or 13N ammonia, or radioactive analogs of other biologic substances such as 18F fluoro-2-deoxy-2-glucose (FDG). After being emitted from the atom, the positron travels in the tissue for a short distance until it encounters an electron and forms a positronium, which immediately annihilates (converts its mass to energy) forming two 511-keV photons. These annihilation photons travel away from each other at approximately 180 degrees and are picked up by the detectors placed around the patient. Simultaneous detection of these photons relates them to the same annihilation event and allows spatial localization. Annihilation coincidence detection can be accomplished by very expensive dedicated PET scanners, yielding superior spatial resolution and sensitivity. Less costly gamma camera-based hybrid systems allow utilization of PET imaging outside of aca-demic centers.
Attenuation of the photons in tissues they travel through decreases the apparent activity picked up by the detectors. Attenuation correction methods provide improved anatomic detail and better lesion localiza-tion but they result in noisier images. The effect of attenuation correc-tion on visual image quality is controversial and, in many centers, the images are generated both with and without attenuation correction. For semiquantitative and quantitative evaluation, however, attenuation cor-rection is necessary.
Depending on the radiopharmaceutical chosen, PET imaging can provide information regarding blood flow, ischemia, deoxyribonucleic acid metabolism, glucose metabolism, protein synthesis, amino acid metabolism, and receptor status. Radiopharmaceutical development requires sophisticated knowledge and equipment which, combined with the very short half-life of most of these substances, limits clinical utility. The relatively long half-life of FDG (110 minutes) accounts for its widespread use. FDG can be delivered to PET imaging facilities through commercial vendors obviating the need for an on-site cyclotron.
Glucose metabolism in growing neoplastic cells is enhanced and accounts for the increased uptake on FDG-PET studies. Molecular studies have revealed that several genetic alterations responsible for tumor development also have direct effects on glycolysis. It has also been shown that increased tumoral FDG uptake is strongly related to the number of viable tumor cells, but not clearly associated with their proliferative rate. The glucose analog 2-deoxy-D-glucose is transported into the cell and metabolized in the glycolytic cycle. After phosphorylation with hexokinase to DG-6-phosphate, the com-pound is metabolically trapped in the cell. Because of this trapping mechanism, FDG concentration steadily increases in metabolically
rapid blood flow (Fig. 11-8). Gradient echo sequences may be obtained faster than conventional spin-echo techniques, although their increased susceptibility to motion artifact decreases the benefits of a short scan time. Gradient echo techniques also permit volume, that is, three-dimensional versus two-dimensional acquisition of images, allowing increased spatial resolution and computer workstation reconstruction of any imaging plane at various slice thicknesses. The disadvantage of gradient echo sequences is the increased magnetic susceptibility artifact from bone or air, thus limiting their role near the skull base or parana-sal sinuses. (To quickly identify a gradient echo image: arteries and often veins are white; fat, CSF, vitreous, and mucosa may have variable signal intensities depending on the technique used.)
Magnetic Resonance AngiographyMRA is most commonly generated by time-of-flight or phase contrast techniques, which rely on the flowing blood within the vessels as the signal source. Contrast-enhanced MRA uses the enhancement of blood with gadolinium-based contrast as the primary source of signal. MRA can be obtained with two-dimensional and three-dimensional algo-rithms. At present, MRA provides the most pertinent information in many clinical scenarios but lacks the temporal resolution (ability to image a vessel over time as the contrast material passes through) neces-sary to evaluate some of the vascular malformations.
Magnetic Resonance Imaging DisadvantagesSeveral disadvantages of MRI of the head and neck bear consideration. MRI frequently requires 30 to 45 minutes of scanning time, during which time the patient must remain motionless, a process difficult for a sick patient to accomplish. Motion artifacts are more frequently encountered than with CT, although dental artifacts may be less prob-lematic. Although no harmful effects are known to occur during preg-nancy, MRI should not be used during the first trimester. Absolute contraindications to MRI include patients with cardiac pacemakers, cochlear implants, and ferromagnetic intracranial aneurysm clips. With the ever-increasing variety of implants with electronic components, one must follow the manufacturer’s recommendations as to the safety of MRI. Those patients at risk for metallic orbital foreign bodies should be screened with plain films or CT before MRI. Generally, ocular prostheses and ossicular implants are safe. Unfortunately, MRI is one of the more expensive imaging modalities.
c
Figure 11-8. Gradient echo sequence in patient with right vagal para-ganglioma. Coronal multiplanar gradient echo image demonstrates a mass (arrowheads) displacing the internal carotid artery (c) medially. Arterial blood flow is very high in signal intensity in the medially dis-placed internal carotid artery, as well as within the feeding vessels deep inside mass.

E
138 Part 2 n General Otolaryngology
active cells, yielding a high contrast between tumor and normal tissue. Bear in mind that increased glucose metabolism is not unique to malignant cells and can be seen in benign tumors, inflammatory or infectious lesions, and even normal tissues. Also, some malignant cells may not have increased glucose metabolism for a variety of reasons.
A typical PET scan is started 30 to 60 minutes after the intrave-nous administration of approximately 10 mCi of 18F-FDG. A 6- to 12-hour period of fasting is required before injection. Patients are encouraged to drink water before the FDG injection to minimize collection in the urinary system. The patients are told not to speak or chew before PET scanning. Because normal FDG uptake in muscle may mimic tumor, muscle relaxants such as benzodiazepines are used in some centers. Scanning is performed in the supine position at mul-tiple table positions to cover the entire body. Scan time is 30 to 60 minutes.
Qualitative evaluation of FDG-PET images is sufficient for most clinical purposes, but quantitative measurement of FDG concen-tration is possible. Several approaches of different complexity can be applied for this purpose. Some of these require complex computa-tion, data acquisition, and arterial blood sampling during scanning. The most commonly used method, standardized uptake values (SUV), is simple and confined to the measurement of radioactivity concen-trations at a single time point. The activity concentration is normal-ized to the body weight or body surface area. SUV may allow differentiation of malignant tissue from benign causes of increased uptake and can be used to measure the response to treatment. A down-side of SUV calculation in therapy monitoring is that it only allows comparison of two measurements obtained at the same time point after tracer injection.
A major disadvantage of PET is lack of anatomic information, resulting in poor lesion localization. A number of software applications are used to “fuse” PET images with CT or MR images, which are obtained at different time points. Fusion of anatomic and functional images significantly improves lesion localization, but it is still subject to many technical difficulties and errors. Combined PET/CT units permit acquisition of both CT and PET images using a single piece of equipment in the same session without the need to move the patient. Errors in lesion localization are minimized, although they do occur in certain body regions where physiologic or involuntary motion is un -avoidable.
Another major limitation of PET is poor spatial resolution. Cur-rently, the maximum spatial resolution of dedicated PET scanners is about 5 to 6 mm. It is substantially inferior for more commonly used hybrid scanners. PET is an evolving technology and improvements in spatial resolution will surely be accomplished. Because of fundamental limitations inherent to the method, however, the maximum achievable spatial resolution is 1 to 2 mm. Therefore PET is incapable of showing microscopic disease.
Radionuclide ImagingScintigraphy has several applications in the head and neck. In sali-vary gland imaging, technetium-99m (99mTc)-pertechnetate imaging may be useful for assessing salivary gland function in autoimmune and inflammatory disease of the salivary glands. If the salivary glands are obstructed, the degree of obstruction, as well as the follow-up of obstruction after treatment, can be assessed. In evaluating neo-plasms of the salivary glands, the findings of the 99mTc-pertechnetate scan are almost pathognomonic of Warthin’s tumor and oncocy-toma. Spatial resolution is limited to approximately 1.5 cm, so accurate localization of the mass within the gland is difficult. Single photon emission computed tomography (SPECT) may be useful in some cases.
Techniques of thyroid imaging and thyroid therapy are described in several textbooks.9,10 Many centers use I-123 to obtain a thyroid update determination, and 99mTc-pertechnetate is used to obtain whole gland images. It is these images that determine whether thyroid nodules are “hot” or “cold.” I-131 is used for therapy of hyperthy-roidism and in follow-up to detect and treat residual, recurrent, and metastatic thyroid cancers.
Medullary carcinoma of the thyroid is difficult to visualize, but 99mTc-DmSA has been used. In-111 pentetreotide has been used with some success.
Identification of parathyroid adenomas has been done for several years with a subtraction technique using 99mTc-pertechnetate and Tl-201 (Fig. 11-9). The basis of this test is that thallium is taken up by thyroid tissue and parathyroid tissue. Thyroid tissue is the only tissue that uptakes 99mTc-pertechnetate. Therefore the subtraction of the 99mTc-pertechnetate image from the thallium-201 image should leave only parathyroid tissue. The sensitivity of this technique is believed to be very high for lesions larger than 1 g. Sensitivity decreases for smaller lesions, and the subtraction technique can be hampered by patient motion. 99mTc-sestamibi is now the favored agent in many institu-tions. A double-phase imaging protocol is employed with improved identification of parathyroid adenomas.
CSF leaks can be detected with In-111 DTPA placed into the subarachnoid space. This technique is described and illustrated in Chapter 44.
Three-Dimensional Reconstruction TechniquesImage data from either CT or MRI can be processed to create three-dimensional reconstructions. The state-of-the-art picture archival and communication systems (PACS) that are now available in most institu-tions obviate the need for a separate workstation to perform these reconstructions.
CT data are loaded as a stack of contiguous two-dimensional slices that define the scanned volume. Reconstructions are created either by choosing a specific range of densities for display or by manually tracing the outline of the desired structure. Improvements offered by multi-slice-multirow CT scanners and enhanced computational capacity of imaging workstations have led to a paradigm shift in radiology; volume imaging has replaced axial imaging. CT data from a large body part can be gathered in a very short time as a whole and the obtained “volumetric” data set can be displayed in various planes and as three-dimensional reconstructions.
Magnetic resonance data for image analysis are best acquired using a “volume acquisition” method, in which data are acquired as a com-plete three-dimensional block rather than as individual slices. Because volume acquisition takes longer, gradient echo techniques are usually required to reduce the imaging time. Once acquired, the data are dis-played in any desired plane and, by selecting a range of signal intensi-ties or by tracing specific structures with a cursor, three-dimensional surface models are created.
The utility of three-dimensional reconstruction is best appreciated with craniofacial reconstructions.11,12 Directly visualizing the three-dimensional relationships of the facial structures aids surgical planning. Instructors find three-dimensional models of the face and orbital struc-tures useful for teaching medical students, residents, and anatomy students. Virtual endoscopy is a computer-generated simulation of endoscopic perspective. The virtual endoscopic images of the trachea, larynx, pharynx, nasal cavity, and paranasal sinuses and ear have dem-onstrated clinical utility (Fig. 11-10).
At present, the spatial resolution of CT is superior to MRI in the head and neck for displaying bony relationships. However, MRI pro-vides a superior display of transcranial soft tissue structures, such as the entire visual pathway, and has better tissue contrast resolution than CT. Thus CT and MRI will likely have complementary roles in three-dimensional image display.
Applications of CT, MRI, and Ultrasound in the Head and NeckEach anatomic region requires a different imaging approach to optimize the detection and characterization of the structure or lesion of interest. The following is a description of the indications for using CT, MRI, or ultrasound in specific head and neck regions, plus a general imaging approach relevant to each anatomic region in terms of imaging planes, slice thickness, contrast agents, and pulse sequences. Whenever possi-ble, CT and MRI are performed before biopsy or resection of lesions because the resulting edema may obscure the true margins of a mass.

E
Chapter 11 n Overview of Diagnostic Imaging of the Head and Neck 139
Application of Computed Tomography in Head and Neck RegionMultichannel CT scanners revolutionized head and neck imaging. The entire neck can be scanned in less than a minute at a slice thickness of less than 1 mm. These data can then be reconstructed in any plane with a desired slice thickness. This obviated the need for site specific imaging protocols. A typical neck CT using a multidetector scanner employs 1-mm slice thickness and a pitch of approximately 1, with contiguous axial scanning performed from the sella turcica down to the thoracic inlet. Then, typically 3-mm-thick axial, sagittal, and coronal images are reconstructed for view. The use of intravenous contrast is critical for interpretation of the study. Determination of extent of disease and vascular invasion, compression, and discrimination of vessels from nodes and small muscle bundles can be extremely difficult (see Figs. 11-3 and 11-4). Evaluation of the normal mucosa-submucosa interface and mucosal tumors can not be accomplished without con-trast enhancement. Optimally, contrast should be present in both arter-ies and veins during image acquisition. Also, enough contrast should be allowed to diffuse from vessels to the tissue interstitium for tumors to enhance. This is particularly important for high-end multidetector CT scanners, which tend to finish image acquisition before optimal tumor enhancement is achieved, unless a delay between injection of contrast and scanning is employed. To maintain good opacification of vessels after this delay, a biphasic contrast injection scheme is used. The delay time and the rate at which contrast material is injected vary depending on the specifications of the scanner. Contrast is best admin-istered with a mechanical pump infusion although a drip-infusion technique may also be effective. Frequently, image reconstruction using a soft tissue algorithm suffices. If a suspicion of bone erosion or destruc-tion by tumor or inflammation exists, sections of the skull base and mandible need to be reconstructed using a bone algorithm.
Suprahyoid NeckSuprahyoid neck CT is often performed for simultaneous evaluation of the deep extent of mucosal based tumors and to evaluate associated metastatic disease to the cervical lymph node chains. Because streak artifacts from dental fillings frequently obscure the oropharynx and nasopharynx, it is usually necessary to obtain additional angled sections to assess the pharynx directly posterior to the dental work (Fig. 11-11).
Cervical LymphadenopathyLymph node CT evaluation is concomitantly performed during CT investigation of most suprahyoid and infrahyoid tumors or inflamma-tion. The quality of lymph node assessment depends very much on the success of achieving a high concentration of contrast in the arterial and venous structures of the neck. Otherwise, nodes and vessels may appear remarkably similar.
Salivary GlandsDental amalgam can cause significant streak artifacts that obscure the parotid or submandibular gland parenchyma. If the dental work is iden-tified on the lateral scout view (scanogram), dental artifacts can usually be avoided if an oblique semiaxial projection is chosen with the scanner gantry angled in a negative direction (between a coronal and an axial plane), thus avoiding the teeth. This plane has the advantage of visual-izing both parotid and submandibular glands in the same slice and is parallel to the posterior belly of the digastric muscle.13 Contrast admin-istration is required for both neoplastic and inflammatory conditions of the salivary glands. Enhancing intraglandular vessels may mimic or obscure small stones, thus a precontrast scan is also advised in cases of suspected sialolithiasis. The CT attenuation of a normal parotid gland is variable depending on the proportion of fat and glandular tissue present, which varies with age. Submandibular glands have a more predictable attenuation that is similar to that of muscle. Any difference in attenuation values of the right and the left submandibular glands should be suspicious for an obstructing lesion such as floor of the mouth cancer.
Sialography and CT-SialographyConventional sialography, although rarely needed, remains the best radiographic method for evaluating ductal anatomy in obstructive,
A
B
C
Figure 11-9. A, Technetium-99m (99mTc)-pertechnetate scintigraphy in a patient with suspected parathyroid adenoma is essentially normal. B, Corresponding T1-201 scintigraphy reveals an apparent area of increased uptake adjacent to the lower pole of the right lobe. C, Sub-traction of the 99mTc-pertechnetate study from the T1-201 study confirms the presence of a parathyroid adenoma.

E
140 Part 2 n General Otolaryngology
ing the cords (see Fig. 11-3). The vocal cords can be assessed during phonation (“eeee”), which causes the cords to adduct and move to a paramedian position (see Fig. 11-3). Breath holding will also adduct the vocal cords, close the glottis, and significantly reduce motion arti-facts. By scanning the larynx twice, once to adduct and a second time (sections limited to the glottis) to abduct the vocal cords, the radiologist can assess vocal cord motion and identify fixation. Evaluation of laryn-geal trauma may not require intravenous contrast. Bone windows are helpful for assessing cartilage fractures or tumor erosion.
Thyroid and Parathyroid GlandsThe scanning should extend to the aortic arch to cover potential sites of ectopic thyroid and parathyroid tissue. Although the normal thyroid is hyperdense because of its natural iodine content on NCCT, a CECT is preferred for this study. The normal thyroid enhances intensely on CECT, with most mass lesions of the thyroid appearing less enhanced. The parathyroids are rarely imaged primarily by CT because nuclear medicine and ultrasound techniques are more feasible for localizing parathyroid adenomas.
Paranasal SinusesParanasal sinus CT can be approached in several ways depending on the anticipated disease process. A screening axial sinus NCCT (Fig. 11-12A) is clearly superior to conventional radiographs and provides information on specific sinus involvement by inflammatory processes as well as better delineation of bony sclerosis or destruction. One method is to use 5-mm-thick sections obtained at 10-mm intervals (5-mm gap), which can cover the entire paranasal sinuses with six to eight slices. The technical parameters can be optimized to achieve a low radiation exposure that is similar to radiographs.
inflammatory, and autoimmune salivary gland diseases. Supplemental CT-sialography may be performed in evaluation of a dense gland that is suspected to harbor a mass in patients who cannot have MRI. CT-sialography may be obtained at the time of intraductal injection of fat-soluble or water-soluble contrast or after a routine sialogram (the gland may be reinjected during the CT with the catheter left in place). The plane of study is the same as that used for NCCT and should be similarly angled to avoid dental filling artifacts. The use of concentrated sialographic contrast material may cause significant streak artifacts if too much contrast collects in dilated ducts, acini, or large pools, all of which can obscure smaller masses in the gland. For optimal CTS, the injection is extended into the acinar phase to maximize parenchymal opacification and thereby silhouette mass lesions within the paren-chyma.14
Larynx and Infrahyoid NeckLaryngeal and infrahyoid neck CT is most commonly requested to evaluate squamous cell carcinoma of the larynx or hypopharynx, associ-ated cervical lymph node metastasis, trauma, and inflammation. The fine detail of the larynx and vocal cords requires thinner reconstructions than the routine 3-mm sections. Sections through the vocal cords are optimally reconstructed parallel to the plane of the true vocal cords. Because assessment of vocal cord mobility is important in staging glottic carcinoma, various provocative techniques may facilitate laryngeal imaging in those cases where the vocal cords are obscured on physical examination. Quiet breathing places the cords in a partially abducted position. By having the patient blow through a straw or do a modified Valsalva maneuver (puffing out the cheeks) the hypopharynx and su -praglottic larynx can be distended, allowing better separation of the aryepiglottic folds from the hypopharynx, while simultaneously abduct-
A B
C D
Figure 11-10. Normal virtual laryngoscopy. A real-time navigation in the larynx can be performed with ease using a workstation and special software.

E
Chapter 11 n Overview of Diagnostic Imaging of the Head and Neck 141
A B
C D
Figure 11-11. Avoiding dental artifacts on computed tomography (CT). A, Lateral scout image without angulation of the CT gantry (dashed lines represent selected axial images) in a patient with numerous metallic densities in teeth from dental work. Posterior tongue (asterisk) and soft palate lie directly posterior to metal. B, Axial contrast-enhanced computed tomography (CECT) at the level of the dental work is not interpretable because of the numerous streak artifacts caused by metallic fillings and crowns. C, Scout view depicting additional slices with the CT gantry angled to avoid dental work. D, Angled axial CECT at the same level as B shows a significant improvement in image quality of the posterior tongue and oropharynx.
A B C
Figure 11-12. Computed tomography in evaluation of sinusitis. A, Axial 5-mm sinus screening noncontrast computed tomography (NCCT) using bone algorithm and bone windows in a patient with chronic right maxillary sinusitis. Excellent bony detail is obtained of both maxillary sinuses (posterior wall thickening and sclerosis are present on right) and mastoids. Clear discrimination of soft tissue opacification of the right maxillary sinus (asterisk) is achieved compared with the normal air-filled left maxillary sinus. Pneumatized pterygoid process (arrow) is an extension of sphenoid sinus pneumatization. B, Coronal 3-mm NCCT with bone algorithm and bone windows in the same patient clearly demonstrates mucosal thickening and opacification of the right maxillary and ethmoid sinuses, and left maxillary infundibulum (arrow). Sharp anatomic detail of the bony architecture and the use of coronal plane are essential for preoperative planning before endoscopic sinus surgery. C, Axial 3-mm contrast-enhanced computed tomography with soft tissue algorithm and soft tissue windows exaggerates the right maxillary sinus posterior wall thickness (arrows). Thickened mucosa has a thin rim of enhancement along its luminal margin (arrowhead). Combination of bony sclerosis and mucosal thickening is often seen in chronic sinusitis.

E
142 Part 2 n General Otolaryngology
often a coronal T1WI, are required to optimally assess fat planes in the neck. Fat provides an excellent white background from which muscle and fascial planes, bone, sinus, and vascular structures can easily be discriminated. The coronal plane is particularly useful for visualizing the relationships of the suprahyoid neck structures to the skull base and also for delineating the anatomy of the tongue and floor of mouth. A T2WI or STIR, usually obtained in the axial plane, is required to detect structures with a long T2 (e.g., tumors, cysts, lym-phadenopathy, edema) that appear brighter than the background muscle and fat. Postgadolinium T1WIs with fat suppression in the axial and coronal plane are frequently helpful to discriminate the enhancing margins of a lesion or to detect perineural spread of tumor. The T2WI may also be combined with fat suppression to optimize the information obtained.
LymphadenopathyBefore the widespread use of gadolinium and fat suppression tech-niques, MRI was often less specific than CT in characterizing cervical lymph node metastases because of the lower ability to show heterogene-ously enhancing nodes which is a highly accurate sign of nodal metas-tasis in the setting of squamous cell cancer of the neck. However, improved MRI scanner technology, gadolinium enhancement, and fat suppression sequences have allowed a comparable accuracy. Also, the MRI detection of carotid artery invasion by extracapsular spread of tumor from nodes is often superior to CECT.
An anterior or volume neck coil using 5-mm thick sections with a small 1- to 2-mm interslice gap is necessary to encompass the entire lymph node chain throughout the neck from the skull base to the clavicles within the imaging field of view. The detection of cervical lymphadenopathy with MRI may be accomplished with (in decreasing order of sensitivity) a STIR sequence, a fat suppressed T2WI, a fat-suppressed post gadolinium T1WI, a conventional T2WI, or a precon-trast T1WI. Although STIR is the most sensitive sequence, it may be limited by prominent pulsation artifacts from vessels. The significance of a heterogeneously enhancing node on MRI should be analogous to the same finding on CECT and is best demonstrated on post-contrast, fat-suppressed T1WIs.
Salivary GlandsMRI of the parotid gland can be accomplished with a standard head coil using 3- to 5-mm slices, but at the risk of excluding a portion of the submandibular gland that lies at the edge of the usable field of view. A volume neck coil is the better coil for imaging both parotid and submandibular glands within the same field of view, especially if a malignancy is suspected and cervical lymph node metastases are sought lower in the neck. A smaller surface coil may be necessary for evaluation of perineural tumor spread along with facial nerve into the mastoid segment of the facial nerve canal. Depending on the fat content of the parotid gland, a tumor may be better defined on T1W or T2WIs. Fat suppression on postcontrast T1WI allows better depiction of the margins of the tumor which is a critical imaging finding in differentiat-ing malignant from benign masses. More recently, magnets with supe-rior gradient performance allowed MR sialography images. Despite its limitation in spatial resolution compared with conventional sialogra-phy, MR sialography eliminated the need for conventional sialography in many clinical scenarios.
Larynx and Infrahyoid NeckThe larynx and infrahyoid neck require either an anterior or a volume neck coil, preferably using no thicker than 3-mm sections for the larynx. The field of view should include the area from the inferior margin of the mandible to the clavicles. Although the larynx can be examined well by both axial CECT and MRI, laryngeal MRI has a higher proportion of suboptimal studies. Laryngeal MRI is more sus-ceptible to motion artifacts than MRI of other regions of the neck because of a combination of swallowing, breathing, and vascular pulsa-tion from the adjacent common carotid arteries. Precontrast axial and coronal T1WIs are essential to assess the paraglottic fat planes. The coronal plane, angled parallel to the airway, is especially useful for determining transglottic tumor spread. Fat saturation postgadolinium
When endoscopic sinus surgery is anticipated, NCCT imaging of the sinuses is mandatory for preoperative evaluation of the extent of sinus disease, to detect anatomic variants, and for planning the surgical approach (see Fig. 11-12B). This study is done in the axial plane while the patient is supine with thin sections reconstructed in sagittal and coronal planes. Frequently, only the bone algorithm with its edge enhancement properties is needed for evaluating the detailed anatomy of the ostiomeatal complex. Contrast administra-tion is usually not necessary for routine sinusitis, although when severe nasal polyposis is suspected, contrast may be useful to demon-strate the characteristic “cascading” appearance of the enhancing polyps or to characterize an associated mucocele. A soft tissue algorithm with soft tissue windows may be useful when using CECT for intra-cranial complications from sinus inflammatory processes. A nasal decongestant may be used to help decrease normal but asymmetrical nasal mucosa congestion (normal nasal mucosal cycle) from a mucosal based mass.
The assessment of sinus tumors requires the most detailed imaging. The intracranial compartment, parapharyngeal, masticator, and buccal spaces should sufficiently be included in the field-of-view as to allow for assessment of tumor extension. At least the lymph node levels I and II should be visualized. For an optimal study, both soft tissue and bone algorithms are used. This differentiates the soft tissue component, as well as evaluating subtle bony destruction (see Figs. 11-12A and C). The coronal plane is best for evaluating the cribriform plate. CECT is used to maximize the enhancement characteristics of the tumor and differentiate it from adjacent soft tissue structures.
Facial TraumaFacial trauma CT characterizes fractures and facial soft tissue injury very well. Contrast material is not needed. Bone algorithm is manda-tory for demonstration of fine bone detail but soft tissue algorithm for assessing orbital and facial soft tissue injury is often very helpful. Three-dimensional surface reconstructions or volume-rendered images are helpful when planning facial restoration and assessing surgical results.
Temporal Bone and Skull BaseHigh-resolution CT images obtained with a multichannel scanner are now the standard of imaging for the temporal bone. The acquired data set is reconstructed at 0.5-mm slice thickness at any plane desired. Rotationally reformatted images are most helpful in displaying an entire semicircular canal in a single plane to aid in the diagnosis of dehiscent superior semicircular canal. In general, intravenous contrast is not necessary for temporal bone imaging, although vascular tumors or squamous cell carcinoma invading the temporal bone may require the use of intravenous contrast plus supplemental soft tissue algorithms to best image the extracranial and intracranial soft tissue component of the lesion. However, bone algorithm with bone windows is used in all temporal bone imaging.
Application of Magnetic Resonance Imaging in Head and Neck Region
Suprahyoid NeckMRI is ideally suited for imaging the suprahyoid neck (including nasopharynx, oropharynx, oral cavity, and tongue). The standard head coil which has a high signal efficiency will permit visualization of the suprahyoid neck structures caudally down to approximately the level of the inferior margin of the mandible and floor of mouth. For imaging the oral cavity, floor of mouth, submandibular space, and cervical lymph node chains, a head coil will not suffice. Either an anterior or volume neck coil is needed to visualize the entire neck from the skull base to the thoracic inlet (from dura to pleura). Several pulse sequences and imaging planes using 5-mm thick sections are required to adequately assess the deep and superficial structures of the neck. (Implicit in this discussion of MRI technique for all areas of the head and neck is the fact that a sagittal T1WI is obtained as the initial sequence in all of the authors’ studies and is used primarily as a scout view for the proper positioning in other imaging planes, as well as for anatomic information.) A precontrast axial T1WI, and

E
Chapter 11 n Overview of Diagnostic Imaging of the Head and Neck 143
products, proteinaceous secretions, or a large destructive tumor is sus-pected or is being further evaluated after a preliminary temporal bone CT. A facial nerve lesion in the mastoid segment of the facial nerve canal is best evaluated for proximal and distal extension using a surface coil with sagittal and coronal pregadolinium and postgadolinium T1WIs.
Skull BaseMRI may be indicated for primary lesions of the skull base or for intracranial and extracranial lesions that secondarily involve the skull base. A standard head coil using 3- to 5-mm slices images this region well. Pregadolinium sagittal, axial, or coronal T1WI allows for assess-ment of the fat planes of the suprahyoid neck and detection of high signal intensity blood breakdown products, proteinaceous fluids, or fat within the lesion. Postgadolinium axial and coronal (occasionally sagit-tal) fat saturation T1WIs are excellent for determining the extent of an enhancing lesion above, below, and within the skull base. T2WI in the axial or coronal plane may be helpful for detecting a high signal lesion. STIR images usually give similar information to T2WIs in the skull base and may not be necessary.
Ultrasound Applications in the Head and NeckHigh-resolution ultrasound evaluation of the suprahyoid neck, salivary glands, and infrahyoid neck is limited to the more superficial neck structures because of the impediment to sound transmission caused by the highly reflective facial bones, mandible, mastoid tip, and air within the oral cavity and pharynx. The ultrasound technique, using a high-frequency (e.g., 10 MHz) transducer and multiple imaging planes, is similar for all these regions. A small superficial lesion is best seen with a high-frequency transducer, which has a higher spatial resolution, whereas a deeper lesion requires a lower frequency transducer. Color flow Doppler technique may help differentiate vascular structures from a cystic or solid lesion. Head and neck ultrasound is performed less frequently in North America than in Europe, perhaps because of the common availability of CT in North America and the perception of the greater accuracy of CT.
Metastatic LymphadenopathyUltrasound, combined with fine needle aspiration, may be a very effec-tive tool in evaluating metastatic lymph nodes in head and neck cancer. The upper one third of the internal jugular, retropharyngeal, and tra-cheoesophageal groove nodes are poorly evaluated, however, because of obscuration by bone or airway structures. Ultrasound may be the best method (possibly better than MRI or CT) for determining the presence of tumor invasion of the carotid by the extracapsular spread from metastatic nodes, but evaluation may not be reliable as the tumor approaches the skull base. Invasion of the carotid artery is characterized by loss of the echogenic fascial plane between the vessel wall and the tumor.
Salivary GlandsUltrasound has indications for both inflammatory and neoplastic disease. It may detect salivary duct stones as small as 2 mm. An obstructed dilated duct may appear as a tubular cystic structure. An abscess may be detected and drained under ultrasound guidance during the acute stage of sialadenitis. A mass in the superficial parotid gland is easily assessed by ultrasound, but the deep lobe of the parotid gland is obscured by the mandible, styloid process, and mastoid tip. Ultra-sound is also very sensitive for a mass in the submandibular gland. Although ultrasound can determine the sharpness of margins of the lesion, an aggressive neoplasm or inflammatory process extending beyond the margins of the gland is better evaluated by MRI or CECT because the deep landmarks are more easily demonstrated with these methods. Well-defined margins usually indicate a benign mass, and infiltrative margins suggest malignancy.
Infrahyoid NeckUltrasound using a high-frequency transducer is usually the first imaging modality for evaluating thyroid gland and parathyroid gland masses because it is relatively inexpensive, has no side affects, and is
T1WIs in the axial and coronal planes are best for detecting lesion margins, invasion of adjacent cartilage, and associated malignant nodes. T2WI in the axial plane may help detect moderately increased tumor signal and improve detection of high signal cystic or necrotic neck lesions.
Thyroid and Parathyroid GlandsThe same techniques and slice thickness as those of the larynx are used for the thyroid and parathyroid glands. The field of view may need lower centering to include the upper mediastinum and ensure complete evaluation of the inferior extent of a thyroid tumor or an ectopic para-thyroid gland. Coronal and sagittal views aid understanding of the craniocaudal extent of the lesion relative to the aortic arch, great vessels, and mediastinum. This information is especially useful to the surgeon. Although MRI may detect an unsuspected thyroid or parathyroid lesion during routine neck or cervical spine imaging, MRI is less frequently used for primary evaluation of these lesions because of the cost of the study and susceptibility to motion artifacts. The normal thyroid gland will enhance mildly on both gadolinium-enhanced MRI and CECT. A solid mass in the thyroid or parathyroid is usually low intensity on T1WI and high signal on T2WI, and it may enhance with gadolinium. Cystic lesions are bright on T2WI.
Paranasal SinusesSinus MRI is primarily indicated for evaluating sinus tumors (and occasionally inflammatory disease such as a mucocele) and may be accomplished with a standard head coil, using 3- to 5-mm slices. The principal value of MRI over CT for sinus tumors is the ability of MRI to distinguish between tumor and obstructed sinus secretions and to predict the true extent of the tumor. A precontrast sagittal, axial, or coronal T1WI will provide a good demonstration of the sinuses, nasal cavity, cribriform plate, masticator and parapharyngeal spaces, and orbits. Sinus secretions with low protein content show low T1 and high T2 signal. With increasing protein content the T1 signal increases and T2 signal decreases. Very high concentrations of protein result in low signal on both pulse sequences and may occasionally mimic normally pneumatized sinus. No enhancement of the sinus secretion is seen on postcontrast images except for the mucosa of the sinus whereas tumors often enhance and show intermediate T2 signal allowing differentiation of postobstructive secretions from tumor. Fat saturation T1WI is rec-ommended to better define the sinus tumor margins when the tumor extends directly or by perineural spread beyond the sinus into the anterior cranial fossa, orbit, parapharyngeal space, or pterygopalatine fossa. The sagittal and coronal planes are very helpful for evaluating cribriform plate extension. The coronal and axial planes are best for orbital, cavernous sinus, pterygopalatine fossa, and parapharyngeal space spread.
Temporal BoneMRI is the imaging standard for the detection of internal auditory canal (IAC), facial nerve canal, and jugular foramen lesions. MRI is useful, in combination with CT, for assessing expansile or destructive lesions of the temporal bone and external auditory canal. A standard head coil is adequate for most temporal bone lesions, but a smaller 5- to 10-cm surface coil may provide improved resolution for certain regions in the expense of coverage. The small size of the temporal bone structures and their respective lesions requires high spatial resolu-tion images, which may be accomplished by using thinner slices of 0.5 to 3.0 mm (preferably without an interslice gap), smaller surface coils (higher signal-to-noise ratio), volume acquisition, or T1WI (higher signal-to-noise ratio). Precontrast T1WI in the sagittal and axial planes is useful for defining anatomy and for detection of high-signal lesions such as fat, methemoglobin, and viscous or pro-teinaceous cysts. Postgadolinium T1WIs (without or with fat satura-tion) in the axial and coronal planes are essential for detecting small enhancing lesions and determining the extent of larger lesions. In fact, for routine evaluation of a suspected acoustic schwannoma, only a postgadolinium axial and coronal T1WI study may be required. T2WIs are frequently unnecessary for IAC tumors but may be helpful when brainstem ischemic or demyelinating disease, meningioma, blood

E
144 Part 2 n General Otolaryngology
the use of this modality in the evaluation of planned neck dissection cases.
Principles of Image Interpretation
Strategy for Image Interpretation and Differential DiagnosisThis section is included to aid the beginning surgeon or oncologist in developing a basic strategy for image interpretation. Normally, the radiologist chooses and supervises the appropriate imaging study, eval-uates and interprets the images, and communicates its significance to the referring physician. However, frequent dialogue between the refer-ring physician and the radiologist will significantly improve interpreta-tion of the imaging study. Accurately interpreting an imaging study of the head and neck requires a systematic method of observation, knowl-edge of the complex anatomy and pathophysiology, and an understand-ing of imaging principles. The differential diagnosis of lesions of the head and neck requires a systematic approach as well. One such diag-nostic imaging process is summarized here:
1. Obtain clinical data: age, sex, history, physical findings.
2. Survey the films for all abnormalities and summarize these findings.
3. Compartmentalize the lesion.
4. Interpret the chronicity and aggressiveness of the observations: acute or chronic, nonaggressive or aggressive, benign or malignant.
5. Develop a differential diagnosis. Use pathologic categories: con-genital, inflammatory, tumor, trauma, vascular. Use clinical and radiographic information to narrow the choices and arrive at the most appropriate diagnosis.
By using such a strategy, it is unlikely that important findings will be missed because all the images have been evaluated. This may be done by looking at all the anatomic spaces on each slice and proceeding sequentially through all the slices. Alternatively, each anatomic space can be evaluated on serial slices, followed by the next anatomic space, and so on. Characterizing a lesion requires specific observations: loca-tion, anatomic space of the epicenter, size, definition of margins, extent of spread in each direction, invasion of adjacent compartments, involve-ment of neurovascular structures, enhancement pattern, cysts, calcifica-tion, density, signal intensity, echogenicity, hemorrhage, and lymphadenopathy. Next, summarizing the findings helps to tie them together into a logical pattern. Compartmentalizing a lesion is the last step in the observational process and requires placing the epicenter or site of origin of the lesion in a specific anatomic space, although some lesions may be multicompartmental. The origin of a lesion is limited by the types of tissue that reside in each specific space. An example of such a summary would be, “A 35-year-old male has a cystic, nonen-hancing mass in the sublingual space.” A frequent cause of misdiagno-sis is the failure to make all the observations first. Interpretation and differential diagnosis of the lesion are the final steps.
The interpretation of the significance of a lesion uses both its radiologic and clinical features. For example, the interpretation might use the following descriptions: inflammatory (edema, abscess cavity, fever), nonaggressive (remodeling of bone, slow progression of symp-toms), aggressive (destruction of bone, rapid progression), benign neo-plastic (well-defined margins, displacement of adjacent structures, nonpainful), malignant (poorly defined margins, invasion and destruc-tion of adjacent structures, pain and neuropathies), or cystic (low-density center with a thin rim of enhancement, fluctuant). The differential diagnosis is narrowed by further refining the interpretation, “A 35-year-old male has an asymptomatic cystic, nonenhancing mass in the sublingual space that appears chronic and nonaggressive.” With knowledge of the relevant clinical findings, the proper differential diag-nosis, which is specific for each anatomic space, can then be constructed and limited to one (or at least a few) possible pathologic causes. In this example, a ranula would be the most likely consideration.
easily performed. Solid and cystic masses and calcification are easily identified but, like with other imaging modalities, a reliable differen-tiation of malignant thyroid nodules from benign ones is not possible. Ultrasound is the imaging modality of choice for image-guided biop-sies. A parathyroid adenoma is readily evaluated if its location is cranial to the sternum.
FDG-PET Applications in Head And Neck CancerPET technology is still evolving as is its exact role in imaging head and neck malignancies. PET-CT is becoming more widely available as the preferred method.
Staging
T-StagingThe detection rate of a primary tumor in the setting of squamous cell carcinoma of the head and neck (SCCHN) with FDG-PET is slightly superior to that with MRI and CT and comparable to that of panen-doscopy. For the superficial mucosal lesions, however, the limitations of all imaging modalities including PET are well recognized and pan-endoscopy remains the best way to evaluate such lesions. PET, because of limited spatial resolution and lack of anatomic detail, is often insuf-ficient for the assessment of submucosal extent of disease and involve-ment of adjacent structures. MRI and CT remain the modality of choice for this purpose. FDG-PET may identify a primary tumor that is not detected by other diagnostic modalities in the setting of cervical nodal metastasis with unknown primary, although false-positive results are also frequent in this setting.
N-StagingThe sensitivity of FDG-PET in detection of metastatic lymph nodes in the neck is higher than that of CT and MRI. The impact of this increased sensitivity on patient management remains to be seen. A modality that would reliably differentiate N0 from N1 necks is very much needed, but it is unrealistic to expect PET to diagnose micro-scopic metastasis—even in the future—because of inherent technical limitations of spatial resolution. Currently available data do not justify the routine use of FDG-PET for nodal staging despite its proven superiority.
M-StagingFDG-PET imaging is suitable for detection of distant disease because of its great sensitivity and ability to examine virtually the entire body in a single study. Synchronous lesions in the upper aero-digestive tract and lungs are also detected with FDG-PET more accu-rately than other modalities, although false-positive results remain problematic.
Therapy Planning and MonitoringRadiotherapy fields can be determined on the basis of PET-CT data. Tracer uptake can be quantified and changes in tumor metabolism can be monitored by PET imaging during treatment. Whether these changes can predict response to treatment is an active area of research. Early data suggest that very early FDG-PET study performed days after initiation of treatment may separate responders from nonresponders even before any structural changes have occurred. If this is proved to be true, it may permit modification of treatment very early in the process.
Detection of Residual and Recurrent DiseaseEvaluation of the neck after surgery and radiotherapy is limited both clinically and radiologically. PET is definitely superior to anatomic imaging modalities and clinical examination in distinguish-ing recurrent disease from fibrosis or scar tissue (Fig. 11-13). It is, however, well recognized that false-positive results, because of surgery and radiotherapy-induced inflammation, are common in the first months after therapy. It is generally recommended to defer FDG-PET studies at least 2 months after treatment, which limits

E
Chapter 11 n Overview of Diagnostic Imaging of the Head and Neck 145
A
B C
Figure 11-13. Recurrent glottic squamous-cell cancer previously treated with radiotherapy. A, T1-weighted, T2-weighted (STIR) and contrast enhanced, fat-saturated T1-weighted MRIs show mild fullness in the left true vocal cord without a discrete mass. It is impossible to differentiate post-therapy changes from the recurrent tumor. B, Coronal PET (left) and PET-CT (right) demonstrate increased metabolic activity in the left glottic and subglottic region. C, Axial PET (above) and PET-CT (below) show uptake anterior to the cricoid, compatible with extra-laryngeal involvement not visualized on the MRI (surgery-pathology proven).

E
146 Part 2 n General Otolaryngology
The head and neck region, the anatomic territory that extends from the skull base to the thoracic inlet, is best and most conveniently divided into the suprahyoid and infrahyoid neck with the hyoid bone serving as the divisional point.15 Figures 11-14 through 11-16 demon-strate normal cross-sectional CT and MRI anatomy of the suprahyoid neck. The suprahyoid neck may be divided into a series of fascial spaces based on the division and layers of the superficial and deep cervical fascia. The superficial cervical fascia surrounds the face and neck, pro-viding a fatty layer on which the skin is able to slide. The underlying deep cervical fascia is separated into three distinct layers: superficial (investing) layer, middle (visceral) layer, and deep (prevertebral) layer.
Imaging Anatomy, Site-Specific Lesions, and Pseudotumors of Head and Neck
Spaces of Suprahyoid NeckWith the advent of cross-sectional imaging in radiology, first with CT and later with MRI, the radiologic interpretive approach changed from a pattern based on surgical compartmental anatomy to one dependent on fascial spaces. However, a combination of the two interpretive approaches, for example, parapharyngeal space at the nasopharyngeal level (with the compartmental designation serving as a modifier) may be more helpful in precisely defining a lesion location.
A B
PMS
SM
dgh
g*
T
sp
sp
mp
mp
m
m
r
lp
MS MSMS
PS
MS
r
r r
SL
Figure 11-14. The normal computed tomography anatomy of suprahyoid neck. A, Coronal contrast-enhanced computed tomography (CECT) and, B, axial CECT demonstrate low-fat density of the parapharyngeal space (arrow). Note its central position as a marker space. The following struc-tures can be identified: anterior belly of digastric muscle (d), genioglossus muscle (g), geniohyoid muscle (gh), lateral pterygoid muscle (lp), masseter muscle (m), medial pterygoid muscle (mp), masticator space (MS), mylohyoid muscle (asterisk), nasopharyngeal mucosal space (PMS, small arrows), parotid space (PS), ramus of mandible (r), sublingual space (SL), submandibular space (SM), soft palate (sp), and intrinsic tongue musculature (T).
A B
PVS
PVS
SL
Tl
e smg
sgg
PVS
PVS
MS
PPS
SM
c c c c
u
J J
mpm
T
Figure 11-15. The normal computed tomography anatomy of sublingual space, submandibular space, and oral cavity. A, Axial contrast-enhanced computed tomography at superior and, B, inferior tongue levels, respectively. Note the following structures: internal carotid (c), epiglottis (e), genioglossus muscle (g), jugular vein (J), lingual tonsil (l), masseter muscle (m), medial pterygoid muscle (mp), masticator space (MS), mylohyoid muscle (asterisk), pharyngeal mucosal space of oropharynx (small arrows), prevertebral space (PVS), retropharyngeal space (arrowheads), sublin-gual space (SL), submandibular space (SM), submandibular gland (smg), intrinsic musculature of tongue (T), and uvula of soft palate (u).

E
Chapter 11 n Overview of Diagnostic Imaging of the Head and Neck 147
9. Sublingual space (SLS)
10. Submandibular space (SMS)
Inflammatory and neoplastic disease, the major pathophysiologic processes of the head and neck territory, tend to grow and spread in the boundaries and confines of these fascial spaces.16 Nevertheless, this approach based on the use of fascial anatomy allows delineation of specific anatomic spaces, with identification of disease-specific lesions for each of these spaces. As a consequence, a more accurate differential diagnosis and resulting final diagnosis are attained.
Parapharyngeal SpaceThe crucial anatomic center point to understanding suprahyoid anatomy is the parapharyngeal space (PPS). This fibrofatty fascial space extends from the skull base to the level of the hyoid bone and serves as a marker space around which the remaining fascial spaces are arranged. It contains fat, portions of the third division of cranial nerve V, the internal maxillary artery, the ascending pharyngeal artery, and the venous plexus. In the axial plane, this space has a triangular configura-tion and demonstrates bilateral symmetry. In the coronal plane, the
(Space limitations and the complexity of the fascial spaces do not allow for a detailed description or explanation of the deep cervical fascia.) Although not usually visualized on CT or MRI, these fascial layers divide the suprahyoid neck into distinct anatomic and surgically defined spaces:
1. Parapharyngeal space (PPS)
2. Pharyngeal mucosal space (PMS)
3. Parotid space (PS)
4. Carotid space (CS)
5. Masticator space (MS)
6. Retropharyngeal space (RPS)
7. Prevertebral space (PVS)
8. Oral cavity (OC)
CC D
AA B
J
MS
lp
m
it
PS
MSMS
PPS
spmp
pg
m
T
vvJ
T
sp
cl
p
md
cbMS
PPS
cl
md
lp
tp m
cb
hp
it
it
s
J
Figure 11-16. The normal magnetic resonance imaging anatomy of suprahyoid neck. A, Sagittal midline noncontrast T1-weighted image (T1WI). B, Axial noncontrast T1WI at the level of jugular foramen. C, Axial postgadolinium T1WI at the same level of B demonstrates enhancement of the nasopharyngeal mucosa and jugular veins. D, Axial noncontrast T1WI at the level of C2 vertebral body and mid tongue demonstrates high signal intensity of parapharyngeal space fat. The following structures are labeled: cerebellum (cb), clivus (cl), hard palate (hp), internal carotid artery (arrow), inferior turbinates (it), jugular vein (J), lateral pterygoid muscle (lp), masseter muscle (m), medulla (md), masticator space (MS), nasopharyngeal mucosal space (small arrows), pons (p), parotid gland (pg), parapharyngeal space (PPS), parotid space (PS), retropharyngeal space (arrowheads), sphenoid sinus (s), soft palate (sp), intrinsic musculature of tongue (T), temporalis muscle (tp), and retromandibular vein (v).

E
148 Part 2 n General Otolaryngology
A Thornwaldt cyst is a common congenital lesion of the midline posterior nasopharyngeal mucosa and only rarely becomes secondarily infected. It is very bright on long TR sequences on MRI.
Squamous cell carcinoma (SCC), the most common tumor of the upper aerodigestive tract, originates from the PMS. The majority of lesions arise from squamous epithelium in the region of the lateral pharyngeal recess (Figs. 11-18 and 11-19). Small submucosal lesions may be missed on the clinical examination but may be detected with cross-sectional imaging. Involvement of the adjacent musculofas-cial spaces confirms the presence of a mucosal lesion. It may become large and lead to extensive invasion and destruction of the neighboring fascial spaces or extend medially to involve the PPS. With CT, SCC demonstrates inhomogeneous lesion enhancement, commonly with extension into adjacent spaces. With MRI, it is of intermediate intensity on T1WI and high intensity on T2WI and enhances after gadolinium infusion.19 It may cause serous otitis media and mastoid cell opacification because of dysfunction of the eustachian tube from invasion or mass effect. Extension superior to the skull base is common. The foramen lacerum, foramen ovale, carotid canal, jugular foramen, and clivus may be affected. Perineural tumor spread along cranial motor nerve V is common and its presence should be diligently sought, especially if there is unilateral atrophy of the muscles of mastication innervated by the mandibular division of the fifth cranial nerve. Inferiorly, nasopharyngeal SCC may extend to involve the soft palate, tonsillar pillars, and nasal cavity. Asymptomatic cervical ade-nopathy with involvement of the superior internal jugular and spinal accessory lymph node chains is the presenting mode in more than 50% of patients. Lymph nodes are usually considered positive when larger than 1.5 cm in diameter. An enhancing lymph node rim with necrotic low-density center on CECT indicates neoplastic involvement. On MRI, lymph nodes have bright signal intensity on T2WI. On T1WI, after gadolinium administration, lymph node enhancement may be seen.
The extensive lymphoid tissue in this space is a source for develop-ment of non-Hodgkin’s lymphoma (Fig. 11-20). Both SCC and lym-phoma may have extensive lymph node involvement. The nodes associated with SCC commonly have necrotic centers, whereas those of lymphoma are usually noncavitary and homogeneous. Malignant
PPS has an hourglass shape, thicker at the skull base and hyoid level and thinner in the mid suprahyoid neck.
The PPS is clearly defined and located on both the axial and coronal planes with both CT and MRI.17 With the former technique, the predominant fat content serves as a low-density marker between the medial muscles of deglutition found in the pharyngeal mucosal space and the muscles of mastication, located more laterally. With MRI, the PPS has bright signal intensity on T1WI (the scanning sequence that best highlights fat and muscle tissue differences). With longer TR times and more T2 weighting, this fatty space becomes less intense in signal.
Because this space is the epicenter around which the other fascial spaces are arranged, it serves as a potential marker or pivotal space. By noting the position and direction of displacement of the PPS, one can determine the epicenter and fascial space origin of a suprahyoid lesion. Because the PPS contains few structures from which lesions arise, most lesions found in this space have spread here secondarily from an adja-cent fascial space.18
The fascial spaces that are centered about the parapharyngeal space include the pharyngeal mucosal space (PMS), the carotid space (CS), the parotid space (PS), the masticator space (MS), the retropharyngeal space (RPS), and the prevertebral space (PVS). Each space has well-defined anatomic boundaries, contains major structures of importance, and gives rise to pathologic processes that are site selective for that space. For consideration of pathologic processes in each fascial space, it is convenient to use the following outline: congenital, inflammatory, neoplastic (benign and malignant), pseudolesions, and miscellaneous. This approach, using these few disease categories, elicits most of the major lesions to be found in the head and neck and is used in the fol-lowing discussion of suprahyoid and infrahyoid lesions.
Pharyngeal Mucosal SpaceThe PMS lies medial to the PPS and anterior to the PVS. It encom-passes the mucosal surfaces of the inner boundaries of the nasopharynx and oropharynx and includes lymphoid (adenoidal) tissue, minor sali-vary glands, portions of the constrictor muscles, and muscles of deglu-tition. The medial portion of the eustachian tube passes through it. These structures lie medial to or on the airway side of the buccophar-yngeal fascia. This fascial structure may be seen on MRI as a band of low signal intensity. On CECT or gadolinium-enhanced MRI studies, the overlying pharyngeal mucosa enhances.
The PMS extends from the skull base to the lower margin of the cricoid cartilage, extending into the upper portion of the infrahyoid neck. It encompasses the nasopharynx, oropharynx, and portions of the hypopharynx. Lesions in this space displace the PPS laterally.
In general, caution is used when interpreting the mucosal surfaces of the pharynx, oral cavity, and larynx. The normal mucosa is high signal on T2WI and STIR and enhances on postgadolinium T1WI (and with CECT). It may be confused with a superficial mucosal based malignancy. Likewise, a small superficial mucosal based tumor may be indistinguishable from the adjacent normal mucosa. The direct clinical examination of the mucosal surfaces is still superior to cross-sectional CT or MR imaging in detecting superficial tumor; however, both CT and MRI excel in detecting submucosal tumor and deep invasion. Mucosal irregularity and slight asymmetry are common, especially near the fossa of Rosenmüller (the lateral pharyngeal recesses of the nasophar-ynx), and care is taken in ascribing abnormality. Repeat studies with a modified Valsalva maneuver to distend the airway may be helpful. Involvement of the submucosal muscles and adjacent deep structures, such as the PPS, will confirm the presence of a suspected neoplastic mucosal lesion. Lymphoid (adenoidal) tissue is often hypertrophic and prominent, especially in children and young adolescents, and may encroach on the airway. On CT, lymphoid tissue is isodense to muscle. With MRI, it has a similar intensity to muscle on T1WI but has a bright signal on T2WI. It lies superficial to the buccopharyngeal fascia and is relatively homogeneous.
Inflammatory lesions of the PMS include pharyngitis, abscess (especially tonsillar abscess), and postinflammatory retention cysts (Fig. 11-17). Benign mixed salivary tumor is the most common benign neoplasm.
Figure 11-17. Tonsillar abscess. Axial contrast-enhanced computed tomography demonstrates a low-density left tonsillar lesion (arrow-heads) with thin peripheral rim enhancement. The left tonsil is increased in size. Partially effaced left parapharyngeal space (arrow) is lateral in position.

E
Chapter 11 n Overview of Diagnostic Imaging of the Head and Neck 149
Because of its high fat content, especially in the adult, the parotid gland parenchyma is frequently low density on CT but may vary and approach muscle density. It is high intensity on T1WI (slightly less than subcutaneous fat) and has decreased intensity on T2WI but often retains its bright T2 signal intensity relative to muscle. The retroman-dibular vein lies just posterior to the lateral margin of the mandibular ramus. The diagonal course of the facial nerve, paralleling a line drawn from the stylomastoid foramen to a point just lateral to the retroman-dibular vein, divides the parotid gland into superficial and deep por-tions. Although this is not a true anatomic division, it is useful for surgical planning. The facial nerve may be seen on some MRI studies. Its course must be considered and determined when removal of deep parotid lobe lesions is planned.
Lesions in the parotid space are usually surrounded by parotid gland tissue and are better defined with MRI than CT.20 With NCCT, lesions are usually isodense to the normal gland or of increased density. With MRI, lesions are of muscle intensity on T1WI and usually hyper-intense to normal parotid gland on T2WI.17 When small, parotid
minor salivary gland tumors also occur in this space. These three malig-nant lesions are difficult to separate radiologically.
Parotid SpaceThe PS, the home of the parotid gland and the extracranial portion of the facial nerve, lies lateral to both the PPS and the CS and posterior to the masticator space. It extends superiorly from the level of the mid squamous temporal bone to the angle of the mandible inferiorly. It contains the parotid gland, multiple lymph nodes (within and outside the parotid gland parenchyma), the facial nerve, the retromandibular vein, and branches of the external carotid artery. The parotid gland overlies the posterior portion of the masseter muscle. Its deep retro-mandibular portion lies posterior to the mandible and lateral to the PPS and the CS. The posterior belly of the digastric muscle separates the PS from the CS.
A B
Figure 11-18. Nasopharyngeal carcinoma. A, Axial contrast-enhanced computed tomography (CECT) demonstrates enhancing lesion (asterisk) involving the pharyngeal mucosa space, retropharyngeal spaces, and prevertebral space. A tumor abuts the skull base. B, Axial CECT image with bone settings at the level of the skull base demonstrates a lytic destructive lesion involving the anteromedial left petrous bone (asterisk), medial portion of greater sphenoid wing (arrowhead), and adjacent clivus (arrow).
Figure 11-19. Squamous cell carcinoma of oropharynx. Axial contrast-enhanced computed tomography demonstrates a mixed-density enhancing lesion (asterisk) in the right oropharynx. The tumor has extended posterolaterally to surround the carotid vessels (arrow). Enhancing lymph node (arrowhead) with low-density necrotic center is noted posterior to the carotid space, lying just beneath the sternoclei-domastoid muscle. Enhancement of the adjacent sternocleidomastoid muscle indicates muscle invasion.
Figure 11-20. Nasopharyngeal lymphoma. Axial non-contrast com-puted tomography demonstrates a large homogeneous pharyngeal mucosal space with a nasopharyngeal mass lesion, displacing prever-tebral and retropharyngeal spaces posteriorly. The lesion bulges into parapharyngeal space bilaterally (arrows).

E
150 Part 2 n General Otolaryngology
a dumbbell configuration of the mass and associated widening of the stylomandibular notch.
Malignant lesions include mucoepidermoid carcinoma, adenoid cystic carcinoma, acinic cell carcinoma, and malignant mixed tumor (Fig. 11-22). High-grade malignant lesions have infiltrative borders. MRI is superior to CT for showing lesion margins and extent. Because of the abundant lymph node tissue within the parotid gland, lymph node involvement may be seen with non-Hodgkin’s lymphoma, and metastatic involvement may be seen with SCC and malignant melanoma. Basal cell carcinoma of the adjacent ear and cheek may metastasize to the parotid lymph nodes.
Carotid SpaceThe CS—the space of vessels, nerves, and lymph nodes—lies posterior to the PPS, lateral to the retropharyngeal space, anterolateral to the prevertebral spaces, and medial to the PS and styloid process. The posterior belly of the digastric muscle separates the CS from the parotid space. The CS is formed from portions of all three layers of the deep cervical fascia. The CS extends from the temporal bone and base of the skull superiorly to the mediastinum inferiorly.23 It contains the common carotid artery, its major divisions, the internal and external carotid artery, the jugular vein, cranial nerves IX to XII, sympathetic plexus, and lymph nodes. The jugular vein lies lateral and posterior to the carotid artery. The vagus nerve lies in the posterior groove between the two vessels. Cranial nerves IX, XI, and XII migrate to the anteromedial portion of the CS lower in the neck. Lesions of the CS displace the PPS anteriorly and, if large, may remodel the styloid process, displacing it anterolaterally.
Infection of the CS occurs most commonly secondary to spread of infection from adjacent fascial spaces. Reactive inflammatory lymph nodes, which are characteristically homogeneous and less than 1 cm in size, may be seen in any portion along the carotid space and be seen with such varied infectious processes as sinusitis, infectious mononu-cleosis, and tuberculosis. Suppurative lymph nodes may have low-density centers and may not be distinguished from malignant lymph nodes. Clusters or groups of lymph nodes lumped into large masses are not uncommon. Cellulitis causes a loss of normal soft tissue planes. Abscesses are characterized by focal fluid collections with enhancing margins.
On CECT, normal blood vessels demonstrate contrast enhance-ment. With dynamic CECT, a wash-in phase (early visualization of contrast) may be demonstrated within normal vessels and within the feeding or draining vessels of a mass, which further indicates the vas-cular etiology of a lesion. On MRI, blood vessels appear as circular or linear areas of flow void, because of flow of fast-moving blood. Turbu-lent or slow flow may lead to areas of mixed signal intensity. Vessel ectasia, dissection, aneurysm, pseudoaneurysm, and thrombosis may be diagnosed readily with either cross-sectional imaging technique. Assess-ment of adjacent sectional images will demonstrate a tubular configura-tion to the lesion. An ectatic carotid artery or an asymmetrically enlarged jugular vein may present clinically as a lateral neck mass, but is readily discernible radiologically. The right jugular vein is usually larger than the left and at times may be several times larger than the left, reflecting its greater venous drainage from the brain. Thrombosis, either arterial or venous in nature, appears as a linear or tubular intra-luminal filling defect with or without associated mass effect on CECT because the vasa vasorum of the vessel wall enhances in a ringlike fashion.24 Subacute thrombosis or vessel wall hemorrhage secondary to dissection or trauma will yield a bright signal on T1WI because of the T1 shortening effects of paramagnetic methemoglobin, a blood break-down product.
Most mass lesions originating in the CS are of neoplastic origin. Most neurogenic tumors are schwannomas (Fig. 11-23). A schwan-noma arises from Schwann cells that form the covering of nerves and most commonly originate from the vagus nerve (less commonly from the sympathetic plexus). A neurofibroma contains mixed neural and Schwann-cell elements and arises from the peripheral nerves. Neurofi-bromas are rare; when present, they usually are multiple and part of neurofibromatosis. Both tumors are well defined with CT, with either tumor having a low-density component because of fat infiltration. On
lesions tend to be homogeneous. With increase in lesion size, areas of hemorrhage, necrosis, and calcification may develop. If the lesion extends or originates from the deep portion of the gland, it displaces the PPS medially and occasionally anteriorly. Large lesions in the parotid gland proper will cause widening of the stylomandibular notch, the space between the posterior border of the mandible and the styloid process. Comparison with the contralateral side will make subtle widen-ing of this space evident.21 Deep lobe lesions, if large, may displace the carotid artery posteriorly. Benign lesions as a general rule are well defined. Malignant lesions have indistinct margins and may invade adjacent structures. Lesions in the PPS or CS may extend laterally into the parotid space, mimicking a parotid lesion clinically.
Congenital lesions of the PS include hemangioma, lymphangi-oma, and first and second branchial cleft cyst, the latter presenting as a cystic-appearing lesion with smooth walls.22 Enhancing margins of the cyst indicate it is secondarily infected. Inflammatory disease may present as diffuse swelling or as a localized abscess. Infection of the adjacent skull base is best demonstrated with CT. Infection may occur secondary to calculus disease.
Calculi are also best demonstrated by sialography as intraluminal filling defects or by CT because of its tenfold higher sensitivity over plain films for detecting calcified calculi. Sialadenitis, autoimmune disease, and strictures are still best evaluated by conventional sialogra-phy, which best demonstrates ductal anatomy. Chronic sialadenitis will cause the affected parotid gland CT density to approach that of muscle. This appears as lower parotid gland signal on T1WI and brighter signal on T2WI than that of the contralateral parotid gland. Autoimmune diseases, such as Sjögren’s syndrome, demonstrate bilateral parotid enlargement. Bilateral gland enlargement by benign lymphoepithelial cysts is seen in acquired immunodeficiency syndrome.
Benign pleomorphic adenoma (benign mixed tumor), the most common benign neoplasm of the parotid gland, is well defined and demonstrates variable degrees of contrast enhancement (Fig. 11-21). It is usually ovoid in configuration and may involve either the superficial or deep lobe of the parotid gland or, less commonly, both. Rarely, benign mixed tumors may arise from salivary rest tissue medial to the deep lobe and have a fat border on both their medial and lateral margins. Calcification is occasionally seen within the tumor. The tumor is hypointense on T1WI and hyperintense on T2WI. Both the super-ficial and deep lobes of the parotid gland may be involved, leading to
Figure 11-21. Benign pleomorphic adenoma of the right parotid gland. Axial contrast-enhanced computed tomography demonstrates a dumb-bell-shaped tumor with enhancement of its superficial portion. Its deep portion is predominantly low density. Parapharyngeal space is dis-placed medially (arrow). The lateral pterygoid muscle is indented and lies anteriorly (arrowhead). The lesion has displaced the ramus of mandible anteriorly.

E
Chapter 11 n Overview of Diagnostic Imaging of the Head and Neck 151
course of the vagus nerve (glomus vagale), or at the carotid bifurcation (carotid body tumor) (Figs. 11-24 and 11-25). Paragangliomas are multiple in up to 5% of patients. The lesion is ovoid with smooth margins. Because of its marked hypervascularity, it is densely enhanc-ing on CT. Angiography reveals a very vascular tumor with dense capillary staining. At the skull base, it erodes the jugular spine and causes permeative bone erosion of the jugular foramen in contradistinc-tion to a schwannoma, which causes a smooth expansion with intact cortical margins. A jugular foramen paraganglioma may extend into the temporal bone or infiltrate through the skull base, presenting as a posterior fossa mass. In the midneck, a paraganglioma causes charac-teristic displacement of the carotid artery anteriorly and the jugular vein posterolaterally. At the carotid bifurcation, a lesion causes splaying of the internal and external carotid arteries. On MRI, it is recognized by its hypervascularity, characterized by multiple areas of signal void and flow-related enhancement from enlarged feeding and draining vessels.25
Lymph node involvement in the CS may be seen most commonly with metastases from SCC or as part of a general involvement by non-Hodgkin’s lymphoma. Lymph node involvement may be the initial manifestation of squamous cell carcinoma. Extracapsular spread of disease may occur. Complete encasement of the carotid artery (carotid fixation) may indicate inoperability. However, the carotid artery may be sacrificed at operation if the patient successfully tolerates a carotid balloon occlusion test. Metastatic lymph nodes are characteristically inhomogeneous, especially after contrast enhancement.
Masticator SpaceThe MS, the space of the muscles of mastication and the posterior portion of the mandibular ramus, lies anterior to the PS and is separated from the muscles of deglutition in the pharyngeal mucosal space by the parapharyngeal space. It contains the masseter, temporalis, and medial and lateral pterygoid muscles, motor branch of the third division of cranial nerve V, inferior alveolar nerve, internal maxillary artery and its branches, pterygoid venous plexus, and the ramus and posterior body of the mandible. It includes the temporal fossa (suprazygomatic MS) superiorly, encompasses the zygomatic arch, and extends inferiorly to include the infratemporal fossa and structures on both sides of the mandible. A mass in the MS displaces the PPS posteriorly and medially.
Infection (cellulitis, abscess, osteomyelitis) may involve the man-dible or the muscles of mastication. Extension through the skull base or involvement of the suprazygomatic masticator space may occur and
CECT, neurofibromas demonstrate variable degrees of enhancement. On MRI, they have a similar appearance. On both CT and MRI, most neural tumors have similar density and intensity characteristics to sali-vary gland tumors and often may not be differentiated. Neural tumors may have dense enhancement and simulate paragangliomas. On angi-ography, neuromas characteristically are hypovascular in contrast to paragangliomas, which are hypervascular. Neurogenic lesions arise pos-terior to the internal carotid artery and thus cause anterior displacement of the latter.
Paragangliomas—lesions developing from neural crest cell deriv-atives—may arise in the jugular foramen (glomus jugulare), along the
A B C
p
Figure 11-22. Acinic cell tumor of left parotid gland. A, Axial contrast-enhanced computed tomography at the level of C1 and C2 demonstrates an inhomogeneous irregular mass lesion involving both the superficial and deep portions of the left parotid gland. Lesion displaces the paraphar-yngeal space anteriorly and medially (arrow). Stylomandibular distance is increased. Areas of patchy enhancement are noted around the periph-ery and throughout the lesion. Lesion has displaced the carotid artery posteriorly (arrowhead). B, Axial T1-weighted image demonstrates superior contrast resolution of magnetic resonance imaging. Both superficial and deep portions of the lesion are well outlined. The margin of the lesion can be separated from the lateral pterygoid muscle (p), which is displaced anteriorly and laterally. PPS (arrowheads), indicated by its high-intensity fat, is displaced medially. The flow void marks the site of the left carotid artery (arrow). C, Axial spin density magnetic resonance imaging image at the level of the skull base demonstrates a well-defined lesion of increased signal intensity. Involvement of both superficial and deep lobes is well delineated.
Figure 11-23. Left carotid space and retropharyngeal space gangli-oneuroma. Axial contrast-enhanced computed tomography at the level of mid tongue demonstrates a C- or sausage-shaped, well-defined, low-density lesion in the anteromedial portion of the left carotid space. The lesion partially encases the left carotid artery (asterisk) and dis-places it posterolaterally. It extends medially into the left retropharyn-geal space (arrow). Parapharyngeal space has been displaced laterally. Pharyngeal mucosal space (arrowheads) lies anterior to the lesion.

E
152 Part 2 n General Otolaryngology
it passes from the brainstem to the cavernous sinus, through the foramen ovale, and eventually below the skull base as it passes inferiorly to innervate the individual muscles of mastication (Fig. 11-30). The foramen ovale may be increased in size, and a tumor may be found within the cavernous sinus. Tumor involvement of the inferior alveolar nerve may cause erosion, irregular enlargement, or destruction of the inferior alveolar canal of the mandible.26
Pseudotumors may mislead the unwary. An accessory parotid gland overlying the anterior border of the masseter muscle or asym-metric enlargement of the parotid gland may simulate tumor. In both situations the parotid gland variant retains MRI signal characteristics identical to the normal parotid gland. Hypertrophy of the masseter muscle may occur secondary to teeth grinding, mimic a mass lesion, or be bilateral. If the fifth cranial nerve is injured or invaded by a tumor resulting in denervation of the muscles, ipsilateral atrophy of the muscles of mastication and fat infiltration ensue. The normal contra-lateral muscle group may be incorrectly considered enlarged and mis-interpreted as tumor involvement.
should be ruled out (Fig. 11-26). Abscesses commonly arise from an odontogenic focus or from poor dentition. The bone changes of osteo-myelitis are best demonstrated with CT.
Benign lesions include hemangioma and lymphangioma (Fig. 11-27). Nasopharyngeal angiofibroma, a tumor of young adolescent males, arises in the pterygopalatine fossa and commonly extends into the masticator space (Fig. 11-28). Primary bone neoplasms may arise from the mandible. Chondrosarcoma and osteosarcoma present with chondroid calcification and new bone formation, respectively. The bone lesion is characteristically muscle intense on T1WI and hyperin-tense with T2WI. Postgadolinium T1WI demonstrates extensive enhancement. An infiltrating mass with mandibular destruction may be indistinguishable from metastatic disease. Non-Hodgkin’s lym-phoma may present with bone involvement, with a soft tissue mass, or as a lymph node mass. SCC presents as an infiltrating mass and occurs secondary to extension from a neighboring fascial space (Fig. 11-29). Perineural spread of tumor is common in the MS. The fifth nerve should be assessed for thickening and enhancement along its course as
A B
Figure 11-24. Glomus vagale (paraganglioma) of right carotid space. A, Axial T1-weighted image (T1WI) at the level of C2 demonstrates a mixed-density, predominantly low-density lesion involving the posterior aspect of the left carotid space. The lesion displaces the posterior belly of the digastric muscle laterally (white arrow) and the internal and external carotid arteries anteriorly (black arrows). Parapharyngeal fat is displaced medially (arrowhead). The lesion bulges into the medial aspect of the airway. The small areas of punctate low intensity noted along the margin and in the anterior portion of the lesion represent the tumor vessel flow voids. B, Axial T1WI at the same level postgadolinium injection demon-strates dense patchy enhancement of the lesion. Again noted are multiple punctate vascular flow voids within the lesion and around the periph-ery. Carotid vessels (arrows) are noted overlying the anterior lesion margin.
A B
Figure 11-25. Glomus vagale of left carotid space. A, Axial contrast-enhanced computed tomography at the level of mid tongue demonstrates a relatively homogeneous, well-defined enhancing lesion in the left carotid space. Carotid vessels lie on the anteromedial margin of the lesion (arrowhead). Parapharyngeal space is displaced medially (arrow). The lesion lies deep to the sternocleidomastoid muscle (asterisk). B, Antero-posterior digital subtraction angiogram demonstrates a densely vascular staining tumor displacing the internal carotid artery medially (arrows). Vascularity and dense tumor stain indicate the lesion is paraganglioma.

E
Chapter 11 n Overview of Diagnostic Imaging of the Head and Neck 153
pharyngeal nodes. This nodal group is commonly involved in children, and up to 1 cm in size is considered normal. But a node larger than 5 mm is viewed with suspicion in an adult. A mass lesion in the RPS will dis-place the PPS anterolaterally. Infection, either pharyngitis or tonsillitis, may give RPS lymph node involvement. Diffuse cellulitis or abscess may occur, the latter usually secondary to infection of the pharyngeal mucosal space or prevertebral space. Infection or mass in the lateral alar portion of the infrahyoid RPS may have a “bow-tie” appearance on axial imaging (Fig. 11-31). SCC may invade the RPS directly or may present solely with lymph node involvement. The pattern is one of inhomogeneous enhancement, commonly with necrotic low-density centers. With non-Hodgkin’s lymphoma, lymph nodes are homogeneous and multiple, commonly involving more than one of the fascial spaces.
Prevertebral SpaceThe PVS, also defined by the deep layers of the deep cervical fascia, is divided into anterior and posterior compartments. The former encom-passes the anterior cervical vertebral bodies, extending from one trans-verse process to another. The posterior compartment surrounds the posterior spinal elements. The PVS contains the prevertebral, scalene, and paraspinal muscles, the brachial plexus, the phrenic nerve, the vertebral body, and the vertebral artery and vein. Similar to the anatomy of the RPS, the PVS extends from the skull base superiorly to the mediastinum inferiorly.
The PVS lies directly posterior to the RPS and posteromedial to the carotid space. An anterior compartment PVS mass causes thicken-ing of the prevertebral muscles and displaces the prevertebral muscles and the PPS anteriorly. A mass in the posterior compartment of the PVS displaces the paraspinous musculature and the posterior cervical space fat laterally, away from the posterior elements of the spine. Infec-tion and malignant disease, the common disease processes of the PVS, usually involve the vertebral body.
Infection, including tuberculosis and bacterial pathogens, charac-teristically involves the vertebral body, as well as the adjacent interver-tebral disc space. Benign processes, although much less common, include chordoma, osteochondroma, aneurysmal bone cyst, giant cell tumor, and plexiform neurofibroma. Malignant disease processes include metastatic disease, leukemia, lymphoma, and direct invasion by SCC. Vertebral body destruction with associated soft tissue mass may be seen. The spinal canal and dural sac may be compromised.
Oral CavityThe oral cavity, the space of the anterior two thirds of the tongue and the floor of the mouth, lies below the hard palate, medial to the supe-
Retropharyngeal SpaceThe RPS, a potential space between the middle and deep layers of the deep cervical fascia, lies posterior to the pharyngeal mucosal space, ante-rior to the PVS, and medial to the carotid space. It extends from the skull base superiorly to the T3 level of the upper mediastinum inferiorly.27 The importance of the RPS derives from its potential to serve as a passageway for infection to spread among the head, neck, and mediastinum. Its contents are fat and lymph nodes, the principal nodes being the nodes of Rouvière (the classic lateral retropharyngeal nodes) and the medial retro-
Figure 11-26. Left masticator space abscess. Axial contrast-enhanced computed tomography at the level of the superior alveolar ridge dem-onstrates a low-density lesion (asterisk) in the medial aspect of the left masticator space, involving the left lateral pterygoid muscle. The abscess is surrounded by a rim of irregular enhancement. Edema has infiltrated and obscured the parapharyngeal space. Left masseter muscle (arrow) is thickened and edema is present in the soft tissue planes, lateral to the masseter muscle and in the buccal space ante-riorly. Note the accessory parotid gland overlying the right masseter muscle (arrowhead).
A B
Figure 11-27. Lymphangioma of left masticator space. A, Axial T1-weighted image at the level of the base of the tongue and tonsillar region of the oropharynx demonstrates an inhomogeneous low-density soft tissue mass involving the left lateral pterygoid muscle (asterisk). It displaces parapharyngeal space medially and anteriorly (arrow). The mass extends to the anterior medial wall of the left oropharynx (arrowhead). B, Axial spin density image with fat suppression demonstrates a lesion with bright signal intensity. The lesion margins are now better defined. The lesion can now be separated from the lateral pterygoid muscle. The lesion abuts the anteromedial wall of oropharynx. Anteriorly, the lesion extends into the buccal space (arrow), anterior to the cortical margin of mandible.

E
154 Part 2 n General Otolaryngology
rior and inferior alveolar ridge and teeth, anterior to the oropharynx, and superior to the mylohyoid muscle, the muscle stretching between the inferomedial margins of the mandible. The oral cavity is separated from the oropharynx posteriorly by the circumvallate papillae, tonsillar pillars, and soft palate. The oral cavity includes the oral tongue (the anterior two thirds of the tongue), whereas the oropharynx contains the base of the tongue (the posterior one third of the tongue), the soft palate, the tonsils, and the posterior pharyngeal wall.
The oral cavity can be divided into two major spaces, the sub-lingual space (SLS) and the submandibular space (SMS). The mylohyoid muscle, which constitutes the floor of the mouth, is the boundary marker between these two spaces. Other areas of the oral cavity include the floor of the mouth, oral tongue, hard palate, buccal mucosa, upper alveolar ridge, lower alveolar ridge, retromolar trigone, and lip.
Most masses in the oral cavity and oropharynx are amenable to direct clinical assessment. Mucosal lesions are readily visualized. The purpose of sectional imaging is to evaluate the degree of submucosal involvement. The majority of neoplasms of the oral cavity are readily detected on clinical examination. SCC accounts for approximately 90% of oral cavity and oropharyngeal neoplasms (Figs. 11-32 through 11-34). Cross-sectional imaging has an important role to play in esti-mation of tumor size, identification of tumor invasion, and assessment of nodal metastasis.
Congenital lesions include lingual thyroid and cystic lesions (epi-dermoid, dermoid, and teratoid cysts). Most infections of the oral cavity are dental in origin. Dental infections anterior to the second
A B
C D
Figure 11-28. Nasopharyngeal angiofibroma. A, Axial noncontrast computed tomography (NCCT) demonstrates a homogeneous soft tissue mass enlarging the right nasal aperture. A large component of the tumor projects posteriorly into the nasopharynx and oropharynx. B, Coronal NCCT also demonstrates the complete opacification and expansion of the right nasal aperture by a soft tissue mass. The tumor extends into and widens the right infraorbital fissure (arrow). The tumor (asterisk), having destroyed right floor, is present in the sphenoid sinus. C and D, Lateral subtrac-tion angiograms (early arterial and capillary phase) demonstrate a vascular mass in the nasopharynx and nasal aperture. Internal maxillary artery (arrow) gives rise to leash of tumor vessels. Dense tumor stain is noted in the capillary phase.
Figure 11-29. Squamous cell carcinoma of mandibular ramus. Axial contrast-enhanced computed tomography at the level of C2 demon-strates a large soft tissue tumor destroying the central portion and medial margin of the left mandibular ramus with an extension of the soft tissue tumor into the masseter and lateral pterygoid muscles. Parapharyngeal space has been displaced medially (arrow). Thin rim of circular enhancement is noted posteriorly and laterally (arrowheads).

E
Chapter 11 n Overview of Diagnostic Imaging of the Head and Neck 155
A B
C D
Figure 11-30. Adenoid cystic carcinoma of masticator space invading left skull base. A, T1-weighted (T1WI) magnetic resonance image demon-strates a low-density, well-defined lesion (asterisk) abutting the lateral border of the clivus and destroying the medial apex of the left petrous temporal bone (arrow). Lateral cortical margin of the clivus has been eroded (arrowhead). B, Axial postgadolinium fat-suppressed T1WI demon-strates diffuse patchy enhancement of the left middle fossa lesion (asterisk). On this sequence, the normal high signal intensity of fat has been suppressed. C, Coronal postgadolinium fat-suppressed spin density image demonstrates an enhancing tumor (arrowhead) below the skull base with the extension through the foramen ovale into the left middle fossa (arrow). D, Coronal spin density with fat suppression postgadolinium infusion demonstrates an enhancing tumor in the expanded vidian canal (arrow) and pterygoid fossa (arrowheads).
A B
Figure 11-31. Retropharyngeal space (RPS) edema and abscess. A, Axial contrast-enhanced computed tomography (CECT) at the level of the superior margin of the hyoid bone demonstrates a nasogastric tube (asterisk) in the posterior wall of the oropharyngeal airway and mild thicken-ing of the lateral wall of the larynx. RPS is normal (arrowhead). Two lymph nodes (arrows) with rim enhancement lie anterior to the left sub-mandibular gland. B, Repeat axial CECT at the same level 6 months later demonstrates a well-defined “bow-tie” appearance of edema in the RPS (arrowheads).

E
156 Part 2 n General Otolaryngology
nerve V), the chorda tympani branch of cranial nerve VII, the lingual artery and vein, the deep portion of the submandibular glands and ducts, and the sublingual glands and ducts.
Congenital lesions of the sublingual space include epidermoid, dermoid, lymphangioma, and hemangioma. Lingual thyroid tissue will result if there is failure of normal descent of developing thyroid tissue from the base of the tongue into the lower neck. On CT, the lingual thyroid is midline in the posterior portion of the tongue and demon-strates dense contrast enhancement. Nuclear medicine thyroid scans demonstrate functioning thyroid tissue.
Cellulitis and abscess may occur secondary to dental or mandibu-lar infections or arise as a consequence of calculus disease of either the submandibular or sublingual glands. Abscess is characterized by central areas of low density with or without boundary enhancement (Fig. 11-35). As with parotid gland calculi, CT readily identifies calcified stones and demonstrates bone destruction and sequestra of mandibular osteomyelitis. Ranula, a postinflammatory retention cyst of the sublin-gual gland, presents as a cystic low-density lesion. As it enlarges, it extends posteriorly and inferiorly into the submandibular space, where it is referred to as a “diving ranula” (Fig. 11-36).
SCC, the most common malignancy of the SLS, may spread from the oropharynx, oral cavity, alveolar ridge, or anterior portion of the tongue. A mass with irregular areas of enhancement, ulceration, central necrosis, and lymph node involvement is characteristic. Normal fat planes may be obscured. Tumor spread across the midline of the tongue, along the lingual or mandibular nerve, or invasion of the cortex or medulla of the mandible is an important finding that alters treatment planning.
Submandibular SpaceThe SMS lies inferior and lateral to the SLS. It is located inferior to the mylohyoid bone and superior to the hyoid bone. It contains the anterior belly of the digastric muscle, fat, submandibular and submen-tal lymph nodes, the superficial portion of the submandibular gland, the inferior portion of the hypoglossal nerve, and the facial artery and vein.
Congenital lesions are not uncommon and include second branchial cleft cyst, thyroglossal duct cyst, and cystic hygroma (lym-phangioma). Branchial cleft cyst occurs most commonly at the angle of the mandible, posterior to the submandibular gland, anterior to the sternocleidomastoid muscle, and anterolateral to the carotid space (Fig. 11-37). It may have an associated fistula or sinus tract. Thyroglossal duct cysts are midline in location and are found anywhere
molar tend to involve the sublingual space and lie superior to the mylohyoid muscle. Infections of the posterior molars usually involve the SMS and lie inferior to the mylohyoid muscle. Knowledge of which space is involved is crucial to plan adequate surgical drainage.
Sublingual SpaceThe SLS is located in the anterior tongue, lateral to the intrinsic muscles of the tongue (genioglossus and geniohyoid) and superior and medial to the mylohyoid muscle. Anteriorly, it extends to the genu of the mandible and, posteriorly, it connects freely with the SMS at the pos-terior margin of the mylohyoid muscle. It contains the anterior portion of the hyoglossus muscle, the lingual nerve (sensory division of cranial
Figure 11-32. Right base of tongue and tonsillar abscess. Axial con-trast-enhanced computed tomography of the suprahyoid neck demon-strates an inhomogeneous mixed low-density enhancing mass (arrowheads) in the base of the tongue and in the right tonsillar region. Low-density area of the lesion indicates pus within the abscess.
A B
Figure 11-33. Squamous cell carcinoma of the base of tongue and the floor of the mouth. A, Axial contrast-enhanced computed tomography (CECT) at the level of the mid tongue demonstrates a homogeneous lesion (asterisk), isodense relative to the muscles of mastication, involving lateral and posterior margins of the left side of tongue, left lateral pterygoid muscle, and tonsillar region of oropharynx. B, Coronal CECT demon-strates a homogeneous mass involving the lateral portion of the tongue, extending from the floor of mouth inferiorly to the tonsillar region supe-riorly (asterisk). Midline septum (arrow) of the tongue is displaced laterally. Necrotic lymph node (arrowhead) lies inferior to the tongue.

E
Chapter 11 n Overview of Diagnostic Imaging of the Head and Neck 157
Benign tumors include benign mixed cell tumor, lipoma, dermoid, and epidermoid. Most malignant disease represents secondary sub-mandibular and submental nodal involvement, commonly from SCC of the oral cavity and face. Multiple enlarged lymph node involvement may be seen with non-Hodgkin’s lymphoma.
Spaces of Infrahyoid NeckThe infrahyoid neck extends superiorly to the hyoid bone and inferiorly to the clavicles and contains the following spaces:
from the tongue base to the midportion of the thyroid gland. Cystic hygroma, a malformation of lymphatic channels, is a multilocu-lar fluid density lesion that may involve both the SLS and SMS in the adult.
Ranula, a retention cyst of the sublingual gland, commonly extends into and may predominantly involve the SMS. It is unilocular in configuration. Its tail of origin should be carefully searched for in the SLS because this will aid in establishing its origin and diagnosis.
A B
Figure 11-34. Non-Hodgkin’s lymphoma of the base of tongue and the floor of the mouth. A, Axial contrast-enhanced computed tomography (CECT) at the midlevel of the tongue demonstrates an enlargement of the right side of the tongue by a homogeneous mass lesion (asterisk), isodense to the normal tongue musculature. Submandibular space (arrow), located more laterally, is also involved. B, Coronal CECT demonstrates homogeneous involvement of the right inferior lateral base of the tongue (asterisk), mylohyoid muscle (arrowhead), and floor of the mouth. Lesion lies above the anterior belly of digastric muscle (arrow). Homogeneous nature of the lesion favors lymphoma.
Figure 11-35. Submandibular abscess and cellulitis. Axial contrast-enhanced computed tomography demonstrates a mixed low-density and enhancing lesion (asterisk) involving the right submandibular space (SMS). Abscess displaces the midline structures of the tongue to the left. Edema extends laterally from the SMS into overlying soft tissues. Fat is of increased density because of infiltration by edema.
Figure 11-36. Ranula of left lingual and submandibular space. Axial contrast-enhanced computed tomography at the level of the body of the mandible demonstrates a large, low-density lesion with well-defined margins involving both sublingual and submandibular space. Lesion displaces the midline tongue structures (arrow) to the right. Sub-mandibular gland is displaced posteriorly and laterally (asterisk).

E
158 Part 2 n General Otolaryngology
density congenital lesions arising primarily in, or secondarily extending into, the infrahyoid RPS. Inflammation of this space may arise from pharyngeal mucosal laceration, discitis, or osteomyelitis from the PVS, or from infections tracking in through the posterior cervical space. Gas in this space suggests laceration of the pharynx, larynx, or trachea, pneumomediastinum, or the presence of gas-forming organisms (Fig. 11-42). Edema from inflammation in an adjacent space may track into the RPS and occasionally mimic a true fluid collection or abscess. Neoplasms arising in the hypopharyngeal MS, CS, posterior thyroid gland, and larynx may involve the RPS. Extracapsular spread of internal jugular and spinal accessory metastatic nodes, as well as recurrent vis-ceral space neoplasms, occasionally may invade the RPS. One common pseudomass that indents into this space is a tortuous common or internal carotid artery, usually seen in the middle-aged and elderly populations.
Infrahyoid Prevertebral SpaceThe infrahyoid PVS continues superiorly into the suprahyoid PVS and inferiorly to the mediastinum. This space is susceptible to the same pathologic processes as the suprahyoid component, which include inflammatory and infectious processes (arthritis, discitis, osteomyelitis), as well as neoplasms arising in the spinal canal, brachial plexus, para-spinous musculature, or vertebral bodies (Fig. 11-43).
Anterior and Posterior Cervical (Lateral Cervical) SpacesThe posterior cervical (lateral cervical) space corresponds to the poste-rior triangle and is a fibrofatty layer containing the internal jugular, spinal accessory, and transverse cervical lymph node chains, as well as the spinal accessory and phrenic nerves. The posterior cervical space is limited by the sternocleidomastoid muscle and investing layer of deep cervical fascia anterolaterally, the carotid sheath anteriorly, and the prevertebral fascia posteromedially. It extends superiorly from the mastoid process and skull base down to the first rib and clavicles infe-riorly.34 Thus a small portion of the posterior cervical space extends into the suprahyoid neck, with the majority occupying the infrahyoid neck.
A trans-spatial lesion (lymphangioma, plexiform neurofibroma, lipoma, hemangioma) may invade two or more anatomic compart-ments, without respect for fascial boundaries.30 Congenital lesions of the posterior cervical space include a second branchial cleft cyst, which tends to lie along the anterior margin of the sternocleidomastoid muscle, and a lymphangioma or cystic hygroma (Fig. 11-44). Both lesions are CSF density on CT, low intensity on T1WI, high intensity on T2WI, and may ring-enhance if secondarily infected. Inflammation may enter this space from cutaneous lesions or from abscessed lymph nodes. Benign neoplasms include neurogenic tumors (plexiform neu-rofibroma, schwannoma), a lipoma, or a hemangioma. Malignant neo-plasms in the posterior cervical space are most commonly metastatic to the spinal accessory or internal jugular lymph nodes, with SCC repre-senting the largest group of both primary and secondary tumors involv-ing this space. Less commonly, sarcomas such as liposarcoma, leiomyosarcoma, or malignant fibrous histiocytoma arise here. Normal structures such as the scalene muscles, poorly opacified vessels on CT, and high-signal, flow-related enhancement in vessels on MRI may be misinterpreted as a pseudomass. Denervation atrophy of the sternoclei-domastoid muscle or other neck muscles may occasionally cause an incorrect interpretation of the contralateral (normal-sized) muscles as representing masses.
Hypopharyngeal Mucosal SpaceThe hypopharyngeal mucosal space forms the walls of the hypopharynx and includes the continuation of the pharyngeal mucosal space below the hyoid bone posteriorly, the piriform sinuses laterally, the aryepiglot-tic folds and epiglottis anteriorly, and the cricopharyngeus muscle inferiorly. The hypopharyngeal mucosal space, piriform sinuses, and aryepiglottic folds are frequently challenging to evaluate on CECT and MRI because they are relatively thin membranous spaces that are nor-mally collapsed together when the pharynx is relaxed. A modified Valsalva maneuver is usually required to distend the hypopharynx enough to obtain adequate imaging (see Fig. 11-2).
1. Infrahyoid RPS
2. Infrahyoid PVS
3. Anterior and posterior (lateral) cervical spaces
4. Hypopharyngeal mucosal space (PMS)
5. Visceral space and larynx
6. CS
Normal cross-sectional anatomy of the infrahyoid neck is pre-sented in Figures 11-38 through 11-40. The PPS ends at the hyoid bone and does not continue into the infrahyoid neck. The mucosal, carotid, retropharyngeal, prevertebral, and posterior cervical spaces are all continuous superiorly with the suprahyoid neck and extend inferi-orly to the thoracic inlet.28 These spaces are discussed in more detail in the suprahyoid neck section of this chapter. The posterior cervical space is described in the next section. Lesions may secondarily invade the structures of the infrahyoid neck from the cranial margin (submandib-ular, parapharyngeal, carotid, retropharyngeal, and oropharyngeal mucosal spaces), posterior margin (prevertebral space and vertebrae), and inferior margin (mediastinum and chest wall).
Infrahyoid Retropharyngeal SpaceThe infrahyoid RPS, a potential space containing a thin layer of fat and no lymph nodes, is bounded by the middle layer of deep cervical fascia anteriorly, the alar fascia of the carotid sheath laterally, and the deep layer of deep cervical fascia posteriorly.29 Unlike the suprahyoid RPS, which contains both fat and lymph nodes, the infrahyoid RPS only contains fat. On CT and MRI, the normal infrahyoid RPS is an incon-sistently demonstrated fat stripe overlying the anterior margin of the longus colli muscles, nestled between the two carotid sheaths.
The infrahyoid RPS may be involved by processes arising from tissues within this space, but more commonly it is affected by external invasion from the adjacent spaces. Lesions within this space have a characteristic “bow-tie” configuration and lie anterior to the longus colli muscles (Fig. 11-41). Lipomas and lymphangiomas are two low-
Figure 11-37. Infected branchial cleft cyst. Axial contrast-enhanced computed tomography at the midlevel of the tongue and base of the mandible demonstrates a well-defined, low-density lesion in the lateral portion of the submandibular space lying anterior to the right sterno-cleidomastoid. A thin rim of peripheral enhancement is noted anteriorly and medially. The lateral wall demonstrates thick enhancement (arrow). Location favors the second branchial cleft cyst. Enhancement of the cyst wall indicates that it is infected.

E
Chapter 11 n Overview of Diagnostic Imaging of the Head and Neck 159
progress with the patient’s age. Ligaments from the styloglossus and stylohyoid muscles frequently calcify. Knowledge of the normal pat-terns of calcification is helpful for distinguishing opaque foreign bodies, such as chicken bones, from normal structures on plain films or CT.
LarynxThe hyoid bone supports the laryngeal skeleton and is occasionally fractured in blunt trauma or destroyed by neoplasms. Fractures of the laryngeal skeleton appear on CT as linear lucencies, often with displace-ment or distortion of the cartilage. A fracture is best appreciated (on bone windows) in well-ossified cartilage, but its identification is more challenging in noncalcified cartilage requiring the use of a narrower window width and careful scrutiny of cartilage configuration. Laryngeal trauma may result in hematomas of the aryepiglottic folds, false cords, true cords, or subglottis, and may potentially compromise the airway (Fig. 11-46). Adjacent subcutaneous emphysema may result from trauma to the laryngopharyngeal mucosa, from a penetrating injury to the neck, or from upward dissection from the chest wall or mediastinum.
Laryngoceles are formed by increased intraglottic pressure (e.g., in horn players and glass blowers) or from obstruction of the laryngeal ventricle and its distal appendix by inflammatory or neoplastic lesions
As with the suprahyoid pharyngeal mucosal space, caution must be exercised in assigning abnormality to this space, since redundancy of the mucosa and incomplete distention may mimic a tumor. Foreign bodies, inflammation, and SCC are the most common lesions in this space. Inflammation may cause ulceration or swelling of the mucosa, with gas or a ring-enhancing fluid collection suggesting the diagnosis. Reactive lymph nodes are common. The best indicator of hypopharyn-geal malignancy is a bulky mass with invasion and destruction of submucosal and deep structures including the retropharyngeal space, aryepiglottic folds, cricoid cartilage and larynx, as well as associated necrotic lymph nodes (Fig. 11-45).
Visceral Space and LarynxThe visceral space, corresponding to the muscular triangle, is confined by the middle layer of deep cervical fascia with the anterior fascial layer splitting around the thyroid gland. The visceral space contains the larynx, trachea, hypopharynx, esophagus, parathyroid glands, thyroid gland, recurrent laryngeal nerve, and tracheoesophageal lymph nodes.31 The superior margin is the hyoid bone, and the inferior border is the mediastinum. The skeleton of the larynx includes the thyroid, cricoid, arytenoid, cuneiform, and corniculate cartilages. These cartilages may reveal a variable degree of calcification or ossification. These findings
A B
C D
c
c
J
J
PVS
PVS
PVS
AC
ACplSC
SC
PC
PC
es
bb
PCtr
AC
PC
pee
s
ae
tc
hsmg
scm
scm
scm tg
J
c
asm
tvc
acc
s
cJ
tc
Figure 11-38. Normal axial contrast-enhanced computed tomography (CECT) anatomy of infrahyoid neck. CECT obtained at hyoid bone (A), false vocal cord (B), true vocal cord (C), and thyroid gland levels (D). (Streaky densities in the superficial fat of the right neck area in A and B are from earlier radiation of the right parotid mass.) Note the following structures: arytenoid cartilage (a), anterior cervical space (AC), aryepiglottic fold (ae), anterior scalene muscle (asm), brachial plexus (b), carotid artery (c), cricoid cartilage (cc), epiglottis (e), esophagus (es), hyoid bone (h), jugular vein (J), posterior cervical space (PC), preepiglottic fat (pe), paralaryngeal fat (pl), prevertebral space (PVS), pharyngeal mucosal space (small arrows), platysma muscle (large arrow), retropharyngeal space (arrowheads), strap muscle (s), superficial cervical space (SC), sternocleido-mastoid muscle (scm), submandibular gland (smg), thyroid cartilage (tc), thyroid gland (tg), trachea (tr), and true vocal cord (tvc).

E
160 Part 2 n General Otolaryngology
A B
C D
eae
scm c cc
J J
s
aescm
PVS
PVS
esasm
b
c
c
J
J
trtg
J
tc
tvc
s
pe
pl
SC
AC
PC
PC
cca
tc
tc
pl
AC
PVS
PC
Figure 11-39. Normal axial magnetic resonance anatomy of infrahyoid neck. Noncontrast T1-weighted images obtained at hyoid bone (A), false vocal cord (B), true vocal cord (C), and thyroid gland levels (D). The following structures are labeled: arytenoid cartilage (a), anterior cervical space (AC), aryepiglottic fold (ae), anterior scalene muscle (asm), branchial plexus (b), carotid artery (c), cricoid cartilage (cc), epiglottis (e), esophagus (es), jugular vein (J), posterior cervical space (PC), preepiglottic fat (pe), paralaryngeal fat (pl), prevertebral space (PVS), pharyngeal mucosal space (small arrows), platysma muscle (arrowheads), retropharyngeal space (large arrow), strap muscle (s), superficial cervical space (SC), sternocleidomastoid muscle (scm), thyroid cartilage (tc), thyroid gland (tg), trachea (tr), and true vocal cord (tvc).
A B
SCSC
cc
cc
pl
pe
tr
tvc
tvc
e
s
smg
Figure 11-40. Normal sagittal and coronal magnetic resonance of infrahyoid neck. A, Sagittal T1-weighted image (T1WI) and, B, coronal T1WI obtained through the larynx. Note the following structures: cricoid cartilage (cc), epiglottis (e), false vocal cord (asterisk), pharyngeal mucosal space (small arrows), preepiglottic fat (pe), paralaryngeal fat (pl), retropharyngeal space (arrowheads), strap muscle (s), superficial cervical space (SC), submandibular gland (smg), trachea (tr), and true vocal cord (tvc).

E
Chapter 11 n Overview of Diagnostic Imaging of the Head and Neck 161
cal for determining the extent of deep invasion or inflammation. The fat in the preepiglottic space, epiglottis, and aryepiglottic folds and paralaryngeal fat of the supraglottic larynx are major landmarks that are easily identified on axial CT and MRI. Coronal T1WIs are par-ticularly useful for evaluating the configuration of the airway and for determining the craniocaudal margins of a supraglottic, glottic, infra-glottic, or transglottic lesion because the vertically oriented paralaryn-geal fat plane terminates inferiorly at the true vocal cords (thyroarytenoid muscle). A lesion becomes transglottic when the fat interface between the thyroarytenoid muscle (true vocal cord) and the paralaryngeal fat (false vocal cord) is eliminated, indicating the tumor has crossed the laryngeal ventricle (Fig. 11-49A). The anterior commis-sure should be less than 1-mm thick. Greater thickness in this area represents tumor spread from the anterior margin of one cord to another. A diagnosis of vocal cord fixation may be made when the involved cord remains paramedian during quiet breathing or with a modified Valsalva maneuver (see Fig. 11-49B).
Cartilage invasion or destruction by aggressive infections or tumors is an important part of staging, and is often difficult to predict on CECT or MRI when the cartilage is incompletely calcified. If the cartilage has ossified, CECT and MRI are relatively sensitive for detect-ing cartilage erosion. MRI, using a combination of T1WI, T2WI, and postgadolinium fat saturation T1WI, may be more sensitive than CECT to invasion of the central layer of the thyroid cartilage, especially if the cartilage has ossified and the central fatty marrow has been locally replaced by an invading tumor. The best indicator of cartilage invasion is the presence of a tumor on the external margin of the cartilage in the strap muscles (Fig. 11-50).
Thyroid GlandThe thyroid gland lies within the anterior leaves of the middle layer of deep cervical fascia (within the visceral space), anterior and lateral to the thyroid, cricoid, and upper tracheal cartilages. It consists of the lateral thyroid lobes, isthmus, and pyramidal lobe. Normal iodine content of the thyroid gland makes it higher density than muscle on NCCT. The gland is normally homogeneous with enhancement on both CECT and MRI, but internal inhomogeneity from calcification, goiter, colloid cyst, or a solid mass is occasionally encountered on routine neck imaging. When physical examination, ultrasound, or thyroid scintigraphy raises the suspicion of a thyroid carcinoma or thyroid lymphoma, CECT or MRI may be used for further charac-terization, especially if it is a low thoracic inlet thyroid or parathyroid mass.
Absence of the thyroid gland at the level of the thyroid cartilage should redirect attention to the tongue for an ectopic lingual thyroid gland (Fig. 11-51). A thyroglossal duct cyst is a remnant of the
(Fig. 11-47). An internal laryngocele tracks superiorly within the para-laryngeal (paraglottic) fat, is air- or fluid-filled (obstructed laryngocele), and causes variable compromise of the supraglottic larynx. A mixed (external) laryngocele extends further superolaterally, piercing the thy-rohyoid membrane, and may present as a neck mass. A mucocele (mucous retention cyst) of the supraglottic laryngeal mucosa may be indistinguishable from an obstructed internal laryngocele. Inflamma-tion of the supraglottic larynx may lead to epiglottitis, thickening the epiglottis and aryepiglottic folds, and compromising the airway (Fig. 11-48).
Apart from routine evaluation of adenopathy from suprahyoid neck and sinus tumors, laryngeal and hypopharyngeal SCC is the most common indication for imaging the infrahyoid neck. Because both CECT and MRI are relatively insensitive to superficial mucosal based lesions, knowledge of the physical examination findings and specific locations of concern is mandatory to facilitate lesion localization and characterization. Findings that help identify SCC of the superficial mucosa of the larynx or pharynx are a mass, mucosal irregularity or asymmetry, and ulceration. Fat planes in the laryngopharynx are criti-
A B
Figure 11-41. Infrahyoid retropharyngeal space and visceral space abscess. A, Axial contrast-enhanced computed tomography at the level of the false vocal cords demonstrates a low-density abscess in the retropharyngeal space (arrowheads) creating a “bow-tie” configuration. The abscess extends laterally to the left posterior cervical space and anteriorly into the visceral and anterior cervical spaces. B, Communication between the retropharyngeal space and mediastinum is well demonstrated by cephalad extension of this mediastinal abscess (asterisk) posterior to the trachea.
h
scm
PVS
AC
PC
Figure 11-42. Axial non-contrast computed tomography of subcutane-ous emphysema highlighting cervical spaces. Gas from a pneumo-mediastinum has dissected into the anterior cervical space (AC), posterior cervical space (PC), and retropharyngeal space (arrowheads). Note the “bow-tie” pattern of the retropharyngeal space. Other labeled structures include the hyoid bone (h), sternocleidomastoid muscle (scm), and prevertebral space (PVS).

E
162 Part 2 n General Otolaryngology
embryonic thyroglossal duct and may occur anywhere along its migra-tory path from the foramen cecum in the tongue to the pyramidal lobe, although most occur just inferior to the hyoid bone (Fig. 11-52). Inflammatory thyroiditis may enlarge the thyroid gland. Benign enlargement may also result from colloid cysts and goiters. Thyroid calcification is nonspecific and occurs in goiters, as well as in benign thyroid adenomas. Primary malignancies of the thyroid include papil-lary, follicular, mixed, and anaplastic carcinomas, as well as non-Hodg-kin’s lymphoma, all of which may have a similar imaging appearance (Fig. 11-53). Indistinct margins of a thyroid mass, infiltration of adja-cent tissues, and necrotic lymph nodes are all indications of thyroid malignancy. Metastasis to the thyroid gland more commonly arises from extracapsular spread of SCC in adjacent nodes than from hema-togenous deposits.
Parathyroid GlandsThe parathyroid glands are usually four to six in number and underlie the posterior surface of the thyroid gland. Because they are quite small, normal parathyroid glands are frequently not visualized on routine neck imaging. An ectopic parathyroid gland may occur in the mediastinum (Fig. 11-54). A parathyroid adenoma is usually a discrete mass lying deep to the thyroid lobes. Occasionally, an adenoma may be detected on routine CT or MRI as a nodular, enhancing mass that may be dif-
A B
N
N
N
Figure 11-43. Prevertebral space (PVS) lesions. A, Axial contrast-enhanced computed tomography (CECT) of the prevertebral abscess extends anteriorly from C5-6 discitis. Anterolateral margins of the abscess (arrowheads) displace pharyngeal mucosa and posterior cervical spaces ante-riorly. A small amount of gas is present in the abscess on the left. B, Axial CECT of bilateral plexiform neurofibromas (N) arising from the brachial plexus in the PVS shows anterior displacement of fat in the posterior cervical spaces (arrowheads).
Figure 11-44. Posterior cervical space lymphangioma. Contrast-enhanced computed tomography reveals a homogeneous, bright, low-density mass with sharp margins displacing the posterior cervical space fat (arrow) posterolaterally and internal jugular vein (arrowhead) anteriorly. Figure 11-45. Piriform sinus squamous cell carcinomas. Axial con-
trast-enhanced computed tomography shows a mildly enhancing mass in the right piriform sinus (asterisk) displacing the aryepiglottic fold anteromedially. Focal defects in the internal jugular and spinal acces-sory nodes (arrowheads) indicate metastatic tumor spread. Calcifica-tion is noted in the internal jugular node.
Figure 11-46. Laryngeal trauma. Axial noncontrast computed tomog-raphy at the level of cricothyroid articulation shows a laterally displaced cricoid ring (arrowheads) fracture and subglottic hematoma obstructing the airway.

E
Chapter 11 n Overview of Diagnostic Imaging of the Head and Neck 163
3. Submandibular space: submandibular and submental nodes
4. Parotid space: parotid nodes
5. Suprahyoid retropharyngeal space: medial and lateral retropharyn-geal nodes
6. Visceral space: prelaryngeal, prethyroid, pretracheal, and tra-cheoesophageal nodes
7. Subcutaneous tissues of the scalp and face: occipital, mastoid, and facial nodes
A condensation of this nomenclature into seven groups with Roman numerals (levels I to VII) has been proposed and is a useful shorthand for node documentation and statistical analysis. Som and others20 have proposed an imaging-based nodal classification to find a common ground between anatomic imaging criteria and the two most commonly used clinical nodal classifications: the American Joint Com-mittee on Cancer and the American Academy of Otolaryngology-Head and Neck Surgery.
In this classification, level I combines the submandibular and submental lymph nodes. Levels II to IV divide the internal jugular chain roughly into thirds, using landmarks that are easily recognizable on cross-sectional imaging. Level II is the jugulodigastric nodes (upper internal jugular), including the nodes from the skull base down to the bottom of the body of the hyoid bone. Level III is the supraomohyoid internal jugular chain (middle internal jugular), from the bottom of the body of the hyoid bone to the level of the bottom of the cricoid carti-lage. Level IV includes the infraomohyoid (low internal jugular), nodes from the level of the bottom of the cricoid to the level of the clavicles. Level V includes the spinal accessory and transverse cervical nodes from the skull base to the clavicles, which lie posterior to the sternocleido-mastoid muscle. Level VI includes the upper visceral nodes, which lie between the carotid arteries from the level of the bottom of the hyoid bone to the level of the top of the manubrium. Level VII nodes are located in the superior mediastinum between the carotid arteries, below the level of the manubrium and above the level of the innominate vein.
Subdivisions of the levels I, II, and V are also defined. Level Ia nodes are the submental nodes; they lie medial to the lateral margin of the anterior belly of the digastric muscle. Level Ib nodes lie lateral to the digastric muscle about the submandibular gland. Level IIa nodes are located at the level of, or anterior to, the internal jugular vein. Level II nodes that are posterior to and separate from the internal jugular vein are in Level IIb. Level Va nodes lie above the level of the bottom of the cricoid arch. Level Vb nodes are below the level of the cricoid and above the level of the clavicle. The levels Ib and IIa are divided by an arbitrarily selected imaginary coronal plane that follows the posterior border of the submandibular gland. The posterior margin of the ster-nocleidomastoid muscle separates the levels II, III, and IV from the level V.
A B
L m
Figure 11-47. Laryngocele. A, Axial contrast-enhanced computed tomography (CECT) at the level of the thyrohyoid membrane demonstrates an air-filled internal laryngocele (L) displacing the preepiglottic fat and aryepiglottic fold. Note that the thyrohyoid membrane is separated from the piriform sinus by the aryepiglottic fold. B, Axial CECT at the true cord level reveals the cause of the laryngocele—an obstructing transglottic carcinoma (m).
Figure 11-48. Epiglottitis. Lateral plain film of the neck demonstrates the swollen epiglottis (arrowheads) and aryepiglottic folds. The lower portion of the stylohyoid ligament (arrow) has ossified bilaterally.
ferentiated from lymph nodes by its location posterior to the thyroid gland.
Lymphadenopathy
Lymph Node Anatomy and ClassificationThe nodes of the superficial triangles of the neck are organized by major lymphatic chains. The traditional classification of lymph nodes of the head and neck includes 10 groups: lateral cervical, anterior cervical, submandibular, submental, sublingual, parotid, facial, mastoid, occipi-tal, and retropharyngeal. The lateral cervical chains are further subdi-vided into the deep and superficial chains. The deep lateral cervical chain includes the internal jugular, spinal accessory, and transverse cervical (supraclavicular) nodes. The superficial lateral cervical chain consists of the external jugular nodes. The anterior cervical (juxtavis-ceral) group contains the prelaryngeal (Delphian), pretracheal, prethy-roid, and lateral tracheal (tracheoesophageal or paratracheal) nodes.32 The cervical lymph node chains are found throughout several of the spaces of the neck:
1. Posterior cervical space: spinal accessory, transverse cervical, and internal jugular (posterior to the internal jugular vein) nodes
2. Carotid space: internal jugular nodes (anterior to the internal jugular vein posterior margin)

E
164 Part 2 n General Otolaryngology
Inflammatory (reactive) lymph nodes on CECT tend to be less than 10 mm (rarely larger than 20 mm), have central hilar or mild homogeneous enhancement, and have well-defined margins (Fig. 11-55). Node margins should remain sharp in reactive adenopathy, except in cases with large abscessed nodes that elicit an inflammatory reaction in the adjacent fat, obscuring the node margins (Fig. 11-56). Calcification is a common finding in previously infected or healed nodes and frequently occurs in tuberculosis or bacterial infections. Multiple nodes may be present, but they tend not to cluster. On MRI, these reactive nodes are enlarged and have well-defined margins on all sequences. They are of muscle intensity on T1WI, enhance moderately and homogeneously on postgadolinium fat-suppressed T1WI, and are bright on T2WI and STIR.
The correlation of lymph node size with sensitivity and specificity in predicting malignant metastasis has been performed for different neck regions in patients with head and neck carcinoma, allowing more appropriate size criteria for distinguishing normal from abnormal lymph nodes.32 Although CT can readily detect lymph node enlarge-ment, it has also proven capable of accurately diagnosing metastases in “normal size” nodes from head and neck primary SCC. The upper range of normal for cervical lymph node size is between 5 and 10 mm, with the jugular digastric node ranging up to 15 mm. The exceptions are the retropharyngeal nodes, which are considered pathologic when larger than 10 mm in children or larger than 5 mm in adults. Generally, cervical nodes larger than 10 to 15 mm are potentially malignant and nodes smaller than this are considered reactive or inflammatory. Nodes larger than 20 mm are frequently malignant. Clinically occult neck disease occurs in 15% to 40% of patients with head and neck SCC. Clinically occult nodes average 12 mm (Fig. 11-57). Studies comparing clinical and CT staging of nodal metastases have shown that physical examination of the neck has an accuracy of 70% to 82% compared with 87% to 93% for CT. In patients with no nodal disease on examination, CT is likely to upstage an N0 neck to N1 in 20% to 46% of cases and upstage clinical staging of the neck between 5% and 67% of cases overall. CT may downstage the clinical neck examination in 3% to 36% of cases.33,34
The enhancement pattern on CT is very helpful, but not infallible, in distinguishing inflammatory nodes from metastatic nodes. The pres-ence of a focal defect (central low density) or peripheral enhancement is characteristic of malignancy even in normal-sized nodes. A focal defect in an enlarged node is a strong indication of a necrotic node metastasis, although tuberculosis or an abscessed node may mimic this appearance. Central dense or linear enhancement of the hilum of an enlarged node without ring enhancement is usually a distinguishing
A B
Quiet Breathing
Figure 11-49. Transglottic laryngeal squamous cell carcinoma with vocal cord fixation. A, True vocal cords are adducted on an axial contrast-enhanced computed tomography (CECT) obtained during breath holding, with the tumor extending anteriorly and superiorly from the left true cord into adjacent paralaryngeal fat (arrow) and posteriorly into the cricoarytenoid joint (arrowheads). Anterior corner of the calcified left arytenoid cartilage (asterisk) has been eroded by the tumor. B, Repeat axial CECT performed during quiet breathing reveals fixation of the left true cord in midline. Right cord is partially abducted.
m
Figure 11-50. Transglottic squamous cell carcinoma with cartilage invasion. Axial CECT at the true vocal cord level shows an enhancing mass (m) originating in the left vocal cord, crossing the anterior com-missure, and invading the anterior third of the right cord. The tumor has invaded through the anterior thyroid cartilage and displaces the thyroid strap muscles anteriorly (arrowheads).
The retropharyngeal, supraclavicular, and parotid nodes are not included in the level classification. The retropharyngeal nodes lie medial to the internal carotid arteries within 2 cm from the skull base. Supraclavicular nodes lie at the level of, or caudal to, the clavicle and lateral to the carotid arteries. Separation of the supraclavicular nodes from low level IV and level V nodes may be difficult on the transverse images because of the oblique course of the clavicle.
Lymph Nodes: Normal and PathologicCECT remains the gold standard for detecting and classifying cervical lymphadenopathy as benign or malignant. The important considera-tions in radiographic lymph node detection and characterization are location, size, number, clustering, enhancement pattern, calcification, sharpness of margins, and invasion or displacement of adjacent struc-tures. First, the nodes must be detected and localized to a specific nodal chain or level using one of the conventions for labeling node regions discussed previously. Node involvement is described as unilateral or bilateral and in terms of the specific level or chain affected.

E
Chapter 11 n Overview of Diagnostic Imaging of the Head and Neck 165
sign of a reactive node. Nodes larger than 20 to 40 mm without central necrosis often indicate lymphoma or sarcoidosis (Fig. 11-58). Treated lymphomatous nodes may have dystrophic calcification and, rarely, calcium matrix-forming tumors (osteosarcoma, chondrosarcoma) may have radiodense metastases. When margins of an enlarged node with central necrosis are indistinct, extracapsular penetration of the tumor through the node capsule has likely occurred (Fig. 11-59). This sign may decrease the 5-year survival by 50%. The number of nodes involved is important. Multiple nodes suggest a more widespread inflammatory or neoplastic process. Clustering of multiple nodes—sometimes into a seemingly single, complex mass—suggests malignancy and may be palpable as a single large mass. Round, rather than bean-shaped nodes, clusters of nodes, and indistinct margins suggest malig-nancy but are less specific than having a size larger than 15 mm, ring enhancement, or focal defect.
MRI of malignant adenopathy has both advantages and limita-tions compared with CECT. Malignant nodes appear as muscle inten-sity on T1WI, may show ring enhancement on postgadolinium fat-suppressed T1WI, are very bright on STIR, and are usually bright on T2WI (although necrosis may give both a high and low signal on long TR sequences) (Fig. 11-60). Fat-suppressed long TR sequences
Figure 11-53. Thyroid follicular carcinoma. Axial contrast-enhanced computed tomography just below the cricoid shows a large mass with nodular calcification (asterisk) displacing the trachea to the right and distorting the airway. Posteriorly it has invaded the retropharyngeal space (arrow).
Figure 11-54. Parathyroid adenoma. Retrotracheal ectopic parathyroid adenoma (arrowhead) looks similar to the adjacent normal esophagus (arrow) on an axial T1-weighted image.
c
Figure 11-52. Thyroglossal duct cyst. Low-density thyroglossal duct cyst (c) elevates the thyroid strap muscles (asterisk) and laterally displaces the sternocleidomastoid muscle in this axial contrast-enhanced computed tomography.
A B
T J
Figure 11-51. Lingual thyroid gland. A, Densely enhancing mass of ectopic thyroid tissue (T) bulges posteriorly from the tongue at the level of the foramen cecum on the axial contrast-enhanced computed tomography. B, CECT at the upper tracheal level reveals that the thyroid gland is absent from its normal location. Note the pseudotumor of the thrombosed internal jugular vein (J) mimicking ring-enhancing node metastasis.

E
166 Part 2 n General Otolaryngology
parenchyma, skin, masticator space, and parapharyngeal space. Su -prahyoid retropharyngeal nodes may extend laterally into the CS, pos-teriorly into the PVS, anteriorly into the mucosal space, and superiorly into the skull base. The tracheoesophageal nodes may involve the common carotid artery and the internal jugular vein in the CS, the recurrent laryngeal nerve, the visceral space structures of the larynx and thyroid, and the mediastinum.
Invasion of the carotid artery carries a poor prognosis, with a local recurrence rate of 46% and a distant metastatic rate of 56% to 68%. For patients with a tumor involving the carotid artery, the 5-year sur-vival rate decreases to 7%, and the mean survival decreases to less than 1 year. Prolonged survival is possible if the involved carotid artery is resected. The best imaging modality among CECT, MRI, or ultra-sound for evaluating carotid fixation remains controversial.35 Surpris-ingly, criteria for carotid invasion are not well established in the literature. A very high likelihood of carotid invasion exists if the tumor involves 75% or more of the circumference of the carotid whereas invasion is unlikely if the contact of the tumor to the carotid is less than 25% of the circumference of the carotid (see Fig. 3-59). Ultra-
will diminish background fat signal, further improving detection. The STIR image is superior to CECT in sensitivity for any enlarged lymph node, but is nonspecific for metastases. MRI and CECT rely on the same criteria of size, clustering, margin sharpness, and shape for char-acterization of abnormal nodes. The specificity of ring enhancement on CECT is the main advantage of CT for diagnosis of metastases. The same finding of ring enhancement on postgadolinium fat-suppressed T1WI likely represents a focal tumor or central necrosis as well. Oth-erwise, the other MRI sequences described are nonspecific. MRI may better demonstrate invasion of adjacent structures, especially muscles, than does CECT.
Adjacent fat, bone, cartilage, and muscle are commonly com-pressed or invaded with extracapsular spread. Secondary invasion of adjacent structures and anatomic spaces by aggressive lymph node lesions may develop in the carotid sheath structures, skull base, PVS and vertebrae, and mandible. The superficial nodes may invade adja-cent muscle and skin. Internal jugular and spinal accessory nodes may invade the carotid, parapharyngeal fat, prevertebral, and infrahyoid visceral spaces. Parotid nodes may violate the surrounding parotid
A B
c
Figure 11-55. Normal lymph node anatomy. A, In this 8-year-old child, normal lateral retropharyngeal nodes (arrows) lie medial to the internal carotid arteries (c) and demonstrate a moderately high signal on the T2-weighted images. High-signal adenoidal tissue is commonly prominent at this age. B, Multiple mildly enlarged nodes (asterisks) are present in the submandibular, anterior jugular, internal jugular, and spinal accessory lymphatic chains on this contrast-enhanced computed tomography. Note the eccentric fatty hilum (arrows) in two nodes, a potential pitfall in the diagnosis of focal defect in the metastatic node.
A B C
Figure 11-56. Reactive and inflammatory lymph nodes on contrast-enhanced computed tomography (CECT) and magnetic resonance imaging. A, Axial CECT of the hyperplastic nodes in a patient with acquired immunodeficiency syndrome-related complex displays multiple submental nodes (arrowheads) and an enlarged internal jugular node with central hilar enhancement (arrow). B, Small, normal, or reactive lymph nodes (arrows) enhance on this fat saturation postgadolinium T1-weighted image. C, Axial CECT of a tuberculous nodal mass (scrofula) with peripheral enhance-ment and invasion of the sternocleidomastoid muscle (arrowhead) is difficult to distinguish from the cluster of metastatic nodes.

E
Chapter 11 n Overview of Diagnostic Imaging of the Head and Neck 167
obstruction to multiple sinus ostia. The posterior ethmoids and sphe-noid sinus drain under the superior turbinate or sphenoethmoidal recess. The nasal cavity extends from the nares anteriorly to the choana posteriorly, and from the hard palate inferiorly to the cribriform plate superiorly. The midline nasal septum, lateral turbinates, and maxillary and ethmoid sinuses form the walls.
The compartments adjacent to the sinuses that are at risk for invasion by aggressive inflammatory or neoplastic processes include the anterior cranial fossa, orbits, cavernous sinus (from the sphenoid sinus), MS, pterygopalatine (pterygomaxillary) fossa, oral cavity, and anterior soft tissues of the face. These compartments are carefully viewed for dural or brain invasion, optic nerve and extraocular muscle compro-mise, perineural spread into the skull base, or direct extension into the deep compartments of the suprahyoid neck and oral structures. Involve-ment of any one of these secondary compartments can significantly alter treatment planning and surgical approach.
Paranasal SinusesCongenital and developmental anomalies of the sinonasal cavities are sought on all CT examinations. Common anatomic variants include pneumatization or paradoxic curvature of the turbinates, deviated septum, sinus hypoplasia, and Haller air cells (Fig. 11-61). Sinus under-development may range from aplasia to hypoplasia. Pneumatization implies sinus development has occurred. Aeration indicates that the pneumatized portion of the sinus is air-filled. Mucosal thickening or opacification signifies the pneumatized section is filled with soft tissue inflammation or fluid. Either hypoplasia or the reactive new bone formation (chronic inflammation) may cause thickening and sclerosis of the sinus walls.
In general, evaluation of the paranasal sinuses involves assessment of two components: (1) the sinus contents (including the mucosa) and (2) the bony walls. Normal sinus mucosa is very thin and not seen on
sonography is a potentially valuable adjunctive technique capable of demonstrating invasion of the carotid artery.
Sinuses and Skull Base
Nose and Paranasal SinusesThe sinonasal region can be divided into three major regions: the sinuses, the ostiomeatal complex, and the nasal cavity. The paranasal sinuses are mucosal-lined, air-filled cavities that are named after the bones of the face in which they develop. This mucosa is prone to both inflammatory and neoplastic disease. The frontal, maxillary, ethmoid, and sphenoid sinuses all drain through ostia into the nasal cavity. The frontal, maxillary, anterior ethmoid, and middle ethmoid sinuses drain into the semilunar hiatus under the middle turbinate. This area repre-sents the ostiomeatal complex or unit. A small lesion here can cause
m
Figure 11-57. Metastatic node on contrast-enhanced computed tom-ography (CECT). Axial CECT in a patient with a left piriform sinus squamous cell carcinoma (m) and a “normal-sized” 9-mm node (arrow) with a focal defect (ring enhancement with “necrotic” center) is diag-nostic of metastasis.
Figure 11-58. Node involvement by non-Hodgkin’s lymphoma. Axial contrast-enhanced computed tomography shows a very large, homoge-neous spinal accessory node (asterisk) invading both the skin and prevertebral space paraspinous musculature. The absence of central necrosis or focal defects in a mass this large is suggestive but not diagnostic of lymphoma.
c
Figure 11-59. Extracapsular spread in multiple nodes in a patient with tonsillar squamous cell carcinoma. Left submandibular and spinal accessory node metastases (arrows) have typical ring enhancement and central low density on this axial contrast-enhanced computed tomography. The large cluster of metastatic nodes (asterisk) in the left internal jugular chain shows central low-density focal defects. Note the poorly defined infiltrative margins of this mass of nodes characteristic of extracapsular tumor spread. Tumor is invading the sternocleidomas-toid muscle (arrowheads) posterolaterally and prevertebral space medi-ally. About 40% of the left internal carotid artery (c) circumference is surrounded by tumor, which may still allow surgical preservation of the carotid artery.

E
168 Part 2 n General Otolaryngology
bone for important clues such as thickening and sclerosis (chronic sinusitis or hypoplasia), fractures, remodeling (slowly expanding mucocele or neoplasm), or destruction (malignancy or aggressive infec-tion such as mucormycosis).
Deciding which portion of the opacified sinus, sinuses, or nasal cavity contains tumor and which contains obstructed mucous secre-tions is clinically important with a sinus or nasal tumor. The question is more problematic with NCCT or CECT because tumor and sinus secretions are frequently similar in density, and both the tumor and the mucosa may enhance; however, MRI is usually much more informative (Fig. 11-63). Evaluation of this problem requires a knowledge of signal intensity patterns of tumor versus mucus. Sinonasal tumors tend to be low-to-intermediate signal intensity on T1WI and intermediate signal intensity on T2WI, although minor salivary tumors and adenoid cystic carcinoma may be of high signal intensity.36 The highly cellular aggres-
CT or MRI, and the bone is normally thin and delicate in the posterior maxillary, ethmoid, and sphenoid sinuses. CT or MRI readily reveals the presence of a normally aerated sinus, mucosal thickening (chronic sinusitis, retention cysts, or polyps), an air-fluid level (acute sinusitis, intubation, and trauma), or complete opacification (mucocele, trauma, and acute or chronic sinusitis) (Fig. 11-62). The normally delicate posterolateral maxillary sinus wall is a much better indicator of bony sclerosis than the anterior wall. The normally thick anterior wall of the maxillary (and frontal) sinus may range from 1 to 3 mm (see Fig. 11-12A and C). Beginning observers frequently forget to assess the
A
c
B C
Figure 11-60. Metastatic nodes and focal defects on magnetic resonance imaging. A, Axial T2-weighted image at the soft-palate level depicts high-signal intensity at the right tonsillar squamous cell carcinoma (asterisk). A 10-mm metastatic lateral retropharyngeal node of Rouvière with a high-signal intensity central defect (arrow) lies medial to the internal carotid artery (c). B, Left jugular digastric node (arrowheads) with low-signal intensity focal defect (arrow) on gadolinium-enhanced T1-weighted image is analogous to focal defect seen with metastases on a contrast-enhanced computed tomography. C, Axial short T1 inversion recovery (STIR) image achieves excellent fat suppression of subcutaneous fat. Metastatic neuroblastoma is demonstrated in the bright internal jugular and spinal accessory nodes (arrows). Note the bright appearance of the normal tonsillar and parotid gland tissues on STIR.
e
m
t
i
u
t
H
Figure 11-61. Normal ostiomeatal complex. Coronal noncontrast com-puted tomography demonstrates the ostiomeatal complex to the best advantage. Normal mucociliary drainage is from the maxillary sinus up through the infundibulum (i) and maxillary sinus ostium into the middle meatus (m). Ethmoid bulla (e) and uncinate process (u) form the lateral and medial walls of the infundibulum, respectively. Normal anatomic variant of a Haller air cell (H) underlying the orbit causes a mild nar-rowing of the left infundibulum. Smaller Haller cell is present on the right. Note the mildly asymmetric mucosa of the turbinates (t), which is part of the normal nasal cycle.
Figure 11-62. Acute and chronic sinusitis. Postgadolinium fat satura-tion T1-weighted image demonstrates an air-fluid level (arrow) in the right maxillary sinus and is diagnostic of acute sinusitis (superimposed on chronic sinusitis). Left maxillary sinus is filled with low-intensity secretions and has a peripheral ring of enhancing inflamed mucosa (arrowheads) typical of chronic sinusitis. Mastoid air cells and the left middle ear cavity (asterisk), which normally appear black, are filled with enhancing inflammatory tissue.

E
Chapter 11 n Overview of Diagnostic Imaging of the Head and Neck 169
bulla, paradoxic curvature of the middle turbinate); (2) the location of obstructed air cells; (3) the extent of the chronic or acute sinus disease and whether this pattern is consistent with the obstruction of the osti-omeatal complex; and (4) the presence of any earlier surgical alterations (e.g., Caldwell-Luc, internal or external ethmoidectomy, uncinectomy). Ostiomeatal complex obstruction may result from anatomic compres-sion, mucosal inflammation, polyps, benign neoplasms, and SCCA. Mucoceles, indicated by sinus expansion and low-density mucus on CECT, or by concentric rings of variably desiccated mucus in an expanded sinus on MRI, are a complication of chronic sinus obstruc-tion (Fig. 11-64). A mucopyocele only shows peripheral enhancement when it is infected, and is then called a pyomucocele.
Nasal CavityThe nasal cavity is occasionally the site of symptomatic disease. Ana-tomic variants include choanal atresia, concha bullosa, paradoxical cur-vature of the middle turbinate, wide nasal cavity from a hypoplastic maxillary sinus, and septal deviation. The nasal mucosa of the tur-binates may be asymmetric in thickness because of the normal nasal cycle or the presence of polyps or inflammation. Obstruction of the ostiomeatal complex and other sinuses may occur with benign (antro-choanal polyp, neural tumors, inverting papilloma) or malignant (SCC, adenocarcinoma, adenoid cystic carcinoma) tumors (Fig. 11-65). If a nasal mass is present, the extent of the mass within the nasal cavity, adjacent sinuses, or orbits, or involvement of the cribriform plate, may be determined by coronal CECT or sagittal and coronal MRI because this may affect the surgical approach and postoperative therapy.
sive neoplasms tend to have a lower water content and are less bright on T2WI. Tumors enhance moderately and, more or less, uniformly with gadolinium. Sinus secretions are complex in their patterns. Hydrated, nonviscous mucus is low intensity on T1WI and high inten-sity on T2WI. Desiccated, viscous mucus tends to be high intensity on T1WI and low-to-intermediate intensity on T2WI. Extremely desic-cated mucus may lack signal intensity on T1WI or T2WI, simulating bone or air. Both an obstructed sinus and an expansile mucocele fre-quently have two or more layers of mucus in a concentric ring pattern with the most desiccated, viscous secretions located centrally. The peripheral mucosa of an obstructed sinus enhances in chronic sinusitis or with a pyomucocele, but does not enhance with a simple mucopy-ocele. The presence of tumor versus obstructed secretion is best solved by comparing the respective change in signal intensity of each compo-nent on the T1WI, T2WI, and post gadolinium T1WI, and is rarely answered by a single sequence. A minimum of a T1WI and a T2WI is required.
Ostiomeatal ComplexThe ostiomeatal complex has become an area of active radiologic and pathophysiologic investigation with the development of endoscopic sinus surgery for inflammatory sinus disease. Coronal thin section NCCT is the best means of demonstrating the anatomy of this area (see Fig. 11-61). Pertinent observations include: (1) the individual’s sinonasal anatomy and the presence of any anatomic variants (hypo-plastic maxillary sinus, concha bullosa, agger nasi air cells, Haller air cells, deviated septum, deviated uncinate process, prominent ethmoid
A B C
Figure 11-63. Comparison of computed tomography and magnetic resonance imaging for separating sinonasal small cell tumor from sphenoid pyomucocele. A, Axial contrast-enhanced computed tomography shows a mildly enhancing mass (asterisk) in the left posterior nasal cavity and ethmoids, which appears to extend into the sphenoid sinus. Sphenoid sinus contents actually represent two different viscosities of mucus, with higher density mucus anteriorly (arrowhead) correlating with most desiccated or viscous mucus. B, Axial noncontrast T1-weighted image demon-strates an intermediate-signal nasal tumor. Anterior, high-signal, viscous mucus (arrowhead) in the sphenoid sinus is clearly discriminated from the nasal tumor anteriorly and from the low-signal hydrated mucus (arrow) posteriorly. C, On axial noncontrast T2-weighted image, the nasal tumor signal is intermediate, similar to the brain. Anterior viscous mucus (arrowhead) in the sphenoid sinus has reversed signal to become low intensity, whereas hydrated mucus (arrow) posteriorly has now become very bright.
A B
Figure 11-64. Simple mucocele on magnetic resonance imaging. A, Frontal mucocele on axial T1-weighted image expands the right frontal sinus and has a very high-signal central viscous or desiccated component (arrowheads) and a lower-intensity peripheral concentric ring of less viscous mucus (arrow). B, Axial T2-weighted image reversal of signal intensities in concentric rings, with peripheral hydrated mucus (arrow) becomes bright and the central viscous mucus (arrowheads) loses signal.

E
170 Part 2 n General Otolaryngology
planes, looking for fractures, normal fissures and canals, and displace-ments. However, the quickest way to locate sinus fractures is to search for indirect signs of fracture (Fig. 11-66): an air-fluid level, complete opacification of a sinus with blood, and the presence of gas outside the sinus (pneumocephalus, subcutaneous emphysema, infratemporal fossa, or orbital gas). Identification of the fractures allows determina-
Facial TraumaFacial trauma is briefly included here because of the intimate relation-ship of the facial bones and sinuses. Thin-section axial and direct coronal NCCT is the ideal method for determining the full extent of facial trauma. One strategy for evaluating the extent of sinus trauma is to visually trace each bony outline on consecutive slices in both imaging
A
C
B
Figure 11-65. Invasive small cell carcinoma of cribriform plate and orbits. A, Coronal contrast-enhanced computed tomography shows (more clearly than magnetic resonance imaging) a mass centered in the posterior ethmoid sinuses with bone destruction of the cribriform plate (arrow) and medial orbits. The tumor has invaded both orbits and maxillary sinuses (arrowheads). B, Anterior cranial fossa extension (arrow) through the cribriform plate and orbital invasion (arrowheads) are well seen on this coronal fat saturation postgadolinium T1-weighted image. C, Sagittal fat saturation postgadolinium T1WI depicts the anterior-posterior dimension of the tumor and extension of enhancing tumor (arrow) through the low-intensity cribriform plate and planum sphenoidale (arrowheads).
A B
Figure 11-66. Medial and lateral orbital blowout fractures. A, Coronal noncontrast computed tomography (NCCT) with soft tissue windows shows an orbital blowout fracture with displacement of the floor (arrow), distortion of the inferior rectus, and herniation of orbital fat through the orbital floor defect. Both intraconal hemorrhage and high-density maxillary sinus hemorrhagic air-fluid level are well demonstrated on these windows. Medial orbital blowout fracture (arrowhead) is suspected as well. B, Axial NCCT using bone windows shows opacified left anterior ethmoid air cells that help direct the observer to the displaced medial orbital fracture (arrowheads).
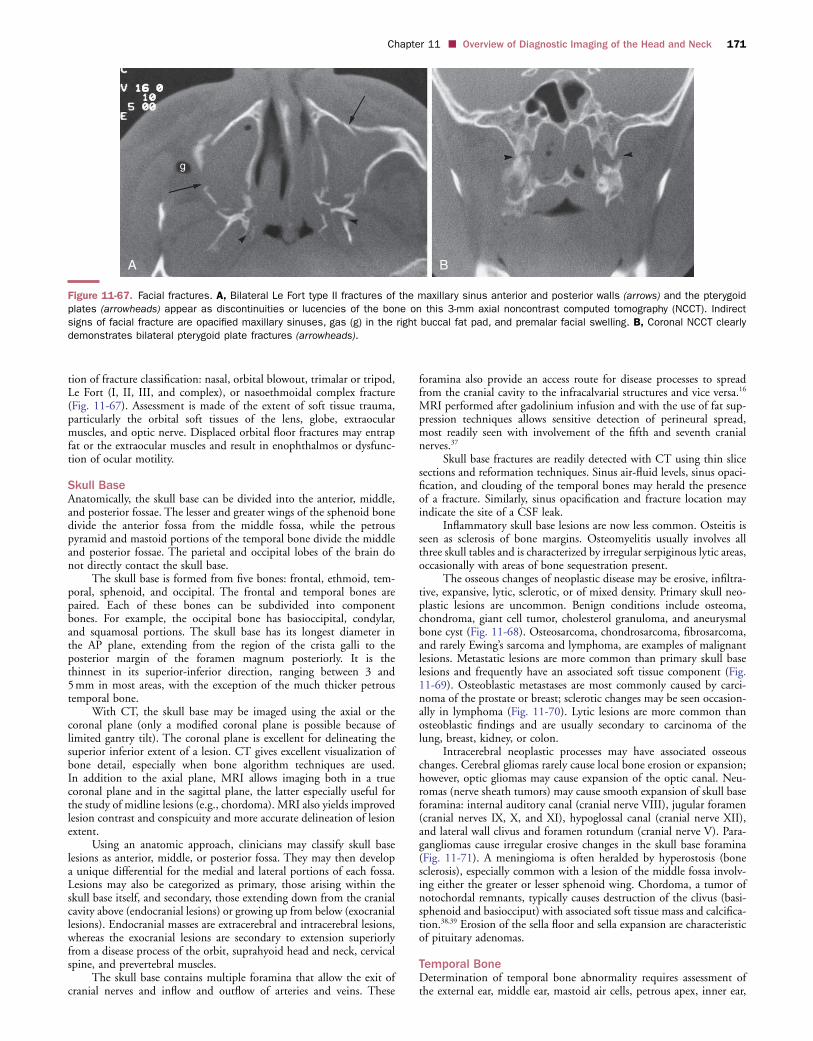
E
Chapter 11 n Overview of Diagnostic Imaging of the Head and Neck 171
foramina also provide an access route for disease processes to spread from the cranial cavity to the infracalvarial structures and vice versa.16 MRI performed after gadolinium infusion and with the use of fat sup-pression techniques allows sensitive detection of perineural spread, most readily seen with involvement of the fifth and seventh cranial nerves.37
Skull base fractures are readily detected with CT using thin slice sections and reformation techniques. Sinus air-fluid levels, sinus opaci-fication, and clouding of the temporal bones may herald the presence of a fracture. Similarly, sinus opacification and fracture location may indicate the site of a CSF leak.
Inflammatory skull base lesions are now less common. Osteitis is seen as sclerosis of bone margins. Osteomyelitis usually involves all three skull tables and is characterized by irregular serpiginous lytic areas, occasionally with areas of bone sequestration present.
The osseous changes of neoplastic disease may be erosive, infiltra-tive, expansive, lytic, sclerotic, or of mixed density. Primary skull neo-plastic lesions are uncommon. Benign conditions include osteoma, chondroma, giant cell tumor, cholesterol granuloma, and aneurysmal bone cyst (Fig. 11-68). Osteosarcoma, chondrosarcoma, fibrosarcoma, and rarely Ewing’s sarcoma and lymphoma, are examples of malignant lesions. Metastatic lesions are more common than primary skull base lesions and frequently have an associated soft tissue component (Fig. 11-69). Osteoblastic metastases are most commonly caused by carci-noma of the prostate or breast; sclerotic changes may be seen occasion-ally in lymphoma (Fig. 11-70). Lytic lesions are more common than osteoblastic findings and are usually secondary to carcinoma of the lung, breast, kidney, or colon.
Intracerebral neoplastic processes may have associated osseous changes. Cerebral gliomas rarely cause local bone erosion or expansion; however, optic gliomas may cause expansion of the optic canal. Neu-romas (nerve sheath tumors) may cause smooth expansion of skull base foramina: internal auditory canal (cranial nerve VIII), jugular foramen (cranial nerves IX, X, and XI), hypoglossal canal (cranial nerve XII), and lateral wall clivus and foramen rotundum (cranial nerve V). Para-gangliomas cause irregular erosive changes in the skull base foramina (Fig. 11-71). A meningioma is often heralded by hyperostosis (bone sclerosis), especially common with a lesion of the middle fossa involv-ing either the greater or lesser sphenoid wing. Chordoma, a tumor of notochordal remnants, typically causes destruction of the clivus (basi-sphenoid and basiocciput) with associated soft tissue mass and calcifica-tion.38,39 Erosion of the sella floor and sella expansion are characteristic of pituitary adenomas.
Temporal BoneDetermination of temporal bone abnormality requires assessment of the external ear, middle ear, mastoid air cells, petrous apex, inner ear,
tion of fracture classification: nasal, orbital blowout, trimalar or tripod, Le Fort (I, II, III, and complex), or nasoethmoidal complex fracture (Fig. 11-67). Assessment is made of the extent of soft tissue trauma, particularly the orbital soft tissues of the lens, globe, extraocular muscles, and optic nerve. Displaced orbital floor fractures may entrap fat or the extraocular muscles and result in enophthalmos or dysfunc-tion of ocular motility.
Skull BaseAnatomically, the skull base can be divided into the anterior, middle, and posterior fossae. The lesser and greater wings of the sphenoid bone divide the anterior fossa from the middle fossa, while the petrous pyramid and mastoid portions of the temporal bone divide the middle and posterior fossae. The parietal and occipital lobes of the brain do not directly contact the skull base.
The skull base is formed from five bones: frontal, ethmoid, tem-poral, sphenoid, and occipital. The frontal and temporal bones are paired. Each of these bones can be subdivided into component bones. For example, the occipital bone has basioccipital, condylar, and squamosal portions. The skull base has its longest diameter in the AP plane, extending from the region of the crista galli to the posterior margin of the foramen magnum posteriorly. It is the thinnest in its superior-inferior direction, ranging between 3 and 5 mm in most areas, with the exception of the much thicker petrous temporal bone.
With CT, the skull base may be imaged using the axial or the coronal plane (only a modified coronal plane is possible because of limited gantry tilt). The coronal plane is excellent for delineating the superior inferior extent of a lesion. CT gives excellent visualization of bone detail, especially when bone algorithm techniques are used. In addition to the axial plane, MRI allows imaging both in a true coronal plane and in the sagittal plane, the latter especially useful for the study of midline lesions (e.g., chordoma). MRI also yields improved lesion contrast and conspicuity and more accurate delineation of lesion extent.
Using an anatomic approach, clinicians may classify skull base lesions as anterior, middle, or posterior fossa. They may then develop a unique differential for the medial and lateral portions of each fossa. Lesions may also be categorized as primary, those arising within the skull base itself, and secondary, those extending down from the cranial cavity above (endocranial lesions) or growing up from below (exocranial lesions). Endocranial masses are extracerebral and intracerebral lesions, whereas the exocranial lesions are secondary to extension superiorly from a disease process of the orbit, suprahyoid head and neck, cervical spine, and prevertebral muscles.
The skull base contains multiple foramina that allow the exit of cranial nerves and inflow and outflow of arteries and veins. These
A
g
B
Figure 11-67. Facial fractures. A, Bilateral Le Fort type II fractures of the maxillary sinus anterior and posterior walls (arrows) and the pterygoid plates (arrowheads) appear as discontinuities or lucencies of the bone on this 3-mm axial noncontrast computed tomography (NCCT). Indirect signs of facial fracture are opacified maxillary sinuses, gas (g) in the right buccal fat pad, and premalar facial swelling. B, Coronal NCCT clearly demonstrates bilateral pterygoid plate fractures (arrowheads).

E
172 Part 2 n General Otolaryngology
brane thickening (otitis media) may all be characterized (Fig. 11-72). The radiographic approach to the mastoid air cells and petrous apex is similar to that of the paranasal sinuses, consisting of the evaluation of the mastoid and petrous apex soft tissue contents and the bony walls. Assessment is made of development or pneumatiza-tion of these regions (pneumatization or opacification by soft tissue), the bony septa and walls (hypoplasia or sclerosis from chronic otomastoiditis), the margins of the mastoid or petrous apex (expanded by a primary or secondary cholesteatoma [Fig. 11-73] or a cholesterol granuloma), or bone destruction (SCC, malignant fibrous histiocytoma, glomus tumor). MRI may complement CT for assessment of larger petrous apex or mastoid masses. A normal unpneu-matized, fatty (marrow-filled) petrous apex is high signal on T1WI and low signal on T2WI, but a cholesterol granuloma is high signal on T1WI and T2WI from the methemoglobin (see Fig. 11-68). Mucus in an air cell is low intensity on T1WI, is very high intensity on T2WI, and enhances mildly with gadolinium. A primary cholesteatoma is similar to CSF in intensity, appearing low intensity on T1WI and moderately high signal on T2WI, and does not enhance with gadolin-ium. Postoperative findings encountered on CT and MRI include metallic ossicular prostheses, cochlear implants, and various types of mastoidectomies.
The inner ear structures are best assessed by high-resolution CT with attention to anatomic variants and bone density. A saccular ves-
IAC, facial nerve canal, and vascular compartment (jugular foramen and carotid canal). The adjacent compartments into which an aggres-sive temporal bone lesion can spread, or from which a lesion can invade the temporal bone, include cerebellopontine angle (meningioma, acoustic schwannoma), middle cranial fossa (geniculate schwannoma, cholesteatoma), jugular foramen (schwannoma, paraganglioma, glomus tumor), skull base and clivus (chordoma), carotid space (aneurysm, schwannoma), parotid space (adenoid cystic carcinoma), and soft tissues of the external ear and scalp (SCC).
For the external ear and external auditory canal (EAC), the search for abnormality may be accomplished with either high-resolution CT or MRI. Abnormal development (external ear hypoplasia, fibrous or bony EAC atresia), soft tissue opacification (cerumen, EAC chole-steatoma, SCC), bone erosion (EAC cholesteatoma, mucormycosis, squamous cell carcinoma), bone formation (exostoses), or scutum erosion (par flaccida cholesteatoma) can easily be detected and their extent defined by CT. MRI may add additional information on soft tissue involvement below the skull base or on infiltration of the auricle and scalp.
The middle ear is best evaluated with high-resolution CT. Ossic-ular chain anomalies (fusion, dislocation, prosthesis, stapedial foot-plate sclerosis), air-fluid level (trauma, acute otitis media), soft tissue opacification (acute or chronic otitis media, cholesteatoma, trauma, chronic endotracheal or nasogastric intubation), and tympanic mem-
A B
DD E
C
Figure 11-68. Cholesterol granuloma. A and B, Axial and coronal contrast-enhanced computed tomography (CECT) images demonstrate expansile lesion of the right petrous apex and greater wing of sphenoid. Lesion is homogeneously low density in nature. Displaced right internal carotid artery (arrows) lies in the lateral aspect of the lesion. C, Axial CECT bone algorithm image using bone windows demonstrates truncation of the anteromedial portion of the right petrous temporal bone (arrow) and adjacent posterolateral portion of the sphenoid bone. The lesion bulges into the right sphenoid sinus. D, Coronal T1-weighted image and, E, T2-weighted image demonstrate a lesion that is high intensity on both sequences, consistent with methemoglobin. Right internal carotid artery is noted in the midlateral portion of the lesion (arrow). The lesion extends above and below the skull base and invaginates into the sphenoid sinus.

E
Chapter 11 n Overview of Diagnostic Imaging of the Head and Neck 173
(acoustic schwannoma, surgery) or narrowing (bone dysplasia, hyper-ostosis from a meningioma) of the IAC. The facial nerve canal may be traced along its entire course in both axial and coronal planes for areas of erosion (facial neuroma, paraganglioma, hemangioma) or abnormal position (anterior location of mastoid segment with EAC atresia). Gadolinium-enhanced MRI is the modality of choice for evaluating the seventh and eighth cranial nerves within the IAC and temporal bone (schwannomas of the facial nerve, of the vestibular nerve, or within the cochlea) or for demonstrating seventh cranial nerve inflammation (Bell’s palsy) (Figs. 11-75 and 11-76). Note that the facial nerves may normally enhance mildly and usually symmetrically within the facial nerve canal. Asymmetric enhancement is more likely to be abnormal.
Postoperative Neck and FaceA preoperative CECT or MRI is extremely helpful for interpreting the postoperative neck, skull base, or face for sites of concern and potential tumor recurrence. Likewise, a baseline CECT or MRI 3 to 6 months after surgery and radiation further improves the ability of imaging to detect posttreatment tumor recurrence. The posterior cervical space is the most frequently altered neck space, and part or all of its contents may be resected for staging and treatment of head and neck carcinoma. Note is made of missing structures.40 A radical neck dissection (Fig. 11-77A) removes the sternocleidomastoid muscle, internal jugular vein, regional lymph nodes, and most of the fibrofatty tissue that comprises this space. Modified radical, functional, and supraomohyoid neck dis-sections remove less.
The oral cavity and face also are affected by surgery. Facial trauma is frequently treated by internal fixation with metallic screws and plates. Internal fixation also is performed as part of composite reactions where the mandible is split, or when the mandible is partially resected for invasion by tumor. Metal wires, screws, and plates may cause artifacts obscuring sites of posttraumatic CSF leak or potential tumor recur-rence. Sinus and palate tumors may require resection of the maxilla, palate, orbital walls and soft tissue, and cribriform plate. The fat, muscle, or bone contained in free flaps, myocutaneous flaps, and oste-ocutaneous flaps placed in the surgical cavity further complicates image interpretation (see Fig. 11-77). Laryngeal surgery may remove parts or all of the larynx, often with placement of a tracheostomy. The remain-ing soft tissues of the collapsed visceral space are difficult to accurately evaluate.
Radiotherapy frequently causes an edematous pattern, character-ized on CT by a streaky increase in the density of the subcutaneous, parapharyngeal, and posterior cervical space fat planes (Fig. 11-78A). On MRI it may have an increased signal on T2WI. The mucosal space of the pharynx and larynx may also develop swelling and edema,
tibule is one of the more common congenital anomalies. A cochlea with less than 2 1
2 to 234 turns represents a Mondini malformation (Fig.
11-74). The basal turn of the cochlea and round window may be identified on both axial and coronal CT images. The horizontal (lateral) semicircular canal cortex may be eroded by a cholesteatoma. The oval window and foot plate of the stapes are thickened in stapedial otoscle-rosis, and the ring of the otic capsule is demineralized in labyrinthine otosclerosis (otospongiosis). The entire petrous bone may be abnor-mally low density with dysplasias such as osteogenesis imperfecta or sclerotic in osteopetrosis and Paget’s disease. Inflammatory or neoplas-tic lesions may involve the cochlea and vestibule without obvious bony changes on CT; however, MRI with gadolinium-enhanced T1WI may show an enhancing lesion.
The IAC and facial nerve canals are best evaluated by high-reso-lution CT for bony detail and by gadolinium-enhanced MRI for the soft tissue abnormality. On CT, the findings might include widening
Figure 11-69. Skull base metastasis from adenocarcinoma of the breast. Axial noncontrast computed tomography demonstrates a meta-static tumor infiltrating and destroying a majority of the middle fossa. Clivus (arrow) and anteromedial left temporal bone (arrowhead) are especially affected.
AA
g
B
Figure 11-70. Metastatic prostate carcinoma to left orbit. A, Axial contrast-enhanced computed tomography (CECT) demonstrates sclerotic metastasis of the posterolateral margin of the left orbit (asterisk). Small soft tissue component (arrow) lies deep to the hyperostosis, displacing the lateral rectus muscle medially. B, Coronal CECT with bone settings demonstrates a marked sclerotic reaction of the superior lateral portion of the left orbit. Intraorbital volume is decreased.

E
174 Part 2 n General Otolaryngology
appearing as diffuse mucosal thickening and enhancement on CECT, while MRI may show high signal on long TR sequences and on gado-linium-enhanced T1WI (see Fig. 11-78B). Postradiation edema, par-ticularly of the larynx and pharynx, may mimic recurrent neoplasm for as long as 6 months to 7 years after radiotherapy.41 Finally, treated lymph nodes may decrease in size or totally disappear, leaving a “dirty fat” appearance.
Recurrent tumor spread often produces strands or nodules of soft tissue density within or replacing the normal fat planes.
Figure 11-71. Glomus tumor (paraganglioma) of the right petrous temporal bone. Axial contrast-enhanced computed tomography with bone windows demonstrates an infiltrative destructive lesion of the middle and superior portions of the right petrous temporal bone (arrow). Poorly defined margin of the lesion is characteristic of a glomus tumor. Soft tissue mass (arrowheads) is noted in the right cerebello-pontine angle cistern and in the inferior portion of the right middle ear cavity (asterisk). Previous right mastoidectomy has been performed.
Figure 11-72. Transverse petrous fracture with ossicular dislocation. High-resolution 1.5-mm noncontrast computed tomography using a bone algorithm and bone windows shows a transverse petrous fracture (arrowheads) extending through the mastoid bone and semicircular canals. Ossicular dislocation of the head of malleus from its articula-tion with the fractured body of incus (arrow) is seen. Middle ear opaci-fication also confirms presence of temporal bone trauma.
c
Figure 11-73. Pars flaccida cholesteatoma. Middle ear cholesteatoma (c) expands the mastoid antrum and epitympanic recess on this axial noncontrast computed tomography. The absence of incus and soft tissue abutting the head of malleus (arrow) confirm ossicular erosion.
Figure 11-74. Mondini malformation. Saccular combined vestibule and cochlea (arrowhead) reveal a severe form of Mondini malformation on this axial noncontrast computed tomography.
However, CECT has difficulty detecting small (less than 1 cm) or mucosal based tumors, and reliably differentiating between recurrent carcinoma and fibrosis or edema. A new bulky, ring-enhancing mass, local tissue invasion, or further bone destruction is a strong sign of recurrent tumor. MRI is reportedly capable of distinguishing tumor from radiation-induced fibrosis in some cases. Posttreatment fibrosis or scarring is similar to or lower in signal than muscle on all sequences (particularly on T2WI), is usually linear, is not masslike, and may enhance mildly in a linear fashion. MRI is superior to CT (particularly NCCT) in discrimination of recurrent tumor from muscle and vascu-lar structures. In the posttreatment neck, gadolinium-enhanced MRI may have the potential to identify tumor recurrence and allow separation of tumor from fibrosis because recurrent tumor may ring-enhance, a pattern not seen with scar. Finally, PET/CT is better able to differentiate the metabolically active tumor tissue from postoperative changes.
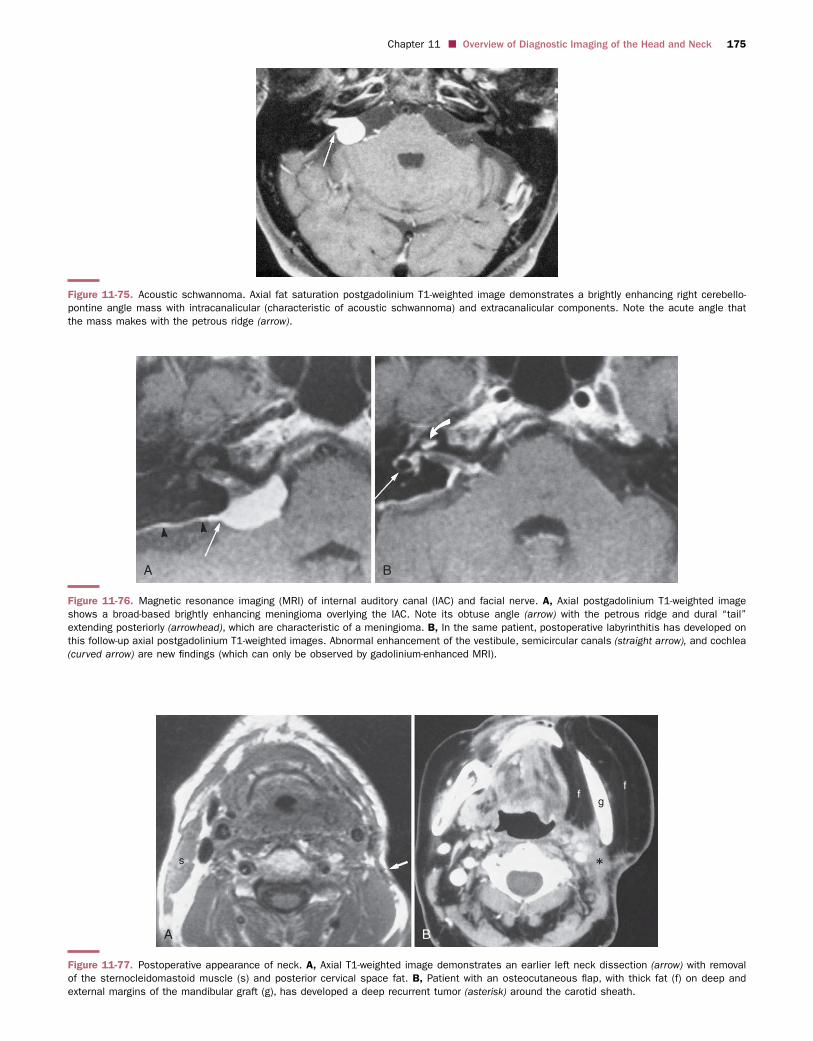
E
Chapter 11 n Overview of Diagnostic Imaging of the Head and Neck 175
Figure 11-75. Acoustic schwannoma. Axial fat saturation postgadolinium T1-weighted image demonstrates a brightly enhancing right cerebello-pontine angle mass with intracanalicular (characteristic of acoustic schwannoma) and extracanalicular components. Note the acute angle that the mass makes with the petrous ridge (arrow).
A B
Figure 11-76. Magnetic resonance imaging (MRI) of internal auditory canal (IAC) and facial nerve. A, Axial postgadolinium T1-weighted image shows a broad-based brightly enhancing meningioma overlying the IAC. Note its obtuse angle (arrow) with the petrous ridge and dural “tail” extending posteriorly (arrowhead), which are characteristic of a meningioma. B, In the same patient, postoperative labyrinthitis has developed on this follow-up axial postgadolinium T1-weighted images. Abnormal enhancement of the vestibule, semicircular canals (straight arrow), and cochlea (curved arrow) are new findings (which can only be observed by gadolinium-enhanced MRI).
A
s
gf
f
B
Figure 11-77. Postoperative appearance of neck. A, Axial T1-weighted image demonstrates an earlier left neck dissection (arrow) with removal of the sternocleidomastoid muscle (s) and posterior cervical space fat. B, Patient with an osteocutaneous flap, with thick fat (f) on deep and external margins of the mandibular graft (g), has developed a deep recurrent tumor (asterisk) around the carotid sheath.

E
176 Part 2 n General Otolaryngology
Rydberg J, Liang Y, Teague SD. Fundamentals of multichannel CT. Radiol Clin
North Am. 2003;41:465-474.
Som PM. Detection of metastasis in cervical lymph nodes: CT and MR criteria
and differential diagnosis. AJR Am J Roentgenol. 1992;158:961-969.
Som PM, Curtin HD, Mancuso AA. Imaging-based nodal classification for
evaluation of neck metastatic adenopathy. AJR Am J Roentgenol.
2000;174:837-844.
Veit-Haibach P, Luczak C, Wanke I, et al. TNM staging with FDG-PET/CT
in patients with primary head and neck cancer. Eur J Nucl Med Mol Imaging.
2007;34:1953-1962.
Yousem DM, Som PM, Hackney DB, et al. Central nodal necrosis and ext-
racapsular neoplastic spread in cervical lymph nodes: MR imaging versus
CT. Radiology. 1992;182:753-759.
SUGGESTED READINGS
Babbel RW, Smoker WRK, Harnsberger HR. The visceral space: the unique
infrahyoid space. Semin Ultra CT MR. 1991;12:204-223.
Bitar R, Leung G, Perng R, et al. MR pulse sequences: what every radiologist
wants to know but is afraid to ask. Radiographics. 2006;26:513-537.
Castelijns JA, van den Brekel MW. Imaging of lymphadenopathy in the neck.
Eur Radiol. 2002;12:727-738.
Curtin HD. Separation of the masticator space from the parapharyngeal space.
Radiology. 1987;163:195.
Davis WL, Harnsberger HR, Smoker WR, Watanabe AS. Retropharyngeal
space: evaluation of normal anatomy and diseases with CT and MR imaging.
Radiology. 1990;174:59.
Fakhry N, Barberet M, Lussato D, et al. [Role of [18]-FDG PET/CT in the
initial staging of head and neck cancers]. Rev Laryngol Otol Rhinol (Bord)
2007;128:3-9.
AA
aa
B
Figure 11-78. Radiation changes in neck. A, Axial contrast-enhanced computed tomography (CECT) demonstrates streaky densities in fat through-out the superficial cervical and anterior cervical spaces (arrows) and a thickening of the platysma muscle (arrowhead). B, Different patient who had radiation therapy for glottic carcinoma has developed a thickening of the epiglottis and aryepiglottic folds (a) on this axial CECT. This finding may persist for many months after therapy.
For complete list of references log onto www.expertconsult.com.