Imaging of Acute Ischemicand Hemorrhagic Stroke · Imaging of Acute Ischemicand Hemorrhagic Stroke....
40
Dr Richard Aviv Associate Professor University of Toronto, Division of Neuroradiology, Sunnybrook Health Sciences Center Imaging of Acute Ischemic and Hemorrhagic Stroke
Transcript of Imaging of Acute Ischemicand Hemorrhagic Stroke · Imaging of Acute Ischemicand Hemorrhagic Stroke....

Dr Richard AvivAssociate Professor University of Toronto, Division of Neuroradiology,
Sunnybrook Health Sciences Center
Imaging of Acute
Ischemic and
Hemorrhagic
Stroke

Disclosures
• None
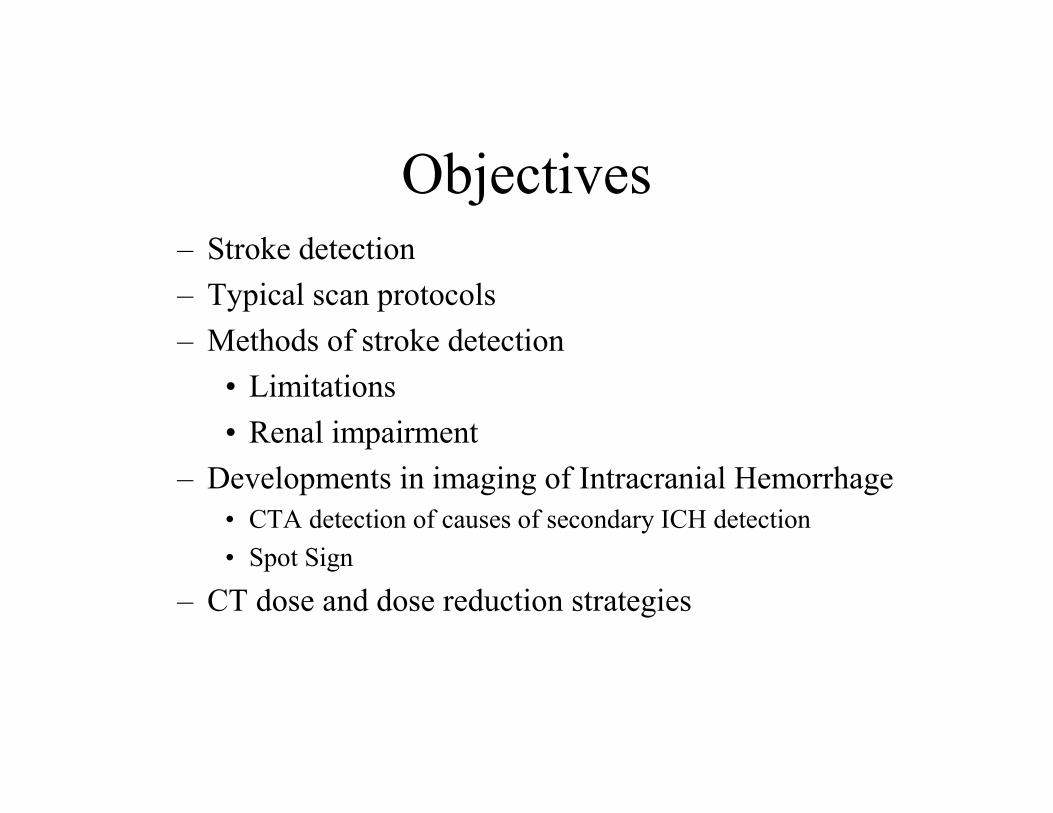
Objectives– Stroke detection
– Typical scan protocols
– Methods of stroke detection
• Limitations
• Renal impairment
– Developments in imaging of Intracranial Hemorrhage
• CTA detection of causes of secondary ICH detection
• Spot Sign
– CT dose and dose reduction strategies

Detecting infarct• Reassurance prior to
treatment
• The larger the initial infarct
– Risk of hemorrhagic
transformation
• Progressive increased risk with
infarct size 1
– Size of final infarct2
– Final clinical outcome3
1) Ann Neurology 2008; 63:52 2)Patel S. JAMA 2001; 286:2830 3) Neurology 1996;47:366 4) NINDS
NEJM 1995;33:1581
<10ml
10-
100ml
>100ml
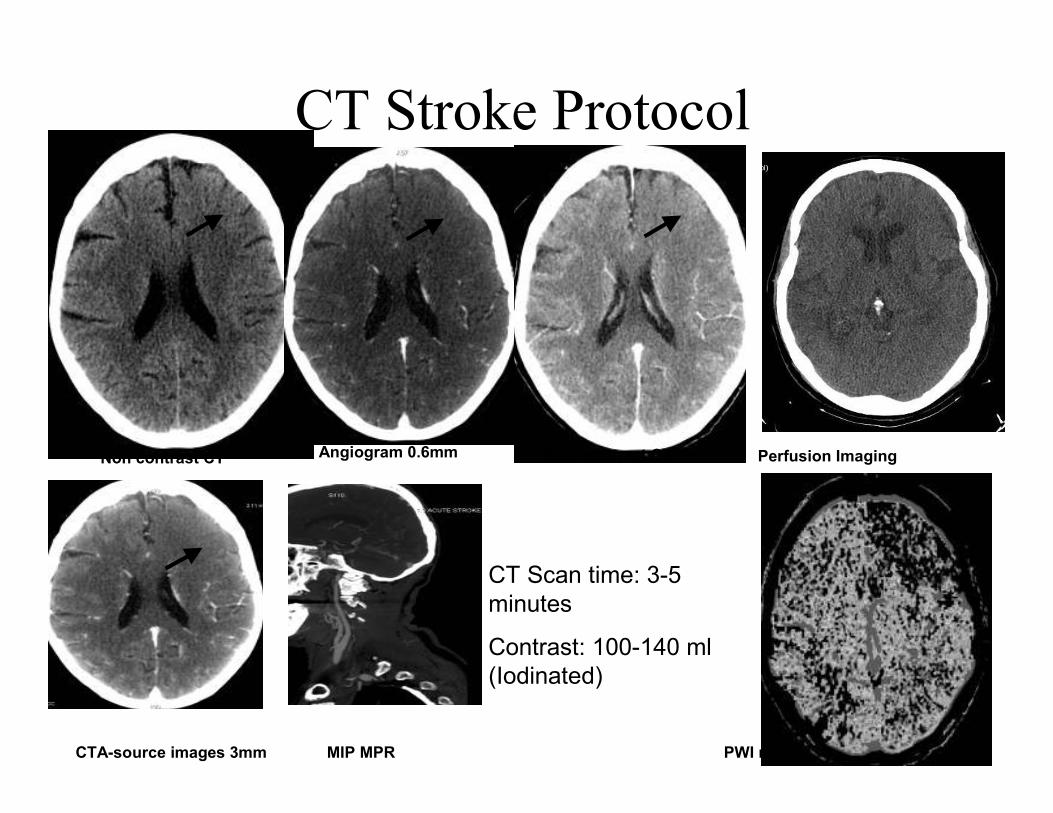
CT Stroke Protocol
Post contrast CT
CTA-source images 3mm MIP MPR
CT Scan time: 3-5
minutes
Contrast: 100-140 ml
(Iodinated)
Non contrast CT CT Angiogram 0.6mm
PWI maps
Perfusion Imaging

1) Radiology 1988;168:463 2) Radiology 1990;176:801; 3) NEJM 1995;33:1581 4) JAMA 1995;274:1017 5) JAMA 2001;286:2830
Loss of Lentiform nucleus1 Loss of Insular ribbon2 and grey/ white differentiation
CT stroke detection
Proven performance (NINDS,ECASS 3,4)
Sensitivity <3hrs 40-60%5
Specificity 85%, PPV 96%, NPV 27%
Earliest time to detection 45 minutes

Strategies to improve CT detection
Stroke window
sensitivity 20%6
CTA-SI
sensitivity 20%7
CTP maps
sensitivity 20%8
WW 35 WL 35

• 191 acute stroke presentations
– 4 blinded inexperienced reviewers
– Combined clinical/ radiological outcome
measure
– LOC score for stroke presence: 1-5
– Etiology
• Stroke present 123 (64%)
• TIA 35 (18%)
• Mimic 32 (17%)
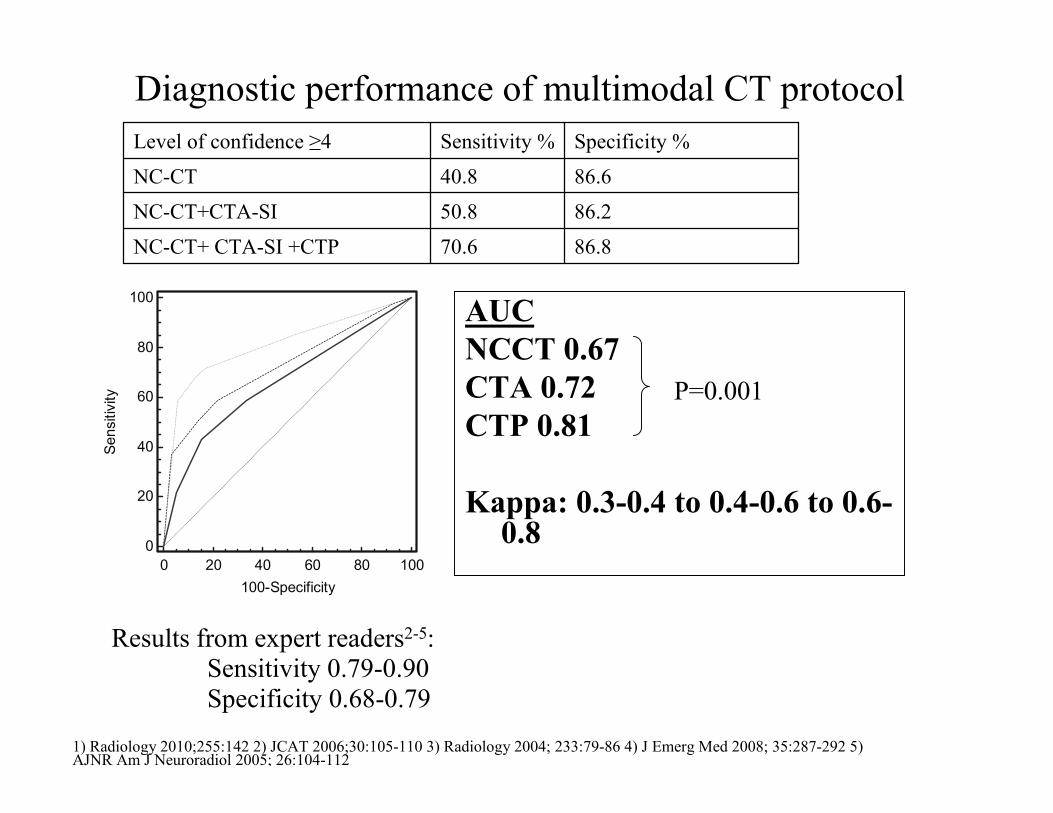
Diagnostic performance of multimodal CT protocol
AUC
NCCT 0.67
CTA 0.72
CTP 0.81
Kappa: 0.3-0.4 to 0.4-0.6 to 0.6-0.8
86.870.6NC-CT+ CTA-SI +CTP
86.250.8NC-CT+CTA-SI
86.640.8NC-CT
Specificity %Sensitivity %Level of confidence ≥4
0 20 40 60 80 100
100
80
60
40
20
0
100-Specificity
Sensitiv
ity P=0.001
Results from expert readers2-5: Sensitivity 0.79-0.90Specificity 0.68-0.79
1) Radiology 2010;255:142 2) JCAT 2006;30:105-110 3) Radiology 2004; 233:79-86 4) J Emerg Med 2008; 35:287-292 5) AJNR Am J Neuroradiol 2005; 26:104-112

NCCT CTA-si CBF
CBV MTT DWI
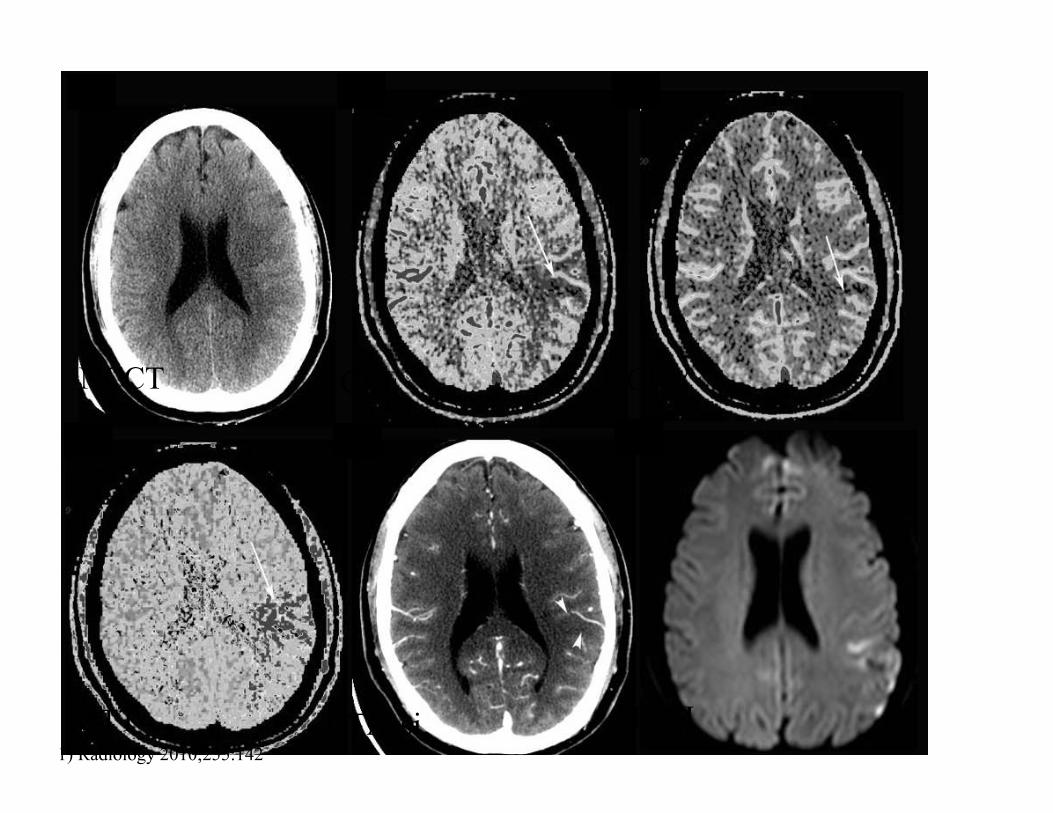
1) Radiology 2010;255:142
NCCT
CTA-si
CBF CBV
MTT DWI

NCCT
CTA-si
CBF CBV
MTT DWI

CTP Cost effectiveness• 1. Penumbra based selection
– reduced mortality
– Improve functional outcome 0.59%
– <4.5 hrs: Cost saving to hospital • 3-4.5hr: Reduce by 0.8% pts receiving ivTPA
• 2. CTP over NCCT– 3/12:
• lower cost (-$1716)
• Greater QALY 0.004
• Number needed to screen to avoid 1 DSA was 2
– Lifetime• Lower cost (-$2058)
• Greater QALY 0.008
1) AJNR 2010;31:1669 2) Neurology 2010;75:1678

MRI Scan time: 10-15 minutes
Contrast: 15 ml (Gadolinium)
FLAIR
MR Angiography
MIP MPR
Perfusion ImagingDiffusion weighted Imaging Gradient
Echo
Perfusion maps
Plaque sequence
MRI Stroke Protocol

• Performance
– Conventional MRI
• Sensitivity similar to NCCT <3hrs
• Usually <24hrs all T2 and 50% T1 abnormal
– DWI
• Sensitivity 88-100%
• Specificity 95-100%
– False negatives
• 5% DWI in 24 hrs1
– 10* more likely posterior fossa
– Small subcortical infarcts2
– False positives
• Abscess, cellular tumor, encephalitis, CJD, seizure
MRI stroke detection
1) AJNR 2000;21:1434 2)Ay H. Neurology 1999;52:1784
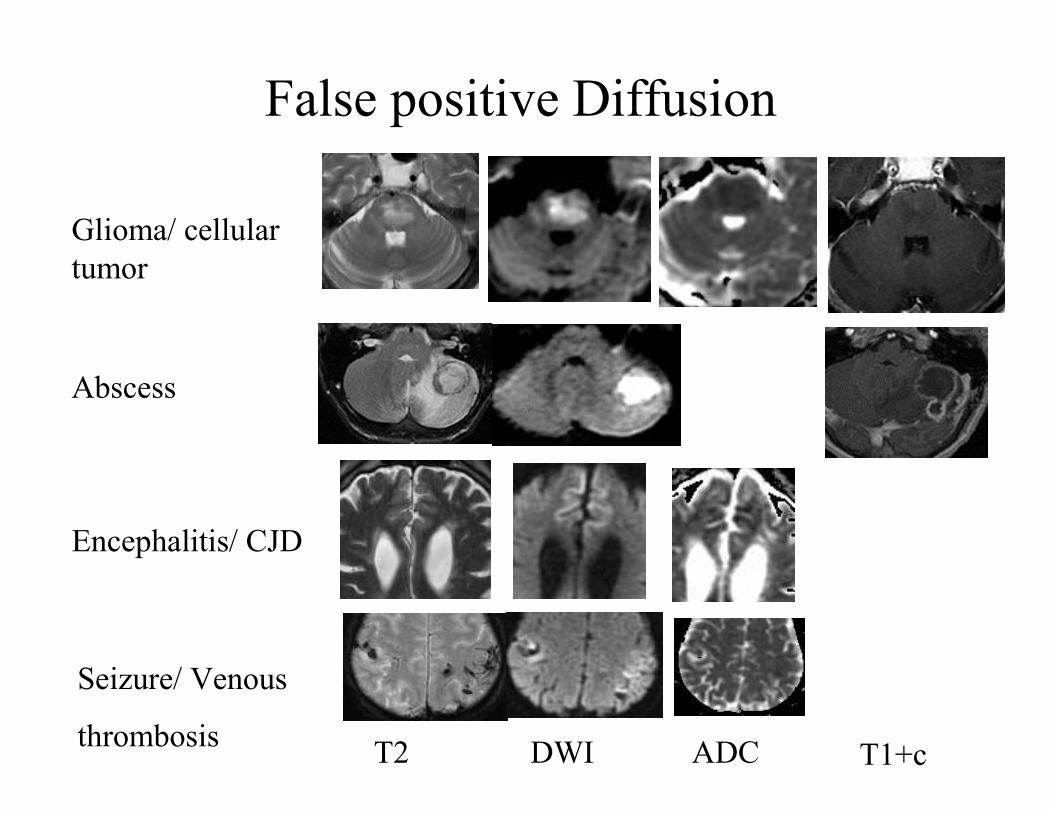
False positive Diffusion
Glioma/ cellular
tumor
Abscess
Encephalitis/ CJD
Seizure/ Venous
thrombosisT2 DWI ADC T1+c

Brain swelling 1
1) Radiology 2005;235:992 2) Stroke 1983;4:756 3) Neuroradiology 1991;33:207 4) Stroke 1976;7:482
•Increased CBV
•Unstable state
•60% infarct
Hyperdense/ hypointense MCA sign2
•35-50% MCA strokes2
•Predicts
•>100ml at risk
•Poorer response to tPA
•Mortality 5-45%
•Survivors poor outcome3
•Sensitivity 78%
•Specificity 93%
Beware: HCT,CA++
Pseudo-hyperdense signGRECT
CT

Eye sign
• High PPV for side of infarct 93%1
• Caveat
– Brainstem & thalamic lesions
– Post-ictal states
• Predicts poor outcome2
– Mortality 44% vs 12% if absent
1) Neurology 2003;60:135-137 2) Stroke 1991;22:200-202
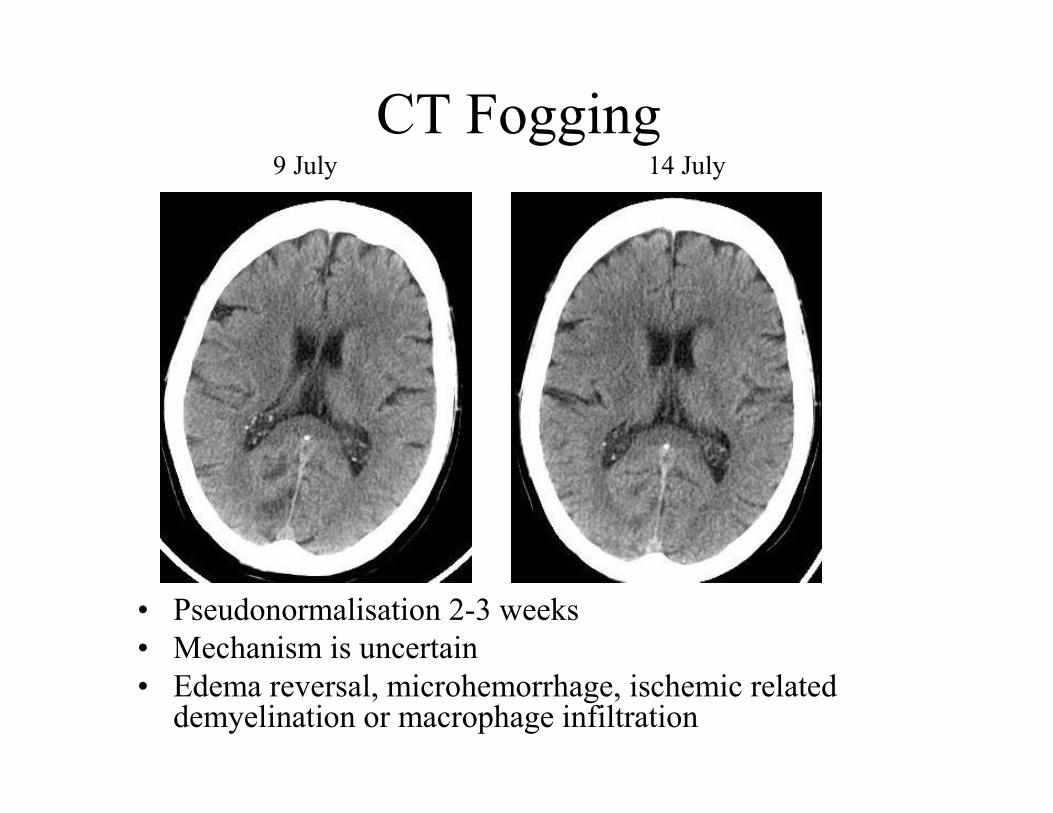
CT Fogging
• Pseudonormalisation 2-3 weeks
• Mechanism is uncertain
• Edema reversal, microhemorrhage, ischemic related demyelination or macrophage infiltration
9 July 14 July

CT limitations-1
Small Lesion Profile Microangiopathic change
Radiation dose - cancer risk 1
Head CT 1/3 of all CT exams
1) NEJM 2007:357:2277

• Renal impairment CIN (25% Cr)• N=831 pts 1,2
– CIN 3%
– No Cr available at time of scan CIN 1.8-2%
– No renal failure
• N=575 NCCT/CTA/CTP±DSA vs 343 control AIS patients – CIN 5% vs 10% control group3
• N=348 CTA for ICH– CIN 6% (contrast not risk factor in multi-variate analysis), 2.6%
significant renal impairment vs 1.4% control (p=0.3)4
• N=2034 for outpatient PCT 66 (3%) sCR– 94% history of renal disease- 2 (0.1%) no risk factors5
• N=640 ER presentation 35 (5.5%) sCR– 75% risk factors for renal insufficiency- 8 (1.3%) no risk factors6
• N=241 All CTA (x=139cc) prior to blood results available– 24% CTA and 22% control pts abn delayed baseline CR
– CIN 3% CTA vs 4% control7
1) Krol Stroke 2007 2) Hopyan Neurology 2007 3) Lima AJNR 2010 in press 4) Stroke 2009;40:2393 5) Radiology 2000;216:481 6) J Emerg Med 1996;14:543 7)JNNP 2010;81:783
•CIN <5% (closer to 2-3%)
•CIN Misnomer- contrast not needed

Guidelines for ER patients
• CAR1:• Evaluate risk factors. If absent no risk for renal failure 2,3
• Risk factors present
– Known renal impairment/single kidney
– Diabetes, age>70, sepsis/hypotension
– Dehydration/ organ transplantation/ chemotherapy
– Cardiovascular disease (HT, CHD, PVD, CAD)
• Consider
– Visipaque (iso-osmolar): Class B data
– Assess hydration: 300-500ml crystalloid bolus
– Stop Metformin resume once renal function known and normal
• ACR4: • Risk of CIN is not an absolute but a relative (and often weak relative)
contraindication to contrast.
• ESUR5:– Emergent situation waive Cr measurement
– If procedure deferrable with no harm to pt- get Cr
1) CAR guidelines 2) Radiology 2000;216:481 3) Kidney Int 1995;47:354 4) ACR manual on contrast media 5) Eur Radiol 05;15:749

1) Demchuk Stroke 2007 2) AJNR 2008;29:1826 3) AJNR 2001;22:1077
Spatial coverage
CT limitations-2
320 slice scanner- whole brain coverageTable toggle3Courtesy J Barfett

MRI limitations
Nephrogenic Systemic fibrosis1
Described 2000
Gadolinium and impaired renal function
Skin thickening/ brawny pigmentation
Extremity fibrosis
Nearly all organs involved
1) Lancet 2000;356:1000
Scan Environment Contraindications 10% Access/ Speed

Emerging Applications
Prediction of hematoma expansion in ICH
• NCCT Sensitivity 77%, Specificity 84% for
predicting underlying cause 1
• AHA guidelines limitations
• Risk of structural lesion in ICH is between 2-
3% Basal Ganglia and up to 11% in all
locations 2,3
1) JNNP 1994;57:1180 2) Stroke 1997;28:1406 3) Delgado ASNR 2009 (in Press)

Vascular malformation
Dural fistula Sinus thrombosis
NCCT
CTA

CTA detection of secondary ICH• Retrospective series
• N=623; ≤24hrs;
– 91/623 (15%)
– CTA Sens 96%; Spec 99; Accuracy 98%
• N=78; 49±14yrs;
– 22/78 (28%)
– CTA Sens 96%; Spec 100; Accuracy 99%
• N=44;
– 24/44 (54%)
– CTA Sens 92%; Spec 92; Accuracy 92%
– Kappa 0.81-0.91
• N=43; ER attendance <40yrs;
– 27/43 (63%)
– CTA Sens 96%; Spec 100; Accuracy 98%
1) Delgado ASNR 2009 2) AJNR 2009; 3) CJNS 2008 4) Emerg Radiol 2009
Sensitivity 92-96%; Specificity 92-100%; Accuracy 92-98%

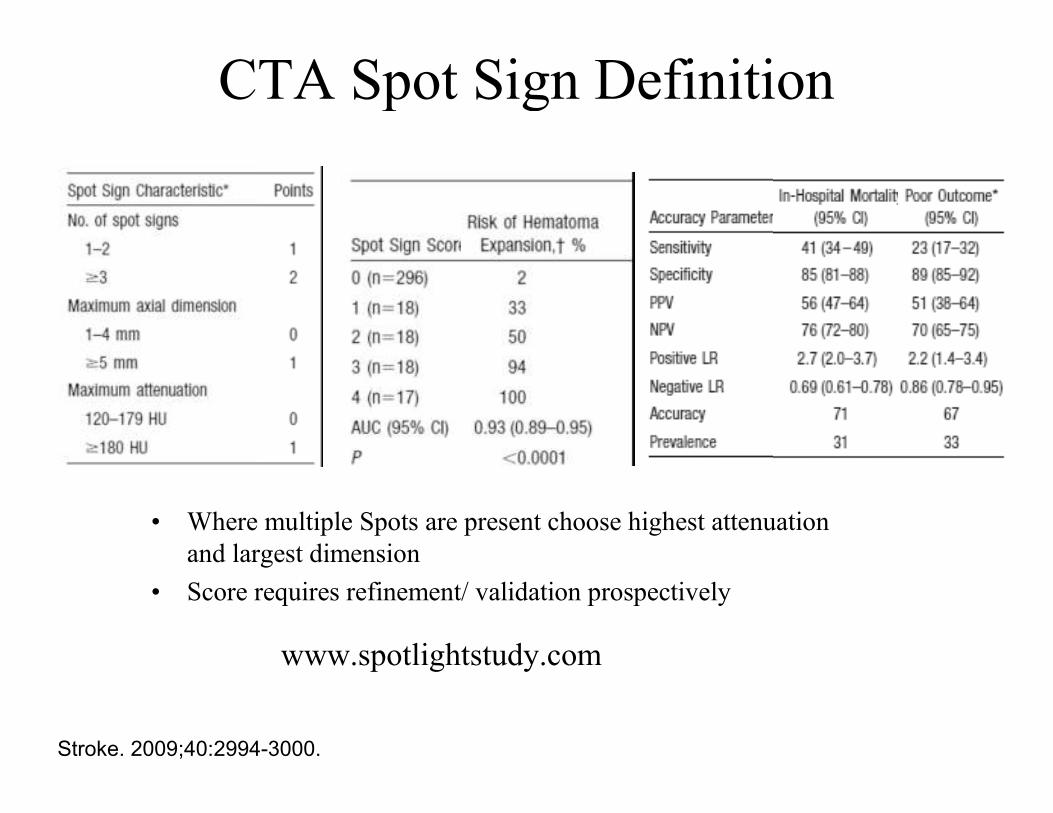
CTA Spot Sign Definition
• Single or multiple, serpiginous or spot-like
foci of contrast density
• Normal NCCT
• No visible communication outside
hematoma
• Density ~2* greater than hematoma
Wada Stroke 2007;38:1257

Axial CTA
CTA Spot Sign Definition•Single or multiple, serpiginous or spot-like foci of contrast density
Appearance of contrast extravasation differs according to scan orientation.
Coronal CTA Reformat
Wada Stroke 2007;38:1257

Axial CTA Coronal CTA Reformat
Appearance of contrast extravasation differs according to scan orientation.
•Single or multiple, serpiginous or spot-like foci of contrast density
Wada Stroke 2007;38:1257
CTA Spot Sign Definition

Axial CTA Coronal CTA ReformatAppearance of contrast extravasation differs according to scan orientation.
CTA Spot Sign Definition
•Single or multiple, serpiginous or spot-like foci of contrast density
Wada Stroke 2007;38:1257

• N=39; <6 hrs
– 33% Spot positive
– Sens 91%, Spec 89%; PPV 77%, NPV 96%
– Predictor hematoma expansion
• N=104; <48 hrs ; retrospective
– 56% Extravasation positive
– Sens 93%, Spec 50%; PPV 24%, NPV 98%
– Predictor hematoma expansion
• N=56; median 13 hrs; retrospective
– 18-23% Extravasation positive
– Predictor hematoma expansion and mortality
• N=573; retrospective
– Sens 88%, Spec 93%; PPV 69%, NPV 98%
– Predictor of hematoma expansion and poor outcome
1)Stroke 2007;38:1257 2)Neurology 2007;68:889 3)AJNR 2008;28:520 4) Stroke 2010;41:54
Sens 99-93%, Spec 89-93%, NPV 96-98%, PPV 69-77%
CTA Spot Sign Performance

CTA Spot Sign Definition
• Where multiple Spots are present choose highest attenuation
and largest dimension
Stroke. 2009;40:2994-3000.
CTA Spot Sign Definition
• Where multiple Spots are present choose highest attenuation
and largest dimension
• Score requires refinement/ validation prospectively
Stroke. 2009;40:2994-3000.
www.spotlightstudy.com


CT dose reduction
• Filtered back projection– Low dose, increased noise
• Adaptive statistical iterative reconstruction (ASIR-GE)– Iteratively compares obtained to ideal value,
transforming obtained value each time
– May be combined other techniques such as principle component analysis (PCA)
– Allows identification & subtraction of noise• Applications
– Obese patients
– Low dose studies: Renal calculus, CT colonography, CTA inclcoronary

Conventional
dose
190 mA; 4.9mSv
Low dose
50 mA; 0.5mSv
No ASIR
Low Dose
50 mA; 0.5mSv
ASIR

High Dose 190 mA Low Dose 50 mALow Dose with Noise
Suppression
Blood Flow
Blood Volume

– Stroke detection
– Typical scan protocols
– Methods of stroke detection
• Limitations
• Renal impairment
– Developments in imaging of Intracranial Hemorrhage
• CTA detection of causes of secondary ICH detection
• Spot Sign
– CT dose and dose reduction strategies
Conclusion

Acknowledgements
• Collaborators
– Neurology and Neuroradiology groups Sunnybrook
Hospital
– Professor Ting Lee; Lawson Research Institute
– Research team
Thank you. Any Questions?