Comparison of Endothelial Dysfunction in Coronary Arteries ...
Imaging flow dynamics in murine coronary arteries with spectral domain
optical Doppler tomography Daniel X. Hammer,1,* Mircea Mujat,1 R. Daniel Ferguson,1 Nicusor Iftimia,1 Daniel Escobedo,2 J. Travis Jenkins,2 Hyunji Lim,3 Thomas E. Milner,3 and
Marc D. Feldman2,4 1Physical Sciences Inc., 20 New England Business Center, Andover, MA 01810, USA
2Department of Cardiology, University of Texas Health Science Center, San Antonio, TX 78248, USA 3Department of Electrical Engineering, University of Texas, Austin, TX 78712, USA
4Veterans Heath Care System, San Antonio, TX 78248 *[email protected]
Abstract: Blood flow in murine epicardial and intra-myocardial coronary arteries was measured in vivo with spectral domain optical Doppler tomography (SD-ODT). Videos at frame rates up to 180 fps were collected and processed to extract phase shifts associated with moving erythrocytes in the coronary arteries. Radial averaging centered on the vessel lumen provided spatial smoothing of phase noise in a single cross-sectional frame for instantaneous peak velocity measurement without distortion of the flow profile. Temporal averaging synchronized to the cardiac cycle (i.e., gating) was also performed to reduce phase noise, although resulting in lower flow profiles. The vessel angle with respect to incident imaging beam was measured with three-dimensional raster scans collected from the same region as the high speed cross-sectional scans. The variability in peak phase measurement was 10-15% from cycle to cycle on a single animal but larger for measurements among animals. The inter-subject variability is attributed to factors related to real physiological and anatomical differences, instrumentation variables, and measurement error. The measured peak instantaneous flow velocity in a ~40-µm diameter vessel was 23.5 mm/s (28 kHz Doppler phase shift). In addition to measurement of the flow velocity, we observed several dynamic features of the vessel and surrounding myocardium in the intensity and phase sequences, including asymmetric vessel deformation and rapid flow reversal immediately following maximum flow, in confirmation of known coronary artery flow dynamics. SD-ODT is an optical imaging tool that can provide in vivo measures of structural and functional information on cardiac function in small animals. © 2012 Optical Society of America OCIS codes: (170.4500) Optical coherence tomography; (170.3880) Medical and biological imaging.
References and links 1. D. Lloyd-Jones, R. J. Adams, T. M. Brown, M. Carnethon, S. Dai, G. De Simone, T. B. Ferguson, E. Ford, K.
Furie, C. Gillespie, A. Go, K. Greenlund, N. Haase, S. Hailpern, P. M. Ho, V. Howard, B. Kissela, S. Kittner, D. Lackland, L. Lisabeth, A. Marelli, M. M. McDermott, J. Meigs, D. Mozaffarian, M. Mussolino, G. Nichol, V. L. Roger, W. Rosamond, R. Sacco, P. Sorlie, R. Stafford, T. Thom, S. Wasserthiel-Smoller, N. D. Wong, and J. Wylie-Rosett; American Heart Association Statistics Committee and Stroke Statistics Subcommittee, “Heart disease and stroke statistics--2010 update: a report from the American Heart Association,” Circulation 121(7), e46–e215 (2010).
2. J. Spaan, C. Kolyva, J. van den Wijngaard, R. ter Wee, P. van Horssen, J. Piek, and M. Siebes, “Coronary structure and perfusion in health and disease,” Philos. Transact. A Math. Phys. Eng. Sci. 366(1878), 3137–3153 (2008).
#160050 - $15.00 USD Received 15 Dec 2011; revised 27 Jan 2012; accepted 28 Jan 2012; published 13 Mar 2012(C) 2012 OSA 1 April 2012 / Vol. 3, No. 4 / BIOMEDICAL OPTICS EXPRESS 701

3. Mouse Genome Sequencing Consortium, “Initial sequencing and comparative analysis of the mouse genome,” Nature 420(6915), 520–562 (2002).
4. C. J. Hartley, A. K. Reddy, S. Madala, L. H. Michael, M. L. Entman, and G. E. Taffet, “Effects of isoflurane on coronary blood flow velocity in young, old and ApoE(-/-) mice measured by Doppler ultrasound,” Ultrasound Med. Biol. 33(4), 512–521 (2007).
5. A. K. Reddy, S. Madala, A. D. Jones, W. A. Caro, J. F. Eberth, T. T. Pham, G. E. Taffet, and C. J. Hartley, “Multichannel pulsed Doppler signal processing for vascular measurements in mice,” Ultrasound Med. Biol. 35(12), 2042–2054 (2009).
6. N. V. Iftimia, D. X. Hammer, R. D. Ferguson, M. Mujat, D. Vu, and A. A. Ferrante, “Dual-beam Fourier domain optical Doppler tomography of zebrafish,” Opt. Express 16(18), 13624–13636 (2008).
7. A. J. Hill, H. Teraoka, W. Heideman, and R. E. Peterson, “Zebrafish as a model vertebrate for investigating chemical toxicity,” Toxicol. Sci. 86(1), 6–19 (2005).
8. Z. P. Chen, T. E. Milner, S. Srinivas, X. Wang, A. Malekafzali, M. J. van Gemert, and J. S. Nelson, “Noninvasive imaging of in vivo blood flow velocity using optical Doppler tomography,” Opt. Lett. 22(14), 1119–1121 (1997).
9. S. Yazdanfar, M. D. Kulkarni, and J. A. Izatt, “High resolution imaging of in vivo cardiac dynamics using color Doppler optical coherence tomography,” Opt. Express 1(13), 424–431 (1997).
10. J. A. Izatt, M. D. Kulkarni, S. Yazdanfar, J. K. Barton, and A. J. Welch, “In vivo bidirectional color Doppler flow imaging of picoliter blood volumes using optical coherence tomography,” Opt. Lett. 22(18), 1439–1441 (1997).
11. Y. H. Zhao, Z. P. Chen, C. Saxer, S. H. Xiang, J. F. de Boer, and J. S. Nelson, “Phase-resolved optical coherence tomography and optical Doppler tomography for imaging blood flow in human skin with fast scanning speed and high velocity sensitivity,” Opt. Lett. 25(2), 114–116 (2000).
12. R. A. Leitgeb, L. Schmetterer, W. Drexler, A. F. Fercher, R. J. Zawadzki, and T. Bajraszewski, “Real-time assessment of retinal blood flow with ultrafast acquisition by color Doppler Fourier domain optical coherence tomography,” Opt. Express 11(23), 3116–3121 (2003).
13. B. R. White, M. C. Pierce, N. Nassif, B. Cense, B. H. Park, G. J. Tearney, B. E. Bouma, T. C. Chen, and J. F. de Boer, “In vivo dynamic human retinal blood flow imaging using ultra-high-speed spectral domain optical coherence tomography,” Opt. Express 11(25), 3490–3497 (2003).
14. H. C. Hendargo, R. P. McNabb, A. H. Dhalla, N. Shepherd, and J. A. Izatt, “Doppler velocity detection limitations in spectrometer-based versus swept-source optical coherence tomography,” Biomed. Opt. Express 2(8), 2175–2188 (2011).
15. R. K. Wang and L. An, “Doppler optical micro-angiography for volumetric imaging of vascular perfusion in vivo,” Opt. Express 17(11), 8926–8940 (2009).
16. Y. Wang, A. Fawzi, O. Tan, J. Gil-Flamer, and D. Huang, “Retinal blood flow detection in diabetic patients by Doppler Fourier domain optical coherence tomography,” Opt. Express 17(5), 4061–4073 (2009).
17. B. Baumann, B. Potsaid, M. F. Kraus, J. J. Liu, D. Huang, J. Hornegger, A. E. Cable, J. S. Duker, and J. G. Fujimoto, “Total retinal blood flow measurement with ultrahigh speed swept source/Fourier domain OCT,” Biomed. Opt. Express 2(6), 1539–1552 (2011).
18. V. X. D. Yang, M. Gordon, E. Seng-Yue, S. Lo, B. Qi, J. Pekar, A. Mok, B. Wilson, and I. Vitkin, “High speed, wide velocity dynamic range Doppler optical coherence tomography (Part II): Imaging in vivo cardiac dynamics of Xenopus laevis,” Opt. Express 11(14), 1650–1658 (2003).
19. A. Mariampillai, B. A. Standish, N. R. Munce, C. Randall, G. Liu, J. Y. Jiang, A. E. Cable, I. A. Vitkin, and V. X. D. Yang, “Doppler optical cardiogram gated 2D color flow imaging at 1000 fps and 4D in vivo visualization of embryonic heart at 45 fps on a swept source OCT system,” Opt. Express 15(4), 1627–1638 (2007).
20. M. W. Jenkins, D. C. Adler, M. Gargesha, R. Huber, F. Rothenberg, J. Belding, M. Watanabe, D. L. Wilson, J. G. Fujimoto, and A. M. Rollins, “Ultrahigh-speed optical coherence tomography imaging and visualization of the embryonic avian heart using a buffered Fourier domain mode locked laser,” Opt. Express 15(10), 6251–6267 (2007).
21. J. W. Villard, M. D. Feldman, J. Kim, T. E. Milner, and G. L. Freeman, “Use of a blood substitute to determine instantaneous murine right ventricular thickening with optical coherence tomography,” Circulation 105(15), 1843–1849 (2002).
22. M. Brezinski, K. Saunders, C. Jesser, X. Li, and J. Fujimoto, “Index matching to improve optical coherence tomography imaging through blood,” Circulation 103(15), 1999–2003 (2001).
23. G. J. Tearney, I. K. Jang, and B. E. Bouma, “Optical coherence tomography for imaging the vulnerable plaque,” J. Biomed. Opt. 11(2), 021002 (2006).
24. D. Piao and Q. Zhu, “Quantifying Doppler angle and mapping flow velocity by a combination of Doppler-shift and Doppler-bandwidth measurements in optical Doppler tomography,” Appl. Opt. 42(25), 5158–5166 (2003).
1. Introduction
Coronary artery disease (CAD) is the leading cause of death worldwide [1]. CAD is caused by the buildup of atheromatous plaques within the walls of the coronary arteries, which may rupture, initiating the clotting cascade and halting blood flow to the myocardium, which in turn causes ischemia or infarction [2]. Genetically-altered murine models are extensively used
#160050 - $15.00 USD Received 15 Dec 2011; revised 27 Jan 2012; accepted 28 Jan 2012; published 13 Mar 2012(C) 2012 OSA 1 April 2012 / Vol. 3, No. 4 / BIOMEDICAL OPTICS EXPRESS 702

to study CAD because of the similarity of coronary anatomy between humans and mice and because the murine genome is fully mapped and easily altered [3]. Typically, coronary blood flow in small animals is measured with Doppler ultrasound biomicroscopy [4,5]. In vivo minimally invasive imaging techniques such as optical coherence tomography (OCT) are attractive for drug studies because an animal may be imaged continually over time while applying different pharmaceutical agents [6]. Imaging approaches can greatly reduce the cost and quantity of animals, as well as the duration required to study cardiac function [7].
Doppler techniques have been applied to OCT since its invention [8–11] and have been extended to Fourier domain OCT (FD-OCT) [12–14]. FD-OCT variants (spectral domain and swept source OCT) yield higher speeds and signal-to-noise (SNR) that have extended the dynamic range of conventional optical Doppler tomography (ODT) [13]. While OCT provides excellent axial sectioning compared to Doppler ultrasound, it has limited penetration and is therefore limited to transparent and superficial targets. Previous ODT studies have concentrated primarily on measurement of either in vivo retinal blood flow [15–17] or cardiac dynamics in developmental models [18–20], because of the relative ease with which OCT and ODT signals can be obtained through the transparent media of the eye or larval tissue. In imaging blood vessels or myocardium, absorption and scattering reduce the penetration to <2 mm, and some groups have employed index matching and blood substitutes to improve imaging performance [21,22]. In addition to optical penetration, OCT and ODT are especially susceptible to motion, which can wash-out interferometric fringes and make phase measurement difficult. In vivo characterization of coronary blood flow is arduous for these reasons. Despite the significance of coronary arteries to the overall health of a subject and the importance of the murine model in investigation of heart disease, to date, no direct measure of coronary artery blood flow using ODT has been performed. In this investigation, we use spectral domain optical Doppler tomography (SD-ODT) to study coronary blood flow dynamics and the structural features of the epicardial and intra-myocardial murine coronary arteries ~50-100 µm in diameter.
We performed several experiments designed to quantify the amplitude and dynamics of blood flow in murine coronary arteries. The studies lay the ground-work for future investigations of blood flow in coronary arteries in mice and humans. In humans, endoscopic intravascular SD-OCT is already being performed to assess vulnerable plaques [23]. SD-ODT may eventually provide a direct measure of coronary blood flow changes or other measures of cardiac function after the application of new pharmaceutical agents to determine toxicity or efficacy. The application of SD-ODT to coronary arteries may lead to a better understanding of vascular flow dynamics and the causes and treatment of CAD.
2. Materials and methods 2.1. SD-ODT system
Figure 1 shows a diagram of the SD-ODT system used to image murine epicardial and intra-myocardial coronary arteries. SD-ODT is implemented in a straight-forward manner because the optical spectrum is readily available from the sensor and thus phase of the interference fringes can be easily extracted, and processed to determine relative flow velocity.
To focus incident light on the intact open chest murine heart, we used a telecentric scan lens (SL, Thorlabs). A turning mirror (TM) folds the imaging beam down into the open thorax of the animal. A lens relay (O1 and L) behind SL sets the proper magnification through the system. The SD-OCT hardware is configured in a conventional manner, with a fiber interferometer (50/50 fiber coupler), and spectrometer comprised of a transmission grating, a linear detector, and optical objectives. The imaging and spectrometer objectives (O1 and O2) are custom designed multi-element objectives optimized for field flatness and low chromatic aberration. The 850-nm imaging source (Superlum Broadlighter D855-HP2) was protected from optical feedback with an in-line fiber isolator (I) and polarization controllers (PC) were
#160050 - $15.00 USD Received 15 Dec 2011; revised 27 Jan 2012; accepted 28 Jan 2012; published 13 Mar 2012(C) 2012 OSA 1 April 2012 / Vol. 3, No. 4 / BIOMEDICAL OPTICS EXPRESS 703
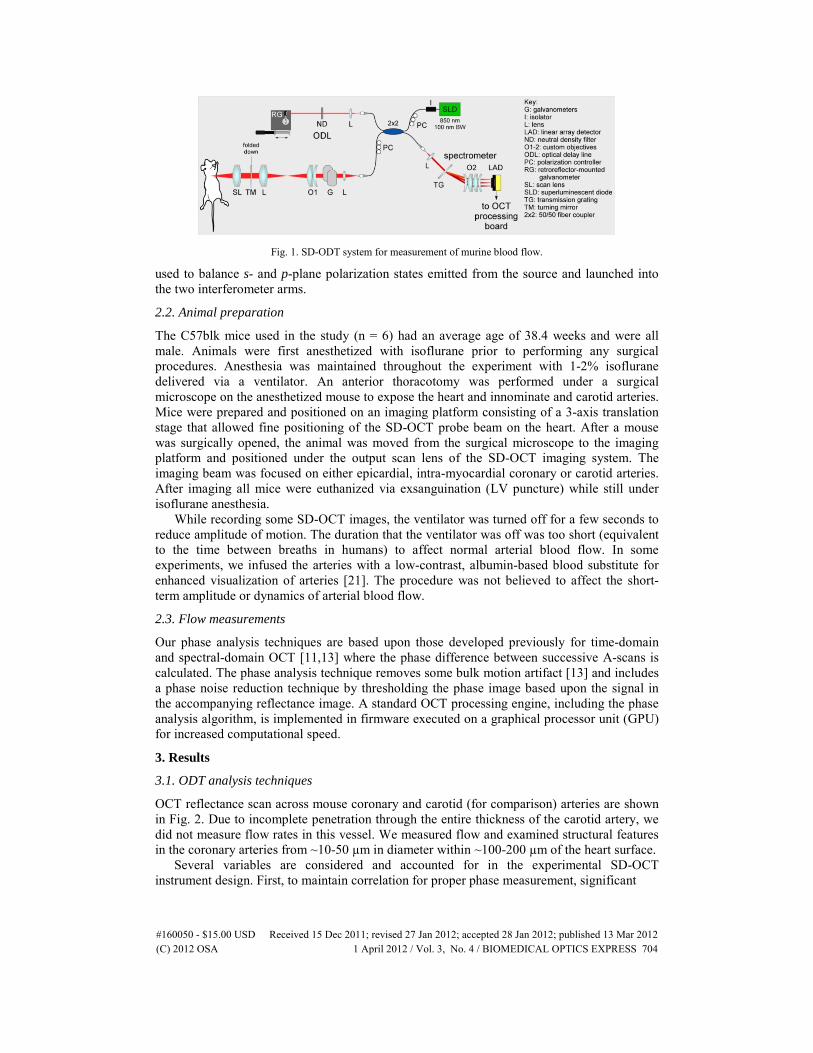
Fig. 1. SD-ODT system for measurement of murine blood flow.
used to balance s- and p-plane polarization states emitted from the source and launched into the two interferometer arms.
2.2. Animal preparation
The C57blk mice used in the study (n = 6) had an average age of 38.4 weeks and were all male. Animals were first anesthetized with isoflurane prior to performing any surgical procedures. Anesthesia was maintained throughout the experiment with 1-2% isoflurane delivered via a ventilator. An anterior thoracotomy was performed under a surgical microscope on the anesthetized mouse to expose the heart and innominate and carotid arteries. Mice were prepared and positioned on an imaging platform consisting of a 3-axis translation stage that allowed fine positioning of the SD-OCT probe beam on the heart. After a mouse was surgically opened, the animal was moved from the surgical microscope to the imaging platform and positioned under the output scan lens of the SD-OCT imaging system. The imaging beam was focused on either epicardial, intra-myocardial coronary or carotid arteries. After imaging all mice were euthanized via exsanguination (LV puncture) while still under isoflurane anesthesia.
While recording some SD-OCT images, the ventilator was turned off for a few seconds to reduce amplitude of motion. The duration that the ventilator was off was too short (equivalent to the time between breaths in humans) to affect normal arterial blood flow. In some experiments, we infused the arteries with a low-contrast, albumin-based blood substitute for enhanced visualization of arteries [21]. The procedure was not believed to affect the short-term amplitude or dynamics of arterial blood flow.
2.3. Flow measurements
Our phase analysis techniques are based upon those developed previously for time-domain and spectral-domain OCT [11,13] where the phase difference between successive A-scans is calculated. The phase analysis technique removes some bulk motion artifact [13] and includes a phase noise reduction technique by thresholding the phase image based upon the signal in the accompanying reflectance image. A standard OCT processing engine, including the phase analysis algorithm, is implemented in firmware executed on a graphical processor unit (GPU) for increased computational speed.
3. Results
3.1. ODT analysis techniques
OCT reflectance scan across mouse coronary and carotid (for comparison) arteries are shown in Fig. 2. Due to incomplete penetration through the entire thickness of the carotid artery, we did not measure flow rates in this vessel. We measured flow and examined structural features in the coronary arteries from ~10-50 µm in diameter within ~100-200 µm of the heart surface.
Several variables are considered and accounted for in the experimental SD-OCT instrument design. First, to maintain correlation for proper phase measurement, significant
#160050 - $15.00 USD Received 15 Dec 2011; revised 27 Jan 2012; accepted 28 Jan 2012; published 13 Mar 2012(C) 2012 OSA 1 April 2012 / Vol. 3, No. 4 / BIOMEDICAL OPTICS EXPRESS 704

Fig. 2. Single OCT images of (a) mouse carotid (lumen labeled c) and (b) heart wall and coronary arteries. Several epicardial (e) and intra-myocardial (i) vessels are labeled accordingly. Scale bar = 200 µm.
spatial beam overlap must exist for successive A-scans [11]. Without sufficient beam overlap, successive A-scans become uncorrelated, and the SNR of the phase signal degrades and approaches that for a random process. The beam overlap constraint places limitations on the overall scan length, number of pixels, and imaging speed. In our setup, the spot size was ~17 µm for the front scan lens (Thorlabs LSM03-BB) and the pixel size never exceeded 2 µm so the beam overlap was always above ~90%. To capture the temporal dynamics of arterial blood flow, the imaging speed was increased with respect to the cardiac cycle. For a fixed linear detector line rate (53 kHz), this was done by decreasing the number of A-scans in the image but with consideration to the aforementioned beam overlap constraint. We typically acquired images at 45, 90, and 180 fps with 1024, 512, and 256 A-scans, respectively. The scan length was typically 1 mm for 1024 and 512 A-scan images and 0.5 mm for 256 A-scans images.
Bulk tissue motion is one of greatest challenges for ODT imaging of coronary arteries overlying a beating heart, absent a robust axial tracker with micron-level precision. For time-domain OCT systems, the problem is difficult to address. But the improvements in speed and SNR with the Fourier domain OCT approach can be applied to more reliably quantify peak blood flow in the coronary and carotid arteries. Bulk motion of the heart is primarily due to ejection (systole) and passive filling (diastole) of blood in the ventricles during the cardiac cycle. However, a significant fraction of the motion, especially in the carotid artery, is from inspiration and expiration of air by the lungs during the respiratory cycle. Slowly varying intra-frame motion, compared to the 53 kHz sensor line rate, caused the image to shift axially but did not perturb the phase image. More rapid inter-frame motion often caused phase distortion at lateral positions across the scan, often disrupting the entire phase measurement. We were able to record ODT phase images despite this motion. As mentioned above, we very briefly (few seconds) turned off the respirator while recording images. No attenuation in coronary flow amplitude or heart rate was observed while the ventilator was turned off.
The 53 kHz line rate limits the maximum detectable frequency shift to 26.5 kHz. In practice, we reduced our line scan rate (to 46 kHz) to accommodate some electronic delays in the instrumentation (real-time processing board and framegrabber). The minimum detectable phase shift, measured from the standard deviation of the phase difference from a stationary coverslip (no scanning) [13], was 0.03 radians (1.6°). This translates to a minimal detectable Doppler frequency shift of ~145 Hz. Quantization of the phase image to 8-bits may be the limiting factor in this measurement and not the actual system phase stability.
In addition to our custom phase processing analysis algorithm, we applied several techniques to improve phase SNR and accuracy, including averaging across the cardiac cycle [18] and phase wrapping. Figure 3 illustrates these techniques. A single OCT intensity image and its corresponding phase image are shown in Figs. 3(a) and (b). Three superficial vessels are observed where flow is resolved in the phase image and one deeper vessel is partially resolved but beyond the penetration depth of the 850-nm source for flow measurements. Note the extensive phase wrapping in the vessel with highest blood flow. Figure 3(c) shows the same image with the semi-automated phase unwrapping algorithm applied. The phase
#160050 - $15.00 USD Received 15 Dec 2011; revised 27 Jan 2012; accepted 28 Jan 2012; published 13 Mar 2012(C) 2012 OSA 1 April 2012 / Vol. 3, No. 4 / BIOMEDICAL OPTICS EXPRESS 705

unwrapping algorithm consisted of several steps. First, block statistics were calculated across the entire phase image using a 32 × 32 pixel window, and the block with the maximum variance was identified as the region most likely to contain the vessel. Regions-of-interest manually selected by the operator were used in the event of vessel identification failure. Second, the centroid of the region was calculated as the vessel center. Third, the unwrapping algorithm was applied with a threshold set by the operator. The unwrapping algorithm identified pixels whose sign is reversed from surrounding pixels. (The algorithm assumes there is not multiple wraps of phase ‒ which is a good assumption for the flow velocity in this study.) Finally, the unwrapped phase region is combined with into the original phase image, which was re-scaled to account for the large phase range. The range on the unwrapped image increased from ±π to ±2π and so the phase noise is at a lower gray-level amplitude.
A composite OCT intensity image averaged across 13 cardiac cycles is shown in Fig. 3(d). The composite phase image was generated by manually gating and averaging the images with respect to the cardiac cycle, using several parameters taken from both the intensity and phase images, including the position and curvature of the heart wall, the shape and appearance of the vessels, the appearance of bulk motion phase artifact, the appearance of blood flow phase wrapping, and the peak flow profile. Composite phase images without and with unwrapping are shown in Figs. 3(e) and (f). Without unwrapping, the phase profile shape is not circular because wrapped pixels distort the average. With wrapping, the phase profile for the vessel is circular.
The accompanying video (Media 1) shows the OCT reflectance and phase images (upper and lower panels, respectively) from five cardiac cycles in the presence of bulk motion, with bulk depth motion corrected, and with temporal averaging (left, middle, and right panels, respectively). The temporal averaging panels are repeated for the five cycles.
The peak phase was measured by computing average phase profiles across the coronary lumen. Phase noise can be reduced by averaging across frames or across spatial dimensions. Averaging across multiple horizontal or vertical profiles will result in distortion of the flow
Fig. 3. Example of phase averaging and phase unwrapping techniques applied to murine coronary artery phase maps. (a) Single intensity image. Single phase images (b) without and (c) with wrapping. (d) Composite intensity image from 13 frames synchronized to the same point in the cardiac cycle and aligned spatially. Composite phase images (e) without and (f) with wrapping. Phase scale for the wrapped images (b, e) is ±π and for the unwrapped images (c, f) is ±2π. Scale bar = 200 µm (Media 1: 8.5 Mb).
#160050 - $15.00 USD Received 15 Dec 2011; revised 27 Jan 2012; accepted 28 Jan 2012; published 13 Mar 2012(C) 2012 OSA 1 April 2012 / Vol. 3, No. 4 / BIOMEDICAL OPTICS EXPRESS 706
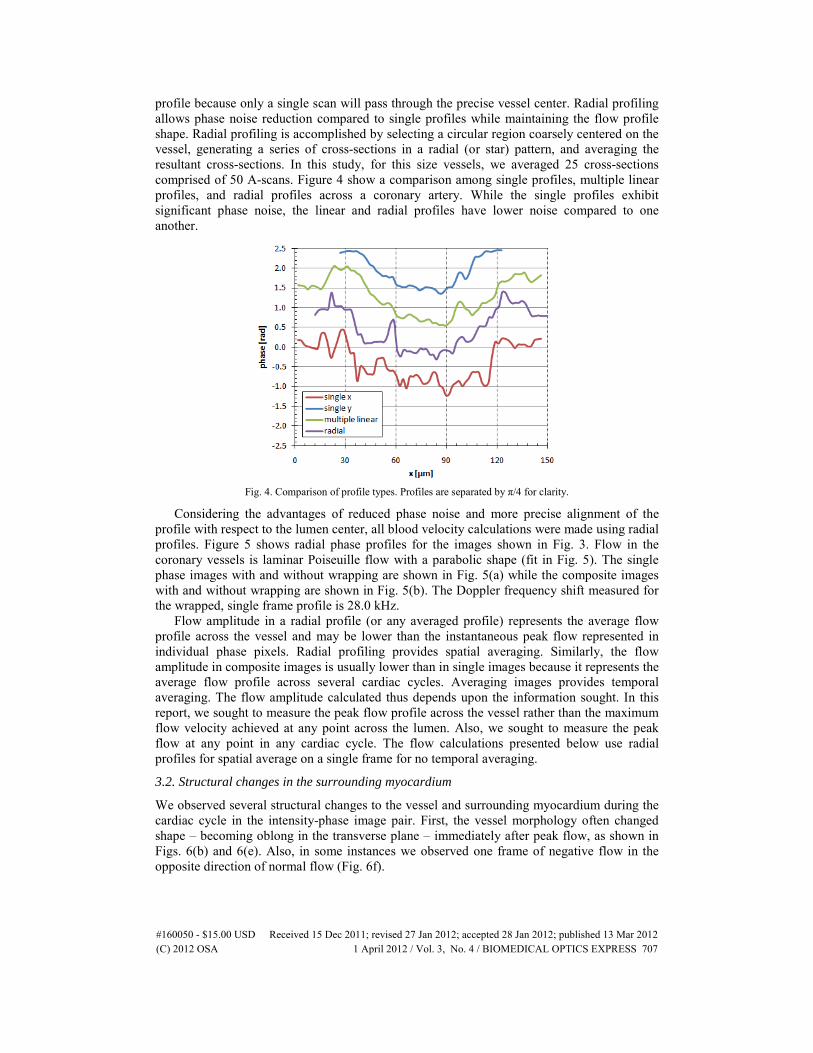
profile because only a single scan will pass through the precise vessel center. Radial profiling allows phase noise reduction compared to single profiles while maintaining the flow profile shape. Radial profiling is accomplished by selecting a circular region coarsely centered on the vessel, generating a series of cross-sections in a radial (or star) pattern, and averaging the resultant cross-sections. In this study, for this size vessels, we averaged 25 cross-sections comprised of 50 A-scans. Figure 4 show a comparison among single profiles, multiple linear profiles, and radial profiles across a coronary artery. While the single profiles exhibit significant phase noise, the linear and radial profiles have lower noise compared to one another.
Fig. 4. Comparison of profile types. Profiles are separated by π/4 for clarity.
Considering the advantages of reduced phase noise and more precise alignment of the profile with respect to the lumen center, all blood velocity calculations were made using radial profiles. Figure 5 shows radial phase profiles for the images shown in Fig. 3. Flow in the coronary vessels is laminar Poiseuille flow with a parabolic shape (fit in Fig. 5). The single phase images with and without wrapping are shown in Fig. 5(a) while the composite images with and without wrapping are shown in Fig. 5(b). The Doppler frequency shift measured for the wrapped, single frame profile is 28.0 kHz.
Flow amplitude in a radial profile (or any averaged profile) represents the average flow profile across the vessel and may be lower than the instantaneous peak flow represented in individual phase pixels. Radial profiling provides spatial averaging. Similarly, the flow amplitude in composite images is usually lower than in single images because it represents the average flow profile across several cardiac cycles. Averaging images provides temporal averaging. The flow amplitude calculated thus depends upon the information sought. In this report, we sought to measure the peak flow profile across the vessel rather than the maximum flow velocity achieved at any point across the lumen. Also, we sought to measure the peak flow at any point in any cardiac cycle. The flow calculations presented below use radial profiles for spatial average on a single frame for no temporal averaging.
3.2. Structural changes in the surrounding myocardium
We observed several structural changes to the vessel and surrounding myocardium during the cardiac cycle in the intensity-phase image pair. First, the vessel morphology often changed shape ‒ becoming oblong in the transverse plane ‒ immediately after peak flow, as shown in Figs. 6(b) and 6(e). Also, in some instances we observed one frame of negative flow in the opposite direction of normal flow (Fig. 6f).
#160050 - $15.00 USD Received 15 Dec 2011; revised 27 Jan 2012; accepted 28 Jan 2012; published 13 Mar 2012(C) 2012 OSA 1 April 2012 / Vol. 3, No. 4 / BIOMEDICAL OPTICS EXPRESS 707

Fig. 5. Radial phase profiles of peak blood flow in coronary arteries from images shown in Fig. 3. (a) Single frame; (b) Composite frame (13 co-added cardiac cycle synchronized frames). Parabolic fit is shown for unwrapped profiles.
Fig. 6. Images illustrating conformation of vessel morphology during cardiac cycle. Scale bar = 200 µm.
#160050 - $15.00 USD Received 15 Dec 2011; revised 27 Jan 2012; accepted 28 Jan 2012; published 13 Mar 2012(C) 2012 OSA 1 April 2012 / Vol. 3, No. 4 / BIOMEDICAL OPTICS EXPRESS 708

3.3. Blood flow measurements
To quantify blood velocity in the coronary vessels, we measured the peak phase shift and angle between vessel and imaging beam. The blood velocity, v, is computed from
2 cos
fvnλθ
=
where f is the measured Doppler frequency shift, λ is the wavelength of light, θ is the angle between the vessel and the imaging beam, and n is the refractive index. The Doppler frequency shift f is related to the measured phase shift Δφ by
Δ2
fTϕπ
=
where T is the time between adjacent A-scans. The line scan rate used for the 1024-pixel camera was typically 46.1 kHz so the maximum detectable Doppler frequency before wrapping was ±23.0 kHz.
To obtain an accurate measure of vessel angle with respect to the imaging beam, we acquired 3-D volumes of the myocardium along the vessel and measured the vessel displacement along the optical axis (z) from the OCT intensity images. Because we did not register images to remove bulk motion associated with the beating heart, the vessel angle is convolved with this bulk motion. Figure 7 shows the results. The cardiac cycle is more apparent in the vertical displacement than the horizontal displacement. Changes in the morphology of the vessel may account for this. A simple linear regression fit through the displacement values renders the result insensitive to the bulk heart motion and also obviates
Fig. 7. Vessel angle displacement (x, y) measurement from a 3-D OCT volume.
#160050 - $15.00 USD Received 15 Dec 2011; revised 27 Jan 2012; accepted 28 Jan 2012; published 13 Mar 2012(C) 2012 OSA 1 April 2012 / Vol. 3, No. 4 / BIOMEDICAL OPTICS EXPRESS 709

any need for registration of the vessel through the complex heart motion. From the displacement results, the compound angle (A + B) can be calculated from the trigonometric identity:
( )cos cos cos sin sinA B A B A B+ = −
For the displacement results shown in Fig. 7, we calculated an angle of 69° with respect to the incident beam. The maximum coronary blood flow velocity computed from the Doppler phase shift calculated above and this beam-vessel orientation angle (assuming an average tissue refractive index of 1.4 and a wavelength of 840 nm) is 23.5 mm/s.
To quantify the phase variation for a single animal, we examined coronary artery radial profiles in the peak velocity frame for 19 consecutive cardiac cycles (Fig. 8). The average minimum phase difference was −3.66 radians (min‒max: −2.62 ‒ −4.61 radians) and the phase variance (standard deviation) was 0.48 radians, or ~13%. We obtained similar results for both 90 and 180 fps, and so the peak velocity was sufficiently sampled across the cardiac cycle for these rates. The variance was slightly lower (11%) when computed for the minimum of the fit rather than the minimum of the raw phase value.
We also examined the peak phase difference associated with coronary blood flow in all six mice imaged in this study (Fig. 9) to characterize the magnitude of variance between animals.
Fig. 8. Average, average + SD, and average-SD radial profiles across a coronary artery for a single animal through 19 consecutive cardiac cycles.
Fig. 9. Peak radial flow profiles of coronary arteries in the six mice used in this study. The animal number is shown above each profile and the phase image below each curve.
#160050 - $15.00 USD Received 15 Dec 2011; revised 27 Jan 2012; accepted 28 Jan 2012; published 13 Mar 2012(C) 2012 OSA 1 April 2012 / Vol. 3, No. 4 / BIOMEDICAL OPTICS EXPRESS 710

We first selected a single phase image that represented the peak coronary blood flow for each animal. A parabolic fit was applied to the radial profile through the vessel and the phase at the minimum of the fit for the animals was compared. Because of vessel orientation with respect to the scan beam, flow in one animal (3391) was in the opposite direction as that for the other animals. To facilitate comparison, the phase profile was inverted prior to averaging. The average minimum phase difference was −2.64 radians (min‒max: −0.79 ‒ −4.89 radians) and the variance (standard deviation) between minima was 1.42 radians, or 54%.
We examined the temporal dynamics of coronary blood flow at high speed frame rates (up to 180 fps). High frame rates were achieved by reducing the number of A-scans in the frame to 256 but without any significant loss of intensity or phase information. The scan length was also reduced to maintain beam overlap. Figure 10 shows a sequence of images recorded at 180 fps for one complete cardiac cycle. The accompanying video (Media 2) shows four cycles at a reduced rate (10 fps). The frames have been aligned axially for comparison in the presence of significant myocardial motion. The mouse in Fig. 10 had a heart rate of ~8.6 bps and so the
Fig. 10. Temporal dynamics of an epicardial coronary artery and adjacent myocardium during one cardiac cycle. The frames have been aligned axially. Scale bar = 100 µm (Media 2: 5.6 Mb).
#160050 - $15.00 USD Received 15 Dec 2011; revised 27 Jan 2012; accepted 28 Jan 2012; published 13 Mar 2012(C) 2012 OSA 1 April 2012 / Vol. 3, No. 4 / BIOMEDICAL OPTICS EXPRESS 711

Fig. 11. Flow profiles for individual frames across a single cardiac cycle (shown in Fig. 10). Each profile is offset by 100 µm. The frame number and time after cycle start (f233) are shown.
duration of a cardiac cycle was ~117 ms. Coronary artery flow occurred during ~57% of the cycle (60-70 ms).
Flow in the coronary arteries occurs predominantly during the diastolic phase of the cardiac cycle, when the myocardium is relaxing and the left ventricle filling. (This turns out to be a serendipitous circumstance for phase imaging because the frames with flow are not corrupted by bulk or local myocardial motion.) The epicardial vessel shown in Fig. 10 remains patent during the entire cardiac cycle. The peak of systole ‒ rapid ejection of blood into the aorta ‒ occurred at f226 and f248, between which the flow sequence in Fig. 10 was recorded. During rapid ejection, the surface of the myocardium moves nearly 1 mm axially and the phase images exhibit artifact associated with this bulk motion (f248). The rapid motion can also cause fringe wash-out and momentary loss of intensity in the reflectance image (f247). During rapid ejection of the left ventricle, the shape of the coronary arteries became most asymmetric (i.e., elongated in horizontal axis, f228), although vessel elongation also occurred during flow (see Fig. 6). Immediately after left ventricle rapid ejection, there is no flow in the coronary arteries (f229-f231), and the vessel appears as a void in the intensity frame, with reduced number of scatterers (e.g., erythrocytes). When coronary flow begins near the beginning of diastole, it is accompanied by a spreading wave of local myocardial relaxation (f233-f236). Peak flow was reached within ~25 ms and maintained for ~25 ms. After peak flow, there is a rapid period of flow reversal followed by a diminution of forward flow velocity before a repeat of the cardiac cycle beginning with rapid ejection during the onset of systole.
The radial profiles for the flow frames (i.e., during diastole) shown in Fig. 10 are plotted in Fig. 11. The radial profiles were shifted in phase to aid comparison of flow magnitude. The radial profiles quantify the observations made from the images, where the flow increases to its peak value within ~25 ms, maintained a constant value for nearly the same duration (from ~25 to 50 ms after coronary flow initiation), was followed by a rapid transient reversal in flow for a short duration (~5 ms), and finally a decrease in flow. Although the sequence of this cardiac cycle was typical, not all cycles for this animal exhibited this pattern. In some cycles, no coronary flow reversal was observed, although this could have been because the flow reversal occurs very rapidly and was missed even at 180 fps.
#160050 - $15.00 USD Received 15 Dec 2011; revised 27 Jan 2012; accepted 28 Jan 2012; published 13 Mar 2012(C) 2012 OSA 1 April 2012 / Vol. 3, No. 4 / BIOMEDICAL OPTICS EXPRESS 712

4. Discussion
Flow in the left main coronary arteries of 10 week and 2 year old mice was previously measured with Doppler ultrasound to be 35.4 ± 1.4 and 24.8 ± 1.6 cm/s, respectively [4]. The measurements in this paper were performed on more distal epicardial and intra-myocardial coronary arteries and so it is not unexpected that the flow amplitude would be an order of magnitude smaller due to segmentation of flow as the coronaries branch into smaller vessels.
The phase variability for measurements on a single vessel in a single animal was 10-15%. This variation is reasonable considering that, for some angular regions close to perpendicular, a 5° change in vessel angle with respect to the incident beam can cause a change of more than 30% in the measured velocity. Consequently, any variation in the incident angle will be observed as a change in phase amplitude for the same velocity. Angle variations during the large excursions that accompanied ejection in systole, even for measurements performed on consecutive beats on the same vessel of the same animal contributed to measurement variability. The incident beam may have probed a different point along the vessel axis where the velocity was higher or lower, although the variation in flow velocity along the vessel is not expected to be large. Also, the peak flow may not have been imaged when it occurred. This is probably less likely because near maximum flow was maintained in these coronary arteries for ~25 ms and so would be missed only for frame rates <40 fps. Also, the variability was about the same for frames rates of 90 and 180 fps. Finally, it is probable that the source of some component of the variability can be attributed to real anatomical and physiological sources of variation rather than measurement error. However, from the results of previous Doppler ultrasound studies, this is expected to be <10% [4].
We expected and our observations confirm that the variance between animals is higher than between cycles for a single animal. The sources of variation are the same as the single animal measurements but with a larger magnitude. For example, the ability to control the incident beam angle with respect to the vessel was limited with the three-axis stage that was used. Also, there were additional anatomical and physiological variations present (e.g., vessel diameter, scan position with respect to vessel branching, real velocity differences) when imaging one animal in comparison to another. Even in the same animal in adjacent coronary arteries, the flow was significantly different. Therefore, a large component of the variability from animal to animal may have been real flow velocity differences. Measurement of the vessel angle and full mapping of the coronary vasculature are challenges for repeatability necessary for small animal studies.
The short duration flow reversal occurs at the beginning of systole when the A-V values close and pressure in the ventricles begins to increase. After flow reversal, for an equally short duration, the remaining blood in the coronary arteries flows into the contracting myocardium before flow stops completely at the peak of systole (when the intra-myocardial vessels become completely closed). The aorta supplies the coronary artery flow passively during diastole. During rapid ejection, after the aortic value opens, flow in the coronary circulation is minimal, although the epicardial vessels remain patent (as observed in this study).
In order to make SD-ODT a better tool for use in small animal studies, several challenges must be overcome. Although SD-ODT provides excellent lateral and axial resolution of structural features and flow in small coronary arteries and veins that cannot be accomplished using Doppler ultrasound, it also has some limitations. The penetration depth is limited but can be extended with use of longer wavelengths and transparent blood substitutes. The high SD-ODT measurement speed can provide 3-D mapping of the coronary circulation and instantaneous measurement of vessel angle. (Other techniques, such a measurement of Doppler broadening and dual-beam configurations, have been implemented to eliminate or reduce the angular ambiguity [6,24]). These advances will make it easier to implement SD-ODT for in vivo longitudinal studies of flow in small animals. For example, it is conceivable that an implantable endoscopic SD-ODT probe could reliably and reproducibly measure flow
#160050 - $15.00 USD Received 15 Dec 2011; revised 27 Jan 2012; accepted 28 Jan 2012; published 13 Mar 2012(C) 2012 OSA 1 April 2012 / Vol. 3, No. 4 / BIOMEDICAL OPTICS EXPRESS 713

rates to quantify the efficacy and toxicity of drugs designed to improve cardiac perfusion and function. This development could significantly impact the study of coronary artery disease.
Acknowledgments
This work was supported by NIH grant NR 009866 (D. X. H.) and a VA merit grant (M. D. F).
#160050 - $15.00 USD Received 15 Dec 2011; revised 27 Jan 2012; accepted 28 Jan 2012; published 13 Mar 2012(C) 2012 OSA 1 April 2012 / Vol. 3, No. 4 / BIOMEDICAL OPTICS EXPRESS 714