
CHAPTER 14. MOOD DISORDERS 14.8 MOOD DISORDERS: TREATMENT OF

Imaging and Mood Disorders:Physiologic Biomarkers
PG4 New Frontiers inNeuropsychopharmacology, 1/9/07
Ian A. Cook, M.D.Director, Unipolar Depression Research Program
UCLA Department of PsychiatrySemel Institute for Neuroscience
and Human Behavior
Why Biomarkers, generally?
• Problems with direct measures of thebiological process you really care about
• Obtain data in a more useful timeframe• Illuminate the causes, prevention, course,
or mechanisms of treatment
Kraemer et al., Am J Geriatr Psychiatry 2002
Why Biomarkers in Mood Disorders?• Enhance treatment outcomes by using
physiologic guidance in treatment planning• Examine biological heterogeneity in
patients presenting with depressivesymptoms, and relationship to outcome
• Differentiate between specific response to atreatment, and nonspecific response to thetreatment process (placebo), for new drugdiscovery and development
Challenges in Managing MDD• While antidepressants lead to symptomatic
improvement in MDD, remission is not thecommon outcome
• Failure to enter remission with initial treatmenthas ominous consequences - symptomaticsuffering, but also functional disability andimpairments, and elevated risk of full relapse
• Evidence-based algorithms may enhanceoutcomes, but still have required the use ofsequential treatment trials for each patient
• Biomarkers of remission could improveoutcomes by guiding treatment plans

Trivedi MH, et al. Am J Psychiatry. 2006;163:28-40.
%
Only 1/3 of patients achieved remission with first treatment trial
67%
Mild symptoms≈28%
Moderatesymptoms
≈23%
Severe symptoms≈12%
Very severe symptoms≈4%
Depressive symptoms (QIDS-SR score) after up to 12 wk antidepressant treatment
STAR*D Study (N=2,876)
Remission≈33%
STAR*D L1: Remission is Uncommon
0
1
2
3
4
5
6
7
8
9
10
0 1 2 3 4 5 6 7 8 9 10 11 12 13 14 15 16 17 18 19 20 21 22 23 24 25 26 27
Predictors of Response I• Clinical & Demographic: include specific symptom clusters (e.g.
melancholia, anxiety), coexisting personality disorder, delusionalfeatures, medical comorbidities, psychomotor slowing,attunement, expectations, family history, functional impairment,episode duration …
• Biological: include presence of structural brain changes, auditoryevoked potentials, dichotic listening tasks, REM latency,neuromotor slowing, thyrotropin releasing hormone stimulationtest, dexamethasone suppression test …
• Tend to identify features separating responders andnonresponders, but they have not yet yielded a predictor ofoutcome that has been embraced in clinical practice.
cf Nierenberg Psych Clin N Am 2003, Perlis et al Psych Clin N Am 2003, Trivedi J Clin Psychiatry 2005.
Predictors of Response II• Neuroimaging studies have pointed to
• Increases in activity in paralimbic or caudate regions withtreatment
• Cortical activity decreases with effective treatment in prefrontalregions
• Reports often assessed pre- to post-treatment changes; not inthe timeframe useful for treatment planning
• Some studies suggest changes arise in responders early intreatment (e.g. during index course of ECT), but prior studiesdid not indicate how early predictive changes might be found
• Issues with dosimetry, cost, and access outside of researchsetting, may limit clinical application of PET and SPECT
Mayberg 1997; Drevets 1994; Sackeim 1990, 1994; Nobler 1994; Brody 2001
Predictors of Response III• Neurophysiology studies suggest a rationale for
biomarkers based on monitoring brain function duringtreatment with surface EEG recordings
• Prefrontal (PFC) and anterior cingulate cortex (ACC) arelinked by white matter tracts as part of a neural circuit
• In the theta band, EEG activity in PFC is correlated withMEG signals in ACC
• Source localization techniques find differences in ACCtheta currents between responders and nonresponders
• Responders and nonresponders differ in theta EEG power• Deep brain stimulation of ACC leads to symptom
improvement in MDD
Ishii et al., Neuroreport 1999; Asada et al., Neurosci Lett 1999; Phan et al., Neuroimage 2002; Knott et al., JAD 1996; Pizzagalli et al., AJP 2001; Mayberg et al., Neuron 2005; Siegel AJP 2006

Classic Neuroimaging
Hippocampal Volume and Depression:A Meta-Analysis of MRI Studies
Videbech & RavnkildeAm J Psychiatry 2004
Meta-analysis examination of MRIstudies of hippocampal volume inmood disorder
12 studies in unipolar depressionhad examined 351 patients and 279healthy subjects
Depression was associated with an8% reduction in hippocampalvolume on the left (top) and 10%reduction on the right side (bottom)
Untreated Depression and Hippocampal Volume Loss
Sheline Am J Psychiatry 2003
Study of relationship ofhippocampal volume to durationof illness and to duration ofuntreated illness in MDD
Hippocampal volume wasmeasured with MRI in 38 womenwith recurrent MDD in remission
Duration of untreated illness isbetter predictor of volume lossthan overall illness, suggestingtreatment may be neuroprotective
Hippocampal Volume and First Major Depressive EpisodeAfter Cancer Diagnosis in Breast Cancer Survivors
Inagaki Am J Psychiatry2004
Study of whether hippocamal volume wasassociated with developing a first episode ofmajor depression after being diagnosed withbreast Ca
Hippocampal volume was measured with MRI in68 female survivors of breast cancer: 17 with afirst MDE after dx, and 51 with no lifetime dx
First major depressive episodes after cancerdiagnosis in female cancer survivors do notappear to be associated with hippocampal volume

MRS in SSRI Discontinuation
Kaufman Biol Psychiatry 2003
Study neurochemicalchanges associated withdiscontinuation of an SSRImedication (“drug holiday”)
13 subjects with MDDstabilized on FLU and 13 onPAR underwent PBOsubstitution for 1 week
Plate A: voxel placement inrostral anterior cingulatePlate B: spectra while onparoxetine (lower trace) andafter 3d on PBO (upper)
Ch:Cr ratio was decreased in subjects reporting discontinuation symptoms,compared with asymptomatic subjects
May reflect altered activity in ACC associated with discontinuation syndrome
Regional Brain Activity in MDD Tx
Brody Arch Gen Psychiatry 2001
Study of changes in brainmetabolism during treatment forMDD with paroxetine orinterpersonal therapy (IPT)
24 MDD and 16 controls hadFDG-PET before and after 12wks of treatment
PAR - bilateral PFC decrIPT - Right PFC onlyBoth groups - L Ant cing decr
Two interventions yield somesimilar yet some contrastingpatterns of change in brainactivity
PAROXETINE IPT
SSRIs in MDD vsOCD
• SSRIs are effective treatments for both MDD and OCD• OCD response correlated with higher pre-tx metabolism in R caudate• MDD response correlated with higher pre-tx in medial PFC, and rostral
ACC (above), and lower values in amygdala and thalamus• Suggests different substrates in different disorders
Saxena Amer J Psychiatry 2003
Predictors of Lithium Response• Positive Response:
Loudness-dependent AEP; higher brain [Li]; lower inositol monophophatasemRNA expression; higher 5HT-induced Ca mobilization; increased NAA peak anddecreased myo-inositol peak on MRS; white matter hyperintensities; decreasedintracellular pH; higher frequency of phospholipase C gamma-1 (PLCGI)-5 repeatand PLCGI-8 repeat; C973A polymorphism in inositol polyphosphate 1-phosphatase gene
• Negative Response:Epileptiform abnormalities on EEG; human leukocyte antigen A3; decreasedphosphocreatine peak after photic stimulation; homozygotes for short variant ofserotonin transporter gene.
• Most predictors of good response are also risk factors for BAD, so lithium-responsive BAD may be a distinct subtype with special neurobiological basis.
• “The search for biological predictors of lithium response is still in its infancy”
Ikeda & Kato. Psychiatry Clin Neurosci 2003

Deep Brain Stimulation• Electrodes have been implanted into brain
tissue to manage movement disorders.• At Brown (Butler Hospital) 5 patients with
MDD were implanted in the ventral striatum; 3of 5 met response criteria, the other twoslowed lesser improved.
• At Univ. of Toronto (Rotman Inst.) 6 patientswith MDD were implanted into the subgenualcingulate white matter (BA 25) and underwenthigh frequency stimulation (130Hz, 60µS pw).At 6 months, 66% met response criteria, and50% met remission (though 2/6 requiredexplantation)
Friehs Proc Int Funct Electr Stim Soc 2005 Ann Meeting; Mayberg Neuron 2005
rCBF changes from DBS• Compared with matched controls,
baseline differences include* high subgenual cingulate (Cg25)* low dorsal anterior cingulate(Cg24)* low dorsolateral PFC (F9)* low ventromedial PFC (F47)
• After 3 months of DBS* ACC, F9/46 PFC now high* subgenual now low* orbitofrontal (oF11) low* medial frontal (mF10) low* hypothalamus (hth) low
Mayberg Neuron 2005
Physiologic Biomarkers
• Study regional brain activity duringtreatment to detect early changesthat are related to outcome
• Develop tools that could be scaledfor use in clinical practice
Quantitative EEG• Computer processing calculates “power spectrum”
• Interpretations have limited integration with othermeasures of brain activity (e.g. PET, SPECT, fMRI)
• Can a measure combine values derived from powerspectra into more meaningful and interpretablemeasures?
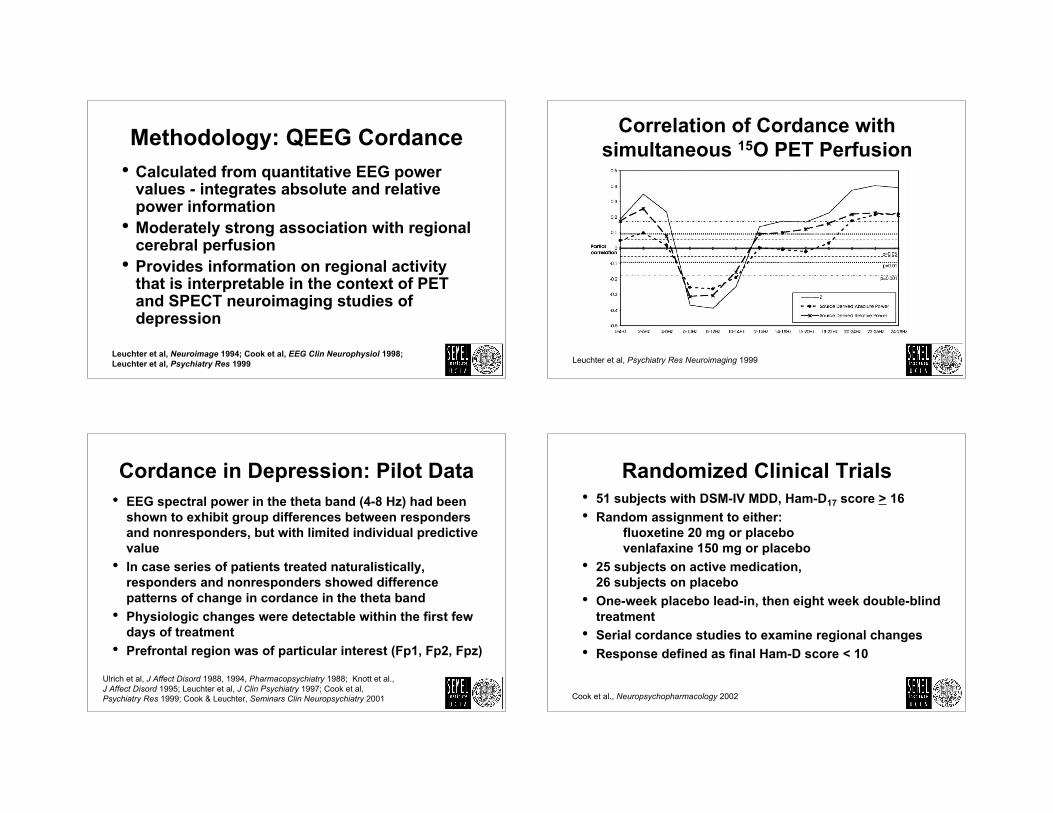
Methodology: QEEG Cordance• Calculated from quantitative EEG power
values - integrates absolute and relativepower information
• Moderately strong association with regionalcerebral perfusion
• Provides information on regional activitythat is interpretable in the context of PETand SPECT neuroimaging studies ofdepression
Leuchter et al, Neuroimage 1994; Cook et al, EEG Clin Neurophysiol 1998;Leuchter et al, Psychiatry Res 1999
Correlation of Cordance withsimultaneous 15O PET Perfusion
Leuchter et al, Psychiatry Res Neuroimaging 1999
Cordance in Depression: Pilot Data• EEG spectral power in the theta band (4-8 Hz) had been
shown to exhibit group differences between respondersand nonresponders, but with limited individual predictivevalue
• In case series of patients treated naturalistically,responders and nonresponders showed differencepatterns of change in cordance in the theta band
• Physiologic changes were detectable within the first fewdays of treatment
• Prefrontal region was of particular interest (Fp1, Fp2, Fpz)
Ulrich et al, J Affect Disord 1988, 1994, Pharmacopsychiatry 1988; Knott et al., J Affect Disord 1995; Leuchter et al, J Clin Psychiatry 1997; Cook et al, Psychiatry Res 1999; Cook & Leuchter, Seminars Clin Neuropsychiatry 2001
Randomized Clinical Trials• 51 subjects with DSM-IV MDD, Ham-D17 score > 16• Random assignment to either:
fluoxetine 20 mg or placebo venlafaxine 150 mg or placebo
• 25 subjects on active medication,26 subjects on placebo
• One-week placebo lead-in, then eight week double-blindtreatment
• Serial cordance studies to examine regional changes• Response defined as final Ham-D score < 10
Cook et al., Neuropsychopharmacology 2002

HAM-D17 Ratings over Time Early Prefrontal Decrease in M-R
Cook et al., Neuropsychopharmacology 2002 p<0.05 † from baseline, * between group
Prefrontal Decreases in M-R
Cook et al., Neuropsychopharmacology 2002
PFC Decrease is Unique to M-R
Cook et al.,Neuropsychopharmacology 2002

Early Changes on Med and 8 week Ham-D17
r = 0.51p = 0.002
Cook et al., Neuropsychopharmacology 2002
Week 1 Test Performance• Using a cut-point of “0” (so any decrease is
considered predictive of response) how doesthis relate to final outcome?
• Sensitivity - 69%• True Positivity - rate correctly classified by test has
having the “condition” (response)• Specificity - 75%
• True Negativity - rate correctly classified by test asnot having the condition
• Test Accuracy - 72%• overall “correctness” of classification
Week 2 - ROC Analysis• Data re-analyzed at 2 week point, as this was
a common decision point in clinical care, andmight be a point where clinicians would beopen to biomarker guidance
• Receiver Operating Characteristic (ROC)curve analysis suggested cut-point of -0.5
• Sensitivity - 77%• Specificity - 92%• Test Accuracy - 84%
ROC Analysis

Replication & Extension:Stage 1 Treatment Resistant Depression
• 12 subjects were treated naturalistically with an SSRIand failed to respond (3 FLX, 3 SER, 1 PAR, 5 CIT)
• Next treatment* was selected by their physician, blindedto EEG results
• EEGs recorded at cross-over and after ~1-2 weeks• 9/12 were classified correctly (5/6 R, 4/6 NR) - sensitivity
83%, specificity 67%, test accuracy 75%, effect size .53• Findings support the use of cordance biomarkers in
TRD patients, without imposing a washout period• Difference in accuracy (v 84%) ? due to TRD and/or
carry-over effect of medication on-board and/or small N
Cook et al., J Psychiatry Res 2005*Subsequent Treatments: in-class switch n=2; out-of class switch n=4 augmentation n=6 (bupropion, buspirone)
Independent TRD Replication• Bareš and colleagues at the Prague Psychiatric Centre
(Czech Republic) independently implemented cordance• Enrolled 17 inpatients with Stage 1 TRD in a 4 wk trial• Next treatments* were chosen clinically (open label)• Measured EEGs and clinical symptoms (MADRS) at
baseline and after 1 and 4 weeks, with ≥50%improvement as threshold for response (5 of 17, 29%)
• Sensitivity: 100% - 5 of 5 responders decreased• Specificity: 83% - 10 of 12 nonresponders did not decr.• Test accuracy: 88% - 15 of 17 correctly predicted by
changes in prefrontal cordance at week 1
Bares et al., J Psychiatry Res 2006 *Next Tx: 4 SSRI, 8 SNRI, 2 NDRI, 2 TCA, 1 other
Biomarkers of Remission in MDD• In an experiment to learn how cordance changes in never-
depressed subjects during medication exposure, 32 healthyadults received venlafaxine and EEGs
• Hierarchical cluster analysis identified electrodeswith high inter-correlation in midline and rightfrontal cortical areas (“MRFC”): FPz, Fz, FP2, AF2, F4, F8
• 37 subjects from our RCTs were then reanalyzed using thisROI and Ham-D17 ≤5 as remission (13 FLX, 24 VLX).11 of 37 remitted (30%)
• With logistic regression, decrease in MRFC at 1 wk wasassociated with remission (p=0.02) (trend at 2 wks, p=0.06)
• Using ROC analysis, area under the curve was 0.73. Withcutpoint of 0, prediction of remission with 68% accuracy (90%sensitivity, 58% specificity)
Cook et al. NCDEU poster, 2006; Leuchter et al., in submission
Cordance Changes in Remission
Cook et al. NCDEU poster, 2006

Treatment Resistant Depression• “Response Variability in Treatment Resistant Depression”
Collaborative R01 Project, Ancillary Study to STAR*D• UCLA and Mass General Sites• Enroll 200 subjects with unipolar MDD and treat with an
SSRI (escitalopram); EEG at start and after 2 wks• Those who do not remit by week 12 can be treated with a
second agent (sertraline); another pair of EEGs at crossover and 2 weeks into the second treatment
• Examine robustness of the biomarker predictions in thiseffectiveness trial setting
R01 MH 069217 (Cook) & R01 MH 069180 (Alpert)
Alternative Technology: BRITE-MD• Biomarkers for Rapid Identification of Treatment
Effectiveness in Major Depression• Multi-center study of a reduced-montage EEG
system for biomarkers of response and remission• One-week challenge with escitalopram, then
randomized assignment to 12 weeks ofescitalopram, bupropion, or combination
• Ten sites: Baylor, Cedars-Sinai, Harbor UCLA, MGH,Northwestern, UCLA/Semel, UCSD, UPMC/WPIC,UT Southwestern, R/D Clinical Research
Sponsor: Aspect Medical Systems, Inc.
Specificity of Biomarkers: SPARC-MD• Specific Prediction of Antidepressant Responses with
Cordance in Major Depression: collaborative R01application (UCLA, UT Southwestern)
• Examine whether the biomarker predicts a likelihoodof remission with a specific antidepressant or a moregeneral likelihood of remission
• Measure two biomarkers prior to the treatment trial(escitalopram and bupropion) and test associationsbetween biomarker predictions with the treatmentagent vs those with the other medication

SPARC-MD Design
• 172 adults with MDD (86/site)• Test specificity of the prediction using
Biomarkers for T1, T2, and T3 periodsOutcomes for TxA and TxB periods
Integrating Biomarker Guidanceinto Treatment Management
EEG tests atbaseline and
after 1 week oftreatment
PredictedNon-Remitter
PredictedRemitter
•Encourage treatmentadherence
•Avoid unnecessaryswitching and/oraugmentation
More patientsachieve response /
remission
•Progress to next step(s)in treatment sequencemore quickly
•Prevent treatmentdiscontinuation beforeachieving remission
Patients achieveresponse /
remission sooner
Less cost, lessimpairment/disability,
less relapse
Possible long-termimpactPossible immediate
impactPatient category
Side Effect Biomarkers• Adverse effects may be related to pharmacodynamic and/or
nonpharmacodynamic effects (e.g., nocebo phenomena)• 32 never-depressed adults randomized to placebo (n=15) or
venlafaxine IR (n=17)• 1 week PBO lead-in, 4 weeks treatment• Medication side effects - semi-structured interview• SE burden was associated with prefrontal EEG changes at the
end of lead-in (r=-0.67 p<0.003) at 2 weeks (r=-0.77 p<0.002) and4 weeks (r=-0.77 p<0.004) post-randomization
• Variance in SE burden is explained by EEG changes duringlead-in; subsequent changes do not add greater explanatorypower.
Hunter et al., Neuropsychopharmacology 2004
Side Effect Biomarkers
Hunter et al., Neuropsychopharmacology 2004

Pretreatment Features• Pizzagalli built on the PET work from Mayberg (1997) and Wu (1999), by using
LORETA - low resolution electromagnetic tomography, with 18 adults treatedwith nortriptyline for MDD.
• Theta activity in the rostral-most anterior cingulate (Brodman 32, 24, some of10) was related to outcome - better response accompanied higher pretreatmentvalues (but only 2 NR)
Pizzagalli et al., Am J Psychiatry 2001
Nonspecific vs Specific Response
Placebo vs “Specific” Response• Classically, response to placebo is marked
by a quick but transient improvement insymptoms
• Placebo lead-in is intended to remove themfrom most RCTs
• How is placebo response related to specificresponse - time course, physiologicchanges?
HAM-D Ratings over Time

Later Changes Characterize P-R
Leuchter et al, Am J Psychiatry 2002
2 weeks 4 weeks 8 weeks
MedicationResponders(n=13)
PlaceboResponders(n=10)
Identification of PBO Response• Responders to PBO had at baseline
• Lower frontocentral cordance (AF1, AF2)• Faster cognition (digit-symbol)• Less terminal insomnia
• Logistic regression model identified 97.6% ofPBO-responders
• Extension project now funded (NCCAM)
Leuchter et al., Psychopharmacology 2004; R01 AT002479 (Leuchter PI)
Conclusions• Functional neuroimaging with PET and related techniques
continues to reveal features of neurobiology in mooddisorders in a research setting
• Physiologic neuroimaging with EEG may be better suited toclinical application in a treatment setting
• Decreases in prefrontal cordance characterized themedication responders, and were found as early as 48 hoursinto treatment
• Replication with SSRI and mixed-action meds; biomarkernow undergoing large-scale tested in the effectivenesssetting
• Prefrontal activity may be associated with side effects aswell as with therapeutic effects
www.DepressionLA.com www.depression.ucla.edu