Town & Country Club Idea Fair-Bee Meet and TED Global Presentation

Revised: 10/12/18
Imagine School at Town Center
SCIENCE FAIR STUDENT HANDBOOK
2018-2019

Imagine Schools
Science Fair Student Handbook
Table of Contents
Science Fair Questions .................................................................................... 1
Category Descriptions ...................................................................................... 3
Progression Plan .................................................................................................. 5
Data Notebook Guidelines ............................................................................... 6
Report Guidelines ............................................................................................... 7
Report Components ............................................................................................ 8
Bibliography Guidelines ..................................................................................... 12
Display Board Guidelines .................................................................................. 13
Display Board Format ........................................................................................ 14
Oral Presentation ............................................................................................... 15
APPENDIX
Resources
Helpful Websites
Forms
Parent Acknowledgement Form
Student Documentation Form
Bibliography Worksheet
4th Grade Judging Form
5th Grade Judging Form
Middle School (Grades 6th-8th) Judging Form

Imagine Schools
Science Fair Student Handbook
1
SCIENCE FAIR QUESTIONS
WHAT IS A SCIENCE FAIR PROJECT?
A science fair project is a chance for the student to be the scientist and explore a
subject of interest. It allows for self-directed exploration of the scientific process,
application of scientific methods, develops research, writing, critical thinking, and
language skills. It helps to stimulate curiosity, and encourages students to HAVE FUN
while they are learning.
Science fair is a key instructional method to implement the Common Core, and the Next
Generation Standards. The end result of science fair is problem-based inquiry style
learning. This type of learning helps students refine valuable skills they need for the
21st century (such as critical thinking, collaboration, and communication).
All science fair projects contain five main components.
1. Scientific Investigation & Research
2. Expermimentation
3. Critical Thinking
4. Communication
5. Applying Scientific Methods.
WHAT IS THE SCIENTIFIC METHOD?
The Scientific method is a procedure that scientists use to answer questions and solve
problems. They are as follows:
1. Ask a question
2. Form a hypothesis
3. Test the hypothesis
4. Analyze the results
5. Draw conclusions
6. Communicate results
Imagine Schools
Science Fair Student Handbook
2
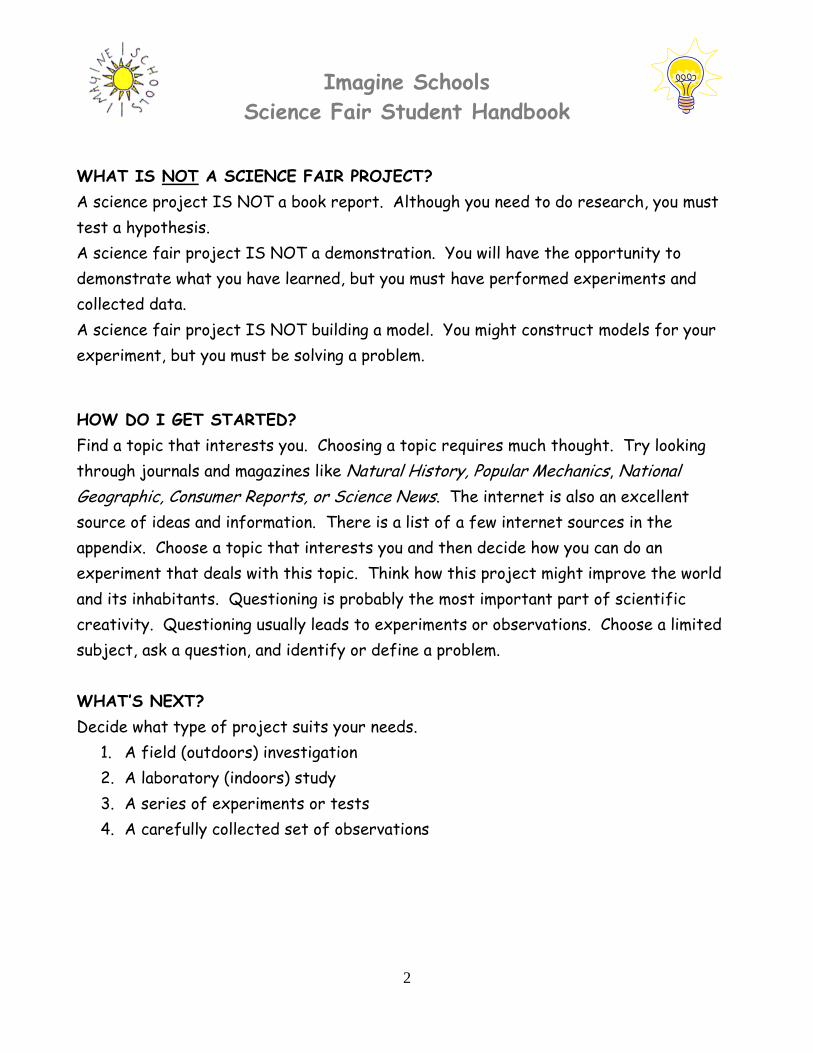
WHAT IS NOT A SCIENCE FAIR PROJECT?
A science project IS NOT a book report. Although you need to do research, you must
test a hypothesis.
A science fair project IS NOT a demonstration. You will have the opportunity to
demonstrate what you have learned, but you must have performed experiments and
collected data.
A science fair project IS NOT building a model. You might construct models for your
experiment, but you must be solving a problem.
HOW DO I GET STARTED?
Find a topic that interests you. Choosing a topic requires much thought. Try looking
through journals and magazines like Natural History, Popular Mechanics, National
Geographic, Consumer Reports, or Science News. The internet is also an excellent
source of ideas and information. There is a list of a few internet sources in the
appendix. Choose a topic that interests you and then decide how you can do an
experiment that deals with this topic. Think how this project might improve the world
and its inhabitants. Questioning is probably the most important part of scientific
creativity. Questioning usually leads to experiments or observations. Choose a limited
subject, ask a question, and identify or define a problem.
WHAT’S NEXT?
Decide what type of project suits your needs.
1. A field (outdoors) investigation
2. A laboratory (indoors) study
3. A series of experiments or tests
4. A carefully collected set of observations

Imagine Schools
Science Fair Student Handbook
3
CATEGORY DESCRIPTIONS
Projects will be assigned to one of the following ten categories based on the problem
solved, research, and application.
Behavioral and Social Sciences*: Human and animal behavior, social
and community relationship – psychology, sociology, anthropology,
archaeology, learning, perception, urban problems, public opinion
surveys, educational testing, etc.
Biochemistry*: The chemistry of life processes – molecular biology,
molecular genetics, enzymes, photosynthesis, blood chemistry, protein
chemistry, food chemistry, metabolism, and hormones.
Biology (including Microbiology and Zoology): The study of the
anatomy, physiology, and processes of living things - bacteriology,
virology, protozoology, fungi, yeast, animal development, pathology,
physiology, systematics.
REMEMBER: You can’t display micro-organisms, someone may be allergic to them!
Botany: The study of plant life – agriculture, agronomy, horticulture,
forestry, plant taxonomy, plant physiology, plant pathology, plant
genetics, hydroponics, algae, etc.
Chemistry: The study of the nature & composition of matter, and the
laws governing it – physical chemistry, organic chemistry, inorganic
chemistry, materials, plastics, fuels, pesticides, metallurgy, soil
chemistry, etc.
You may test some consumer products here.

Imagine Schools
Science Fair Student Handbook
4
CATEGORY DESCRIPTIONS (cont.)
Earth, Space & Environmental Sciences:
(Earth Science) The Study of Earth’s structure and processes. -
geology, mineralogy, physical oceanography, meteorology, seismology,
geography, topography.
(Space Science) – astronomy, star visibility, astrological computations
You can’t test planets, star, or the moon – no solar systems please. (Environmental Science) – The study of interactions among physical,
chemical, and biological components of the environment – air, water, and
land pollution sources and their control, ecology, waste disposal, impact
studies, etc.
Engineering: Technology projects that directly apply scientific
principles to manufacturing and practical uses – civil, mechanical,
aeronautical, chemical, electrical, photographic, sound, automotive,
marine, heating and refrigeration, transportation, etc.
Math and Computer Science: Probability, statistics, applied math and
analysis, artificial intelligence, algorithms, databases, programming
languages, operating systems, networking, computer graphics, etc.
Medicine and Health*: The study of diseases and health of humans and
animals – medicine, dentistry, pharmacology, pathology, veterinary
medicine, nutrition, sanitations, pediatrics, allergies, speech and
hearing, etc.
Physics: The study of matter, energy, and forces – states of matter,
thermal energy, chemical energy, radiant energy, electricity, sound
waves, light waves, conductors, insulators, gravity, magnetism, forces,
simple machines, friction, etc.
*BE CAREFUL: When working with humans or animals you must get PRIOR approval from your teacher.
NO HUMANS OR ANIMALS MAY BE HURT DURING THE PROJECT!

Imagine Schools
Science Fair Student Handbook
5
Use this Progression Plan to help you stay on track with your project.
PHASE DESCRIPTION COMPLETE
INFO
ISTC Parent Info Night – school cafeteria 6:30 pm, Tues. Oct. 23, 2018
10/23/18
Generating
Ideas
1. Complete Parent/Guardian Acknowledgement Form
2. Brainstorm possible subjects or categories.
3. Write investigation questions for each topic.
4. Chose a topic and question that interests you.
5. Form a hypothesis.
6. Start recording ideas in data notebook.
Due:
10/29/18
Planning and
Researching
1. Complete Student Documentation Form
2. Research the hypothesis.
3. Find reliable sources of information from the internet, books,
encyclopedias, media, and professionals in the field of study.
4. Record research information in the data notebook.
5. Compile information for a bibliography if required.
(see Bibliography Worksheet)
6. Plan an experiment to test the hypothesis. (How will you test your
hypothesis to find if it is valid? Where will you conduct your
experiment? What will be your controls and variables?)
7. Write out your procedures.
8. Obtain needed supplies.
Due:
11/16/18
Bibliography
Due:
11/30/18
Collecting and
Organizing
1. Set up experiment. Safety first!!
2. Make data tables.
3. Conduct at least three trials (validity) and record data
(measurements & observations) in tables in your data notebook.
4. Record any on-going observations, and thoughts after the
experiments are complete.
Analysis
1. Write overall results in data notebook.
2. Create graphs, charts, and visuals to help explain your results.
Communication
1. Finalize notebook
2. Compile and type a report (see requirements for grade level)
3. Create display board (see requirements for grade level)
4. Prepare a visual display using props, multimedia, etc. (optional)
5. Prepare a short oral presentation of your project
Submission &
Presentation
Classroom Presentations: turn in and present your project
(See requirements per grade level)
Start:
12/3/2018
Competition
ISTC School Fair: Tuesday, December 18, 2018 in cafeteria
Regional Fair: Tuesday, January 15, 2019 in Kissimmee, FL
Compete:
12/18/18

Imagine Schools
Science Fair Student Handbook
6
DATA NOTEBOOK GUIDELINES A data notebook is mandatory for all grades (4th through 8th).
When you do an experiment, you make observations. You may record changes in your
subjects, make notes about possible influences in your experiment that you didn’t
anticipate, or draw pictures of results along the way. All scientists are constantly
recording relevant observations. Graphs, charts or tables should represent the data
properly (preferably with metric units if applicable). A data notebook is a journal that
may be set up to reflect observations by the week, day, hour or minute, depending on
the type of experiment. You could organize it by putting a day’s observation on each
page. A student’s data notebook should also contain any other notes he/she may have
made from the research, such as article summaries, important phone numbers or even
possible contacts. Entries should be neat, dated, and orderly. Data notebooks maybe
handwritten or typed. It should be a complete and accurate record of the student’s
project from start to finish. The data notebook is both qualitative (observations with
senses) and quantitative (numbers & measurements). It shows all the time and effort
that went into the project.
Suggestions: ½ inch binder, composition book, spiral notebook, or folder.
Day 1
January 20th
Subject 1: I notice
that there are some
holes on my
leaves. I think
bugs have gotten
into the
experiment
Day 2
January 21st
My dad said to
spray the plants
with an equal
amount of bug
spray. I will have
to add this control
to my list.
Day 3
January 22nd
I measured the
plant growth of all
three plants.
#1 = 1cm
#2 = 1cm
#3 = 1.5cm

Imagine Schools
Science Fair Student Handbook
7
REPORT GUIDELINES
A typed report is not required for 4th or 5th grade students. However, some
components needed for the display board are described in the report section.
A typed report is mandatory for all middle school students (grades 6 through 8).
The typed report is a formal presentation of the research, investigation,
experimentation, and conclusions. It gives detailed information about the science
project, and scientific methods. It may include pictures, diagrams and added knowledge
the student has gained through reading or research, experimentation, or interviews.
The entire report should be typed (12-14 font), easy-to-read, double-spaced, and placed
3-ring binder or folder. The cover should state the project title and a graphic. It
should not include the student’s name. Components of the report must be neat and in
order.

Imagine Schools
Science Fair Student Handbook
8
REPORT COMPONENTS
ALL of the following components must be included in the report and follow the same
order. Those components marked with an asterisk (*) must also appear on the
display board.
Title Page: Students need to have a title that reflects their science project. This is not
the problem. Type only the project title; Center the project title. Do not type student
name or any other information on this page. Students should include graphics, clip art,
or pictures.
*Abstract: A summary of the project in a brief paragraph form. This is a one page,
250-word maximum summary of the entire project that includes the components below.
It is one of the last items done. Judges and the public should have a fairly accurate
idea of the project after reading the abstract. It should only include procedures done
by the student. Work done by someone else (scientist) must not be included.
Abstract Components (in paragraph form)
1. Problem: The question telling what the student is trying to find out.
2. Purpose: The statement that explains why the student is doing the experiment.
3. Hypothesis: An explanation of what prompted the student’s research, and what
the student thinks the outcome might be (before doing the experiment).
4. Procedures: A brief summary of how the experiment was performed.
5. Results: A brief description of the important results that lead directly to the
student’s conclusion.
6. Conclusions: A brief summary of why you believe the experiment had those results
and if your hypothesis was supported or not.
7. Applications: A brief summary of how you think your results can be used by
others.
Imagine Schools
Science Fair Student Handbook
9
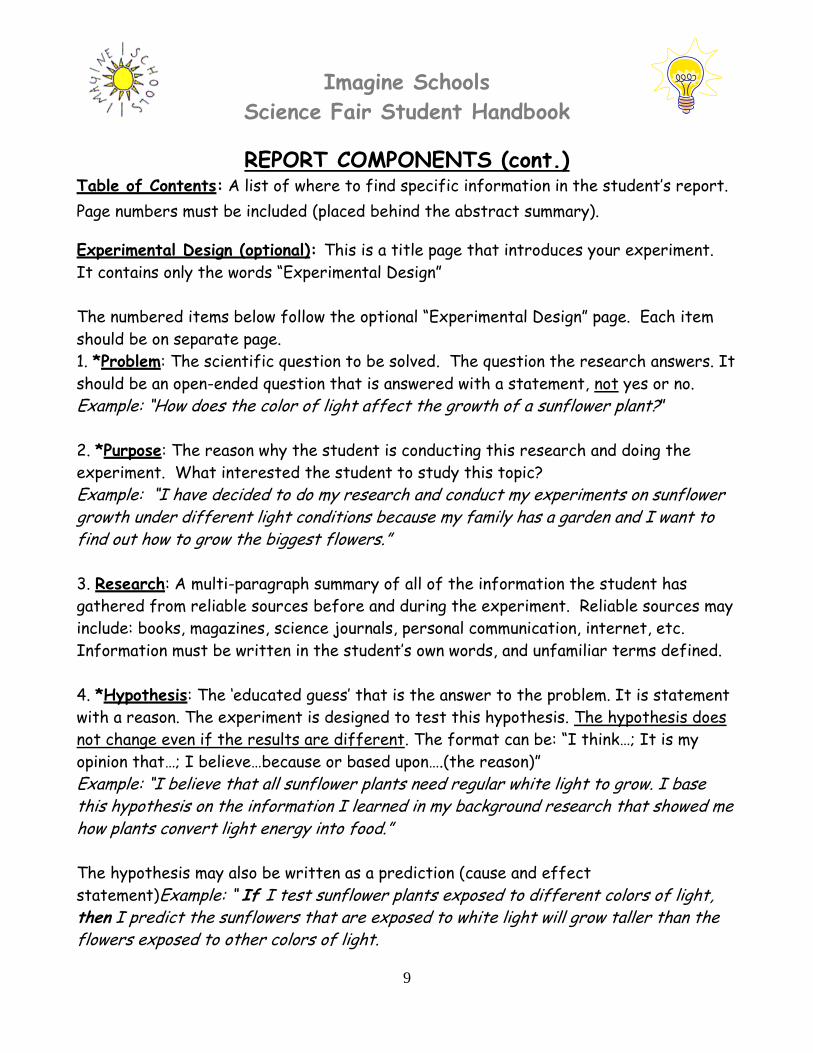
REPORT COMPONENTS (cont.) Table of Contents: A list of where to find specific information in the student’s report.
Page numbers must be included (placed behind the abstract summary).
Experimental Design (optional): This is a title page that introduces your experiment.
It contains only the words “Experimental Design”
The numbered items below follow the optional “Experimental Design” page. Each item
should be on separate page.
1. *Problem: The scientific question to be solved. The question the research answers. It
should be an open-ended question that is answered with a statement, not yes or no.
Example: “How does the color of light affect the growth of a sunflower plant?”
2. *Purpose: The reason why the student is conducting this research and doing the
experiment. What interested the student to study this topic?
Example: “I have decided to do my research and conduct my experiments on sunflower growth under different light conditions because my family has a garden and I want to find out how to grow the biggest flowers.”
3. Research: A multi-paragraph summary of all of the information the student has
gathered from reliable sources before and during the experiment. Reliable sources may
include: books, magazines, science journals, personal communication, internet, etc.
Information must be written in the student’s own words, and unfamiliar terms defined.
4. *Hypothesis: The ‘educated guess’ that is the answer to the problem. It is statement
with a reason. The experiment is designed to test this hypothesis. The hypothesis does
not change even if the results are different. The format can be: “I think…; It is my
opinion that…; I believe…because or based upon….(the reason)”
Example: “I believe that all sunflower plants need regular white light to grow. I base this hypothesis on the information I learned in my background research that showed me how plants convert light energy into food.”
The hypothesis may also be written as a prediction (cause and effect
statement)Example: “ If I test sunflower plants exposed to different colors of light, then I predict the sunflowers that are exposed to white light will grow taller than the flowers exposed to other colors of light.

Imagine Schools
Science Fair Student Handbook
10
REPORT COMPONENTS (cont.)
5. Subject(s): Explain what organism, item or parameter you are testing. Any matter,
living or nonliving is the subject.
Example: “The subject of my experiment is sunflower plants.”
6. *Constants: The parameters that are kept the same so that the experiment is valid.
The factors that you do not change during the experiment.
Example: “The constants in my experiment are: the type of sunflower plants (same original height), type and amount of potting soil, temperature, amount of moisture, and amount of light exposure.”
7. *Variable(s): The item(s) that change during the experiment that are being tested.
The manipulated (independent) variable is the factor that you are testing. The
responding (dependent) variable is what is measured as a response. (Both terms will be
accepted- manipulated/independent; responding/dependent)
Example: “The manipulated variable in my experiment is the color of light and the responding variable is the height of the plant in centimeters.”
8. *Materials: A bulleted list of any supplies necessary to complete your study of the
problem and testing of your hypothesis. Be sure to include the measurement and
quantity of items listed.
9. *Procedures: A step-by-step process used to carry out the experiment. It should be
detailed so that someone would be able to repeat the experiment. Use numbers to list
steps beginning with a verb (like in a recipe). Do not use pronouns and informal language.
The experiment must be done at least three times to increase the validity of your
results. It is highly recommended to use the metric system!
Example: 1. Measure 500mL of de-ionized water into three plastic cups 2. Time the reaction with a stopwatch with 0.1 second accuracy
3. Place each type of AA alkaline batteries into each plastic cup 4. Record results 5. Repeat steps two more times for trials two and three

Imagine Schools
Science Fair Student Handbook
11
REPORT COMPONENTS (cont.)
10. *Data: Graphs, tables, charts, pictures, and diagrams that represent your data in an
easy- to- see format that is a good representation. It is recommended that you use
metric measurements. Students must include a minimum of one.
11. *Results: A summary of what was the overall outcome of your experiment based on
your data. Just give the facts not your interpretation (interpretation goes in the
conclusion section).
Example: “After completing the experiment, the sunflower plants grown in the white light grew an average of 5 centimeters higher than the plants exposed to the other colors of light.”
12. *Conclusion: Write a thoroughly defined summary in paragraph format about what
you discovered, and how the results compare to your hypothesis. Was your hypothesis
supported or not by data collected from your experiment? How did your data collected
through experimentation relate to information that you collected through research?
Example: My hypothesis was… The results did support my hypothesis. The plants exposed to white light grew taller than the plants exposed to other colors of light. My hypothesis should be accepted as valid. *Application: A summary written in paragraph form that states how the project relates
to real world problems or situations. How might your project help mankind?
Recommendations: Explain what changes you would make to improve the experimental
design, or give possible extensions/follow-up research or testing that could be done.
Interview Summaries (optional – not mandatory): A paragraph that explains information
learned from any personal interview(s), emails, phone calls, and other forms of
communication from professionals that helped your research in any way.
Acknowledgments: Give credit to anyone who helped you during the project. This is not
a list of names, but a short paragraph describing who helped you and how.
Bibliography: A Properly formatted list of all sources and reference materials used for
the project. (See appendix for proper formats).

Imagine Schools
Science Fair Student Handbook
12
BIBLIOGRAPHY GUIDELINES
4th Grade: A bibliography is not required.
5th Grade: A bibliography of a minimum of 2 sources at the end of the research
summary.
Middle School: A bibliography with a minimum of 3 sources included in the report.
The following two websites provide free bibliography tools. You will need to create an
account before you can use them.
www.noodletools.com and www.easybib.com
Reference Material How to site information
Book Author(s). Title of Book. Place of Publication: Publisher, Year of
publication
Book with corporate
author
American Medical Association. Diabetes in Adults. New York:
Random, 1998.
Magazine or
Newspaper Article
Johnson, Dennis. “Science is Cool.” Engineering 15 Jan 1999: 44-45.
Article in Reference
Database on CD-ROM
“World War II.” Encarta. CD-ROM. Seattle: Microsoft, 1999
Government
Publication
United States Department of Health and Human Services. Healthy
People 2010: Understanding and Improving Health. Washington: GPO,
2000
Interview that the
student conducted
Presley, Elvis. Personal Interview. 1 January 2004
Sound Recording U2. All That You Can’t Leave Behind. Interscope, 2000
Email Author. “Title of Message (if any)” Email to the author. Date of
message.
Article from a reference
book
“Science”. Encyclopedia Britannica. 1999 ed.
Web site First, Hugo. All About Science Fair Projects. 17 December 1999.
Awesome Guides. 15 November 2000
http://www.awesomeguides.com/student_science_fair-project_help.htm

Imagine Schools
Science Fair Student Handbook
13
DISPLAY BOARD GUIDELINES
A standard size (36 in X 48 in./the larger one), tri-fold display board is
mandatory for all competitors (grades 4 through 8) at the school, region, and state
competitions. See your school requirements for non-competing students.
4th grade students: Students who compete at the school, region, and state must have
a display board with all components except an ABSTRACT SUMMARY. Students may
include additional photos if desired.
5th grade students: Display boards are mandatory for all competing students. The
board must contain all components except an ABSTRACT SUMMARY. Students will
replace this section with a multi-paragraph RESEARCH SUMMARY. The summary should
be a minimum of one typed page double-spaced. A bibliography of research sources (1
page minimum) should be attached to the back of the board for students who compete.
Middle school students (Grades 6-8): Display boards are mandatory for students who
compete at the school, region, and state. The board is to contain all the components
including an ABSTRACT SUMMARY.
Board size: A standard size, tri-fold presentation board that can be purchased in an
office supply, or local supermarket store. It must be free standing and sturdy.
First impressions can make a difference. Be creative.
Photos: All photos must have a caption. Pictures should be of the outcome of the experiment
with no faces.
Judging Criteria: The display board is judged based on grammar, creativity, the
scientific method, thoroughness, and neatness. All items must be typed and placed in
the correct location and order. Please don’t use staples.

Imagine Schools
Science Fair Student Handbook
14
DISPLAY BOARD FORMAT All items must be typed and placed in the correct location and order with titles.
Wording can be larger than 12-14 font and does not need to be double-spaced.
Student names should not be written on the front of the board.
LEFT MIDDLE RIGHT
4th Grade: An abstract summary or research summary is not needed. Additional photos
or graphics may be added.
5th Grade: A multi-paragraph research summary replaces the abstract summary. This
should be a minimum of one page double spaced. Pages will be layered with the
bibliography of a mininum of 2 sources should be placed at the end of the research
summary.
Middle School: All components are required including the abstract summary.
*Photos are required.
**Additional space for data if necessary
The data notebook and written report are separate from the board and will be displayed
in front of the board if required.
TITLE
Problem
Purpose
Hypothesis
Materials
Procedures
Constants Variables
(kinds)
*Photo
s
*Photo
s
Abstract or
Research
Summary
Data
Conclusion
Application
Results
Data**
(extra)

Imagine Schools
Science Fair Student Handbook
15
ORAL PRESENTATION
Oral presentations are mandatory for all students (grades 4 – 8) who compete.
See your school requirements for non-competing students.
The oral presentation is a short 3-5 minute oral presentation describing your project
and experimental design. It is also a chance for you to answer questions and show the
knowledge you have gained through research and experimentation.
Oral Presentation Tips It is perfectly natural to be nervous.
Begin by introducing yourself and your project.
Explain your project components. Refer to your board headings, or write brief
notes on cards, but don’t read from them word for word.
Use visuals, pictures, graphs, or props to help explain the details of your project.
Explain your data and how you collected it.
Make sure you use and pronounce the key terms mentioned in your project
properly.
Maintain eye contact.
Speak clearly and slowly.
Practice your presentation in front of family members, friends, or a mirror.
When finished, ask the judge, “Do you have any questions?”
If a judge asks you a question on something you do not know, don’t worry. Discuss
what you do know.

Imagine Schools
Science Fair Student Handbook
APPENDIX
(Additional Resources & Forms)
Imagine Schools
Science Fair Student Handbook
HELPFUL WEBSITES
SCIENCE FAIR: The following are some web pages that provide ideas for science
fair projects.
scifair.org
nasa.gov
ScienceBuddies.org
scienceproject.com
all-science-fair-projects.com
cool-science-projects.com
sciencefair-projects.org
sciencepage.org
scienceclub.org
discoverychannel.com
sciencebob.com
Chemistry.about.com
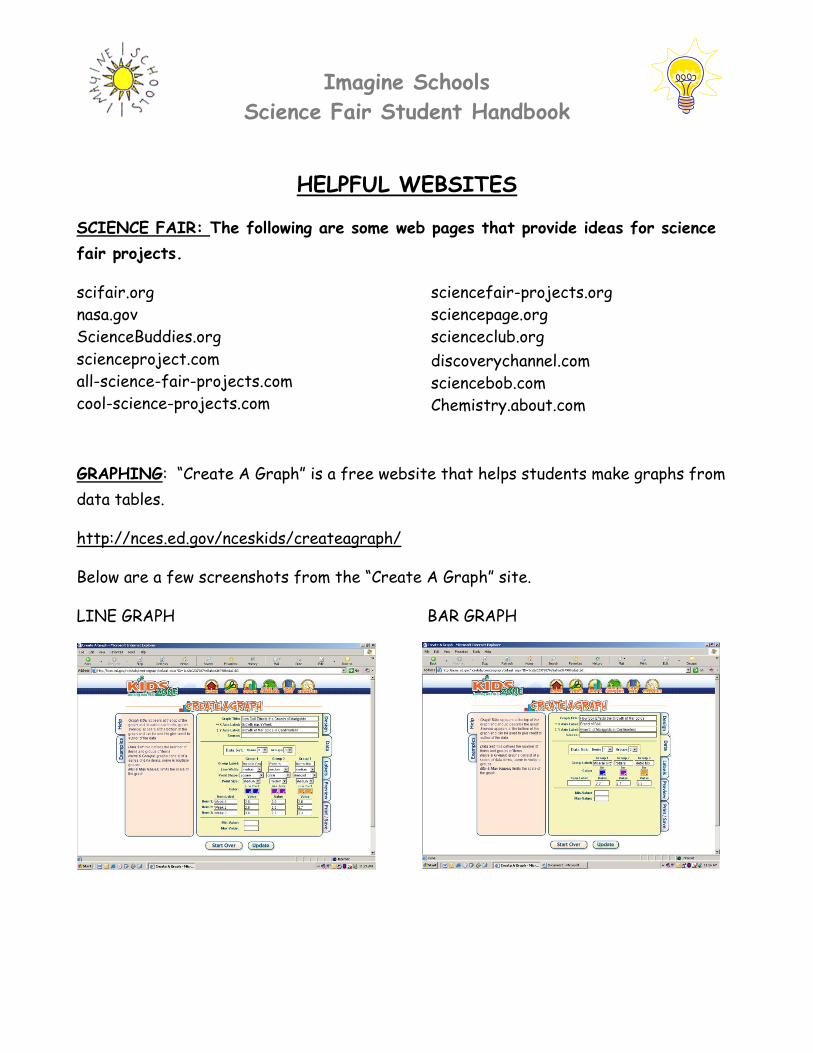
GRAPHING: “Create A Graph” is a free website that helps students make graphs from
data tables.
http://nces.ed.gov/nceskids/createagraph/
Below are a few screenshots from the “Create A Graph” site.
LINE GRAPH BAR GRAPH

Imagine Schools
Science Fair Student Handbook
PARENT/GUARDIAN & STUDENT ACKNOWLEDGEMENT FORM
(This must be turned in to your teacher before you begin the project.)
Student Name:_______________________ Homeroom Teacher:_______________
Dear Parents/Guardians,
Please review the Imagine Schools Science Fair Student Handbook and sign this
document as acknowledgement that:
1. You are aware the Annual Imagine Schools Science Fair project and
competition has begun.
2. You are aware of the project timeline, components, due dates, and
grading rubric.
3. You are aware this is a long-term research and experimentation project
done mostly at home.
4. You are aware of the impact this project will have on your child’s
grade.
5. If your child wishes to compete in the school science fair, a complete
project and board will be required. Incomplete projects will not be
accepted.
_______________________________ ___________________
Parent/Guardian Signature Date
_______________________________ ___________________
Student Signature Date
Return to your child’s teacher by: _______________________

Imagine Schools
Science Fair Student Handbook
STUDENT DOCUMENTATION FORM (This must be turned into your teacher and approved before you begin the project.)
STUDENT:_________________________ TEACHER:_________________ DUE: ____________
PARTNER(S) for non-competing students only:______________________ ____________________
(Each student must turn in his/her own form with parent signature)
SUBJECT: (What topic do you want to research?) _________________________________________
PURPOSE: (Why you are doing the research and experiment?)
___________________________________________________________________________________
___________________________________________________________________________________
PROBLEM: (What question will you will investigate? It cannot be answered yes or no.)
___________________________________________________________________________________
____________________________________________________________________________________
HYPOTHESIS: (What you think is the answer to the question. You may change this after doing your
research, but you may not change it after you begin your experiment.)
____________________________________________________________________________________
____________________________________________________________________________________
EXPERIMENT SUMMARY: (How and where will do you plan on testing your hypothesis?)
____________________________________________________________________________________
____________________________________________________________________________________
____________________________________________________________________________________
TIME NEEDED: (How long will you need to perform 3 trials?) _____________________________
MATERIALS: (What will you need to perform the experiment?)_______________________________
____________________________________________________________________________________
____________________________________________________________________________________
Expected Costs of Project: $ ____________________
I plan on COMPETING or NOT COMPETING (circle one).
Parent Approval: _____________________________________ Date: __________________
Teacher Approval: ____________________________________ Date:___________________
Teacher Comments: ______________________________________________________________

Imagine Schools
Science Fair Student Handbook
BIBLIOGRAPHY WORKSHEET Use this sheet to help you gather information for your bibliography.
WEB SITE
Author(s):
Page or Article Title:
Web Site Name:
Sponsor/Publisher:
Last Revised or Publication Date: Date Viewed:
URL:
BOOK
Author(s):
Title:
City of Publication:
Publisher Name:
Year of Publication: Page Number(s):
MAGAZINE
Author(s):
Article Title:
Name of Magazine:
Publication Date: Page Number(s):
NEWSPAPER
Author (s):
Title of Article:
Newspaper:
Publication Date:
Edition: Page Number(s):
TELEVISION/RADIO
Title of Episode:
Title of Program/Series:
TV / Radio Network:
TV/ Radio Station:
Broadcast Date:
Mail From Name:
Title/Subject of Mail:
Mail To Name: Date Received:

Imagine Schools Science Fair Judging
Data Notebook
Qualitative (descriptive senses)
Describe what you observed with your 5 senses
or those that apply. (50 points)_____
Quantitative (use of numbers) Measure what
happed, this will be graphed. (50 points) _____
**Must have both in data notebook**
DATA NOTEBOOK TOTAL _____/100
4th Grade TOTAL Score Student: ____________________________________ School: _____________________
Category: _______________________________________ Judge Initials: ______________
Project Display Board Physical Presentation (20 points) ______ (Colorful, neat and clear)
Scientific Method
Steps in order (15 points) ______
Steps have headings (10 points) ______
Thoroughness/Skill
Clear graphs, tables, &/or
charts (15 points) ______
Pictures have captions (5 points) ______
Data shows three trials (10 points) ______
Proper format of components (complete hypothesis, application, results, etc.)
(15 points)________
Conventions (Spelling, Grammar, Punctuation,
No Pronouns in Procedures) (10 points) ______
DISPLAY TOTAL _______/100
270
Oral Presentation Content
Introduction (2 points) _______
Problem/Purpose (2 points) _______
Research (10 points) _______
Hypothesis (3 points) _______
Materials (2 points) _______
Procedure (3 points) _______
Variables/Constants (2 points)________
Data (3 points) _______
Conclusion (3 points) _______
Application (5 points) _______
Recommendations (5 points) _______
Delivery
Eye contact (10 points) _______
Proper pronunciation (10 points) _______
Speak clear and slow (8 points) _______
No Vocalized pauses (2 points) _______
(uh, well uh, um)
PRESENTATION TOTAL ____/70

Imagine Schools Science Fair Judging
Data Notebook
Qualitative (descriptive senses)
Describe what you observed with your 5 senses or
those that apply. (50 points)_____
Quantitative (use of numbers) Measure what
happed, this will be graphed. (50 points) _____
**Must have both in data notebook**
DATA NOTEBOOK TOTAL _____/100
Research (on board)
Minimum of one page typed, double spaced,
12 -14 point font
*Bibliography should be pasted to back of
board with at least 2 sources).
Grammar (5 points) ______
Bibliography (5points) ______
Research (20points) ______
RESEARCH TOTAL ____/30
5th Grade TOTAL Score
Student: ____________________________________ School: _____________________
Category: _______________________________________ Judge Initials: _____________
Project Display Board
Physical Presentation (20 points) ______ (Colorful, neat and clear)
Scientific Method
Steps in order (15 points) ______
Steps have headings (10 points) ______
Thoroughness/Skill
Clear graphs, tables, &/or
charts (15 points) ______
Pictures have captions (5 points) ______
Data shows three trials (10 points) ______
Proper format of components (complete hypothesis, application, results, etc.)
(15 points)________
Conventions (Spelling, Grammar, Punctuation,
No Pronouns in Procedures) (10 points) ______
DISPLAY TOTAL _______/100
300
Oral Presentation Content Introduction (2 points) _______
Problem/Purpose (2 points) _______
Research (10 points) _______
Hypothesis (3 points) _______
Materials (2 points) _______
Procedure (3 points) _______
Variables/Constants (2 points)________
Data (3 points) _______
Conclusion (3 points) _______
Application (5 points) _______
Recommendations (5 points) _______
Delivery Eye contact (10 points) _______
Proper pronunciation (10 points) _______
Speak clear and slow (8 points) _______
No Vocalized pauses (2 points) _______
(uh, well uh, um)
PRESENTATION TOTAL ____/70

Imagine Schools Science Fair Judging
Data Notebook
Qualitative (descriptive senses)
Describe what you observed with your 5 senses or
those that apply. (50 points)_____
Quantitative (use of numbers) Measure what
happed, this will be graphed. (50 points) _____
**Must have both in data notebook**
DATA NOTEBOOK TOTAL _____/100
Written Report I. Title Page (2 points) ________
II. Abstract (8 points) ________
III. Table of Contents (2 points) _______
IV. Experimental Design
1. Problem (5 points) _____
2. Purpose (5 points) _____
3. Research (15 points)_____
4. Hypothesis (5 points) _____
5. Subjects (1 points) _____
6. Constants (5 points) _____
7. Variables (5 points) _____
8. Materials (5 points) _____
9. Procedure (min.3trials) (5 points) _____
10. Data (5 points) _____
11. Results (5 points) _____
12. Conclusion (5 points)_____
13. Application (5 points) _____
14. Recommendations (5 points) _____
V. Acknowledgements (2 points) _____
VI. Bibliography (5 points) _____
Mechanics & Order (5 points) _____
WRITTEN REPORT TOTAL ____/100
Middle School TOTAL Score Student: ____________________________________ School: _____________________
Category: _______________________________ Judge Initials: _____________________
Project Display Board
Physical Presentation (20 points) ______ (Colorful, neat and clear)
Scientific Method
Steps in order (15 points) ______
Steps have headings (10 points) ______
Thoroughness/Skill
Clear graphs, tables, &/or
charts (15 points) ______
Pictures have captions (5 points) ______
Data shows three trials (10 points) ______
Proper format of components (complete hypothesis, application, results, etc.)
(15 points)________
Conventions (Spelling, Grammar, Punctuation,
No Pronouns in Procedures) (10 points) ______
DISPLAY TOTAL _______/100
Oral Presentation Content Introduction (2 points) _______
Problem/Purpose (2 points) _______
Research (10 points) _______
Hypothesis (3 points) _______
Materials (2 points) _______
Procedure (3 points) _______
Variables/Constants (2 points)________
Data (3 points) _______
Conclusion (3 points) _______
Application (5 points) _______
Recommendations (5 points) _______
Delivery Eye contact (10 points) _______
Proper pronunciation (10 points) _______
Speak clear and slow (8 points) _______
No Vocalized pauses (2 points) _______
(uh, well uh, um)
PRESENTATION TOTAL ____/70
370