
Image Processing - medical imaging - ECE/CISbarner/courses/eleg675/Image Processing... · 2 Image...
12
1 Medical Imaging Image Processing with Biomedical Applications ELEG-475/675 Prof. Barner Image Processing Medical Imaging Prof. Barner, ECE Department, University of Delaware 2 Classes of Medical Imaging Modalities Anatomical or structural The ability to discriminate different constituents of the body Water, bone, soft tissue, etc. X-ray imaging, computed tomography (CT), ultrasound, and Magnetic Resonance Imaging (MRI) Functional or metabolic The ability to discriminate different levels of metabolism caused by specific biochemical activity Biochemical activity: Describes the functional behavior of tissue or organs May be caused by internal or external simulation Functional Magnetic Residents Imaging (fMRI), Single Photon Emission Computed Tomography (SPECT), Positron Emission Tomography (PET) Image Processing Medical Imaging Prof. Barner, ECE Department, University of Delaware 3 Medical Imaging Examples Anatomical cases X-ray imaging for fracture identification, mammography tumor identification Ultrasound examinations of fetuses Functional cases fMRI methods for measuring blood flow or oxygenation level in brain tissue Changes in blood flow/oxygen level reflect numeral activity caused by stimulation Example: sound or light simulation PET imaging utilizing flurodeoxyglucose (FDG) administration shows blood flow and glucose metabolism in tissue Utilized to detect if tissue is affected by a tumor or epilepsy Image Processing Medical Imaging Prof. Barner, ECE Department, University of Delaware 4 X-Ray Imaging An incident electron, with energy higher than the binding energy of a particular shell level, is used to eject an electron Total energy preservation results in the release of a x-ray photon X-ray photons are focused in a monochromatic beam Scattering is a major problem in projection radiography Photons arrived at the same detector location through different paths Anti-scatter grids and collimators are used to reduce indirect arrivals at the sensor
Transcript of Image Processing - medical imaging - ECE/CISbarner/courses/eleg675/Image Processing... · 2 Image...
1
Medical Imaging
Image Processing with Biomedical Applications
ELEG-475/675Prof. Barner
Image ProcessingMedical Imaging
Prof. Barner, ECE Department, University of Delaware 2
Classes of Medical Imaging Modalities
Anatomical or structuralThe ability to discriminate different constituents of the body
Water, bone, soft tissue, etc.X-ray imaging, computed tomography (CT), ultrasound, and Magnetic Resonance Imaging (MRI)
Functional or metabolicThe ability to discriminate different levels of metabolism caused by specific biochemical activity
Biochemical activity: Describes the functional behavior of tissue or organsMay be caused by internal or external simulation
Functional Magnetic Residents Imaging (fMRI), Single Photon Emission Computed Tomography (SPECT), Positron Emission Tomography (PET)
Image ProcessingMedical Imaging
Prof. Barner, ECE Department, University of Delaware 3
Medical Imaging Examples
Anatomical casesX-ray imaging for fracture identification, mammography tumor identificationUltrasound examinations of fetuses
Functional casesfMRI methods for measuring blood flow or oxygenation level in brain tissue
Changes in blood flow/oxygen level reflect numeral activity caused by stimulation
Example: sound or light simulation
PET imaging utilizing flurodeoxyglucose (FDG) administration shows blood flow and glucose metabolism in tissue
Utilized to detect if tissue is affected by a tumor or epilepsy
Image ProcessingMedical Imaging
Prof. Barner, ECE Department, University of Delaware 4
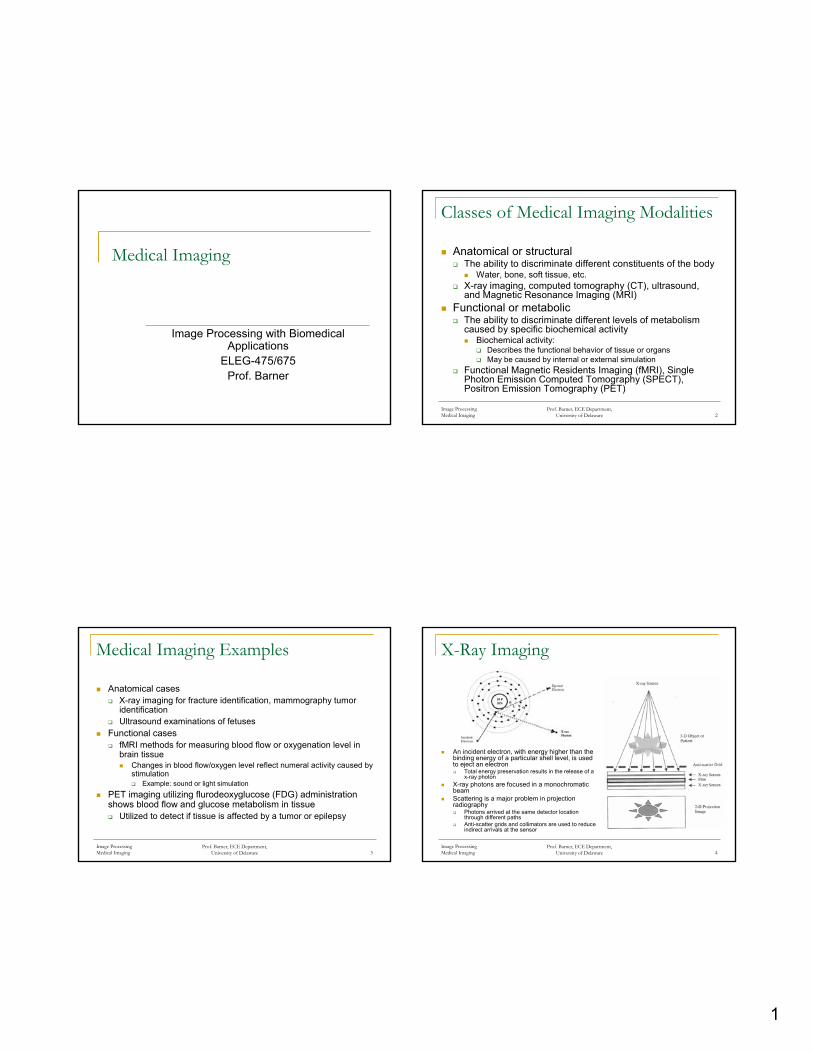
X-Ray Imaging
An incident electron, with energy higher than the binding energy of a particular shell level, is used to eject an electron
Total energy preservation results in the release of a x-ray photon
X-ray photons are focused in a monochromatic beamScattering is a major problem in projection radiography
Photons arrived at the same detector location through different pathsAnti-scatter grids and collimators are used to reduce indirect arrivals at the sensor

2
Image ProcessingMedical Imaging
Prof. Barner, ECE Department, University of Delaware 5
X-Ray Absorption
For a radiation beam passing through a medium with linear attenuation coefficient μ
N0=Nine-μt
Nin and N0 are the total number of photons entering and leaving the medium of thickness tIn more general cases, the attenuation coefficient and source are spatially varying
Yields integral expression along x-ray path
Example: attenuation coefficients for bone and fat
Photon energy dependent
Image ProcessingMedical Imaging
Prof. Barner, ECE Department, University of Delaware 6
X-Ray Example
Chest x-ray of a male
Normal result
Image ProcessingMedical Imaging
Prof. Barner, ECE Department, University of Delaware 7
X-Ray Computed Tomography (I)
Conventional x-ray radiography projects a 3-D object onto a 2-D detector plane
3-D information is diagnostically important
Bone fracture treatment may require 3-D imagingHeart and brain diagnoses require 3-D imaging
Consider a 3-D object as a stack of 2-D slicesAssume the x-ray radiation is parallel to the x-direction
The recorded radiation is given by
μ(x,y,z) is the attenuation coefficient and Iinand Iout are the source and detected radiation
( , ; )out in( ; , )
x t z dxI x y z I e
μ−∫=
Image ProcessingMedical Imaging
Prof. Barner, ECE Department, University of Delaware 8
X-Ray Computed Tomography (II)
For x-ray radiation parallel to the x-direction
Sensor readings along the ydirection give information on the y-direction projection of the selected slice
Rotate the source and detector for alignment along the y-direction
Gives x-direction projection information
First generation CT scanners rotated parallel beam sources and detector
Obtain projections at multiple angles
Multiple angle scans are performed for each slice (z value)
Stack multiple slices to form volume

3
Image ProcessingMedical Imaging
Prof. Barner, ECE Department, University of Delaware 9
X-Ray Computed Tomography (III)First-generation CT scanner geometry
Source: parallel beamDetector: linear arrayScanning: translation and rotation of source/detector pair
Second-generation CT scanner geometrySource: fan beamDetector: linear arrayScanning: translation and rotation of source/detector pair
Third-generation CT scanner geometrySource: fan beam (covers entire object without translation)Detector: arc of detectorsScanning: Entire projection obtained from single source location
Additional views obtained by source/detector rotationRotate only – no translation required
Fourth-generation CT scanner geometrySource: fan beam (covers entire object without translation)Detector: ring of detectorsScanning: source rotation
Image ProcessingMedical Imaging
Prof. Barner, ECE Department, University of Delaware 10
CT Example
CT sliceCardiac cavity of a cadaver
Pathological image
Image corresponding to the actual CT slice
Image ProcessingMedical Imaging
Prof. Barner, ECE Department, University of Delaware 11
Magnetic Resonance Imaging (MRI)
Nuclear Magnetic Residents (NMR) independently explained by Felix Bloch and Edward Purcell in 1946
1952 Nobel PrizePaul Lauterbur and Peter Mansfield used the NMR principal in MRIimaging
Obtains physical and chemical properties based images of an object2003 Nobel Prize
Like CT, MRI is tomographic imaging that produces three-dimensional imagesUnlike CT, MRI is not based on the transmission of external radiation through the objectMRI uses nuclear magnetic resonance property of selected matter in the object
Images anatomical structures as well as biochemical propertiesBiochemical properties are based on physiological function, such as blood flow and oxygenation
Image ProcessingMedical Imaging
Prof. Barner, ECE Department, University of Delaware 12
MRI Example
MRI methods allow image capture based on multiple parameters that represent various physical and chemical properties
Parameters: T1 weighted, T2 weighted, and Spin-DensityHuman brain a cross-section example
T1 weighted, T2 weighted, and Spin-Density of hydrogen protonsFunctional MRI (fMRI) reports physiological behavior over time
MRI imaging can create any direction cross-sectional images and multi-dimensional imaging sequences without making any physical changes to the instrumentMRI has fast signal acquisition (fraction of the second)MRI has high spatial resolution (millimeter to hundreds of a millimeter)
Temporal and spatial resolution relaxed to increase signal-to-noise ratio

4
Image ProcessingMedical Imaging
Prof. Barner, ECE Department, University of Delaware 13
MRI Principles (I)
Objective: map the spatial location and associate properties of specific nuclei or protons in an objectNuclei with odd atomic number possess angular moment
Angular moment referred to as spinSpinning of the charge protons creates and magnetic fieldThe charged protons thus an possess angular moment and magnetic moment
Example shown of charge proton with angular moment (J) and magnetic moment (μ):
Magnet representationSymbolic representation
Note: μ=γJ where γ is a gyromagnetic ratio
Image ProcessingMedical Imaging
Prof. Barner, ECE Department, University of Delaware 14
MRI Principles (II)
A hydrogen atom has one proton in its nucleusOdd atomic number results in nuclear spinGyromagnetic ratio is 42.58MHz/T
External magnetic fields of 0.5-1.5T yield sufficient magnetic moment for imaging the human body
A significant percentage of the human body is waterWater molecules contained hydrogen protonsthe hydrogen proton is an excellent choice for NMR based imaging in the human body
Other protons that exhibit the NMR phenomenon are available in the body (C, F, and P)
Image ProcessingMedical Imaging
Prof. Barner, ECE Department, University of Delaware 15
MRI Principles (III)
No external magnetic field case:The direction of the magnetic moment is random
Zero net longitudinal and transverse vectors
External magnetic field case:Nuclear paramagnetic polarization with specific orientationsInteraction between the magnetic moment of the nuclei and external magnetic field cause the spinning nuclei to precess
Wobbles like a spinning top subject to a gravitational field
Image ProcessingMedical Imaging
Prof. Barner, ECE Department, University of Delaware 16
MRI Principles (IV)
External magnetic field case:Nuclei align along or against the magnetic field
Nuclei aligned along the field have lower energy levelNuclei aligned against the field have higher energy levelMore nuclei align along the field than aligned against it
Results in a net magnetization vector in the direction of the external magnetic fieldThe procession is still random – net zero vector in the transverse direction

5
Image ProcessingMedical Imaging
Prof. Barner, ECE Department, University of Delaware 17
MRI Principles (V)
Using classical mechanics:The torque generated by the interaction of the magnetic moment of a proton and the external magnetic field is equal to the rate of change of angular momentum
Result given by the equation of motion for isolated spin:
where H0 is the strength of the external magnetic field and is the unit vector in the z-direction
Equation solution yields:
Larmor equation – precession frequency depends on gyromagnetic ratio and external magnetic field intensity
k
0 0
0
,
;
,
dJ H H kdt
J
dJ H kd
μ μ
μ γ
γμμ
= × = ×
=
= ×
0 0Hω γ=
Image ProcessingMedical Imaging
Prof. Barner, ECE Department, University of Delaware 18
MRI Principles (VI)
RF energy received by a nuclei at ω0 causes a change in stateResults in NMRThe excited nuclei returns to equilibrium through a relaxation process
Emits energy at the same precession frequency: ω0
During NMRNuclei can receive energy to move from a lower-energy state to a higher-energy state
Nuclei oriented along the external magnetic field can flip and oriented against the magnetic fieldResulting net longitudinal vector is no longer in the direction of the external magnetic field
90-degree pulseRF energy pulse at the Larmor frequency required to shift the net longitudinal vector by 90°All of the nuclei precess in phase
Longitudinal vector rotates in the x-y plane
Image ProcessingMedical Imaging
Prof. Barner, ECE Department, University of Delaware 19
MRI Principles (VII)
180-degree pulseRF energy pulse at the Larmor frequency required to shift the net longitudinal vector by 180°All of the nuclei precess in phase
Longitudinal vector rotates in the x-y planeRF Energy provided by a RF electromagnetic coil oscillating at the Lamor frequency
When RF pulses turned off, excited nuclei go through a relaxation phase
Net longitudinal magnetization vector returns to equilibrium state (in line with the field)Net transverse magnetization goes to zero as nuclei de-phase
Image ProcessingMedical Imaging
Prof. Barner, ECE Department, University of Delaware 20
MRI Principles (VIII)
Energy emitted during the relaxation process induces an electrical signal in the RF coil at the Larmor frequency
Basic MRI imaging signal: The free induction decay of the signal in the RF coil
Consider the external magnetic field and the RF pulls causing nuclear excitation
Change of the net magnet visitation vector:
T1 – longitudinal (spin-lattice) relaxation timeReturn to equilibrium net nine physicians vector in the z-direction
T2 – transverse (spend-spin) relaxation timeLoss of coherence (dephasing) leading to net zero vector in the x-yplane
( )02 1
z zx y M M kM i M jdM M Hdt T T
γ−+
= × − −

6
Image ProcessingMedical Imaging
Prof. Barner, ECE Department, University of Delaware 21
MRI Principles (IX)
Transverse relaxation processMagnetization relaxation after the RF pulse
TransverseLongitudinal
Free Induction Decay (FID)
Recorded in the coil at LarmorfrequencyRaw NMR imaging signal
Image ProcessingMedical Imaging
Prof. Barner, ECE Department, University of Delaware 22
MRI Principles (X)
The voltage induced in the RF coil is given by
Result is spatially dependentGoal: identify a magnetic resonance response of spinning nuclei are at a specific spatial location
Recall Larmor (precession) frequency is dependent on the net magnetic fieldSuperimpose gradient magnetic field on static external magnetic field
Yields spatially variant Lamor frequencySpatially encoded NMR signal by varying magnetic field
MRI images exploit three parameters of nucleiSpin density (density of nuclei)Longitudinal relaxation time, T1Transverse relaxation time, T2Parameter responses can be combined (weighted)
( )( ) ( ) ( , )robject
tV t H M t dt t
φ∂ ∂= − = − ⋅
∂ ∂ ∫ r r r
Image ProcessingMedical Imaging
Prof. Barner, ECE Department, University of Delaware 23
3-D Fourier Transform Description of MRI Imaging
Directional gradient magnetic fields: Gx, Gy, GzSelectively excites a spatial volume with spin nuclei density ρ(x,y,z)Overall gradient at spatial location r
FID NMR spin-echo signal from volume location r is
where and M0 is the magnetization vector at thermal equilibriumExpression can be rewritten as
ωx, ωy, ωz: Frequencies corresponding to Gx, Gy, GzTaking the inverse Fourier transform
Reconstruction of desired values
( ) ( ) ( ) ( )x y zt G t i G t j G t k= + +G
3( ) ( , )S t M t d r= ∫ r
0
( ') '
0( , ) ( )
r
i G t dt
M t M eγ
ρ− ∫
=r
r r
( )0( , , ) ( , , ) x y zi x y z
x y zS M x y z e dxdydzω ω ωω ω ω ρ − + += ∫∫∫
( )0( , , ) ( , , ) x y zi x y z
x y z x y zx y z M S e d d dω ω ωρ ω ω ω ω ω ω+ += ∫∫∫
Image ProcessingMedical Imaging
Prof. Barner, ECE Department, University of Delaware 24
MRI Parameters
Relaxation times and spin density for human tissues and fluidsNote considerable change in relaxation parameters of tissues/fluids of interest
Example: blood and cerebrospinal fluid (CSF)Image contrast adjusted after reconstruction
Spin density images are T1 weighted by the parameter to improve contrast features the anatomical structures

7
Image ProcessingMedical Imaging
Prof. Barner, ECE Department, University of Delaware 25
MRI Instrumentation (I)
Three orthogonal coils provide gradient magnetic fields
Simple is case: linear spatially dependent magnetic fieldGeneral parameters:
Field strength, linearity, and switching time
RF coilTransmits time-varying are pulses
Causes nuclear excitationReceives signature Free Induction Decay (FID) signal
During nuclear relaxation phase
Image ProcessingMedical Imaging
Prof. Barner, ECE Department, University of Delaware 26
MRI Instrumentation (II)
RF pulses are encoded to selectively excite specific voxels
Frequency and phase encodingProper encoding provides slice views in various orientations
Axial, sagittal, coronal
Image ProcessingMedical Imaging
Prof. Barner, ECE Department, University of Delaware 27
MRI Encoding
Slice selection –frequency encoding
Linear gradient applied in the z direction
X direction encoding –phase encodingY direction encoding –frequency (read out) encodingBlock diagram shows overall spatial encoding
Image ProcessingMedical Imaging
Prof. Barner, ECE Department, University of Delaware 28
Transverse Relaxation and Rephasing
Transverse vector initially phased with 90° pulseDuring x-direction space in coding transverse vector begins dephasingRephasingachieved with 180° pulse
Received echo based on rephasedtransverse vector
8
Image ProcessingMedical Imaging
Prof. Barner, ECE Department, University of Delaware 29
Typical MRI Encoding Sequence – Spin Echo Case
Encoding scheme returns FID from a specified locationVarying the time between pulses (cycle repetition time) determines the influence of T1and T2 on the FIDVarious encoding schemes can be applied
Echo planar imagingGradient echo imagingFlow imaging
Image ProcessingMedical Imaging
Prof. Barner, ECE Department, University of Delaware 30
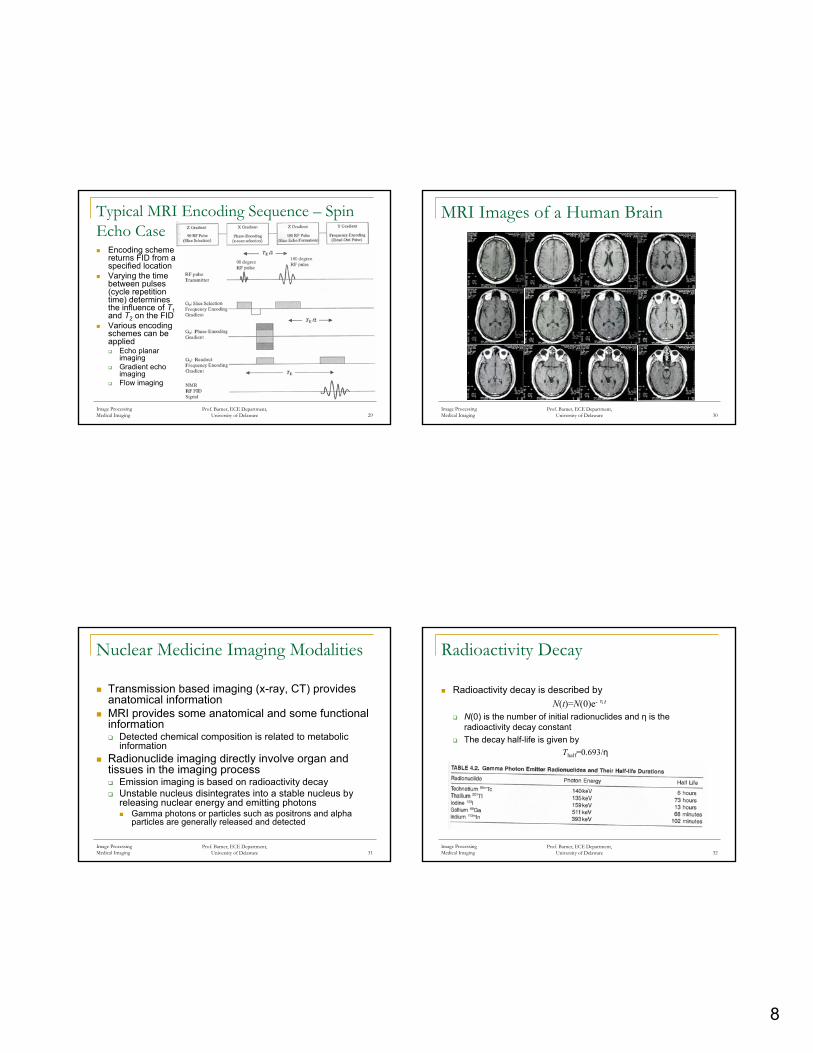
MRI Images of a Human Brain
Image ProcessingMedical Imaging
Prof. Barner, ECE Department, University of Delaware 31
Nuclear Medicine Imaging Modalities
Transmission based imaging (x-ray, CT) provides anatomical informationMRI provides some anatomical and some functional information
Detected chemical composition is related to metabolic information
Radionuclide imaging directly involve organ and tissues in the imaging process
Emission imaging is based on radioactivity decayUnstable nucleus disintegrates into a stable nucleus by releasing nuclear energy and emitting photons
Gamma photons or particles such as positrons and alpha particles are generally released and detected
Image ProcessingMedical Imaging
Prof. Barner, ECE Department, University of Delaware 32
Radioactivity Decay
Radioactivity decay is described byN(t)=N(0)e-ηt
N(0) is the number of initial radionuclides and η is the radioactivity decay constantThe decay half-life is given by
Thalf=0.693/η

9
Image ProcessingMedical Imaging
Prof. Barner, ECE Department, University of Delaware 33
Single Photon Emission Computed Tomography (SPECT)
SPECT imaging utilizes gamma raysRadioisotopes are injected into the body through radiopharmaceutical drugs that metabolize with specific tissuesGamma rays emanating from the tissues are captured by detectors surrounding the body
Recorded radiation form the raw projection data
Gamma ray attenuation is similar to x-ray attenuation
Id=I0e-xνx is the distance traveled by the gamma ray and ν is a medium dependent linear attenuation coefficient
Image ProcessingMedical Imaging
Prof. Barner, ECE Department, University of Delaware 34
SPECT System& Example
Source intensity is based on the dose, metabolism, and half-life of the radionuclideScattering causes loss of source information
Difficult to determine the travel path of the received photon
Lead collimators reduce detection of scatters
SPECT image of the human brainPoor resolution and anatomical structure informationResult shows radioactivity distribution in tissue representing specific metabolism or blood flow
Image ProcessingMedical Imaging
Prof. Barner, ECE Department, University of Delaware 35
Positron Emission Tomography (PET)
PET is based on the simultaneous detection of two 511 keV photonsPhotons are traveling in opposite directionsFeature: the ability to trace radioactive material metabolized in tissue
Provides specific information on biochemical and physiological behaviorMethod: some radioisotopes decay by admitting positrons
Positron emission is accompanied by a significant amount of kinetic energyPositrons typically travel 1-3 mm, losing some kinetic energyAnnihilation (with a loosely bound electron) occursAnnihilation causes the formation of two Gamma photons with 511 keV
Gamma photons travel in opposite directionsCoincidence detection is used to determine the annihilation location
Annihilation location is close to the positron emission location
Image ProcessingMedical Imaging
Prof. Barner, ECE Department, University of Delaware 36
PET Scanner System
Detector pair is moved in an arc around objectCoincidence detection localizes annihilation location
Arrivals are within nanosecondsScattered photons do not arrive within preset window of time
Reduces scattering problem

10
Image ProcessingMedical Imaging
Prof. Barner, ECE Department, University of Delaware 37
Series of Human Brain PET ImagesRadiopharmaceutical used: Fluorodeoxyglucose(FDG)FDG images show glucose metabolism and blood flow
Used to determine heterogeneity and invasiveness of tumors
Resolution of PET is better than SPECTMain advantage:
Ability to tag specific biochemical activity and trace it with time
Image ProcessingMedical Imaging
Prof. Barner, ECE Department, University of Delaware 38
Ultrasound Imaging
Sonar technology was successfully used by the military in World War IIUltrasound waves in medical imaging were first explored in the 1970s and 1980sCurrent ultrasound uses:
Diagnostic imaging of anatomical structures, blood flow measurements, and tissue characterizationUltrasound machines are safe, portable, and low-cost
Ultrasound WAV definition: sound waves with frequencies above 20kHzVelocity (c), wavelength (λ), and frequency (ν) relationship: C=λν
Frequency remains constantWhen a sound wave leaves one medium and enters another (e.g., soft tissue to fat)
Wavelength changes (medium specific velocities, fixed frequency)Directional change – governed by laws of diffractionSound waves follow the principles of reflection, refraction, and superposition
Image resolution is limited by wavelengthShorter wavelengths provide better resolution and penetrate deeper into tissueCommonly used frequency range: 2-5MHz
Image ProcessingMedical Imaging
Prof. Barner, ECE Department, University of Delaware 39
Reflection and Transmission
When changing mediums, the acoustic impedance changes
Causes reflection of the incident soundIntensity of the reflected way it is given by
Intensity of wave transmitted to the second medium
Zi and Zj are the acoustic impedances of the two media
Application to a multilayer structure yields
Rearranging using 1+Rij=Tij yields
j iij
i j
Z ZR
Z Z−
=−
2 jij
i j
ZT
Z Z=
+
0 0 12 23 34 54 43 32 21R I T T T T T T T=
( )( ) ( )2 2 20 0 12 23 34 4510 1 1R I R R R R= − −
Image ProcessingMedical Imaging
Prof. Barner, ECE Department, University of Delaware 40
Refraction and Attenuation
The angle of reflection is equal to the angle of incidentsThe angle of the transmitted wave is given by Snell’s law
Dependent on the propagation speeds of the two mediums: c1and c2
Attenuation occurs as a wave propagatesAttenuation coefficients are characterized in dB/cm and are frequent independent
2
1
sin sint icc
θ θ=

11
Image ProcessingMedical Imaging
Prof. Barner, ECE Department, University of Delaware 41
Reflection Imaging
System parametersSource and object
s(x,y) – acoustic signal intensityω(t) – acoustic signal pulseR(x,y,z) – biological tissue reflectivity (desired parameter)
ReceiverK – normalizing constantώ(t) – received pulseJcr(t) – recorded reflected intensity (adaptive time varying gain applied to compensate for attenuation)
Recorded intensity signal can be written as a convolution
Imaging extracts R(x,y,z), which characterizes the tissue( ) ( ) ( ), , ,
2crctJ t K R x y s x y tω⎛ ⎞= ⊗ − −⎜ ⎟
⎝ ⎠
Image ProcessingMedical Imaging
Prof. Barner, ECE Department, University of Delaware 42
Ultrasound System
An ultrasound pulse is typically 2-3 cycles in durationA crystal element generates pulses and records the reflections
Acoustic echoes are position dependentUltrasound images appear noisy with speckles
Objects lack a continuous boundaryUltrasound image interpretation is difficult
Image ProcessingMedical Imaging
Prof. Barner, ECE Department, University of Delaware 43
Ultrasound Imaging Modes (I)
A-Mode:Record amplitude of returning echoes from tissue boundaries with respect to time
Perpendicular incident angleEcho time represents acoustic impedance and depth of reflecting boundary
Provides 3-D informationM-Mode:
Provides information about signal amplitude variation due to object motion
Fixed position transducer produces a sweep cycle of A-mode recordingsResponse displayed as a line of intensities representing object the collection
Example: Display of mitral valve leaflet of a beating heart.
Image ProcessingMedical Imaging
Prof. Barner, ECE Department, University of Delaware 44
Ultrasound Imaging Modes (II)
B-Mode:Provides 2-D images representing the change in acoustic impedance of the tissue
Brightness shows echo strength2-D information is obtained by pivoting the transducer or using a transducer array
V-shaped imageExample: fetal abdomen

12
Image ProcessingMedical Imaging
Prof. Barner, ECE Department, University of Delaware 45
Ultrasound Imaging Modes (III)
Doppler imagingEffective for imaging blood flowA stationary observer sees a frequency change from a moving sourceChange in frequency:
Velocity of moving source: νSource frequency: fVelocity of sound in the medium: cIncident angle of the moving source with respect to the sound propagation: θ
Spatial spanning used to generate 2-D imageDoppler shift mapped to intensity/color
Example: Doppler image of kidney
2 cosdoppler
v ffcθ
=


