Image Processing David Kauchak cs458 Fall 2012 Empirical Evaluation of Dissimilarity Measures for...
48
Image Processing David Kauchak cs458 Fall 2012 Empirical Evaluation of Dissimilarity Measures for Color and Texture Jan Puzicha, Joachim M. Buhmann, Yossi Rubner & Carlo Tomasi
-
Upload
willis-hodges -
Category
Documents
-
view
215 -
download
2
Transcript of Image Processing David Kauchak cs458 Fall 2012 Empirical Evaluation of Dissimilarity Measures for...

Image Processing
David Kauchak
cs458
Fall 2012
Empirical Evaluation of Dissimilarity Measures for Color and Texture
Jan Puzicha, Joachim M. Buhmann, Yossi Rubner & Carlo Tomasi

Image processing
Image processing
Computer vision
Computer Graphics

Text retrieval
What was the key problem we needed to solve for text retrieval?
sim( ) = ?,query document

The Problem: Image Similarity
sim( ) = ?,

Where does this problem arise in computer vision?
Image Classification Image Retrieval Image Segmentation
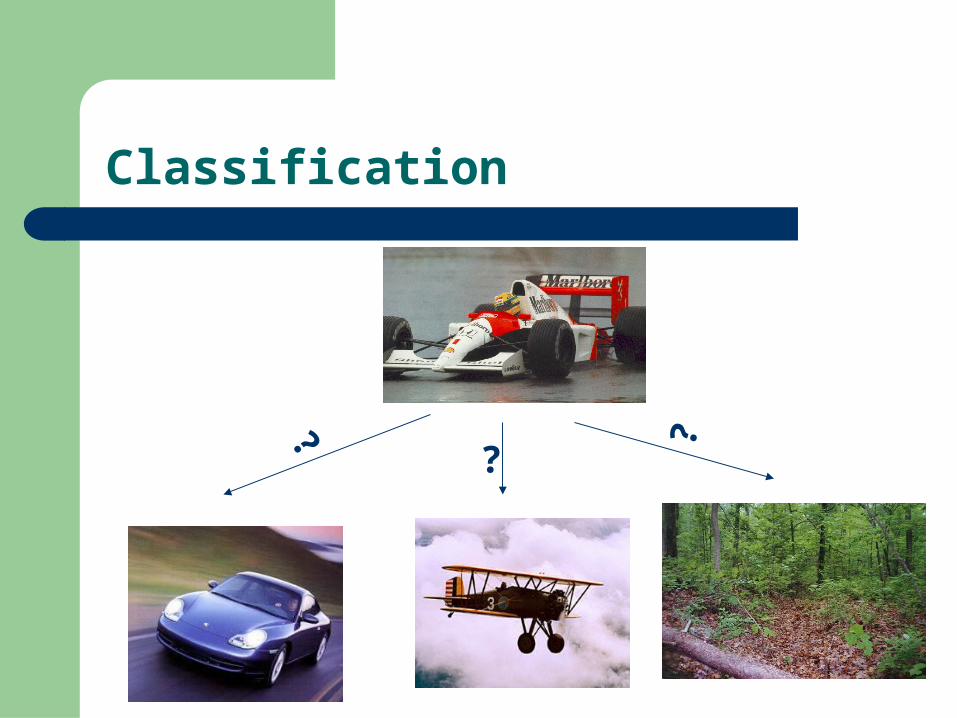
Classification
?
?
?
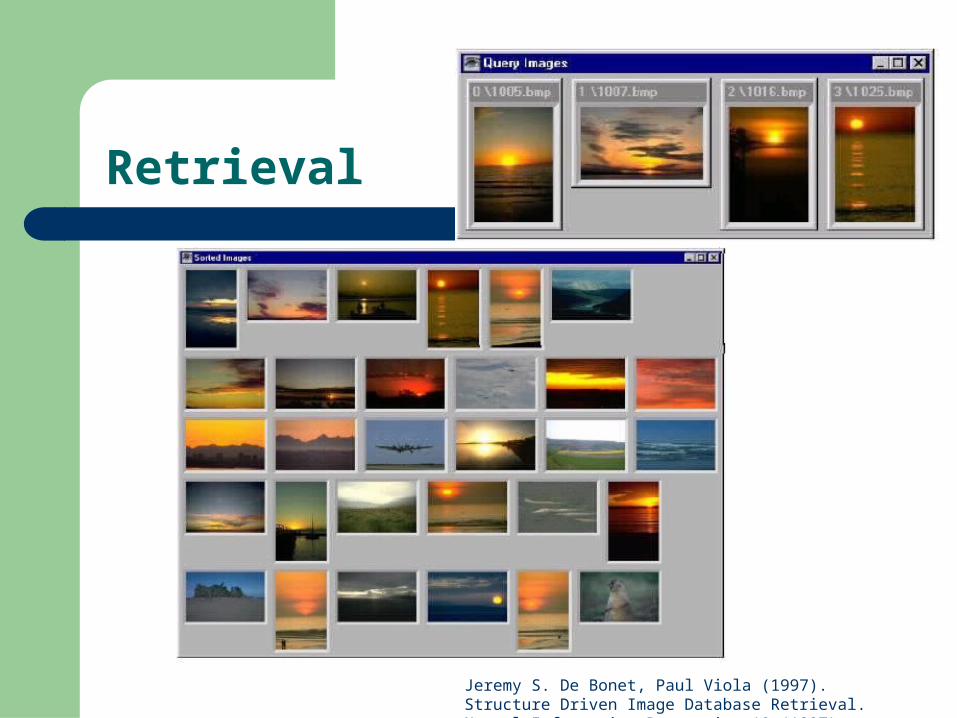
Retrieval
Jeremy S. De Bonet, Paul Viola (1997). Structure Driven Image Database Retrieval. Neural Information Processing 10 (1997).

Segmentation
http://vizlab.rutgers.edu/~comanici/segm_images.html
How is an image represented?
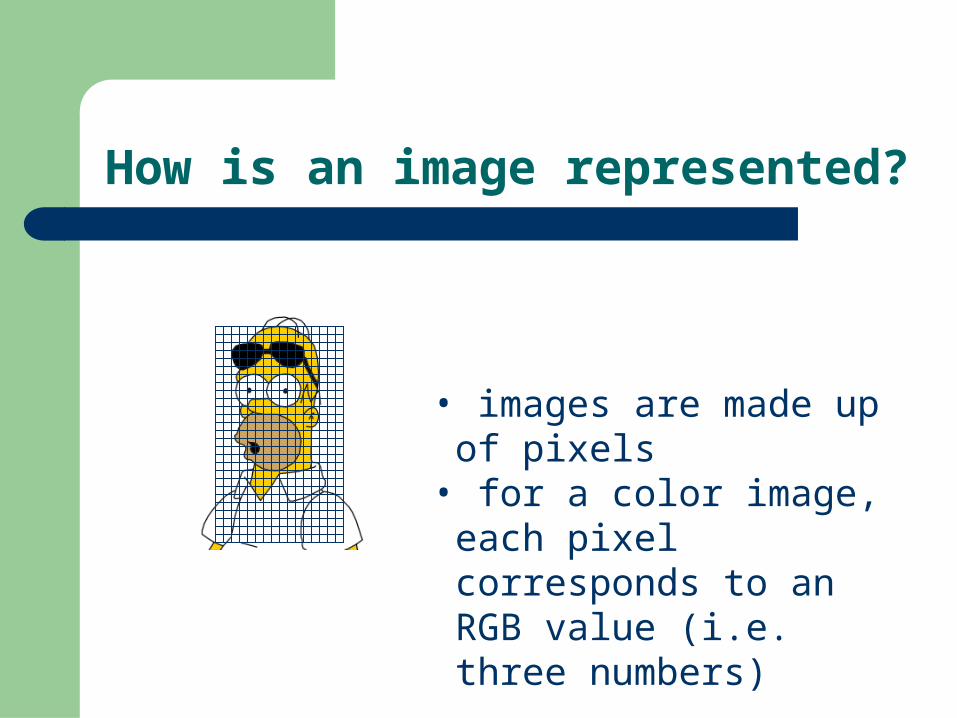
How is an image represented?
• images are made up of pixels• for a color image, each pixel
corresponds to an RGB value (i.e. three numbers)
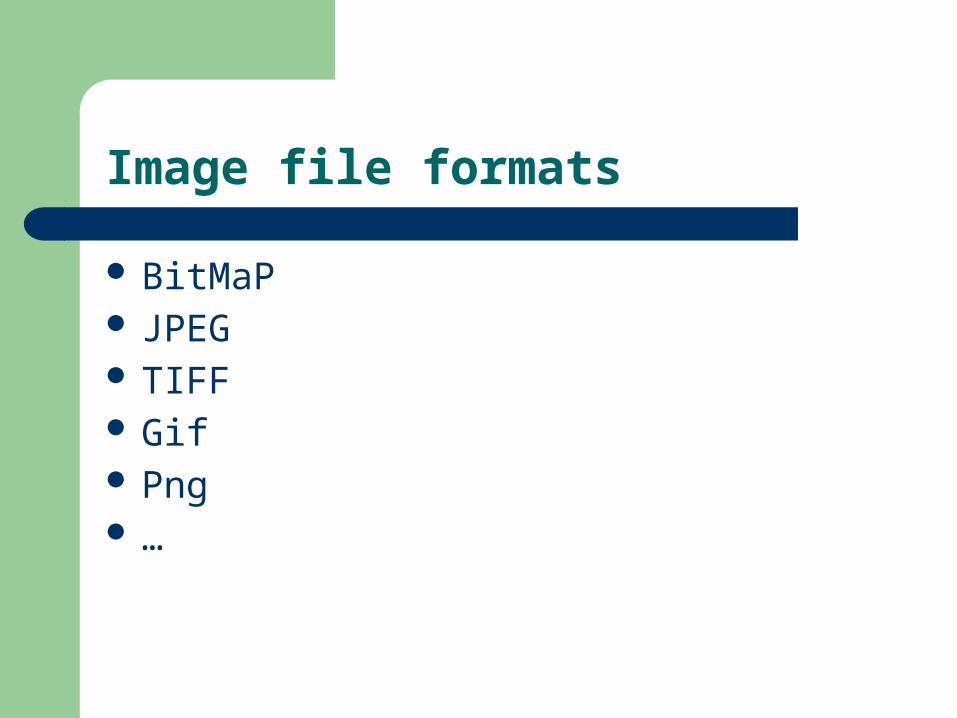
Image file formats
BitMaP JPEG TIFF Gif Png …

Bitmap
R, G, B
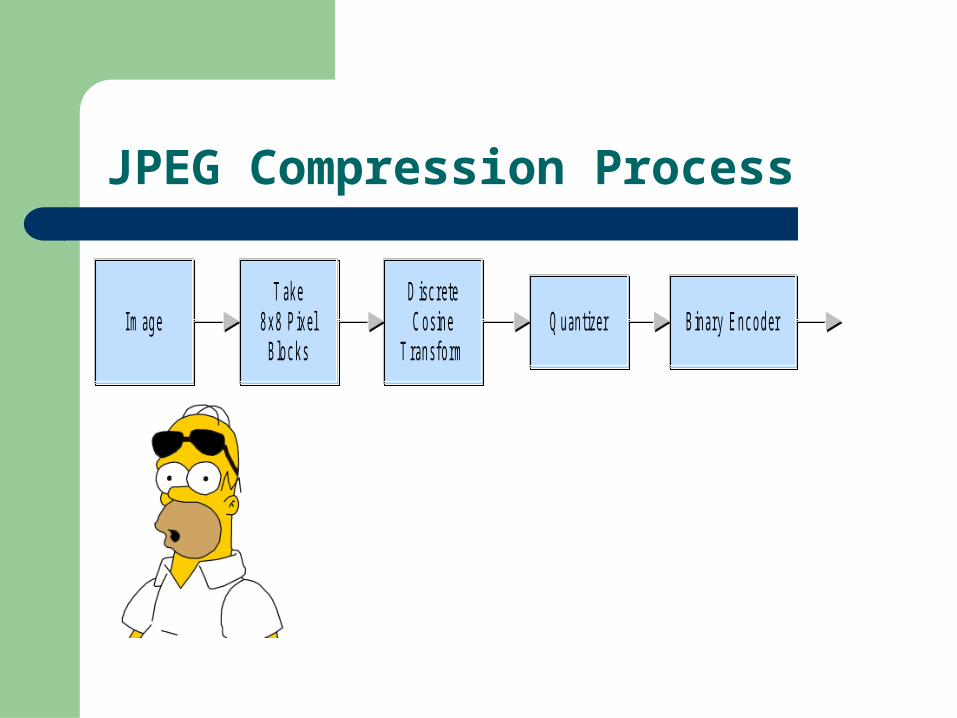
JPEG Compression Process
T ak e8 x 8 P ix e l
Blo c k s
D is c r e teC o s in e
T r an s f o r mQ u an tizer Bin ar y E n c o d er . . .1 011 001 . . .I m ag e

JPEG Compression Process
T ak e8 x 8 P ix e l
Blo c k s
D is c r e teC o s in e
T r an s f o r mQ u an tizer Bin ar y E n c o d er . . .1 011 001 . . .I m ag e

JPEG Compression Process
T ak e8 x 8 P ix e l
Blo c k s
D is c r e teC o s in e
T r an s f o r mQ u an tizer Bin ar y E n c o d er . . .1 011 001 . . .I m ag e
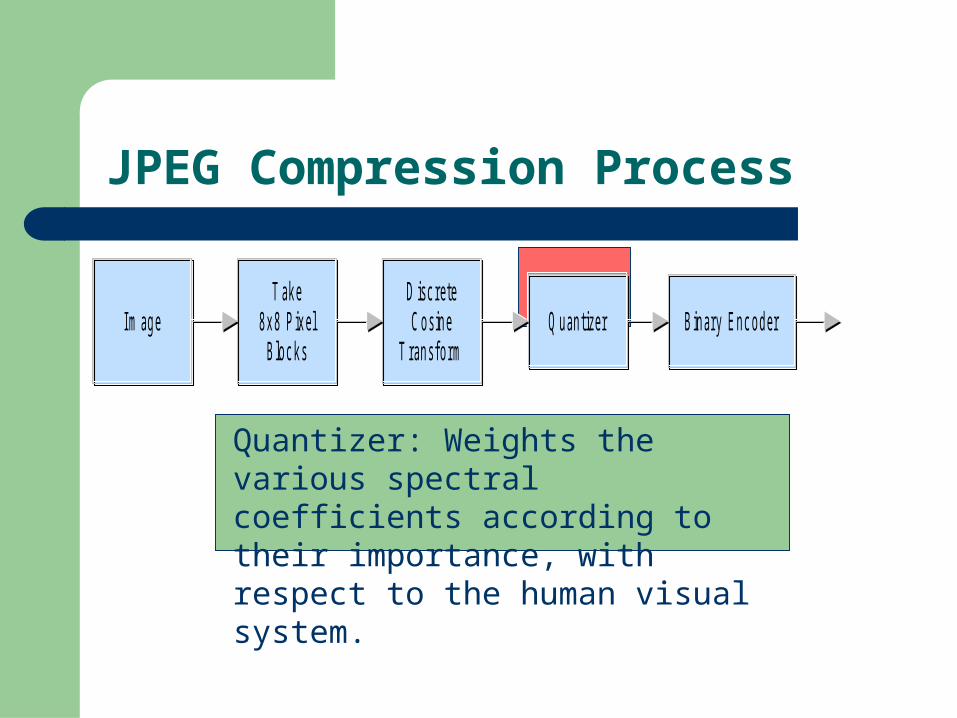
JPEG Compression Process
Quantizer: Weights the various spectral coefficients according to their importance, with respect to the human visual system.
T ak e8 x 8 P ix e l
Blo c k s
D is c r e teC o s in e
T r an s f o r mQ u an tizer Bin ar y E n c o d er . . .1 011 001 . . .I m ag e

JPEG Compression

Image features
?
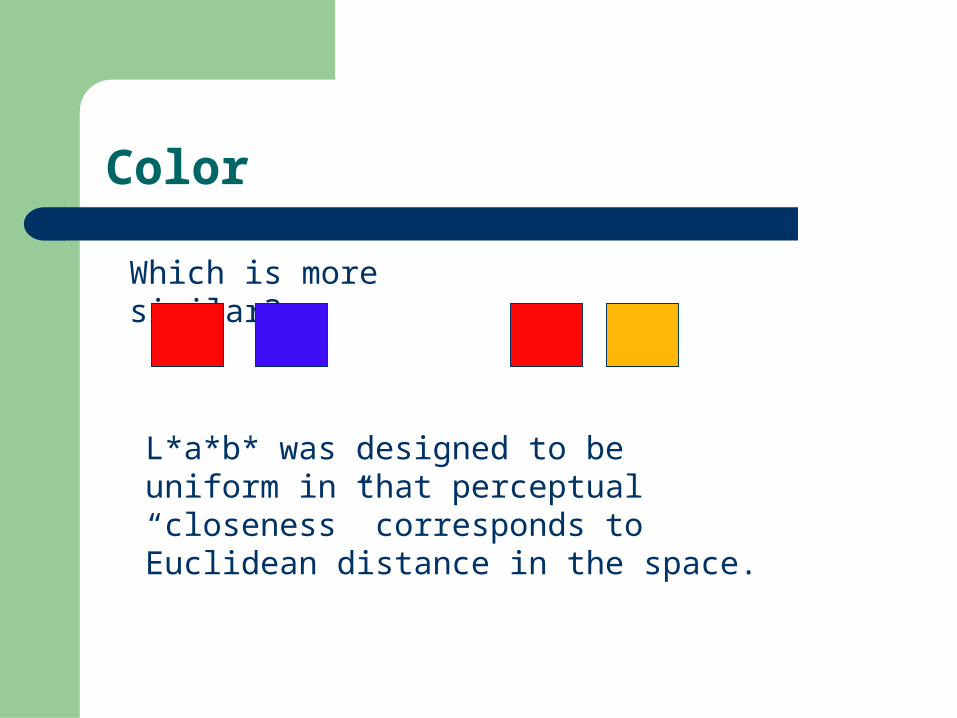
Color
Which is more similar?
L*a*b* was designed to be uniform in that perceptual “closeness” corresponds to Euclidean distance in the space.
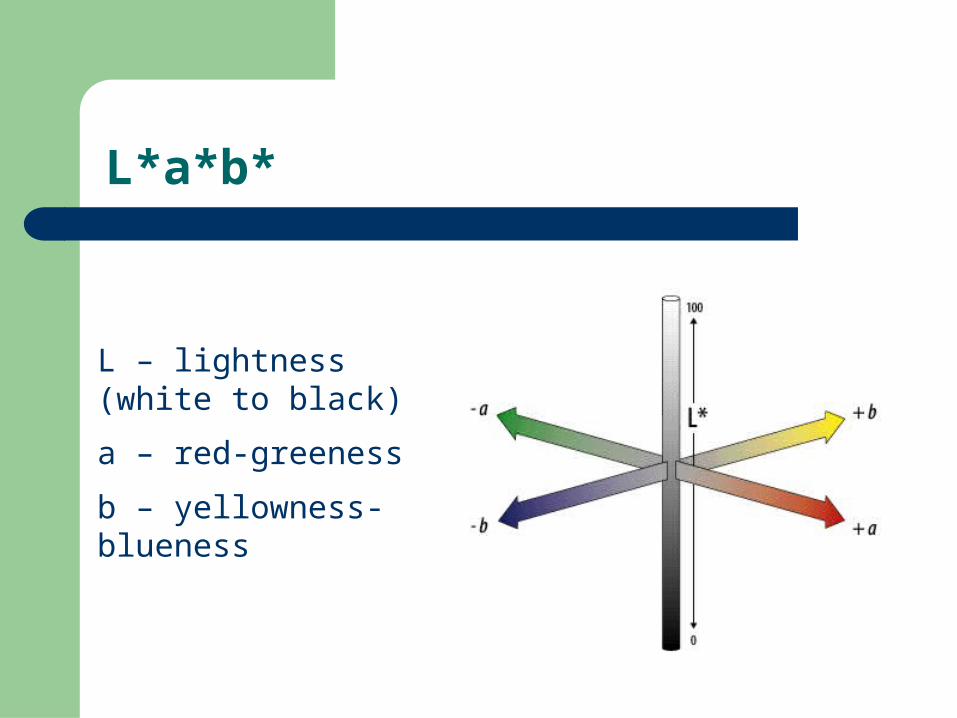
L*a*b*
L – lightness (white to black)
a – red-greeness
b – yellowness-blueness

L*a*b*

Texture
How is texture different than color?

Texture
Texture is not pointwise like color
Texture involves a local neighborhood
How can we capture texture?How did we capture audio texture?

Gabor Filters
Gabor filters are Gaussians modulated by sinusoids
They can be tuned in both the scale (size) and the orientation
A filter is applied to a region and is characterized by some feature of the energy distribution (often mean and standard deviation)
Similar idea to wavelets (Gabor wavelet)!
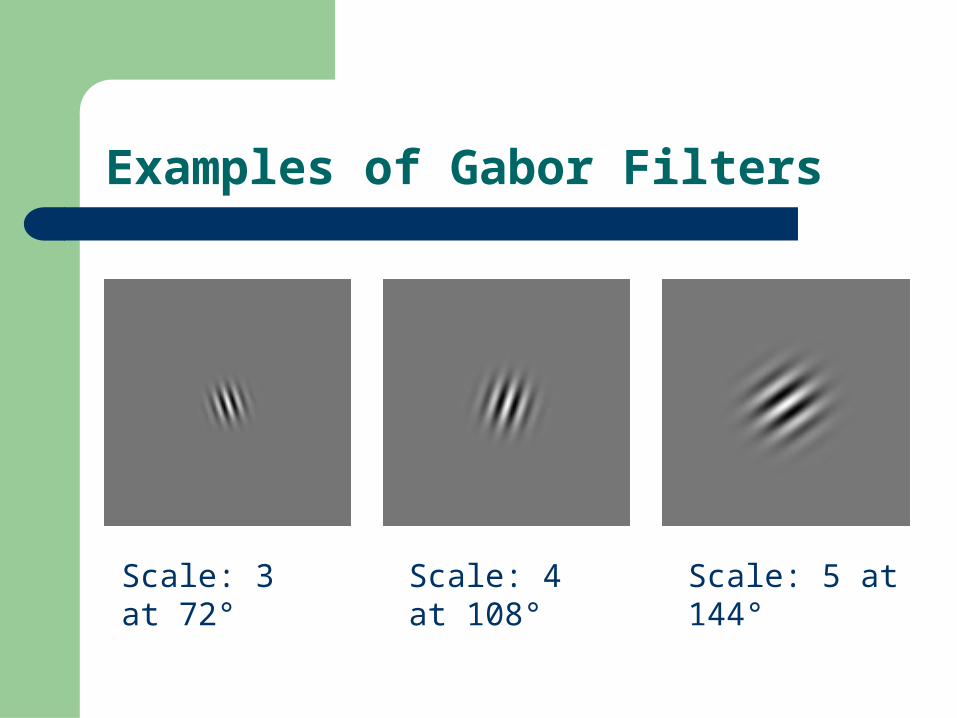
Examples of Gabor Filters
Scale: 4 at 108° Scale: 5 at 144°Scale: 3 at 72°

Gabor filters
What would the response look like to a vertical filter?

Gabor filters

Features
any problem?
For each pixel:• set of color features• set of texture features (i.e.
responses to different filters)• …

Features
For each pixel:• set of color features• set of texture features (i.e.
responses to different filters)• …
• Lots of features!• Extremely sparse• Features are position dependent
Ideas?

One approach: histograms
Examine the distribution of features, rather than the features themselves
General purpose (i.e. any distribution of features)
Resilient to variations (shadowing, changes in illumination, shading, etc.)
Can use previous work in statistics, etc.

Histogram Example

Cumulative Histogram
Normal Histogram
Cumulative Histogram

Similarity Measures Using the Histograms
Histogram 1 Histogram 2
Need to quantify how similar two histograms are

Heuristic Histogram Distances
Minkowski-form distance Lp
Special cases:– L1: absolute, cityblock, or
Manhattan distance– L2: Euclidian distance– L: Maximum value distance
More heuristic distances
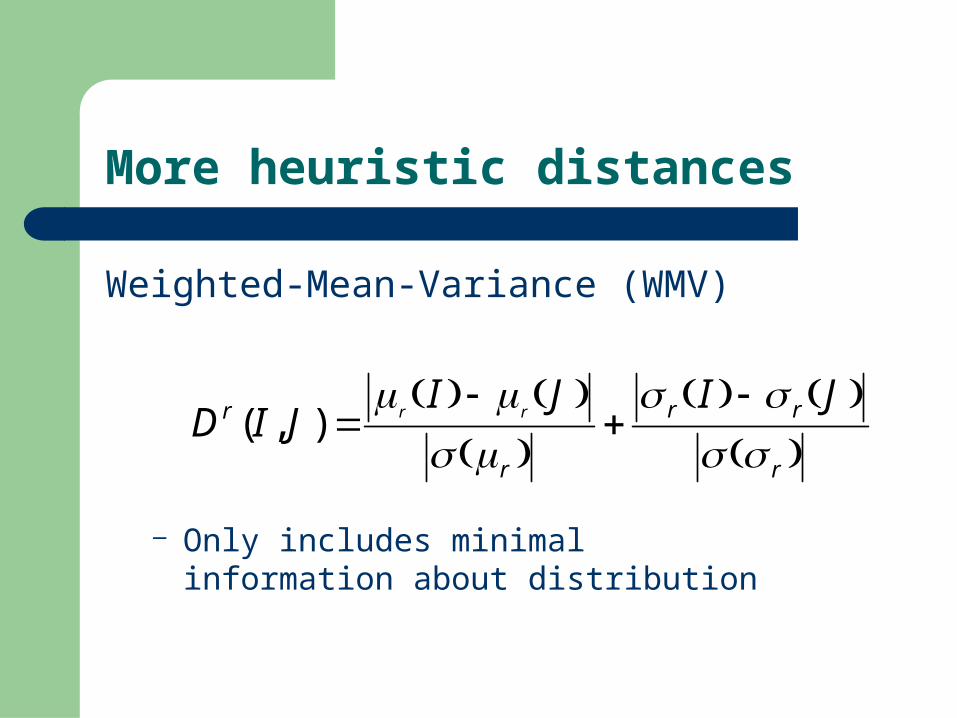
Weighted-Mean-Variance (WMV)
– Only includes minimal information about distribution
r
rr
r
r JIJIJID rr
),(

Cumulative Difference Example
Histogram 1 Histogram 2 Difference
- =
L∞ = L2 =
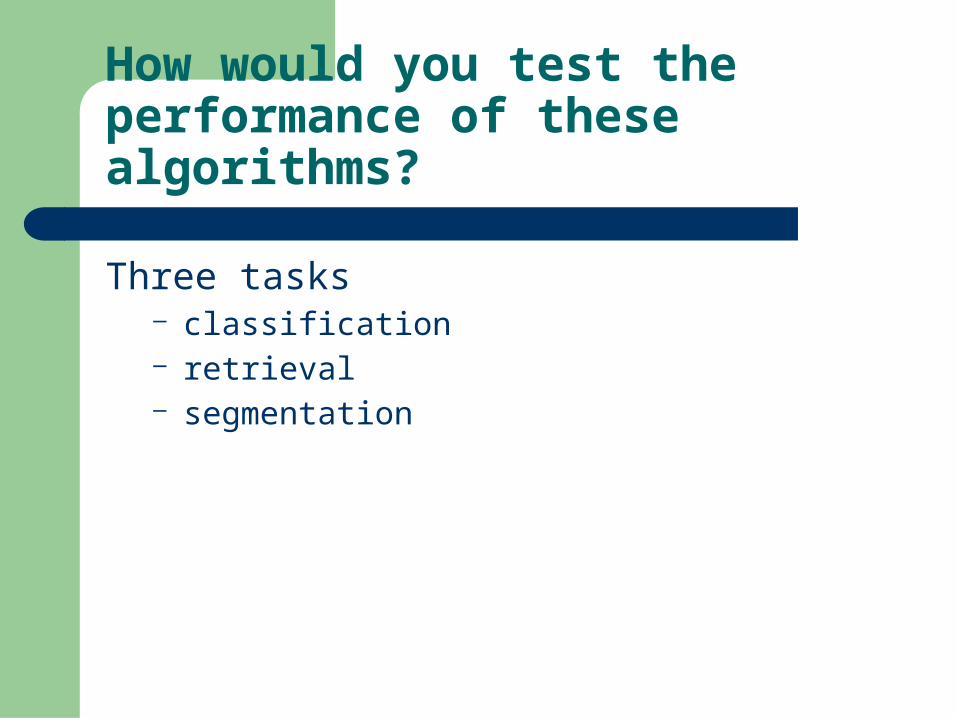
How would you test the performance of these algorithms?
Three tasks– classification– retrieval– segmentation

Data Set: Color
Randomly chose 94 images from set of 2000– 94 images represent separate classes
Randomly select disjoint set of pixels from the images
– Set size of 4, 8, 16, 32, 64 pixels– 16 disjoint samples per set per image

Data Set: Texture
Brodatz album– Collection of wide range of texture (e.g. cork, lawn, straw,
pebbles, sand, etc.)
Each image is considered a class (as in color)
Extract sets of 16 non-overlapping blocks– sizes 8x8, 16x16,…, 256x256

Setup: Classification
How can we use similarity for classification?
k-Nearest Neighbor classifier is used– Nearest Neighbor classification: given a collection
of labeled points S and a query point q, what point belonging to S is closest to q?
– k nearest is a majority vote of the k closest points

Results: Classification, color data set
sample size
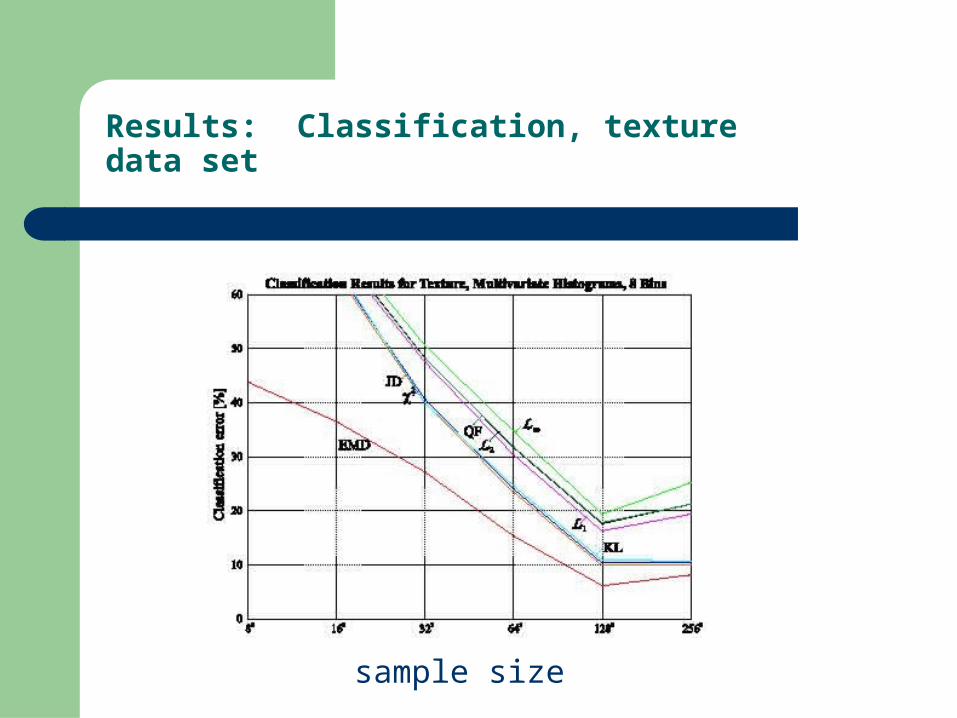
Results: Classification, texture data set
sample size

Results: Image Retrieval

Setup: Segmentation
100 images
Each image consists of 5 different textures
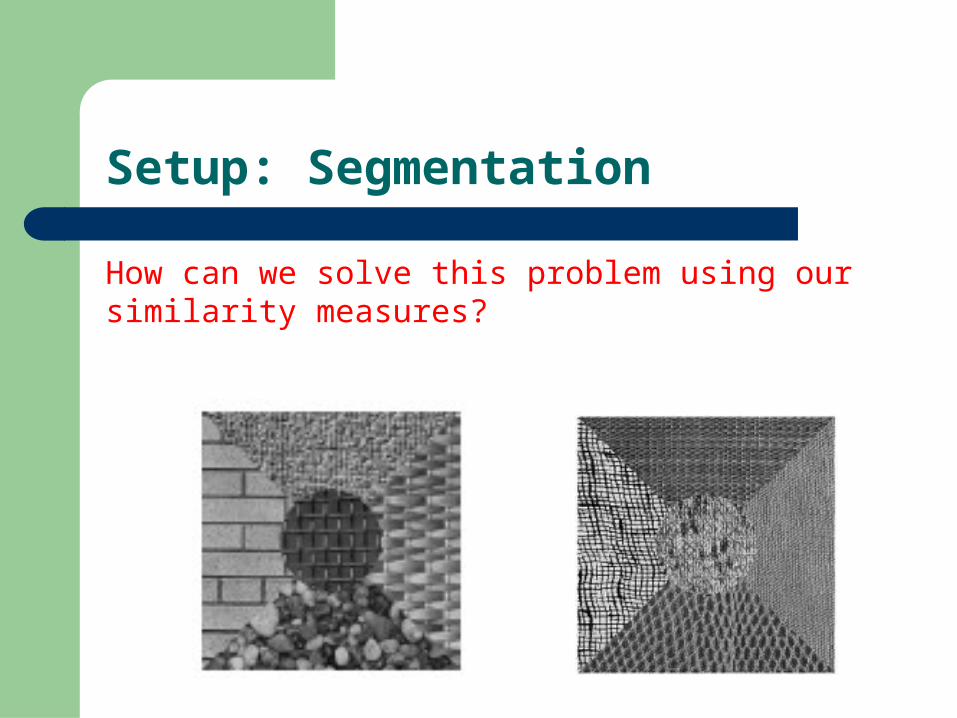
Setup: Segmentation
How can we solve this problem using our similarity measures?

Setup: Segmentation (cont.)
Image is divided into 16384 sites (128 x 128 grid)
A histogram is calculate for each site
Each site histogram is then compared with 80 randomly selected sites
Image sites with high average similarity are then grouped

Results: Segmentation
Something fun…
http://www.popsci.com/gear-amp-gadgets/article/2009-09/building-virtual-cities-automatically-150000-flickr-photos