Image-based phenotyping of plant disease symptoms and Bart Image-based phenotyping of plant disease...
8
REVIEW ARTICLE published: 05 January 2015 doi: 10.3389/fpls.2014.00734 Image-based phenotyping of plant disease symptoms Andrew M. Mutka and Rebecca S. Bart * Donald Danforth Plant Science Center, Saint Louis, MO, USA Edited by: Adi Avni, Tel Aviv University, Israel Reviewed by: Mahmut Tör, University of Worcester, UK Roland Pieruschka, Forschungszentrum Jülich, Germany *Correspondence: Rebecca S. Bart, Donald Danforth Plant Science Center, 975 North Warson Road, Saint Louis, MO 63132, USA e-mail: [email protected] Plant diseases cause significant reductions in agricultural productivity worldwide. Disease symptoms have deleterious effects on the growth and development of crop plants, limiting yields and making agricultural products unfit for consumption. For many plant–pathogen systems, we lack knowledge of the physiological mechanisms that link pathogen infection and the production of disease symptoms in the host. A variety of quantitative high- throughput image-based methods for phenotyping plant growth and development are currently being developed. These methods range from detailed analysis of a single plant over time to broad assessment of the crop canopy for thousands of plants in a field and employ a wide variety of imaging technologies. Application of these methods to the study of plant disease offers the ability to study quantitatively how host physiology is altered by pathogen infection. These approaches have the potential to provide insight into the physiological mechanisms underlying disease symptom development. Furthermore, imaging techniques that detect the electromagnetic spectrum outside of visible light allow us to quantify disease symptoms that are not visible by eye, increasing the range of symptoms we can observe and potentially allowing for earlier and more thorough symptom detection. In this review, we summarize current progress in plant disease phenotyping and suggest future directions that will accelerate the development of resistant crop varieties. Keywords: plant disease, phenotyping, imaging, pathogen, host INTRODUCTION Plant disease is a major threat for global agriculture, account- ing for at least a 10% reduction in global yields (Strange and Scott, 2005). Subsistence farmers are the most at risk from plant diseases, as they often have limited resources to deal with out- breaks. Most resistant crop varieties have been developed through breeding with resistance (R) genes. These R genes typically rec- ognize the activity of pathogen virulence factors to induce strong resistance responses (Dangl et al., 2013). This approach has been successful in some cases, but often resistance is quickly lost, which is thought to be due to rapid pathogen evolution (Kunkeaw et al., 2010; Dangl et al., 2013). An in depth understanding of the molecular interplay between hosts and their pathogens will guide the development of durable resistance strategies for crop protection. However, research aimed at identifying and characterizing the genetic determinants of host–pathogen inter- actions is often obfuscated by functional redundancy, especially on the side of the pathogen. In essence, single gene mutants often lack dramatic phenotypes and are therefore difficult to study. The advancement of genome and transcriptome sequencing technologies has helped address the above challenge by making it possible to study the genetic diversity present in both plant hosts and pathogens (Bart et al., 2012; Berkman et al., 2012). Currently, much research is aimed at characterizing this diversity with the goal of exploiting it for the development of crops with durable resistance. The ability to translate knowledge of genomic variants into desired resistance phenotypes would be aided by a more complete understanding of the relationship between genotype and phenotype in plants. Nonetheless, our ability to study plant phenomics has not progressed at the same rate as our ability to sequence genomes and transcriptomes. In recent years, there has been considerable interest and progress in the development of platforms for quantitative, high-throughput plant phenotyping (Furbank and Tester, 2011; Dhondt et al., 2013; Fiorani and Schurr, 2013; Araus and Cairns, 2014; Granier and Vile, 2014). The field of machine vision develops tools that perform auto- mated image acquisition and analysis to understand and quan- tify aspects of a scene. Increasingly, these approaches are being applied to studies of plant growth and development (Spalding and Miller, 2013). Image-based phenotyping methods offer a range of advantages. They are non-destructive, meaning that phenotypic data can be collected from the same organism over the course of a long experiment. They are also amenable to automation, making it feasible to study large sample sizes for increased statistical power. Particularly important for plant– pathogen interactions, imaging can detect spatial patterns of heterogeneity and allows for visualization of localized responses, which may be difficult to determine with other methods. Addi- tionally, various imaging techniques, such as hyperspectral and thermal imaging, collect data that cannot be visualized with the human eye. In this review, we discuss the application of image-based phenotyping methods that have the potential to dramatically enhance our ability to characterize plant disease phenotypes. www.frontiersin.org January 2015 | Volume 5 | Article 734 | 1
Transcript of Image-based phenotyping of plant disease symptoms and Bart Image-based phenotyping of plant disease...
REVIEW ARTICLEpublished: 05 January 2015
doi: 10.3389/fpls.2014.00734
Image-based phenotyping of plant disease symptomsAndrew M. Mutka and Rebecca S. Bart*
Donald Danforth Plant Science Center, Saint Louis, MO, USA
Edited by:Adi Avni, Tel Aviv University, Israel
Reviewed by:Mahmut Tör, University ofWorcester, UKRoland Pieruschka,Forschungszentrum Jülich,Germany
*Correspondence:Rebecca S. Bart, Donald DanforthPlant Science Center, 975 NorthWarson Road, Saint Louis,MO 63132, USAe-mail: [email protected]
Plant diseases cause significant reductions in agricultural productivity worldwide. Diseasesymptoms have deleterious effects on the growth and development of crop plants, limitingyields and making agricultural products unfit for consumption. For many plant–pathogensystems, we lack knowledge of the physiological mechanisms that link pathogen infectionand the production of disease symptoms in the host. A variety of quantitative high-throughput image-based methods for phenotyping plant growth and development arecurrently being developed. These methods range from detailed analysis of a single plantover time to broad assessment of the crop canopy for thousands of plants in a fieldand employ a wide variety of imaging technologies. Application of these methods to thestudy of plant disease offers the ability to study quantitatively how host physiology isaltered by pathogen infection. These approaches have the potential to provide insight intothe physiological mechanisms underlying disease symptom development. Furthermore,imaging techniques that detect the electromagnetic spectrum outside of visible light allowus to quantify disease symptoms that are not visible by eye, increasing the range ofsymptoms we can observe and potentially allowing for earlier and more thorough symptomdetection. In this review, we summarize current progress in plant disease phenotyping andsuggest future directions that will accelerate the development of resistant crop varieties.
Keywords: plant disease, phenotyping, imaging, pathogen, host
INTRODUCTIONPlant disease is a major threat for global agriculture, account-ing for at least a 10% reduction in global yields (Strange andScott, 2005). Subsistence farmers are the most at risk from plantdiseases, as they often have limited resources to deal with out-breaks. Most resistant crop varieties have been developed throughbreeding with resistance (R) genes. These R genes typically rec-ognize the activity of pathogen virulence factors to induce strongresistance responses (Dangl et al., 2013). This approach has beensuccessful in some cases, but often resistance is quickly lost, whichis thought to be due to rapid pathogen evolution (Kunkeawet al., 2010; Dangl et al., 2013). An in depth understandingof the molecular interplay between hosts and their pathogenswill guide the development of durable resistance strategies forcrop protection. However, research aimed at identifying andcharacterizing the genetic determinants of host–pathogen inter-actions is often obfuscated by functional redundancy, especiallyon the side of the pathogen. In essence, single gene mutantsoften lack dramatic phenotypes and are therefore difficult tostudy.
The advancement of genome and transcriptome sequencingtechnologies has helped address the above challenge by makingit possible to study the genetic diversity present in both planthosts and pathogens (Bart et al., 2012; Berkman et al., 2012).Currently, much research is aimed at characterizing this diversitywith the goal of exploiting it for the development of crops withdurable resistance. The ability to translate knowledge of genomicvariants into desired resistance phenotypes would be aided by
a more complete understanding of the relationship betweengenotype and phenotype in plants. Nonetheless, our ability tostudy plant phenomics has not progressed at the same rate asour ability to sequence genomes and transcriptomes. In recentyears, there has been considerable interest and progress in thedevelopment of platforms for quantitative, high-throughput plantphenotyping (Furbank and Tester, 2011; Dhondt et al., 2013;Fiorani and Schurr, 2013; Araus and Cairns, 2014; Granier andVile, 2014).
The field of machine vision develops tools that perform auto-mated image acquisition and analysis to understand and quan-tify aspects of a scene. Increasingly, these approaches are beingapplied to studies of plant growth and development (Spaldingand Miller, 2013). Image-based phenotyping methods offer arange of advantages. They are non-destructive, meaning thatphenotypic data can be collected from the same organism overthe course of a long experiment. They are also amenable toautomation, making it feasible to study large sample sizes forincreased statistical power. Particularly important for plant–pathogen interactions, imaging can detect spatial patterns ofheterogeneity and allows for visualization of localized responses,which may be difficult to determine with other methods. Addi-tionally, various imaging techniques, such as hyperspectral andthermal imaging, collect data that cannot be visualized with thehuman eye.
In this review, we discuss the application of image-basedphenotyping methods that have the potential to dramaticallyenhance our ability to characterize plant disease phenotypes.
www.frontiersin.org January 2015 | Volume 5 | Article 734 | 1
Mutka and Bart Image-based phenotyping of plant disease symptoms
The techniques discussed have the potential to increase thedimensions at which an interaction is investigated and can bedeployed in a high-throughput manner. If further developed andemployed correctly, phenomics will increase our understandingof host–pathogen interactions and facilitate the developmentof durable resistance strategies. The methods for phenotypingdisease symptoms can be broadly divided into (1) data col-lection and (2) data analysis, both of which deserve carefulattention in experimental design. We hope that this review willbring plant phenomics to the attention of the host–microbecommunity and inspire further development of these promisingtechnologies.
IMAGE-BASED METHODS FOR ASSESSMENT OF PLANTDISEASE SYMPTOMSDATA COLLECTIONVisible light imagingTraditionally, plant disease severity is scored with visual inspec-tion of plant tissue by trained raters, who categorize diseaseseverity according to a discrete scale (Bock et al., 2010). Whilethis approach has been refined over many years and many cropsystems, it still is plagued by inherent pitfalls that reduce thereliability of disease estimates. Substantial variation is observedboth between individual raters and between different assessmentsby a single rater (Nutter et al., 1993; Bock et al., 2008, 2010).Accurate visual estimates are particularly difficult to achieve withcertain types of disease symptoms, such as small, evenly spacedlesions (Bock et al., 2010). Additionally, because of the cost oflabor and time needed to perform visual assessments of disease,the number of time points from which data can be sampled islimited.
The use of automated, high-throughput digital imaging inplant disease phenotyping allows for collection of data at numer-ous time points, produces images from which quantitative phe-notypic data can be derived, and improves reproducibility ofexperiments. Many different phenotypic measurements can beobtained from image data. For studies of plant growth and devel-opment, these measurements may be plant height or biomass.For studies of plant disease or other stresses, percent leaf areacovered with symptoms or changes in photosynthetic responsescan be derived from images. The scale of imaging systems can varygreatly. For example, image-based phenotyping of a small numberof plants can be performed with inexpensive, portable systems,such as the Raspberry Pi computer and camera1. On a larger scale,high-throughput phenotyping systems, such as the BellwetherFoundation Phenotyping Facility at the Donald Danforth PlantScience Center2 and the Australian Plant Phenomics Facility3,can perform automated imaging of hundreds or thousands ofplants.
Studies with a variety of pathogens have found that image-based phenotyping produces more accurate and precise resultsthan can be obtained with visual assessments of disease, and
1http://www.raspberrypi.org2http://www.danforthcenter.org/scientists-research/core-technologies/phenotyping3http://www.plantphenomics.org.au
allows for exploration of more dimensions of disease phenotypes.For example, imaging of wheat leaves infected with strains ofthe fungal pathogen Zymoseptoria tritici was compared to tradi-tional visual assessment methods (Stewart and McDonald, 2014).This fungus causes septoria wheat blotch, which is characterizedby chlorosis, necrotic lesions, and fungal fruiting bodies calledpycnidia. Typical visual disease assessments rely on estimates ofpercent of leaf area covered by pycnidia or lesions. Since pycnidiaare small, accurate estimates of pycnidia cover are difficult tomake, especially when they are numerous. Stewart and McDonald(2014) used automated image analysis of infected wheat leavesto analyze disease symptoms caused by Z. tritici. This approachallowed them to quantify pycnidia size and density, along withother traits, which would not have been possible with visualassessment alone. Thus, image-based phenotyping can greatlyenhance the data available for characterizing plant disease.
Since variability between different ratings and between dif-ferent raters is a limitation for visual disease assessment, image-based phenotyping offers the potential to improve reproducibilityand sensitivity of disease quantification. Bock et al. (2008) exam-ined citrus canker disease symptoms on grapefruit leaves causedby the bacterium Xanthomonas axonopodis pv. citri using digitalimaging. The authors found that automated image analysis wasmore reproducible than visual assessments over multiple mea-surements. Another study found that image analysis enhanced theability to distinguish between genotypes with different levels ofdisease severity. Xie et al. (2012) studied common bacterial blightcaused by Xanthomonas spp. on two different genotypes of bean.While for this particular disease all measurements of the diseasewere reproducible between different assessments, image analysiswas better able to distinguish between different disease suscepti-bility levels on different genotypes. The authors concluded thatimage analysis is more useful for investigating the quantitativegenetics of disease resistance for this system. Thus, analysis ofplant disease symptoms with visible light imaging has been shownto have a variety of benefits, which depend on the plant–pathogensystem being analyzed.
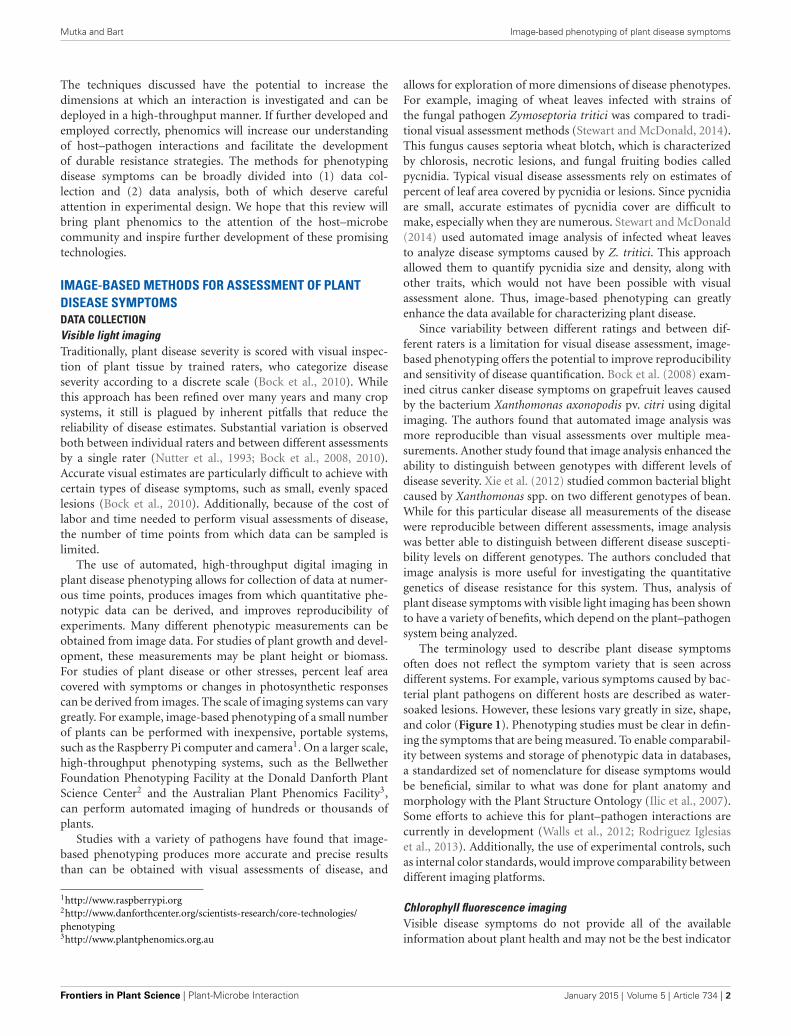
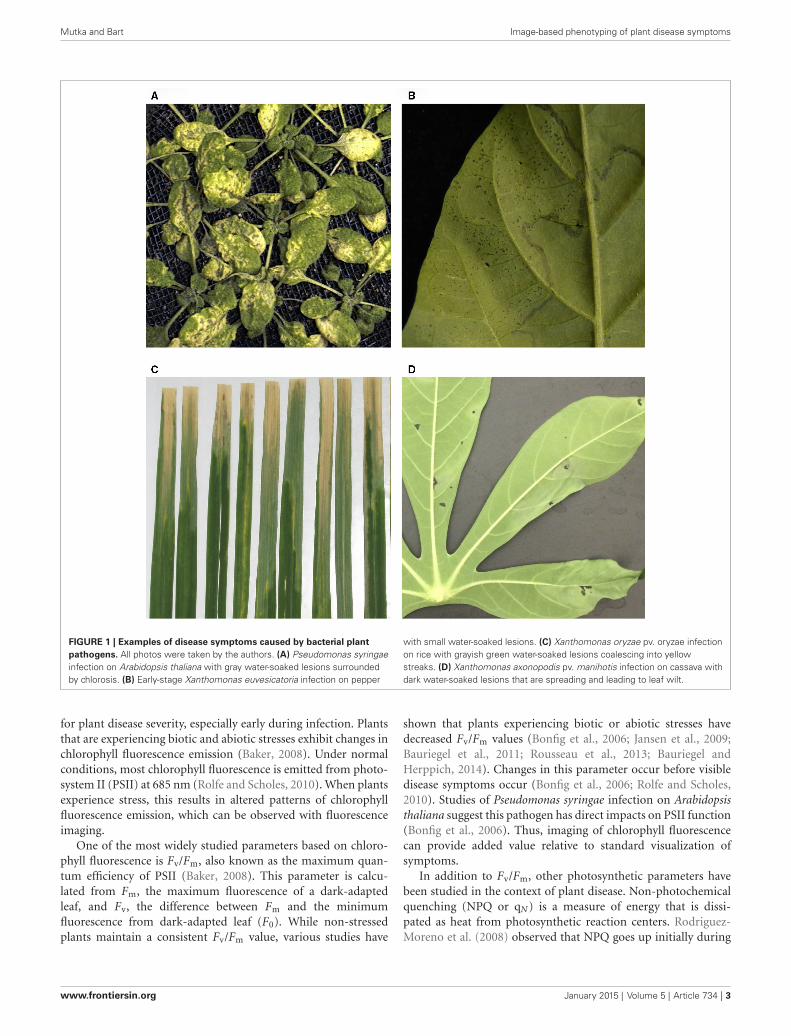
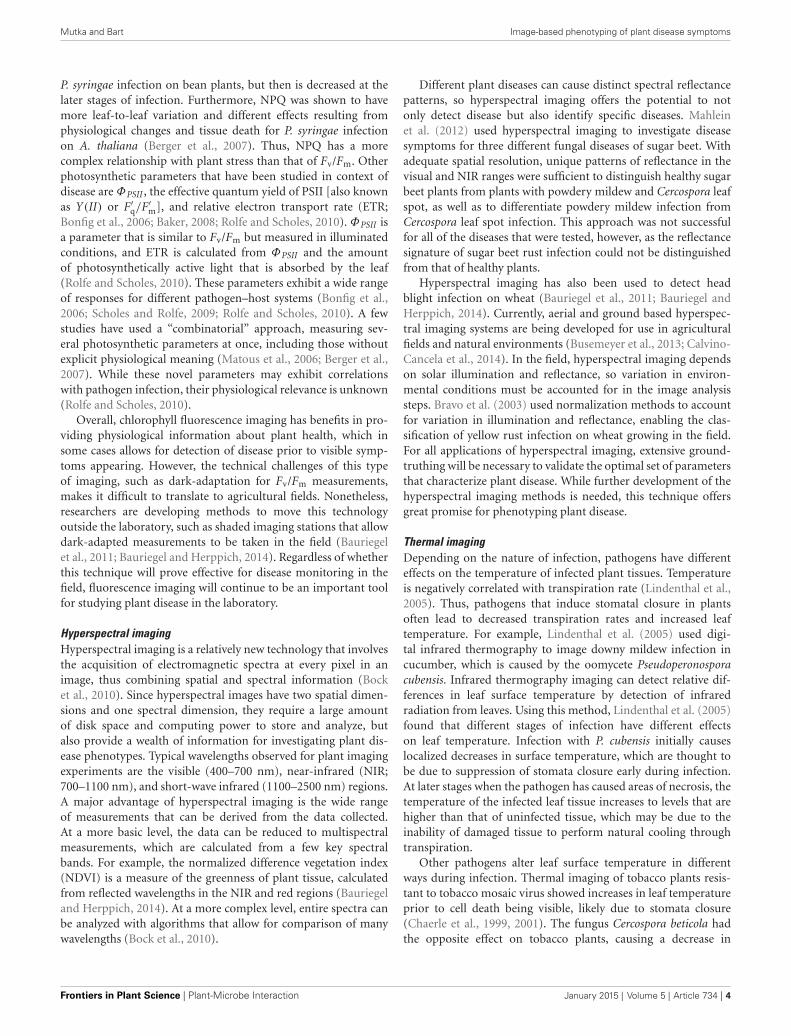
The terminology used to describe plant disease symptomsoften does not reflect the symptom variety that is seen acrossdifferent systems. For example, various symptoms caused by bac-terial plant pathogens on different hosts are described as water-soaked lesions. However, these lesions vary greatly in size, shape,and color (Figure 1). Phenotyping studies must be clear in defin-ing the symptoms that are being measured. To enable comparabil-ity between systems and storage of phenotypic data in databases,a standardized set of nomenclature for disease symptoms wouldbe beneficial, similar to what was done for plant anatomy andmorphology with the Plant Structure Ontology (Ilic et al., 2007).Some efforts to achieve this for plant–pathogen interactions arecurrently in development (Walls et al., 2012; Rodriguez Iglesiaset al., 2013). Additionally, the use of experimental controls, suchas internal color standards, would improve comparability betweendifferent imaging platforms.
Chlorophyll fluorescence imagingVisible disease symptoms do not provide all of the availableinformation about plant health and may not be the best indicator
Frontiers in Plant Science | Plant-Microbe Interaction January 2015 | Volume 5 | Article 734 | 2
Mutka and Bart Image-based phenotyping of plant disease symptoms
FIGURE 1 | Examples of disease symptoms caused by bacterial plantpathogens. All photos were taken by the authors. (A) Pseudomonas syringaeinfection on Arabidopsis thaliana with gray water-soaked lesions surroundedby chlorosis. (B) Early-stage Xanthomonas euvesicatoria infection on pepper
with small water-soaked lesions. (C) Xanthomonas oryzae pv. oryzae infectionon rice with grayish green water-soaked lesions coalescing into yellowstreaks. (D) Xanthomonas axonopodis pv. manihotis infection on cassava withdark water-soaked lesions that are spreading and leading to leaf wilt.
for plant disease severity, especially early during infection. Plantsthat are experiencing biotic and abiotic stresses exhibit changes inchlorophyll fluorescence emission (Baker, 2008). Under normalconditions, most chlorophyll fluorescence is emitted from photo-system II (PSII) at 685 nm (Rolfe and Scholes, 2010). When plantsexperience stress, this results in altered patterns of chlorophyllfluorescence emission, which can be observed with fluorescenceimaging.
One of the most widely studied parameters based on chloro-phyll fluorescence is Fv/Fm, also known as the maximum quan-tum efficiency of PSII (Baker, 2008). This parameter is calcu-lated from Fm, the maximum fluorescence of a dark-adaptedleaf, and Fv, the difference between Fm and the minimumfluorescence from dark-adapted leaf (F0). While non-stressedplants maintain a consistent Fv/Fm value, various studies have
shown that plants experiencing biotic or abiotic stresses havedecreased Fv/Fm values (Bonfig et al., 2006; Jansen et al., 2009;Bauriegel et al., 2011; Rousseau et al., 2013; Bauriegel andHerppich, 2014). Changes in this parameter occur before visibledisease symptoms occur (Bonfig et al., 2006; Rolfe and Scholes,2010). Studies of Pseudomonas syringae infection on Arabidopsisthaliana suggest this pathogen has direct impacts on PSII function(Bonfig et al., 2006). Thus, imaging of chlorophyll fluorescencecan provide added value relative to standard visualization ofsymptoms.
In addition to Fv/Fm, other photosynthetic parameters havebeen studied in the context of plant disease. Non-photochemicalquenching (NPQ or qN ) is a measure of energy that is dissi-pated as heat from photosynthetic reaction centers. Rodriguez-Moreno et al. (2008) observed that NPQ goes up initially during
www.frontiersin.org January 2015 | Volume 5 | Article 734 | 3
Mutka and Bart Image-based phenotyping of plant disease symptoms
P. syringae infection on bean plants, but then is decreased at thelater stages of infection. Furthermore, NPQ was shown to havemore leaf-to-leaf variation and different effects resulting fromphysiological changes and tissue death for P. syringae infectionon A. thaliana (Berger et al., 2007). Thus, NPQ has a morecomplex relationship with plant stress than that of Fv/Fm. Otherphotosynthetic parameters that have been studied in context ofdisease areΦPSII , the effective quantum yield of PSII [also knownas Y(II) or F′
q/F′m], and relative electron transport rate (ETR;
Bonfig et al., 2006; Baker, 2008; Rolfe and Scholes, 2010).ΦPSII isa parameter that is similar to Fv/Fm but measured in illuminatedconditions, and ETR is calculated from ΦPSII and the amountof photosynthetically active light that is absorbed by the leaf(Rolfe and Scholes, 2010). These parameters exhibit a wide rangeof responses for different pathogen–host systems (Bonfig et al.,2006; Scholes and Rolfe, 2009; Rolfe and Scholes, 2010). A fewstudies have used a “combinatorial” approach, measuring sev-eral photosynthetic parameters at once, including those withoutexplicit physiological meaning (Matous et al., 2006; Berger et al.,2007). While these novel parameters may exhibit correlationswith pathogen infection, their physiological relevance is unknown(Rolfe and Scholes, 2010).
Overall, chlorophyll fluorescence imaging has benefits in pro-viding physiological information about plant health, which insome cases allows for detection of disease prior to visible symp-toms appearing. However, the technical challenges of this typeof imaging, such as dark-adaptation for Fv/Fm measurements,makes it difficult to translate to agricultural fields. Nonetheless,researchers are developing methods to move this technologyoutside the laboratory, such as shaded imaging stations that allowdark-adapted measurements to be taken in the field (Bauriegelet al., 2011; Bauriegel and Herppich, 2014). Regardless of whetherthis technique will prove effective for disease monitoring in thefield, fluorescence imaging will continue to be an important toolfor studying plant disease in the laboratory.
Hyperspectral imagingHyperspectral imaging is a relatively new technology that involvesthe acquisition of electromagnetic spectra at every pixel in animage, thus combining spatial and spectral information (Bocket al., 2010). Since hyperspectral images have two spatial dimen-sions and one spectral dimension, they require a large amountof disk space and computing power to store and analyze, butalso provide a wealth of information for investigating plant dis-ease phenotypes. Typical wavelengths observed for plant imagingexperiments are the visible (400–700 nm), near-infrared (NIR;700–1100 nm), and short-wave infrared (1100–2500 nm) regions.A major advantage of hyperspectral imaging is the wide rangeof measurements that can be derived from the data collected.At a more basic level, the data can be reduced to multispectralmeasurements, which are calculated from a few key spectralbands. For example, the normalized difference vegetation index(NDVI) is a measure of the greenness of plant tissue, calculatedfrom reflected wavelengths in the NIR and red regions (Bauriegeland Herppich, 2014). At a more complex level, entire spectra canbe analyzed with algorithms that allow for comparison of manywavelengths (Bock et al., 2010).
Different plant diseases can cause distinct spectral reflectancepatterns, so hyperspectral imaging offers the potential to notonly detect disease but also identify specific diseases. Mahleinet al. (2012) used hyperspectral imaging to investigate diseasesymptoms for three different fungal diseases of sugar beet. Withadequate spatial resolution, unique patterns of reflectance in thevisual and NIR ranges were sufficient to distinguish healthy sugarbeet plants from plants with powdery mildew and Cercospora leafspot, as well as to differentiate powdery mildew infection fromCercospora leaf spot infection. This approach was not successfulfor all of the diseases that were tested, however, as the reflectancesignature of sugar beet rust infection could not be distinguishedfrom that of healthy plants.
Hyperspectral imaging has also been used to detect headblight infection on wheat (Bauriegel et al., 2011; Bauriegel andHerppich, 2014). Currently, aerial and ground based hyperspec-tral imaging systems are being developed for use in agriculturalfields and natural environments (Busemeyer et al., 2013; Calvino-Cancela et al., 2014). In the field, hyperspectral imaging dependson solar illumination and reflectance, so variation in environ-mental conditions must be accounted for in the image analysissteps. Bravo et al. (2003) used normalization methods to accountfor variation in illumination and reflectance, enabling the clas-sification of yellow rust infection on wheat growing in the field.For all applications of hyperspectral imaging, extensive ground-truthing will be necessary to validate the optimal set of parametersthat characterize plant disease. While further development of thehyperspectral imaging methods is needed, this technique offersgreat promise for phenotyping plant disease.
Thermal imagingDepending on the nature of infection, pathogens have differenteffects on the temperature of infected plant tissues. Temperatureis negatively correlated with transpiration rate (Lindenthal et al.,2005). Thus, pathogens that induce stomatal closure in plantsoften lead to decreased transpiration rates and increased leaftemperature. For example, Lindenthal et al. (2005) used digi-tal infrared thermography to image downy mildew infection incucumber, which is caused by the oomycete Pseudoperonosporacubensis. Infrared thermography imaging can detect relative dif-ferences in leaf surface temperature by detection of infraredradiation from leaves. Using this method, Lindenthal et al. (2005)found that different stages of infection have different effectson leaf temperature. Infection with P. cubensis initially causeslocalized decreases in surface temperature, which are thought tobe due to suppression of stomata closure early during infection.At later stages when the pathogen has caused areas of necrosis, thetemperature of the infected leaf tissue increases to levels that arehigher than that of uninfected tissue, which may be due to theinability of damaged tissue to perform natural cooling throughtranspiration.
Other pathogens alter leaf surface temperature in differentways during infection. Thermal imaging of tobacco plants resis-tant to tobacco mosaic virus showed increases in leaf temperatureprior to cell death being visible, likely due to stomata closure(Chaerle et al., 1999, 2001). The fungus Cercospora beticola hadthe opposite effect on tobacco plants, causing a decrease in
Frontiers in Plant Science | Plant-Microbe Interaction January 2015 | Volume 5 | Article 734 | 4
Mutka and Bart Image-based phenotyping of plant disease symptoms
temperature during infection, possibly due to the pathogen’sability to suppress stomatal closure (Chaerle et al., 2004). Bacterialpathogens, such as P. syringae and Xanthomonas campestris pv.campestris suppress stomatal closure at early stages of infectionto promote entry into leaf tissue (Melotto et al., 2008; Gudesblatet al., 2009), which may also lead to detectable surface temper-ature changes. Thus, if thermal imaging is able to detect thesetemperature changes caused by pathogens, it offers the potentialto identify different types of plant diseases.
When used in agricultural fields, infrared thermography issensitive to environmental variation, such as cloud cover and solarorientation (Munns et al., 2010). It can also be difficult to identifyplots of interest in an image, to separate the crop canopy from soilin the background, and to adjust for different temperatures thatresult from different plant heights and different environmentalconditions (Munns et al., 2010). Nonetheless, researchers arecurrently developing methods that alleviate these challenges. Forexample, plots are identified with signs that are readable in thethermal image, and reference surfaces are used for internal nor-malization of image data (Jones et al., 2009). Using these methods,different genotypes of rice and grape were distinguished basedon their relative responses to drought stress. While not yet usedextensively in the field specifically for biotic stresses, infrared ther-mography may be a useful tool as a monitoring system for generalstress responses in agriculture settings, whether biotic or abiotic.
DATA ANALYSISFor image-based phenotyping, once the images are generated,phenotypic data must be extracted using analysis techniques. Thecomputational methods by which these datasets are analyzed arean important consideration in any phenotyping experiment. Justas there are many options for how image data are collected, so toothere are many options for how the data are analyzed.
Marr’s three levels of information processing is a helpfulframework for thinking about how to apply image analysis to bio-logical problems (Marr, 1982; Pridmore et al., 2012). According toMarr (1982), any information processing process, such as imageanalysis, can be divided to three levels: (1) computational theory, adescription of what the process does, often in mathematical terms;(2) algorithm, the steps used by the process to implement thecomputational theory; and (3) mechanism, the physical systemsand software that carry out the process (Pridmore et al., 2012).All three of these levels should be considered when designing aphenotyping experiment. As discussed by Pridmore et al. (2012),plant biologists may lack expertise in computer vision and oftenfocus primarily on mechanism, relying on the software and hard-ware with which they are most familiar. This may not result inthe best experimental design, however, so Pridmore et al. (2012)advise biologists to identify the best possible approaches basedon computational theory and algorithm, and then choose themechanism that best implements those approaches. Like so manyfields, phenomics will benefit from increased multidisciplinarycollaboration.
Image processingIn order to extract meaningful data from images, various imageprocessing steps are necessary. Computational pipelines can be
customized to carry out these steps in an automated manner. Pre-processing steps adjust for differences in lighting and alignmentof the image. They may also involve conversion between differentimage types, such as conversion between RGB and grayscale(Klukas et al., 2014). Following pre-processing, segmentationsteps can be used to partition regions of the image for selectionof certain features (Klukas et al., 2014). Rousseau et al. (2013)used segmentation of Fv/Fm images to assess disease symptomphenotypes caused by Xanthomonas fuscans subsp. fuscans onthe common bean Phaseolus vulgaris. For their initial approach,areas with different stages of disease were identified with uni-versal threshold levels set by human raters based on their visualobservations of a training set of images. To improve upon thismethod, the authors developed a probability-based approach toidentify areas of the leaf that were likely to be diseased, followedby clustering analysis to divide the diseased area into regionswith different stages of disease. Additionally, the probabilitythresholds were normalized daily based on Fv/Fm measure-ments from mock-inoculated controls. Overall, the probability-based approach improved the analysis both by automating theprocess and by accounting for day-to-day variation in Fv/Fm
levels.A wide variety of algorithms can be used for classification or
quantification of image features. A commonly used example forhyperspectral imaging applications is the Spectral Angle Mapper(SAM) classification algorithm (Bauriegel et al., 2011; Mahleinet al., 2012). This algorithm compares vectors representing experi-mentally determined spectra and reference spectra, and calculatesan angle to represent the degree of difference between the two ateach pixel.
A variety of available software packages can aid in developmentof custom image analysis approaches. ImageJ4 is an open source,Java-based image analysis program, which is customizable witha variety of available macros and plugins written specifically forplant phenotyping applications (Hartmann et al., 2011; Stewartand McDonald, 2014). There are also commercial software pack-ages available for plant disease phenotyping, such as ASSESS 2.0,from the American Phytopathological Society, but these lack abil-ity for customization. The website Plant Image Analysis5 providesan online database of image analysis software options for plantbiology, both commercial and open source (Lobet et al., 2013).Given that image-based plant phenotyping is a relatively new field,the analysis tools are still in development.
CHALLENGES AND FUTURE DIRECTIONS FOR IMAGE-BASEDPLANT DISEASE PHENOTYPINGWhile image-based phenotyping methods offer great promisefor enhancing characterization of plant disease phenotypes,many hurdles remain for implementing these techniques in bothresearch and agricultural production. Since phenotyping methodsenable the exploration of multiple dimensions of phenotypicspace, it will be essential to determine which particular dimen-sions serve as the best indicators for plant disease status. Asthe ultimate goal is to limit the impacts of plant disease on
4http://rsbweb.nih.gov/ij5http://www.plant-image-analysis.org
www.frontiersin.org January 2015 | Volume 5 | Article 734 | 5
Mutka and Bart Image-based phenotyping of plant disease symptoms
agricultural production, understanding the correlation betweenthe disease symptoms and impacts on yield is important. Further-more, indicators of general stress may be effective early warningsigns of disease but are not likely to identify or distinguishbetween different diseases. On the other hand, assays that aredesigned to detect specific pathogens or diseases may be morereliable but may not be useful for broad surveys or early warningsystems. This tradeoff must be considered when designing pheno-typing strategies.
While imaging is likely to be useful for investigating manyplant–pathogen systems, there also may be cases for which imag-ing approaches are not sufficient for characterization of diseasephenotypes. Plant diseases that progress asymptomatically or withonly internal symptoms will be difficult to detect with image-based phenotyping. For example, the group of fungi known asFusarium spp. cause maize ear rot disease, and certain envi-ronmental conditions promote asymptomatic Fusarium infec-tions with accumulation of dangerous mycotoxins in the hosttissue (Murillo-Williams and Munkvold, 2008; Mesterházy et al.,2012). Imaging approaches are unlikely to effectively diagnosethis type of infection at an early stage. Instead, other non-imaging remote sensing technologies need to be developed todetect this disease or others like it. Becker et al. (2014) identi-fied changes in a set of volatile sesquiterpenes that are emittedfrom corn, between plants infected with Fusarium and thosethat are uninfected. In theory, remote sensing of these dif-ferent volatile chemical profiles could be a method for earlydetection for Fusarium infection. While such technologies forremote sensing do not yet exist, it may be possible to use suchmethods in the future to detect diseases without clear visiblesymptoms.
Other studies suggest that image-based phenotyping is notmore accurate or sensitive than visual assessment for certainhost–pathogen systems. Olmstead et al. (2001) attempted to usedigital imaging to improve estimates of powdery mildew infectionon sweet cherry leaves. They determined that imaging did notprovide an accurate quantification of the infected leaf area, likelybecause the difference in color between infected and uninfectedareas was not distinct enough for this particular disease (Olm-stead et al., 2001). Additionally, for some applications, it maybe more useful to quantify pathogen growth levels in the hostrather than disease symptoms (Jackson et al., 2006). Given thewide range of infections caused by plant pathogens, the best phe-notyping strategy for each particular disease should be carefullyconsidered.
A major goal in plant disease phenotyping is to translatetechniques from controlled environments in growth chambers toagricultural fields (Araus and Cairns, 2014). Many researchersare currently working on developing unmanned aerial vehiclesor ground vehicles for imaging of crop canopies (Prashar et al.,2013). Using a variety of different imaging techniques simultane-ously may be necessary for acquiring sufficient data to monitorplant health in the field.
Another challenge is developing hardware and software thatare broadly applicable across different plant–pathogen systems.Plants vary widely in size and leaf architecture, and dis-eases cause different types of symptoms. Thus, most disease
phenotyping methods have been developed specifically for oneparticular host–pathogen system. For example, imaging meth-ods developed specifically for A. thaliana may not be appli-cable to grasses, which have a dramatically different architec-ture.
Moving forward, it will be necessary to standardize methodsand document analysis methods for reproducibility. Making anal-ysis software open source and available is necessary for repro-ducibility and will enable improvement of the phenotyping meth-ods to be a community effort (Prlic and Procter, 2012; Leprevostet al., 2014). While many challenges remain for implementingthese technologies, a multi-disciplinary approach involving col-laboration between biologists, engineers, and computer scientistsis the best strategy for overcoming these hurdles.
ACKNOWLEDGMENTSAndrew M. Mutka and Rebecca S. Bart are supported by theBill and Melinda Gates Foundation. We acknowledge Ivan Baxter,Dmitri Nusinow, Melia Gehan, and Noah Fahlgren for mentor-ship and insightful discussion.
REFERENCESAraus, J. L., and Cairns, J. E. (2014). Field high-throughput phenotyping: the new
crop breeding frontier. Trends Plant Sci. 19, 52–61. doi: 10.1016/j.tplants.2013.09.008
Baker, N. R. (2008). Chlorophyll fluorescence: a probe of photosynthesis in vivo.Annu. Rev. Plant Biol. 59, 89–113. doi: 10.1146/annurev.arplant.59.032607.092759
Bart, R., Cohn, M., Kassen, A., McCallum, E. J., Shybut, M., Petriello, A., et al.(2012). High-throughput genomic sequencing of cassava bacterial blight strainsidentifies conserved effectors to target for durable resistance. Proc. Natl. Acad.Sci. U.S.A. 109, E1972–E1979. doi: 10.1073/pnas.1208003109
Bauriegel, E., Giebel, A., and Herppich, W. B. (2011). Hyperspectral and chloro-phyll fluorescence imaging to analyse the impact of Fusarium culmorum on thephotosynthetic integrity of infected wheat ears. Sensors (Basel) 11, 3765–3779.doi: 10.3390/s110403765
Bauriegel, E., and Herppich, W. (2014). Hyperspectral and chlorophyll fluorescenceimaging for early detection of plant diseases, with special reference to Fusar-ium spec. infections on wheat. Agriculture 4, 32–57. doi: 10.3390/agriculture4010032
Becker, E. M., Herrfurth, C., Irmisch, S., Kollner, T. G., Feussner, I., Karlovsky,P., et al. (2014). Infection of corn ears by Fusarium spp. induces the emis-sion of volatile sesquiterpenes. J. Agric. Food Chem. 62, 5226–5236. doi:10.1021/jf500560f
Berger, S., Benediktyova, Z., Matous, K., Bonfig, K., Mueller, M. J., Nedbal,L., et al. (2007). Visualization of dynamics of plant–pathogen interactionby novel combination of chlorophyll fluorescence imaging and statisticalanalysis: differential effects of virulent and avirulent strains of P. syringaeand of oxylipins on A. thaliana. J. Exp. Bot. 58, 797–806. doi: 10.1093/jxb/erl208
Berkman, P. J., Lai, K., Lorenc, M. T., and Edwards, D. (2012). Next-generationsequencing applications for wheat crop improvement. Am. J. Bot. 99, 365–371.doi: 10.3732/ajb.1100309
Bock, C. H., Parker, P. E., Cook, A. Z., and Gottwald, T. R. (2008). Visual rating andthe use of image analysis for assessing different symptoms of citrus canker ongrapefruit leaves. Plant Dis. 92, 530–541. doi: 10.1094/PDIS-92-4-0530
Bock, C. H., Poole, G. H., Parker, P. E., and Gottwald, T. R. (2010). Plantdisease severity estimated visually, by digital photography and image anal-ysis, and by hyperspectral imaging. Crit. Rev. Plant Sci. 29, 59–107. doi:10.1080/07352681003617285
Bonfig, K. B., Schreiber, U., Gabler, A., Roitsch, T., and Berger, S. (2006). Infectionwith virulent and avirulent P. syringae strains differentially affects photo-synthesis and sink metabolism in Arabidopsis leaves. Planta 225, 1–12. doi:10.1007/s00425-006-0303-3
Frontiers in Plant Science | Plant-Microbe Interaction January 2015 | Volume 5 | Article 734 | 6
Mutka and Bart Image-based phenotyping of plant disease symptoms
Bravo, C., Moshou, D., West, J., Mccartney, A., and Ramon, H. (2003). Early diseasedetection in wheat fields using spectral reflectance. Biosyst. Eng. 84, 137–145.doi: 10.1016/S1537-5110(02)00269-6
Busemeyer, L., Mentrup, D., Moller, K., Wunder, E., Alheit, K., Hahn, V.,et al. (2013). BreedVision—a multi-sensor platform for non-destructive field-based phenotyping in plant breeding. Sensors (Basel) 13, 2830–2847. doi:10.3390/s130302830
Calvino-Cancela, M., Mendez-Rial, R., Reguera-Salgado, J., and Martin-Herrero, J.(2014). Alien plant monitoring with ultralight airborne imaging spectroscopy.PLoS ONE 9:e102381. doi: 10.1371/journal.pone.0102381
Chaerle, L., De Boever, D., Van Montagu, M., and Van Der Straeten, D. (2001).Thermographic visualization of cell death in tobacco and Arabidopsis. Plant CellEnviron. 24, 15–25. doi: 10.1046/j.1365-3040.2001.00654.x
Chaerle, L., Hagenbeek, D., De Bruyne, E., Valcke, R., and Van Der Straeten,D. (2004). Thermal and chlorophyll-fluorescence imaging distinguish plant–pathogen interactions at an early stage. Plant Cell Physiol. 45, 887–896. doi:10.1093/pcp/pch097
Chaerle, L., Van Caeneghem, W., Messens, E., Lambers, H., Van Montagu, M.,and Van Der Straeten, M. (1999). Presymptomatic visualization of plant–virus interactions by thermography. Nat. Biotechnol. 17, 813–816. doi: 10.1038/11765
Dangl, J. L., Horvath, D. M., and Staskawicz, B. J. (2013). Pivoting the plantimmune system from dissection to deployment. Science 341, 746–751. doi:10.1126/science.1236011
Dhondt, S., Wuyts, N., and Inze, D. (2013). Cell to whole-plant pheno-typing: the best is yet to come. Trends Plant Sci. 18, 428–439. doi:10.1016/j.tplants.2013.04.008
Fiorani, F., and Schurr, U. (2013). Future scenarios for plant phenotyping. Annu.Rev. Plant Biol. 64, 267–291. doi: 10.1146/annurev-arplant-050312-120137
Furbank, R. T., and Tester, M. (2011). Phenomics—technologies to relieve thephenotyping bottleneck. Trends Plant Sci. 16, 635–644. doi: 10.1016/j.tplants.2011.09.005
Granier, C., and Vile, D. (2014). Phenotyping and beyond: modelling the relation-ships between traits. Curr. Opin. Plant Biol. 18C, 96–102. doi: 10.1016/j.pbi.2014.02.009
Gudesblat, G. E., Torres, P. S., and Vojnov, A. A. (2009). Xanthomonas campestrisovercomes Arabidopsis stomatal innate immunity through a DSF cell-to-cell signal-regulated virulence factor. Plant Physiol. 149, 1017–1027. doi:10.1104/pp.108.126870
Hartmann, A., Czauderna, T., Hoffmann, R., Stein, N., and Schreiber, F. (2011).HTPheno: an image analysis pipeline for high-throughput plant phenotyping.BMC Bioinformatics 12:148. doi: 10.1186/1471-2105-12-148
Ilic, K., Kellogg, E. A., Jaiswal, P., Zapata, F., Stevens, P. F., Vincent, L. P.,et al. (2007). The plant structure ontology, a unified vocabulary of anatomyand morphology of a flowering plant. Plant Physiol. 143, 587–599. doi:10.1104/pp.106.092825
Jackson, E. W., Avant, J. B., Overturf, K. E., and Bonman, J. M. (2006). Aquantitative assay of Puccinia coronata f.sp. avenae DNA in Avena sativa. PlantDis. 90, 629–636. doi: 10.1094/PD-90-0629
Jansen, M., Gilmer, F., Biskup, B., Nagel, K. A., Rascher, U., Fischback, A., et al.(2009). Simultaneous phenotyping of leaf growth and chlorophyll fluores-cence via GROWSCREEN FLUORO allows detection of stress tolerance inArabidopsis thaliana and other rosette plants. Funct. Plant Biol. 36, 902–914. doi:10.1071/FP09095
Jones, H. G., Serraj, R., Loveys, B. R., Xiong, L., Wheaton, A., and Price, A. H.(2009). Thermal infrared imaging of crop canopies for the remote diagnosis andquantification of plant responses to water stress in the field. Funct. Plant Biol. 36,978–989. doi: 10.1071/FP09123
Klukas, C., Chen, D., and Pape, J. M. (2014). Integrated Analysis Platform: anopen-source information system for high-throughput plant phenotyping. PlantPhysiol. 165, 506–518. doi: 10.1104/pp.113.233932
Kunkeaw, S., Tan, S., and Coaker, G. (2010). Molecular and evolutionary analysesof Pseudomonas syringae pv. tomato race 1. Mol. Plant Microbe Interact. 23, 415–424. doi: 10.1094/MPMI-23-4-0415
Leprevost, F. V., Barbosa, V. C., Francisco, E. L., Perez-Riverol, Y., and Carvalho,P. C. (2014). On best practices in the development of bioinformatics software.Front. Genet. 5:199. doi: 10.3389/fgene.2014.00199
Lindenthal, M., Steiner, U., Dehne, H. W., and Oerke, E. C. (2005). Effect of downymildew development on transpiration of cucumber leaves visualized by digital
infrared thermography. Phytopathology 95, 233–240. doi: 10.1094/PHYTO-95-0233
Lobet, G., Draye, X., and Périlleux, C. (2013). An online database for plant imageanalysis software tools. Plant Methods 9, 38. doi: 10.1186/1746-4811-9-38
Mahlein, A. K., Steiner, U., Hillnhütter, C., Dehne, H. W., and Oerke, E. C. (2012).Hyperspectral imaging for small-scale analysis of symptoms caused by differentsugar beet diseases. Plant Methods 8, 3. doi: 10.1186/1746-4811-8-3
Marr, D. (1982). Vision: A Computational Investigation into the Human Representa-tion and Processing of Visual Information. San Francisco: Freeman.
Matous, K., Benediktyova, Z., Berger, S., Roitsch, T., and Nedbal, L. (2006).Case study of combinatorial imaging: what protocol and what chlorophyllfluorescence image to use when visualizing infection of Arabidopsis thaliana byPseudomonas syringae? Photosynth. Res. 90, 243–253. doi: 10.1007/s11120-006-9120-6
Melotto, M., Underwood, W., and He, S. Y. (2008). Role of stomata in plant innateimmunity and foliar bacterial diseases. Annu. Rev. Phytopathol. 46, 101–122. doi:10.1146/annurev.phyto.121107.104959
Mesterházy, Á., Lemmens, M., and Reid, L. M. (2012). Breeding for resistance toear rots caused by Fusarium spp. in maize—a review. Plant Breed. 131, 1–19.doi: 10.1111/j.1439-0523.2011.01936.x
Munns, R., James, R. A., Sirault, X. R., Furbank, R. T., and Jones, H. G. (2010). Newphenotyping methods for screening wheat and barley for beneficial responses towater deficit. J. Exp. Bot. 61, 3499–3507. doi: 10.1093/jxb/erq199
Murillo-Williams, A., and Munkvold, G. P. (2008). Systemic infection by Fusariumverticillioides in maize plants grown under three temperature regimes. Plant Dis.92, 1695–1700. doi: 10.1094/PDIS-92-12-1695
Nutter, F. W. Jr., Gleason, M. L., Jenco, J. H., and Christians, N. C. (1993).Assessing the accuracy, intra-rater repeatability, and inter-rater reliability ofdisease assessment systems. Phytopathology 83, 806–812. doi: 10.1094/Phyto-83-806
Olmstead, J. W., Lang, G. A., and Grove, G. G. (2001). Assessment of severityof powdery mildew infection of sweet cherry leaves by digital image analysis.HortScience 36, 107–111.
Prashar, A., Yildiz, J., Mcnicol, J. W., Bryan, G. J., and Jones, H. G. (2013). Infra-redthermography for high throughput field phenotyping in Solanum tuberosum.PLoS ONE 8:e65816. doi: 10.1371/journal.pone.0065816
Pridmore, T. P., French, A. P., and Pound, M. P. (2012). What lies beneath:underlying assumptions in bioimage analysis. Trends Plant Sci. 17, 688–692. doi:10.1016/j.tplants.2012.07.003
Prlic, A., and Procter, J. B. (2012). Ten simple rules for the open development ofscientific software. PLoS Comput. Biol. 8:e1002802. doi: 10.1371/journal.pcbi.1002802
Rodriguez Iglesias, A., Egana Aranguren, M., Rodriguez Gonzalez, A., and Wilkin-son, M. D. (2013). “Plant–pathogen interactions ontology (PPIO),” in Pro-ceedings of the International Work-Conference on Bioinformatics and BiomedicalEngineering, 695–702.
Rodriguez-Moreno, L., Pineda, M., Soukupova, J., Macho, A. P., Beuzon, C. R.,Baron, M., et al. (2008). Early detection of bean infection by Pseudomonassyringae in asymptomatic leaf areas using chlorophyll fluorescence imaging.Photosynth. Res. 96, 27–35. doi: 10.1007/s11120-007-9278-6
Rolfe, S. A., and Scholes, J. D. (2010). Chlorophyll fluorescence imaging of plant–pathogen interactions. Protoplasma 247, 163–175. doi: 10.1007/s00709-010-0203-z
Rousseau, C., Belin, E., Bove, E., Rousseau, D., Fabre, F., Berruyer, R., et al. (2013).High throughput quantitative phenotyping of plant resistance using chlorophyllfluorescence image analysis. Plant Methods 9, 17. doi: 10.1186/1746-4811-9-17
Scholes, J. D., and Rolfe, S. A. (2009). Chlorophyll fluorescence imaging as tool forunderstanding the impact of fungal diseases on plant performance: a phenomicsperspective. Funct. Plant Biol. 36, 880–892. doi: 10.1071/FP09145
Spalding, E. P., and Miller, N. D. (2013). Image analysis is driving a renais-sance in growth measurement. Curr. Opin. Plant Biol. 16, 100–104. doi:10.1016/j.pbi.2013.01.001
Stewart, E. L., and McDonald, B. A. (2014). Measuring quantitative virulence in thewheat pathogen Zymoseptoria tritici using high-throughput automated imageanalysis. Phytopathology 104, 985–992. doi: 10.1094/PHYTO-11-13-0328-R
Strange, R. N., and Scott, P. R. (2005). Plant disease: a threat to global foodsecurity. Annu. Rev. Phytopathol. 43, 83–116. doi: 10.1146/annurev.phyto.43.113004.133839
www.frontiersin.org January 2015 | Volume 5 | Article 734 | 7
Mutka and Bart Image-based phenotyping of plant disease symptoms
Walls, R., Smith, B., Elsar, J., Goldfain, A., Stevenson, D. W., and Jaiswal, P. (2012).“A plant disease extension of the Infectious Disease Ontology,” in InternationalConference on Biomedical Ontology (ICBO-2012), 1–5.
Xie, W., Yu, K., Pauls, K. P., and Navabi, A. (2012). Application of image anal-ysis in studies of quantitative disease resistance, exemplified using commonbacterial blight-common bean pathosystem. Phytopathology 102, 434–442. doi:10.1094/PHYTO-06-11-0175
Conflict of Interest Statement: The authors declare that the research was con-ducted in the absence of any commercial or financial relationships that could beconstrued as a potential conflict of interest.
Received: 05 September 2014; accepted: 03 December 2014; published online: 05January 2015.Citation: Mutka AM and Bart RS (2015) Image-based phenotyping of plant diseasesymptoms. Front. Plant Sci. 5:734. doi: 10.3389/fpls.2014.00734This article was submitted to Plant-Microbe Interaction, a section of the journalFrontiers in Plant Science.Copyright © 2015 Mutka and Bart. This is an open-access article distributed under theterms of the Creative Commons Attribution License (CC BY). The use, distribution orreproduction in other forums is permitted, provided the original author(s) or licensorare credited and that the original publication in this journal is cited, in accordancewith accepted academic practice. No use, distribution or reproduction is permittedwhich does not comply with these terms.
Frontiers in Plant Science | Plant-Microbe Interaction January 2015 | Volume 5 | Article 734 | 8


![[INFOGRAPHIC] Uncovering Hidden Symptoms of Parkinson’s Disease](https://static.fdocuments.net/doc/165x107/557ab0a1d8b42a74488b4dbe/infographic-uncovering-hidden-symptoms-of-parkinsons-disease.jpg)