Image Analysis of Planetary Nebula - Physics Portal at …Image Analysis of Planetary Nebula NGC ......
23
Image Analysis of Planetary Nebula NGC 6543 Faculty Mentor Dr. Donald Walter Team Members Ms. Jennifer Sanders, Mathematics Education Ms. Korressa Williams, Biology South Carolina State University July 22, 2005
Transcript of Image Analysis of Planetary Nebula - Physics Portal at …Image Analysis of Planetary Nebula NGC ......

Image Analysis of Planetary Nebula NGC 6543
Faculty Mentor Dr. Donald Walter
Team Members
Ms. Jennifer Sanders, Mathematics Education Ms. Korressa Williams, Biology
South Carolina State University July 22, 2005
PLANETARY NEBULAE
A star is a sphere of gas where the gravitational force that pulls all particles together, is
balanced by an outgoing pressure from the gas itself. When a low mass star like the sun or a few
times more massive than the sun burns more and more heavy elements, it makes its final lap
across the Hertzsprung-Russell (H-R) diagram and enters a region called asymptotic giant branch
(AGB), a region that lies above and parallel to the red giant region. In the AGB region, the star,
which has expanded into a red giant, continues to go through a series of changes as its dying
process continues. Inside the core of the star, there is a carbon ash core, a shell where helium is
fusing into carbon, and a shell where the fusion of hydrogen to helium has temporarily ceased.
As the fusing of helium into carbon continues, the inner core collapses to a high-density state
causing the burning inside the shell to increase its intensity. At this point, the star becomes
unstable, continues to heat up, and begins shrinking, as it becomes a white dwarf. Inside the core,
nuclear reactions are taking place such that carbon, nitrogen, and oxygen are created. Through
convection, these reactions are transported to the outer envelope of the stellar atmosphere. The
asymmetric winds from the dying stars start to sculpt their circumstellar envelopes. The dust
around the core that prevented the light from escaping outward has disappeared and energetic
rays and fast stellar winds interact with the escaping atmosphere. A fast stellar wind of gas,
which is energized by light pressure from the hot core, blows off the outer layers of the central
star creating an elongated shell of dense, glowing gas. This elongated shell is known as planetary
nebula.
Planetary nebulae are an expanding shell of gas ejected from a star during the latter
stages of its evolution. The name planetary nebula comes from the similarity between how
planetary nebulae look like the planet Uranus with a greenish-blue disk. They are composed of
ionized gases like nitrogen and oxygen. Planetary nebulae are bright in the visible, radio,
2

infrared, ultra-violent and x-ray sources, yet, their brightness in the radio sources will decrease as
a planetary nebula's ages and expands as well as become more diffuse. They have radii in the
range of 0.2 to 3 light-years and an expansion rate of 10 to 20 km/s. The youngest planetary
nebulae are bright as radio sources while full-grown planetary nebulae, which are made of
glowing plasma, are ionized by ultraviolet light from the central star. Calculation of ages based
on the expansion rate shows that planetary nebulae are in most cases no more than 10,000 years
old. Researchers have identified about 1500 planetary nebulae thus far. The older planetary
nebulae have combined with the interstellar medium and are not detectable.
Planetary nebulae display paired lobes, jets, hourglass shaped shells, or other bipolar
forms that will appear nearly circular, elongated, dumbbell figure or opposing lobes. These
peculiar shapes are believed to be the result of a star or planet orbiting the central star, rapid
rotation or magnetic fields. Researchers have three theories about how the shapes of planetary
nebulae are formed.
The first theory states that strong magnetic fields helped shape the star's stellar winds,
which shape the planetary nebula. Strong magnetic fields are associated with fast rotation that
could shape planetary nebulae but giant stars are mostly slow rotators. This means that a central
star's stellar winds would not be fast enough to create the shapes.
The second theory states that the central star has a binary (orbiting) companion that
shapes the out flowing gas known as planetary nebula. A binary companion could be possible
and if so, it might be responsible for a pair of high speed jets of gas that lie at right angles to the
equatorial ring. This means that the binary companion was attracting materials from a nearby star
and jets of gas were escaping off of the binary companion’s rotation axis causing gas lobes. The
jets would explain several puzzling features along the outside edge of the gas lobes. However,
the twin jets are pointing in different directions than suggested by several features that were
3
observed. This could only mean that the jets are wobbling and turning on and off episodically.
Nonetheless, the shape of the planetary nebula is not a geometric concept but a result of the
physical processes that are constantly occurring in the nebula. Nevertheless, researchers lean
toward the second theory, even though, there are certain events that can occur to make a giant
star spin fast enough so the first theory could possibly be right.
The third theory is that the unseen, high-density, neutral materials around the core
confine the central torus and force an outflow of materials from the star. This outflow escapes
through the torus creating bipolar lobes as well as shaping planetary nebulae.
Planetary nebulae also have a series of rings and extended halos. The series of rings is the
result of the central star blowing off its outer layers every so many thousands of years. These
rings are apart of the planetary nebulae and are composed of gases ejected during active phases
of the star's evolution prior to nebula's illumination by the central star. The planetary nebula's
bright inner parts are several magnitudes brighter than the extended (outer) halo, which appears
as a diffuse glow and is the remnant of the envelope ejected when a star was a red giant. The
glow gives the halo the name AGB halo because it is a representation of the mass loss as the star
is moving along the AGB region and has not thrown off its outer layers. The halo is the first
ejection from the star as it goes into its red giant stage. The AGB halo will be reclassified as a
recombination halo as it becomes an expanded, cooling planetary shell. The glow of the halo will
start at the deep red wavelength of the hydrogen-alpha emission line and then work its way to the
blue-green of the oxygen-III line where it is going from the outer to the inner part of the nebula.
The halo is a circular, bipolar filamentary structure that looks clumpy with broken arcs. On the
average, a halo is two or three times the diameter of a planetary nebula.
NGC 6543
On February 15, 1786, William Herschel discovered a planetary nebula now called NGC
4

6543. NGC is an abbreviation for “New General Catalog”. The NGC catalog is a book of
classified entries of deep sky objects and NGC 6543 is the 6,543 rd entry. NGC 6543 is also
known as The Cat's Eye nebula because of its series of gas loops that resemblance a cat’s eye.
NGC 6543 was the first planetary nebula to be spectroscopically investigated and it displayed a
peculiar emission line spectrum. English amateur astronomer William Huggins gathered this data
in 1864. The emission lines were small in numbers with the brightest of them being 500.7
nanometers, which did not correspond to any known element at the time. Later it was discovered
that the emission line at 500.7 nanometers was the familiar element oxygen, which has been
doubly ionized and is being observed in low-density conditions.
NGC 6543 surprisingly revealed intricate structures of concentric gas shells with jets of
high-speed gas and unusual shock-induced knots of gas as viewed with NASA's Hubble Space
Telescope. Modern telescopes show a figure of NGC 6543 as transparent hourglasses or barrels
tipped at various angles creating a display with two-sided symmetry. Beside the discovery of a
glowing bubble of hot gas, scientists noticed an unexpected X-ray bright central star, which is an
O-type star, within the structure of the planetary nebula.
NGC 6543 is 8th magnitude and located almost exactly in the direction of the North
Ecliptic Pole. This means that the normal vector of Earth’s orbital plane points to a direction
very close to the planetary nebula NGC 6543. NGC 6543 can be found in the northern
constellation Draco, which lies midway between Delta and Zeta Dra. NGC 6543 is about 3000
light years from Earth. It has a diameter of 20 arc seconds and an extended halo of matter that is
386 arc seconds. This means that NGC 6543 is 18” wide and the outer halo is 4' wide. The
brightest part of the Cat's Eye Nebula is about a half light-year wide where it lies in a large part
of the oldest halo from the central star. The intricate web of nebulosity of NGC 6543 is about
1,000 years old.
5

The outer layers of NGC 6543 are possibly outer polar caps and other debris that were
created by an even earlier bursting of the central star. The materials are moving away at a speed
of about 4 million miles per hour. The materials are embedded inside two larger lobes of gas that
were blown off the central star in an earlier phase. The lobes are pinched by a ring of denser gas,
which many scientists believe was ejected along the orbital plane of a binary companion.
NGC 6543 is one of the brightest objects of its type and has a visual record of the
dynamics and late evolution of a dying star. NGC 6543 has nine faint, regular spaced rings that
indicate that a bubble of gas is ejected every 1,500 years. The outer filaments are about 60,000
years old. The dust cloud around the central star weighs around 1.17 solar masses. The central
star has a surface temperature of about 60,000 degrees, but the X-ray emission from the central
star has a temperature of a few million degrees.
INTERSTELLAR MEDIUM
A planetary nebula expands at a few kilometers per second, and it will eventually
become so far away from the central star that its ultraviolet radiation will no longer ionize it. The
gas clouds will become invisible and gradually disperse into the interstellar medium (ISM). The
gases of planetary nebulae contain a large proportion of elements such as carbon, nitrogen, and
oxygen. These elements are mixed in with the interstellar medium and provide heavy elements to
the next generation of stars and planets.
The ISM is the gas and dust distributed between the stars. The gas, which is 99 percent of
the ISM, can be hot or cold and the dust, which is 1 percent of the ISM, can be small or large
because the interstellar medium is not uniform. Actually, the interstellar medium is very clumpy
and the different clumps are the result of the differences in temperature and density of its four
components. The components are HI clouds, intercloud medium, coronal gas and molecular
clouds.
6

The HI clouds are not ionized but are neutral gases. They are very cool with
temperatures that range from 50 to 150 Kelvin and densities of about ten to a few hundred atoms
per cubic centimeters. They are long, twisted filaments that are flatten into thin sheets or tangled
into chaotic shapes.
Within these HI clouds, a hot intercloud medium lies and is made up of ionized
hydrogen with the gases ionized by the ultraviolet photons in the starlight. Its temperature is
about a few thousand Kelvin and densities of 0.01 atoms per cubic centimeters. The intercloud
medium is in equilibrium with the HI clouds because its hot, low-density gas has about the same
pressure as the HI clouds’ colder, denser gas.
Molecular clouds are very dense and located inside the densest clouds where dust
absorbs and scatters the short-wavelength radiation because its molecules are very fragile and a
high-energy photons in the ultraviolet would break the molecules into separate atoms. The
molecules emit energy as radio and infrared photons that escape from the clouds keeping the
interior of the clouds very cool through molecular radiation. These clouds can be as large as 60
pc in diameter with a mass up to a million solar masses. Within these molecular clouds, stars are
born and the energy from these hot stars and supernova explosions create coronal gases.
X-ray telescopes have detected x-rays with extremely high temperatures in some regions
of the interstellar medium. These regions are filled with coronal gases that have a temperature of
about a million Kelvin and higher and densities of 0.0004 to 0.003 atoms per cubic centimeters.
Coronal gas is the extremely high-temperature, low-density gas in the interstellar medium.
Neighboring shells of coronal gases often form to produce an even larger volume of coronal
gases. Astronomers believe that coronal gases account for only 5 percent of the interstellar mass
while the approximate amounts for other regions include HI clouds at 25 percent, intercloud
medium at 50 percent, and molecular clouds at 25 percent. Studies of the interstellar absorption
7
lines reiterate the composition of gases in the interstellar medium. They indicate that hydrogen is
the most abundant but helium, nitrogen, oxygen, carbon, iron, calcium, and titanium are also
among the gases present.
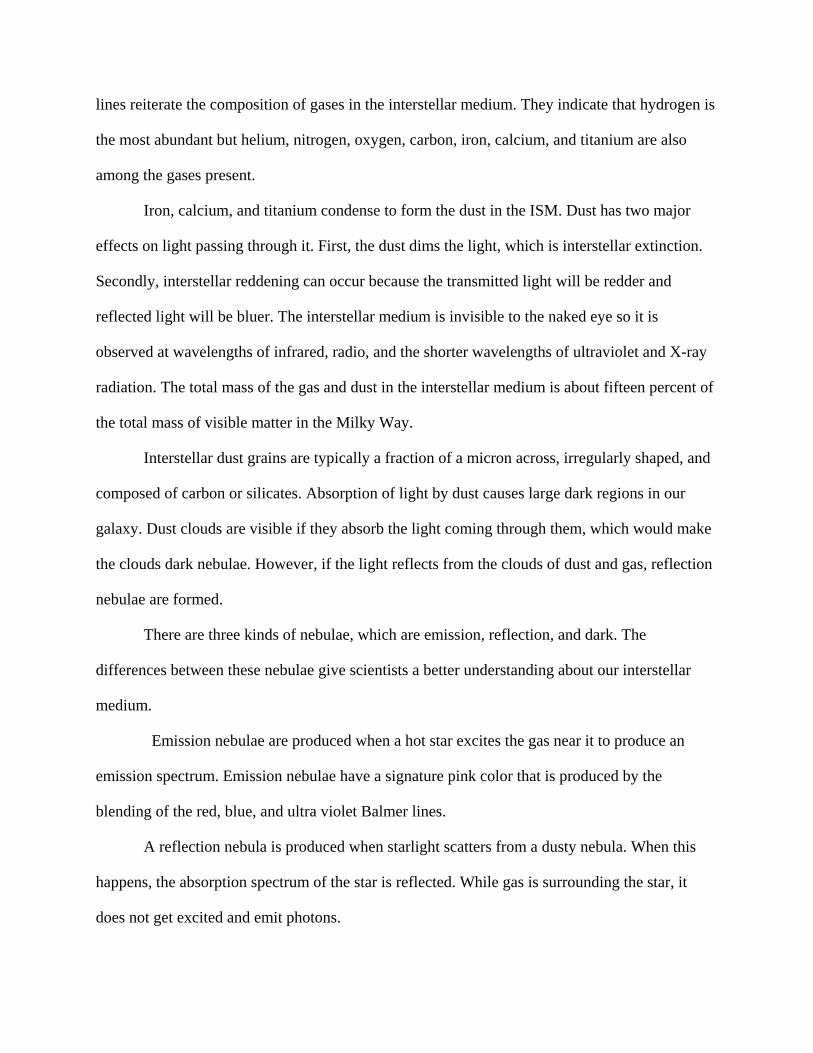
Iron, calcium, and titanium condense to form the dust in the ISM. Dust has two major
effects on light passing through it. First, the dust dims the light, which is interstellar extinction.
Secondly, interstellar reddening can occur because the transmitted light will be redder and
reflected light will be bluer. The interstellar medium is invisible to the naked eye so it is
observed at wavelengths of infrared, radio, and the shorter wavelengths of ultraviolet and X-ray
radiation. The total mass of the gas and dust in the interstellar medium is about fifteen percent of
the total mass of visible matter in the Milky Way.
Interstellar dust grains are typically a fraction of a micron across, irregularly shaped, and
composed of carbon or silicates. Absorption of light by dust causes large dark regions in our
galaxy. Dust clouds are visible if they absorb the light coming through them, which would make
the clouds dark nebulae. However, if the light reflects from the clouds of dust and gas, reflection
nebulae are formed.
There are three kinds of nebulae, which are emission, reflection, and dark. The
differences between these nebulae give scientists a better understanding about our interstellar
medium.
Emission nebulae are produced when a hot star excites the gas near it to produce an
emission spectrum. Emission nebulae have a signature pink color that is produced by the
blending of the red, blue, and ultra violet Balmer lines.
A reflection nebula is produced when starlight scatters from a dusty nebula. When this
happens, the absorption spectrum of the star is reflected. While gas is surrounding the star, it
does not get excited and emit photons.
8

Dark nebulae are dense clouds of gas and dust that obstruct our view of more distant
stars. Dark nebulae are responsible for holes and rifts along the interstellar medium.
ATOMIC PROCESSES IN THE PLANETARY NEBULAE
The Cat's Eye Nebula's images we studied were taken with two Sulfur II narrow-band
filters, 6717 and 6731. The singly ionized sulfur ion emits photons that are transmitted through
the filter. The photons that hit the filter were a result of several atomic processes in the nebula.
These atomic processes of importance to our study are ionization, collisional excitation, and
spontaneous deexcitation, which aid in the production of photons.
Inside the core of a white dwarf star, ultra-violent photons are created and emitted into
the surrounding nebular gases. These gases then become ionized during the first atomic process
ionization. Ionization occurs when atoms in the gases absorb energetic photons and an electron is
stripped away from the atom or ion.
There are free electrons moving around among the S+ ions inside the gases. When a free
electron hits an S+ ion, the free electron transfers some of its kinetic energy to the S+ ion. The S+
ion suddenly moves to a more energetic state. This is the second atomic process mentioned
above called collisional excitation. Collisional excitation occurs when a free electron collides
with an ion.
The third and final step is one in which the S+ ion spontaneously decays to the ground
state and a photon is released, spontaneous deexcitation has occurred. Spontaneous deexcitation
is the release of a photon from a S+ ion when a bound electron jumps to a lower energy state.
This photon then travels to the charged coupled device (CCD) chip landing on one or more of the
pixels.
DATA SET & ANALYSIS
Our images of NGC 6543 were taken with the 1.3 meter Robotically Controlled
9

Telescope at Kitt Peak National Observatory. The telescope took images of NGC 6543 with two
sulfur II filters, 6717 and 6731. The sulfur II 6717 had a central wavelength (CWL) of 671.6
nanometers and a full width half maximum (FWHM) of 0.9 nanometers meaning that photons
with wavelengths 0.45 nanometers above or below the central wavelength pass through the filter
but most other wavelengths are blocked. The sulfur II 6731 has a CWL of 672.9 nanometers and
a FWHM of 0.8 nanometers.
CCD camera on the telescope acquired our images. CCDs have revolutionized the way
astronomers and other researchers obtain images of celestial objects. CCDs are very effective,
however, they are prone to saturation, cosmic ray hits, bad pixels, et cetera. A properly calibrated
digital image has to have its noise sources minimized. Therefore, image processing is used to
transform the raw images of the “Cat's Eye” nebula into useful images using the Image
Reduction Analysis Facility (IRAF) software package, which is logged onto through an x-
terminal window in LINUX.
IRAF is a software package that uses commands to carry out astronomical image
processing. The processing of NGC 6543 data requires the use of many IRAF commands. These
commands aid in the tedious process that it takes to clean up the bias, flat, and object frames with
speed and accuracy. The commands we used are listed in the following table.
COMMAND FUNCTION chpixtype change the pixel type of a list of images
imarith simple image arithmetic
imcopy copy an image
imdelete delete a list of images
imheader print an image header
imhistogram compute and plot or print an image histogram
10
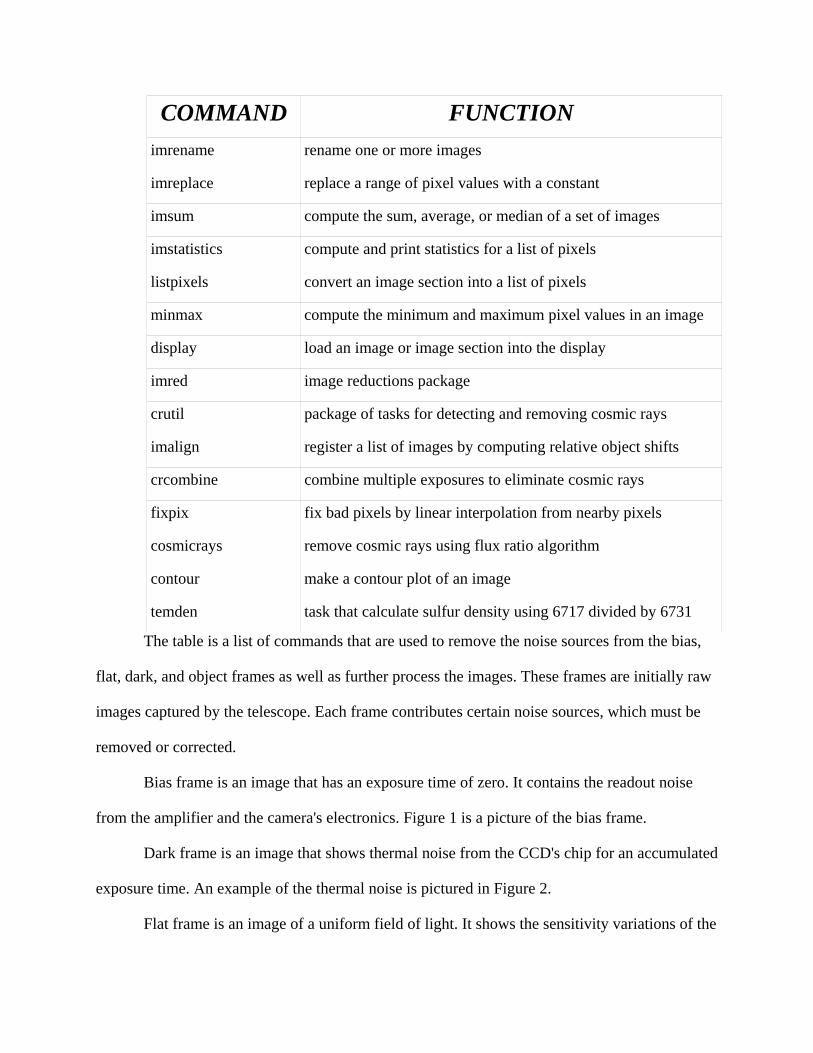
COMMAND FUNCTION imrename rename one or more images
imreplace replace a range of pixel values with a constant
imsum compute the sum, average, or median of a set of images
imstatistics compute and print statistics for a list of pixels
listpixels convert an image section into a list of pixels
minmax compute the minimum and maximum pixel values in an image
display load an image or image section into the display
imred image reductions package
crutil package of tasks for detecting and removing cosmic rays
imalign register a list of images by computing relative object shifts
crcombine combine multiple exposures to eliminate cosmic rays
fixpix fix bad pixels by linear interpolation from nearby pixels
cosmicrays remove cosmic rays using flux ratio algorithm
contour make a contour plot of an image
temden task that calculate sulfur density using 6717 divided by 6731
The table is a list of commands that are used to remove the noise sources from the bias,
flat, dark, and object frames as well as further process the images. These frames are initially raw
images captured by the telescope. Each frame contributes certain noise sources, which must be
removed or corrected.
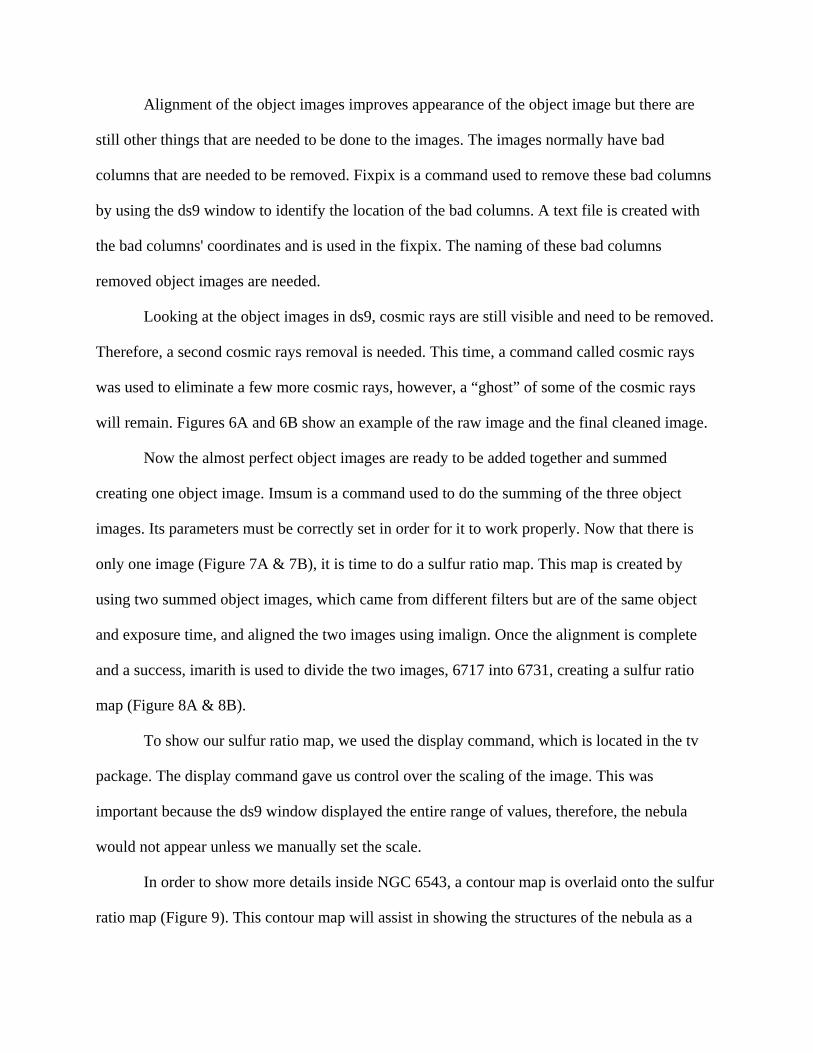
Bias frame is an image that has an exposure time of zero. It contains the readout noise
from the amplifier and the camera's electronics. Figure 1 is a picture of the bias frame.
Dark frame is an image that shows thermal noise from the CCD's chip for an accumulated
exposure time. An example of the thermal noise is pictured in Figure 2.
Flat frame is an image of a uniform field of light. It shows the sensitivity variations of the
11
pixels in the CCD as well as dust particles that sit on the CCD's cover as shown in Figure 3.
Figure 4 shows an image of the planetary nebula NGC 6543 and surrounding stars. This
is called the object frame and contains noise from the bias, dark, and flat frames.
The imaging process begins with the renaming of the original file names. This is
important because the imaging processes that will take place later will need a symbol or a letter
as representation of what was performed on the image at each step. Therefore as progression
occurs in the steps of image processing, each step will have an identifiable symbol or letter just
in case backtracking to a particular step is needed.
As each step is being performed, it is helpful to constantly look at the images in a ds9
window. DS9 is a window created by Smithsonian Astrophysical Observatory at Harvard that
allows images to be viewed in three viewing windows. There is one large window called the
main viewing window that allows an image to be displayed. In this window, the cursor can be
moved around by the mouse or manually with cursor keys and with each movement; the pixel
value (x, y) is shown. In the two smaller windows, one called the “pan” window shows an
outlined of the image and allows the user to quickly move the main viewing window around the
image. The third is the “zoom” window and it shows a high magnification of the area where the
cursor is positioned. DS9 aids in the viewing of the noise sources in an image and their location.
It has many button controls, like zoom, scale, color, et cetera that will assist in making the image
viewed as perfect as possible. In the ds9 window, multiple images can be seen at one time or
blinked making several images easily comparable.
One can use imstat and imhist to also compare image statistics for a single image or a
group of images. Imstat gives the statistics of an image such as minimum and maximum value,
mean, standard deviation, et cetera while imhist gives the histogram of the image. These two
commands are used constantly throughout the image processing.
12

There are important changes to the images that are needed to be made.
STEP PREFIX NAME
original image none 3182-obsG-1.fits
rename file none s17.1.fits
trim image t ts17.1.fits
bias subtract bs bsts17.1.fits
flat field ff ffbsts17.1.fits
allignment a affbsts17.1.fits
imsum none sum17.fits
ratio none ratio17_31.fits
One of the changes is converting all the images' pixel values to real from ushort. In order to
perform this task, chpixtype is used. Chpixtype has a way of changing all of the image's pixel
values at one time instead of performing this task individually. Nonetheless, it is important for
the pixel value to be real for the future use of the data. Another important change is trimming the
images. Each image has bias overscanned columns located on the edges of the images. Using
imcopy, the name of the image, and the x and y dimensions we want to remove, the images are
trimmed. The x and y dimensions of the image must be identical because the image should have
a shape of a square. Imhead is then used to show the dimensions of the image. The naming of the
image so it symbolizes that trimming has been done is recommended.
The next area of focus is to remove some of the cosmic rays and average the bias images.
These two steps can be performed at the same time using the command crcombine. Crcombine
will remove as many cosmic rays and average the three bias frames at once creating an average
bias frame with cosmic rays removed. In order for crcombine to perform this task its parameter
must be set properly. After the average bias is created, it will be used to remove the bias frames
from the trimmed flat and object frames. This step will be performed with the use of imarith.
13
Imarith is a command that allows an image or number to be added, subtracted, multiplied, or
divided by some image or number. The bias average will be subtracted from each trimmed flat
and object frames creating new bias subtracted flat and object frames. The naming of the images
to symbolize bias subtracted is important if needed to back track.
Crcombine will once again be used to average three frames. This time the three flat
frames with the same second exposure time will be averaged using the same parameter used in
the averaging of the three bias frames. An imstat will be done on the average flat frame in order
to get its mean value. Imarith will be used to divide the mean of the average flat into the average
flat image creating a normalized average flat. If these steps are done correctly, the mean of the
normalized average flat will be one. Now it is time to flat field the object frames. In order to
create these flat-fielded images for the objects, imarith is used to divide the normalized average
flat into each of the three object frames creating three flat-fielded object images. The naming of
the images to symbolize flat fielded is a wise decision.
Imalign is a command that takes several images that are alike, which means that they
have been taken with the same camera, exposure time, and of the same object, and align them so
that each location in space is at the same pixel position in all images, and would fit perfectly on
top of one another. The three object images will be aligned using the image coordinates of
several stars as reference points in one of the images to align the other two object images.
Imalign also trimmed the three images so that each object image has the same dimensions. DS9
window will be used to gather the image coordinate of the stars and later to make sure the three
object images are aligned. If the images are not aligned, they will not over lap properly thus
looking like Figure 5A. If they are aligned correctly, the resultant images will look like Figure
5B. Imhead will be used to display the three object images' dimensions. The naming of the
aligned images is very important so that they are kept separately from the unaligned images.
14
Alignment of the object images improves appearance of the object image but there are
still other things that are needed to be done to the images. The images normally have bad
columns that are needed to be removed. Fixpix is a command used to remove these bad columns
by using the ds9 window to identify the location of the bad columns. A text file is created with
the bad columns' coordinates and is used in the fixpix. The naming of these bad columns
removed object images are needed.
Looking at the object images in ds9, cosmic rays are still visible and need to be removed.
Therefore, a second cosmic rays removal is needed. This time, a command called cosmic rays
was used to eliminate a few more cosmic rays, however, a “ghost” of some of the cosmic rays
will remain. Figures 6A and 6B show an example of the raw image and the final cleaned image.
Now the almost perfect object images are ready to be added together and summed
creating one object image. Imsum is a command used to do the summing of the three object
images. Its parameters must be correctly set in order for it to work properly. Now that there is
only one image (Figure 7A & 7B), it is time to do a sulfur ratio map. This map is created by
using two summed object images, which came from different filters but are of the same object
and exposure time, and aligned the two images using imalign. Once the alignment is complete
and a success, imarith is used to divide the two images, 6717 into 6731, creating a sulfur ratio
map (Figure 8A & 8B).
To show our sulfur ratio map, we used the display command, which is located in the tv
package. The display command gave us control over the scaling of the image. This was
important because the ds9 window displayed the entire range of values, therefore, the nebula
would not appear unless we manually set the scale.
In order to show more details inside NGC 6543, a contour map is overlaid onto the sulfur
ratio map (Figure 9). This contour map will assist in showing the structures of the nebula as a
15

funtion to the different densities.
Using the pixel values inside the nebula from the ratio map, the density is calculated. The
command temden allows the pixel value to be entered and it outputs the density if its parameters
are correctly set to output the density.
Imreplace, an iraf command, is used to replace the pixel value with the density. A density
map (Figure 10) is created to show the number of electrons per cubic centimeters of a given
pixel. To see the steepness of the density areas, a contour map is placed on top of the density
map (Figure 11).
RESULTS & FUTURE WORK
We are planning on comparing our result to the previous research published in the
literature. Our results will then be ready to be compared to the modeling results of other.
Additionally, we will present these preliminary results at a future student research conference.
Figure 11 and 12 are preliminary density calibration images. There are four high density
regions in both figures. The large left lobe contains the highest concentration and has the steepest
gradient. The upper right lobe has a higher density and a steeper gradient than the lower right
lobe. The results in the center are not very accurate due to the prescence of a star. Therefore, the
concentration that you see in the center comes from both the central star and the gas surrounding
it. To make our results more accurate we would have to remove the values that come from the
star. The other parts of the nebula have low and nonuniform densities. If you refer to Figure 12,
you would observe that the gray areas are clumped in certain places, and that the distribution of
electrons is not uniform. The low density regions are either white or a light gray.
ACKNOWLEDGEMENTS
Special thanks go out to Dr. Donald Walter, Ms. Irene Scott, Mr. Joseph Bartolini, and
the other URIA faculty mentors. This work has been supported in part by NASA/MU-SPIN
16

(NNG04GD62G), NASA's Science Mission (NNG04GD62G) and NASA URC through a
subgrant from Tennessee State University (NCCW-0085).
17

References
“An Extended Cat's Eye” (December 2003). Sky & Telescope.
Beasley, D., Steve, R., & Watzke, M (2001). “Chandra Reveals the X-ray Glint in the Cat’s Eye.” http://chandra.harvard.edu/press/01_releases/press_010801.html
“Cat's Eye Nebula” Wikipedia. http://en.wikipedia.org/wiki/Cats_Eye_Nebula
Elowitz, Mark (1995). “The Cat’s Eye Nebula NGC 6543.” http://www.seds.org/hst/NGC6543.html
Frommert, H. & Kronberg, C (1998). “The Cat’s Eye Nebula.”
http://www.seds.org/messier/xtra/ngc/n6543.htmlKraljic, Frank (October 2003). “Outer Halos of Planetary Nebulae.” Sky & Telescope.
Kwok, Sun (October 1998). “Metamorphosis.” Sky & Telescope.
Kwok, Sun (July 2000). “What is the Real Shape of the Ring Nebulae?” Sky & Telescope.
Schilling, Govert (3 February 2004). “Making Planetary Nebulae.” http://skyandtelescope.com/printable/news/article_1172.asp
Schilling, Govert (March 2003). “What Shapes Planetary Nebulae?” Sky & Telescope.
Seeds, A. Michael “Stars and Galaxies” (2005). Interstellar Medium. pps 137-214 Seeds, A. Michael “Stars and Galaxies” (2005). Planetary Nebulae. pps 250-263 Sogi, Kim (2003). “The Cat’s Eye Nebula.”
http://www2.keck.hawaii.edu/realpublic/haumana/formal_activities/pages/astro.ngc6543.html
Sorensen, Peter. “Planetary Nebulae.”
file://C:\work\nasa\uria\uria2005\dkw.team\articles\PlanetaryNebulae.htm Strobel, Nick (2001). “Interstellar Medium and the Milky Way”
http://www.astronomynotes.com/ismnotes/s2.html Walter, Donald (2005). “Processes in the Interstellar Medium Handout” (private
communication).
18
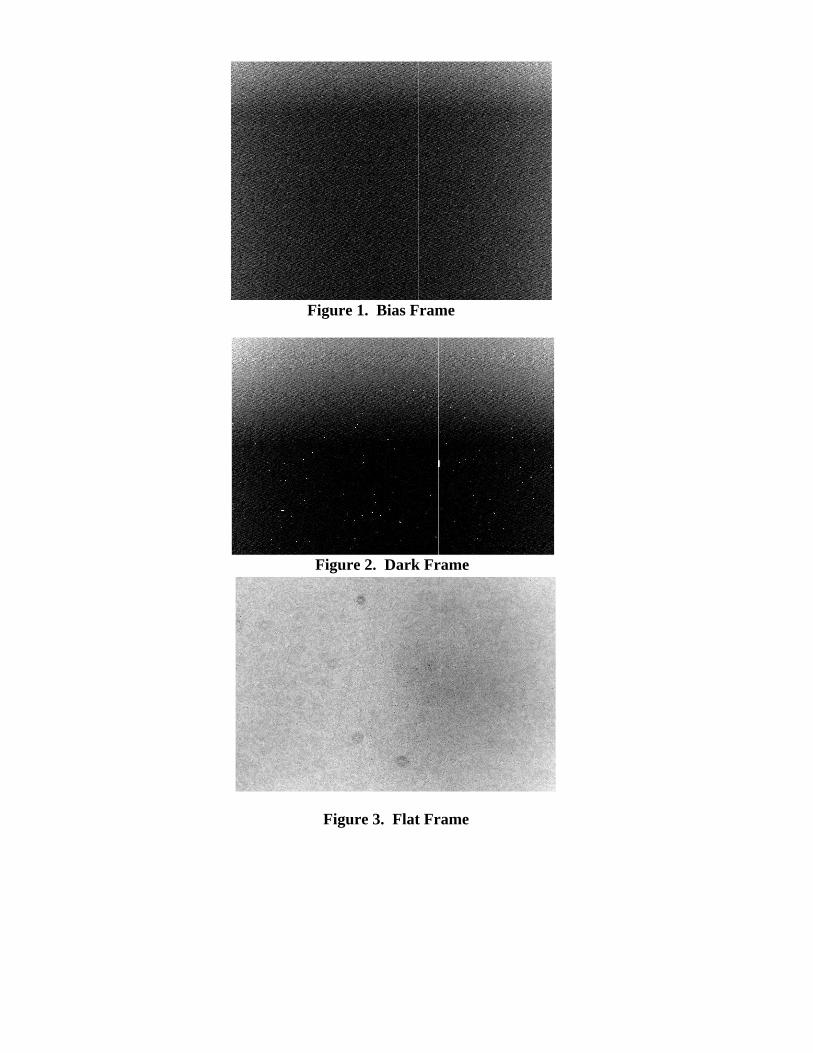
Figure 1. Bias Frame
Figure 2. Dark Frame
Figure 3. Flat Frame
19
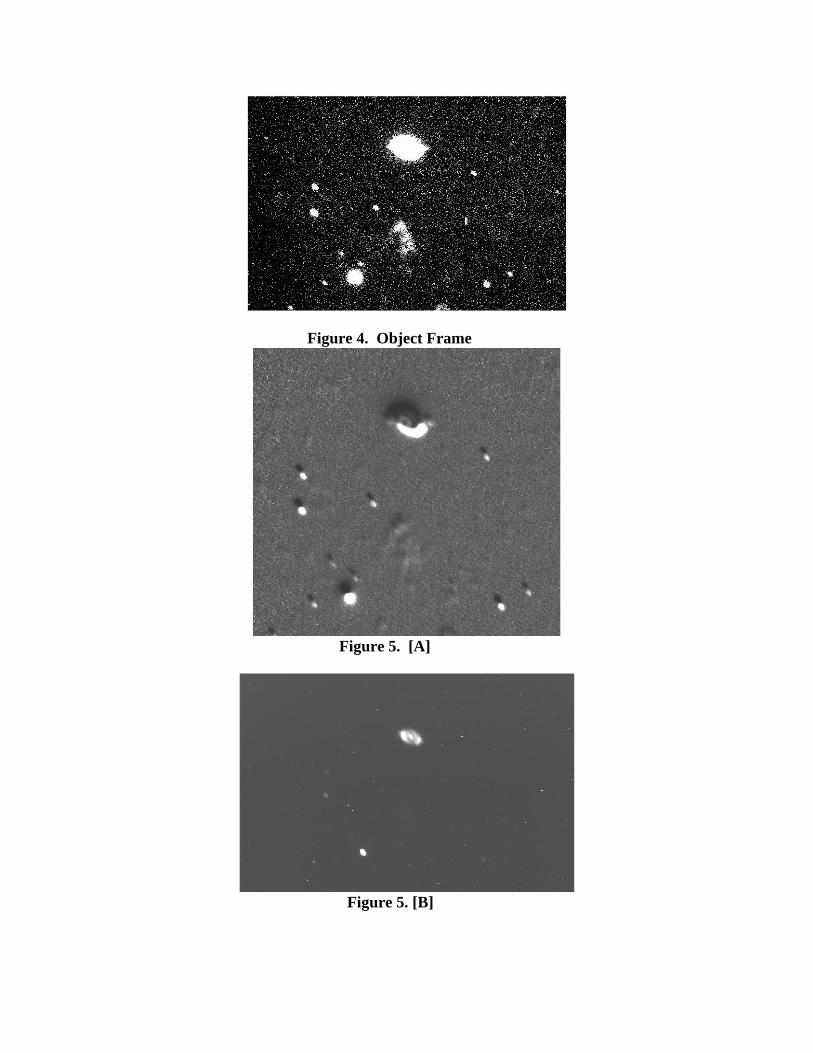
Figure 4. Object Frame
Figure 5. [A]
Figure 5. [B]
20

Figure 6. [A] before Figure 6. [B] after cosmic ray removal cosmic ray removal
Figure 7. [A] Sulphur 6717 Figure 8. [A] Sulphur 6731
Figure 7. [B] grey scale Figure 8. [B] grey scale
21

Figure 9. [A] ratio map of NGC 6543 color scale
Figure 9. [B] ratio map of NGC 6543
inverted grey scale
Figure 10. ratio map of NGC 6543 with contours
22

Figure 11. density map in color SCALE YELLOW- greater than 1500 electrons/cm3 ORANGE- 1300-1500 electrons/cm3 RED- 1150-1300 electrons/cm3 PINK- 900-1150 electrons/cm3 PURPLE- less than 900 electrons/cm3
Figure 12. density map of NGC 6543
SCALE
inverted grey scale with contours
2000 electrons/cm3
m
BLACK- greater than GREY- 600-2000 electrons/cm3
3 WHITE- less than 600 electrons/c
23

![Index [assets.cambridge.org]assets.cambridge.org/97811070/16569/index/9781107016569_index.pdfIndex Abell 41, planetary nebula, 17 Abell 63, planetary nebula, 17 Abdurashitov, J. N.,](https://static.fdocuments.net/doc/165x107/5e084650b47fcb33e20e9921/index-abell-41-planetary-nebula-17-abell-63-planetary-nebula-17-abdurashitov.jpg)