
Illuminated vs. Non-Illuminated Signage Economic Impact … · 3 Illuminated vs. Non-Illuminated...
31
Illuminated vs. Non-Illuminated Signage – Economic Impact of Illumination Charles R. Taylor, Villanova University Executive Summary Recent years have seen a trend toward some municipalities implementing restrictions on lighted on-premise signs. How does this impact businesses? To this end, this study reports the results of a nationally representative sample of on-premise sign users. Specifically, the study examined the degree to which businesses: 1) light their signs beyond normal business hours; 2) face lighting restrictions on on-premise signs; 3) believe lighted, on-premise signs help them perform key marketing functions; and 4) believe a lighted on-premise sign impacts their bottom line. A professional market research firm sent the survey to 750 on-premise sign users identified from industry customer lists. All received a $10 incentive. After a reminder mailing, 333 usable responses were obtained. After excluding undeliverable mail, the response rate was 47.4%. Analysis indicates responses came from businesses in a wide variety of types, sizes and longevity. The average respondent has 1.71 signs and lights their signs 13.9 hours per day, while the average hours of operation were just 10.8 hours. More than 80% of companies reported illuminating their sign after business hours, with 30% indicating they leave their sign on 24/7. Approximately one-fourth of the sample reported facing restrictions on lighted, on-premise signs. Most restrictions concerned the type of illuminated sign (24%), but some focused on brightness (8%) and the sign’s allowable hours of operation (3%). The on-premise sign users strongly report that lighted, on-premise signs effectively perform key marketing functions. Respondents overwhelmingly agree a lighted on-premise sign
Transcript of Illuminated vs. Non-Illuminated Signage Economic Impact … · 3 Illuminated vs. Non-Illuminated...

Illuminated vs. Non-Illuminated Signage – Economic Impact of Illumination
Charles R. Taylor, Villanova University
Executive Summary
Recent years have seen a trend toward some municipalities implementing restrictions on
lighted on-premise signs. How does this impact businesses? To this end, this study reports the
results of a nationally representative sample of on-premise sign users. Specifically, the study
examined the degree to which businesses: 1) light their signs beyond normal business hours; 2)
face lighting restrictions on on-premise signs; 3) believe lighted, on-premise signs help them
perform key marketing functions; and 4) believe a lighted on-premise sign impacts their bottom
line.
A professional market research firm sent the survey to 750 on-premise sign users
identified from industry customer lists. All received a $10 incentive. After a reminder mailing,
333 usable responses were obtained. After excluding undeliverable mail, the response rate was
47.4%. Analysis indicates responses came from businesses in a wide variety of types, sizes and
longevity.
The average respondent has 1.71 signs and lights their signs 13.9 hours per day, while the
average hours of operation were just 10.8 hours. More than 80% of companies reported
illuminating their sign after business hours, with 30% indicating they leave their sign on 24/7.
Approximately one-fourth of the sample reported facing restrictions on lighted, on-premise
signs. Most restrictions concerned the type of illuminated sign (24%), but some focused on
brightness (8%) and the sign’s allowable hours of operation (3%).
The on-premise sign users strongly report that lighted, on-premise signs effectively
perform key marketing functions. Respondents overwhelmingly agree a lighted on-premise sign

2
helps perform the following marketing functions (as measured on a 7-point Likert type scale with
7 = strongly agree):
- Reinforces advertising as part of integrated marketing communications (6.14)
- Brands the business’ location (6.14)
- Enhances store image (6.21)
- Helps communicate the business’ location (6.19)
Respondents also agree that restrictions on lighting on-premise signs inhibit their ability to
effectively perform these marketing functions. Respondents further report that keeping a sign
illuminated when a store/business is closed helps achieve marketing goals (6.22) and enhances
the overall look of the business community.
More than half of the respondents indicate they would lose sales if government
regulations prevent them from lighting their sign. This group estimates a 21% loss, while the
overall sample estimates an 11% average loss. Collectively, these results clearly document that
managers know lighting on-premise signs achieves important marketing functions. Regulators
should acknowledge these findings when considering lighting restrictions on on-premise signs.

3
Illuminated vs. Non-Illuminated Signage – Economic Impact of Illumination
Charles R. Taylor, Villanova University
Motivation for the Study and Research Questions:
Some municipalities have implemented restrictions on the illumination of on-premise
signage. Critics argue the lighting of on-premise signs is unnecessary, aesthetically displeasing,
and wastes energy (e.g., Dark Skies International 2014; Flagstaff Dark Skies 2014). In recent
years, some critics have blamed on-premise signs for light pollution, defined as “light that is
either too bright for its intended purpose” or “that shines where it is not needed or wanted”
(RASC 2003; c.f., Garvey 2005, p.8). While available evidence documents a strong majority of
on-premise signs do not meet photometric levels associated with light pollution (e.g., Garvey
2005), controversy still remains. As a result, many municipalities have been pressured to
implement stricter codes with respect to lighted signs, particularly newly installed signs. Below
are some examples:
- Pima County, AZ – mandates a shut-off time of 10 pm unless the business remains
open. If the business remains open after 10 pm, illumination must be turned off
between closing time and sunrise.
- Hilton Head, SC – bans all internally illuminated signs.
- Winston Salem, NC – mandates that illuminated signs shall be so shielded so as not to
cast direct light onto any residential district.
- Arlington County, VA – provides lighting standards for illumination of traditional
signage.
- Mendham Borough, NJ – prohibits neon signs.

4
The enactment of such restrictions has been growing in recent years, and, in many cases, their
impact will evolve gradually due to “grandfather clauses” that protect existing businesses from
new regulations. Thus, it is particularly important to study the impact of such regulations so that
communities can make informed decisions. Because businesses clearly use on-premise signs to
perform important marketing functions (Taylor, Claus, and Claus 2005; Taylor, Sarkees, and
Bang, 2011), it is particularly important to examine the degree to which illuminating on-premise
signs impacts on those businesses subject to such regulation.
Extant literature sites several aspects that contribute to on-premise signs’ general
effectiveness (Signage Sourcebook 2003). A sign’s ability to be read is a fundamental
prerequisite to success. More specifically, in addition to size and proper placement, two key
issues to a sign’s effectiveness are visual conspicuity and its level of visibility. Visibility refers
to the physical attributes of a sign that allow its detection at a given distance. Visual conspicuity
(hereafter, conspicuity) refers to the sign’s capacity to stand out or be distinguishable from its
surroundings, and thus be readily discovered by the eye (Taylor, Claus and Claus 2005).
Referring to signs in urban environment, Taylor, Claus and Claus (2005, p.8.2) state:
“One way to think of conspicuity, as opposed to visibility, legibility, or readability, is that
the term relates to a sign’s surroundings. A sign in isolation may meet all the criteria for
visibility (or detectability at some distance), legibility (letters and/or graphics can be
easily differentiated), and readability, (the legend in totality conveys a meaningful or
understandable message to the viewer). However, when that sign is placed in the urban

5
environment where it competes with other signs, utility poles, traffic control devices, bus
shelters, and right of way landscaping, it can become essentially invisible.”
A conspicuous sign stands out from its visual surroundings and has a high probability of being
noticed. If the sign does not stand out from its surroundings, it is much less likely to get noticed.
Clearly, lighting affects both the visibility and conspicuity of signage, particularly at
night or under bad weather conditions. As a result, the on-premise sign industry needs to adapt
to several illumination needs, including accurate color rendering, readability, energy efficiency,
cost, and local weather conditions (see Taylor, Claus and Claus 2005). Moreover, visibility and
conspicuity, as well as the sign’s readability, can be affected by lighting, in some instances, even
under relatively good daytime weather conditions.
Controversy over the need for lighted on-premise signs necessitates research on the
degree to which being allowed to light signs affects business. This research strives to document
how restrictions on lighted on-premise signs affect business. The specific research questions are:
1) How long do typical businesses illuminate their on-premise signs?
2) To what extent do businesses face restrictions on the lighting of on-premise signs?
3) To what extent do lighted, on-premise signs help perform key marketing functions, and to
what extent do restrictions on lighting on-premise signs inhibit them from performing
these marketing functions?
4) How do restrictions on lighting on-premise signs impact businesses’ bottom line?

6
The Marketing Functions of On-Premise Signs
Because the study examines whether lighting restrictions affect on-premise signs’ ability
to help businesses achieve goals, prior research should be examined as to previously established
marketing functions of signs, and the potential impact of lighting restrictions on signs’ ability to
perform these functions, and on sales.
As outlined by Taylor, Claus, and Claus (2005), on-premise signs perform four key
marketing functions.
1) Communicating the business’ location;
2) Reinforcing advertisements and other promotional techniques as part of integrated
marketing communications;
3) Branding the site; and
4) Enhancing the image of the store or business. Below, each of these functions, and the
possible impact of limits on lighting, are discussed.
Communicating the location of the business
A business’ on-premise sign normally plays a critical role in identifying the business’
located. The sign plays a key role both in wayfinding and in “getting the word out” that the
business exists at a particular location. For some businesses, especially those that rely on
impulse purchases, or serve immediate needs, the sign may often directly lead to a customer
purchases. According to the U.S. Small Business Administration (2003), impulse stops account
for 15% to 45% of sales, depending on the type of business. Clearly, sign visibility and
conspicuity closely relate to the ability to know where the store is (Berman and Evans 2007;
Dunne and Lusch 2007). Thus, restrictions on illumination, especially during evening hours or
poor weather conditions, would harm signage’s identification function.

7
Reinforcing advertisements and other marketing variables as part of integrated marketing
communications (IMC).
Marketers must carefully communicate a consistent message to consumers because
consumer perceptions of a company or brand are a synthesis of messages received from the
company, as well as every point of contact with the business (Belch and Belch 2004; Chaterjee
2011; Kerr et al., 2008; Taylor 2010). Inconsistent or incongruent messaging can confuse the
consumer and harm brand equity (Duncan 2005; Garretson and Burton 2005; Goodstein 1993).
Exposure to on-premise signage must be considered part of IMC. If lighting restrictions prevent
a business from communicating and displaying its message, such as an identifiable logo or
character (e.g., Target, Wendy’s), consumers may be confused, and damage to the brand may
result (Garretson and Burton 2005).
Branding the site.
The on-premise sign uniquely and critically brings branding to the business’ physical site
(Taylor, Claus and Claus 2005). Trade dress, including trademarks, can help enhance recall of
the business and build positive associations with the brand (Kopp and Langenderfer 2014).
Exposure to trade dress via the on-premise sign, even during non-business hours, can be
important in shaping brand image. Moreover, reinforcing the brand at the point of purchase, for
retail and service businesses, is fundamental to maximizing brand equity (Taylor, Claus and
Claus 2005).
A key point is, the on-premise sign can help to brand the site even when the store is
closed. (Ray: what about adding this here? Even though a business may be closed, the
illuminated sign can create top-of-mind awareness, which means the consumer may not need the
8
product or service at that time, but they’ll remember the location for a subsequent time when
they might.) Thus, at night, an illuminated sign can still provide value to the business via the
exposures it provides to consumers. Obviously, a sign that is not visible or cannot be read
cannot help brand the site.
Enhancing the image of the store or business.
Retailing professionals have long agreed that brick-and-mortar stores must create and
reinforce a positive store image to ensure success (Golden, Albaum and Zimmer 1987; Pessemier
1980). Signage is important to crafting a store image because it not only attracts attention, it also
can communicate the store’s image and atmosphere (Berman and Evans 2007). For example,
some stores seek prestige via expensive signage, coupled with an elegant storefront. Recently,
Old Navy returned to its original logo in order to be consistent with the family-oriented
environment inside its stores (Old Navy 2013). The on-premise sign should consistently
demonstrate the store’s image. Universally, retail stores and service businesses must project a
clear, distinctive image to consumers to be successful. Lighting the on-premise sign allows this
image to be communicated at all hours.
Sales Impact of On-Premise Signs.
Many academic and practitioner studies from various perspectives (for the most part,
legal) suggest businesses would lose sales if on-premise signs were altered, restricted or removed
(e.g., Claus, Claus, and Claus 2001; The Economic Value of On-Premise Signs 1997).
Additionally, a recent academic study by Taylor, Sarkees and Bang (2012) found that 85% of a
representative U.S. sample of on-premise sign users would lose sales if they did not have an on-

9
premise sign. Additionally, the average reported loss of sales across the entire sample was
34.5%.
The on-premise-sign debate includes arguments that, without adequate signage,
customers will not know a business’ location, or enter the store, and thus sales will suffer.
Related marketing studies support this theory. An on-premise sign, as a “feature” notification
method, may drive customer foot traffic and sales (e.g., Lohse 1997; Zhang, Wedel, and Pieters
2009). This suggests a business could lose first-time customers and potentially longer-term
revenue without an on-premise sign. Additionally, limiting the on-premise sign’s ability to
perform marketing functions hinders longer-term consumer perceptions, such as branding the
site, enhancing image, and reinforcing other marketing communications. Similarly, limits on
lighting would harm the sign’s ability to perform all of these functions and, hence, these
restrictions would negatively impact sales.
Most sign users believe sign illumination plays an important role. Illuminated signage
and technologies, such as neon lighting, have directly helped many businesses enhance their
image. Stores can ensure that signs look the same during the day or night, or they can use the
sign to produce a different (perhaps more exciting or exotic look) at night, depending on business
objectives. Clearly, illumination helps brand the site and communicates the company’s message,
whether or not the business is open. Consumers may remember the business’ location and
image, even when the business is closed, and come back later. Lighting can especially make the
sign stand out from the environment. This also enhances the sign’s ability to perform marketing
functions, and give the business a competitive advantage.
10
Methodology
The survey and sampling plan were developed and designed by Dr. Charles R. Taylor of
Villanova University. Mailing and data entry were carried out by ICR/SSRS of Media, PA, a
large, independent, and well-respected marketing research firm via a mail methodology. An
initial mailing, sent via first-class mail using envelopes with a Villanova University return
address, included:
An 11 x 17 booklet that contained a one-page cover letter, personalized and customized
with the sample provider’s name and company, and a three- page questionnaire
A business-reply envelope addressed to SSRS (response went directly to SSRS) (Ray:
What’s SSRS?)
$10 as an incentive to return the completed survey
The cover letter and survey are attached to this report as Appendix 1.
The sample was drawn from the customer lists of two national companies, Signtronix
(1,016 records) and Federal Health (37 records) provided by The Signage Foundation.
After eliminating duplicates, 750 records were selected -- 713 randomly selected from the
Signtronix list and all 37 from Federal Heath. The national coverage of these companies ensures
the sample’s national representation of on-premise sign users.
Next, 525 reminder postcards were sent approximately three weeks after the initial
mailing to all survey non-responders (see Appendix 2). Surveys returned as “undeliverable”
were also excluded from this reminder mailing. Additionally, Tom Johnson, president of
Signtronix, emailed those on the Signtronix list and asked for their participation.

11
Field Dates:
Initial mailing to 750 – November 12-14, 2013
Reminder postcard mailing to 525 – December 4, 2013
Final cut-off date for returns – February 1, 2014
Final Returns Count:
Undeliverables – 48
Returned blank – 8
Completed returns – 325
Response Rate: 333 / (750-48) = 333/702 = 47.4%
The response rate, as calculated above, follows standard practice for marketing
research in that undeliverable mail is subtracted from the total number of surveys sent out in the
numerator, while only completed surveys are included in the denominator. Because of the high
response rate, additional statistical analyses of non-respondents were deemed unnecessary as it is
unlikely non-response bias would impact the results. Also, 35 of the non-responses were
returned due to “no mail receptable,” which possibly indicates the business receives its mail at a
P.O. Box independent of the store address.
Results
Profile of Respondents and Their Signage Use
The respondents represent companies of myriad durations (see Table 1). As shown in
Table 2, most are small businesses. Table 3 shows a wide variety of types of businesses were
included.

12
Table 1 – Number of Years in Business
Category Percentage of Sample
Less than 1 year 10%
2 – 5 years 23%
6 – 10 years 13%
11 – 25 years 19%
26 – 50 years 24%
More than 50 years 8%
Table 2 – Number of Employees
Category Percentage of Sample
10 or fewer 73%
11 - 25 13%
26 - 50 3%
51 - 100 1%
101 - 250 1%
Over 250 6%
Seventy-three percent of the businesses had 10 or fewer employees, and 86% of the
sample had 25 or fewer employees. This reflects that a large majority of U.S. businesses are
small business (Private Firms, Establishments, Employment, Annual Payroll and Receipts by
Firm Size, 1988-2006, 2007; The Small Business Economy: A Report to the President 2009).

13
Table 3 – Type of Business
Type of Business Percentage of Sample
Restaurant (table or fast food) 18.9%
Retail (general/grocery/apparel) 17.9%
Insurance 14.2%
Automotive or Auto Repair 14.2%
Consumer Services 8.0%
Non-profit 4.2%
Hotel/Motel 2.6%
Business Services 2.2%
Gas station/ Mini-Mart 1.6%
Entertainment 1.3%
Consulting 1.3%
Real Estate 1.0%
Other 8.9%
With respect to Research Question 1, respondents report having an average of 1.71
illuminated, on-premise signs at their place of business. The mean number of hours the business
is open per day is 10.8 hours. The average number of hours per day the sign is illuminated is
13.9 hours, more than three hours longer.
A large majority of the businesses (81%) report keeping the sign illuminated after
business hours, and 30% of the companies report leaving their sign on all the time. Sixty percent

14
indicate they turn their illuminated sign on during the day. An overwhelming proportion (91%)
report they have images, such as a logo, drawing, or other artwork, on their lighted on-premise
sign.
Prevalence of Restrictions on Illuminated Signs
With respect to Research Question 2, just 3% of respondents reported restrictions on
hours of illumination, while 8% indicated they faced restrictions on allowable brightness level.
A somewhat larger proportion (24%) reported restrictions on the type of illuminated sign
permitted. Overall, approximately three-quarters of these sign owners reported no local
restrictions in terms of hours, brightness and sign type. However, these results suggest more
businesses are facing some type of restriction than previously.
Table 4 – Percentage of Businesses Facing Lighting Restrictions
Regulations on: Percentage of Sample
Hours of operation 3%
Brightness of sign 8%
Type of illuminated sign 24%
Open-ended Response Pertaining to Illumination
Question 11 on the survey asked respondents, “If you have ever encountered a situation
in which you were forced to limit illumination of your on-premise sign, please describe the
reason for the limitation and the impact it had on your business (Please be as specific as
possible).” Among respondents, 14 (44%) referenced limitations on sign brightness or
flashing/scrolling messages; three responses referred to complete bans on illumination (9%); 3
more concerned time restrictions (9%), and two involved height/size restrictions (6%). Other

15
comments fell into the miscellaneous category. Appendix 3 shows some representative
comments. Overall, these findings reinforce that restrictions on brightness, and the degree to
which signs deliver scrolling and/or flashing messages, have become a significant issue.
Functions of Lighted On-Premise Signs
Research Question 3 asked whether restrictions on lighting on-premise signs inhibit them
from performing their marketing functions. Results clearly indicate businesses believe lighted
on-premise signs play these roles. Respondents overwhelming agreed that a lighted, on-premise
sign helps perform the following marketing functions (as measured on a 7-point Likert type scale
with 7 = strongly agree):
- Helps business to attract customers (5.99),
- Reinforces advertising as part of integrated marketing communications (5.90),
- Brands the location (6.27),
- Enhances store image (6.27), and
- Helps communicate the business’ location (6.17).
Respondents expressed strong agreement when asked specifically about the importance
of an on-premise sign illuminated during night hours. Mean scores were:
- 6.19 for “Communicates the location of the business”;
- 6.06 for “Reinforces advertising and other marketing communication”;
- 6.14 for “Brands the site”; and,
- 6.21 for “Enhances store image.”
Most respondents also agree an illuminated sign lit when the store is closed helps achieve
marketing goals (6.22), and enhances the overall look of the business community (5.75/7.0).

16
Collectively, these results indicate lighted on-premise signs make important contributions to
firms successfully marketing their products.
Impact on the Bottom Line
Results indicate that lighted on-premise signs substantially impact the bottom line of
many businesses. A sizeable majority of respondents (58%) indicated they would lose sales if
government regulations prevented signs from being lit at any hour. For those who reported a
sales loss, the average estimate was 21%. For the overall sample, including those businesses not
reporting a loss, the average estimated loss of sales exceeded 10%. Similar to the results for
sales, 58% of businesses reported they would lose customers, given such a restriction, with a
decline of 18% for those indicating a loss and a 9.4% decline for the overall sample.
Respondents largely agreed their lighted, on-premise sign creates a competitive advantage
(5.37/7.0).
Overall, these results strongly indicate that lighting on-premise signs affects the bottom
line of many businesses. For those businesses who would expect a loss, the average loss of more
than 20% could be the difference in being profitable.
Analyses Based on Geographic Region
Each response was coded into one of the nine geographic regions shown in Table 5. For
purposes of analysis, these categories were collapsed into the four sub-categories, also shown in
Table 5. The breakdown of respondents by region is shown as Table 6.

17
Table 5 – Geographic Regions
1) Northeast - New England (Maine, Vermont, New Hampshire, Rhode Island, Connecticut,
Massachusetts, and Mid-Atlantic (New York, New Jersey, Pennsylvania, Delaware, Maryland,
West Virginia, Maryland, Virginia)
2) North Central - East North Central (Ohio, Indiana, Wisconsin, Michigan and Illinois) and
West North Central (Minnesota, Iowa, Missouri, Kansas, Nebraska, South Dakota, North
Dakota)
3) South - South Atlantic (North Carolina, South Carolina, Georgia, Florida), East South Central
(Kentucky, Tennessee, Alabama, Mississippi) and West South Central (Texas, Oklahoma,
Arkansas, Louisiana)
4) West - Mountain (Montana, Idaho, Colorado, Wyoming, New Mexico, Arizona, Utah,
Nevada) and Pacific (Washington, Oregon, California, Hawaii, Alaska)
Table 6 – Responses by Region
Region Number Percentage of Sample
Northeast 59 19%
North Central 83 27%
South 134 44%
West 32 10%
The average number of illuminated signs by region, for those respondents who reported
having an illuminated sign, is reported in Table 7. As can be seen, any difference are negligible.
A similar analysis showed relatively small differences in the number of hours signs are
illuminated, although sign operators in the South did report somewhat shorter hours of operation
(see Table 8).

18
This difference was statistically significant at .05 for South vs. Northeast and South vs. North
Central. However, none of the differences in the number of hours the business is open were
statistically significant at .05. Again, these findings support the notion that most businesses
across the county believe it is important to have a sign illuminated beyond normal business
hours.
Table 7 – Average Number of Illuminated Signs by Region
Region Average Number of Illuminated Signs
Northeast 1.64
North Central 1.86
South 1.81
West : 1.66
Table 8 – Average Number of Illuminated Signs by Region
Hours Open Hours Illuminated
Northeast 11.19 14.41
North Central 11.94 14.36
South 9.92 13.62
West : 10.65 13.22
Analysis of restrictions on hours (Q4) and sign brightness (Q5) were uniformly low
across geographic regions. However, as shown in Table 9, the Northeast region is most prone to

19
have restrictions on the type of illuminated sign (Q6) that is allowable, followed by the West,
North Central and Southern regions.
Table 9 – Restrictions on Type of Illuminated Sign Allowable
Region Percentage Reporting Restrictions
Northeast 31%
North Central 23%
South 20%
West 25%
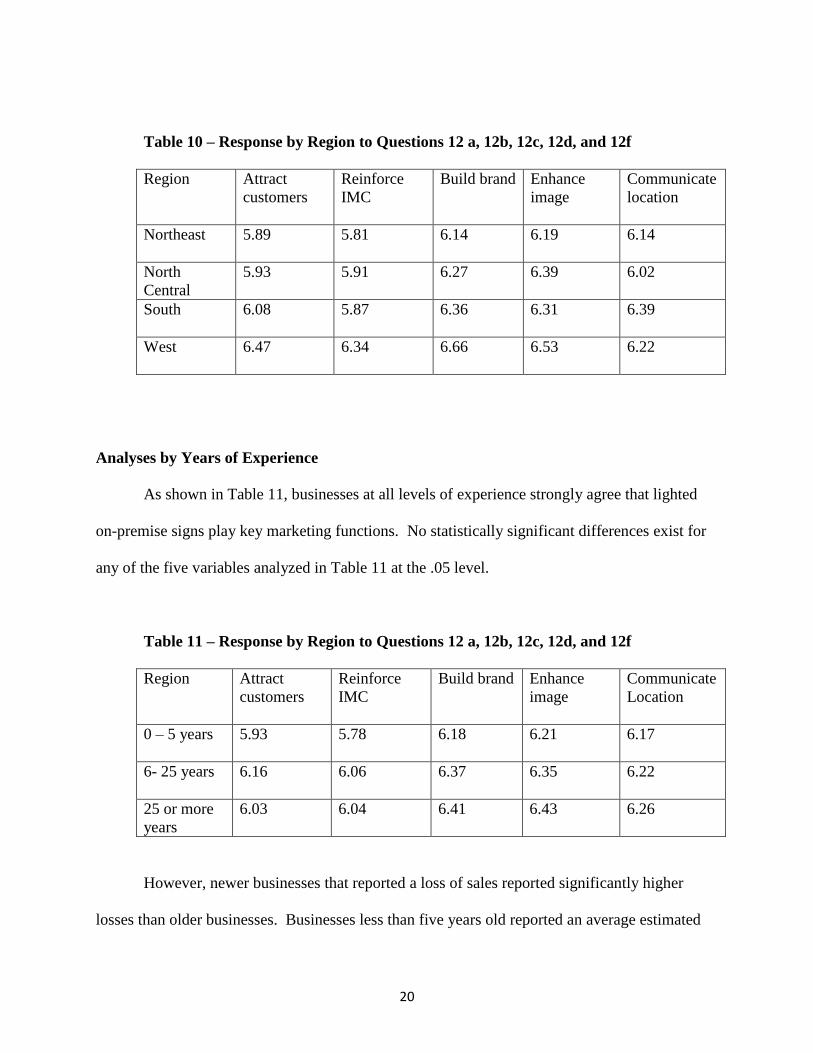
In general, additional analyses, of whether attitudes differ about the importance of on-
premise signs by geographic region, did not yield significant results. As illustrated by Table 10,
respondents across all regions showed strong agreement with the questions pertaining to
marketing functions of signage, including helping them to obtain customers (Q12a), reinforcing
integrated marketing communications (Q12b), branding the site (Q12c), enhancing store image
(Q12d), and communicating location of the business (Q12f). Results were also uniform across
regions for the degree to which illuminated signage helps businesses achieve various goals
during night hours, and the degree to which lost sales in response to a ban on lighted on-premise
signs was reported. Clearly, respondents across all geographic regions understand the value of
illuminated on-premise signs.
20
Table 10 – Response by Region to Questions 12 a, 12b, 12c, 12d, and 12f
Region Attract
customers
Reinforce
IMC
Build brand Enhance
image
Communicate
location
Northeast 5.89 5.81 6.14 6.19 6.14
North
Central
5.93 5.91 6.27 6.39 6.02
South 6.08 5.87 6.36 6.31 6.39
West 6.47 6.34 6.66 6.53 6.22
Analyses by Years of Experience
As shown in Table 11, businesses at all levels of experience strongly agree that lighted
on-premise signs play key marketing functions. No statistically significant differences exist for
any of the five variables analyzed in Table 11 at the .05 level.
Table 11 – Response by Region to Questions 12 a, 12b, 12c, 12d, and 12f
Region Attract
customers
Reinforce
IMC
Build brand Enhance
image
Communicate
Location
0 – 5 years 5.93 5.78 6.18 6.21 6.17
6- 25 years 6.16 6.06 6.37 6.35 6.22
25 or more
years
6.03 6.04 6.41 6.43 6.26
However, newer businesses that reported a loss of sales reported significantly higher
losses than older businesses. Businesses less than five years old reported an average estimated

21
loss of 26.6% with no illuminated sign, compared to 20.4% for those in business 6-25 years, and
16.6% for businesses older than 25 years.
Analyses by Size of Business
Similar to years of experience, no statistically significant differences were found for
questions related to the marketing functions of signs (Questions 12 a, b, c, d, f). however,
businesses with 10 or fewer employees reported an average estimated loss of 22.2%, while those
with 11 or more employees reported an average loss of 17.9%. These results indicate lighted,
on-premise signs are more important to the smallest businesses.
Conclusion
This study clearly shows businesses understand the value of lighting of on-premise signs.
Moreover, the results demonstrate that lighted, on-premise signs help large numbers of
businesses perform marketing functions effectively. Regardless of geographic region, size of
business, and number of years in business, businesses of all types believe lighted on-premise
signs play important marketing functions. Moreover, the businesses report illumination of signs,
on average, is very important to their bottom line. This impact is even more pronounced for
smaller and younger businesses. For many businesses, a lighted on-premise sign may be a
“make or break” factor affecting profitability.

22
References
Belch George E. and Michael A. Belch (2007), Introduction to Advertising and Promotion (7th
ed.), New York: McGraw Hill.
Berman, Barry and Joel Evans (2007), Retail Management. 10th
ed. New York: MacMillan.
Duncan, Thomas R. (2005), IMC in Industry: More Talk than Walk,” Journal of Advertising, 34
(4), 5-6.
Dunne, Patrick and Robert F. Lusch (1993), Retailing. 6th
ed. Cincinnati: Southwestern
Publishing.
Flagstaff Dark Skies (2014), “Light Pollution: The Problem,”
http://www.flagstaffdarkskies.org/dark-sky-solutions/dark-sky-solutions-2/light-pollution-the-
problem/ (accessed June 1, 2014).
Garvey, Philip (2005), “On-Premise Commercial Sign Lighting and Light Pollution,” Leukos, 1
(3), 7-18.
Golden, Linda L., Gerald Albaum, and Mary Zimmer (1987), “The Numerical Comparative
Scale: An Economical Format for Retail Image Measurement,” Journal of Retailing, 64
(Winter), 404.
Goodstein, Ronald (1993), “Category-Based Applications and Extensions in Advertising:
Motivating More Extensive Ad Processing,” Journal of Consumer Research, 20 (June), 87-99.
International Dark-Sky Association (2014) “Outdoor Lighting,”
http://www.darksky.org/component/content/article?id=51, (accessed: June 1, 2014).
Kerr, Gayle, Don Schultz, Charles H. Patti, and Ilchul Kim (2008), “An Inside-out Approach to
Integrated Marketing Communication: An International Analysis,” International Journal of
Advertising, 27(4), 511-548.
Kopp, Steve W. and Jeff Langenderfer (2014), Protecting Appearance and Atmospherics: Trade
Dress as a Component of Retail Strategy, Journal of Public Policy and Marketing, forthcoming.
Kitchen, Philip J., Joanne Brignell and Li Tao (1999),”The Emergence of IMC: A Theoretical
Perspective,” 44 (1), 19-30.
Lohse, Gerald L. (1997), “Consumer Eye Movement Patterns on Yellow Pages Advertising,”
Journal of Advertising, 26 (1), 61-73.

23
McArthur, David N. and Tom Griffin (1997), “A Marketing Management View of Integrated
Marketing Communications,” Journal of Advertising Research, 37 (5), 169-188.
Old Navy (2005), http://en.wikipedia.org/wiki/Old_Navy. (accessed August 27, 2013).
Pessemeir, Edgar (1980), “Store Image and Positioning,” Journal of Retailing, 56 (Spring), 96-
97.
Private Firms, Establishments, Employment, Annual Payroll and Receipts by Firm Size, 1988-
2006 (2007), Washington, DC: Office of Advocacy of U.S. Small Business Association.
(RASC) Royal Astronomical Society of Canada (2003), Light Pollution Abatement Site.
Calgary: Royal Astronomical Society of Canada. http://ww.rasc.ca/light/home.html
Schultz, Donald E. and Philip J. Kitchen (1997), “Integrated Marketing Communications in U.S.
Advertising Agencies, Journal of Advertising Research, 39 (1), 21-38.
Signage Sourcebook: A Signage Handbook (2003), Washington, DC: U.S. Small Business
Administration.
Taylor, Charles R. (2010), “IMC in 2010 and Beyond,” International Journal of Advertising, 29
(2), 161-164.
Taylor, Charles R., Susan Claus and Thomas Claus (2005), On-Premise Signs as Storefront
Marketing Devices and Systems. Washington DC: U.S. Small Business Administration.
Taylor, Charles R., Matthew Sarkees and Hae-Kyong Bang (2012), "Understanding the Value of
On-Premise Signs as Marketing Devices to Businesses for Legal and Public Policy Purposes,”
Journal of Public Policy and Marketing, 31 (2), 185-194.
The Small Business Economy: A Report to the President (December 2009), Washington, DC:
Office of Advocacy of the U.S. Small Business Administration.
Zhang, Jie, Michel Wedel, and Rik Pieters (2009), “Sales Effects of Attention to Feature
`

On-Premise Signs
I. The following questions relate to your company’s use of on-premise signs. Please fill in the number which you believe is most appropriate.
1. How many illuminated on-premise signs are at your place of business? _________# Signs (11-12)
2. How many hours per day is your business open? ________________ # Hours Open (13-14)
3. How many hours per day is your sign(s) illuminated? _____________ # Hours Illuminated (15-16)
4. Does your business face restrictions on the hours that you can illuminate your on-premise sign? (17) 1 Yes 2 No
5. Does your business face restrictions on the brightness of your illuminated on-premise sign?(18) 1 Yes 2 No
6. Does your business face restrictions on what kind of illuminated sign you are allowed to use? (19) 1 Yes 2 No
7. Do you keep your illuminated sign on after business hours?(20) 1 Yes 2 No
If not, why not? (Please check all that apply) (21)
a) Not allowed by local government 1
b) Don’t see need to keep it on after close 2
c) Want to keep utility bills down 3
8. Do you turn on your illuminated sign during daytime hours (i.e., during bad weather)?(22) 1 Yes 2 No
9. Do you have images on your illuminated sign (e.g., logo, drawing or other visual artwork)?(23) 1 Yes 2 No
10. Do you communicate messages to your customers via your illuminated sign (e.g., scroll or flashing weekly sales or other information)?(24) 1 Yes 2 No
11. If you have ever encountered a situation in which you were forced to limit illumination of your on-premise sign, please describe the reason for the limitation and the impact it had on your business. (Please be as specific as possible)
Please check here if you have not encountered this situation (25) 1
____________________________________________________________________________________________________________
____________________________________________________________________________________________________________
____________________________________________________________________________________________________________
____________________________________________________________________________________________________________
____________________________________________________________________________________________________________
____________________________________________________________________________________________________________

25
____________________________________________________________________________________________________________

II. These questions relate to the functions performed by lighted, on-premise signs.
12. Please circle the number that most accurately reflects your agreement with each item below.
Strongly Disagree
(26-41) Strongly Agree
a. Our lighted on-premise signs help us to attract customers by communicating the location of our business.
1 2 3 4 5 6 7
b. Our lighted on-premise sign reinforces our advertising and/or other communications we have with our customers.
1 2 3 4 5 6 7
c. Our lighted on-premise signs help us to brand our site (gives our business an identity with customers).
1 2 3 4 5 6 7
d. Our lighted on-premise sign helps to enhance the image of our business.
1 2 3 4 5 6 7
e. Having our on-premise sign lit when the store is closed helps us achieve our marketing objectives.
1 2 3 4 5 6 7
f. Having our on-premise sign lit helps consumers know the location of our business.
1 2 3 4 5 6 7
g. Our lighted, on-premise sign is the primary way we attract new customers.
1 2 3 4 5 6 7
h. Without a lighted, on-premise sign we would likely go out of business
1 2 3 4 5 6 7
i. Our competitors utilize on-premise, lighted signs.
1 2 3 4 5 6 7
j. Our lighted, on-premise sign creates a bond with our customers.
1 2 3 4 5 6 7
k. Our lighted, on-premise sign enhances the overall look of the local business community.
1 2 3 4 5 6 7
l. Our lighted, on-premise sign creates a competitive advantage.
1 2 3 4 5 6 7
m. Our lighted, on-premise sign is a source of pride.
1 2 3 4 5 6 7
n. Our lighted, on-premise sign makes our customers feel more safe.
1 2 3 4 5 6 7
o. I would be willing to pay more for a lighted, on-premise sign.
1 2 3 4 5 6 7
p. If it was permissible, my lighted, on-premise sign would be larger.
1 2 3 4 5 6 7
13. Please indicate the extent to which you believe that having an on-premise sign that is illuminated (versus not illuminated) helps companies achieve the following goals during night hours.
Strongly Disagree
(42-45) Strongly Agree
a. Communicates the location of the business. 1 2 3 4 5 6 7
b. Reinforces advertising and other marketing communications.
1 2 3 4 5 6 7
c. Brands the site. 1 2 3 4 5 6 7
d. Enhances store or business image. 1 2 3 4 5 6 7
III. The following questions ask about the regulation of your lighted, on-premise signs.
14. If government regulations prevented you from lighting your sign at any hour, what impact, if any, would that have on your company? (Please check one answer for each outcome and provide estimated percentage, if applicable.)
Outcome
a. Sales Decline _______% 1 No Change Increase _______% (46-52)
b. Number of Employees Decline _______% 1 No Change Increase _______% (53-59)
c. Number of Customers Decline _______% 1 No Change Increase _______% (60-66)
d. Open Business Hours Decline _______% 1 No Change Increase _______% (67-73)

27
15. Please circle the number that most accurately reflects your agreement with limiting the use of lighted, on-premise signs.
Strongly Disagree
(11-16) Strongly Agree
a. Limits during business hours hurt my business.
1 2 3 4 5 6 7
b. Limits during non-business hours hurt my business.
1 2 3 4 5 6 7
c. Limits hurt our local business community. 1 2 3 4 5 6 7
d. Limits hurt customer choice. 1 2 3 4 5 6 7
e. Limits increase local crime. 1 2 3 4 5 6 7
f. Limits will result in me closing my location. 1 2 3 4 5 6 7
IV. Please answer the following questions about your company.
16. The following questions refer to the intensity of competition in your business industry. Please circle the number that most accurately reflects your agreement with each item.
Strongly Disagree
(17-20) Strongly Agree
a. There are many “promotion wars” in our industry.
1 2 3 4 5 6 7
b. Any offer that one competitor makes to customers in the market, other organizations can readily match.
1 2 3 4 5 6 7
c. Price competition is a cornerstone of our industry.
1 2 3 4 5 6 7
d. Our competitors are constantly trying to gain advantages.
1 2 3 4 5 6 7
17. How many years has your company been in business?
1 1 or less 2 2 - 5 3 6 - 10 4 11 - 25 5 26 - 50 6 More than 50 (21)
18. How many employees work for your company? (Note: if your business is a franchise, please indicate the number of employees who work for your franchise, as opposed to the parent company).
1 10 or less 2 11 - 25 3 26 - 50 4 51 - 100 5 101 - 250 6 Over 250 (22)
19. Please check the one category that best describes your business: (23) (24) (25) (26) (27)
1 Auto Dealership 1 Auto Repair 1 Banking 1 Consulting 1 Entertainment
2 Hair/Barber 2 Hotel/Motel 2 Insurance 2 Manufacturing 2 Non-Profit
3 Repair Service 3 Retail(Apparel) 3 Retail(Grocery) 3 Retail (Other) 3 Real Estate
4 Gas Station or Mini-Market
4 Government Services
4 Restaurant (Fast Food)
4 Restaurant (Table Service)
4 Sports/Training Center
5 Service (Business)
5 Services (Consumer)
5 Other:(Please specify):_____________________________
Thank you very much for your cooperation.
Please return your completed questionnaire by using the enclosed business reply envelope.
Job # M1130<XXXX>

28
Appendix 2 – Reminder Postcard
We recently sent you a questionnaire along with $10 in the hopes you would complete our short survey for the Signage Foundation Inc. (SFI). This survey is regarding your on-premise signs and issues related to them being illuminated at night. Your participation in this survey will help gauge the attitudes of the business community toward illuminated signage, their impact on the business, and their regulation by local governments.
We are asking that you fill out the survey and return it in the provided postage-paid business reply envelope you were sent as soon as possible but no later than December 20
th.
Your response will be kept anonymous. When received, surveys will be input into a data set for aggregate analysis and respondents will not be identified either by individual or by company.
Independent survey research firm SSRS is handling the administration of the survey. If you would like a summary of the results of the study, please include a business card or note indicating what email address you would like the summary to be sent to.
Thank you very much for your cooperation and assistance!
Sincerely, ANY QUESTIONS, CONTACT: Charles R. “Ray” Taylor, Ph.D. Deborah Leiby-Clark John A. Murphy Professor of Marketing SSRS Past President, American Academy of Advertising 1-800-633-1986, ext. 4336 or Villanova University [email protected]
VILLANOVA SCHOOL of BUSINESS DEPARTMENT OF MARKETING AND BUSINESS LAW 800 Lancaster Avenue Villanova, PA 19085-1678

29
30
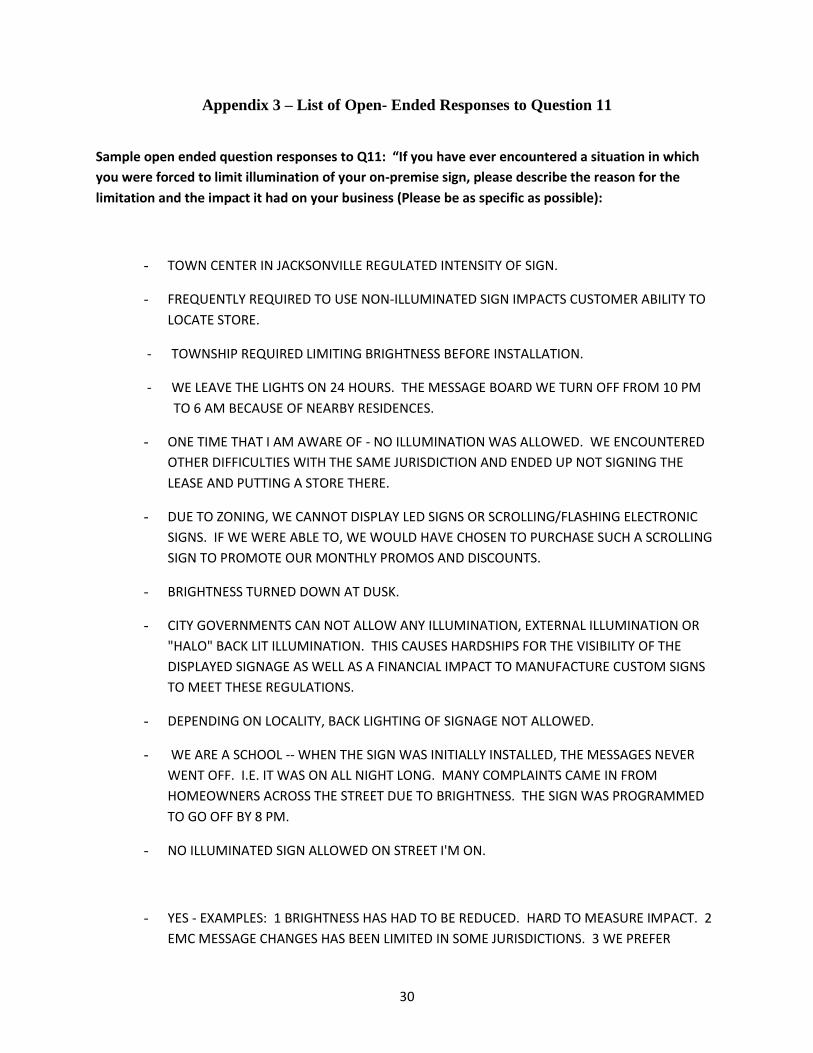
Appendix 3 – List of Open- Ended Responses to Question 11
Sample open ended question responses to Q11: “If you have ever encountered a situation in which
you were forced to limit illumination of your on-premise sign, please describe the reason for the
limitation and the impact it had on your business (Please be as specific as possible):
- TOWN CENTER IN JACKSONVILLE REGULATED INTENSITY OF SIGN.
- FREQUENTLY REQUIRED TO USE NON-ILLUMINATED SIGN IMPACTS CUSTOMER ABILITY TO
LOCATE STORE.
- TOWNSHIP REQUIRED LIMITING BRIGHTNESS BEFORE INSTALLATION.
- WE LEAVE THE LIGHTS ON 24 HOURS. THE MESSAGE BOARD WE TURN OFF FROM 10 PM
TO 6 AM BECAUSE OF NEARBY RESIDENCES.
- ONE TIME THAT I AM AWARE OF - NO ILLUMINATION WAS ALLOWED. WE ENCOUNTERED
OTHER DIFFICULTIES WITH THE SAME JURISDICTION AND ENDED UP NOT SIGNING THE
LEASE AND PUTTING A STORE THERE.
- DUE TO ZONING, WE CANNOT DISPLAY LED SIGNS OR SCROLLING/FLASHING ELECTRONIC
SIGNS. IF WE WERE ABLE TO, WE WOULD HAVE CHOSEN TO PURCHASE SUCH A SCROLLING
SIGN TO PROMOTE OUR MONTHLY PROMOS AND DISCOUNTS.
- BRIGHTNESS TURNED DOWN AT DUSK.
- CITY GOVERNMENTS CAN NOT ALLOW ANY ILLUMINATION, EXTERNAL ILLUMINATION OR
"HALO" BACK LIT ILLUMINATION. THIS CAUSES HARDSHIPS FOR THE VISIBILITY OF THE
DISPLAYED SIGNAGE AS WELL AS A FINANCIAL IMPACT TO MANUFACTURE CUSTOM SIGNS
TO MEET THESE REGULATIONS.
- DEPENDING ON LOCALITY, BACK LIGHTING OF SIGNAGE NOT ALLOWED.
- WE ARE A SCHOOL -- WHEN THE SIGN WAS INITIALLY INSTALLED, THE MESSAGES NEVER
WENT OFF. I.E. IT WAS ON ALL NIGHT LONG. MANY COMPLAINTS CAME IN FROM
HOMEOWNERS ACROSS THE STREET DUE TO BRIGHTNESS. THE SIGN WAS PROGRAMMED
TO GO OFF BY 8 PM.
- NO ILLUMINATED SIGN ALLOWED ON STREET I'M ON.
- YES - EXAMPLES: 1 BRIGHTNESS HAS HAD TO BE REDUCED. HARD TO MEASURE IMPACT. 2
EMC MESSAGE CHANGES HAS BEEN LIMITED IN SOME JURISDICTIONS. 3 WE PREFER

31
- HAVING EMC SIGNS AT ALL PROPERTIES (186) BUT PROBABLY 20-25% HAVE NOT BEEN
SUCCESSFUL GETTING THESE.
- HAVE TIMER TO SWITCH TO LOW ILLUMINATION NOT INSTALLED YET BUT PROBABLY WILL
SET LOW ILLUMINATION FROM 9:00 PM UNTIL 6 AM TO INCREASE BULB LIFE AND REDUCE
LIGHT POLLUTION. SOME POWER SAVINGS WILL OR SHOULD BE REALIZED.
- I AM CURRENTLY IN THE PROCESS OF PUTTING UP A NEW ILLUMINATED SIGN. LOCAL
GOVERNMENT HAS SAID NOTHING TO ME ABOUT RESTRICTIONS OF ILLUMINATION. I HAVE
BEEN FIGHTING WITH THEM ABOUT PLACEMENT OF THE SIGN BECAUSE I SET SO FAR OFF
THE ROAD.
- LOCAL ORDINANCE PREVENTED ILLUMINATION.
- TYPICALLY IT IS DUE TO LOCAL ORDINANCES.
- RESTRICTED ON HOURS THE SIGN CAN BE LIT.


![CONCEPT DEVELOPMENT · Stair Core Cladding Signage / Branding 01 illuminated signage 02 paint applied 03 extruded signage [block lettering] 04 neon signage 05 extruded signage [back](https://static.fdocuments.net/doc/165x107/5fb95a0d7a42e557e94b787a/concept-development-stair-core-cladding-signage-branding-01-illuminated-signage.jpg)