Traffic classification and applications to traffic monitoring
November, 2004
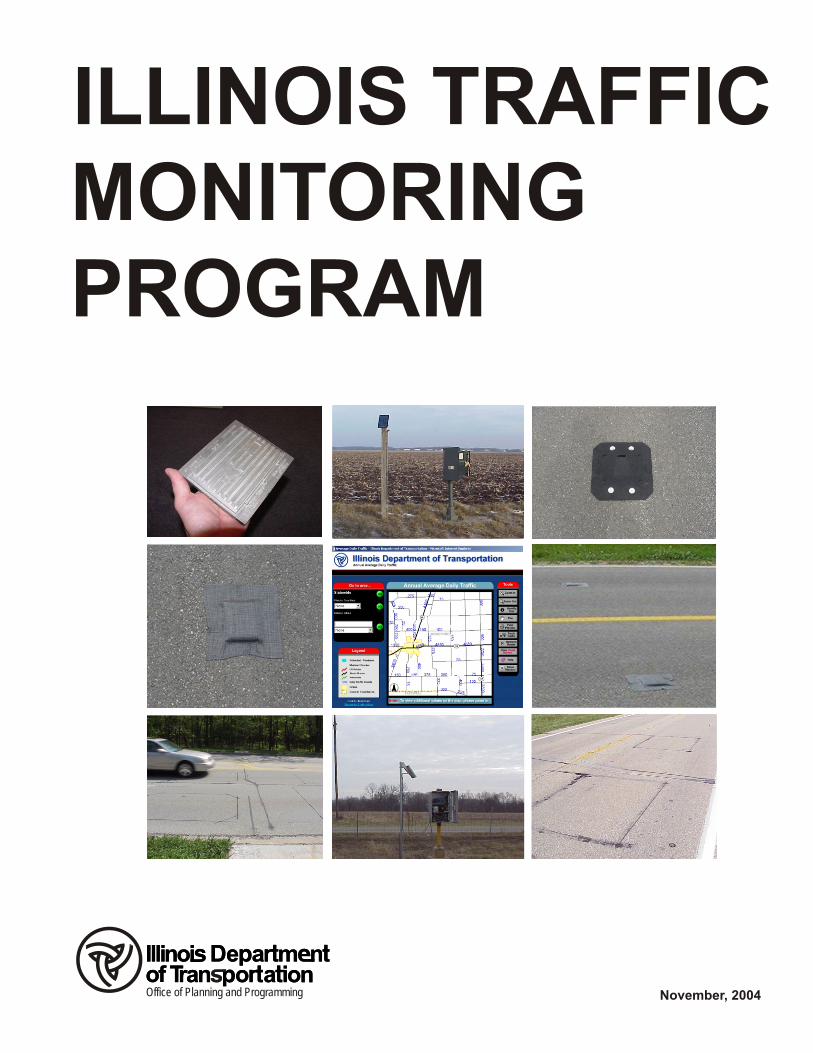
ILLINOIS TRAFFIC MONITORING PROGRAM
of Tran o a ionDe a m nlIlli noi
of Tran o a ionDe a m nlIlli noi
Office of Planning and Programming

Illinois Traffic Monitoring Program
November, 2004
STATE OF ILLINOIS DEPARTMENT OF TRANSPORTATION
OFFICE OF PLANNING AND PROGRAMMING
PREPARED IN COOPERATION WITH U.S. DEPARTMENT OF TRANSPORTATION
FEDERAL HIGHWAY ADMINISTRATIO

Illinois Traffic Monitoring Program
(revised 2005)
Table of Contents Page Introduction 1 Overview of IDOT’s Traffic Monitoring Program 3 History 7 I. Traffic Monitoring A. Automatic Traffic Recorders 9 B. Marked Route short-term counts 14 C. Vehicle length-based Classification counts 18 D. Countywide Coverage Counts 22 E. Structure and Railroad counts 24 F. HPMS counts 25 G. Quality Controls 27 H. Strategic Highway Research Program 35 II. Traffic Maps 37 A. Internet AADT application 38 B. GIS produced State Primary System AADT 39
and Truck AADT Plots C. GIS County Traffic Plots 39 D. Urban Area and City Traffic Maps 40 Appendices A. Illinois Vehicle Classification summary B. FHWA approval of Illinois’ Vehicle length-based classification C. HPMS unmarked cycle agreement - FHWA D. Abbreviations E. FHWA approval of the new Illinois Traffic Monitoring Program The latest version of the ITMP document can be found at www.dot.il.gov/itmp.pdf

1
ILLINOIS TRAFFIC MONITORING PROGRAM November 2004
Introduction The importance of traffic data in highway design and operation has long been recognized. The department has had an organized traffic counting program since the early 1930's. This program developed over time to include three major elements: volume counting, vehicle type classification, and truck weighing. Today, the use of traffic data continues to expand within the department, to other government agencies, and to the general public. The Illinois Traffic Monitoring Program document last modified in July 1995, is being revised due to several significant changes in the last few years. These changes include: • New portable traffic equipment • Changes in FHWA requirements • Use of length-based classification • Distribution of traffic data on the Internet • Use of GIS to produce traffic maps • Use of outside sources for the gathering of traffic data The pace of change within the traffic area will continue to be very active as new technologies are sought for passive traffic equipment, data sharing with ITS (Intelligent Transportation Systems) is expanded, and requirements from FHWA and IDOT continue to evolve. The new version of the Illinois Traffic Monitoring Program will document the current processes and strategies used throughout the state to meet the existing traffic requirements for the Illinois Department of Transportation. If additional information about this manual is needed, please contact the Office of Planning and Programming at (217) 785-8494. .

Illinois Traffic Monitoring Program
3
Overview- IDOT’s Traffic Monitoring Program The department's basic philosophy is to conduct an annual traffic monitoring program consisting of volume counting, vehicle classification, and truck weighing conceived as one comprehensive program. Traffic monitoring equipment is provided annually by the Office of Planning and Programming (OP&P) in adequate amounts to assure proper equipment for District Traffic studies staff for the collection of accurate traffic measurements. The annual program includes the standard elements of continuous counts Automatic Traffic Recorders (ATRs), classification counts, coverage counts, HPMS counts, Structure counts, and Railroad crossing counts. These elements are discussed in detail under "Traffic Monitoring" later in this document. Special emphasis in a particular area may come up due to additional requirements or priorities for the department. Personnel in the nine district offices along with consultants under contract perform the majority of traffic data collection. IDOT also uses data from Chicago's Traffic Systems Center and the Illinois Toll Highway Authority to estimate annual travel on the Chicago expressway system and toll highways, which are major urban interstate routes. The department annually holds a meeting with traffic data collection personnel to identify problems, coordinate activities and advance new technologies to ensure traffic data collection activities efficiently meet the department’s needs. The department also annually transmits Traffic Data Collection Instructions to the districts detailing the roadway systems to be counted and the proper traffic counting procedures. Traffic monitoring has been an evolving process in Illinois to gather and distribute the most accurate and up-to-date data possible. To assist users of traffic data, the department stores Annual Average Daily Traffic (AADT), single unit truck, and multiple unit truck data in the Illinois Roadway Information System (IRIS) data file. IRIS provides user accessibility and has interfaces to allow other management systems to readily share the traffic data. The traffic information is also available on IDOT’s Geographical Information System (GIS) which allows for more complete editing and review of the traffic data.

Illinois Traffic Monitoring Program
4
IDOT maintains a statewide Automatic Traffic Recorder (ATR) network of 85 sites where hourly traffic volumes are recorded continuously by direction, and lane. Thirty-six (32 in Chicago, 4 in East St. Louis) of the sites were built in 1999-2000 and brought online in 2001 to better represent the large urban areas in the calculation of seasonal and growth factors for the state. The ATR sites are distributed across the various roadway functional classifications, volume groups and area types (urban or rural) to achieve a statistically valid representation of all roadway systems above township roads and municipal streets. ATR data is used primarily to develop statewide annual growth factors for each highway system and to calculate monthly factors for seasonal adjustment of short-term machine counts to estimates of Annual Average Daily Traffic (AADT). IDOT uses data from Chicago's Traffic Systems Center and the Illinois Toll Highway Authority to estimate annual travel on the Chicago expressway system and toll highways. The Traffic Systems Center has installed thousands of continuously operating vehicle sensors in the pavement for event monitoring on the expressways, a byproduct of which is hourly traffic volumes by lane. Toll revenue receipts are converted to traffic volume information for the toll highways. On non-interstate marked routes in the Chicago area, and on all marked routes downstate, short-term machine and manual counts are performed biennially on the state primary system. The counts are taken on the odd numbered years (2001, 2003, 2005, etc.) A count is taken on every marked route segment between significant intersections and these counts are adjusted to AADT by application of the seasonal adjustment factors developed from ATR data. The unmarked (local) roadway systems are counted during county traffic surveys which take place on a 4-year cycle in the Chicago area and a 5-year cycle downstate. This amounts to approximately 20% of the state's counties being surveyed each year. County coverage is extensive, including detailed coverage of urban areas within each county. Least extensive is the coverage obtained on township roads and municipal streets, which carry a small percentage of statewide travel.

Illinois Traffic Monitoring Program
5
Approximately 20,000 short-term counts are performed each year for the state primary system and county traffic surveys. The department maintains an electronic file of all public roadway mileage in the state on a mainframe system called IRIS (Illinois Roadway Information System). IRIS contains various types of information including functional classification, system length, traffic volumes, physical characteristics, geographical, jurisdictional and maintenance information are stored on the roadway file and revised as necessary. Upon completion of a traffic survey, the raw field counts are entered into an ACCESS database. The ACCESS database is loaded with the current seasonal factors (provided by the OP&P) which are used to generate AADT for each count. The District Traffic staff will use the database to determine which counts are acceptable and which should be excluded. Historically information from previous versions of the database, and current AADT information from the IRIS can be downloaded into the database to check the validity of the new counts. Several edits reports are also provided within the database to verify the new traffic counts. More information about the use and capabilities of the Traffic Count database can be found in the “General Guidelines for Processing, Verifying and Reporting Traffic Data” document that is provided to the districts by OP&P. Once the counts are accepted, the District Traffic staff enters the AADTs into the IRIS mainframe system before the IRIS file closes for the year which is traditionally around the end of February. However, the sooner that the counts are entered into IRIS, the more opportunity the districts and central office have to run edit reports off the mainframe and GIS to review the traffic information. The use of GIS (Geographical Information Systems) has provided another tool for the district and central office Traffic Staff to review the accuracy and completeness of newly entered AADT numbers in IRIS. Specific edits checks using GIS can be found in the “General Guidelines for Processing, Verifying and Reporting Traffic Data” document. OP&P along with assistance from the District staff continues to use its technical resources to investigate new types of traffic equipment and technology to meet the needs of the department. While the department has made a serious investment in the NuMetric Hi-Star counters, we continue to investigate non-

Illinois Traffic Monitoring Program
6
intrusive technologies that could provide accurate portable classification counts at a reasonable cost. When reviewing any new technology or equipment, the first priority is the SAFETY of the worker. Other considerations are the quality and quantity of the data collected, and the cost to the department. Many changes have occurred in the collection and methods of processing traffic data during the last 5 years. Depending on new requirements from FHWA and IDOT, changes in traffic equipment technology, budget and resource issues, the traffic monitoring program for Illinois will continue to evolve.
Illinois Traffic Monitoring Program
7
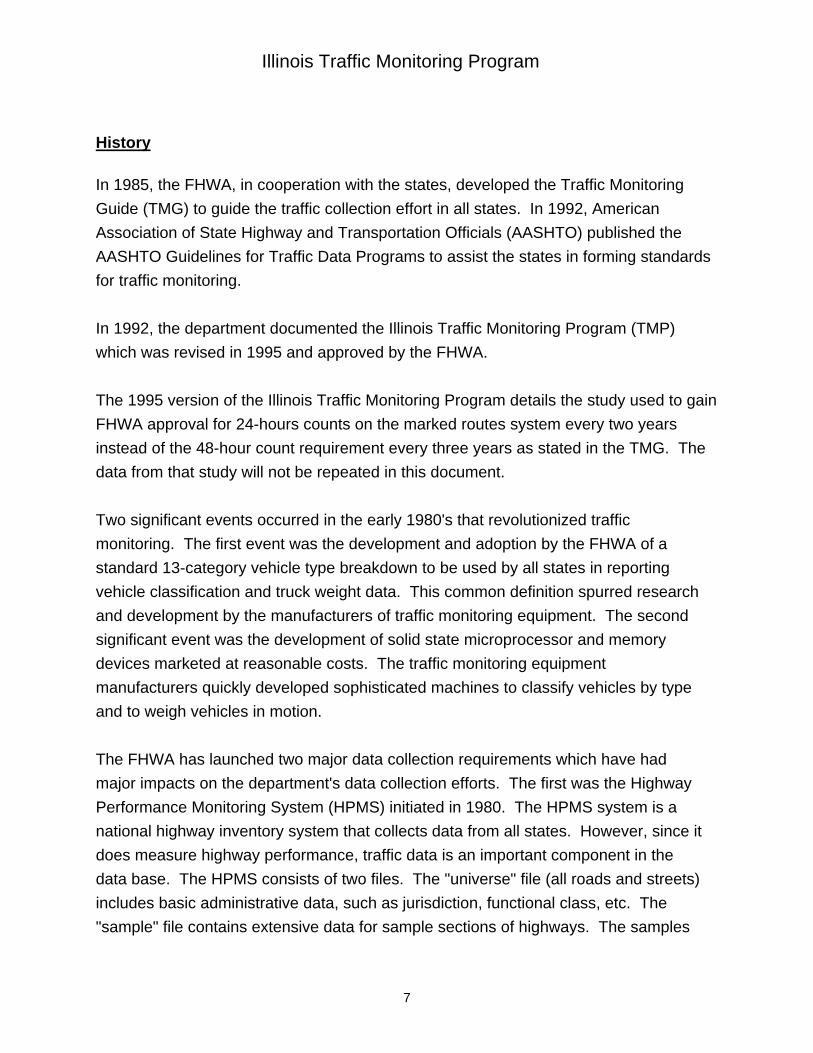
History In 1985, the FHWA, in cooperation with the states, developed the Traffic Monitoring Guide (TMG) to guide the traffic collection effort in all states. In 1992, American Association of State Highway and Transportation Officials (AASHTO) published the AASHTO Guidelines for Traffic Data Programs to assist the states in forming standards for traffic monitoring. In 1992, the department documented the Illinois Traffic Monitoring Program (TMP) which was revised in 1995 and approved by the FHWA. The 1995 version of the Illinois Traffic Monitoring Program details the study used to gain FHWA approval for 24-hours counts on the marked routes system every two years instead of the 48-hour count requirement every three years as stated in the TMG. The data from that study will not be repeated in this document. Two significant events occurred in the early 1980's that revolutionized traffic monitoring. The first event was the development and adoption by the FHWA of a standard 13-category vehicle type breakdown to be used by all states in reporting vehicle classification and truck weight data. This common definition spurred research and development by the manufacturers of traffic monitoring equipment. The second significant event was the development of solid state microprocessor and memory devices marketed at reasonable costs. The traffic monitoring equipment manufacturers quickly developed sophisticated machines to classify vehicles by type and to weigh vehicles in motion. The FHWA has launched two major data collection requirements which have had major impacts on the department's data collection efforts. The first was the Highway Performance Monitoring System (HPMS) initiated in 1980. The HPMS system is a national highway inventory system that collects data from all states. However, since it does measure highway performance, traffic data is an important component in the data base. The HPMS consists of two files. The "universe" file (all roads and streets) includes basic administrative data, such as jurisdiction, functional class, etc. The "sample" file contains extensive data for sample sections of highways. The samples
Illinois Traffic Monitoring Program
8
were randomly selected using three different criteria; Annual Average Daily Traffic (AADT) Volume Group, Functional Class, and Urban/Urbanized/Rural classification. Since Illinois is greatly urban or urbanized, the numbers of samples resulted in a large number of urban samples. The second major data collection effort launched by the FHWA was the Traffic Monitoring Guide (TMG) in 1985. The TMG traffic monitoring plan is based entirely upon HPMS sample sections, and is divided into three types of traffic monitoring - volume counting, vehicle classification, and truck weighing. FHWA completely re-wrote the Traffic Monitoring Guide (TMG) in 2001. Many of the new components of the TMP are currently being utilized by the department and will be reflected in this document. Two significant changes in the TMG were FHWA’s requirement for additional classification counts, and the acceptance of length-based vehicle classification.

Illinois Traffic Monitoring Program
9
I. Traffic Monitoring A. Automatic Traffic Recorders (ATRs)
Automatic Traffic Recorders (ATR) are permanent locations along the roadway where continuous traffic data is collected and retrieved throughout the year. IDOT maintains a network of 85 ATR locations throughout the state. The data collected from the ATR locations is extremely important to traffic monitoring program as the ATRs provide the statistical information for the development of monthly factors used to convert short term counts (24 hour/48 hour) to AADT, along with annual ADT growth factors. In addition, the ATR data is used for publishing hourly traffic trends, weekday traffic trends, and contribute to our understanding of design hourly volumes. The ATR location consists of induction loops embedded in the pavement for each traffic lane, a cabinet mounted on concrete off the road with the recording unit, modem, battery, and solar panel. A phone line is run into the cabinet. ATR sites are polled daily via modem from the central office. A visual review of each station is made to identify missing or irregular daily lane volumes to assure accurate data is being collected from each station. At the beginning of each month the unedited ATR data from the previous month is transferred from the polling PC to the mainframe for storage. The mainframe file containing the hourly ATR data is reviewed and edited before being transferred to an ACCESS database. When problems in the polling of traffic data are detected, the Equipment Repair manager who is located at the Data Management Unit (DMU) Repair shop is notified and will evaluate the equipment's operation and make the necessary repairs. The DMU Equipment Repair staff will determine if other people are required to assist in the repair of the ATR sites. The District Traffic staff might be asked by the Equipment Repair staff to make a visit to check phone lines, solar panel, battery, and equipment operation. Under the guidance of the DMU Repair Shop staff, the District staff may make minor repairs or equipment

Illinois Traffic Monitoring Program
10
replacement. If this fails to resolve the problem, the DMU staff will visit the site and make the repair or determine if sensors require replacement. Repairs in District One are handled by the electrical maintenance contract administered by the Traffic Surveillance Center. Of the 85 ATR sites, 36 of those locations also collect hourly vehicle classification counts for each of 13 vehicle types as defined in FHWA's Traffic Monitoring Guide (TMG). These locations utilize two induction loops with a piezo electric cable between the loops embedded in the pavement for each traffic lane. Classification data by hour and vehicle type is being polled, reviewed, and transferred to an ACCESS database for future use. Location of ATR sites IDOT has maintained ATR locations in varying amounts since 1967. A network of 49 ATR locations has been in place since 1988. During 1998-2000, IDOT established a construction contract to build 36 additional ATR sites primarily in the Chicago Area. Thirty-two sites were added in District One, and four locations were added in the East St. Louis area. The new 36 sites began reporting data in 2001. Currently, the distribution on the 85 ATR sites is as follows:
District Number of ATR sites
Sites that also collect Classification data
District One 43 17 District Two 5 2 District Three 3 1 District Four 6 2 District Five 4 2 District Six 6 2 District Seven 6 3 District Eight 9 5 District Nine 3 2 Statewide 85 36

Illinois Traffic Monitoring Program
11
The distribution by functional class is as follows:
Functional Class Number of ATR sites
Sites that also collect
Classification data Interstate (Urban) 5 1 Interstate (Rural) 14 8 Other Principal Arterial (Urban)
29 14
Other Principal Arterial (Rural)
6 4
Minor Arterial (Rural) 5 3 Major Collector (Rural) 3 1 Minor Arterial (Urban) 16 4 Collector (Urban) 7 1 Statewide 85 36
Growth Factors Annual growth factors for adjusting older AADT from the IRIS system to estimates of current-year AADT are developed from ATR data. Additional data received from monthly reports from the Illinois Tollway Authority is included in the growth factor process. Factors are developed for each of the following four road groups: • Interstate - Rural • Interstate - Urban • Non-Interstate Rural (OPA Rural and Minor Art. Rural functional classes
combined) • Non-Interstate Urban (Minor Art. Urban and Collector Urban functional
classes combined) Growth factors are not considered necessary for the rural major and minor collectors and local roads and streets. Annual change in AADT on these systems is usually negligible during one count cycle.
Illinois Traffic Monitoring Program
12
Each January an AADT for the previous year is calculated for every ATR with complete or nearly complete data by dividing the total number of vehicles recorded during the year by the number of days in the year. The ATR data is aggregated by the four road groups, and an average percent change in AADT from the previous year is calculated for each group. These percentages are the factors used for adjusting past-year volumes from the IRIS to estimates of current-year volumes used in publishing Vehicle Miles Traveled (VMT). Seasonal Factors Monthly seasonal factors and day-of-week factors are used to adjust counts of 24 or 48 hours to AADT. Factors are calculated first after the ATR data is edited by means of several queries in the Access database. These queries are used to flunk all Fridays, Saturdays, Sundays, and any day with more than six consecutive hours of zero volume, along with all data from the six major holidays: New Year’s Day, Memorial Day, Fourth of July, Labor Day, Thanksgiving and Christmas. The day before and the day after the major holidays are also flunked. Questionable data identified in the daily polling reports is deleted as necessary. The database calculates an average Monday - Thursday volume for each count station, for each month. The seasonal adjustment factor for each station, for each month is then calculated by dividing the average weekday volume for each month by the station AADT. Factors for the current and previous three years for each station are then averaged. This four-year average is used to minimize the effect of weather extremes. IDOT has defined four groups; Interstate Rural, Interstate Urban, Non-Interstate Rural, and Non-Interstate Urban for the stations, and each station is assigned to one of the five road groups. The seasonal factor for each month for each road group is then calculated by averaging the factors of all ATRs within each group. The new seasonal factors are distributed to the districts in an ACCESS table by February for use with the upcoming year’s counts. A similar process is utilized to develop individual Monday, Tuesday, Wednesday, and Thursday factors. The day of week factors are used along with the monthly seasonal factors for the development of the AADT from raw counts.

Illinois Traffic Monitoring Program
13
Other uses of ATR data The data collected and processed from the ATR locations are used for many other purposes outside of the development of the seasonal and growth factors. With hourly data available for all 365 days at the ATR locations, engineers can use the information to review design hour volumes, which contributes to decisions made in the designing of roads. Data collected from the ATR locations are used to produce charts that show hourly, daily, and monthly travel by road group in the "Illinois Travel Statistics" publication. These charts have been very useful in explaining general travel trend patterns, and to answer specific traffic questions from the general public. Monthly data from Illinois' ATR locations are sent to the Federal Highway Administration as part of their nationwide monitoring of travel change and monthly publication of "Travel Volume Trends" by FHWA on the Internet. The ATR data from 1995-2004 generates ACCESS tables of over a million records. The tables are stored on an SQL server for faster querying. With all the data easily accessible in ACCESS, queries can be run on demand to answer the following types of questions: • Travel comparisons between days of week. • Information on the time and day that the highest hourly traffic volumes
occur. • Hourly relationships for accident studies and others; e.g., percentage of
AADT that occurs during hours of darkness. • Environmental studies made by governmental agencies and consulting
firms where traffic data are used in conjunction with air and noise pollution monitoring.
• Request from media sources for travel data on holiday weekends. • Monitoring changes in travel caused by fuel shortages, fuel prices,
recessions, and other major socioeconomic changes. • Identify the relationships of vehicle types within various time relationships;
e.g. daily, weekday vs. weekend, annual, etc.

Illinois Traffic Monitoring Program
14
B. Marked Route short-term counts
The short-term coverage count is the primary source of traffic data for the department's Traffic Monitoring Program. Different count cycles are in place depending on whether the roadway is a marked route, HPMS section, or the type of functional class. These different cycles allow for emphasis on the State system while allowing the district to level the amount of traffic counts between years. Even though the Marked Route system consists of only 10% of the centerline mileage throughout the state, the Marked Routes generate 65% of the traffic statewide. The Marked Route AADT information is essential to the overall program planning process and the Highway maintenance, repair and rehabilitation program. Marked Routes are defined as mainline Interstates, United States routes, and Illinois Routes. The count cycle for Marked Routes is every two years, with the counts being taken on the odd number years (2003, 2005, 2007…). Full coverage of the marked route system utilizing the Hi-Star counters is required in odd-numbered years. If a district elects to count the marked routes for a county or city map in an even-numbered year, the same coverage and data requirements apply, and all marked routes must be surveyed again the following year. Each count is to be 24 hours in duration and the data collected is to include hourly volumes by lane in three vehicle-length categories (1'-21', 22'-39' and 40'+). On interstate routes, full coverage entails a Hi-Star set in each lane of mainline between interchanges. With a count on every mainline segment, it will not be necessary to calculate AADT for uncounted segments using ramp volumes. For this reason, the central office no longer requires ramp counts as part of the marked routed traffic survey.
Illinois Traffic Monitoring Program
15
At some locations where interchanges are close together, and the mainline section is so short as to cause excessive traffic weaving, it could be difficult or impossible to obtain reliable machine counts on the mainline. In these areas it may be necessary to set Hi-Star counters on the ramps and calculate mainline volumes; however, volumes for each of the three vehicle categories must be calculated. The districts will determine the need for ramp counts, and entry to IRIS of ramp AADT derived from these counts is optional. Full coverage on non-interstate marked routes requires a Hi-Star set in each lane of highway segment between intersections with other marked routes, and between intersections with streets, roads or entrances where the change in AADT on the highway being counted is ten percent or greater. The District Traffic staff scheduling the counts must be familiar with the area being surveyed. The District Traffic staff must be knowledgeable of the traffic characteristics and traffic generators within the area being counted. Since 2001, the department has been using magnetic lane counters to collect traffic volume and vehicle classification by length on the Marked Route system. Between 1999 and 2001, the Office of Planning & Programming purchased over a thousand NuMetrics Hi-Star 97 traffic counters to supply the District Traffic staff for their ongoing operations. Counting marked routes with Hi-Stars eliminates the need for a separate survey conducted specifically for determining heavy commercial and multiple-unit truck volumes. Truck volumes will be collected biennially as a byproduct of the marked route total traffic survey, putting the state AADT, heavy commercial and multiple-unit traffic maps on the same count cycle. The Hi-Star counts will also provide hourly volumes with percent trucks by direction on the entire marked route system, making it possible to report count-based peak-hour data for all HPMS sections on the system. The raw ADT data from the Hi-Star is seasonal factored using monthly factors and day-of-week factors provided yearly by OP&P. Since the NuMetric Hi-Star counts vehicles and not axles, an extra axle correction is not needed. An ACCESS database with the seasonal factors and calculation process has been distributed to the districts to assist in the development of the final AADT. Therefore we limit short term counts to any non-holiday week from 9AM Monday through 2PM on Thursday. On rural or lower AADT routes, at the district’s
Illinois Traffic Monitoring Program
16
discretion, the count period can extend earlier on Monday or go into Friday morning. Also the counting season is limited to April through October to avoid the variable effects of winter weather. However, the months of March and November are sometimes mild enough to allow traffic counting. All Marked Route counts are validated through an analytical process which compares adjacent counts along the highway, the resultant traffic flow, and historical data. The department's GIS system allows the counts to be reviewed graphically along a route. A count that provides illogical traffic flow is rejected and the location is recounted. OP&P Equipment Repair Shop handles equipment questions relating to the installation or operations of the NuMetric's Hi-Star traffic counter. OP&P will provide the District Traffic Staff with an appropriate amount of traffic counters and supplies to conduct the yearly traffic program in each of the districts. For the State Primary System (Marked Routes), there is no special program for counting HPMS sections on the marked routes. The FHWA Traffic Monitoring Guide (TMG) states that HPMS Sections are counted for 48 hours once every 3 years. However, IDOT received approval from FHWA during the early 1990's to count the Marked Route HPMS sections every two years with a 24-hour count. Additional information on the 24/48 hour agreement can be found in Section F. “HPMS Counts”. The Marked Route HPMS sections are to be counted as coverage counts along with the other coverage counts along the route and included with the traffic flow analysis for the route. IDOT uses year-end AADT reports from the Illinois Toll Highway Authority to enter the AADT for 282 miles of Tollways in Northeastern Illinois. The reports containing AADT information for the previous year from the Tollway normally arrive at IDOT during the summer. With OP&P freezing the year-end IRIS file for the HPMS submittal and Traffic publications in February, the Tollway data on our submittal is always one year behind. The Chicago Area Transportation Study (CATS) receives yearly information from IDOT's Traffic Systems Center (TSC) for the non-toll Chicago expressway system to estimate annual travel. The Expressway system is all major urban

Illinois Traffic Monitoring Program
17
interstate routes. The Traffic Systems Center has installed thousands of continuously operating vehicle sensors in the pavement for event monitoring on the expressways, which are used by CATS to generate hourly traffic volumes by lane. After CATS completes an extensive review of the Expressway data, files with the yearly Expressway data are sent to OP&P. The files from CATS contain directional ADT data, so OP&P has a procedure using Visual Basic programs to generate a mainline AADT for entry in IRIS. The previous year's Expressway AADT data is entered during the summer. Since the IRIS system is froze at the end of February for annual year-end processing, the Expressway data will be one year behind on our submittals.
Illinois Traffic Monitoring Program
18
C. Vehicle Length based Classification counts Vehicle classification counts are becoming more important because of the increasing number of trucks on Illinois highways, and because of the trend toward larger trucks with heavier loads. There is a strong need for better understanding of the effects of trucks upon pavement deterioration and upon highway geometrics. In addition, the new FHWA's TMG recommends that at least 30% of the short-term counts also include classification counts. Prior to 2001, an additional count cycle of every 4 years for truck counts (1992, 1996, 2000) was required on the Marked Route system. Due to problems with using road tubes on higher ADT routes, along with the burden of maintaining two different cycles and count station locations on Marked Routes, an extensive search for a different type of portable traffic counting/classifying equipment was undertaken. More details on the equipment search and history can be found in Appendix “A” – Illinois Vehicle Classification summary. The result of the search was the department's decision to implement the use of the NuMetrics Hi-Star counter for volume and length based classification on the Marked Routes. The magnetic lane counters allow the traffic volume and vehicle classification by length data to be collected at the same time without an additional installation process. The process that IDOT conducted to gain FHWA approval for using vehicle length-based classification for the HPMS submittal is documented in Appendix “A” – Illinois Vehicle Classification summary. FHWA approved the 3 length based classification categories in the HPMS Data review notes for the 2000 Data Year review. The actual approval can be found in the memo in Appendix “B” – FHWA approval of Illinois’ Vehicle length-based classification, in section V. (Review Observations), #7.
The NuMetric Hi-Star is used to classification vehicles into the following categories:
• <22 feet Passenger Vehicles • 22-39 feet Single-Unit trucks • 40 feet + Multi-Unit Trucks

Illinois Traffic Monitoring Program
19
The District Traffic staff is provided with more information on the programming and use of the NuMetric Hi-Star traffic counter by the OP&P Equipment Repair Shop staff. Using the NuMetric's Hi-Star, vehicle classification data is collected for the entire Marked Route that IDOT staff counts. The Illinois Tollway Authority provides an annual atlas report with classification data at the different plazas. OP&P uses the atlas report to enter the truck data for the Tollways into the IRIS system. The department has been using consultants since 1996 to collect traffic counts in District One. IDOT staff from the Schaumburg office administers the contract during the year. The contract has been funded using SPR funds and the invoices are paid by OP&P. In addition to the Marked Routes counts (non-Interstates), the consultant performs manual 12-hour counts for trucks on the higher volume Interstates (non-toll). In addition to manual counts for the overall Traffic Monitoring program, the District Traffic Staff is frequently required to conduct manual counts for signal warrants or intersection design. These manual counts may require 3 or 8 categories. A form that accommodates up to 4 legs of an intersection can be used. The field technician must be careful to identify North on the direction symbol, and to indicate the intersecting routes in the area provided in the center of the form. Some districts still process the manual counts using the old Manual Classification Count Computer System (STC). As indicated by the design of the classification forms, most manual counts are made at intersections. At lower traffic volume intersections one person will usually be sufficient. However, high traffic volume or complex intersections will require two or more persons. It is the district traffic counting supervisor's responsibility to assure there are enough persons to provide reliable classification counts.

Illinois Traffic Monitoring Program
20
The 12-hour manual counts that are used to generate AADTs, should be made in six hour increments to allow sufficient travel time to and from the counting site. The 6-hour increments are: 6:00 A. M. to 12 Noon 12 Noon to 6:00 P.M. The 12-hour to 24-hour factors to convert the count to AADT is examined periodically to assure proper expansions. Additional classification type data is required on HPMS sections. Those requirements are explained in Section “F” - HPMS counts. Once all the Truck AADT information is entered in IRIS for the Marked Routes, OP&P has developed a process to extrapolate the Truck Vehicle Miles Traveled (VMT) on the lower functional classes. Using the complete coverage of truck counts on Marked Routes, the following percentages by functional class can be achieved using actual counts.
Functional Class U / R Total MilesTotal Marked Route Miles
Percent Coverage
Interstate Rural 1,510 1,510 100%Interstate Urban 660 660 100%
Freeways & Expwys Urban 139 81 58%Other Prin. Arterials Rural 2,640 2,581 98%Other Prin. Arterials Urban 2,688 2,221 83%
Minor Arterials Rural 4,791 4,707 98%Major Collectors Rural 14,169 1,396 10%Minor Arterials Urban 3,988 421 11%
For the functional classes listed that does not have complete coverage, the truck percentages from the actual counts are applied to the remaining mileage within the functional class. OP&P uses fixed truck percentages on the lower functional classes to develop statewide Truck VMT for the HPMS submittal and for the Illinois Traffic publications. The truck percentages on the lower functional classes were developed by IDOT using manual counts. Buses are factored out of the Single Units for the HPMS submittal using historical data.

Illinois Traffic Monitoring Program
21
With the Marked Route system being counted on odd-number years, the same truck percentages used to develop statewide Truck VMT for the HPMS submittal and for the Illinois Traffic publications will be used in the even-number years.

Illinois Traffic Monitoring Program
22
D. Countywide Coverage Counts
The County coverage count makes up the majority of the overall traffic counts that are taken throughout the state. The countywide coverage count is a 24-hour count usually made with road tubes and a Mitron counter. The Mitron counter is small and light weight and provides flexibility in scheduling pick-up time. The Mitron is air actuated with road tubes. The count is adjusted by an extra axle correction factor and then adjusted for seasonal variation by applying the appropriate monthly factor. In some cases, the NuMetric Hi-Star counter is used for countywide coverage counts. Volume information can be used for the development of the AADT, however, classification data is not required for a county coverage count. County traffic surveys outside of the District One counties, and surveys of urbanized areas exclusive of Chicago remain on a five-year cycle. District One counties are on a four-year cycle. The need for traffic surveys of cities other than urbanized areas is determined at the district level. These cycles remain flexible in that a county or urbanized area survey may be delayed or counted earlier for reasons such as local government interest, manpower considerations, major bridge closings or relative rate of change within the area. If a county survey is deferred, the structure/crossing counts for that county should still be obtained. The districts should coordinate changes in the anticipated count cycle changes with the central office. Assistance in the generation of the locations to be counted can be found in the yearly “Traffic Data Collection Instructions” that are provided to the districts by the central office. The 24-hour county coverage counts should be taken between in the period 6 A.M. Monday through 2 P.M. Friday before the traffic peaks. Also the counting season is limited to April thru October to avoid the variable effects of winter weather. However, the months of March and November are sometimes mild enough to allow traffic counting. A day of week factor is not applied. An

Illinois Traffic Monitoring Program
23
analysis of ATR data indicated no significant daily difference in traffic from Mondays through Thursday. Supporting documentation for that study was included in Appendix “E” of the July, 1995 version of the “Illinois Traffic Monitoring Program”. All roads and streets functionally classified as collector or higher must be counted. Also, all roads and streets functionally classified as local with an AADT of 3,000 or more should be counted. Additionally, all FAS and all FAU routes should be counted. The location and density of the remaining coverage counts depends upon the type of traffic survey being conducted, resources available to the Traffic staff, and the goals for that survey. Maximum coverage must be obtained with the fewest counts possible. The districts should develop counting work schedules that provide an efficient use of resources available. The districts are urged to develop cooperative arrangements with counties, cities and planning agencies to assist in traffic counting. Typically the county, city, or planning agency provides the manpower and the district provides the equipment and guidance. The district should perform the analysis of the counts before AADTs are entered by the district into IRIS. The raw ADT data from the counters are seasonal factored using monthly factors provided yearly by OP&P. Extra axle factors will be needed if road tubes are used and there is truck traffic along the count. The NuMetric Hi-Star counts vehicles and not axles, so an extra axle correction is not needed. An ACCESS database with the seasonal factors and calculation process has been distributed to the districts to assist in the development of the final AADT. A day-of-week factor is not applied. County traffic work maps, which in the past have been prepared for the OP&P Mapping and Graphics Unit, are no longer required. The Mapping and Graphics Unit has discontinued printing county AADT traffic maps. The county maps are now produced using IDOT's GIS application. The process for a county traffic plot is explained in Chapter II. - Traffic Maps, Section "C" - GIS County Traffic Plots.
Illinois Traffic Monitoring Program
24
E. Structure and Railroad counts
When choosing locations for bridge and railroad crossings, it is not necessary to set the counter at or near the bridge or railroad crossing. The counter may be located in an area that will collect the traffic that goes from the intersection before the bridge/railroad crossing to the intersection after the bridge/railroad crossing. If the count is scheduled due to the bridge or railroad crossing, code the AADT into IRIS for the entire applicable section of road from intersection to intersection, not just the bridge or railroad crossing. Bridges over 100 AADT and Railroad crossings over 250 AADT should have a machine count when the county is counted.

Illinois Traffic Monitoring Program
25
F. HPMS Counts
The Highway Performance Monitoring System (HPMS) is a national level highway information system that includes data on the extent, condition, performance, traffic, and operating characteristics of the Nation's highways. Data from HPMS is used by Congress in establishing both authorization and appropriation legislation, activities that ultimately determine the scope and size of the Federal-aid Highway Program. The traffic data from HPMS is specifically used in the apportionment formulae, used in the analysis of the performance and condition reports for Congress, used for Clean Air requirements, and is central to the performance indicators for vehicle crash and fatality rates.
The AADT data for HPMS comes directly from the IRIS system. However, there are specific traffic data items required for HPMS sections. The FHWA procedures for HPMS counts require 48-hour counts on a 3 year cycle for the higher functional class roads, and a 6 year cycle for the lower systems. However, due to the different count cycles utilized in IDOT’s count program, and the use of vehicle length-based classifiers, IDOT has reached several agreements with FHWA for variations on the standard 3-yr 48-hour count cycle. Since the department counts the Marked Route system every two years, HPMS sections on the Marked System will have a new AADT every two years based on a 24-hour count. During the late 1980’s, IDOT conducted a comprehensive study to evaluate the 24 hour count verses the 48 hour count. A statistical test was made using the Analysis of Variance technique. The results from the study was included in the Appendix “E” of the July, 1995 version of the “Illinois Traffic Monitoring Program”. Based on the results of that study, FHWA agreed that IDOT should continue to count the Marked Route HPMS section on a two year cycle for 24 hours as part of the ongoing Marked Route count program.

Illinois Traffic Monitoring Program
26
In order to better balance the work load of traffic counts each year for the IDOT District Traffic staff, IDOT and FHWA reached agreement to change the unmarked HPMS 48-hour counts to a 4 year cycle. The original request and FHWA approval can be found in Appendix “C” – HPMS unmarked cycle agreement – FHWA. The only exception to the four year cycle for unmarked HPMS section is sections that are on the NHS system. There are currently 18 HPMS unmarked NHS sections, and they will need to be counted every two years. The central office will provide the listing of these sections to the district annually. When counting both Marked and Unmarked HPMS sections, additional traffic data other than AADT is also required to be reviewed. The additional HPMS traffic fields are entered on HPMS screen 35 include the “K” factor, Directional factor, Peak Single Unit %, Average Single Unit %, Peak Combination %, and Average Combination %. Detail instruction on each of those fields can be found in the “HPMS Information and Procedure Field Manual”. With the use of the vehicle length classifiers on Marked Routes, IDOT collects classification data on the entire Marked Route system. With complete coverage on the Marked Route system, IDOT no longer collects the 13 category classification counts on 100 selected HPMS Sections each year as specified in FHWA’s HPMS procedures. Rather than using a few hundred HPMS samples to determine the classification percentages for the HPMS submittal, IDOT uses the complete Marked Route coverage classification counts to determine the classification percentages. This process was part of the FHWA agreement on IDOT’s use of Vehicle length-based classification. As OP&P reviews the sample adequacy of the current HPMS sample distribution, HPMS sections will be added and deleted. OP&P will provide the districts with changes in the number of HPMS section at the beginning of the year.

Illinois Traffic Monitoring Program
27
G. Quality Control
IDOT conducts multiple tasks through the count process to ensure quality and completeness of the Traffic information. Quality and completeness is an essential component of the overall traffic program. Quality of the traffic data is considered in all steps, from the preparation of the equipment and scheduling of counts, to editing the AADT data after entry in the mainframe system, and to the preparation of the final distribution of AADT data. The different steps for quality control can be broken into these six categories: Equipment, Field procedures, Training, Meetings, Office Procedures, and Documentation. 1. Equipment The department expends considerable effort to evaluate new traffic counting equipment. OP&P Equipment Repair staff continues to test new portable traffic devices and technologies as they become available. Equipment Repair staff makes contacts with different Vendors that make traffic devices available for testing. The factors considered when reviewing new equipment (in priority order) are:
• Safety of the worker • Quality and quantity of the data collected • Cost to the department
Additional considerations are given to ease of operations, maintenance, and durability. The department has a vast inventory of NuMetric Hi-Star magnetic lane counters for the short-term count program on the Marked Routes. While the department continues to buy some replacement units, a higher percentage of the Hi-Star counters are going through the Equipment Repair shop for repairs. When a traffic counter is returned to the repair shop for repair, the counter is both visibly and electronically inspected to determine what level of repair is required. The type of testing done is determined by the type of counter. The department uses three different types of counters, non-PC based tube

Illinois Traffic Monitoring Program
28
counters, tube and electronic sensor micro-processor based counters, and microprocessor based PC dependant magnetic lane counters. Methods for testing, calibration, repair, and criterion for final acceptance vary significantly depending upon the type of counter. Non-PC Based Counters: The counter is visibly inspected for obvious damage. Battery voltage is checked and if low the batteries are replaced. A tube is connected to the unit and the unit is pulsed to determine if it is operating. If a problem is noted the unit is tested to determine the problem and the defective component or components are replaced. After the repair the unit is retested by pulsing a tube connected to the counter and observing the cumulative count to confirm proper operation. No road test is required for these counters. A record of the repair is entered into the counter repair database. The unit is made available to the districts for returned to service. PC Based counters using tube, loop, and/or piezo sensors: These counters are microprocessor based and their configuration can be varied by the installation or removal of various circuit boards. When the counter returned for service it is first visibly inspected for obvious damage. Battery voltage is checked, and if low the batteries are replaced or the unit is connected to an external power source for further testing. A communication test is performed. If communication is not established, the communication error is corrected before further testing. Once communication is established the counters are tested using specialized test equipment to test each of the various sensor inputs that are installed in the particular counter. In most cases the counters are repaired by replacing defective circuit cards. The defective circuit cards are then repaired at a later time and kept as spares. Once repaired the unit is tested using an automated test set to insure proper operation. A record or the repair is entered into the counter repair database. The unit is made available to the districts for returned to service.
Illinois Traffic Monitoring Program
29
PC Dependant Magnetic Lane Counters: Initial testing for these counters is essentially the same as the previous counters. Once communications is established a software based sensor calibration test is performed. If this test fails then the counters are returned to the manufacturer for repair. Repairs to these units are limited to replacement of cases, batteries, circuit board assemblies, and non-sensor related components on the circuit board assemblies. After the counters are reassembled the batteries are charged and they are given a functional test in the shop and then an on-road classification test where the counter results are compared to a test site ATR location using loops to classify vehicle lengths. The test site’s loops are tested and calibrated using a vehicle of known length at various speeds. All testing and repair is performed using a variety of standard and specialized electronic and PC based test equipment. Equipment includes but might not be limited to the following:
• Digital VOM • Digital Storage Oscilloscope – Bench and portable • Inductance / Capacitance Meters • Arbitrary Function Generators • ATSI – Loop/Piezo/Road Tube Simulator • PACE Solder / De-solder / SMT Rework Stations • PC Workstation
The Equipment Repair staff keeps their technical skills up to date by attending technical Traffic meetings with other states, WIM conferences, biennial NATMEC conference, industry and electronic workshops, and other Vendor training.
Illinois Traffic Monitoring Program
30
2. Field procedures When scheduling counts, the district should develop a counting work schedule that provide an efficient use of resources available. Prior to the count season, OP&P can provide the districts with an extract from IRIS of the previous count coverage in an ACCESS table. The districts can use that table along with other district priorities to develop reports and plots for the locations to be counted. The location and density of the counts depend upon the type of traffic survey being conducted, resources available to the Traffic staff, and the goals for that survey. Maximum coverage must be obtained with the fewest counts possible. When setting out and picking up the traffic counters, the field technician must verify the proper operation of the traffic counter. When using the Hi-Star counter, each counter must be programmed for the location where it will be set. At the time of programming the counter, the battery status should be checked to ensure a sufficient charge is available for the duration of the count. When using road tubes, a check should be done through comparing the machine count and visual count of vehicles passing over the sensors. The field technician must also be alert to detect situations or events that might affect the traffic count. Examples of situations include construction, bridge closures, temporary road closures, temporary traffic generators, and anything else that would cause abnormal traffic during the count period.

Illinois Traffic Monitoring Program
31
3. Training Training is provided to the District traffic staff to allow them to assist the Central Office Equipment Repair staff by performing routine troubleshooting, maintenance, and light repair tasks. These tasks include, but are not limited to the use of basic electronic test equipment, ATR / WIMM site troubleshooting including testing and repairing the solar / battery power system, counter troubleshooting and circuit board replacement, and determining the status of the telephone / modem. The level of training provided is determined by the needs and staffing of the district requesting the training. Training is also provided on an as needed basis covering equipment programming, operation, installation, traffic equipment software, downloading procedures, and managing the data collected. The Equipment Repair staff are certified instructors for HILTI Powder Actuated Tools and provide training and certification to all district personnel that will be setting counters in the proper and safe operation of HILTI tools used by the department. The Equipment Repair staff keeps their technical skills up to date by attending technical Traffic meetings with other states, WIM conferences, biennial NATMEC conference, industry and electronic workshops, and other Vendor training.
Illinois Traffic Monitoring Program
32
4. Meetings The department annually holds a meeting with district traffic data collection personnel to identify problems, coordinate activities and advance new technologies to ensure traffic data collection activities efficiently meet the department’s needs. During the meeting the department distributes and discusses the annual “Traffic Data Collection Instructions” which details the roadway systems to be counted and any additional special emphasis for that year. During the year, district traffic staff makes occasional stops at the Equipment Repair shop to drop off and pick up repaired or new equipment. If necessary, at that time additional training is conducted on software, equipment use, or installation procedures. IDOT staff continues to monitor the changes in FHWA traffic requirements and “Best Practices” by other states, by attending FHWA sponsored conferences on HPMS and Traffic Monitoring activities.
Illinois Traffic Monitoring Program
33
5. Office Procedures Traffic monitoring has been an evolving process in Illinois to gather and distribute the most accurate and up-to-date data possible. To assist users of traffic data, the department stores Annual Average Daily Traffic (AADT), single unit truck, and multiple unit truck data in the Illinois Roadway Information System (IRIS) data file. IRIS provides user accessibility and has interfaces to allow other management systems to readily share the traffic data. The traffic information is also available on IDOT’s Geographical Information System (GIS) which allows for more complete editing and review of the traffic data. A Traffic count database application was developed using Microsoft ACCESS for the factoring, rounding, and determination of the key route stations of the count locations. The central office sends out annual updates of seasonal factors, and other updates as needed. A process to extract the current locations with key routes and reference points from the IRIS system has been developed to generate the original counts locations in the ACCESS database. This process is run as requested by the districts for counties, Marked Routes, and HPMS sections. More about this process and other editing with the Traffic Count ACCESS database can be found in the “General Guideline for Processing, Verifying and Reporting Traffic Data”. After final AADTs are entered into the IRIS system, there are several additional editing tools that the district and central office have available. Using the GIS Data Verification project, the updated AADTs can be viewed graphically. Some of the more common uses of GIS would be to check the coverage of the current AADT year for completeness, color-band the AADT by volume ranges looking for abnormal changes along a route, check AADT counts go from intersection to intersection, and check border AADT counts with adjacent counties. An extension was added to the GIS project that allow the districts to view the AADTs directory from the ACCESS database on their GIS before data is entered in to the IRIS system. In addition to the ACCESS and GIS checking that is done, there are other standard mainframe edit reports that are run from the IRIS system on a regular basis. Reports are run to check the consistency of the entered AADT volumes and estimates so they conform to standards of nearest 100, 50, 25, or 10

Illinois Traffic Monitoring Program
34
depending on the AADT value. Other reports look at the consecutive AADTs along a key route for changes more than 5 times an adjacent count, and the busiest intersections by looking at the AADT of all four legs of the intersection. Other editing using IRIS reports and GIS can be found in the “General Guideline for Processing, Verifying and Reporting Traffic Data”. 6. Documentation The department annually transmits the “Traffic Data Collection Instructions” to the districts at the March Traffic meeting. The document details the roadway systems to be counted, proper traffic counting procedures, and any specific traffic count emphasis for the upcoming year. The department also distributes the “General Guidelines for Processing, Verifying, and Reporting Traffic Data” to the districts, and sends revised copies as additional editing features are added. The “Illinois Traffic Monitoring Guide” which was updated in 2004, gives a complete overview and detailed procedures of the implementation of the Illinois Traffic program. In 2002, Illinois fulfilled the FHWA required Traffic Monitoring System (TMS) requirement by submitting the documentation for the Illinois TMS. The different components within the TMS have been updated and included in ITMG. During the annual Traffic meetings, PowerPoint presentations have been given on Equipment Installation processes, ACCESS Traffic Count database, GIS, locations and use of Traffic data on the IDOT’s Internet and Intranet. All of these PowerPoint presentations are made available to the districts and are saved by the central office for future use.

Illinois Traffic Monitoring Program
35
H. Strategic Highway Research Program
The Strategic Highway Research Program (SHRP) is a nationwide study conceived by the National Research Council, the principal operating agency of the National Academy of Science and the National Academy of Engineering. SHRP has six research areas: Asphalt Characteristics, Long Term Pavement Performance (LTPP), Maintenance Cost Effectiveness, Concrete Bridge Protection, Cement and Concrete, and Snow and Ice Control.
IDOT maintains 14 Permanent High Speed Weigh-In-Motion sites for the LTPP program. Through the years, several LTPP sites have been removed from the study due to pavement improvements which changes the research value of the data collected. The remaining 14 sites collect continuous axle-weight data by each of the TMG/HPMS 13-category vehicle types. LTPP sites are polled weekly via modem from the central office. Every quarter, the LTPP data that is polled is sent to the consultant contracted for the processing of the LTPP data as part of the requirements for the study. When problems in the polling of the LTPP sites are detected, the Equipment Repair manager is notified and will evaluate the equipment's operation and make the necessary repairs. Under the guidance of the DMU Repair Shop staff, the district staff may make minor repairs or equipment replacement. If this fails to resolve the problem, the DMU staff will visit the site and make the repair or determine if sensors require replacement. The district office involvement is the same as it is with our ATR station network; i.e. swapping PC boards and other components to get the station back into service as quickly as possible.

Illinois Traffic Monitoring Program
36

Illinois Traffic Monitoring Program
37
II. Traffic Maps
Traffic Maps have long been used as the method of displaying and providing AADT information to IDOT users and other requestors of traffic data. During the last few years, IDOT has been providing AADT information via the Internet and other electronic formats and gradually lessening the need for paper maps. Previously, IDOT published county level AADT maps for all counties on a five year cycle, State Primary AADT maps on a two year cycle, and Truck AADT maps on a 4 year cycle. These maps were distributed in bulk to the counties, and a limited amount of maps are requested through Map Sales during the year. The AADT maps were used in the central and district offices to respond to specific traffic location count requests. Through the use of GIS, Traffic plots can be produced by district or central office with quality close to the level of the current cartographic produced maps in a fraction of the time. The combination of the Internet AADT application, GIS produced County plots, and GIS produced Statewide AADT plots satisfies IDOT’s responsibility in responding to traffic information requests utilizing a substantial reduction in resources.

Illinois Traffic Monitoring Program
38
A. Internet AADT application
The Internet Annual Average Daily Traffic count application was available on IDOT’s website www.dot.il.gov starting in 2001. All current Annual Average Daily Traffic counts (AADT) and Truck counts are shown with the exception of estimates (ending in “9”) and unmarked counts over 10 years old. The application displays more current and complete AADT information than currently available through the use of paper traffic maps. In addition to the volume and truck AADT, other data such as year of count, street name, and marked route is available. The use of the Internet AADT application has resulted in the following benefits: • Allowed IDOT to provide quick and complete traffic count information to all
users of traffic data. • Reduce the amount of AADT phone inquiries to the district and central office. • Reduce the number of cartographic produced AADT maps. • Respond to the increasing public demand for on-line accessibility to traffic
count information. The Internet AADT application is receiving approximately 6,000 hits a month by users inquiring traffic data. The AADT Internet application is updated once a year in April with the data from the year-end GIS shapefiles.
Illinois Traffic Monitoring Program
39
B. State Primary System - AADT Plot
The State Primary System AADT maps have been produced using GIS since 2001. Every two years, nine different AADT plots are created:
• State Primary AADT, State Primary Multi-Unit AADT, State Primary Heavy Commercial AADT
• Chicago area AADT, Chicago area Multi-Unit AADT, Chicago area Heavy Commercial AADT
• East S. Louis area AADT, East St. Louis area Multi-Unit AADT, East St. Louis area Heavy Commercial AADT
These plots are created by OP&P and are converted into a PDF file. The PDF files are placed on IDOT’s website www.dot.il.gov/trafficmaps/table.htm and are available to download.
C. GIS County Traffic Plots
Using GIS, county Traffic plots can be produced by the central office when requested by the districts. While these plots are not as detailed as the cartographic produced maps used in the past, the plots can be created as soon as all of the new AADTs are in the current GIS shapefiles. The plots will be converted to a PDF format for viewing and an EPS format for printing from ArcView.

Illinois Traffic Monitoring Program
40
D. Urban Area and City Traffic Maps
Due to the electronic distribution of AADT via the Internet, the need for a large amount of city and urban area traffic maps has been reduced. Since only a few cities have complete street graphics in GIS, city traffic maps and urban area traffic maps can not be generated using the same process as the County based GIS plots. There are three choices available when these types of traffic maps are required by the districts:
• Cartographic produced city traffic maps • Using the city TIFF and labeling within GIS • Using GIS when city streets become available
City maps can still be submitted on paper to the central office by marking up the latest city base map with the current AADTs and color banding the routes above the minimum AADT. If paper maps are used, follow the instructions in the Work submittal Guidelines for City AADT maps that are currently in use. Due to resource issues for the cartographers, the city traffic maps will be scheduled when time permits. The district can request to OP&P for a city TIFF file that is projected for use in GIS. By adding the TIFF file into GIS, AADTs can be labeled individually and saved within GIS. As OP&P completes more of the municipal streets on GIS, additional city traffic maps can be produced in GIS similar to the County based GIS plots.
APPENDIX A
Illinois Vehicle Classification summary

Illinois Vehicle Classification summary September 2000
1
Introduction The Illinois Department of Transportation (IDOT) proposes to modify the methods used to collect vehicle classification data for the Federal Highway Administration’s (FHWA) Highway Performance Monitoring System (HPMS). We intend to accurately collect three vehicle classification categories at 10,000 locations biennially and to expand those counts to the required 13 HPMS categories using historical data. Background For several years, IDOT has experienced wide fluctuations in truck counts. These fluctuations are related to imprecision and inaccuracies associated with data collection methods, equipment and samples. Since 1980, the Department has conducted 13-category classification counts on 300 sample sections on a 3-year cycle (100 sections annually) as required by FHWA. Each year the vehicle type distribution obtained from these counts is applied against total VMT to report travel by vehicle type (published in FHWA’s Highway Statistics). The following chart illustrates the fluctuations reported for Illinois over the last 15 years in the Total traffic, Total Trucks, Multi-Unit (MU), and Single-Unit (SU). A combination of road tube and manual counts was used to collect the truck data.
Prior to 1993, an extensive manual count program was employed statewide to report travel by vehicle type in eight categories for publication in IDOT’s Illinois Travel Statistics. Between five hundred and one thousand manual counts were conducted annually by IDOT staff. In addition, portable machine counts at 100 sample sections were used to expand results of the 8-category manual counts to the 13 vehicle categories required for HPMS.
Truck Vehicle Mile Traveled (VMT) percent change 1984-1999
-10.0%
0.0%
10.0%
20.0%
30.0%
1984
1986
1988
1990
1992
1994
1996
1998ye
arly
per
cent
cha
nge
Total TrafficTotal TrucksMulti-UnitSingle-Unit
Illinois Vehicle Classification summary September 2000
2
The extensive manual count program was stopped in the early 1990’s due to staffing shortages created by an Early Retirement Incentive offered to State employees. Another factor contributing to the change was the obsolescence of the factors used to expand 12 hour truck counts to 24 hour counts. Since that time, the 100 annual HPMS classification counts have been the primary source of Truck data for the Department. Even though total VMT growth has been relatively constant over the past 15 years, there has been significant spiking in truck VMT growth. In fact, we have reported annual MU truck VMT growth of over 10% twice and under 1% twice in the past 7 years. Part of this roller-coaster variability can be attributed to our conversion from strictly manual counts to a combination of manual and machine truck counts during 1993 and 1994. However, the bulk of the problem is related to sample size. Total VMT is determined from approximately 18,000 counts a year, while only 100 counts are used to determine truck VMT. If truck data is collected on Marked Routes at 10,000 short term count locations, Illinois will have almost full coverage of the higher functional classes of roadways. This will yield more consistent and accurate truck data than existing methods which rely on a small sample. Traditional Data Collection Methods and Equipment Road Tubes: Road tubes are the most economical method of obtaining portable axle classification counts on a statewide road network. However, Illinois has experienced four major problems collecting axle classification with road tubes. • Road tubes fail on high AADT roads. The last time Illinois used road tubes for
classification in the Chicago area in 1995, we had terrible results. Simply stated, the road tubes would not stay down on our high AADT routes. Since 55% of the total VMT in Illinois is located in the Chicago area, our classification data was suspect.
• The amount of time spent on and near multi-lane roadways to install multiple road tubes at higher AADT locations creates an unacceptable risk for our Traffic staff.
• Road tubes do not classify correctly on congested roads. Simultaneous hits on the road tubes lead to incorrect classification.
• Six lane roads are impossible to classify with road tubes unless there is a median where the counter can be placed.
In summary, Illinois has experienced up to 10% unclassified vehicles when we use road tubes to collect classification data. The need to distribute these unclassified vehicles to the 13 categories significantly contributes to the inconsistency of the truck counts. Manual Counts: If road tubes can not be used for classification, manual counts are used. However, there are several drawbacks to using manual counts for classification. • Manual counts are very expensive. • Manual counts are not as accurate as machine counts because they introduce
human error during the 12 hour period. • 12-hour counts require the use of outdated expansion factors to create 24 hour
counts. While updated expansion factors could be created through a large scale 24-hour manual count program, counting at night is discouraged by IDOT for safety reasons.

Illinois Vehicle Classification summary September 2000
3
Considerations for New Equipment During the last five years, IDOT has expended considerable effort to evaluate new traffic counting equipment. To accomplish this, we have tested a small numbers of several different devices, attended the NATMEC conferences and invited equipment vendors to display and demonstrate their products. The factors we considered in selecting new equipment (in priority order) were • the safety of the worker. • the quality and quantity of the data collected. • the cost to the Department. Based on our evaluations, we have selected the NuMetrics Hi-Star traffic counter (Model # NC97) for our state system volume counts. Safety: The Hi-Stars are taped (or nailed in with covers depending on ADT) in the center of each lane. We have purchased high powered Hilti nail and screw guns for faster installation of the protective Hi-Star cover. As a result, the amount of time that field personnel spend on the roadway installing the devices has been significantly reduced. In addition, the amount of time spent on or near the roadway collecting classification counts has been reduced by a factor of 4. This reduced exposure to the traffic is of paramount importance. Classification Data: One of the byproducts of the Hi-Star magnetic lane sensor technology is that vehicle classification by length can be collected with the same amount of effort and cost as the collection of the volume data. Since the Hi-Stars will enable us to collect truck data at 100% of our traffic count locations on the State system, we will obtain thousands of truck counts throughout the state on a two year cycle. This will comply with the new TMG recommendation that truck data be collected at 30% or more of the volume locations. While we have made a serious investment in the Hi-Star counters, we continue to investigate non-intrusive technologies that could provide accurate portable classification counts at a reasonable cost. IDOT Truck Data Publications Historically IDOT has published data on 8 vehicle types, grouped into 3 major categories: Passenger Vehicles; Single Unit Trucks; and Multi-Unit Trucks. Since the advent of HPMS, the department has added the 13 vehicle categories required by FHWA into the classification data mix. Even though our travel publications detail the 8 vehicle types and our HPMS reports identify the 13 FHWA categories, we have determined that the primary use of truck data in Illinois is satisfied at the 3 major category level. Therefore, future IDOT publications will ultimately identify only the three major categories that are collected for our entire network using the Hi-Stars. As discussed below, we will continue to report the 13 HPMS categories to FHWA. Length based Classification The magnetic lane counters are able to accurately measure the length of vehicles. By using machine comparisons, manual observations, vehicle measurements, and ATR

Illinois Vehicle Classification summary September 2000
4
classification data, we have developed length bins that reasonably represented the 3 major classification categories. In addition, we have been able to allocate the 13 HPMS vehicle types into the 3 major categories, as shown below. Length (feet) 3 Categories 13 FHWA/HPMS Categories
0-21 Passenger Vehicles F1, F2, F3 22-40 Single-Units F4, F5, F6, F7 40+ Multi-Units F8, F9, F10, F11, F12, 13
Overview: At several of our continuous weigh-in-motion sites, we were able to accumulate vehicle data by vehicle length and axle classification on more than 100,000 vehicles. Prior to any calculations, we edited the classification data from the continuous site to eliminate obvious miss-classified vehicles. We took the mean length of each federal 13 category classification and included the range of one standard deviation from the mean. The following chart displays the results of our analysis.
Determining Length Bins: We begin the process of determining the appropriate length bins by physically measuring vehicles that would fall in the three different categories (PV,SU,MU). We installed Hi-Stars on Interstate 55 and Illinois 29 and conducted daily sequential studies to see the different lengths of vehicles on the roads. We noticed very few vehicles fell within the 36-40 foot range. We then conducted one-hour sequential studies along with corresponding manual counts to compare the data and fine tune the length ranges. At this point the breakdown between SU and MU seems to fit in the 36-40 foot range. However we did notice an approximate equal distribution of vehicles with
F 0 1
F 0 2
F 0 3
F 0 4
F 0 5
F 0 6
F 0 7
F 0 8
F 0 9
F 1 0
F 1 1
F 1 2
F 1 3
0 2 0 4 0 6 0 8 0V e h ic le L e n g th (fe e t)
F 0 1
F 0 2
F 0 3
F 0 4
F 0 5
F 0 6
F 0 7
F 0 8
F 0 9
F 1 0
F 1 1
F 1 2
F 1 3
A x le C la s s if ic a tio n vs L e n g th C la s s if ic a tio n
M u lti-U n itS in g le U n it

Illinois Vehicle Classification summary September 2000
5
18, 19, 20, 21, and 22 foot lengths. After conducting additional manual count comparisons against vehicles that fell in those categories, we set the length range at 21 foot for Passenger Vehicles. Using the 0-21, 22-40, 40+ length bins, we made many comparisons between Hi-Star and classification from a Peek 241 using road tubes. After reviewing the results, we noticed a higher total volume of trucks. However, every vehicle was classified with the Hi-Star, while the tube counters would have approximate 5% unclassified vehicles. We compared the 0-21, 22-40, 40+ length bins against the data from the continuous count classification sites and noticed a good correlation. The only category that did not fall into the appropriate 3 category scheme was buses. The longer buses would fall into the MU category. Buses are single-unit vehicles and should be placed in the SU category. As we obtain more data, the dividing point between SU and MU categories was moved from 36 to 40 in order to classify a more accurate amount of SU vehicles. 10,000 Truck counts Biennially Currently IDOT conducts trucks counts at the 100 HPMS sites annually, and full truck coverage every 4 years for use on the Truck AADT maps. Every other year IDOT conducts volume counts for all of our Interstate, US and Illinois marked routes. Using the Hi-Stars at those volume locations, we will be able to obtain complete coverage of the truck classification by length for our marked routes. The Truck VMT on marked routes is 90% of the total Truck VMT in Illinois. Rather than using the 100 HPMS samples to derive the Truck percentages, we will have complete coverage for the higher functional class Marked Routes. We will have limited truck coverage on the lower functional class roads that carry the rest of the Truck volumes. Using those counts will give us a larger sample for those lower functional class roads than the very few HPMS classification sites. Ongoing Verification of Length Bins At our new continuous count classification locations and existing weigh-in-motion sites, we are able to accumulate vehicle data by vehicle length and axle classification. We intend to build a comprehensive database that will eventually contain millions of vehicle classification records that will give us detailed data to fine tune the length categories if required. Converting 3 length categories to 13 HPMS categories Initially, we will use the data from previous HPMS submittals to expand the 3 length categories to the 13 HPMS categories. The information that we are currently collecting at our permanent classification sites will assist us in fine tuning the percentages used in expanding the 3 length categories to the 13 HPMS axle classification categories, if that conversion is still needed in the future.

Illinois Vehicle Classification summary September 2000
6
Conclusion Illinois currently has sufficient Hi-Star portable count equipment to conduct the 10,000 short term counts in 3 length based classification for our Marked route system. This will give Illinois nearly full coverage for truck counts at the higher functional classes every two years and eliminate our current reliance on limited sample data. We will use this information to publish travel by vehicle type in the 3 major categories on Illinois roads. In addition, the 3 categories can be converted to the 13 HPMS categories by either the State or FHWA using historical data from our HPMS submittal. The end result of using the 3 length based categories will be more accurate, reliable, and consistent truck VMT.

APPENDIX B
FHWA approval of Illinois’ Vehicle length-based classification


APPENDIX C
HPMS unmarked count cycle agreement - FHWA


APPENDIX D
Abbreviations

Abbreviations used in the Illinois Traffic Monitoring Program
AADT Annual Average Daily Traffic ADT Average Daily Traffic ATR Automatic Traffic Recorders CATS Chicago Area Transportation Study DMU Data Management Unit FAP Federal aid Primary FAU Federal aid Urban FHWA Federal Highway Administration GIS Geographic Information System IDOT Illinois Department of Transportation IRIS Illinois Roadway Information System ITS Intelligent Transportation Systems HPMS Highway Performance Monitoring System LTPP Long Term Pavement Performance NHS National Highway System OP&P Office of Planning and Programming SHRP Strategic Highway Research Program SPR State Planning and Research TMG FHWA’s Traffic Monitoring Guide TMS Traffic Monitoring Systems TSC IDOT’s Traffic systems Center VMT Vehicle Miles of Travel
APPENDIX E
FHWA approval of the Illinois Traffic Monitoring Program