Illinois Department of Revenue Annual Report
92
Illinois Department of Revenue Fiscal Year 2003 Annual Report of Collections and Distributions
Transcript of Illinois Department of Revenue Annual Report

Illinois Department of Revenue
Fiscal Year 2003
AnnualReportofCollectionsandDistributions

2 Illinois Department of Revnue
F I S C A L Y E A R 2 0 0 3 A N N U A L R E P O R T

F I S C A L Y E A R 2 0 0 3 A N N U A L R E P O R T
Illinois Department of Revnue 3
Table of ContentsAlternative Payment and Filing Options
Graph 1: Dollars and Documents Processed ................................................................................................................................ 7Electronic Funds Transfer (EFT)
EFT Program ................................................................................................................................................................................... 7Graph 2: EFT Program Dollars Collected ..................................................................................................................................... 7
Lockbox ProgramGraph 3: Lockbox Processing Dollars Collected ........................................................................................................................ 8
Individual Income Tax Alternative Filing and Payment Optionse-File ................................................................................................................................................................................................ 8TeleFile ............................................................................................................................................................................................. 8I-File .................................................................................................................................................................................................. 8PC File .............................................................................................................................................................................................. 8Graph 4: Income Tax Alternative Filing Options ......................................................................................................................... 9Credit Card Payments ................................................................................................................................................................... 9Electronic Funds Withdrawal ........................................................................................................................................................ 9
Sales Tax Alternative Filing OptionsTeleFile ............................................................................................................................................................................................. 9Electronic Data Interchange (EDI) ............................................................................................................................................... 9
Total Revenue CollectedTable 1: Total Revenue Collected .............................................................................................................................................. 10
Income TaxesIndividualsTable 2: Illinois Income Tax Rate History ..................................................................................................................................... 12Table 3: Individual Exemption History ......................................................................................................................................... 12Table 4: Individual Income Tax Filing Status ............................................................................................................................... 12Table 5: Individual Income Tax returns Filed by Adjusted Gross Income — Tax Year 2002 .................................................. 13Table 6: Property Tax Credit, Education Expense Credit, and Earned Income Credit Amounts ........................................ 13Graph 5: Illinois Individual Income Tax — Property Tax Relief .................................................................................................... 13Individual Income Tax Credits ......................................................................................................................................................... 13
CorporationsTable 7: Corporate Liability Stratification for Income and Replacement Taxes — Tax Year 2001 ...................................... 14Graph 6: Illinois Corporate Income Tax Credits, Schedule 1299-D ........................................................................................... 14Table 8: Corporate Income Tax Credit Profile ........................................................................................................................... 15
DistributionTable 9: Individual and Corporate Income Tax Receipts by Fund ......................................................................................... 15Graph 7: Individual and Corporate Receipts ............................................................................................................................. 15Table 10: Income Tax Collections and Refunds .......................................................................................................................... 15Table 11: Individual Income Tax Refunds .................................................................................................................................... 16Table 12: Income Tax Refund Fund Deposits per the Office of the Comptroller .................................................................... 16Graph 8: Individual Income Tax Average Refund ...................................................................................................................... 16
Income Tax CheckoffsGraph 9: Checkoff Dollars Donated ............................................................................................................................................ 16Table 13: Checkoff Dollars Donated by Tax Year ....................................................................................................................... 17
Sales TaxesTable 14: Sales Tax Rates History ................................................................................................................................................... 18Table 15: State Sales Tax Collections ........................................................................................................................................... 19Graph 10: State Sales Tax Collections ........................................................................................................................................... 19Table 16: Sales Tax Reported by Type of Business ...................................................................................................................... 19Graph 11: Sales Tax Reported by Type of Business for Fiscal Year 2003 ..................................................................................... 19
DistributionSales Taxes ......................................................................................................................................................................................... 20Use Taxes ............................................................................................................................................................................................ 20
Local Taxes Collected by the Department .................................................................................................................................... 20Manufacturer’s Purchase Credit ...................................................................................................................................................... 21
Graph 12: MPC Used .................................................................................................................................................................. 21

4 Illinois Department of Revnue
F I S C A L Y E A R 2 0 0 3 A N N U A L R E P O R T
Other Sales or Renting Taxes and FeesAutomobile Renting Occupation and Use Taxes .......................................................................................................................... 22
Graph 13: Automobile Renting Occupation and Use Taxes Collections ............................................................................. 22
Replacement Vehicle Tax ................................................................................................................................................................ 23Graph 14: Replacement Vehicle Tax Collections .................................................................................................................... 23
Tire User Fee ....................................................................................................................................................................................... 23Graph 15: Tire User Fee Collections ........................................................................................................................................... 23
Vehicle Use Tax ................................................................................................................................................................................. 24Table 17: Vehicle Use Tax Rates .................................................................................................................................................. 24Table 18: History of Vehicle Use Tax Rates ................................................................................................................................. 24Graph 16: Vehicle Use Tax Collections ...................................................................................................................................... 24
Motor Fuel TaxesMotor Fuel and Motor Fuel Use Taxes ............................................................................................................................................. 25
Table 19: Motor Fuel Tax Rate History ........................................................................................................................................ 25Table 20: Motor Fuel Gallonage History .................................................................................................................................... 25Table 21: Motor Fuel Tax Collections and Refunds .................................................................................................................. 26Table 22: Motor Fuel Tax Refunds for Nonhighway Use ........................................................................................................... 26Graph 17: Motor Fuel Tax Collections ....................................................................................................................................... 26
Underground Storage Tax and Environmental Impact Fee .......................................................................................................... 27Graph 18: UST and EIF Collections ............................................................................................................................................. 27
Excise and Utility TaxesCigarette and Cigarette Use Taxes ................................................................................................................................................. 28
Table 23: Cigarette Tax Rate History .......................................................................................................................................... 28Graph 19: Cigarette and Cigarette Use Tax Collections ........................................................................................................ 28
Coin-operated Amusement Device and Redemption Machine Tax .......................................................................................... 29Graph 20: Coin-operated Amusement Device and Redemption Machine Tax Collections ............................................ 29
Dry-cleaning Solvent Tax and License Fees .................................................................................................................................. 30Graph 21: Dry-cleaning Solvent Tax and License Fees Collections ....................................................................................... 30
Electricity Excise Tax ......................................................................................................................................................................... 31Table 24: Electricity Excise Tax Rate History ............................................................................................................................... 31Graph 22: Electricity Excise Tax Collections ............................................................................................................................. 31
Energy Charges ................................................................................................................................................................................. 32Graph 23: Energy Charges Collections .................................................................................................................................... 32
Gas Revenue Tax .............................................................................................................................................................................. 33Table 25: Gas Revenue Tax Rate History ................................................................................................................................... 33Graph 24: Gas Revenue Tax Collections .................................................................................................................................. 33
Hotel Operators’ Occupation Tax ................................................................................................................................................... 34Table 26: Hotel Operators’ Occupation Tax Rate History ....................................................................................................... 34Graph 25: Hotel Operators’ Occupation Tax Collections ...................................................................................................... 34Table 27: Hotel Net Receipts by County ................................................................................................................................... 35
Liquor Gallonage Tax ....................................................................................................................................................................... 36Table 28: Liquor Tax Rate History ................................................................................................................................................ 36Table 29: Liquor Gallonage History ............................................................................................................................................ 36Graph 26: Liquor Gallonage Tax Collections ........................................................................................................................... 36
Oil and Gas Production Assessment ............................................................................................................................................... 37Graph 27: Oil and Gas Production Assessment Collections ................................................................................................... 37
Telecommunications Excise Tax...................................................................................................................................................... 38Table 30: Telecommunications Excise Tax Rate History ........................................................................................................... 38Graph 28: Telecommunications Excise Tax Collections .......................................................................................................... 38
Tobacco Products Tax ...................................................................................................................................................................... 39Graph 29: Tobacco Products Tax Collections .......................................................................................................................... 39

F I S C A L Y E A R 2 0 0 3 A N N U A L R E P O R T
Illinois Department of Revnue 5
Gaming TaxesBingo Tax and License Fees ............................................................................................................................................................. 40
Table 31: Bingo Tax and License Fee Collections ..................................................................................................................... 40Graph 30: Bingo Tax and License Fees Collections ................................................................................................................. 40Table 32: Bingo Tax Statistics by County .................................................................................................................................... 41
Charitable Games Tax and License Fees ...................................................................................................................................... 43Table 33: Charitable Games Tax and License Fee Collections .............................................................................................. 43Graph 31: Charitable Games and License Fees Collections ................................................................................................. 43
Pull Tabs and Jar Games Tax and License Fees ............................................................................................................................ 44Table 34: Pull Tabs and Jar Games Tax and License Fee Collections .................................................................................... 44Graph 32: Pull Tabs and Jar Games Tax and License Fees Collections ................................................................................ 44
Racing Privilege Tax .......................................................................................................................................................................... 45Graph 33: Racing Privilege Tax Collections .............................................................................................................................. 45Table 35: Racing Privilege Tax Breakdown by Fund ................................................................................................................. 45
Riverboat Gambling Taxes and License Fees ................................................................................................................................ 46Graph 34: Riverboat Gambling Collections ............................................................................................................................. 46Table 36: Riverboat Gambling Collections ............................................................................................................................... 47
Real Estate Taxes and ProgramsCircuit Breaker Property Tax Grant Program and Pharmaceutical Assistance Program
Program Explanation ................................................................................................................................................................... 48Amount Expended....................................................................................................................................................................... 48
Property TaxTable 37: Steps in the Property Tax Cycle ................................................................................................................................. 49Table 38: Comparison of Equalized Assessed Values and Taxes Extended, 2000 and 2001 ............................................... 50Graph 35: Tax Year 2001 Extensions by Class ........................................................................................................................... 52Graph 36: Tax Year 2001 Extensions by Type of District ........................................................................................................... 52Tax Relief Provisions ...................................................................................................................................................................... 52
Table 39: Senior Citizens Real Estate Tax Deferrals for Tax Year 2001 (paid in 2002) ....................................................... 52Property Tax Extension Limitation Law ....................................................................................................................................... 53Tennessee Valley Authority .......................................................................................................................................................... 53
Table 40: TVA Payments ........................................................................................................................................................ 53Stipends and Reimbursements ................................................................................................................................................... 54
Table 41: FY 2003 Stipends and Reimbursements .............................................................................................................. 55
Real Estate Transfer TaxTable 42: Real Estate Transfer Tax Rate History ......................................................................................................................... 56Graph 37: Real Estate Transfer Tax Collections ........................................................................................................................ 56Table 43: Real Estate Stamp Sales by County .......................................................................................................................... 57
Disbursements to Local GovernmentsTable 44: Taxes Disbursed to Local Governments ......................................................................................................................... 58
Taxes Collected for Local GovernmentsAutomobile Renting Occupation and Use Taxes ..................................................................................................................... 60
Chicago Home Rule Municipal Soft Drink Retailers’ Occupation Tax ................................................................................... 60
County Motor Fuel Tax ................................................................................................................................................................. 60
County Water Commission Taxes ............................................................................................................................................... 61
Home Rule and Non-home Rule Sales and Use Taxes ............................................................................................................. 61Table 45: FY 2003 Home Rule, Non-home Rule, and Special County ROT for Public Safety Sales Tax Disbursements .. 62
Hotel Taxes .................................................................................................................................................................................... 63Illinois Sports Facilities Tax ........................................................................................................................................................ 63Metropolitan Pier and Exposition Authority (MPEA) Hotel Tax ............................................................................................ 63Municipal Hotel Tax (Chicago) .............................................................................................................................................. 63
Mass Transit District Taxes (Metro-East Mass Transit (MED) Taxes and Regional Transportation Authority (RTA) Taxes) ..... 64Table 46: FY 2003 Regional Transportation Authority Payments ....................................................................................... 64Table 47: FY 2003 Metro-East Mass Transit District Payments ............................................................................................. 64
Metro-East Park and Recreation District Tax ............................................................................................................................. 64
Metropolitan Pier and Exposition Authority Food and Beverage Tax .................................................................................... 65
Municipal Simplified Telecommunications Tax ......................................................................................................................... 65
Replacement Vehicle Taxes (County Replacement Vehicle Tax, Municipal Replacement Vehicle Tax) ......................... 65
Special County Retailers’ Occupation Tax for Public Safety .................................................................................................. 65

6 Illinois Department of Revnue
F I S C A L Y E A R 2 0 0 3 A N N U A L R E P O R T
Revenue-sharing with Local GovernmentsGaming Taxes (Charitable Games Tax and license fees, Pull Tabs and Jar Games Tax and license fees) ....................... 66
Table 48: Charitable Games Distributions to Municipalities and Counties ..................................................................... 66Table 49: Pull Tabs and Jar Games Distributions to Municipalities and Counties ........................................................... 67
Fund Transfers to Local Governments ....................................................................................................................................... 70Population-based disbursements .......................................................................................................................................... 70Table 50: Income Tax Revenue-sharing History .................................................................................................................. 70Table 51: Summary of Income Tax/Sales Tax Distributions to Local Governments ......................................................... 70
Sales Tax Transfers for Local Transportation (Public Transportation Fund, Downstate Public Transportation Fund,Metro-East Public Transportation Fund) ................................................................................................................................ 70Table 52: FY 2003 Sales Tax Transfers for Local Transportation .......................................................................................... 70Table 53: FY 2003 Population-based Distributions of Tax Revenues Shared With Local Governments ........................ 71
Local Share of State Sales and Use Taxes ................................................................................................................................. 73Table 54: Fiscal Year 2003 Municipal and County Share of State Sales and Use Taxes ................................................. 74Table 55: Fiscal Year 2003 Countywide Share of State Sales Taxes .................................................................................. 75
Motor Fuel Taxes (collected by the Department of Revenue and distributed by the Department of Transportation) .. 73
Replacement Taxes ..................................................................................................................................................................... 76Table 56: Replacement Tax Payments by Type of District ................................................................................................. 77Table 57: Replacement Tax Payments by County ............................................................................................................. 77
Tax Increment Financing ............................................................................................................................................................. 78Table 58: Tax Increment Financing Allocations .................................................................................................................. 78
Report on Areas of Recurrent Non-complianceAudit Bureau ...................................................................................................................................................................................... 79
Bureau of Criminal Investigations .................................................................................................................................................... 79
Collection Services Bureau .............................................................................................................................................................. 79
Table 59: FY 2003 Major Enforcement Program Totals ............................................................................................................... 79
Legislation Recap for Calendar Year 2003Miscellaneous / Tax Administration ................................................................................................................................................. 80
Circuit Breaker / Pharmaceutical Assistance ................................................................................................................................ 82
Income Tax ........................................................................................................................................................................................ 82
Property Tax / Local Government ................................................................................................................................................... 83
Sales and Excise Tax ......................................................................................................................................................................... 86
Court CasesZebra Technologies Corp. v. Topinka, et al. ................................................................................................................................... 88
Envirodyne Industries, Inc. et al. v. Illinois Department of Revenue ............................................................................................ 88
Hollinger international, Inc. v. Bower, et al. .................................................................................................................................... 88
Shakkour et al. v. Bower et al. ......................................................................................................................................................... 88
Wexler et al. v. Wirtz et al. ................................................................................................................................................................ 88
Ogden Chrysler Plymouth, Inc. v. Bower ........................................................................................................................................ 89

F I S C A L Y E A R 2 0 0 3 A N N U A L R E P O R T
Illinois Department of Revnue 7
EFT$12,125,473,011
51.50%
In-house$6,149,602,731
26.12%
Lockbox$5,268,081,613
22.38%
Dollars
Total dollars processed: $23,543,157,355
Documents/number of payments
In-house 9,306,19662.59%
EFT758,9405.10%
Lockbox4,803,63632.31%
Total documents/number of payments: 14,868,772
Alternative Payment andFiling OptionsOverviewThe Illinois Department of Revenue must depositmonies within 24 hours of receipt. Electronic fundstransfer (EFT), lockbox facilities, and alternative filingmethods are used to deposit money quickly and toreduce errors associated with processing returns.
Electronic Funds Transfer (EFT)EFT is an electronic method used to pay tax liabilities.Instead of writing a check, financial institutions areinstructed to transfer the funds from the taxpayer’saccount to ours. The department applies the trans-ferred amount to the tax liability. EFT is not a way to filea return electronically.
The department receives various tax payments by EFT.The State of Illinois transmits payments for taxes with-held from its employees using this method. Riverboatgambling tax payments and fedwire transfers are alsoreceived by EFT. A taxpayer whose annual averageliability meets or exceeds a certain threshold mustparticipate in the department’s EFT program.
Note: Graph 1 shows all tax payments received by EFT;Graph 2 shows all tax payments received by the EFTprogram.
EFT ProgramThe department’s EFT program has both mandatedand voluntary participants. The Automated ClearingHouse (ACH) payment network is the primary meansof collecting EFT payments. Taxpayers may originatetheir tax payments through their financial institution(ACH credit). They also may authorize the departmentto have its bank take the money from an accountthey designate by use of interactive voice responsetelephone calls, Internet, or modem-to-modemcommunications (ACH debit). The tax dollars aretransmitted electronically to the bank thereby elimi-nating mail and check collection “float”.
Graph 1: Dollars and Documents Processed
Graph 2: EFT Program Dollars Collected
$12.13
$11.01
$10.31
$9.18
$7.66
$6.95
$6.37
$5.46
$4.30
$0 $2 $4 $6 $8 $10 $12 $14
Billions
FY95
FY96
FY97
FY98
FY99
FY00
FY01
FY02
FY03

8 Illinois Department of Revnue
F I S C A L Y E A R 2 0 0 3 A N N U A L R E P O R T
Lockbox ProgramLockbox is a service provided by a financial institutionthat enables selected taxpayers to mail their taxpayments directly to a post office box for pickup bythe financial institution. The financial institution thenprocesses and deposits the monies based ondepartment specifications. This process reduces mail“float,” check collection time, and the time necessaryto credit a taxpayer’s account. In 1986, thedepartment processed its first payment through alockbox facility. Currently, six different payment typesare processed at two different lockbox facilities.Graph 3 shows the recent decline in the lockboxprocessing volume. The department expects thisdecline to continue as more payments are processedusing the electronic funds transfer program.
Individual Income Tax AlternativeFiling and Payment OptionsThe Illinois Department of Revenue offers taxpayers achoice of several electronic filing options for FormIL-1040: e-File, TeleFile, I-File and PC File.
e-FileThrough the department’s electronic filing program,taxpayers can have Form IL-1040, Illinois IndividualIncome Tax Return, transmitted directly from tax profes-sionals’ computers to the department’s computer. Thismethod of electronic filing has been in place since 1991.The department also participates in the Internal Rev-enue Service (IRS) Federal/State Electronic Filing Pro-gram. Rather than transmit returns directly to the depart-ment, the tax professional can transmit the state returnalong with the federal return to the IRS. The IRS thenmakes the state return available for the department toretrieve electronically and process. This method ofelectronic filing has been in place since 1996. Thedepartment received 1,444,354 returns in processingyear 2003 through both electronic filing methods, a 16.6percent increase from the previous year.
TeleFileThe TeleFile method of filing an individual income taxreturn was launched in 1994, and was only offered to aselect group of taxpayers based on their previous filinghistory. Beginning in January 2000, this method isoffered to all Illinois taxpayers that meet the TeleFileprogram criteria. Taxpayers who are assigned an IllinoisPersonal Identification Number (IL-PIN) access theTeleFile system by dialing a toll-free telephone number.Voice instructions guide these taxpayers through thetelephone call, instructing them when, how, and what
Graph 3: Lockbox Processing Dollars Collected
type of entries to make from the keypad of a touch-tone telephone. The department received 128,434returns in processing year 2003 by the TeleFile method,a 6.2 percent increase from the previous year.
I-FileIn January 1999, the department introduced theInternet Filing Pilot Program to 700,000 randomlyselected taxpayers. Beginning in 2000, the program isavailable to any Illinois taxpayer who is assigned anIL-PIN and who meets the I-File program criteria. Thesetaxpayers have the opportunity to file their individualincome tax returns on our Internet web site.
By allowing taxpayers to enter the IL-PIN and the datafrom their W-2 forms, those expecting a refund havenothing to mail. The department received 120,887Internet filed returns in processing year 2003, a 39.1percent increase from the previous year.
PC FileBeginning in 2000, all taxpayers assigned an IL-PINmay use the PC Retail Software filing method.Taxpayers can purchase or obtain a tax preparationsoftware package from a retail store or bydownloading software on the Internet that containsan Illinois Individual Income Tax Return and file boththeir federal and Illinois income tax returns at thesame time. The department received 247,342PC Retail Software filed returns in 2003, a 44.4 percentincrease from the previous year.
$5.27
$5.56
$6.62
$7.93
$8.13
$8.73
$8.36
$8.33
$8.08
$0 $2 $4 $6 $8 $10Billions
FY95
FY96
FY97
FY98
FY99
FY00
FY01
FY02
FY03

F I S C A L Y E A R 2 0 0 3 A N N U A L R E P O R T
Illinois Department of Revnue 9
Graph 4: Income Tax Alternative Filing Options
Credit Card PaymentsIn addition to paying by check or money order,taxpayers may use a credit card to pay IndividualIncome Tax owed for the current tax year, prior taxyears, estimated payments, and extension payments.In FY 2003, 17,693 credit card payments totaling morethan $5.25 million were received.
Electronic Funds WithdrawalIn addition to paying by check or money order,taxpayers may pay Individual Income Tax liabilitiesowed for the current tax year by having the amountowed debited from their checking or savings ac-counts. In FY 2003, 30,635 electronic funds withdrawalpayments totaling $3,597,447 were received.
Sales Tax Alternative Filing OptionsTeleFileThe Sales Tax TeleFile Program was implemented inNovember 1999, but only those with relatively simplesales tax returns could participate. In May 2002, theprogram was expanded to include use tax reporting.The direct debit payment feature was also added.The program was further expanded in October of 2003so that taxpayers who are required to report theirliquor sales and those who want to apply a prior
0
200,000
400,000
600,000
800,000
1,000,000
1,200,000
1,400,000
1,600,000
1,800,000
2,000,000
Num
be
r of I
L-10
40 fo
rms
Internet 11,191 43,538 62,556 86,881 120,887
P C R etail So ftware 51,195 108,501 171,232 247,342
TeleF ile 14,008 24,229 111,670 190,406 119,654 74,727 172,367 147,014 120,963 128,434
Electro nic F iling 107,299 154,016 310,711 378,505 495,423 631,171 811,927 957,297 1,238,563 1,444,354
To tal 121,307 178,245 422,381 568,911 615,077 717,089 1,079,027 1,275,368 1,617,639 1,941,017
1994 1995 1996 1997 1998 1999 2000 2001 2002 2003
overpayment of tax could use the TeleFile Program. InJanuary 2004, a Spanish-speaking script was added.
Taxpayers receive a personal identification number toaccess the toll-free TeleFile system. Taxpayers areprompted to enter information from the telephonekeypad. The TeleFile system computes math, eliminat-ing arithmetic mistakes. The department received16,676 TeleFile Form ST-1 returns (returns only) in fiscalyear 2003.
Electronic Data Interchange (EDI)The department initiated the Form ST-1 ElectronicData Interchange (EDI) Program in September 2000.The program is voluntary and only Form ST-1, Sales andUse Tax Return, and Form ST-2, Multiple Siteattachment, can be filed electronically. The programis an electronic exchange of business documents fromone company’s computer to another’s computer inmachine-processable, national standard dataformats. Participants in the program include taxpayerswho are required to file Form ST-1; trading partnersformatting EDI interchanges; transmitters transmittingdirectly to the department’s communicationsprocessor; and software developers supporting EDI.The department received 165 Form ST-1 returns by EDIin fiscal year 2003.

10 Illinois Department of Revnue
F I S C A L Y E A R 2 0 0 3 A N N U A L R E P O R T
Total Revenue CollectedTable 1: Total Revenue Collected (1)
Section 1: State Taxes and Fees Collections (2) FY 2001 FY 2002 FY 2003Income Taxes1 Corporate Income Tax 1,302,558,427 1,042,682,985 $ 921,586,9262 Individual Income Tax 8,617,847,075 8,090,152,509 7,976,979,8273 Personal Property Replacement Income Tax 942,653,146 746,786,810 761,126,499
A. Total Income Taxes $ 10,863,058,648 $ 9,879,622,304 $ 9,659,693,252
Sales Taxes1 Retailers’ Occupation, Use, Service Occupation, Service Use 8,014,161,192 8,266,932,058 8,118,945,8372 Other Sales or Renting Taxes and Fees
a Automobile Renting Occupation and Use Taxes 31,730,257 28,978,931 27,341,198b Replacement Vehicle Tax 1,233,808 1,337,011 1,492,275c Tire User Fee 6,448,167 6,259,881 6,662,296d Vehicle Use Tax 38,999,471 42,328,377 40,659,305
B. Total Sales Taxes $ 8,092,572,895 $ 8,345,836,258 $ 8,195,100,911
Motor Fuel Taxes1 Motor Fuel and Motor Fuel Use Taxes 1,296,026,938 1,299,068,873 1,323,322,1002 Underground Storage Tank Tax and Environmental Impact Fee 73,658,542 69,446,083 72,387,628
C. Total Motor Fuel Taxes $ 1,369,685,480 $ 1,368,514,956 $ 1,395,709,728
Excise Taxes1 Cigarette and Cigarette Use Taxes 470,352,315 464,508,645 643,123,9952 Coin-operated Amusement Device Tax 1,307,615 1,298,772 1,144,6553 Dry-cleaning Solvent Tax and License Fees 1,771,326 1,648,968 1,518,2154 Electricity Excise Tax 367,730,929 317,240,916 353,290,6975 Energy Assistance and Renewable Energy Charges 92,619,239 92,592,764 95,511,4066 Gas Revenue Tax 150,560,390 109,522,250 144,262,9547 Hotel Operators’ Occupation Tax 170,013,089 149,658,344 150,727,7888 Invested Capital Tax and Electricity Distribution Tax 183,470,954 177,571,534 177,285,1099 Liquor Gallonage Tax 140,118,688 141,093,445 142,756,272
10 Oil and Gas Production Assessment 293,911 259,346 301,48811 Telecommunications Excise Tax 793,188,882 756,300,376 657,347,64812 Telecommunications Infrastructure Maintenance Fee 36,872,412 34,764,947 32,036,18213 Tobacco Products Tax 17,317,691 17,753,571 18,301,531
D. Total Excise Taxes $ 2,425,617,441 $ 2,264,213,878 $ 2,417,607,940
Gaming Taxes1 Bingo Tax and License Fees 5,190,765 4,904,218 4,665,8692 Charitable Games Tax and License Fees 160,632 156,720 153,8353 Pull Tabs and Jar Games Tax and License Fees 7,918,236 7,596,099 7,690,8454 Racing Privilege Tax 12,815,513 12,388,203 12,222,2065 Riverboat Gambling Taxes and Fees 528,547,545 570,672,511 691,261,635
E. Total Gaming Taxes $ 554,632,691 $ 595,717,751 $ 715,994,390Other Collections1 Miscellaneous (3) 770,852 696,251 696,8242 Pharmaceutical Assistance 4,485,037 7,571,238 3,961,4873 Qualified Solid Waste Energy Facility Payment (4) 100,220 359,168 298,0384 Real Estate Transfer Tax 59,584,436 62,981,829 72,439,4025 Senior Citizens Real Estate Tax Deferral 2,319,222 3,472,658 2,938,5946 Tennessee Valley Authority (TVA) 68,469 77,519 81,577
F. Total Other Collections $ 67,328,236 $ 75,158,663 $ 80,415,922
Total Section 1: State Collections (A+B+C+D+E+F) $ 23,360,655,875 $ 22,529,063,810 $ 22,464,522,143

F I S C A L Y E A R 2 0 0 3 A N N U A L R E P O R T
Illinois Department of Revnue 11
Table 1: Total Revenue Collected (1) (continued)Section 2: Taxes Collected for Local Governments (5) FY 2001 FY 2002 FY 2003Automobile Renting Occupation and Use Taxes1 County Automobile Renting Occupation and Use Taxes 78,180 104,006 48,3192 MPEA Automobile Renting Occupation and Use Taxes 26,945,368 24,050,677 21,335,6143 Municipal Automobile Renting Occupation and Use Taxes 5,761,105 5,217,889 4,870,704
A. Total Automobile Renting Occupation and Use Taxes $ 32,784,653 $ 29,372,572 $ 26,254,637
B. Chicago Soft Drink Tax $ 8,071,991 $ 7,960,115 $ 8,173,372
C. County Motor Fuel Tax $ 27,292,721 $ 26,653,660 $ 28,267,307
D. County Water Commission Tax $ 33,324,122 $ 32,665,268 $ 31,262,606
E. Home Rule and Non-home Rule Sales Taxes $ 682,323,787 $ 691,127,245 $ 735,332,256
Hotel Taxes1 Illinois Sports Facilities Tax 27,222,223 23,474,429 24,395,8482 MPEA Hotel Tax 31,736,059 27,366,872 28,441,0763 Municipal Hotel Tax (Chicago) 13,750,046 11,856,981 12,322,392
F. Total Hotel Taxes $ 72,708,328 $ 62,698,282 $ 65,159,316
G. Mass Transit District Sales and Use Taxes $ 537,851,021 $ 656,548,287 $ 653,845,504
H. Metro-East Park and Recreation District Tax (6) $ 0 3,096,778 $ 3,558,619
I. MPEA Food and Beverage Tax $ 23,106,600 $ 22,298,284 $ 23,456,015
J. Municipal Simplified Telecommunications Tax (7) $ 0 $ 0 $ 98,800,419
Replacement Vehicle Taxes1 County Replacement Vehicle Tax 243 102 5542 Municipal Replacement Vehicle Tax 46,150 52,645 60,292
K. Total Replacement Vehicle Taxes $ 46,393 $ 52,747 $ 60,846
L. Tennessee Valley Authority (TVA) $ 159,760 $ 180,877 $ 190,347
M. Special County Retailers’ Occupation Taxfor Public Safety $ 17,821,985 $ 22,474,392 $ 25,312,365
Total Section 2: Taxes Collected for Local Governments(A+B+C+D+E+F+G+H+I+J+K+L+M) $ 1,435,491,361 $ 1,442,718,014 $ 1,699,673,609
Collections Grand Total (Section 1+ Section 2) $ 24,808,386,752 $ 23,971,781,824 $ 24,164,195,752
Table 1 Footnotes(1) Amounts reported represent dollars remaining after the return is processed, any adjustments have been made to the
account, and any credits or refunds have been issued. “Collections Grand Total” figures do not match Graph 1, whichrepresents dollars deposited before the return was processed.
(2) Amounts reported in Section 1 include amounts subsequently disbursed to units of local government in the form of revenue-sharing as mandated by various Illinois tax acts. See Table 44 and “Revenue-sharing with Local Governments” for moreinformation.
(3) Includes jury duty refunds, duplicate payments, insurance claims, and tax forms.
(4) Payments were required to be sent to the department effective January 2001.(5) These taxes are locally-imposed taxes that the department collects for the governmental unit that imposes the tax. State
revenues that are “shared” with units of local government are shown in Table 44.(6) Imposed July 1, 2001.(7) First collections were January 1, 2003.

12 Illinois Department of Revnue
F I S C A L Y E A R 2 0 0 3 A N N U A L R E P O R T
Income TaxesStatutory Reference35 ILCS 5/101 to 5/1701
DefinitionThe Illinois Income Tax is imposed on every individual,corporation, trust, and estate earning or receivingincome in Illinois. The tax is calculated by multiplying netincome by a flat rate. The Illinois Income Tax is based, toa large extent, on the federal Internal Revenue Code.
IndividualsThe rate is 3 percent of net income. The starting pointfor the Illinois Individual Income Tax is federal adjustedgross income. Federal adjusted gross income is “in-come” minus various deductions (not including item-ized deductions, the standard deduction, or anyexemptions). Next, the federal adjusted gross incomeis changed by adding back certain items (e.g.,federally tax-exempt interest income) and subtractingothers (e.g., federally taxed retirement and SocialSecurity income). The result is “base income.”
The base income earned in Illinois or while a resident ofIllinois is then reduced by the number of federallyclaimed exemptions plus any additional exemptions. Theamount of each standard exemption is $2,000. Additionalexemptions are allowed for any taxpayer or spouse whowas either 65 years of age or older, legally blind, or both($1,000 each). The total exemption amount is deductedfrom base income to arrive at “net income.” The tax rateis then applied against net income.
Illinois Income Tax must be withheld by an employer iffederal income tax is withheld on
compensation (i.e., wages and salaries) paid inIllinois, andgambling or lottery winnings paid in Illinois.
An employee may also enter a voluntary withholdingagreement with the employer.
Illinois Income Tax is not withheld from
compensation paid to residents of Iowa, Kentucky,Michigan, and Wisconsin, due to reciprocalagreements with each of these states andcertain other types of compensation and payments.
Table 2: Illinois Income Tax Rate History
Effective date Individuals Corporations
August 1, 1969 2.5 percent 4.0 percentJanuary 1, 1983 (1) 3.0 percent 4.8 percentJuly 1, 1984 2.5 percent 4.0 percentJuly 1, 1989 (2) 3.0 percent 4.8 percentJuly 14, 1993 (3) 3.0 percent 4.8 percent(1) First 20 percent surcharge(2) Second 20 percent surcharge(3) Rate made permanent, retroactive to July 1, 1993.
Table 3: Individual Exemption HistoryTax Standard Additionalyear exemption exemptions
1969 $1,000 As on federal return*1987 $1,000 $ 01990 $1,000 $1,0001998 $1,300 $1,0001999 $1,650 $1,0002000 $2,000 $1,000
* Additional exemptions for blind and elderly (i.e., age 65 orolder) were provided through the federal income tax return.These exemptions were subsequently repealed at the federallevel by the Federal Tax Reform Act of 1986, effective for taxyear 1987.
Table 4: Individual Income Tax Filing StatusTaxpayer 2001 2002status returns returnsSingle* 3,343,148 3,255,506Married, filing jointly 2,255,874 2,236,240Married, filing separately 76,824 71,115Total 5,675,846 5,562,861
* Includes single, head of household, and widowed.

F I S C A L Y E A R 2 0 0 3 A N N U A L R E P O R T
Illinois Department of Revnue 13
Graph 5: Illinois Individual Income Tax — PropertyTax Relief
Individual Income Tax CreditsProperty tax relief for real estate taxes paid on one’sprincipal residence has been provided to IllinoisIndividual Income Tax filers by various means since taxyear 1983. A single deduction for property taxes paidwas in effect for tax years 1983 through 1988; a doublededuction for property taxes paid was in effect for taxyears 1989 and 1990. The current 5 percent creditbegan in tax year 1991.
Beginning with tax year 2000, taxpayers who spendmore than $250 for qualifying education expensesmay receive a credit for 25 percent of the amountover $250, up to a maximum of $500. An Illinois EarnedIncome Credit, equal to 5 percent of the federal taxcredit, was also allowed beginning in tax year 2000.
Table 5: Individual Income Tax returns Filed by Adjusted Gross Income — Tax Year 2002No. claiming Property
Adjusted gross No. of Total No. of Tax property tax creditincome (AGI) returns AGI exemptions liability tax credit amount
Less Than Zero 51,713 $ (2,477,509,602) 93,069 $ 770,253 288 $ 87,997$0 — $5,000 492,616 1,283,432,142 504,624 19,798,095 11,418 400,395
$5,001 — $15,000 888,370 8,734,059,935 1,491,979 152,077,545 122,110 8,549,070$15,001 — $25,000 753,295 14,938,079,468 1,595,139 304,379,298 181,439 16,188,583$25,001 — $50,000 1,308,453 47,569,134,503 2,893,206 1,107,069,937 576,982 61,004,513$50,001 — $100,000 1,206,013 84,597,723,080 3,400,516 2,075,926,000 915,918 134,141,565
$100,001 — $500,000 491,056 $79,024,954,744 1,556,737 2,115,657,931 436,329 113,483,291$500,001 & more 25,591 $35,991,852,006 84,766 1,072,865,545 23,961 14,226,509
Subtotal resident returns 5,217,107 $ 269,661,726,276 11,620,036 $ 6,848,544,604 2,268,445 $ 348,081,923
Nonresidents and residents withinvalid Illinois Zip Codes 345,754 $60,652,494,076 764,135 377,601,031 37,007 7,470,341
Total 5,562,861 $ 330,314,220,352 12,384,171 $ 7,226,145,635 2,305,452 $ 355,552,264
Table 6: Property Tax Credit, Education Expense Credit, and Earned Income Credit Amounts
Property tax Education Expense Earned IncomeTax Number Credit Number Credit Number Credityear of returns amount of returns amount of returns amount1993 2,056,462 $ 203,093,478 — — — —1994 2,099,241 218,690,218 — — — —1995 2,182,997 239,410,806 — — — —1996 2,231,165 258,704,032 — — — —1997 2,237,539 273,854,726 — — — —1998 2,255,864 287,911,422 — — — —1999 2,275,646 303,400,238 — — — —2000 2,296,883 317,933,001 165,781 $ 61,233,025 542,070 $ 39,921,2062001 2,337,890 337,404,976 189,055 68,444,006 584,223 44,147,5012002 2,305,452 $ 355,552,264 185,005 $ 66,518,652 645,973 $ 50,829,816
$355.6
$337.4
$317.9
$303.4
$287.9
$273.9
$258.7
$239.4
$218.7
$203.1
0 100 200 300 400
Millions
1993
1994
1995
1996
1997
1998
1999
2000
2001
2002

14 Illinois Department of Revnue
F I S C A L Y E A R 2 0 0 3 A N N U A L R E P O R T
CorporationsThe rate for corporations is 4.8 percent of net income.The rate for trusts and estates is 3 percent of net income.
(Note: These rates apply to income tax only. See“Replacement Taxes.”)
Generally, S corporations and partnerships do not paythe Illinois Corporate Income Tax. However, corpora-tions, S corporations, partnerships, and trusts arerequired to pay Personal Property Replacement Tax.Income from these entities is generally passed on toowners who, in turn, must report this income on theirfederal income tax returns. This income is included infederal adjusted gross income, which is the startingpoint for the Illinois Individual Income Tax, or taxableincome for corporations.
The starting point for the Illinois Corporate Income Taxis federal taxable income, which is income minusdeductions. Next, the federal taxable income ischanged by adding back certain items (e.g., state,municipal, and other interest income excluded fromfederal taxable income) and subtracting others (e.g.,interest income from U.S. Treasury obligations). Theresult is “base income.”
If income is earned both inside and outside of Illinois,the base income is then apportioned by a formula todetermine Illinois’ share of income. Generally, incomeallocable to Illinois is determined by the ratio of salesof the corporation within Illinois to total sales of theentire corporation. Insurance companies, financialorganizations, and transportation companies havedifferent formulas.
Corporate Income Tax credits are provided as incen-tives to encourage certain types of taxpayer behavior.Major tax credits are listed below.
Research and Development Credit (for tax yearsending on or before December 31, 2003 andbeginning again for tax years ending on or afterDecember 31, 2004)Training Expense Credit (for tax years ending on orbefore December 31, 2003)
Coal Research and Coal Utilization InvestmentCreditsEnterprise Zone Investment CreditHigh Impact Business Investment CreditEnvironmental Remediation Tax Credit (for taxyears ending on or before December 31, 2001)Economic Development for a Growing Economy(EDGE) Tax CreditTECH-PREP Youth Vocational Programs CreditDependent Care Assistance Program Tax CreditEmployee Child Care Tax CreditEnterprise Zone and Foreign Trade Zone Jobs TaxCreditLife and Health Insurance and HMO GuaranteeAssociation fee offset (for tax years ending on orbefore December 31, 2002)Affordable Housing Credit (for tax years ending onor after December 31, 2000)Film Production Services Credit (for tax yearsbeginning on or after January 1, 2004)
Graph 6: Illinois Corporate Income Tax Credits,Schedule 1299-D
$40.7
$49.6
$51.2
$72.8
$79.6
$68.2
$61.8
$42.9
$34.9
$21.4
0 20 40 60 80Millions
1992
1993
1994
1995
1996
1997
1998
1999
2000
2001
Table 7: Corporate Liability Stratification for Income and Replacement Taxes — Tax Year 2001Liability Range Total Percent Liabilities Percent of Average(000’S) filers of filers (millions) liabilities Liability$0 89,756 70.14% $ 0.0 0.00% $ 0.0$0 > $5 29,858 23.33% 35.6 3.34% 1,192$5 > $10 3,172 2.48% 21.9 2.05% 6,904$10 > $50 3,250 2.54% 72.1 6.76% 22,185$50 > $100 759 0.59% 54.0 5.06% 71,146$100 > $500 838 0.65% 177.5 16.64% 211,814$500 > $1,000 162 0.13% 111.7 10.47% 689,506$1,000 or more 171 0.13% 594.1 55.68% 3,474,269Totals 127,966 100.00% $ 1,066.9 100.00% $ 8,337Liability only 38,210 29.86% $ 1,066.9 100.00% $ 27,922Note: For information about replacement taxes, see Table 56 and Table 57.

F I S C A L Y E A R 2 0 0 3 A N N U A L R E P O R T
Illinois Department of Revnue 15
Table 8: Corporate Income Tax Credit Profile* (in millions)
Credit 1993 1994 1995 1996 1997 1998 1999 2000 2001 Total
Enterprise Zone $ 2.9 $ 7.0 $ 10.0 $ 8.4 $ 9.0 $1 0.0 $ 5.8 $ 4.4 $ 7.5 $ 65.0Coal Research & Coal Utilization 3.1 3.1 3.9 0.7 4.3 1.1 0.1 1.1 1.1 18.5High Impact Business 0.0 0.2 0.4 1.2 0.4 0.5 0.5 0.5 0.2 3.9Jobs Tax Credit 0.0 0.3 0.0 0.0 0.0 0.0 0.0 0.0 0.0 0.3Training Expense 5.9 9.8 17.4 17.7 18.8 17.3 14.5 14.4 12.7 128.5Research & Development 16.5 24.0 27.8 35.2 32.6 27.5 15.9 15.0 6.7 201.2Life & Health Insurance Tax Offset N/A N/A 2.7 4.1 12.3 16.1 14.1 12.9 6.2 68.4Tech-Prep N/A N/A 0.0 0.0 0.2 0.3 0.3 0.0 0.0 0.8Dependent Care N/A N/A 0.0 1.0 0.0 0.0 0.0 0.0 0.0 1.0Environmental Remediation N/A N/A N/A N/A 0.0 0.0 0.0 0.2 0.0 0.2EDGE** N/A N/A N/A N/A N/A N/A 0.0 0.2 3.3 3.5Child Care N/A N/A N/A N/A N/A N/A N/A 0.9 3.0 3.9Affordable Housing N/A N/A N/A N/A N/A N/A N/A N/A 0.0 0.0
Total $ 28.4 $ 4 4.4 $ 62.2 $ 68.3 $ 77.6 $ 72.8 $ 51.2 $ 49.6 $ 40.7 $ 495.2* Based on a review of Schedules 1299-D.** Economic Development for a Growing Economy
DistributionIndividual and corporate income tax collections aredeposited into three separate funds: the Income TaxRefund Fund (ITRF), the Education Assistance Fund(EAF), and the General Revenue Fund (GRF). A per-centage of gross income tax collections — 7.6 per-cent for individuals and 27.0 percent for corporationsin FY 2003 — is deposited into the ITRF to arrive at netincome taxes. A percentage of the net income taxesis then deposited into the EAF (7.3 percent). The GRFreceives all remaining income tax deposits. Beginningwith FY 1996, 1/10 of net income taxes are transferredfrom the GRF to the Local Government DistributiveFund. See “Revenue-sharing with Local Governments.”
Table 9: Individual and Corporate Income TaxReceipts by Fund (in millions)
Individual Corporate TotalFunds FY 2003 FY 2003 FY 2003
ITRF $ 638.5 $ 272.9 $ 911.4EAF 535.8 54.0 589.8GRF 6,805.0 684.5 7,489.5Total $ 7,979.3 $1,011.4 $ 8,990.7The GRF received 83.3 percent of total income tax receipts inFY 2003. The individual and corporate receipt totals by fundshown in this table may not equal those in Table 10 due totiming differences between when the money was received andwhen it was deposited into the funds.
Graph 7: Individual and Corporate Receipts
0 2,000 4,000 6,000 8,000 10,000
Millions
1994
1995
1996
1997
1998
1999
2000
2001
2002
2003
Individual ReceiptsCorporate Receipts
Table 10: Income Tax Collections and RefundsFiscal year Individual Corporate Total collections Total refunds1994 $ 5,378,397,361 $ 939,156,586 $ 6,317,553,947 $ 531,509,9761995 5,710,709,044 1,100,484,453 6,811,193,497 584,395,2241996 6,110,147,297 1,204,187,601 7,314,334,898 629,104,3981997 6,544,228,585 1,364,779,886 7,909,008,471 667,642,3911998 7,254,646,661 1,397,470,262 8,652,116,923 616,524,8871999 7,786,233,842 1,384,711,476 9,170,945,318 740,663,0052000 8,265,868,742 1,524,201,811 9,790,070,553 959,039,9902001 8,617,847,075 1,302,558,427 9,920,405,502 942,653,1462002 8,090,152,509 1,042,682,985 9,132,835,494 870,283,2812003 $ 7,976,979,827 $ 921,586,926 $ 8,898,566,753 $ 1,396,083,434
Note: Collections from replacement income taxes are not included in this table. See Table 56 and Table 57.

16 Illinois Department of Revnue
F I S C A L Y E A R 2 0 0 3 A N N U A L R E P O R T
Income Tax Refund FundEffective January 1, 1989, the Income Tax Refund Fund(ITRF) removed income and replacement tax refundsfrom the appropriation process. Percentages of allincoming income tax dollars are deposited into thefund. Public Act 85-1414 set the individual percentageat 6 percent and the corporate percentage at 18percent for FY 89. The act requires that thepercentages be revised annually on the last businessday of each fiscal year. However, for fiscal years 1999,2000, and 2001, the refund fund percentages werefixed at 7.1 percent for individual income taxcollections and 19.0 percent for corporate andreplacement tax collections. For fiscal year 2003, thepercentages were 8 percent and 27 percent. Forfiscal year 2004, the percentages were 11.7 percentand 32 percent; for fiscal year 2005, they are 10percent and 24 percent. All deposits into the ITRF aredesignated for the sole purpose of paying refunds.
ITRF deposits are shown in Table 12.
Table 11: Individual Income Tax RefundsTax Refunds Refund Averageyear issued amount refund1992 2,711,501 $ 328,984,665 $ 121.331993 2,825,089 355,777,239 125.931994 2,932,315 378,397,464 129.041995 2,956,237 386,403,494 130.711996 2,969,670 411,863,295 138.691997 3,009,427 432,014,209 143.551998 3,438,205 552,142,118 160.591999 3,428,546 589,245,130 171.862000 3,695,456 787,103,446 212.992001 3,680,097 $ 877,145,543 $ 238.34
Graph 8: Individual Income Tax Average Refund
Income Tax CheckoffsIncome tax checkoffs for charitable causes firstappeared on the Illinois Individual Income Tax returnfor the 1983 tax year. Taxpayers who were due arefund could donate up to $10 of that refund to anyor all of the causes listed on the return. (Joint filerscould each donate $10 per cause.) Follow-uplegislation in 1986 required that checkoff causesattract at least $100,000 in donations by October 1 inorder to remain on the return for subsequent years.Effective January 1, 1990, all taxpayers may donateand there is no maximum for donations.
Graph 9: Checkoff Dollars Donated
$1.48
$1.37
$1.28
$1.30
$1.08
$0.86
$0.81
$0.81
$0.83
$0.88
0 1 1 2Millions
1993
1994
1995
1996
1997
1998
1999
2000
2001
2002
Table 12: Income Tax Refund Fund Deposits per the Office of the Comptroller (in millions)
Individual Corporate ReplacementFiscal Refund Refund Refund Refund Refund Refund Totalyear percent deposits percent deposits percent deposits deposits1994 6.9 $ 372.1 17.7 $ 164.9 17.7 $ 100.7 $ 637.71995 6.6 376.9 18.6 205.2 18.6 130.7 712.81996 6.6 400.6 19.1 230.8 19.1 143.9 775.31997 6.3 412.8 20.3 276.3 20.3 171.7 860.81998 5.8 421.7 19.0 266.3 19.0 169.8 857.81999 7.1 552.2 19.0 263.1 19.0 172.0 987.32000 7.1 587.4 19.0 290.2 19.0 194.8 1,072.42001 7.1 611.1 19.0 243.0 19.0 176.8 1,030.92002 7.6 614.5 23.0 239.7 23.0 173.5 1,027.72003 8.0 $ 638.5 27.0 $ 272.9 27.0 $ 205.0 $ 1,116.4
$238
$213
$172
$161
$144
$139
$131
$129
$126
$121
0 50 100 150 200 250
1992
1993
1994
1995
1996
1997
1998
1999
2000
2001

F I S C A L Y E A R 2 0 0 3 A N N U A L R E P O R T
Illinois Department of Revnue 17
Table 13: Checkoff Dollars Donated by Tax YearNote: Totals may not add due to rounding.
Voluntary Contributions 1983 1984 1985 1986 1987 1988 1989 1990 1991 1992Veterans Home 178,283 124,150 68,499 — — — — — — —Wildlife Conservation 259,972 227,947 171,291 200,200 205,875 234,117 239,970 234,220 175,802 169,086Child Abuse Prevention 498,337 353,407 240,052 266,837 296,130 312,694 285,977 273,728 182,395 205,338Food and Housing Assistance — 116,208 79,122 — — — — — — —Mental Health Education — — 56,417 — — — — — — —Alzheimer’s Disease Research — — 114,850 173,026 164,603 169,823 169,784 185,781 103,651 124,415U.S. Olympic Fund — — — — 82,629 — — — — —Assistance to the Blind — — — — 84,427 — — — — —Heritage Preservation — — — — — 49,496 — — — —Assistance to the Homeless — — — — — — 263,989 280,481 178,184 202,248Child Care Expansion Program — — — — — — 77,720 — — —Community Health Center Care — — — — — — 60,058 — — —Gulf War Veterans — — — — — — — — 15,922 —1992 U.S. Olympians — — — — — — — — 33,817 —Rehabilitation Technology — — — — — — — — 28,764 —AIDS Victims Assistance — — — — — — — — 96,677 —Domestic Violence — — — — — — — — 54,589 —Drug Abuse Prevention — — — — — — — — 75,992 —Literacy Advancement — — — — — — — — — 82,285Breast & Cervical Cancer Research — — — — — — — — — —Ryan White Pediatric and Adult AIDS — — — — — — — — — —Illinois Special Olympics — — — — — — — — — —Heart Disease Prevention — — — — — — — — — —Korean War Memorial — — — — — — — — — —Hemophilia Treatment — — — — — — — — — —Women in the Military Memorial — — — — — — — — — —Children’s Cancer — — — — — — — — — —American Diabetes — — — — — — — — — —Mental Health Research — — — — — — — — — —Prostate Cancer Research — — — — — — — — — —National WWII Memorial — — — — — — — — — —Korean War Veteran’s Museum — — — — — — — — — —Multiple Sclerosis Assistance — — — — — — — — — —
Total 936,592 821,711 730,232 640,063 833,664 766,129 1,097,497 974,211 945,793 783,371
Voluntary Contributions 1993 1994 1995 1996 1997 1998 1999 2000 2001 2002Veterans Home $ — $ — $ — $ — $ — $ —$ —$ — $ — $ —Wildlife Conservation 185,824 205,177 216,356 208,763 178,688 240,033 237,183 225,373 248,751 267,594Child Abuse Prevention 167,299 167,801 175,912 179,119 138,290 239,537 283,213 232,810 248,169 263,942Food and Housing Assistance — — — — — — — — — —Mental Health Education — — — — — — — — — —Alzheimer’s Disease Research 108,116 108,592 119,277 130,165 102,721 161,503 225,860 166,146 181,614 192,262U.S. Olympic Fund — — — — — — — — — —Assistance to the Blind — — — — — — — — — —Heritage Preservation — — — — — — — — — —Assistance to the Homeless 152,274 141,603 145,321 143,717 115,011 190,708 189,386 180,108 192,981 221,257Child Care Expansion Program — — — — — — — — — —Community Health Center Care — — — — — — — — — —Gulf War Veterans — — — — — — — — — —1992 U.S. Olympians — — — — — — — — — —Rehabilitation Technology — — — — — — — — — —AIDS Victims Assistance — — — — — — — — — —Domestic Violence — — — — — — — — — —Drug Abuse Prevention — — — — — — — — — —Literacy Advancement — — — — — — — — — —Breast & Cervical Cancer Research 117,279 111,008 129,797 146,317 110,965 247,496 224,968 249,649 252,541 256,937Ryan White Pediatric and Adult AIDS 81,607 — — — — — — — — —Illinois Special Olympics 64,103 — — — — — — — — —Heart Disease Prevention — 48,384 — — — — — — — —Korean War Memorial — 25,640 — — — — — — — —Hemophilia Treatment — 22,940 — — — — — — — —Women in the Military Memorial — — 24,342 — — — — — — —Children’s Cancer — — — — 86,248 — — — — —American Diabetes — — — — 74,133 — — — — —Mental Health Research — — — — 57,093 — — — — —Prostate Cancer Research — — — — — — 115,837 115,468 117,471 131,025National WWII Memorial — — — — — — — 112,666 86,411 —Korean War Veteran’s Museum — — — — — — — — 40,934 —Multiple Sclerosis Assistance — — — — — — — — — 146,342Total 876,503 831,144 811,005 808,081 863,149 1,079,278 1,296,446 1,282,221 1,368,871 1,479,360

18 Illinois Department of Revnue
F I S C A L Y E A R 2 0 0 3 A N N U A L R E P O R T
Sales TaxesStatutory References
Retailers’ Occupation Tax — 35 ILCS 120/1 to 120/14Service Occupation Tax — 35 ILCS 115/1 to 115/21Service Use Tax — 35 ILCS 110/1 to 110/21Use Tax — 35 ILCS 105/1 to 105/22
Definition“Sales tax” is imposed on a seller’s receipts from salesof tangible personal property for use or consumption.Tangible personal property does not include realestate, stocks, bonds, or other “paper” assetsrepresenting an interest.
If the seller (typically an out-of-state business, such as acatalog company or a retailer making sales on theInternet) does not charge Illinois Sales Tax, thepurchaser must pay the tax directly to the department.
The term “sales tax” actually refers to several tax acts.Sales tax is a combination of “occupation” taxes thatare imposed on sellers’ receipts and “use” taxes thatare imposed on amounts paid by purchasers. Sellersowe the occupation tax to the department; theyreimburse themselves for this liability by collecting usetax from the buyers. “Sales tax” is the combination ofall state, local, mass transit, water commission, homerule occupation and use, non-home rule occupationand use, and county public safety taxes.
For purposes of this document, Illinois Sales Tax hasthree rate structures — one for qualifying food, drugs,
and medical appliances; one for items required to betitled or registered; and another for all other generalmerchandise.
“Qualifying food” applies to food not prepared by theretailer for immediate human consumption, such asgrocery store food items. “Qualifying food, drugs, andmedical appliances” include
food that has not been prepared for immediatehuman consumption, such as most food sold atgrocery stores, excluding hot foods, alcoholicbeverages, and soft drinks;prescription medicines and nonprescription itemsclaimed to have medicinal value, such as aspirin,cough medicine, medicated hand lotion, andfluoride toothpaste (Section 130.310 was amendedon June 24, 2002 to remove fluoride toothpaste from the low rate); and prescription and nonprescription medicalappliances that directly replace a malfunctioningpart of the human body, such as correctiveeyewear, contact lenses, prostheses, insulinsyringes, and dentures.
“Vehicles” includes
vehicles, watercraft, aircraft, trailers, and mobilehomes; andvehicles, aircraft, and vessels owned by a businesswhen that business moves into or relocates toIllinois.
Table 14: Sales Tax Rates History
Year Imposed by Rate
1933 State (temporary) 2.00%1935 State (permanent) 3.00%1955 Municipalities — local sales tax varied1959 Counties — local sales tax varied1969 State 4.00%1979 State/municipalities & counties 4.00%/1.00%1979 Regional Transportation Authority (RTA) 0.25%/1.00% (1)
1980 State (food, drugs, & medical appliances) 3.00% (2)
1980 Metro-East Mass Transit District (MED) 0.25% (3)
1981 State (food, drugs, & medical appliances), 2.00%1981 MED (food, drugs, & medical appliances) 0.25%1984 State (general merchandise/food, drugs,
& medical appliances) 5.00%/0.00% (4)
1986 County Water Commission 0.25% (5)
1986 All counties but Cook County 0.25% (6)
1990 Sales Tax Reform 6.25%/1.00% (7)
1990 Home rule taxes varied (8)
1994 Non-home rule taxes varied (8)
1998 County public safety taxes varied (8)
2001 Metro-East Park and Recreation 0.10% (9)
Footnotes
(1) 0.25 percent in DuPage, Kane, Lake, McHenry, and Will counties;1.00 percent in Cook County
(2) No change to rates imposed by local governments (up to 1%)and RTA (either 0.25 percent or 1 percent)
(3) Portions of Madison and St. Clair counties(4) No change to rates imposed on food, drugs, and medical
appliances by local governments (up to 1 percent) and masstransit districts (RTA, either 0.25 percent or 1 percent; MED, 0.25percent); “soft drinks” removed from definition of food, drugs,and medical appliances effective September 1
(5) Most of DuPage County and certain municipalities in Cook andWill counties
(6) County Supplementary Tax Act(7) Local sales tax acts and County Supplementary Tax Act re-
pealed; additional 1.25 percent on general merchandise and1.00 percent on qualifying food, drugs, and medical appliancesreturned to local governments; RTA and MED sales tax remainimposed on both general merchandise and qualifying food,drugs, and medical appliances bases
(8) Imposed in 0.25 percent increments and on the same generalmerchandise base as the state sales tax, excluding titled orregistered tangible personal property (such as vehicles, water-craft, aircraft, trailers, and mobile homes), and qualifying food,drugs, and medical appliances
(9) Imposed on the same general merchandise base as the statesales tax, excluding titled or registered tangible personal property(such as vehicles, watercraft, aircraft, trailers, and mobile homes),and qualifying food, drugs, and medical appliances
ropm018
Note
Accepted set by ropm018

F I S C A L Y E A R 2 0 0 3 A N N U A L R E P O R T
Illinois Department of Revnue 19
“Other general merchandise” includes sales of mosttangible personal property including sales of
soft drinks;photo processing (getting pictures developed);prewritten and “canned” computer software;repair parts and other items transferred or sold inconjunction with providing a service.
The fundamental rate for
qualifying food, drugs, and medical appliances is1 percent.items required to be titled or registered is 6.25percent.other general merchandise is 6.25 percent.
Depending upon the location of the sale, the actualsales tax rate may be higher than the fundamentalrate because of home rule, non-home rule, watercommission, mass transit, county public safety, andpark and recreation district sales taxes.
Table 15: State Sales Tax Collections
Fiscal Number ofyear Collections taxpayers1994 $ 5,854,432,646 233,5501995 6,331,447,058 240,0211996 6,564,513,297 241,0031997 6,825,310,943 243,3261998 7,158,829,522 244,1991999 7,570,174,221 242,3392000 8,165,116,191 239,0542001 8,014,161,192 235,5062002 8,266,932,058 239,9172003 $ 8,118,945,837 241,460Note: Collections include Motor Vehicle Use Tax and the 20
percent share subsequently disbursed to units of localgovernment.
Graph 10: State Sales Tax Collections
Table 16: Sales Tax Reported by Type of Business (1)
FY 1999 FY 2000 FY 2001 FY 2002 FY 2003Number of taxpayers filing (2) 399,323 332,814 332,672 332,860 344,811General merchandise $ 688,401,607 $ 707,330,341 $ 702,095,418 $ 747,449,729 $ 749,360,894Food 221,895,292 270,122,075 270,103,662 300,866,189 319,610,933Drinking and eating places 580,091,716 643,298,617 667,482,637 660,714,606 675,298,382Apparel 229,317,700 239,477,718 247,274,214 234,107,920 238,012,061Furniture, household, and radio 395,715,790 438,941,925 449,535,424 441,525,889 441,847,465Lumber, building, and hardware 362,691,745 401,369,486 407,483,210 434,584,164 452,169,291Automotive and filling stations 1,293,388,251 1,437,105,671 1,377,200,398 1,503,133,350 1,475,120,440Drugs and other retail 574,801,314 630,806,710 681,046,638 679,956,940 691,938,000Agriculture and extractives 1,266,815,433 1,326,995,905 1,212,130,197 1,155,742,681 1,140,783,321Manufacturers 316,091,101 277,365,381 259,577,057 232,890,159 214,475,812Total tax collections $5,929,209,954 $6,372,813,833 $6,273,928,855 $6,390,971,628 $6,398,616,598Note: Amounts subsequently disbursed to units of local government, which are included in Table 15 and Graph 10, have been
subtracted.(1) This table shows where sales tax collections came from by category and is for items purchased during the fiscal year.(2) Includes both taxpayers registered for sales tax and those paying use tax.
Graph 11: Sales Tax Reported by Type ofBusiness for Fiscal Year 2003
Manufacturers$214,475,812
Agriculture and
extractives$1,140,783,321
Drugs and other retail
$691,938,000
Automotive and filling stations
$1,475,120,440
Lumber, building, and
hardware$452,169,291
Furniture, household, and radio
$441,847,465
Apparel$238,012,061
Drinking and eating places$675,298,382
Food$319,610,933
General Merchandise$749,360,894
$8.12
$8.27
$8.01
$8.17
$7.57
$7.16
$6.83
$6.56
$6.33
$5.85
0 2 4 6 8 10Millions
1994
1995
1996
1997
1998
1999
2000
2001
2002
2003

20 Illinois Department of Revnue
F I S C A L Y E A R 2 0 0 3 A N N U A L R E P O R T
DistributionSales and use tax collections are allocated amongstate and local governments.
Sales TaxesThe state treasury receives 80 percent of collectionsfrom the 6.25 percent general merchandise sales tax(including items that must be titled or registered).
In FY 2003, the state’s 80 percent share was disbursedas shown below.
Build Illinois Fund — 5.55 percentIllinois Tax Increment Fund — 0.27 percentGeneral Revenue Fund — 70.635 percent (or 75percent of the amount remaining afterdisbursements to the first two funds listed)General Revenue/Common School SpecialAccount Fund — 23.545 percent (or 25 percent ofthe amount remaining after disbursements to thefirst two funds listed)
Local governments receive the remaining 20 percentof the 6.25 general merchandise sales tax and 100percent of the collections from qualifying food, drugs,and medical appliances. See “Revenue-sharing withLocal Governments, Local Share of State Sales andUse Taxes” for more information.
Use TaxesThe state treasury receives 80 percent of collectionsfrom the basic 6.25 percent general merchandise usetax (including items that must be titled or registered).
Local governments receive the remaining 20 percentof the 6.25 general merchandise use tax and 100percent of the collections from qualifying food, drugs,and medical appliances. The local government’sportion (excluding the 20 percent for items that mustbe titled or registered, which is discussed under“Revenue-sharing with Local Governments, LocalShare of State Sales and Use Taxes”) is deposited inthe State and Local Sales Tax Reform Fund with asubsequent disbursement of local use tax to the LocalGovernment Distributive Fund (LGDF). These transfersare made in the following order:
20 percent to Chicago10 percent to the Regional TransportationAuthority (RTA)0.6 percent to the Metro-East Mass Transit District(MED)$37.8 million to the Build Illinois FundThe remainder to municipal and countygovernments (except Chicago) based on eachlocal government’s population (referred to as“local” use tax, transferred to the LGDF beforedisbursement)
Local Taxes Collected by theDepartmentThe department collects certain taxes imposed byunits of local government. Collections, minus anystatutory administrative fees, are disbursed to the unitof local government that imposes the tax.
Chicago Home Rule Municipal Soft Drink Retailers’Occupation TaxChicago Home Rule Use TaxCounty Motor Fuel TaxCounty Water Commission TaxesHome Rule County TaxesHome Rule or Non-home Rule Municipal TaxesMass Transit District Taxes (Metro-East Mass Transit(MED) Taxes and Regional Transportation Authority(RTA) Taxes)Metropolitan Pier and Exposition Authority (MPEA)Food and Beverage TaxMetro-East Park and Recreation District TaxesSpecial County Retailers’ Occupation Tax forPublic Safety
See “Taxes Collected for Local Governments” formore information.
Note: Units of local government may impose taxes orfees which the department does not collect.

F I S C A L Y E A R 2 0 0 3 A N N U A L R E P O R T
Illinois Department of Revnue 21
Manufacturer’s Purchase CreditStatutory ReferencesUse Tax — 35 ILCS 105/3-85; Service Use Tax — 35 ILCS110/3-70; Service Occupation Tax — 35 ILCS 115/9;Retailers’ Occupation Tax — 35 ILCS 120/3
DefinitionTaxpayers who purchase sales and use tax exempt(i.e., no tax is paid on the purchase) manufacturing orgraphic arts machinery and equipment may earn aManufacturer’s Purchase Credit (MPC). This credit canbe applied toward future state use tax or service usetax liabilities owed when production-related tangiblepersonal property is purchased from suppliers(including purchases by a manufacturer, graphic artsproducer, or lessor who rents or leases the use of theproperty to a manufacturer or graphic arts producer).The credit cannot be transferred to another party.
Qualified production-related tangible personalproperty must be used or consumed in a productionfacility in which the manufacturing process or graphicarts production takes place. The term includestangible personal property
purchased for incorporation into real estate withina manufacturing or graphic arts facility;used or consumed in activities such aspreproduction material-handling, receiving,quality control, inventory control, storage, staging,and packaging for shipping and transportationpurposes; andused or consumed by the purchaser for researchand development.
Taxpayers who make qualifying purchases must reportMPC earned to the Department of Revenue toreceive the MPC. The MPC must be used within twocalendar years following the year in which the creditwas earned. The taxpayer must pay any locallyimposed taxes (e.g., home rule, mass transit) directlyto the supplier. Taxpayers can also use the MPC tosatisfy use or service use tax liabilities owed onpurchases of production-related tangible personalproperty from suppliers not registered in Illinois.
Credit HistoryMPC is determined by multiplying the 6.25% tax thatwould have been due on the purchase of exemptmanufacturing or graphic arts machinery andequipment by the applicable percentage based onyear of purchase:
15 percent for purchases made on or afterJanuary 1, 1995, but before July 1, 1995(manufacturers only)25 percent for purchases made on or after July 1,1995, but before July 1, 1996 (manufacturers only)40 percent for purchases made on or after July 1,1996, but before July 1, 1997 (manufacturers andgraphic artists)50 percent for purchases made on or after July 1,1997 (manufacturers and graphic artists)
Graph 12: MPC Used
$35.0
$25.0
$25.0
$11.5
$16.0
$7.3
$11.7
$10.1
$5.2
0 10 20 30 40
Millions
1995
1996
1997
1998
1999
2000
2001
2002
2003

22 Illinois Department of Revnue
F I S C A L Y E A R 2 0 0 3 A N N U A L R E P O R T
$27.3
$29.0
$31.7
$32.4
$29.4
$26.3
$25.2
$23.8
$21.6
$19.3
0 10 20 30 40
Millions
1994
1995
1996
1997
1998
1999
2000
2001
2002
2003
Other Sales or RentingTaxes and FeesAutomobile Renting Occupationand Use TaxesStatutory Reference35 ILCS 155/1 to 155/5
DefinitionThe occupation tax is imposed on automobile rentalbusinesses based on their charges for renting or leasingan automobile in Illinois for periods of one year or less.
The use tax is imposed on persons renting automobilesin Illinois based on the rental price. Rentors collect theuse tax from rentees and in turn meet theiroccupation tax liability by remitting the tax to theDepartment of Revenue. If the use tax is not paid tothe rentor, the person using the automobile in Illinoismust pay the tax directly to the department.
The department began collecting the original 4percent taxes on January 1, 1982. Effective July 1,1985, the tax rates are 5 percent.
DistributionCollections are deposited into the General RevenueFund.
Local Taxes Collected by the DepartmentCounties, municipalities, certain mass transportationdistricts, and the Metropolitan Pier and ExpositionAuthority (MPEA) are allowed to impose automobilerenting occupation and use taxes. If imposed, thedepartment collects the taxes for these localgovernments and returns the collections to them. Thespecific names of these local taxes are identifiedbelow. See “Taxes Collected for Local Governments”for more information .
County Automobile Renting TaxMetro-East Mass Transit (MED) Automobile RentingTaxMetropolitan Pier and Exposition Authority (MPEA)Automobile Renting TaxMunicipal Automobile Renting TaxRegional Transportation Authority (RTA) AutomobileRenting Tax
Graph 13: Automobile Renting Occupation andUse Taxes Collections

F I S C A L Y E A R 2 0 0 3 A N N U A L R E P O R T
Illinois Department of Revnue 23
$1.5
$1.3
$1.2
$1.3
$1.1
$1.1
$1.2
$1.0
$0.6
$0.6
0.0 0.5 1.0 1.5
Millions
1994
1995
1996
1997
1998
1999
2000
2001
2002
2003
Replacement Vehicle TaxStatutory Reference625 ILCS 5/3-2001 to 5/3-2006
DefinitionThe tax is imposed on insurance companies purchasingpassenger cars bought in Illinois by or on behalf of theirinsured person to replace an insured person’spassenger car that has been deemed a total loss.
Effective August 19, 1983, the state rate of tax is $200per vehicle. Effective July 1, 2003, this tax is no longerimposed; sales or use tax must be paid instead.
DistributionCollections are deposited into the General RevenueFund.
Local Taxes Collected by the DepartmentMunicipalities and counties may impose areplacement vehicle tax of $50. The Department ofRevenue collects the tax for municipal and countygovernments and returns it to them minus anadministrative fee of 1.6 percent for municipalities and2 percent for counties. The specific names of theselocal taxes are identified below.
County Replacement Vehicle TaxMunicipal Replacement Vehicle Tax
See “Taxes Collected for Local Governments” for moreinformation about these taxes.
Graph 14: Replacement Vehicle Tax Collections
Tire User FeeStatutory Reference415 ILCS 5/55.8 - 55.15
DefinitionAny person who sells or delivers tires at retail in Illinoismust collect the fee. The fee is imposed on
new and used tires for vehicles in which persons orproperty may be transported or drawn upon ahighway, as defined in the Illinois Vehicle Code,Section 1-217;aircraft;special mobile equipment (such as streetsweepers, road construction and maintenancemachinery); andimplements of husbandry (farm wagons andcombines).
Effective July 1, 1992, the rate is $1 per tire sold ordelivered at retail.
DistributionCollections are deposited into the Used TireManagement Fund, less a retailer seller’s collectionallowance of 10 cents per tire and an amount equalto 10 cents per tire, which is paid into the GeneralRevenue Fund.
Graph 15: Tire User Fee Collections
$6.6
$6.3
$6.4
$6.3
$6.1
$5.8
$5.7
$5.6
$5.5
$5.5
0 2 4 6 8
Millions
1994
1995
1996
1997
1998
1999
2000
2001
2002
2003

24 Illinois Department of Revnue
F I S C A L Y E A R 2 0 0 3 A N N U A L R E P O R T
Vehicle Use TaxStatutory Reference625 ILCS 5/3-1001 to 5/3-1006
DefinitionThe tax is imposed on motor vehicles purchased (oracquired by gift or transfer) from another individual orprivate party. (Sales of motor vehicles from registeredIllinois dealers are taxed under the Retailers’Occupation Tax Act.) The tax is submitted to theOffice of the Secretary of State when the purchaserapplies for title to the motor vehicle. The rate isdetermined by either the purchase price or fair marketvalue of the motor vehicle. Fair market value is usedwhen there is no stated purchase price (e.g., themotor vehicle is a gift). If the vehicle’s purchase priceis less than $15,000, the tax is based on the age of thevehicle. See Table A below. If the vehicle’s purchaseprice is $15,000 or more, the tax is based on thepurchase price. See Table B.
Table 17: Vehicle Use Tax Rates
Table A Table BVehicles purchased for Vehicles purchased forless than $15,000: $15,000 or more:
Vehicle Age Tax Purchase Price Tax1 or newer $ 390 $15,000 – $19,999 $ 7502 290 $20,000 – $24,999 1,0003 215 $25,000 – $29,999 1,2504 165 $30,000 or more 1,5005 1156 907 808 659 5010 4011 or older 25In addition, there is a flat rate tax of $25 forpurchases of motorcycles and all-terrain vehicles(ATVs), and $15 for purchases from certain familymembers, gifts to beneficiaries (not spouses), andtransfers in a business reorganization.
DistributionThe first $5 million of collections annually goes into theBuild Illinois Fund. The remainder goes into the GeneralRevenue Fund.
Table 18: History of Vehicle Use Tax RatesEffective date Rate
January 1, 1980 $30 per transactionOctober 1, 1985 5 percent of selling price
on models up to 10 years old*January 1, 1988 See Table 17
Note: Effective September 9, 1980, through October 1, 1985,motor vehicles more than five years old were not subjectto the tax.
* cars, trucks, vans, motorcycles, motor-driven cycles, andbuses (pull-trailers not taxed)
Graph 16: Vehicle Use Tax Collections
$40.7
$42.5
$39.0
$43.4
$42.3
$42.7
$42.0
$41.7
$43.5
$43.1
0 10 20 30 40 50
Millions
1994
1995
1996
1997
1998
1999
2000
2001
2002
2003

F I S C A L Y E A R 2 0 0 3 A N N U A L R E P O R T
Illinois Department of Revnue 25
Motor Fuel TaxesMotor Fuel and Motor Fuel UseTaxesStatutory References
Motor Fuel Tax — 35 ILCS 505/1 to 505/21Motor Fuel Use Tax — 35 ILCS 505/13a
DefinitionThe Motor Fuel Tax is imposed on the privilege ofoperating motor vehicles on public highways andrecreational watercraft on waterways in Illinois. It ispaid by distributors and suppliers, who collect the taxfrom their customers.
The Motor Fuel Use Tax (MFUT) is imposed on the use ofmotor fuel on Illinois highways by commercial motorvehicles, which are qualified under the InternationalFuel Tax Agreement (IFTA). IFTA includes all contiguousstates in the U.S. and most Canadian provinces. Eachmotor carrier has a base jurisdiction (state or province)that collects motor fuel use taxes on qualified motorvehicle operations for all IFTA jurisdictions andapportions money to those jurisdictions.
The motor fuel tax rate for diesel fuel is 2.5 cents pergallon over the 19 cents per gallon rate for gasoline(or 21.5 cents per gallon). The motor fuel use tax rate iscomposed of two parts. The Part A rate is the motorfuel tax rate. The Part B rate is equal to 6.25 percent ofthe average selling price of motor fuel sold in Illinois.The department determines the Part B rate by January1 of each year.
Taxpayers applying for a license as a distributor,distributor/blender, supplier, or receiver of gasoline,diesel, kerosene, aviation/jet fuel, or other fuels mustpost a bond. The maximum bond is based on twicethe monthly amount that would be collectable as atax in the event of a sale of all motor fuel, or specialfuel sold, distributed, and used by the distributorincluding tax-free sales, use, and distribution.
Illinois based motor carriers who travel interstate maybe required to post a bond for just cause. The bond isbased on at least twice the estimated average taxliability of a quarterly return.
Table 19: Motor Fuel Tax Rate History
Effective date Gasoline DieselAugust 1, 1929 $.03 $.03August 1, 1951 $.04 $.04January 1, 1953 $.05 $.05August 1, 1967 $.06 $.06August 1, 1969 $.075 $.075August 1, 1983 $.11 $.135July 1, 1984 $.12 $.145July 1, 1985 $.13 $.155August 1, 1989 $.16 $.185January 1, 1990 $.19 $.215
Table 20: Motor Fuel Gallonage History
Fiscal Combustibleyear Gasoline Diesel gases Total
1993 4,476,228,862 785,392,592 6,971,287 5,268,592,741
1994 4,579,543,480 839,644,173 6,646,947 5,425,834,600
1995 4,660,057,634 857,273,635 6,207,897 5,523,539,166
1996 4,735,404,376 883,291,045 6,164,852 5,624,860,273
1997 4,782,926,142 905,165,220 6,324,513 5,694,415,875
1998 4,792,542,981 948,322,221 5,935,007 5,746,800,209
1999 4,855,227,376 1,055,975,015 5,781,131 5,947,225,399
2000 5,216,523,158 1,046,610,027 5,139,625 6,268,272,810
2001 5,182,725,051 1,061,333,056 5,463,172 6,249,521,279
2002 5,059,658,465 1,033,927,899 4,734,234 6,098,320,598
2003 5,233,840,475 1,068,762,622 4,494,708 6,307,097,805

26 Illinois Department of Revnue
F I S C A L Y E A R 2 0 0 3 A N N U A L R E P O R T
Table 21: Motor Fuel Tax Collections and Refunds (1)
No. ofFiscal Non-highway motor fuel ---- No. of MFUT taxpayers ----year Collections refunds taxpayers (2) IFTA IL Interstate (3) Total1994 1,105,043,967 22,894,784 861 7,011 12,699 19,7101995 1,141,921,067 15,477,780 826 8,507 13,047 21,5541996 1,169,906,414 8,775,809 923 7,757 2,801 10,5581997 1,187,335,532 13,185,825 748 8,056 0 8,0561998 1,227,238,552 10,066,589 863 8,834 0 8,8341999 1,258,279,198 12,360,782 851 9,412 0 9,4122000 1,292,203,504 13,284,511 765 10,309 0 10,3092001 1,296,026,938 11,177,559 730 10,476 0 10,4762002 $ 1,299,068,873 $ 13,319,981 675 11,153 0 11,1532003 $ 1,323,322,100 $ 13,199,134 776 11,496 0 11,496
(1) Money collected for tax on motor fuel not used for highway travel is refundable. Includes refunds for overpayments (e.g., commoncarriers).
(2) Includes distributors and suppliers.(3) The Illinois Interstate program was abolished January 1, 1997.
A provision in the Motor Fuel Tax Law allows for refundsof tax paid to consumers for nonhighway use of motorfuel, such as a manufacturing process. Refunds fornonhighway use totalled $13.32 million.
Table 22: Motor Fuel Tax Refunds for NonhighwayUse*
Nonhighway use Number Amount
Agriculture 4,704 $ 1,183,417Construction 35 15,941Industrial 299 4,623,258Marine 67 27,685Lawn 440 333,637Distributor 148 1,083,148Supplier 1 2,006Manufacturing (1) 8 59,398Research and Development (1) 3 204,597Commercial Motor Vehicles (1) 11 19,696Airports (1) (2) 0 0Refrigeration Units (1) 737 1,093,513Power Take-off Units (1) 558 1,799,896Unintentional Mixing (1) 2 9,659Testing (1) 7 75,073Dual Use (1) 52 1,147,270
Total 7,072 $ 11,678,194 * Does not include reciprocal claims and common carrier
refunds.(1) Refunds for undyed diesel fuel only beginning 7/1/01(2) Qualifying airports only
DistributionCollections from motor fuel taxes (excluding theUnderground Storage Tank Tax and the EnvironmentalImpact Fee) are divided among state and localgovernments according to a formula set by law.
The 2.5 cents additional tax on diesel fuel goes directlyinto the State Construction Account Fund. The GradeCrossing Protection Fund receives $2.25 million permonth, and $420,000 per month is transferred to the
Boating Act Fund. The Vehicle Inspection Fundreceives a transfer of $30 million annually. Departmentof Transportation and Department of Revenueadministrative costs, along with the cost of refunds,are deducted. The remainder is distributed as follows:
45.6 percent is distributed to the IllinoisDepartment of Transportation. Of this amount, 63percent is allocated to the Road Fund (includes$1.25 million reserved for use in accordance withprovisions of the Illinois Highway Code) and 37percent to the state Construction Fund.54.4 percent is shared by local governments and isdistributed as follows: 49.1 percent tomunicipalities, 16.74 percent to counties with morethan 1,000,000 residents (Cook County), 18.27percent to all other counties, and 15.89 percent toroad districts.
Graph 17: Motor Fuel Tax Collections
$1.3
$1.3
$1.3
$1.3
$1.3
$1.2
$1.2
$1.2
$1.1
$1.1
0.0 0.5 1.0 1.5
Billions
1994
1995
1996
1997
1998
1999
2000
2001
2002
2003

F I S C A L Y E A R 2 0 0 3 A N N U A L R E P O R T
Illinois Department of Revnue 27
Underground Storage Tax andEnvironmental Impact FeeStatutory References
Underground Storage Tax — 35 ILCS 505/2a-2b, 17Environmental Impact Fee — 415 ILCS 125/310
DefinitionBoth the tax and fee are imposed on the privilege ofbeing a receiver of certain petroleum products inIllinois. The fee is paid by the receiver who first sells oruses the following petroleum products:
Motor fuelHome heating oilKeroseneAviation fuel (in some cases)
Effective January 1, 1990, the Underground StorageTank Tax rate is three-tenths of one cent ($.003) pergallon of fuel. Effective May 22, 1996, and retroactiveto January 1, 1996, the Environmental Impact Fee rateis $60 per 7,500 gallons (eight-tenths of one cent[$.008] per gallon) of fuel sold.
DistributionCollections are deposited into the UndergroundStorage Tank Fund and are used by the IllinoisEnvironmental Protection Agency to clean up leakingstorage tanks.
Graph 18: UST and EIF Collections
$72.4
$69.4
$73.7
$73.6
$67.5
$66.7
$65.6
$38.4
$17.7
$17.6
0 20 40 60 80
Millions
1994
1995
1996
1997
1998
1999
2000
2001
2002
2003

28 Illinois Department of Revnue
F I S C A L Y E A R 2 0 0 3 A N N U A L R E P O R T
$643.1
$464.5
$470.4
$477.9
$485.8
$458.4
$408.3
$415.5
$423.8
$410.1
0 200 400 600 800
Millions
1994
1995
1996
1997
1998
1999
2000
2001
2002
2003
Excise and Utility TaxesCigarette and Cigarette UseTaxesStatutory References
Cigarette Tax Act — 35 ILCS 130/1 to 130/30Cigarette Use Tax Act — 35 ILCS 135/1 to 135/37
DefinitionThe Cigarette Tax Act imposes a tax on anyoneengaged in the business as a retailer of cigarettes inIllinois. Although the tax is imposed on the retailer,licensed distributors prepay the tax through thepurchase of stamps, which are affixed (either heat-transferred or hand-applied) to each cigarettepackage. The distributor, who is liable for the tax,collects the tax from the retailer at or before the timeof sale. The retailer passes the tax on to the consumerin the cigarette sale price. The Cigarette Use Tax Actimposes a tax on the privilege of using cigarettes inIllinois. This act duplicates the provisions of theCigarette Tax Act.
The rate for both Cigarette Tax and Cigarette Use Taxis 49 mills per cigarette or 98 cents per package of 20cigarettes. A $250 annual fee is charged for eachdistributor’s license. In addition, a $2,500 bond must beposted.
DistributionUnder the Cigarette Tax Act, the 8-cents-per-packincrease enacted in 1985 and the 14-cents-per-packincrease enacted in 1997 are deposited into theCommon School Fund (up to $17.3 million per month),1 cent per pack is placed in the Metropolitan Fair andExposition Authority Reconstruction Fund (up to $4.8million per year), and $16 million per month goes intothe General Revenue Fund. The remaining balancederived from the 58-cents-per-pack tax is used to payfor any unpaid amounts owed to the GeneralRevenue Fund and the Long-Term Care Provider Fund,respectively. After these delinquent amounts (if any)are paid, $9,545,000 per month is deposited into theLong-Term Care Provider Fund and all remainingcollections are placed into the Hospital Provider Fund.
Table 23: Cigarette Tax Rate History
Effective date Per cigarette Per pack of 20July 1, 1941 0.10¢ 2¢January 1, 1947 0.15¢ 3¢July 31, 1959 0.20¢ 4¢June 8, 1960 0.15¢ 3¢May 1, 1961 0.20¢ 4¢August 1, 1965 0.35¢ 7¢August 1, 1967 0.45¢ 9¢August 1, 1969 0.60¢ 12¢December 1, 1985 1.00¢ 20¢July 1, 1989 1.50¢ 30¢July 14, 1993 2.20¢ 44¢December 15, 1997 2.90¢ 58¢July 1, 2002 4.90¢ 98¢
Graph 19: Cigarette and Cigarette Use TaxCollections

F I S C A L Y E A R 2 0 0 3 A N N U A L R E P O R T
Illinois Department of Revnue 29
Coin-operated AmusementDevice and Redemption MachineTaxStatutory Reference35 ILCS 510/1 to 510/16
DefinitionThe tax is imposed on the privilege of operatingamusement devices that require insertion of coins,tokens, chips or similar objects. Jukeboxes, pinballmachines, kiddie rides, and coin-operated video gamesare among the many coin-operated amusementdevices that are required to display state decals underthe Coin-operated Amusement Device and RedemptionMachine Tax Act.
The tax is also imposed on the privilege of operatingredemption machines — single-player or multi-playeramusement devices involving a game whose purposeis to propel an object into, upon, or against a target.
Decals are valid for one year, and the license yearbegins August 1. The rate is $30 per decal.
Rate and Base HistoryThis annual tax became effective August 1, 1953, atthe following rates: $50 for pinball machines, $25 formechanical bowling and shuffleboard machines, and$10 for machines using electric light rays. In 1963, therate became $10 per coin-receiving slot.
Effective January 1, 1990, the rate was changed to $25per machine but was reduced February 1, 1990, to $15per decal for a full-year license. Decals issued on orafter February 1 for any year and ending July 31 ofthat year were $8. Redemption machines were addedto the tax base on May 8, 1992. Beginning with licenseyear 2003, decal are $30 per year.
DistributionCollections are deposited into the General RevenueFund.
Graph 20: Coin-operated Amusement Device andRedemption Machine Tax Collections
$1.15$1.30
$1.31
$1.31
$1.22
$1.46
$1.39
$1.30
$1.41
$1.27
0.0 0.5 1.0 1.5
Millions
1994
1995
1996
1997
1998
1999
2000
2001
2002
2003

30 Illinois Department of Revnue
F I S C A L Y E A R 2 0 0 3 A N N U A L R E P O R T
Dry-cleaning Solvent Tax andLicense FeesStatutory Reference415 ILCS 135/60 to 135/70
DefinitionThe Dry-cleaning Solvent Tax is imposed on the use ofdry-cleaning solvent by persons who operate dry-cleaning facilities in Illinois and has two different ratesdepending on the type of solvent used or purchased.The tax rate on chlorine-based solvents is $3.50 pergallon used or purchased. The tax rate on petroleum-based solvents is $0.35 per gallon used or purchased.
License fees are imposed on those who operate dry-cleaning facilities and are based on the amount andtype of dry-cleaning solvent purchased by a dry-cleaning facility operator and are determinedannually by the Dry-cleaner Environmental ResponseTrust Fund Council. Proof of license fee payment isrequired in order to receive a dry-cleaning licensefrom the Dry-cleaning Trust Fund Council. The licensefees are
$500 for a facility that purchases 140 gallons or lessof chlorine-based dry-cleaning solvents annually or1,400 gallons or less of petroleum-based dry-cleaning solvents annually$1,000 for a facility that purchases more than 140gallons but less than 360 gallons of chlorine-baseddry-cleaning solvents annually or more than 1,400gallons but less than 3,600 gallons of petroleum-based dry-cleaning solvents annually$1,500 for a facility that purchases 360 gallons ormore of chlorine-based dry-cleaning solventsannually or 3,600 gallons or more of petroleum-based dry-cleaning solvents annually
DistributionThe Dry-cleaner Environmental Response Trust FundCouncil issues the licenses and determines the tax rateannually. Collections are deposited into theDrycleaner Environmental Response Trust Fund.
Graph 21: Dry-cleaning Solvent Tax and LicenseFees Collections
$601
$917
$680
$969
$727
$1,044
$810
$1,177
$831
$836
$398
$780
0 200 400 600 800 1,000 1,200
Thousands
1998
1999
2000
2001
2002
2003
Tax Fees

F I S C A L Y E A R 2 0 0 3 A N N U A L R E P O R T
Illinois Department of Revnue 31
$353.3
$317.2
$367.7
$354.0
$325.0
$316.8
$315.8
$325.4
$297.0
$300.2
0 100 200 300 400
Millions
1994
1995
1996
1997
1998
1999
2000
2001
2002
2003
Electricity Excise TaxStatutory Reference35 ILCS 640/2-1 to 99
DefinitionThe tax is imposed on the privilege of using electricitypurchased in Illinois for use and consumption (not forresale). Each month, municipal systems and electriccooperatives collect tax from each purchaser in anamount equal to the lesser of 5 percent or $.0032 perkilowatt-hour (kwh) per customer. Delivering supplierscollect the following tax amounts from eachpurchaser monthly:
$.0033 per kilowatt-hours (kwhs) for the first 2,000kwhs$.00319 per kwh for the next 48,000 kwhs$.00303 per kwh for the next 50,000 kwhs$.00297 per kwh for the next 400,000 kwhs$.00286 per kwh for the next 500,000 kwhs$.00270 per kwh for the next 2 million kwhs$.00254 per kwh for the next 2 million kwhs$.00233 per kwh for the next 5 million kwhs$.00207 per kwh for the next 10 million kwhs$.00202 per kwh for all kwhs in excess of 20 millionkwhs
Self-assessing purchasers pay 5.1 percent of thepurchase price for all electricity distributed, supplied,furnished, sold, transmitted, and delivered to them in amonth.
HistoryThe tax was originally imposed under the Public UtilitiesRevenue Tax Act, which became effective March 11,1937. The Electricity Excise Tax Law became effectiveAugust 1, 1998.
DistributionCollections are deposited into the General RevenueFund.
Other taxesAn Electricity Distribution Tax and an Invested CapitalTax is also imposed. See “Revenue-Sharing with LocalGovernments, Replacement Taxes, for moreinformation.”
Table 24: Electricity Excise Tax Rate History
Effective date Rate
1937 3.00 percentAugust 1, 1965 4.00 percentSeptember 1, 1966 3.92 percentAugust 1, 1967 5.00 percentJanuary 1, 1986 (1) 5.00 percent or $0.0032 per kwh,
whichever is lessAugust 1, 1998 (2) See “Definition”
(1) Municipal systems and electric cooperatives (2) Public Utilities Revenue Tax was replaced by the Electricity
Excise Tax.
Graph 22: Electricity Excise Tax Collections

32 Illinois Department of Revnue
F I S C A L Y E A R 2 0 0 3 A N N U A L R E P O R T
$90.7$4.8
$89.7$2.9
$89.0$3.6
$85.8$0.1
$85.9$5.9
$31.6
$0.0
0 10 20 30 40 50 60 70 80 90 100
Millions
1998
1999
2000
2001
2002
2003
EACREC
Energy ChargesStatutory References
Energy Assistance Charge — 305 ILCS 20/13Renewable Energy Resources and CoalTechnology Development Assistance Charge — 20ILCS 687/6-5
DefinitionThe energy charges are amounts that a public utility, amunicipal utility, a cooperative, or an alternative retailelectric supplier collects monthly from each of itscustomers for electric or natural gas services deliveredby the utility, cooperative, or supplier.
The rates that are imposed for each of the energycharges depend on the type of customer and thecustomer’s electric or natural gas usage during thepast calendar year.
The monthly rates for the Energy Assistance Chargeare listed below. These rates became effectiveJanuary 1, 1998.
$0.40 per account to which residential electricservice is delivered$0.40 per account to which residential gas serviceis delivered$4.00 per account to which nonresidential electricservice is delivered and which had less than 10megawatts of peak demand during the previouscalendar year$4.00 per account to which nonresidential gasservice is delivered and which received less than 4million therms of gas during the previous calendaryear$300 per account to which nonresidential electricservice is delivered and which had 10 megawattsor more of peak demand during the previouscalendar year$300 per account to which nonresidential gasservice is delivered and which received 4 milliontherms or more of gas during the previouscalendar year
The monthly rates for the Renewable Energy Resourcesand Coal Technology Development AssistanceCharge are listed below. These rates becameeffective January 1, 1998.
$0.05 per account to which residential electricservice is delivered$0.05 per account to which residential gas serviceis delivered$0.50 per account to which nonresidential electricservice is delivered and that had less than 10megawatts of peak demand during the previouscalendar year$0.50 per account to which nonresidential gasservice is delivered and that received less than 4million therms of gas during the previous calendaryear
$37.50 per account to which nonresidentialelectric service is delivered and that had 10megawatts or more of peak demand during theprevious calendar year$37.50 per account to which nonresidentialnatural gas service is delivered and that received4 million therms or more of gas during the previouscalendar year
DistributionCollections from the Energy Assistance Charge aredeposited into the Supplemental Low-Income EnergyAssistance Fund. Collections from the RenewableEnergy Resources and Coal Technology DevelopmentAssistance Charge are deposited into the RenewableEnergy Resources Trust Fund and the Coal TechnologyDevelopment Assistance Fund. Each fund receives 50percent of the collections.
Graph 23: Energy Charges Collections

F I S C A L Y E A R 2 0 0 3 A N N U A L R E P O R T
Illinois Department of Revnue 33
Gas Revenue TaxStatutory Reference35 ILCS 615/1 to 615/15
DefinitionThe tax is imposed on persons who distribute, supply,furnish, or sell natural gas for use or consumption (notfor resale). The tax is calculated at the lesser of 5percent or 2.4 cents per therm per customer.
DistributionCollections are deposited into the General RevenueFund.
Other taxesAn Invested Capital Tax is also imposed. See“Revenue-Sharing with Local Governments,Replacement Taxes,” for more information.
Table 25: Gas Revenue Tax Rate History
Effective date Rate
March 11, 1937* 3.00 percentJuly 23, 1945* 3.00 percentAugust 1, 1965 4.00 percentSeptember 1, 1966 3.92 percentAugust 1, 1967 5.00 percentJanuary 1, 1986 5 percent or 2.4 cents, per
therm per customer, whicheveris less
* The tax was originally collected under the Public UtilitiesRevenue Act. The Gas Revenue Tax was adopted July 24, 1945.
Graph 24: Gas Revenue Tax Collections
$144.3
$109.5
$150.6
$127.8
$106.4
$134.0
$151.3
$131.9$130.9
$155.8
0 50 100 150 200
Millions
1994
1995
1996
1997
1998
1999
2000
2001
2002
2003

34 Illinois Department of Revnue
F I S C A L Y E A R 2 0 0 3 A N N U A L R E P O R T
$150.7
$149.6
$170.0
$161.0
$151.6
$139.8
$126.2
$113.0
$104.3
$95.6
0 50 100 150 200
Millions
1994
1995
1996
1997
1998
1999
2000
2001
2002
2003
Hotel Operators’ Occupation TaxStatutory Reference35 ILCS 145/1 to 145/10
DefinitionThe tax is imposed on the occupation of renting,leasing, or letting rooms to persons for living quartersfor periods of less than 30 days. The rate is comprisedof two tax rates:
5 percent of 94 percent of the gross receipts fromrenting, leasing, or letting rooms for periods of lessthan 30 days andan additional tax of 1 percent of 94 percent of thegross receipts from renting, leasing, or letting roomsfor periods of less than 30 days.
Distribution5 percent of 94 percent of gross rental receipts
40 percent of the total net proceeds is depositedinto the Build Illinois Fund.60 percent of the total net proceeds is distributedin the following order:— Illinois Sports Facilities Fund: $5 million plus an
advance amount of $22,179,000 for FY 2002— Local Tourism Fund: 8 percent of the net
revenues received— International Tourism Fund: 6.0 percent of the
net FY 2002 revenues received— General Revenue Fund: remaining net revenues
with a subsequent transfer to the TourismPromotion Fund equal to 21 percent of theamount deposited in the General Revenue Fund
1 percent of 94 percent of gross rental receiptsBuild Illinois Fund: 100 percent.
Local Taxes Collected by the DepartmentThe department collects the following locally imposedhotel taxes:
Metropolitan Pier and Exposition Authority (MPEA)Hotel Operators’ Occupation TaxMunicipal Hotel Operators’ Occupation Tax(Chicago)Sports Facilities Authority Hotel Operators’Occupation Tax
See “Taxes Collected for Local Governments” formore information.
Table 26: Hotel Operators’ Occupation Tax RateHistory
Effective date Rate
August 1, 1961 3 percent of 97 percent*July 1, 1969 5 percent of 95 percent*
August 1, 19845 percent of 94 percent*
+ 1 percent of 94 percent*
6 percent of 94 percent* * of gross rental receipts
Graph 25: Hotel Operators’ Occupation TaxCollections

F I S C A L Y E A R 2 0 0 3 A N N U A L R E P O R T
Illinois Department of Revnue 35
Table 27: Hotel Net Receipts by CountyNo. of FY 2001 No. of FY 2002 No. of FY 2003
County Accounts Receipts Accounts Receipts Accounts Receipts
Adams 21 $ 8,041,948 20 $ 8,771,986 21 $ 8,400,537Alexander 12 332,660 11 318,679 12 302,282Bond 10 1,766,542 12 1,756,555 8 1,669,074Boone 5 121,073 5 127,690 4 110,205Bureau 14 1,796,538 14 1,584,682 13 1,420,464Carrol 24 1,601,169 21 1,578,157 20 1,330,352Champaign 56 36,365,311 56 34,028,435 64 36,981,661Christian 8 730,406 8 698,115 10 702,170Clinton 10 700,795 11 1,009,476 13 1,120,194Coles 19 6,535,989 18 6,343,227 21 6,527,524Cook 638 2,027,556,238 626 1,718,417,555 637 1,800,780,593Crawford 5 1,286,533 5 1,286,998 8 1,306,054DeKalb 15 6,105,122 15 6,088,390 16 6,392,531DeWitt 7 1,199,214 6 1,275,022 5 1,232,125Douglas 20 3,448,913 18 3,377,739 15 3,530,630DuPage 165 295,656,681 163 243,770,147 169 242,578,737Effingham 28 12,946,869 26 13,220,678 26 12,888,722Fayette 9 2,061,632 8 2,090,106 7 2,136,924Franklin 15 3,395,957 17 3,726,351 16 3,583,764Fulton 13 869,248 12 783,532 9 805,659Grundy 9 4,326,014 8 4,461,680 8 4,151,757Hancock 22 1,504,201 36 2,372,678 37 3,177,273Jackson 24 6,809,400 24 6,333,353 24 7,026,848Jefferson 19 11,448,665 18 12,042,581 19 12,642,847Jersey 14 2,678,142 12 2,654,916 18 2,765,617Jo Daviess 160 25,876,519 150 25,122,112 142 24,002,460Kane 42 38,472,747 38 36,913,650 43 43,885,444Kankakee 19 8,266,895 17 8,119,898 17 8,046,800Kendall 11 2,305,567 10 2,122,974 11 2,127,956Knox 23 5,982,401 21 6,106,732 21 5,824,943Lake 130 120,455,899 135 112,514,511 138 107,545,881LaSalle 44 14,249,527 44 13,771,411 43 14,664,745Lee 7 2,186,201 7 1,867,445 8 2,130,700Livingston 9 2,086,986 10 2,029,601 8 2,215,678Logan 11 2,440,323 10 2,470,629 10 2,498,926McDonough 13 3,611,674 11 3,929,018 13 3,654,343McHenry 30 12,275,329 28 12,639,680 31 11,717,000McLean 45 35,101,145 45 37,692,976 41 35,684,355Macon 22 13,703,068 20 12,966,820 22 12,630,768Macoupin 8 2,051,209 9 2,065,498 9 1,998,566Madison 69 27,542,809 65 29,614,303 66 28,069,211Marion 18 3,092,505 13 2,924,060 12 2,873,988Mason 7 435,113 7 382,092 6 372,273Montgomery 12 2,856,033 10 2,832,651 9 2,593,638Morgan 11 2,729,373 11 2,476,769 15 3,544,719Ogle 22 4,130,899 19 4,109,893 19 4,268,668Peoria 42 32,269,132 38 33,188,507 39 31,645,715Perry 9 740,203 9 745,474 8 702,089Rock Island 30 18,419,965 26 18,299,612 25 17,234,489St Clair 57 26,074,959 54 25,271,148 60 25,428,224Sangamon 55 49,615,868 49 49,271,949 56 50,140,621Shelby 17 3,028,811 17 2,862,930 15 2,735,234Stephenson 11 3,366,384 11 3,213,660 15 3,529,878Tazewell 34 16,664,976 31 17,235,301 27 18,564,870Vermilion 23 7,221,466 20 7,075,479 21 7,815,091Washington 8 1,127,306 8 1,137,974 8 1,127,790White 5 969,408 4 1,080,023 5 244,701Whiteside 13 3,365,987 13 3,343,172 14 4,126,979Will 73 38,706,544 69 39,022,130 74 40,296,965Williamson 20 9,712,459 20 10,269,313 23 10,842,849Winnebago 49 35,415,166 48 32,913,989 51 32,552,322
Brown & Schuyler 7 422,549 6 461,506 6 478,611Calhoun & Green 7 293,730 8 252,475 5 262,772Cass & Menard 6 522,956 6 501,488 8 523,277Clark & Edgar 10 1,813,030 9 1,950,256 11 2,111,378Clay, Cumberland & Jasper 10 925,128 10 1,072,039 10 996,992Edwards, Wabash & Wayne 9 494,761 9 552,691 11 1,707,149Ford & Iroquois 13 1,753,927 11 1,692,346 12 1,685,715Gallatin, Hardin & Hardin 11 267,117 12 272,182 12 318,335Henderson, Mercer & Warren 9 1,135,684 9 1,136,521 12 1,175,854Henry & Stark 18 1,875,960 17 1,851,640 20 1,994,754Johnson & Union 18 861,609 18 1,162,510 21 1,192,694Lawrence & Richland 7 1,029,899 7 1,034,695 9 973,068Marshall, Putnam & Woodford 6 993,971 5 935,812 5 1,080,336Massac & Pulaski 11 4,568,282 11 5,160,415 10 5,223,156Monroe & Randolph 18 1,761,624 18 1,849,275 19 1,681,065Moultrie & Piatt 10 920,055 11 915,624 10 1,013,211Pike & Scott 12 542,054 12 632,794 13 691,352Pope & Saline 22 1,121,196 25 1,468,631 24 1,437,935Total 2,545 $ 3,037,139,648 2,471 $ 2,668,625,012 2,543 $ 2,755,451,075
ExampleAdams County net receipts: $ 8,400,537State hotel tax (6% of 94% = 5.64%): X .0564Approximate state tax collections $ 473,790
Note: Some counties have been combined to preserve taxpayer confidentiality.Net receipts represent hotel revenue on which state and local taxes are calculated.To figure approximate tax receipts, see the example.

36 Illinois Department of Revnue
F I S C A L Y E A R 2 0 0 3 A N N U A L R E P O R T
Liquor Gallonage TaxStatutory Reference235 ILCS 5/8-1 to 5/8-14
DefinitionIllinois imposes a tax on businessesthat are manufacturers orimporting distributors of liquor. Thetax rates are listed below.
18.5 cents per gallon of beer18.5 cents per gallon of ciderwith an alcohol content of 0.5percent to 7 percent73 cents per gallon of wineother than cider with analcohol content of less than 20percent$4.50 per gallon for alcoholicliquor with an alcohol contentof 20 percent or more
DistributionCollections are deposited into the General RevenueFund.
Table 28: Liquor Tax Rate History
Cider Wine Wine AlcoholEffective 0.5%-7% </= > 14% - = / >date or Beer 14% < 20% 20%July 1, 1934 $.02 $.10 $.25 $ .50July 1, 1941 $.04 $.15 $.40 $1.00July 1, 1957 $.04 $.15 $.40 $1.02Aug. 1, 1959 $.06 $.23 $.60 $1.52Aug. 1, 1969 $.07 $.23 $.60 $2.00July 1, 1999 $.185 $.73 $.73 $4.50
Table 29: Liquor Gallonage History(in millions of gallons)
Cider Wine WineFiscal 0.5%-7% < / = >14% - =/>year & Beer 14% <20% 20% Total1993 274.6 21.1 3.5 16.6 315.81994 276.7 21.3 3.1 16.1 317.21995 274.8 21.6 2.9 15.5 314.81996 276.8 22.3 2.8 15.9 317.81997 269.8 22.9 2.7 15.5 310.91998 274.2 23.3 2.8 15.3 315.61999 276.9 22.3 2.6 15.3 317.12000 282.0 21.9 3.0 15.5 322.42001 281.7 22.3 2.4 16.5 323.02002 283.3 22.9 2.3 15.6 324.12003 314.0 23.9 2.4 15.9 356.1
Graph 26: Liquor Gallonage Tax Collections
0
10
20
30
40
50
60
70
80
Mill
ion
sBeer/cider $19.4 $19.2 $19.4 $18.9 $19.2 $19.4 $48.2 $50.5 $52.4 $52.9
Wine </= 14% $4.9 $5.0 $5.4 $5.3 $5.4 $5.1 $14.7 $15.8 $16.9 $16.9
Wine >14%-<20% $1.9 $1.7 $1.7 $1.6 $1.7 $1.5 $2.1 $1.7 $1.7 $1.7
Alc. =/> 20% $33.0 $31.1 $31.9 $31.3 $30.7 $30.8 $63.5 $72.1 $70.0 $71.0
1994 1995 1996 1997 1998 1999 2000 2001 2002 2003

F I S C A L Y E A R 2 0 0 3 A N N U A L R E P O R T
Illinois Department of Revnue 37
Oil and Gas ProductionAssessmentStatutory Reference225 ILCS 728/30 to 728/99
DefinitionEffective July 10, 1998, the assessment is levied ongross revenues of oil and gas produced from eachwell in Illinois. It is imposed on Illinois oil or gasproducers and is paid by the first purchaser of the oilor gas. The first purchaser pays the assessment to thedepartment. The Illinois Petroleum Resources Boardadministers and enforces this assessment. Theassessment is levied in the amount of 0.1 percent ofthe gross revenues of oil and gas produced from eachwell in Illinois.
DistributionAmounts collected are distributed to the IllinoisPetroleum Resources Board. Revenues are used to
demonstrate the importance of Illinois’ oilexploration and production industry;encourage the wise and efficient use of energy,promote environmentally sound productionmethods and technologies,develop existing supplies of Illinois oil resources,andsupport research and educational activitiesconcerning the oil exploration and productionindustry.
Graph 27: Oil and Gas Production AssessmentCollections
$301.5
$259.3
$293.9
$239.5
$129.9
0 100 200 300 400
Thousands
1999
2000
2001
2002
2003

38 Illinois Department of Revnue
F I S C A L Y E A R 2 0 0 3 A N N U A L R E P O R T
$657.3$756.3
$793.2
$776.1
$675.9
$499.3
$404.4
$387.5
$318.8
$332.0
0 200 400 600 800
Millions
1994
1995
1996
1997
1998
1999
2000
2001
2002
2003
Telecommunications Excise TaxStatutory Reference35 ILCS 630/1 to 630/21
DefinitionThe tax is imposed on intrastate messages (i.e., thosethat originate and terminate in Illinois) as well asinterstate messages. The rate is 7 percent of grosscharges.
In addition to this tax, a state telecommunicationsinfrastructure maintenance fee (TIMF) is imposed onpersons in the business of transmitting, supplying, orfurnishing telecommunications and all associatedservices in Illinois for compensation (i.e., telecommuni-cations retailers).
DistributionCollections from the 5 percent rate effective August 1,1967, are deposited into the General Revenue Fund,minus $1 million per month, which is deposited into theCommon School Fund. Proceeds from the 2 percentincrease effective January 1, 1998, are dividedequally between the School Infrastructure Fund andthe Common School Fund.
Local Taxes Collected by the DepartmentMunicipalities may impose the Simplified MunicipalTelecommunications Tax on the privilege of originatingor receiving telecommunications. Beginning January1, 2003, telecommunication service providers whohave customers who have a service address that islocated in a municipality with a population of 500,000or less, must report and pay the municipal taxesdirectly to the department. The department collectsthe tax for these municipalities and returns it to themeach month, minus an administrative fee of 0.5 per-cent. The Chicago Department of Revenue collectsthe tax for the City of Chicago.
Table 30: Telecommunications Excise TaxRate History
Effective date RateMarch 11, 1937 3.00%August 1, 1965 4.00%September 1, 1966 3.92%August 1, 1967 5.00%January 1, 1998 7.00%
Graph 28: Telecommunications Excise TaxCollections

F I S C A L Y E A R 2 0 0 3 A N N U A L R E P O R T
Illinois Department of Revnue 39
Tobacco Products TaxStatutory Reference35 ILCS 143/10-1
DefinitionThe tax is imposed on tobacco products (other thancigarettes), including cigars; cheroots; stogies;periques; granulated, plug-cut, crimp-cut, ready-rubbed and other smoking tobacco; snuff or snuffflour; cavendish; plug and twist tobacco; fine-cut andother chewing tobaccos; refuse scraps, clippings,cuttings and sweepings of tobacco; and other kindsand forms of tobacco suitable for chewing orsmoking. The rate is 18 percent of the wholesale priceof tobacco products sold by a distributor.
Rate HistoryThe original Tobacco Products Tax Act becameeffective October 1, 1993. The tax imposed under thisact was at the rate of 20 percent of the wholesaleprice of tobacco products. The circuit court of CookCounty declared the tax unconstitutional onJanuary 12, 1995.
On September 1, 1995, a new tobacco products taxwas imposed under the Tobacco Products Tax Act of1995. This tax is at the rate of 18 percent of thewholesale price of tobacco products sold by adistributor.
DistributionCollections are deposited into the Long-Term CareProvider Fund.
Graph 29: Tobacco Products Tax Collections
$18.3
$17.7
$17.3
$17.8
$16.9
$17.1
$16.5
$10.3
$5.1
$5.8
0 5 10 15 20
Millions
1994
1995
1996
1997
1998
1999
2000
2001
2002
2003

40 Illinois Department of Revnue
F I S C A L Y E A R 2 0 0 3 A N N U A L R E P O R T
$4.44$0.22
$4.66$0.24$4.95$0.24
$5.50$0.26
$5.85$0.28$6.48$0.30
$6.75$0.32
$7.12$0.33
$7.29$0.33$7.47
$0.36
0 2 4 6 8
Millions
1994
1995
1996
1997
1998
1999
2000
2001
2002
2003
Tax License
Gaming TaxesBingo Tax and License FeesStatutory Reference230 ILCS 25/1 to 25/7
DefinitionThe tax is imposed on the privilege of conductingbingo games. Annual license fees are imposed onsuppliers, providers, and operators of bingo games. Tooperate a bingo game, the organization must
be licensed by the state;be a licensed bona fide religious, charitable, labor,fraternal, youth athletic, senior citizens’,educational, or veterans’ organization in Illinois;operate without profit to its members;have been in existence in Illinois continuously for aperiod of five years immediately before applyingfor a license; and— it must have a bona fide membership engaged
in carrying out its objectives during that entirefive-year period. (Note: The five-yearrequirement is reduced to two years when it isapplied to a local organization that is affiliatedwith and chartered by a national organizationthat meets the five-year requirement.)
The rate is 5 percent of gross proceeds. License feesare imposed in the following amounts:
An operator’s license is $200 and permits anorganization to hold one bingo session a week,with a maximum of 25 bingo games per sessionand a maximum of $2,250 in prizes or merchandiseper session. (In Madison, Monroe, and St. Claircounties, and the City of Redbud, the prize limit is$3,250.) A licensed organization may obtainpermits to hold two special events per year of upto seven days each.Organizations that would qualify for annuallicenses but prefer not to conduct weekly bingosessions may obtain a limited license for $50. This
license entitles them to conduct a maximum oftwo bingo events during the year. Each event islimited to five consecutive days.Persons, firms, or organizations that sell, lease, orotherwise distribute bingo supplies (e.g., cards ormarkers) must purchase a supplier’s license for $200.Persons, firms, or organizations that rent or leasepremises (e.g., rooms, halls, or buildings) for bingogames must purchase a provider’s license for $200.
Rate HistoryThe original 10 percent tax on the gross receipts frombingo games was effective from October 1, 1971,through December 31, 1978. Effective January 1, 1979,the rate was reduced to 5 percent.
DistributionTax collections are divided evenly between theCommon School Fund and the Mental Health Fund.License Fees collections are deposited into theGeneral Revenue Fund.
Graph 30: Bingo Tax and License Fees Collections
Table 31: Bingo Tax and License Fee CollectionsNo. of
Fiscal License *No. of limited No. of No. ofyear Tax fees licenses licenses suppliers providers
1993 $ 7,814,672 $ 360,220 1,384 383 93 1661994 7,474,444 363,495 1,375 378 107 1691995 7,294,153 334,130 1,915 362 122 1581996 7,124,471 334,570 1,237 393 115 1591997 6,746,008 318,960 1,171 368 121 1561998 6,476,875 297,900 1,167 353 112 1361999 5,852,258 284,260 1,031 342 104 1292000 5,499,934 259,130 899 311 100 1092001 4,950,235 240,530 905 295 93 982002 4,663,448 240,770 871 279 93 1002003 $ 4,441,719 $ 224,150 811 281 94 96* Total licenses in effect on June 30 of the given fiscal year.

F I S C A L Y E A R 2 0 0 3 A N N U A L R E P O R T
Illinois Department of Revnue 41
Table 32: Bingo Tax Statistics by CountyCounty FY 01 FY 02 FY 03Adams
Players 37,907 30,284 26,221Gross $776,585 $652,385 $568,449
Tax $38,153 $32,746 $28,422Alexander
Players 1,703 1,192 576Gross $28,640 $21,260 $10,455
Tax $1,432 $1,063 $523Bond
Players 2,676 0 0Gross $48,595 $0 $0
Tax $2,429 $0 $0Boone
Players 18,038 18,090 15,722Gross $369,533 $381,167 $322,611
Tax $18,477 $19,057 $16,131Brown
Players 0 0 0Gross $0 $0 $0
Tax $0 $0 $0Bureau
Players 20,672 24,040 24,084Gross $394,642 $468,003 $496,179
Tax $19,681 $23,400 $24,809Calhoun
Players 3,587 4,167 3,988Gross $56,834 $64,650 $54,011
Tax $2,842 $3,232 $2,701Carroll
Players 10,651 9,214 9,721Gross $222,018 $233,616 $214,090
Tax $10,927 $11,719 $10,704Cass
Players 7,952 9,387 11,022Gross $127,476 $92,901 $80,254
Tax $6,350 $4,674 $4,013Champaign
Players 45,052 42,936 41,685Gross $972,985 $896,002 $916,842
Tax $48,659 $44,800 $45,842Christian
Players 73,381 70,740 65,915Gross $1,206,592 $1,160,710 $1,051,926
Tax $60,404 $58,107 $52,636Clark
Players 669 0 0Gross $11,735 $0 $0
Tax $587 $0 $0Clay
Players 7,140 6,545 6,540Gross $93,860 $89,299 $91,322
Tax $4,693 $4,464 $4,566Clinton
Players 75,161 77,216 74,598Gross $1,114,699 $1,198,639 $1,150,351
Tax $55,735 $59,931 $58,655Coles
Players 44,762 42,749 37,884Gross $896,599 $818,304 $728,917
Tax $44,829 $41,066 $36,446Cook
Players 1,266,391 1,169,531 1,140,473Gross $21,695,124 $21,111,462 $19,603,251
Tax $1,085,176 $1,059,317 $984,222Crawford
Players 5,493 5,790 5,338Gross $39,705 $51,012 $56,205
Tax $1,985 $2,550 $2,810Cumberland
Players 4,911 3,796 5,014Gross $99,949 $73,027 $99,532
Tax $4,997 $3,651 $4,977DeKalb
Players 23,195 26,526 22,620Gross $499,215 $510,235 $472,079
Tax $24,960 $25,511 $23,604DeWitt
Players 10,442 11,216 11,159Gross $211,468 $185,229 $178,307
Tax $10,573 $9,261 $8,915Douglas
Players 93,104 7,717 6,552Gross $198,368 $159,442 $133,920
Tax $9,919 $7,972 $6,714DuPage
Players 276,174 191,079 166,704Gross $3,346,418 $3,158,371 $3,122,070
Tax $165,706 $158,343 $157,030Edgar
Players 19,763 18,286 11,766Gross $350,056 $336,575 $296,199
Tax $17,514 $16,876 $14,870Edwards
Players 0 0 0Gross $0 $0 $0
Tax $0 $0 $0Effingham
Players 26,512 28,068 25,660Gross $558,291 $542,576 $494,970
Tax $27,914 $27,989 $24,799Fayette
Players 28,759 27,851 25,156Gross $505,106 $510,197 $463,350
Tax $25,255 $25,509 $23,168
County FY 01 FY 02 FY 03Ford
Players 6,569 6,877 5,955Gross $157,279 $164,050 $164,288
Tax $7,863 $8,260 $8,216Franklin
Players 47,651 42,422 38,862Gross $1,036,999 $903,253 $879,651
Tax $51,850 $45,662 $44,053Fulton
Players 30,078 27,337 25,217Gross $597,932 $557,973 $524,638
Tax $29,897 $27,956 $26,232Gallatin
Players 539 0 0Gross $11,394 $0 $0
Tax $570 $0 $0Greene
Players 7,133 7,290 5,838Gross $99,666 $100,156 $82,500
Tax $4,984 $5,007 $4,125Grundy
Players 20,086 17,793 17,987Gross $435,878 $403,794 $398,438
Tax $21,794 $20,228 $19,922Hamilton
Players 0 0 0Gross $0 $0 $0
Tax $0 $0 $0Hancock
Players 11,203 11,208 10,735Gross 195,933 190,675 $166,239
Tax $9,797 $9,612 $8,754Hardin
Players 0 0 0Gross $0 $0 $0
Tax $0 $0 $0Henderson
Players 1,884 1,757 1,964Gross $19,808 $20,568 $23,831
Tax $990 $1,028 $1,192Henry
Players 32,516 33,595 28,328Gross $579,994 $569,786 $511,673
Tax $29,298 $28,543 $25,649Iroquois
Players 863 2,369 5,284Gross $11,887 $47,256 $86,224
Tax $594 $2,389 $4,311Jackson
Players 31,140 28,601 19,786Gross $780,034 $795,232 $673,697
Tax $39,003 $39,806 $33,685Jaspar
Players 127 0 0Gross $1,920 $0 $0
Tax $96 $0 $0Jefferson
Players 32,458 30,204 27,250Gross $670,726 $609,628 $539,020
Tax $33,536 $30,481 $27,307Jersey
Players 11,582 10,050 9,844Gross 174,828 159,394 $157,262
Tax $8,742 $8,030 $7,863Jo Daviess
Players 1,599 2,442 2,423Gross $33,804 $34,402 $41,202
Tax $1,690 $1,720 $2,060Johnson
Players 0 0 0Gross $0 $0 $0
Tax $0 $0 $0Kane
Players 143,392 127,667 111,634Gross $2,994,236 $2,702,571 $2,443,606
Tax $147,027 $135,576 $123,488Kankakee
Players 27,062 26,508 24,177Gross $661,601 $606,771 $559,337
Tax $33,080 $30,424 $27,967Kendall
Players 39,603 27,799 26,742Gross $554,988 $596,579 $558,389
Tax $27,749 $29,828 $28,025Knox
Players 42,660 50,114 50,078Gross $773,161 $850,802 $912,806
Tax $38,679 $42,654 $45,640Lake
Players 163,666 156,359 150,189Gross $3,511,602 $3,212,422 $2,977,411
Tax $175,569 $161,404 $149,233LaSalle
Players 116,024 105,928 92,388Gross $2,277,202 $2,112,022 $1,951,215
Tax $113,861 $106,671 $97,679Lawrence
Players 6,228 7,066 5,825Gross $225,441 $220,257 $192,516
Tax $11,272 $11,012 $9,626Lee
Players 13,928 13,435 10,935Gross $314,230 $304,257 $278,789
Tax $15,711 $15,363 $13,939

42 Illinois Department of Revnue
F I S C A L Y E A R 2 0 0 3 A N N U A L R E P O R T
Table 32: Bingo Tax Statistics by CountyCounty FY 01 FY 02 FY 03Livingston
Players 11,887 11,507 10,814Gross $275,516 $282,762 $257,120
Tax $13,776 $14,192 $12,856Logan
Players 19,619 22,360 23,710Gross $372,755 $332,918 $319,371
Tax $18,760 $16,645 $15,970McDonough
Players 23,595 20,220 18,252Gross $541,798 $461,050 $438,255
Tax $27,103 $23,061 $21,913McHenry
Players 58,585 57,063 53,559Gross $1,259,972 $1,263,775 $1,177,674
Tax $63,000 $63,549 $58,947McLean
Players 35,305 37,731 35,894Gross $768,688 $791,616 $777,587
Tax $38,625 $39,660 $39,259Macon
Players 174,578 151,752 125,388Gross 1,746,414 1,540,489 $1,481,840
Tax $86,971 $77,665 $74,096Macoupin
Players 56,029 53,115 54,906Gross $1,105,839 $1,065,308 $1,092,580
Tax $55,362 $53,366 $54,683Madison
Players 413,654 409,402 362,316Gross $8,172,750 $7,863,358 $7,423,674
Tax $408,640 $394,528 $374,374Marion
Players 51,770 55,066 52,369Gross $1,139,709 $1,169,627 $1,049,771
Tax $56,978 $58,513 $52,575Marshall
Players 3,742 3,421 2,142Gross $68,924 $62,990 $58,551
Tax $3,446 $3,149 $2,928Mason
Players 2,933 2,696 2,772Gross $48,793 $49,993 $50,387
Tax $2,439 $2,499 $2,519Massac
Players 0 0 0Gross $0 $0 $0
Tax $0 $0 $0Menard
Players 2,933 2,188 1,583Gross $54,738 $38,646 $26,870
Tax $2,737 $1,932 $1,344Mercer
Players 2,777 4,231 5,365Gross $54,086 $82,636 $110,364
Tax $2,704 $4,131 $5,518Monroe
Players 19,258 20,692 18,790Gross $422,066 $433,452 $407,202
Tax $21,103 $21,718 $20,360Montgomery
Players 36,282 32,833 29,088Gross $740,037 $708,421 $693,601
Tax $37,001 $35,421 $34,680Morgan
Players 24,754 20,624 10,270Gross $290,968 $243,467 $140,862
Tax $14,244 $12,173 $7,293Moultrie
Players 14,109 13,838 12,399Gross $227,014 $219,207 $202,482
Tax $11,351 $10,960 $10,124Ogle
Players 11,070 7,383 7,029Gross $140,900 $87,445 $86,557
Tax $7,045 $4,897 $4,328Peoria
Players 78,441 78,076 58,086Gross $923,152 $952,610 $723,790
Tax $47,068 $47,731 $36,357Perry
Players 44,271 40,731 37,447Gross $805,708 $781,275 $721,290
Tax $40,426 $39,123 $36,064Piatt
Players 0 0 250Gross $0 $0 $1,808
Tax $0 $0 $90Pike
Players 7,340 6,493 4,181Gross $140,568 $123,684 $79,810
Tax $7,028 $6,184 $3,991Pope
Players 0 0 0Gross $0 $0 $0
Tax $0 $0 $0Pulaski
Players 0 0 0Gross $0 $0 $0
Tax $0 $0 $0Putnam
Players 0 0 0Gross $0 $0 $0
Tax $0 $0 $0
County FY 01 FY 02 FY 03Randolph
Players 38,403 37,744 33,943Gross $776,959 $755,006 $728,245
Tax $38,848 $37,810 $36,412Richland
Players 15,289 15,491 12,797Gross $295,174 $303,195 $249,099
Tax $14,759 $15,159 $12,461Rock Island
Players 160,101 140,882 127,843Gross $2,721,884 $2,389,193 $2,384,276
Tax $135,178 $119,567 $119,548St. Clair
Players 289,699 276,916 267,233Gross $5,707,056 $5,657,610 $5,389,189
Tax $286,394 $282,883 $269,952Saline
Players 20,442 16,851 17,479Gross $327,198 $275,931 $294,168
Tax $16,360 $13,853 $14,708Sangamon
Players 195,902 171,701 133,694Gross $2,144,984 $2,021,281 $1,822,382
Tax $107,251 $101,141 $91,534Schuyler
Players 2,170 731 200Gross $42,832 $43,681 $45,451
Tax $2,142 $2,184 $2,273Scott
Players 2,674 2,612 2,453Gross $39,800 $34,005 $26,692
Tax $1,990 $1,715 $1,335Shelby
Players 12,400 17,784 18,921Gross $140,274 $179,741 $203,841
Tax $7,014 $9,320 $10,213Stark
Players 0 0 0Gross $0 $0 $0
Tax $0 $0 $0Stephenson
Players 24,020 23,670 26,768Gross $416,908 $411,220 $424,836
Tax $20,846 $20,693 $21,242Tazwell
Players 95,754 77,034 68,361Gross $1,349,360 $1,127,997 $1,073,689
Tax $67,710 $56,545 $54,222Union
Players 8,488 6,468 6,091Gross $209,633 $197,665 $198,388
Tax $10,481 $9,893 $9,978Vermilion
Players 37,408 34,245 26,491Gross $675,958 $645,820 $514,893
Tax $34,261 $32,528 $25,930Wabash
Players 11,104 10,776 10,320Gross $334,958 $329,658 $309,254
Tax $16,748 $16,482 $15,520Warren
Players 21,379 16,263 15,192Gross $169,760 $173,777 $156,622
Tax $8,487 $8,688 $7,831Washington
Players 16,812 15,062 13,294Gross $207,021 $186,572 $170,852
Tax $10,350 $9,328 $8,543Wayne
Players 6,634 5,748 5,529Gross $124,208 $112,331 $106,599
Tax $6,211 $5,616 $5,330White
Players 11,095 10,346 10,494Gross $213,526 $201,339 $212,190
Tax $10,876 $10,129 $10,703Whiteside
Players 55,776 55,728 50,963Gross $1,135,889 $1,185,885 $1,045,272
Tax $56,795 $59,334 $52,324Will
Players 117,487 114,321 105,061Gross $2,428,372 $2,330,634 $2,110,624
Tax $121,419 $116,859 $105,733Williamson
Players 59,912 60,349 54,381Gross $1,210,228 $1,286,875 $1,126,440
Tax $60,488 $64,343 $56,322Winnebago
Players 284,010 285,666 307,708Gross $4,482,351 $4,441,898 $4,628,499
Tax $224,141 $222,889 $233,722Woodford
Players 28,941 38,916 41,694Gross $324,581 $505,868 $490,608
Tax $16,229 $25,331 $24,852Grand total
Players 5,500,918 5,049,967 4,693,359Gross $94,724,345 $91,228,821 $85,761,573
Tax $4,733,634 $4,576,279 $4,306,481
Note: Grand total figures may not agree with the reported collectionsbecause these statistics are taken directly from bingo tax returnsand are unedited.

F I S C A L Y E A R 2 0 0 3 A N N U A L R E P O R T
Illinois Department of Revnue 43
$104.2$49.6
$109.0$47.6$114.2$46.4$112.8$52.9
$123.9$57.4$141.1$61.0
$180.3$71.5$211.1$82.3
$516.1$114.7$563.8$129.6
0 100 200 300 400 500 600
Thousands
1994
1995
1996
1997
1998
1999
2000
2001
2002
2003
Tax
License
Charitable Games Tax andLicense FeesStatutory Reference230 ILCS 30/1 to 30/15
DefinitionThe tax is imposed on the gross proceeds of charitablegames; license fees are imposed on operators,suppliers, and providers of such games. Fourteengames are permitted: bang, beat the dealer, big six,blackjack, chuck-a-luck, craps, five-card stud poker,gin rummy, hold-em poker, keno, merchandise wheel,poker, pull tabs, and roulette. Profits from the gamesmust be used to support the organization’s goals, suchas charitable work or education. A licensedorganization may hold up to four charitable gameevents per year.
In order for a group to be eligible to conductcharitable games, it must
be a religious, charitable, educational, veterans’,fraternal, or labor organization;have been in existence for at least five years;operate without profit to its members; andalready be exempt from federal income taxationunder Internal Revenue Code, Section 501(c)(3),(4), (5), (8), (10), or (19).
Note: Veterans’ organizations that are eligible to holda bingo license are also eligible for a charitable gamelicense without regard to federal tax status.
The tax rate is 3 percent of gross proceeds andbecame effective September 1, 1986. License fees arealso imposed. One annual application is good for fourevents; however, if all four dates are not requested atapplication time, an organization may amend or adddates by requesting an amendment in writing 30 daysprior to an event.
Organizations conducting charitable games arerequired to pay a $200 annual license fee.Suppliers of gaming equipment are required topurchase a $500 annual license fee.A $50 annual “provider’s fee” is imposed onanyone who rents space to be used for acharitable game.
DistributionTax collections are deposited into the Illinois GamingLaw Enforcement Fund. From this fund, two-thirds goesto the Department of Revenue, the Department ofState Police, and the Office of the Attorney General.One-third is distributed to cities and counties wherelicensed games are held and is to be used for lawenforcement purposes.
License fee collections generated from the supplierand provider license fees are deposited into theGeneral Revenue Fund. The Illinois Gaming LawEnforcement Fund receives money from the operatorlicense fee.
See “Revenue-sharing with Local Governments” formore information.
Graph 31: Charitable Games and License FeesCollections
Table 33: Charitable Games Tax and License Fee CollectionsFiscal License No. of No. of No. ofyear Tax fees licenses suppliers providers1994 $ 563,775 $ 129,550 457 19 2581995 516,081 114,700 408 18 2271996 211,149 82,250 226 16 1821997 180,332 71,500 240 15 1631998 141,150 60,950 217 15 1481999 123,903 57,350 176 13 1382000 112,849 52,950 160 12 1362001 114,232 46,400 155 11 1312002 109,070 47,650 160 9 1282003 $ 104,235 $ 49,600 170 10 140

44 Illinois Department of Revnue
F I S C A L Y E A R 2 0 0 3 A N N U A L R E P O R T
$7.1$0.6
$7.0$0.6
$7.3$0.6
$7.5$0.7
$7.1$0.7
$7.1$0.7
$7.3$0.7
$7.2$0.7$5.8$0.7$5.9$0.7
0 2 4 6 8
Millions
1994
1995
1996
1997
1998
1999
2000
2001
2002
2003
Tax License
Pull Tabs and Jar Games Tax andLicense FeesStatutory Reference230 ILCS 20/1 to 20/7
DefinitionThe tax is imposed on the gross proceeds of pull tabsand jar games. An annual license fee is imposed onoperators, suppliers, and manufacturers of pull tabsand jar games. To sell pull tabs or conduct jar gamesthe organization must
be licensed by the state;be a licensed bona fide religious, charitable, labor,fraternal, youth athletic, senior citizens’,educational, or veterans’ organization in Illinois;operate without profit to its members;have been in existence in Illinois continuously for aperiod of five years immediately before applyingfor a license; and— it must have a bona fide membership engaged
in carrying out its objectives during that entirefive-year period.(Note: The five-year requirement is reduced totwo years when it is applied to a localorganization that is affiliated with and charteredby a national organization that meets the five-year requirement.
The cost of a ticket cannot exceed $2, and no morethan 6,000 tickets can be sold for a single game. Theaggregate value of all prizes or merchandiseawarded on any single day of games cannot exceed$5,000 and a single prize cannot exceed $500.
Effective July 1, 1988, the tax rate is 5 percent of grossproceeds. License fees are also imposed in thefollowing amounts:
The annual fee for a regular license is $500.Qualified operators of pull tabs and jar gamesmay hold only one regular operator’s license,which is valid only at the locations stated on thelicense. Once during each license year, a regularlicensee may obtain a special permit to sell pull
tabs at a different additional location for a periodof up to 10 consecutive days.The limited license fee is $50. An organizationqualified for a regular license, but not holding one,may receive a limited license to sell pull tabs orconduct jar games on two occasions per year for upto five consecutive days each at a single location.Qualified suppliers and manufacturers of pull tabsand jar games must pay an annual license fee of$5,000.
DistributionFifty percent of the collections is deposited into theCommon School Fund, and 50 percent is depositedinto the Illinois Gaming Law Enforcement Fund. Two-thirds of the amount deposited into the Illinois GamingLaw Enforcement Fund is appropriated to theDepartment of Revenue, the Department of StatePolice, and the Office of the Attorney General. Theremaining one-third is distributed for law enforcementpurposes to municipalities and counties based on thenumber of licenses issued in the municipality or county.
See “Revenue-sharing with Local Governments” formore information.
Graph 32: Pull Tabs and Jar Games Tax and LicenseFees Collections
Table 34: Pull Tabs and Jar Games Tax and License Fee CollectionsNo. of No. of
Fiscal License regular limited No. of No. ofyear Tax fees licenses licenses suppliers manufacturers1994 $ 5,919,140 $ 725,100 1,064 152 21 91995 6,797,453 723,100 1,006 145 22 91996 7,208,488 740,650 1,098 150 24 101997 7,304,678 712,904 1,076 149 28 111998 7,133,877 700,000 1,050 141 24 91999 7,051,440 698,800 993 127 26 82000 7,546,315 655,150 891 122 21 102001 7,289,486 628,750 915 105 21 92002 6,978,549 617,550 805 104 22 82003 $ 7,057,695 $ 633,150 872 102 23 9

F I S C A L Y E A R 2 0 0 3 A N N U A L R E P O R T
Illinois Department of Revnue 45
Racing Privilege TaxStatutory Reference230 ILCS 5/1 to 5/27.1
DefinitionThe tax is imposed on every person, association, ortrust conducting the pari-mutuel or certificate systemof wagering. The Illinois Racing Board determines theamount of tax to be collected. Each of the state’sseven racetrack organizations (four in Cook Countyand three downstate) is allowed to have two off-trackbetting (OTB) outlets. Cook County’s OTB outletscannot be within 5 miles of an existing track or morethan 90 miles from the sponsoring track. DownstateOTB outlets cannot be more than 135 miles from thesponsoring track. OTB outlets cannot be located nearexisting churches, schools, and residences.
The flat pari-mutuel tax rate is 1.5 percent of the dailypari-mutuel handle and is imposed at all pari-mutuelfacilities. The Illinois Racing Board administers anadmittance tax of 15 cents for each ticket and licensefees required of the organizations that sponsor races.
DistributionBeginning January 1, 2001, all revenues except thosefrom quarterhorse racing are deposited into the HorseRacing Fund.
Rate HistoryThe Horse Racing Act of 1927 set up different privilegetax schedules for thoroughbred and harness racingwagers. When the act was rewritten in 1975, a singleracing privilege tax schedule was established atgraduated rates. In 1985, separate graduated rateswere created for downstate tracks. Effective January1, 1988, the tax was imposed at a flat rate of the dailypari-mutuel “handle” (total amount wagered). Therate was based on the racetrack’s location and thenumber of horses wagered.
Graph 33: Racing Privilege Tax Collections
Table 35: Racing Privilege Tax Breakdown by FundFunds Percentage allocated to funds FY 00 FY 01 FY 02 FY 03General Revenue Fund 50% total regular breakage $ 1,460,225 $ 0 $ 0 $ 0
(Discontinued 12/31/99) 100% total charity breakage 0 0 0 0Agricultural Premium Fund
(Discontinued 12/31/99) 50% total privilege tax 6,042,161 0 0 0Metropolitan Exposition Authority
Auditorium and Office Building Fund(Discontinued 12/31/99) 34.5% total privilege tax 4,169,091 0 0 0
Fair and Exposition Fund(Discontinued 12/31/99) 7% total privilege tax 98,390 0 0 0
Build Illinois Fund(Discontinued 12/31/99) 7% total privilege tax 747,512 0 0 0
Racetrack Improvement Fund(Discontinued 12/31/99) 50% total regular breakage 1,439,125 0 0 0
Illinois Standardbred Breeders Fund(Discontinued 12/31/99) 8.5% total privilege tax 303,505 0 0 0
Illinois Thoroughbred Breeders Fund(Discontinued 12/31/99) 8.5% total privilege tax 702,561 0 0 0
Horse Racing Allocation Fund 1% pari-mutuel handle on(Discontinued 12/31/99) intertrack wagering 2,839,665 0 0 0
Illinois Racing Quarterhorse @ 1/01 100% pari-mutuel taxreceipts into Quarterhorse racing 2,378 0 0 0
Horse Racing Fund @ 1/01 100% with exception ofQuarterhorse racing 4,394,022 12,815,513 12,388,203 12,222,206
Protest 1,079,281 0 0
Total $ 23,277,916 $ 12,815,513 $ 12,388,203 $ 12,222,206Note: Other horse-racing-related taxes and fees include
a 15-cents admittance tax collected by the Racing Board. This money goes into the General Revenue Fund.license fees of $1,000 from organizations for each race meeting. A fee of $100 is levied when the handle is more than $400,000 andan additional $100 when the handle reaches $700,000 for a maximum total of $200. There is also a $110 fee for each racing dayawarded. This money goes into the General Revenue Fund.
$12.2
$12.4
$12.8
$23.2
$36.4
$38.0
$40.4
$42.0
$40.9
$42.0
0 10 20 30 40 50
Millions
1994
1995
1996
1997
1998
1999
2000
2001
2002
2003

46 Illinois Department of Revnue
F I S C A L Y E A R 2 0 0 3 A N N U A L R E P O R T
$691.3
$570.7
$528.5
$483.6$357.5
$266.9
$261.3
$294.9
$267.3
$202.3
0 200 400 600 800
Millions
1994
1995
1996
1997
1998
1999
2000
2001
2002
2003
Riverboat Gambling Taxes andLicense FeesStatutory Reference230 ILCS 10/1 to 10/23
DefinitionThe Illinois Gaming Board regulates the riverboatgambling industry in Illinois. It conducts backgroundinvestigations on applicants, approves owners, andissues licenses to employees of owners, and suppliers.The board oversees the licensees’ operations forcompliance with the Illinois Riverboat Gambling Actand adopted rules. The board also conducts audits ofcasinos’ internal control systems and financial records.In addition, the board is responsible for collecting allgaming and admissions taxes, penalties and fees. Ona calendar year basis, the board produces a detailedannual report, which may be obtained by writing to:Illinois Gaming Board, P.O. Box 19474, Springfield,Illinois 62794-9474, or by visiting their web site atwww.IGB.state.il.us.
A $2 admission tax is imposed on every personadmitted to each riverboat gambling cruise.
Originally, a 20 percent wagering tax was imposed onthe daily calculation of adjusted gross receiptsderived from wagering activities. Effective January 1,1998, the wagering tax rates are graduated and areimposed on annual adjusted gross receipts at thefollowing rates:
Annual adjusted gross receipts Tax rate$0 — $25,000,000 15%$25,000,001 — $50,000,000 20%$50,000,001 — $75,000,000 25%$75,000,001 — $100,000,000 30%$100,000,001 or more 35%
Application fees must be paid when the applicationfor license is submitted. Annual license fees are duewhen the license is issued. If there is cause for aninvestigation relating to the license, the licensee mustpay the board for the cost of the investigation.
Application fees License feesOwner’s license $50,000 $25,000; $5,000 *Supplier’s license $10,000 $5,000Occupational license, Level 1$1,000 $50Occupational license, Level 2$200 $50Occupational license, Level 3$75 $50
* $25,000 for the first year; $5,000 for each succeeding year
DistributionRiverboat gaming collections are deposited into theState Gaming Fund with the exception of fines andpenalties, which are deposited into the EducationAssistance Fund. All Illinois Gaming Board and IllinoisState Police expenses relative to the enforcement ofgaming regulations and laws are paid for from theState Gaming Fund. The balance of funds collectedfrom riverboat gaming is appropriated to theEducation Assistance Fund. Each quarter, the boardissues 50 percent of the admission tax collections,subject to appropriation, to the municipality or countyin which the licensee operates. Twenty-five percent ofthe wagering tax revenues collected from eachlicensee is issued, subject to appropriation, to thelocal government designated as the home dock.
Graph 34: Riverboat Gambling Collections

F I S C A L Y E A R 2 0 0 3 A N N U A L R E P O R T
Illinois Department of Revnue 47
Table 36: Riverboat Gambling CollectionsOwner’s Supplier’s Occupationallicense Owner’s license license and Other
Fiscal Admission Wagering application license application application (fines andyear tax tax fees fees fees fees penalties) Total1994 $ 31,891,288 $ 168,317,522 $ 124,222 $ 0 $ 188,384 $ 1,384,655 $ 358,703 $ 202,264,774
1995 46,585,968 219,014,777 60,000 0 120,000 1,152,475 389,472 267,322,692
1996 51,293,835 242,015,934 103,409 0 130,000 1,105,166 218,291 294,866,635
1997 49,701,556 210,368,224 50,000 0 110,000 939,285 166,582 261,335,653
1998 49,741,868 215,102,027 55,000 120,000 75,000 648,905 1,184,958 266,927,758
1999 50,244,686 305,858,916 0 0 20,000 0 1,421,051 357,544,653
2000 38,533,548 443,533,513 55,000 0 10,000 0 1,426,464 483,558,525
2001 37,067,890 490,201,313 45,000 0 20,000 0 1,213,342 528,547,545
2002 38,139,181 531,108,176 45,000 0 40,000 0 1,340,154 570,672,511
2003 $ 54,930,338 $ 632,039,884 $ 50,000 $ 0 $ 20,000 $ 0 $ 4,221,413 $ 691,261,635

48 Illinois Department of Revnue
F I S C A L Y E A R 2 0 0 3 A N N U A L R E P O R T
Real Estate Taxes andProgramsCircuit Breaker Property Tax GrantProgram and PharmaceuticalAssistance ProgramStatutory Reference320 ILCS 25/1 to 25/13
Program ExplanationCircuit Breaker consists of two components — aproperty tax grant and pharmaceutical assistance. Theproperty tax grant portion acts to offset mobile hometax or property taxes paid by low- to middle-incomesenior and disabled residents who can least afford theburden of property taxes on residences (whether paiddirectly or indirectly in the form of increased rent ornursing home charges). When property taxes begin to“overload” the elderly or disabled person’s income,the Circuit Breaker property tax relief program providescompensation, just as a circuit breaker prevents anoverload in an electrical system. By providingcompensation for property taxes paid, the programcan provide incentives for senior citizens and disabledpersons to acquire and retain private housing andthereby reduce the need for public housing.
The Property Tax grant for claim year 2002 wascalculated as follows:
Claimants having an annual combined householdincome of less than $14,000
The amount of the grant was either the amount of theclaimant’s property tax bill minus 3.5 percent ofhousehold income; or $700 (the maximum grantallowable) minus 4.5 percent of household income,whichever was less.
Claimants having an annual combined householdincome of $14,000 or more
The amount of the grant was either the amount of theclaimant’s property tax bill minus 3.5 percent ofhousehold income; or $70, whichever was less.
The claimant’s property tax bill was figured by using
the entire amount of property tax,the entire amount of mobile home tax,25 percent of rent, or6.25 percent of nursing home charges.
The Pharmaceutical Assistance Program helps partici-pants pay for approved prescription medications usedfor the treatment of heart and blood pressure prob-lems, diabetes (including insulin and syringes andneedles used to administer insulin), arthritis, Parkinson’sdisease, Alzheimer’s disease, cancer, glaucoma, lungdisease and smoking-related illnesses, osteoporosis,and multiple sclerosis (added January 2004).
During the 2003 calendar year, a two-tiered structurewas in effect: the cost of pharmaceutical coverageand the amount of copayment per prescriptionrequired from the participant were determined by theparticipant’s income. If a participant’s annual incomefor calendar year 2003 was below the federal povertylevel guidelines in effect at that time ($8,860 for singleindividuals and $11,940 for married couples), thecoverage cost was $5, and there was no monthlycopayment. If a participant’s income was at or abovethe federal poverty level, the coverage cost was $25,and the participant paid the first $3 of eachprescription covered. Participants were liable for 20percent of drug costs after the accumulated total paidby the program reached $2,000 for the fiscal year.
Amount ExpendedCircuit Breaker and Pharmaceutical AssistanceProperty Tax Grant — A total of 268,189 Property Taxgrants were processed during the 2003 calendar year,amounting to more than $53.4 million in grants.
Pharmaceutical Assistance Program — The totalamount expended in the 2003 calendar year was$68,273,686 for 56,934 members.
Note: An annual report for the Circuit Breaker andPharmaceutical Assistance programs is available andoutlines the two programs in greater detail. To obtaina copy, visit our web site at www.ILtax.com or write tous at the address below.
PHARMACEUTICAL ASSISTANCE SECTIONILLINOIS DEPARTMENT OF REVENUEPO BOX 19021SPRINGFIELD IL 62794-9021
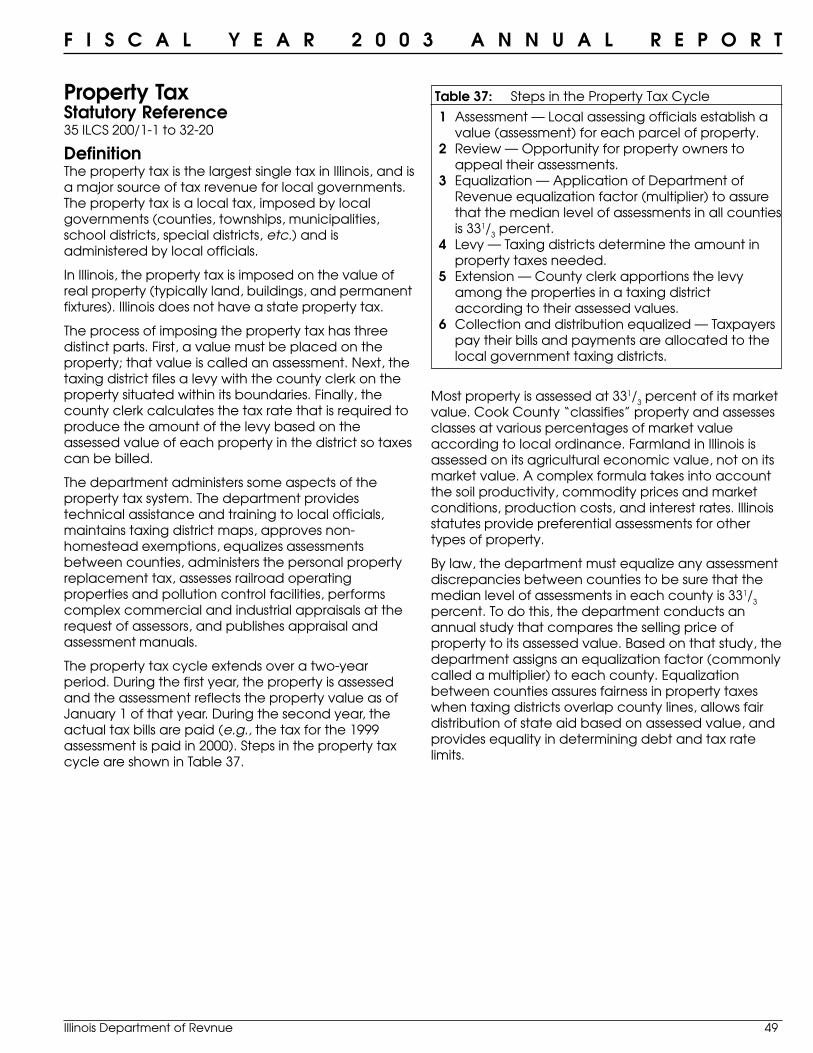
F I S C A L Y E A R 2 0 0 3 A N N U A L R E P O R T
Illinois Department of Revnue 49
Property TaxStatutory Reference35 ILCS 200/1-1 to 32-20
DefinitionThe property tax is the largest single tax in Illinois, and isa major source of tax revenue for local governments.The property tax is a local tax, imposed by localgovernments (counties, townships, municipalities,school districts, special districts, etc.) and isadministered by local officials.
In Illinois, the property tax is imposed on the value ofreal property (typically land, buildings, and permanentfixtures). Illinois does not have a state property tax.
The process of imposing the property tax has threedistinct parts. First, a value must be placed on theproperty; that value is called an assessment. Next, thetaxing district files a levy with the county clerk on theproperty situated within its boundaries. Finally, thecounty clerk calculates the tax rate that is required toproduce the amount of the levy based on theassessed value of each property in the district so taxescan be billed.
The department administers some aspects of theproperty tax system. The department providestechnical assistance and training to local officials,maintains taxing district maps, approves non-homestead exemptions, equalizes assessmentsbetween counties, administers the personal propertyreplacement tax, assesses railroad operatingproperties and pollution control facilities, performscomplex commercial and industrial appraisals at therequest of assessors, and publishes appraisal andassessment manuals.
The property tax cycle extends over a two-yearperiod. During the first year, the property is assessedand the assessment reflects the property value as ofJanuary 1 of that year. During the second year, theactual tax bills are paid (e.g., the tax for the 1999assessment is paid in 2000). Steps in the property taxcycle are shown in Table 37.
Table 37: Steps in the Property Tax Cycle
1 Assessment — Local assessing officials establish avalue (assessment) for each parcel of property.
2 Review — Opportunity for property owners toappeal their assessments.
3 Equalization — Application of Department ofRevenue equalization factor (multiplier) to assurethat the median level of assessments in all countiesis 331/3 percent.
4 Levy — Taxing districts determine the amount inproperty taxes needed.
5 Extension — County clerk apportions the levyamong the properties in a taxing districtaccording to their assessed values.
6 Collection and distribution equalized — Taxpayerspay their bills and payments are allocated to thelocal government taxing districts.
Most property is assessed at 331/3 percent of its marketvalue. Cook County “classifies” property and assessesclasses at various percentages of market valueaccording to local ordinance. Farmland in Illinois isassessed on its agricultural economic value, not on itsmarket value. A complex formula takes into accountthe soil productivity, commodity prices and marketconditions, production costs, and interest rates. Illinoisstatutes provide preferential assessments for othertypes of property.
By law, the department must equalize any assessmentdiscrepancies between counties to be sure that themedian level of assessments in each county is 331/3
percent. To do this, the department conducts anannual study that compares the selling price ofproperty to its assessed value. Based on that study, thedepartment assigns an equalization factor (commonlycalled a multiplier) to each county. Equalizationbetween counties assures fairness in property taxeswhen taxing districts overlap county lines, allows fairdistribution of state aid based on assessed value, andprovides equality in determining debt and tax ratelimits.

50 Illinois Department of Revnue
F I S C A L Y E A R 2 0 0 3 A N N U A L R E P O R T
Table 38: Comparison of Equalized Assessed Values and Taxes Extended, 2000 and 2001Amount of % of Amount of % of
increase increase Total taxes Total taxes increase increase2001 2000 or or extended extended or or
County Total EAV Total EAV decrease decrease 2001 2000 decrease decreaseStatewide 220,330,253,329 204,178,019,641 16,152,233,688 7.91 16,922,710,220 15,967,696,133 955,014,088 5.98Cook County 99,102,429,909 90,753,566,063 8,348,863,846 9.20 8,253,682,769 7,892,880,682 360,802,087 4.57Collar Counties 68,796,684,846 63,311,676,137 5,485,008,709 8.66 4,737,046,490 4,342,652,726 394,393,764 9.08Rest of State 52,431,138,574 50,112,777,441 2,318,361,133 4.63 3,931,980,962 3,732,162,725 199,818,237 5.35
Adams 698,304,176 680,113,035 18,191,141 2.67 46,440,355 44,004,386 2,435,969 5.54Alexander 40,412,707 40,171,135 241,572 0.60 3,660,208 3,656,956 3,252 0.09Bond 124,987,387 118,199,650 6,787,737 5.74 9,995,352 9,568,319 427,033 4.46Boone 674,982,918 634,838,596 40,144,322 6.32 45,484,524 43,661,560 1,822,964 4.18Brown 49,142,424 50,824,475 (1,682,051) (3.31) 3,881,802 3,833,281 48,521 1.27Bureau 504,790,708 484,025,959 20,764,749 4.29 39,000,024 36,669,816 2,330,207 6.35Calhoun 45,216,669 45,909,747 (693,078) (1.51) 3,213,379 3,117,525 95,854 3.07Carroll 249,614,671 241,603,651 8,011,020 3.32 18,119,481 17,521,512 597,969 3.41Cass 112,156,114 110,708,484 1,447,630 1.31 9,343,001 9,176,318 166,683 1.82Champaign 2,304,411,757 2,198,470,000 105,941,757 4.82 172,755,359 163,664,297 9,091,062 5.55Christian 393,205,350 388,432,576 4,772,774 1.23 27,140,241 26,465,389 674,852 2.55Clark 154,691,635 151,976,663 2,714,972 1.79 10,312,241 10,020,230 292,010 2.91Clay 105,922,423 102,368,500 3,553,923 3.47 8,171,965 8,120,059 51,906 0.64Clinton 343,758,955 320,732,881 23,026,074 7.18 24,017,261 22,458,953 1,558,308 6.94Coles 526,425,236 530,360,023 (3,934,787) (0.74) 40,871,858 41,510,909 (639,052) (1.54)Cook 99,102,429,909 90,753,566,063 8,348,863,846 9.20 8,253,682,769 7,892,880,682 360,802,087 4.57Crawford 214,936,386 216,631,101 (1,694,715) (0.78) 15,454,298 14,854,354 599,944 4.04Cumberland 91,835,916 89,310,738 2,525,178 2.83 6,704,487 6,448,204 256,284 3.97DeKalb 1,356,157,372 1,291,841,788 64,315,584 4.98 109,638,180 103,859,004 5,779,176 5.56DeWitt 463,136,079 474,657,662 (11,521,583) (2.43) 25,681,540 26,307,444 (625,904) (2.38)Douglas 290,094,202 285,250,844 4,843,358 1.70 19,730,336 19,088,141 642,195 3.36DuPage 25,715,214,817 23,850,845,257 1,864,369,560 7.82 1,625,756,019 1,514,365,993 111,390,026 7.36Edgar 228,951,148 227,894,663 1,056,485 0.46 15,705,388 15,690,428 14,960 0.10Edwards 49,468,577 49,629,762 (161,185) (0.32) 3,895,228 3,914,682 (19,455) (0.50)Effingham 440,318,277 425,126,859 15,191,418 3.57 27,540,991 26,876,127 664,865 2.47Fayette 150,525,188 141,782,535 8,742,653 6.17 11,614,158 11,023,982 590,176 5.35Ford 187,294,361 187,440,221 (145,860) (0.08) 15,707,886 15,137,572 570,314 3.77Franklin 205,968,778 191,965,272 14,003,506 7.29 17,994,253 17,298,509 695,744 4.02Fulton 320,712,322 309,849,244 10,863,078 3.51 26,019,949 24,828,955 1,190,994 4.80Gallatin 47,786,427 48,967,232 (1,180,805) (2.41) 3,650,367 3,654,383 (4,016) (0.11)Greene 132,730,283 134,214,336 (1,484,053) (1.11) 9,059,623 8,910,376 149,247 1.67Grundy 1,369,169,748 1,228,918,269 140,251,479 11.41 82,703,180 71,374,702 11,328,478 15.87Hamilton 58,816,646 52,608,771 6,207,875 11.80 4,732,561 4,563,439 169,122 3.71Hancock 221,167,581 217,978,266 3,189,315 1.46 15,569,563 15,238,144 331,418 2.17Hardin 19,793,916 20,122,116 (328,200) (1.63) 987,405 977,123 10,282 1.05Henderson 95,706,583 96,925,097 (1,218,514) (1.26) 7,010,203 6,892,141 118,062 1.71Henry 620,314,950 592,585,858 27,729,092 4.68 45,249,068 42,424,058 2,825,010 6.66Iroquois 406,635,398 408,880,647 (2,245,249) (0.55) 31,525,254 30,823,454 701,800 2.28Jackson 461,546,863 429,171,613 32,375,250 7.54 38,196,199 35,661,884 2,534,315 7.11Jasper 202,004,472 187,515,555 14,488,917 7.73 11,652,270 10,543,075 1,109,195 10.52Jefferson 324,807,857 314,426,542 10,381,315 3.30 23,915,008 23,709,269 205,739 0.87Jersey 231,446,276 219,465,025 11,981,251 5.46 12,962,568 11,519,410 1,443,157 12.53JoDaviess 487,583,115 462,981,904 24,601,211 5.31 31,191,801 29,523,200 1,668,601 5.65Johnson 71,840,628 68,673,451 3,167,177 4.61 4,783,831 4,785,713 (1,882) (0.04)Kane 8,163,403,577 7,352,997,897 810,405,680 11.02 586,963,592 538,236,868 48,726,724 9.05Kankakee 1,314,924,250 1,252,230,215 62,694,035 5.01 101,154,752 95,866,186 5,288,566 5.52Kendall 1,177,397,829 1,043,009,508 134,388,321 12.88 87,852,814 77,978,189 9,874,625 12.66Knox 617,662,482 586,808,181 30,854,301 5.26 46,020,716 43,329,047 2,691,670 6.21Lake 18,474,399,581 17,059,530,969 1,414,868,612 8.29 1,307,613,151 1,208,307,732 99,305,419 8.22

F I S C A L Y E A R 2 0 0 3 A N N U A L R E P O R T
Illinois Department of Revnue 51
Table 38: Comparison of Equalized Assessed Values and Taxes Extended, 2000 and 2001Amount of % of Amount of % of
increase increase Total taxes Total taxes increase increase2001 2000 or or extended extended or or
County Total EAV Total EAV decrease decrease 2001 2000 decrease decreaseLaSalle 1,840,012,626 1,793,398,144 46,614,482 2.60 129,623,241 125,566,520 4,056,721 3.23Lawrence 98,018,543 93,771,191 4,247,352 4.53 6,912,918 6,634,969 277,949 4.19Lee 498,250,156 486,892,901 11,357,255 2.33 35,783,333 34,829,964 953,369 2.74Livingston 506,865,956 505,641,259 1,224,697 0.24 41,746,438 41,835,898 (89,461) (0.21)Logan 381,954,250 381,690,469 263,781 0.07 28,173,541 27,684,152 489,389 1.77McDonough 295,740,298 313,144,655 (17,404,357) (5.56) 27,049,810 26,455,937 593,873 2.24McHenry 5,802,973,128 5,356,477,945 446,495,183 8.34 437,235,832 396,626,610 40,609,222 10.24McLean 2,467,640,290 2,320,289,188 147,351,102 6.35 178,036,086 168,324,856 9,711,230 5.77Macon 1,263,557,973 1,195,222,277 68,335,696 5.72 102,387,464 96,101,374 6,286,090 6.54Macoupin 404,573,299 395,433,544 9,139,755 2.31 27,607,928 26,600,730 1,007,198 3.79Madison 2,897,620,041 2,696,984,998 200,635,043 7.44 215,147,068 198,412,437 16,734,632 8.43Marion 271,117,574 256,434,885 14,682,689 5.73 22,872,441 22,154,520 717,920 3.24Marshall 181,818,231 181,362,814 455,417 0.25 14,274,048 13,841,471 432,577 3.13Mason 160,185,703 158,801,671 1,384,032 0.87 13,757,006 13,265,495 491,511 3.71Massac 142,349,404 137,731,522 4,617,882 3.35 8,982,755 8,808,523 174,232 1.98Menard 177,900,988 176,870,882 1,030,106 0.58 12,214,180 11,903,968 310,213 2.61Mercer 186,022,582 182,214,341 3,808,241 2.09 14,138,408 13,790,116 348,292 2.53Monroe 449,235,026 409,124,242 40,110,784 9.80 25,147,863 23,065,440 2,082,423 9.03Montgomery 310,301,215 298,443,626 11,857,589 3.97 23,772,032 23,180,954 591,078 2.55Morgan 418,518,220 412,509,590 6,008,630 1.46 27,891,228 26,996,412 894,816 3.31Moultrie 186,401,657 186,816,607 (414,950) (0.22) 13,810,834 13,726,351 84,483 0.62Ogle 1,199,231,257 1,178,799,365 20,431,892 1.73 79,737,529 76,835,430 2,902,099 3.78Peoria 2,279,283,056 2,139,508,945 139,774,111 6.53 173,317,514 162,669,735 10,647,779 6.55Perry 144,123,309 136,471,725 7,651,584 5.61 10,992,383 10,325,990 666,393 6.45Piatt 271,564,201 269,859,183 1,705,018 0.63 18,455,392 17,495,882 959,510 5.48Pike 158,288,145 163,500,309 (5,212,164) (3.19) 11,229,590 11,164,972 64,618 0.58Pope 28,012,185 25,128,581 2,883,604 11.48 1,758,179 1,625,460 132,719 8.17Pulaski 26,362,673 25,045,010 1,317,663 5.26 2,029,205 2,008,148 21,057 1.05Putnam 104,143,831 101,441,928 2,701,903 2.66 6,510,957 6,259,145 251,812 4.02Randolph 300,316,335 275,643,504 24,672,831 8.95 18,771,782 17,500,994 1,270,789 7.26Richland 157,023,293 156,883,760 139,533 0.09 10,876,698 10,702,892 173,806 1.62Rock Island 1,785,484,717 1,684,808,308 100,676,409 5.98 146,837,036 136,472,749 10,364,287 7.59St. Clair 2,386,358,481 2,275,444,355 110,914,126 4.87 188,957,895 180,736,709 8,221,186 4.55Saline 167,507,621 162,495,827 5,011,794 3.08 14,163,805 13,843,599 320,206 2.31Sangamon 2,703,165,666 2,585,007,362 118,158,304 4.57 195,032,535 185,234,815 9,797,720 5.29Schuyler 67,695,923 68,498,397 (802,474) (1.17) 5,797,556 5,695,420 102,136 1.79Scott 56,017,132 62,671,859 (6,654,727) (10.62) 3,837,742 3,841,530 (3,788) (0.10)Shelby 253,327,349 234,363,069 18,964,280 8.09 18,568,754 17,645,980 922,774 5.23Stark 97,425,588 99,264,446 (1,838,858) (1.85) 7,087,037 6,711,851 375,186 5.59Stephenson 551,752,552 537,829,791 13,922,761 2.59 47,682,704 45,770,361 1,912,343 4.18Tazewell 1,691,752,265 1,612,265,925 79,486,340 4.93 120,946,533 114,714,002 6,232,531 5.43Union 110,884,973 105,479,961 5,405,012 5.12 8,206,736 8,000,241 206,495 2.58Vermillion 747,434,397 722,583,799 24,850,598 3.44 61,894,562 59,885,566 2,008,996 3.35Wabash 103,735,401 101,463,880 2,271,521 2.24 7,043,715 6,880,856 162,859 2.37Warren 228,299,965 227,598,101 701,864 0.31 15,981,019 15,813,369 167,650 1.06Washington 154,192,576 146,806,601 7,385,975 5.03 12,469,348 11,904,622 564,726 4.74Wayne 123,213,556 123,188,861 24,695 0.02 9,448,155 9,234,468 213,687 2.31White 114,041,634 111,503,388 2,538,246 2.28 8,159,971 8,050,984 108,987 1.35Whiteside 640,289,675 619,861,256 20,428,419 3.30 49,248,711 46,684,813 2,563,898 5.49Will 10,640,693,743 9,691,824,069 948,869,674 9.79 779,477,896 685,115,523 94,362,373 13.77Williamson 595,278,839 553,808,281 41,470,558 7.49 38,381,132 36,023,978 2,357,153 6.54Winnebago 3,313,519,668 3,151,207,315 162,312,353 5.15 314,795,929 297,055,409 17,740,520 5.97Woodford 544,571,239 515,966,893 28,604,346 5.54 38,121,309 35,641,961 2,479,349 6.96

52 Illinois Department of Revnue
F I S C A L Y E A R 2 0 0 3 A N N U A L R E P O R T
Graph 35: Tax Year 2001 Extensions by Class
Graph 36: Tax Year 2001 Extensions by Type ofDistrict
Tax Relief ProvisionsGeneral Homestead Exemption — This annualexemption is available for residential property that isoccupied as the principal dwelling place by theowner or a lessee with an equitable interest in theproperty and an obligation to pay the property taxeson the leased property. The amount of exemption isthe increase in the current year’s equalized assessedvalue (EAV), above the 1977 EAV, up to a maximum of$3,500 ($4,500 in Cook County).
Homestead Improvement Exemption — This exemptionis limited to the fair cash value that was added tohomestead property by any new improvement, up toan annual maximum of $45,000. The exemptioncontinues for four years from the date theimprovement is completed and occupied.
Senior Citizens Assessment Freeze HomesteadExemption — This exemption allows senior citizens whohave a total household income of less than $40,000,and meet certain other qualifications to elect tomaintain the equalized assessed value (EAV) of theirhomes at the base year EAV and prevent anyincrease in that value due to inflation.
Senior Citizens Homestead Exemption — This exemptionallows a $2,000 reduction ($2,500 in Cook County) in theEAV of the property that a person 65 years of age orolder is obligated to pay taxes on, and owns andoccupies, or leases and occupies as a residence.
Senior Citizens Real Estate Tax Deferral Program — Thisprogram allows persons 65 years of age and older,who have a total household income of less than$40,000 and meet certain other qualifications, to deferall or part of the real estate taxes and specialassessments on their principal residences. The deferralis similar to a loan against the property’s market value.A lien is filed on the property in order to ensurerepayment of the deferral. The state pays the propertytaxes and then recovers the money, plus 6 percentannual interest, when the property is sold ortransferred. The deferral must be repaid within oneyear of the taxpayer’s death or 90 days after theproperty ceases to qualify for this program. Themaximum amount that can be deferred, includinginterest and lien fees, is 80 percent of the taxpayer’sequity interest in the property.
Table 39: Senior Citizens Real Estate Tax Deferralsfor Tax Year 2001 (paid in 2002)
County DeferralBoone $ 16,101.22Cass $279.18Champaign 26,270.20Christian 1,852.98Clinton 5,418.30Coles 1,975.60Cook 1,096,108.48DeKalb 81,609.10Douglas 2,029.24DuPage 687,481.67Effingham 760.16Fayette 2,023.16Ford 773.04Grundy 2,515.24Henry 2,331.84Iroquois 9,555.42JoDaviess 3,215.38Kane 220,215.60Kankakee 36,736.36Kendall 41,052.92Knox 1,415.20Lake 627,322.53LaSalle 25,695.94Lee 14,463.46Livingston 1,045.38Logan 573.06Macon 13,612.18Macoupin 5,000.04Madison 24,239.17
County DeferralMassac 18.00McHenry 199,739.13McLean 6,401.30Menard 2,132.16Monroe 5,273.96Montgomery 617.54Morgan 1,148.08Moultrie 966.70Ogle 16,302.42Peoria 23,129.46Perry 1,271.88Rock Island 6,021.16Saline 1,400.38Sangamon 19,206.42St. Clair 14,885.14Stephenson 17,128.02Tazewell 6,582.00Vermilion 353.96Wayne 1,201.94Whiteside 9,375.52Will 127,856.25Williamson 2,387.44Winnebago 194,135.89Total $ 3,609,206.80Special assessmentdeferrals $ 8,055.47
Total $ 3,617,262.27Number of participants: 1,706
Commerical$4,432,064,177
26.19%
Minerals$6,654,530
0.04%Farm
$613,256,8403.62%
Industrial$1,835,240,209
10,84%
Railroads$62,336,488
0.37%
Residential$9,973,157,977
58.93%
Other special districts
$707,929,5134.35%
Community colleges
$624,185,8593.78%
Park $673,476,170
4.03%
Sanitary $383,944,948
2.32%
TIF$429,982,435
2.48%Cities
$2,021,154,35915.14%
Townships$436,173,095
2.63%
Counties$1,420,340,413
8.44%
Schools$9,270,509,341
56.85%

F I S C A L Y E A R 2 0 0 3 A N N U A L R E P O R T
Illinois Department of Revnue 53
Property Tax Extension LimitationLawStatutory Reference35 ILCS 200/18-185 to 18-245
DefinitionThe Property Tax Extension Limitation Law (PTELL), wasenacted to limit the annual increases in property taxextensions (total taxes billed) for non-home rule taxingdistricts. Increases in property tax extensions are limitedto the lesser of five percent or the increase in theconsumer price index (CPI), for the year preceding thelevy year. The CPI used is for all urban consumers for allitems as published by the United States Department ofLabor. The CPI increase for 2000 was 2.7%.
Although the law is commonly referred to as “taxcaps,” use of this phrase can be misleading. The PTELLdoes not “cap” either individual property tax bills orindividual property assessments. Individual tax billsmay still increase or decrease. PTELL only limitsincreases in taxing districts’ extensions. The PTELLallows a taxing district to receive a limited inflationaryincrease in tax extensions on existing property, plus anadditional amount for new construction, and voter-approved rate increases.
The limitation slows the growth of revenues to taxingdistricts when property values and assessments areincreasing faster than the rate of inflation. As a whole,property owners have some protection from tax billsthat increase only because the market value of theirproperty is rising rapidly.
Payments for bonds issued without voter approval aresubject to strict limitations.
If a taxing district determines that it needs moremoney than is allowed under the PTELL, it can ask thevoters to approve an increase.
The PTELL was originally passed in 1991. Only non-home rule taxing districts are subject to the PTELL. Thefollowing districts are subject to the PTELL:
• Non-home rule taxing districts with a majority oftheir 1990 EAV in DuPage, Kane, Lake, McHenry, orWill counties;
• Non-home rule taxing districts with a majority oftheir 1994 EAV in Cook and the collar counties thatwere not subject to the PTELL before 1995;
• Non-home rule taxing districts in other counties ifevery county in which the district is located hasheld a referendum asking if voters want the PTELLto be applicable, and if the majority of the EAV ofthe district is in counties where voters haveapproved the referendum;
• Non-home rule taxing districts with part of their EAVin Cook or the collar counties if every other county inwhich the district is located has held a referendumasking if voters want the PTELL to be applicable, andif the majority of the EAV in the district is in countieswhere voters have approved the referendum and inCook and the collar counties.
Tennessee Valley AuthorityThe Tennessee Valley Authority (TVA) makes annualpayments instead of property taxes each year for itsIllinois coal reserves. Federal law provides that 5percent of the TVA’s gross proceeds from the previousyear’s sale of power be divided among the states inwhich it owns property.
The state retains 30 percent for its General RevenueFund and distributes the remainder to the threecounties (Franklin, Hamilton, and Jefferson) in whichthe TVA owns property based on the value of thatproperty. Illinois received $258,396 in FY 2002.
Table 40: TVA PaymentsCounty FY 2003Franklin $ 90,752
Hamilton 78,582
Jefferson 21,013
Total paid to counties $ 190,347
State of IllinoisGeneral Revenue Fund $ 81,577
Total TVA payments $ 271,924

54 Illinois Department of Revnue
F I S C A L Y E A R 2 0 0 3 A N N U A L R E P O R T
Stipends and ReimbursementsAssessor training stipends — The department awards$500 per year to any chief county assessment officer(CCAO), assessor, or board of review member who hasbeen awarded a Certified Illinois Assessing Officerscertificate from the Illinois Property Assessment Institute.The department also awards $500 per year to anyCCAO, assessor, or board of review member who hasearned a Certified Assessment Evaluator certificatefrom the International Association of Assessing Officers.In addition, the department awards $250 per year toany CCAO, assessor, or board of review member whohas been awarded a Residential Evaluation Specialist,Assessment Administration Specialist, or CadastralMapping Specialist certificate by the InternationalAssociation of Assessing Officers, but who has not beenawarded a Certified Assessment Evaluator certificate.To continue to be eligible for additional compensation,an assessor or board of review member mustsuccessfully complete a minimum number of qualifiedcontinuing education classes.
Assessor performance stipends — Any assessor otherthan in Cook County or any chief county assessingofficer other than in Cook or St. Clair counties maypetition the department each year to receiveadditional compensation of $3,000 based onperformance. To receive additional compensation,the official’s assessment jurisdiction must meet certaincriteria pertaining to the median level of assessmentsand the uniformity of assessments.
Chief County Assessment Officer (CCAO) salaryreimbursements — Each month the department willreimburse a county 50 percent of the salary thecounty paid to its CCAO for the preceding month ifthe department determines that the total assessedvalue of property in the county is between 311/3
percent and 351/3 percent of the total fair cash valueof property in the county.
County treasurer stipends — The department pays eachcounty treasurer a stipend per year.

F I S C A L Y E A R 2 0 0 3 A N N U A L R E P O R T
Illinois Department of Revnue 55
Table 41: FY 2003 Stipends and ReimbursementsAssessor Assessor S of A CountyTraining Performance Salary Treasurer
County Stipend Stipends Reimbursement Stipends
Adams $ 33,000.00 $ — $ 20,942.46 $ 6,500.00Alexander 500.00 — 14,528.82 6,500.00Bond 500.00 3,000.00 20,500.02 6,500.00Boone 6,500.00 9,000.00 25,140.24 6,500.00Brown 1,500.00 6,000.00 12,836.28 6,500.00Bureau 3,000.00 6,000.00 20,275.02 6,500.00Calhoun — 3,000.00 13,101.36 6,500.00Carroll 3,500.00 9,000.00 18,750.00 6,500.00Cass 1,500.00 3,000.00 16,882.50 6,500.00Champaign 8,000.00 24,000.00 26,963.76 6,500.00Christian 1,500.00 15,000.00 20,579.58 6,500.00Clark 1,000.00 — 15,102.60 6,500.00Clay 1,500.00 3,000.00 19,333.74 6,500.00Clinton 2,500.00 9,000.00 21,290.16 6,500.00Coles 2,000.00 — 22,368.72 6,500.00Cook 35,500.00 — — 6,500.00Crawford 1,500.00 3,000.00 17,750.04 6,500.00Cumberland 1,000.00 3,000.00 15,250.08 6,500.00DeKalb 3,500.00 24,000.00 33,871.56 6,500.00DeWitt 500.00 15,000.00 19,787.46 6,500.00Douglas 3,000.00 3,000.00 17,250.06 6,500.00DuPage 20,500.00 6,000.00 46,127.94 6,500.00Edgar 1,500.00 6,000.00 20,600.04 6,500.00Edwards — — 16,209.78 6,500.00Effingham 3,000.00 6,000.00 22,000.08 6,500.00Fayette 1,000.00 — 21,212.52 6,500.00Ford 1,000.00 9,000.00 20,375.04 6,500.00Franklin 1,000.00 — 20,488.62 6,500.00Fulton 4,500.00 9,000.00 19,125.00 6,500.00Gallatin 500.00 — 16,580.04 6,500.00Greene 2,000.00 — 16,627.56 6,500.00Grundy 2,000.00 3,000.00 29,775.96 6,500.00Hamilton 500.00 6,000.00 13,374.96 6,500.00Hancock 2,500.00 — 13,968.47 6,500.00Hardin 500.00 — 11,198.16 6,500.00Henderson 1,000.00 — 14,778.54 6,500.00Henry 3,500.00 — 28,411.96 6,500.00Iroquois 5,500.00 21,000.00 20,975.04 6,500.00Jackson 4,000.00 3,000.00 21,812.50 6,500.00Jasper 500.00 — 20,759.62 6,500.00Jefferson 3,500.00 — 21,729.72 6,500.00Jersey 1,000.00 15,000.00 19,358.76 6,500.00Jo Daviess 1,500.00 21,000.00 21,532.80 6,500.00Johnson 1,000.00 — 22,525.08 6,500.00Kane 15,000.00 63,000.00 35,750.04 6,500.00Kankakee 5,500.00 9,000.00 27,129.72 6,500.00Kendall 1,000.00 15,000.00 35,284.80 6,500.00Knox 4,500.00 — 21,222.42 6,500.00Lake 21,250.00 93,000.00 58,107.54 6,500.00LaSalle 7,500.00 3,000.00 28,586.67 6,500.00Lawrence 500.00 — 14,799.96 6,500.00
Assessor Assessor S of A CountyTraining Performance Salary Treasurer
County Stipend Stipends Reimbursement Stipends
Lee $ 3,250.00 $ 3,000.00 $ 23,646.00 $ 6,500.00Livingston 3,000.00 3,000.00 24,936.46 6,500.00Logan 1,000.00 3,000.00 16,792.26 6,500.00Macon 8,250.00 18,000.00 23,058.00 6,500.00Macoupin 1,000.00 — 18,872.82 6,500.00Madison 16,500.00 — 23,537.52 6,500.00Marion 2,500.00 9,000.00 20,325.00 6,500.00Marshall 1,500.00 — 17,505.28 6,500.00Mason 1,500.00 6,000.00 21,750.00 6,500.00Massac 1,000.00 3,000.00 15,798.96 6,500.00McDonough 4,500.00 6,000.00 15,316.08 6,500.00McHenry 8,500.00 42,000.00 39,526.50 6,500.00McLean 13,000.00 33,000.00 26,784.35 5,958.33Menard 500.00 3,000.00 18,321.24 6,500.00Mercer 2,000.00 9,000.00 18,050.04 6,500.00Monroe 2,000.00 3,000.00 24,284.52 6,500.00Montgomery 4,000.00 — 19,054.02 6,500.00Morgan 2,000.00 3,000.00 19,369.77 6,500.00Moultrie 2,500.00 12,000.00 19,062.48 6,500.00Ogle 4,500.00 15,000.00 25,473.24 6,500.00Peoria 9,500.00 9,000.00 35,400.96 6,500.00Perry — 3,000.00 19,459.92 6,500.00Piatt 3,000.00 18,000.00 19,843.26 6,500.00Pike 2,500.00 — 16,231.80 6,500.00Pope — — 18,097.05 6,500.00Pulaski 1,000.00 — 15,773.28 6,500.00Putnam 1,000.00 3,000.00 14,604.72 6,500.00Randolph 3,000.00 3,000.00 20,846.61 6,500.00Richland 500.00 3,000.00 18,178.98 6,500.00Rock Island 10,000.00 3,000.00 22,971.04 6,500.00Saline 1,500.00 9,000.00 24,509.04 6,500.00Sangamon 9,500.00 12,000.00 26,810.22 6,500.00Schuyler 1,000.00 3,000.00 17,040.00 6,500.00Scott 1,000.00 — 14,761.26 6,500.00Shelby 1,500.00 — — 6,500.00St. Clair 3,500.00 — — 6,500.00Stark 1,500.00 3,000.00 15,000.00 6,500.00Stephenson 4,000.00 15,000.00 24,748.26 6,500.00Tazewell 3,500.00 6,000.00 25,615.20 6,500.00Union — 3,000.00 21,854.52 6,500.00Vermillion 3,750.00 3,000.00 21,750.00 6,500.00Wabash 500.00 — 16,475.04 6,500.00Warren 500.00 — 14,750.04 6,500.00Washington 2,000.00 3,000.00 17,833.34 6,500.00Wayne 1,500.00 — 15,989.28 6,500.00White 500.00 — 19,911.66 6,500.00Whiteside 3,000.00 3,000.00 27,370.40 6,500.00Will 15,500.00 54,000.00 41,148.96 6,445.90Williamson 2,000.00 — 22,326.00 6,500.00Winnebago 15,500.00 30,000.00 29,585.52 6,500.00Woodford 2,500.00 12,000.00 20,137.54 6,500.00
Total $386,500.00 $795,000.00 $2,143,422.24 $662,404.23

56 Illinois Department of Revnue
F I S C A L Y E A R 2 0 0 3 A N N U A L R E P O R T
Real Estate Transfer TaxStatutory Reference35 ILCS 200/31-1 to 31-70
DefinitionThe tax is imposed on the privilege of transferring titleto real estate or a beneficial interest in a land trust inIllinois. If the property transferred remains subject to anexisting mortgage, only the owner’s equity (not theamount of the mortgage outstanding) is included inthe base for computing the tax.
The recorder of deeds or registrar of titles in eachcounty collects the tax through the sale of revenuestamps which counties purchase from the Departmentof Revenue. The same stamp may also provideevidence of the payment of a county real estatetransfer tax.
The state rate is 50 cents for each $500 of value.Counties may impose a tax of 25 cents per $500 ofvalue on real estate transactions. Home rule units ofgovernment may also impose an additional realestate transfer tax.
DistributionCollections are deposited as follows: 50 percent intothe Illinois Affordable Housing Trust Fund; 35 percentinto the Open Space Lands Acquisition andDevelopment Fund; and 15 percent into the NaturalAreas Acquisition Fund.
Table 42: Real Estate Transfer Tax Rate HistoryEffective date Rate
January 1, 1968 50 cents per $500 of value *May 17, 1979 25 cents per $500 of value *(state)May 17, 1979 25 cents per $500 of value *(counties)September 15, 1989 50 cents per $500 of value *(state)* or fraction thereof
Graph 37: Real Estate Transfer Tax Collections
$72.4
$63.0
$59.6
$57.7
$53.7
$47.5
$39.2
$37.6
$33.3
$34.6
0 20 40 60 80
Millions
1994
1995
1996
1997
1998
1999
2000
2001
2002
2003

F I S C A L Y E A R 2 0 0 3 A N N U A L R E P O R T
Illinois Department of Revnue 57
Table 43: Real Estate Stamp Sales by CountyCounty FY 2000 FY 2001 FY 2002 FY 2003Adams $ 154,000 $ 99,000 $ 149,000 $ 139,000Alexander 4,530 7,830 8,125 4,851Bond 26,095 28,580 32,420 38,270Boone 135,548 180,196 200,000 200,000Brown 6,434 6,430 13,920 12,380Bureau 88,000 72,000 88,000 96,000Calhoun 6,060 9,025 10,881 9,898Carroll 53,938 51,727 48,344 55,552Cass 20,909 24,190 20,435 18,853Champaign 450,000 520,000 619,000 600,000Christian 60,000 60,000 84,000 60,000Clark 27,620 24,236 30,081 31,179Clay 18,350 20,164 19,992 24,325Clinton 61,105 65,235 59,245 67,058Coles 120,000 60,000 140,000 90,000Cook 25,760,893 27,381,085 29,266,258 34,130,047Crawford 32,931 26,093 33,050 23,123Cumberland 18,220 17,150 15,895 18,990DeKalb 315,000 360,000 400,000 450,000DeWitt 51,800 40,000 34,832 49,979Douglas 42,105 38,270 53,443 48,895Du Page 6,860,000 6,800,000 6,720,000 7,600,000Edgar 43,721 38,873 30,349 46,523Edwards 7,663 7,508 7,213 7,345Effingham 67,218 66,178 76,835 62,488Fayette 33,270 31,340 36,235 38,410Ford 34,380 33,045 36,266 39,138Franklin 50,001 40,001 40,000 45,000Fulton 80,001 80,000 50,000 75,000Gallatin 8,124 18,973 8,100 6,000Greene 22,000 22,535 22,680 27,000Grundy 213,756 154,099 191,929 286,544Hamilton 9,465 8,483 11,888 13,875Hancock 38,730 31,453 38,358 40,880Hardin 7,636 4,341 4,991 3,951Henderson 9,275 14,525 20,360 17,993Henry 104,190 103,465 110,360 107,865Iroquois 75,000 85,000 85,000 95,000Jackson 98,542 73,710 77,000 116,800Jasper 218,298 17,055 17,180 19,225Jefferson 60,002 40,000 90,000 55,000Jersey 36,000 46,000 45,000 50,000Jo Daviess 255,613 109,300 68,125 290,479Johnson 13,104 18,365 15,889 15,950Kane 2,741,424 3,023,722 3,330,687 3,354,109Kankakee 280,000 260,000 280,000 339,058Kendall 447,478 528,387 652,496 925,186Knox 90,000 90,000 110,000 100,000Lake 4,848,122 5,440,000 5,660,000 6,230,000LaSalle 376,000 349,961 400,000 300,039Lawrence 20,273 19,108 14,840 16,948
County FY 2000 FY 2001 FY 2002 FY 2003Lee $ 76,975 $ 145,300 $ 45,150 $ 117,450Livingston 80,001 105,138 80,000 105,000Logan 35,000 70,000 57,000 65,000Macon 265,000 275,000 250,000 250,000Macoupin 78,950 70,725 60,798 114,650Madison 806,707 700,002 720,000 800,000Marion 49,000 52,000 48,613 55,000Marshall 32,680 43,122 38,933 37,535Mason 38,200 36,250 32,800 23,550Massac 16,586 12,580 19,912 22,425McDonough 55,000 55,000 55,000 60,000McHenry 1,920,000 1,760,000 2,340,000 2,600,000McLean 568,000 565,001 765,000 750,000Menard 26,641 29,640 44,200 33,685Mercer 31,915 35,000 40,000 45,000Monroe 90,005 105,000 120,000 135,000Montgomery 150,737 39,979 59,980 50,000Morgan 95,000 80,000 80,000 75,000Moultrie 37,288 28,889 24,805 38,337Ogle 157,964 305,725 203,475 201,075Peoria 473,850 463,350 532,000 568,400Perry 23,090 26,373 21,960 21,155Piatt 50,091 53,210 59,948 55,000Pike 40,605 51,073 33,485 25,933Pope 8,876 4,190 7,650 7,118Pulaski 7,626 4,003 4,395 5,123Putnam 24,460 17,525 27,425 18,560Randolph 139,189 83,301 52,261 37,283Richland 22,784 21,892 24,482 26,118Rock Island 263,761 329,824 299,878 359,747St. Clair 607,136 555,752 695,101 757,994Saline 34,875 27,258 34,810 28,588Sangamon 534,177 510,732 559,918 683,968Schuyler 16,038 19,058 14,133 17,510Scott 8,194 8,233 13,170 12,348Shelby 40,526 43,223 44,115 42,558Stark 15,797 16,197 11,665 16,640Stephenson 117,796 104,791 113,009 118,704Tazewell 390,000 345,000 345,000 390,000Union 18,176 21,071 21,113 21,301Vermilion 157,805 130,000 148,000 121,000Wabash 17,215 17,454 17,720 18,060Warren 38,522 35,300 41,000 35,700Washington 27,275 25,825 32,900 19,850Wayne 23,823 18,249 17,155 34,438White 19,065 21,694 20,400 17,566Whiteside 130,000 80,000 126,150 116,500Will 3,999,072 4,264,741 4,266,667 5,333,159Williamson 106,280 108,540 144,557 168,668Winnebago 800,000 800,000 800,000 1,000,000Woodford 82,665 106,333 87,985 122,967
Total $ 57,453,233 $ 59,475,171 $ 63,282,413 $ 72,274,858

58 Illinois Department of Revnue
F I S C A L Y E A R 2 0 0 3 A N N U A L R E P O R T
Disbursements to Local GovernmentsTable 44: Taxes Disbursed to Local GovernmentsSection 1: Taxes Collected for Local Governments (1)
FY 2001 FY 2002 FY 2003Automobile Renting Taxes1 County Automobile Renting Tax 78,203 64,509 48,0412 MPEA Automobile Renting Tax 26,945,368 24,050,677 21,335,6143 Municipal Automobile Renting Tax 5,715,746 5,154,968 4,804,136
A. Total Automobile Renting Taxes $ 32,739,317 $ 29,270,154 $ 26,187,792
B. Chicago Soft Drink Tax $ 7,953,705 $ 7,323,659 $ 7,517,094
C. County Motor Fuel Tax $ 26,983,326 $ 26,247,323 $ 27,781,966
D. County Water Commission Tax (2) $ 33,615,413 $ 32,848,682 $ 31,373,768Home Rule and Non-home Rule Taxes (3)
1 Chicago Home Rule Vehicle Use Tax 24,786,163 26,203,321 23,633,3562 County Home Rule 279,511,401 273,592,150 274,366,9643 Municipal Home Rule 379,927,819 389,231,803 430,982,8944 Municipal Non-home Rule 2,638,254 4,446,818 8,127,457
E. Total Home Rule and Non-home Rule Taxes $ 686,863,637 $ 693,474,092 $ 737,110,671
Hotel Taxes1 Illinois Sport Facilities Tax (4) 27,222,223 23,474,429 24,395,8482 MPEA Hotel Tax 31,736,059 27,366,872 28,441,0763 Municipal Hotel Tax 13,750,046 11,856,981 12,322,392
F. Total Hotel Taxes $ 72,708,328 $ 62,698,282 $ 65,159,316
Mass Transit District Sales and Use Taxes1 RTA 519,184,837 524,339,320 520,020,3522 MED 22,737,679 23,372,482 23,775,009
G. Total Mass Transit District Sales and Use Taxes $ 541,922,516 $ 547,711,802 $ 543,795,360
H. Metro-east Park and Recreation District Tax (5) $ 0 $ 3,096,778 $ 3,558,619
I. MPEA Food and Beverage Tax $ 23,106,600 $ 21,852,319 $ 22,986,895
J. Municipal Simplified Telecommunication Tax (6) $ 0 $ 0 $ 98,306,436
Replacement Vehicle Taxes1 County Replacement Vehicle 258 149 4442 Municipal Replacement Vehicle 45,458 51,838 59,455
K. Total Replacement Vehicle Taxes $ 45,716 $ 51,987 $ 59,899
L. Tennessee Valley Authority (TVA) $ 159,760 $ 180,877 $ 190,347
M. Special County ROT for Public Safety $ 18,275,098 $ 22,591,932 $ 25,768,593
Total Section 1: Taxes Collected forLocal Governments (A+B+C+D+E+F+G+H+I+J+K+L+M) $ 1,444,373,416 $ 1,425,314,691 $ 1,589,796,755

F I S C A L Y E A R 2 0 0 3 A N N U A L R E P O R T
Illinois Department of Revnue 59
Table 44: Taxes Disbursed to Local Governments (continued)Section 2: Revenue-sharing with Local Governments
FY 2001 FY 2002 FY 2003Gaming Taxes1 Charitable Games 49,160 48,775 46,2402 Pull Tabs and Jar Games 1,320,204 1,271,011 1,273,434
A. Total Gaming Taxes $ 1,369,364 $ 1,319,786 $ 1,319,674
Fund Transfers to Local Governments1 Income Tax (LGDF) 903,539,363 827,497,057 792,571,0512 Photoprocessing (LGDF) (7) 25,267,839 24,927,618 03 Local Share of Use Tax (State and Local Sales Tax Reform Fund)
Build Illinois 37,800,000 37,800,000 37,800,000City of Chicago (Chicago Use Tax) 41,935,443 36,538,588 35,060,281Metro-East Public Transportation Fund 1,258,063 1,096,203 1,051,808Local Use Tax (subsequently deposited into the LGDF) 107,715,967 88,994,187 83,681,931RTA Occupation and Use Tax Replacement Fund 21,089,120 18,269,295 17,530,140Total Local Share of Use Tax 209,798,593 182,698,274 175,124,160
4 Sales Tax Transfers for Local TransportationPublic Transportation Fund 164,329,470 165,571,042 164,505,018Downstate Public Transportation Fund 37,798,346 41,706,544 45,574,000Metro-East Public Transportation Fund 14,954,917 15,220,123 15,278,358Total Sales Tax Transfers for Local Transportation 217,082,733 222,497,709 225,357,376
B. Total Fund Transfers to Local Governments $ 1,355,688,528 $ 1,257,620,658 $ 1,193,052,587
Local Share of Sales and Use Taxes1 County Share of State Taxes (2) 51,112,504 48,664,169 47,804,8952 Countywide Share of State Taxes (2) 168,836,788 174,486,192 176,106,9133 Municipal Share of State Taxes (2) 1,276,961,158 1,313,681,619 1,318,972,6774 RTA Share of State Taxes (2) 112,233,903 112,410,493 111,136,272
C. Total Local Share of Sales and Use Taxes $ 1,609,144,353 $ 1,649,242,472 $ 1,654,020,754
Motor Fuel Taxes (Collected by IDOR and Distributed by IDOT)1 Counties 212,317,355 213,309,872 215,370,3682 Municipalities 297,726,491 299,001,555 302,202,9553 Townships 96,320,159 96,815,021 97,825,091
D. Total Motor Fuel Taxes $ 606,364,005 $ 609,126,448 $ 615,398,413
E. Replacement Taxes $ 1,006,863,634 $ 878,330,216 $ 753,224,347
F. Tax Increment Financing Districts $ 16,781,564 $ 16,947,385 $ 16,848,629
Total Section 2: Revenue-sharing withLocal Governments (A+B+C+D+E+F) $ 4,596,211,448 $ 4,412,586,965 $ 4,233,864,404
Disbursements Grand Total(Section 1 + Section 2) $ 6,040,584,864 $ 5,837,901,656 $ 5,823,661,159(1) The amount disbursed may not agree with collection figures reported in Table 1 because these amounts may include interest or
advance payments or are net of any statutory administrative fees.(2) Excludes hardship refunds.(3) Amounts include any interest or advance payments(4) Payments exclude $8 million dollar advance to the authority from the General Revenue Fund.(6) Imposed July 1, 2001.(6) First collections were January 1, 2003.(7) Discontinued July 1, 2003.

60 Illinois Department of Revnue
F I S C A L Y E A R 2 0 0 3 A N N U A L R E P O R T
Taxes Collected for LocalGovernmentsAutomobile Renting Occupationand Use TaxesStatutory ReferencesCounty Automobile Renting Occupation Tax 55 ILCS 5/5-1032; County Automobile Renting Use Tax, 55 ILCS 5/5-1033; Metro-East Mass Transit District (MED) AutomobileRenting Occupation Tax, 70 ILCS 3610/5.02; Metro-EastMass Transit District (MED) Automobile Renting Use Tax,70 ILCS 3610/5.02; Metropolitan Pier and ExpositionAuthority (MPEA) Automobile Renting Occupation Tax,70 ILCS 210/13(d); Metropolitan Pier and ExpositionAuthority (MPEA) Automobile Renting Use Tax, 70 ILCS210/13(e); Municipal Automobile Renting OccupationTax, 65 ILCS 5/8-11-7; Municipal Automobile Renting UseTax, 65 ILCS 5/8-11-8; Regional Transportation Authority(RTA) Automobile Renting Occupation Tax, 70 ILCS3615/4.03.1; Regional Transportation Authority (RTA)Automobile Renting Use Tax, 70 ILCS 3615/4.03.1
DefinitionLocal governments may impose automobile rentingtaxes on the same base as that used for the stateautomobile renting occupation and use taxes.
County and municipal governments and the Metro-East Mass Transit District (MED) may impose taxes of upto 1 percent.
The Regional Transportation Authority (RTA) may levysuch taxes at a rate not to exceed 1 percent in CookCounty or 0.25 percent in DuPage, Kane, Lake,McHenry, and Will counties.
The Metropolitan Pier and Exposition Authority (MPEA)imposes a 6 percent tax on automobiles rented withinCook County.
Local occupation and use taxes on automobilerentals were authorized in 1982. At the end of FY 99,261 municipal and 4 county governments hadimposed the taxes. The MPEA automobile renting taxbecame effective October 1, 1992.
DistributionCollections, minus an administrative fee of 1.6 percent formunicipalities and 2 percent for counties, are distributedmonthly to municipalities and counties. Collections arecertified to the state treasurer for distribution to the MPEA;no administrative fee is retained.
Chicago Home Rule Municipal SoftDrink Retailers’ Occupation TaxStatutory Reference65 ILCS 5/8-11-6b
DefinitionThe Chicago Home Rule Municipal Soft DrinkOccupation Tax is imposed on persons who sellcanned or bottled soft drinks at retail in Chicago. “Softdrinks” include (but are not limited to) soda water,carbonated water, colas, and drinks containing lessthan 50 percent natural fruit or vegetable juice.
Effective April 1, 1994, the rate is 3 percent of grossreceipts from soft drinks sold at retail.
DistributionCollections, minus a 2 percent administrative fee, aredistributed monthly to Chicago based on sales of softdrinks occurring in the municipality.
County Motor Fuel TaxStatutory Reference55 ILCS 5/5-1035.1
DefinitionDuPage, Kane, and McHenry counties may impose atax on the retail sale of motor fuel at a rate notexceeding 4 cents per gallon. DuPage and McHenrycounties levy the tax at the maximum rate, while KaneCounty imposes the tax at 2 cents per gallon.
The County Motor Fuel Tax Law was enacted in 1989.DuPage County approved its ordinance in January1990, Kane County in June 1991, and McHenry Countyin August 1991.
DistributionCollections and earned interest, minus anadministrative fee not to exceed 2 percent of theprevious year’s receipts, are distributed monthly to thethree counties imposing the tax.

F I S C A L Y E A R 2 0 0 3 A N N U A L R E P O R T
Illinois Department of Revnue 61
County Water Commission TaxesStatutory Reference70 ILCS 3720/4
DefinitionThe County Water Commission Tax of 0.25 percent isimposed on sales of general merchandise within theboundaries serviced by the County Water Commission(most of DuPage County and certain municipalities inCook and Will Counties). A “use” tax is also imposed atthe same rate.
Legislation creating water commission districtsbecame effective in 1985. DuPage County imposed itswater commission tax on July 1, 1986.
DistributionCollections are distributed monthly to the CountyWater Commission.
Home Rule and Non-home RuleSales and Use TaxesStatutory ReferencesHome Rule County Retailers’ Occupation Tax, 55 ILCS5/5-1006; Home Rule County Service Occupation Tax,55 ILCS 5/5-1007; Home Rule Municipal Retailers’Occupation Tax, 65 ILCS 5/8-11-1 and 65 ILCS 5/8-11-1.6 (non-home rule provisions); Home RuleMunicipal Service Occupation Tax, 65 ILCS 5/8-11-5
DefinitionHome rule units of local government are authorized toimpose a home rule sales tax (in 0.25 percentincrements) to be collected by the department. Thetax is imposed on the same general merchandisebase as the state sales tax, excluding titled orregistered tangible personal property (such asvehicles, watercraft, aircraft, trailers, and mobilehomes), and qualifying food, drugs and medicalappliances.
Certain non-home rule units of local government areauthorized to impose a non-home rule sales tax (in0.25 percent increments) to be collected by thedepartment. The tax is imposed on the same generalmerchandise base as the state sales tax, excludingtitled or registered tangible personal property (such asvehicles, watercraft, aircraft, trailers, and mobilehomes), and qualifying food, drugs and medicalappliances.
The department administers the 1 percent ChicagoHome Rule Use Tax on automobiles and other titled orregistered items sold by dealers located in thecounties of Cook, Kane, Lake, McHenry, DuPage, andWill selling items that will be registered to an addresswithin the corporate limits of Chicago.
Before Illinois Sales Tax Reform, most municipalitiesimposing a home rule sales tax did so at a 1 percentrate. However, some home rule units imposed onlypartial taxes by “capping” the amount taxed. Thedepartment did not collect these sales taxes.
New home rule provisions became effective with theenactment of Sales Tax Reform. The departmentbegan collecting home rule sales taxes on September1, 1990. Effective September 1, 1991, home rule unitscould no longer impose a sales tax on qualifying food,drugs, and medical appliances. However, home ruleunits could continue to impose and collect their ownexcise taxes on utilities, hotels and motels, real estatetransfers, restaurants, alcohol and cigarettes, and usetax on titled or registered tangible personal propertysuch as vehicles, watercraft, aircraft, trailers, andmobile homes.
In FY 92, the department began administering the 1percent Chicago Home Rule Use Tax on automobilesand other titled items. The department beganadministering non-home rule sales tax on January 1,1994.
DistributionCollections are distributed monthly to the units of localgovernment imposing the tax based on salesoccurring within the local government’s boundaries.(Chicago Home Rule Use Tax collections, minus a 2%administrative fee, are distributed to Chicago.)

62 Illinois Department of Revnue
F I S C A L Y E A R 2 0 0 3 A N N U A L R E P O R T
Table 45: FY 2003 Home Rule, Non-home Rule, and Special County ROT for Public Safety Sales Tax DisbursementsNet Advanced
Municipality Collected Interest Payment TotalAddison 2,645,963.03 1,747.63 0 2,647,710.66Alsip 918,371.43 515.97 0 918,887.40Alton 1,656,003.46 1,181.16 272.18 1,657,456.80Arlington Heights 3,744,605.52 2,830.57 0 3,747,436.09Aurora 12,196,789.29 8,729.98 32,504.15 12,238,023.42Bedford Park 2,241,571.50 1,158.93 0 2,242,730.43Belleville 848,859.50 611.69 1,223.44 850,694.63Berkeley 123,660.16 90.24 0 123,750.40Berwyn 1,807,858.32 1,319.61 0 1,809,177.93Bloomingdale 3,168,842.30 1,957.13 0 3,170,799.43Bloomington 11,144,975.63 7,716.54 128,404.04 11,281,096.21Bolingbrook 5,824,593.86 4,164.38 27,771.36 5,856,529.60Bridgeview 2,799,041.85 1,443.87 0 2,800,485.72Buffalo Grove 1,902,144.35 1,393.11 3,346.22 1,906,883.68Burbank 1,834,679.23 1,291.35 0 1,835,970.58Burnham 45,108.94 33.22 0 45,142.16Cahokia 423,887.00 273.53 0 424,160.53Calumet City 4,508,826.06 2,785.75 0 4,511,611.81Carbondale 3,645,429.46 2,591.56 9,836.11 3,657,857.13Carpentersville 1,679,592.17 1,163.57 15,153.92 1,695,909.66Champaign 9,998,239.32 7,060.73 0 10,005,300.05Channahon 2,305,483.16 1,512.62 35,936.44 2,342,932.22Chicago 138,462,676.32 100,391.10 0 138,563,067.42Chicago Ridge 2,462,555.11 1,718.13 5,474.44 2,469,747.68Cicero 3,323,776.63 2,443.37 2,593.38 3,328,813.38Danville 3,488,649.54 2,478.50 0 3,491,128.04Decatur 8,099,646.22 5,660.58 0 8,105,306.80DeKalb 2,330,524.65 1,643.10 2,822.01 2,334,989.76Des Plaines 3,792,637.49 2,740.31 0 3,795,377.80Dolton 456,919.69 333.40 0 457,253.09East Hazelcrest 26,287.68 19.78 0 26,307.46East St. Louis 569,319.42 407.81 0 569,727.23Elgin 4,495,917.53 3,283.22 0 4,499,200.75Elk Grove Village 3,373,468.62 2,282.21 0 3,375,750.83Elmhurst 1,358,654.30 951.43 0 1,359,605.73Elmwood Park 807,936.81 586.24 0 808,523.05Elwood 360,060.78 241.70 0 360,302.48Evanston 5,476,611.02 3,960.83 79,755.53 5,560,327.38Evergreen Park 1,137,500.82 818.65 0 1,138,319.47Fairview Heights 1,840,593.65 1,284.57 3,069.25 1,844,947.47Galesburg 2,199,938.77 1,575.73 0 2,201,514.50Glendale Heights 748,430.87 533.72 0 748,964.59Granite City 2,168,309.45 1,442.57 0 2,169,752.02Gurnee 4,235,493.05 3,059.96 308,757.67 4,547,310.68Hanover Park 850,418.16 616.65 0 851,034.81Harwood Heights 734,223.12 519.05 0 734,742.17Highland Park 2,729,815.80 1,664.26 1,250.20 2,732,730.26Hillside 436,789.16 132.06 0 436,921.22Hoffman Estates 2,030,200.44 1,638.02 0 2,031,838.46Joliet 13,772,437.15 9,704.63 35,544.06 13,817,685.84Lansing 2,036,758.11 1,437.43 0 2,038,195.54Lincolnwood 1,211,531.07 872.44 0 1,212,403.51Marion 3,312,271.08 2,310.13 15,790.25 3,330,371.46Moline 4,559,009.16 3,226.78 0 4,562,235.94Monee 340,606.31 226.25 0 340,832.56Monmouth 534,132.24 390.39 1,629.33 536,151.96Morton Grove 1,787,784.28 1,534.67 15,621.22 1,804,940.17Mount Prospect 2,333,055.45 1,695.20 0 2,334,750.65Mount Vernon 3,061,043.59 2,187.71 1,087.79 3,064,319.09Mundelein 2,098,946.85 1,548.17 0 2,100,495.02Murphysboro 287,638.64 210.48 0 287,849.12Niles 6,412,151.63 4,571.31 0 6,416,722.94Normal 4,761,014.78 3,420.18 54,588.77 4,819,023.73Norridge 3,151,567.70 2,145.40 0 3,153,713.10Northbrook 2,862,102.57 2,029.62 174,735.04 3,038,867.23Northlake 1,859,347.73 1,345.79 7,599.78 1,868,293.30Oak Lawn 1,399,499.13 842.34 0 1,400,341.47Oak Park 1,950,471.80 1,411.53 544.93 1,952,428.26Orland Park 9,330,722.34 6,433.61 582,140.30 9,919,296.25Palatine 1,973,321.64 1,447.12 0 1,974,768.76Park Ridge 786,918.51 591.93 0 787,510.44Pekin 2,523,730.82 1,799.92 0 2,525,530.74
Net AdvancedMunicipality Collected Interest Payment TotalPeoria 18,421,573.07 11,917.48 0 18,433,490.55Peoria Heights 364,806.44 262.45 0 365,068.89Quincy 6,418,521.55 3,924.94 1,468.17 6,423,914.66Rock Island 1,152,243.69 774.00 0 1,153,017.69Rolling Meadows 1,059,243.40 789.55 0 1,060,032.95Rosemont 2,578,334.32 1,844.60 0 2,580,178.92Round Lake Beach 992,753.10 708.29 0 993,461.39Sauget 47,969.59 34.11 0 48,003.70Schaumburg 9,407,723.29 6,668.72 0 9,414,392.01Schiller Park 238,861.95 172.80 0 239,034.75Sesser 74,444.67 53.45 0 74,498.12Sherman 67,976.70 34.85 0 68,011.55Skokie 7,036,310.34 5,065.06 0 7,041,375.40South Barrington 218,299.79 162.26 0 218,462.05South Holland 513,117.16 270.71 0 513,387.87Springfield 14,656,132.60 10,517.38 0 14,666,649.98St Charles 2,572,273.05 1,834.41 3,039.48 2,577,146.94Stone Park 217,906.32 147.43 0 218,053.75Streamwood 970,179.84 723.12 1,772.81 972,675.77Sycamore 2,831,006.34 2,016.70 64,901.68 2,897,924.72Urbana 1,855,888.55 1,333.27 0 1,857,221.82Washington 860,827.61 620.30` 0 861,447.91Watseka 1,241,310.23 868.92 10,834.96 1,253,014.11Waukegan 3,937,258.14 2,033.21 0 3,939,291.35West Dundee 2,936,249.43 2,078.90 0 2,938,328.33Wheeling 2,556,835.62 1,889.24 15,305.48 2,574,030.34
Total 429,035,990.01 302,129.27 1,644,774.39 430,982,893.67
County Home RuleCook 274,119,249.85 247,714.00 0 274,366,963.85
Municipal Non-home RuleArcola 74,961.75 48.69 0 75,010.44Clinton 92,920.48 23.83 0 92,944.31East Peoria 3,215,756.10 2,078.83 0 3,217,834.93Forest View 225,709.81 144.58 0 225,854.39Forsyth 338,149.25 87.09 0 338,236.34Galena 82,246.54 20.25 0 82,266.79Jerseyville 545,585.14 352.46 0 545,937.60Litchfield 657,626.82 422.45 0 658,049.27Merrionette Park 142,937.88 91.62 0 143,029.50Mokena 746,181.85 457.74 0 746,639.59Ofallon 1,316,255.63 860.87 0 1,317,116.50Sparta 354,086.83 233.72 0 354,320.55Streator 190,669.74 49.21 0 190,718.95Swansea 139,462.22 35.66 0 139,497.88
Total 8,122,550.04 4,907.00 0 8,127,457.04
Chicago Home Rule Vehicle Use TaxChicago 23,616,233.49 17,122.73 0 23,633,356.22
County Public SafetyBoone 967,007.52 0 2,957.32 969,964.84Brown 53,196.01 0 0 53,196.01Carroll 205,352.57 0 0 205,352.57Champaign 3,630,654.01 0 8,226.04 3,638,880.05Kendall 2,408,895.57 0 115,254.88 2,524,150.45Knox 864,329.62 0 0 864,329.62LaSalle 2,447,093.86 0 0 2,447,093.86McDonough 903,100.07 0 0 903,100.07Marion 461,084.85 0 0 461,084.85Peoria 3,815,342.11 0 0 3,815,342.11Perry 467,116.22 0 0 467,116.22Pike 180,394.72 0 0 180,394.72Richland 499,640.55 0 0 499,640.55Stephenson 1,343,342.51 0 0 1,343,342.51Tazewell 4,555,375.98 0 329,789.74 4,885,165.72Vermilion 1,228,963.68 0 0 1,228,963.68Winnebago 0 0 0 0Woodford 1,281,475.18 0 0 1,281,475.18
Total 25,312,365.03 0 456,227.98 25,768,593.01

F I S C A L Y E A R 2 0 0 3 A N N U A L R E P O R T
Illinois Department of Revnue 63
Hotel TaxesIllinois Sports Facilities TaxStatutory Reference70 ILCS 3205/19
DefinitionThe Illinois Sports Facilities Authority imposes a 2percent of 98 percent tax on gross receipts from hoteloperators within the City of Chicago. Receipts frompermanent guests (occupants of 30 days or longer)are not taxed. Proceeds are used for the corporatepurposes of the authority, including construction costsfor the Comiskey Baseball Park.
The Illinois Sports Facilities Tax was enacted in 1988.
DistributionCollections, minus a 4 percent administrative fee, aredistributed monthly to the authority.
Metropolitan Pier and Exposition Authority(MPEA) Hotel TaxStatutory Reference70 ILCS 210/13(c)
DefinitionEffective October 1, 1992, the Metropolitan Pier andExposition Authority (MPEA) imposes a 2.5 percent taxon the gross receipts from hotel operators within thecity of Chicago.
DistributionCollections are certified to the state treasurer fordistribution to the MPEA to pay for the expansion ofMcCormick Place in Chicago.
Municipal Hotel Tax (Chicago)Statutory Reference65 ILCS 5/8-3-13
DefinitionChicago imposes a 1 percent of 99 percent tax ongross hotel receipts in the city. Receipts frompermanent guests (occupants of 30 days or longer)are not taxed. Proceeds are used to promote tourism.This tax was enacted in 1967.
DistributionCollections, minus a 4 percent administrative fee, aredistributed monthly to Chicago.

64 Illinois Department of Revnue
F I S C A L Y E A R 2 0 0 3 A N N U A L R E P O R T
Mass Transit District Taxes(Metro-East Mass Transit (MED) Taxes andRegional Transportation Authority (RTA)Taxes)Statutory ReferencesMetro-East Mass Transit District (MED) Retailers’Occupation Tax, 70 ILCS 3610/5.01(b); Metro-East MassTransit District (MED) Service Occupation Tax, 70 ILCS3610/5.01(c); Metro-East Mass Transit District (MED) UseTax, 70 ILCS 3610/5.01(d); Regional TransportationAuthority (RTA) Retailers’ Occupation Tax, 70 ILCS 3615/4.03; Regional Transportation Authority (RTA) ServiceOccupation Tax, 70 ILCS 3615/4.03; RegionalTransportation Authority (RTA) Use Tax, 70 ILCS 3615/4.03
DefinitionThe Regional Transportation Authority (RTA) isauthorized to impose a sales tax in Cook, DuPage,Kane, Lake, McHenry, and Will counties. The Metro-East Mass Transit District (MED) imposes a sales tax inparts of Madison and St. Clair counties.
The RTA imposes taxes at the following rates:
0.75 percent sales tax on general merchandise inCook County1.00 percent sales tax on qualifying food, drugs,and medical appliances in Cook County0.25 percent sales tax on general merchandiseand qualifying food, drugs, and medicalappliances in DuPage, Kane, Lake, McHenry, andWill counties
The RTA also receives an amount equal to 4 percent ofthe total general merchandise sold anywhere in CookCounty and 4 percent on out-of-state purchases of titledor registered general merchandise for which the title orregistration address of record is within Cook County.
The MED imposes taxes at the following rates:
Madison County — 0.25 percent sales tax ongeneral merchandise (including items that mustbe titled or registered) and sales of qualifyingfood, drugs, and medical appliancesSt. Clair County— 0.75 percent sales tax on general merchandise
(excluding items that are titled or registered)and sales of qualifying food, drugs, and medical
— 0.25 percent sales tax on sales of titled orregistered general merchandise
The RTA sales tax on general merchandise becameeffective November 1, 1979. It replaced the former5 percent tax on the sale and use of motor fuel, whichexpired October 31, 1979, when the new sales taxtook effect.
The MED ordinances became effective on February 1,1981. Monroe County rescinded its ordinanceeffective July 1, 1981.
DistributionCollections are distributed monthly to each masstransit district based on the sales occurring within thedistrict boundaries.
Table 46: FY 2003 Regional Transportation AuthorityPayments
RTA Sales Tax
County Payment Percent of totalCook $ 423,470,271.79 67.09%DuPage 39,589,477.88 6.27%Kane 12,113,179.39 1.92%Lake 24,169,376.88 3.83%McHenry 7,217,392.22 1.14%Will 12,774,356.35 2.02%
Total $ 519,334,054.51 82.28%
Share of State Taxes(revenue-sharing)
$ 111,136,271.92 17.61%
Advanced Payment $ 686,297.29 0.11%
Total $ 631,156,623.72 100.0%
Table 47: FY 2003 Metro-East Mass Transit DistrictPayments
County Payment Percent of total
Madison $ 6,615,013.75 27.82%St .Clair 17,159,994.84 72.18%
Total $ 23,775,008.59 100.00%
Metro-East Park and RecreationDistrict TaxStatutory referenceMetro-East Park and Recreation District Act, 70 ILCS1605
DefinitionThe Metro-East Park and Recreation District tax of 0.10percent is imposed on sales of general merchandisewithin the district’s boundaries. The tax is imposed onthe same general merchandise base as the state salestax, excluding titled or registered tangible personalproperty (such as vehicles, watercraft, aircraft, trailers,and mobile homes), and qualifying food, drugs andmedical appliances.
DistributionFunds are distributed monthly.

F I S C A L Y E A R 2 0 0 3 A N N U A L R E P O R T
Illinois Department of Revnue 65
Metropolitan Pier and Exposition Authority Food and Beverage TaxStatutory Reference70 ILCS 210/13(b)
DefinitionA retailers’ occupation tax on the gross receipts from food prepared for immediate consumption, alcoholicbeverages, and soft drinks is imposed on sales within Chicago’s Metropolitan Pier and Exposition Authority(MPEA) boundaries. Effective October 1, 1992, the tax rate is 1 percent.
DistributionCollections, minus a 2 percent administrative fee, are certified to the state treasurer for distribution to the MPEAto pay for the expansion of Chicago’s McCormick Place.
Municipal Simplified Telecommunications TaxStatutory Reference35 ILCS 635/1 to 635/920
DefinitionMunicipalities may impose the Simplified Municipal Telecommunications Tax on the privilege of originating orreceiving telecommunications. Telecommunication service providers who have customers who have a serviceaddress that is located in a municipality with a population of 500,000 or less report and pay the municipal taxesdirectly to the department. The Chicago Department of Revenue administers and collects the City ofChicago’s tax.
DistributionCollections, minus a 0.5 percent administrative fee, are distributed monthly to each municipality imposing this tax.
Replacement Vehicle Taxes(County Replacement Vehicle Tax, Municipal Replacement Vehicle Tax)DefinitionThe Counties Code allows Illinois counties to impose a $50 replacement vehicle tax on any vehicle purchasedwithin the county (but outside any incorporated municipality imposing a replacement vehicle tax) by aninsurance company as settlement for a total loss.
The Illinois Municipal Code authorizes Illinois municipalities to impose a replacement vehicle tax of $50 on anyvehicle purchased within the municipality by an insurance company as settlement for a total loss.
DistributionCollections, minus an administrative fee of 1.6 percent for municipalities and 2 percent for counties aredistributed monthly to the municipality or county from which the tax was collected.
Special County Retailers’ Occupation Tax for Public SafetyStatutory Reference55 ILCS 5/5-1006.5
DefinitionCounty governments are authorized to impose, with voter approval, a countywide tax (in 0.25 percentincrements) to be collected by the department. The tax is imposed on the same general merchandise base asthe state sales tax, excluding titled or registered tangible personal property (such as vehicles, watercraft, aircraft,trailers, and mobile homes) and qualifying food, drugs and medical appliances.
This tax was enacted in July 1995 and was originally limited to counties with a population greater than 180,000residents. The law was amended in March 1997 to remove the population requirement. Revenues generatedmust be used exclusively for public safety purposes in the county that imposes the tax.
DistributionCollections are distributed monthly to the counties imposing the tax and are based on sales occurring in each county.

66 Illinois Department of Revnue
F I S C A L Y E A R 2 0 0 3 A N N U A L R E P O R T
Revenue-sharing withLocal GovernmentsGaming Taxes(Charitable Games Tax and license fees, PullTabs and Jar Games Tax and license fees)Charitable Games Tax — Revenues received from theoperator license fees and the 3 percent tax on grossproceeds of charitable games are deposited into theIllinois Gaming Law Enforcement (IGLE) Fund. Two-thirdsof the amount deposited into the IGLE Fund isappropriated to the Department of Revenue, theDepartment of the State Police, and the Office of the
Attorney General. The remaining one-third is distributedfor law enforcement purposes to municipalities andcounties annually in proportion to the number oflicenses issued in each municipality or county.
Pull Tab and Jar Games Tax — Revenues received fromthe operator license fees and the 5 percent tax ongross proceeds of pull tabs and jar games are dividedequally between the Common School Fund and theIllinois Gaming Law Enforcement (IGLE) Fund. Two-thirdsof the amount deposited into the IGLE Fund isappropriated to the Department of Revenue, theDepartment of the State Police, and the Office of theAttorney General. The remaining one-third is distributedfor law enforcement purposes to municipalities andcounties annually in proportion to the number oflicenses issued in each municipality or county.
Table 48: Charitable Games Distributions to Municipalities and CountiesTreasurer Number of licenses AllocationCountyCook County Treasurer 1 215.07DuPage County Treasurer 2 430.14Kankakee County Treasurer 1 215.07Lake County Treasurer 3 645.21McHenry County Treasurer 1 215.07Winnebago County Treasurer 1 215.07Total County 5 $ 1,935.63MunicipalityAddison Village Treasurer 2 430.14Antioch Village Treasurer 2 430.14Arlington Heights Treasurer 3 645.21Aurora City Treasurer 1 215.07Aviston Village Treasurer 1 215.07Belleville City Treasurer 7 1,505.49Bloomingdale Village Treasurer 1 215.07Blue Island City Treasurer 2 430.14Bradley Village Treasurer 1 215.07Breese City Treasurer 1 215.07Brookfield Village Treasurer 1 215.07Burbank City Treasurer 2 430.14Cahokia Village Treasurer 2 430.14Carbondale City Treasurer 1 215.07Carol Stream Village Treasurer 1 215.07Chicago City Treasurer 41 8,817.87Collinsville City Treasurer 1 215.07Columbia City Treasurer 1 215.07Crestwood Village Treasurer 1 215.07Danville City Treasurer 2 430.14Decatur City Treasurer 1 215.07Deerfield Village Treasurer 2 430.14Des Plaines City Treasurer 3 645.21Downers Grove Vlg Treasurer 1 215.07Edwardsville City Treasurer 1 215.07Effingham City Treasurer 2 430.14Elk Grove Village Treasurer 1 215.07Evanston Finance Director 2 430.14Evergreen Park Vlg Treasurer 1 215.07Flossmoor Village Treasurer 1 215.07Forest Park Village Treasurer 1 215.07Fox Lake Village Treasurer 1 215.07Freeburg Village Treasurer 1 215.07Galesburg City Treasurer 1 215.07Geneva City Treasurer 1 215.07Glen Ellyn Village Treasurer 1 215.07Glendale Heights Vlg Treasurer 1 215.07Glenview Village Treasurer 1 215.07Granite City Treasurer 2 430.14Herrin City Treasurer 1 215.07Hoffman Estates Vlg Treasurer 3 645.21Homewood Village Treasurer 1 215.07Itasca Village Treasurer 1 215.07Joliet City Treasurer 1 215.07Kankakee City Treasurer 3 645.21Kaskaskia Village Treasurer 1 215.07Lake Villa Village Treasurer 1 215.07Lemont Village Treasurer 2 430.14Lexington City Treasurer 1 215.07Libertyville Village Treasurer 1 215.07
Treasurer Number of licenses AllocationMunicipalityLincolnshire Village Treasurer 6 1,290.42Lisle Village Treasurer 2 430.14Lockport City Treasurer 2 430.14Lombard Village Treasurer 1 215.07Long Grove Village Treasurer 1 215.07Manhattan Village Treasurer 1 215.07Marseilles City Treasurer 1 215.07Maryville Village Treasurer 1 215.07Matteson Village Treasurer 1 215.07McHenry City Treasurer 1 215.07Monroe County Treasurer 1 215.07Mount Prospect Vlg Treasurer 1 215.07Mount Zion Village Treasurer 1 215.07Mundelein Village Treasurer 3 645.21Murphysboro City Treasurer 1 215.07Naperville City Treasurer 2 430.14New Baden Village Treasurer 1 215.07North Aurora Village Treasurer 1 215.07Northbrook Village Treasurer 3 645.21Northfield Village Treasurer 1 215.07Oak Brook Village Treasurer 4 860.28Oak Lawn Village Treasurer 1 215.07Oakbrook Terrace City Treas 2 430.14Ofallon City Treasurer 1 215.07Orland Park Village Treasurer 1 215.07Ottawa City Treasurer 1 215.07Palatine Village Treasurer 1 215.07Park Ridge City Treasurer 1 215.07Pawnee Village Treasurer 1 215.07Peoria City Treasurer 1 215.07Radom Village Treasurer 1 215.07River Forest Village Treasurer 1 215.07Rockford City Comptroller 11 2,365.77Rolling Meadows City Treasurer 2 430.14Roscoe Village Treasurer 1 215.07Rosemont Village Treasurer 6 1,290.42Salem City Treasurer 1 215.07Schaumburg Village Treasurer 1 215.07Skokie Village Treasurer 1 215.07South Beloit City Treasurer 1 215.07Spring Bay Village Treasurer 1 215.07Spring Grove Village Treasurer 1 215.07Springfield City Treasurer 1 215.07St Charles City Treasurer 4 860.28Tinley Park Village Treasurer 2 430.14Vernon Hills Village Treasurer 1 215.07Waterloo City Treasurer 1 215.07Waukegan City Treasurer 1 215.07West Chicago City Treasurer 1 215.07Willow Springs Vlg Treasurer 1 215.07Wilmette Village Treasurer 1 215.07Winnetka Village Treasurer 1 215.07Wood Dale City Treasurer 1 215.07Woodridge Village Treasurer 1 215.07Woodstock City Treasurer 1 215.07Total Municipal 206 $ 44,304.42Grand Total 215 $ 46,240.05

F I S C A L Y E A R 2 0 0 3 A N N U A L R E P O R T
Illinois Department of Revnue 67
Table 49: Pull Tabs and Jar Games Distributions to Municipalities and Counties
Treasurer Number of licenses AllocationCountyAdams County Treasurer 1 1,268.36Cass County Treasurer 1 1,268.36Champaign County Treasurer 1 1,268.36Cook County Treasurer 19 24,098.84Cumberland County Treasurer 1 1,268.36DuPage County Treasurer 5 6,341.80Franklin County Treasurer 1 1,268.36Grundy County Treasurer 1 1,268.36Jackson County Treasurer 1 1,268.36Jefferson County Treasurer 1 1,268.36Kane County Treasurer 5 6,341.80Kendall County Treasurer 1 1,268.36Lake County Treasurer 4 5,073.44LaSalle County Treasurer 3 3,805.08Lee County Treasurer 2 2,536.72Livingston County Treasurer 2 2,536.72Macon County Treasurer 1 1,268.36Macoupin County Treasurer 2 2,536.72Madison County Treasurer 3 3,805.08Mason County Treasurer 1 1,268.36McHenry County Treasurer 3 3,805.08McDonough County Treasurer 1 1,268.36Monroe County Treasurer 1 1,268.36Perry County Treasurer 3 3,805.08Randolph County Treasurer 3 3,805.08Tazewell County Treasurer 3 3,805.08Union County Treasurer 1 1,268.36Vermilion County Treasurer 1 1,268.36Will County Treasurer 7 8,878.52Williamson County Treasurer 1 1,268.36Winnebago County Treasurer 4 5,073.44Woodford County Treasurer 4 5,073.44Total County 88 $ 111,615.68MunicipalityAbingdon City Treasurer 1 1,268.36Albion City Treasurer 2 2,536.72Aledo City Treasurer 1 1,268.36Algonquin Village Treasurer 1 1,268.36Alsip Village Treasurer 1 1,268.36Altamont City Treasurer 1 1,268.36Alton City Treasurer 4 5,073.44Antioch Village Treasurer 2 2,536.72Arlington Heights Treasurer 3 3,805.08Aurora City Treasurer 13 16,488.68Bartlett Village Treasurer 1 1,268.36Bartonville Village Treasurer 1 1,268.36Batavia City Treasurer 2 2,536.72Beckemeyer Village Treasurer 2 2,536.72Beecher Village Treasurer 1 1,268.36Belleville City Treasurer 4 5,073.44Bellwood Village Treasurer 2 2,536.72Belvidere City Treasurer 5 6,341.80Bensenville Village Treasurer 1 1,268.36Benton City Treasurer 3 3,805.08Berwyn City Treasurer 6 7,610.16Bethalto Village Treasurer 1 1,268.36Bloomingdale Village Treasurer 1 1,268.36Bloomington City Treasurer 5 6,341.80Blue Island City Treasurer 2 2,536.72Bolingbrook Village Treasurer 7 8,878.52Bradley Village Treasurer 2 2,536.72Braidwood City Treasurer 1 1,268.36Bridgeview Village Treasurer 5 6,341.80Brocton Village Treasurer 1 1,268.36Brookfield Village Treasurer 2 2,536.72Burbank City Treasurer 2 2,536.72Cahokia Village Treasurer 3 3,805.08Cairo City Treasurer 1 1,268.36Calumet City Treasurer 1 1,268.36Canton City Treasurer 4 5,073.44Carbondale City Treasurer 2 2,536.72Carlinville City Treasurer 3 3,805.08Carlyle City Treasurer 2 2,536.72Carmi City Treasurer 2 2,536.72Carol Stream Village Treasurer 1 1,268.36Carpentersville Vlg Treasurer 2 2,536.72Carrier Mills Vlg Treasurer 1 1,268.36Carthage City Treasurer 1 1,268.36
Treasurer Number of licenses AllocationMunicipalityCasey City Treasurer 2 2,536.72Caseyville Village Treasurer 3 3,805.08Cedar Point Village Treasurer 1 1,268.36Cedarville Village Treasurer 1 1,268.36Centralia City Treasurer 5 6,341.80Champaign City Treasurer 4 5,073.44Charleston City Treasurer 4 5,073.44Chenoa City Treasurer 1 1,268.36Cherry Valley Treasurer 1 1,268.36Chester City Treasurer 5 6,341.80Chicago City Treasurer 98 124,299.28Chicago Heights City Treasurer 6 7,610.16Chicago Ridge Vlg Treasurer 3 3,805.08Chillicothe City Treasurer 2 2,536.72Christopher City Treasurer 1 1,268.36Cicero Town Treasurer 8 10,146.88Clinton City Treasurer 3 3,805.08Clinton County Treasurer 1 1,268.36Coal City Village Treasurer 1 1,268.36Collinsville City Treasurer 5 6,341.80Colona City Treasurer 1 1,268.36Columbia City Treasurer 2 2,536.72Crestwood Village Treasurer 5 6,341.80Creve Coeur Village Treasurer 4 5,073.44Cuba City Treasurer 1 1,268.36Cullom Village Treasurer 1 1,268.36Danville City Treasurer 1 1,268.36Darien City Treasurer 1 1,268.36Decatur City Treasurer 8 10,146.88DeKalb City Treasurer 3 3,805.08Des Plaines City Treasurer 4 5,073.44Dixon City Treasurer 1 1,268.36Dolton Village Treasurer 11 13,951.96Downers Grove Vlg Treasurer 3 3,805.08Dubois Village Treasurer 1 1,268.36Dupo Village Treasurer 1 1,268.36Duquoin City Treasurer 3 3,805.08Dwight Village Treasurer 1 1,268.36East Alton Village Treasurer 1 1,268.36East Dundee Village Treasurer 2 2,536.72East Gillespie Vlg Treasurer 1 1,268.36East Moline City Treasurer 2 2,536.72East Peoria City Treasurer 1 1,268.36Edgewood Village Treasurer 1 1,268.36Edwardsville City Treasurer 2 2,536.72Effingham City Treasurer 7 8,878.52El Paso City Treasurer 1 1,268.36Eldorado City Treasurer 1 1,268.36Elgin City Treasurer 9 11,415.24Elk Grove Village Treasurer 1 1,268.36Elmhurst City Treasurer 2 2,536.72Eureka City Treasurer 1 1,268.36Evergreen Park Vlg Treasurer 2 2,536.72Fairbury City Treasurer 1 1,268.36Fairfield City Treasurer 3 3,805.08Fairmont City Vlg Treasurer 1 1,268.36Fairview Hts City Treasurer 3 3,805.08Farina Village Treasurer 1 1,268.36Farmer City Treasurer 1 1,268.36Farmington City Treasurer 1 1,268.36Fayetteville Village Treasurer 1 1,268.36Flora City Treasurer 5 6,341.80Flossmoor Village Treasurer 1 1,268.36Forest Park Village Treasurer 2 2,536.72Fox Lake Village Treasurer 2 2,536.72Franklin Park Vlg Treasurer 1 1,268.36Freeburg Village Treasurer 1 1,268.36Freeport City Treasurer 3 3,805.08Galesburg City Treasurer 5 6,341.80Gardner Village Treasurer 1 1,268.36Geneseo City Treasurer 1 1,268.36Geneva City Treasurer 1 1,268.36Genoa City Treasurer 1 1,268.36Germantown Village Treasurer 3 3,805.08Glendale Heights Vlg Treasurer 3 3,805.08Glenview Village Treasurer 1 1,268.36Godfrey Village Treasurer 1 1,268.36Granite City Treasurer 12 15,220.32

68 Illinois Department of Revnue
F I S C A L Y E A R 2 0 0 3 A N N U A L R E P O R T
Table 49: Pull Tabs and Jar Games Distributions to Municipalities and Counties (continued)
Treasurer Number of licenses AllocationMunicipalityGrayslake Village Treasurer 1 1,268.36Grayville City Treasurer 2 2,536.72Greenup Village Treasurer 2 2,536.72Gurnee Village Treasurer 1 1,268.36Hamilton City Treasurer 1 1,268.36Hanna City Village Treasurer 1 1,268.36Harrisburg City Treasurer 3 3,805.08Harvard City Treasurer 1 1,268.36Harvey City Treasurer 2 2,536.72Harwood Heights Vlg Treasurer 1 1,268.36Havana City Treasurer 1 1,268.36Hecker Village Treasurer 1 1,268.36Henderson County Treasurer 1 1,268.36Henry City Treasurer 1 1,268.36Herrin City Treasurer 4 5,073.44Heyworth City Treasurer 1 1,268.36Hickory Hills Vlg Treasurer 3 3,805.08Highland City Treasurer 1 1,268.36Hillsboro City Treasurer 2 2,536.72Hillside Village Treasurer 1 1,268.36Hinsdale Village Treasurer 1 1,268.36Hometown City Treasurer 1 1,268.36Hoopeston City Treasurer 1 1,268.36Huntley Village Treasurer 2 2,536.72Itasca Village Treasurer 1 1,268.36Jacksonville City Treasurer 6 7,610.16Jerseyville City Treasurer 3 3,805.08Joliet City Treasurer 17 21,562.12Kankakee City Treasurer 2 2,536.72Kewanee City Treasurer 4 5,073.44Kincaid Village Treasurer 3 3,805.08Lacon City Treasurer 1 1,268.36Lagrange Park Vlg Treasurer 2 2,536.72Lake In The Hills Vlg Treas 1 1,268.36Lake Zurich Village Treasurer 1 1,268.36LaSalle City Treasurer 5 6,341.80Lawrence County Treasurer 2 2,536.72Lawrenceville City Treasurer 3 3,805.08Lemont Village Treasurer 2 2,536.72Libertyville Village Treasurer 2 2,536.72Lincoln City Treasurer 4 5,073.44Lindenhurst Village Treasurer 1 1,268.36Litchfield City Treasurer 3 3,805.08Lockport City Treasurer 5 6,341.80Lombard Village Treasurer 4 5,073.44Loves Park City Treasurer 7 8,878.52Macomb City Treasurer 3 3,805.08Macon City Treasurer 1 1,268.36Madison City Treasurer 1 1,268.36Manteno Village Treasurer 1 1,268.36Marion City Treasurer 3 3,805.08Marseilles City Treasurer 2 2,536.72Marshall City Treasurer 2 2,536.72Maryville Village Treasurer 1 1,268.36Mascoutah City Treasurer 2 2,536.72Matteson Village Treasurer 1 1,268.36Mattoon City Treasurer 4 5,073.44Mazon Village Treasurer 1 1,268.36McHenry City Treasurer 1 1,268.36Melrose Park Vlg Comptroller 3 3,805.08Mendota City Treasurer 2 2,536.72Metropolis City Treasurer 2 2,536.72Midlothian Village Treasurer 4 5,073.44Milan Village Treasurer 2 2,536.72Millstadt Village Treasurer 4 5,073.44Moline City Treasurer 6 7,610.16Monee Village Treasurer 1 1,268.36Monmouth City Treasurer 4 5,073.44Montgomery Village Treasurer 1 1,268.36Morris City Treasurer 3 3,805.08Morrisonville Vlg Treasurer 1 1,268.36Morton Grove Village Treasurer 1 1,268.36Mount Carmel City Treasurer 6 7,610.16Mount Morris Village Treasurer 1 1,268.36Mount Olive City Treasurer 1 1,268.36Mount Prospect Vlg Treasurer 1 1,268.36Mount Vernon City Treasurer 3 3,805.08Mount Zion Village Treasurer 9 11,415.24
Treasurer Number of licenses AllocationMunicipalityMurphysboro City Treasurer 4 5,073.44Naperville City Treasurer 1 1,268.36Neoga City Treasurer 1 1,268.36New Baden Village Treasurer 1 1,268.36New Lenox Village Treasurer 1 1,268.36Newark Village Treasurer 1 1,268.36Niles Village Treasurer 2 2,536.72Norridge Village Treasurer 1 1,268.36North Aurora Village Treasurer 1 1,268.36North Riverside Vlg Treasurer 2 2,536.72Northbrook Village Treasurer 1 1,268.36Northlake City Treasurer 1 1,268.36Oak Forest Village Treasurer 1 1,268.36Oak Lawn Village Treasurer 6 7,610.16Ofallon City Treasurer 2 2,536.72Oglesby City Treasurer 1 1,268.36Okawville Village Treasurer 1 1,268.36Olney City Treasurer 4 5,073.44Oregon City Treasurer 1 1,268.36Orient Village Treasurer 2 2,536.72Orland Park Village Treasurer 3 3,805.08Oswego Village Treasurer 1 1,268.36Ottawa City Treasurer 4 5,073.44Palatine Village Treasurer 1 1,268.36Palestine City Treasurer 2 2,536.72Palos Hills City Treasurer 1 1,268.36Pana City Treasurer 5 6,341.80Paris City Treasurer 4 5,073.44Pekin City Treasurer 5 6,341.80Peoria City Treasurer 13 16,488.68Peoria Heights Vlg Treasurer 2 2,536.72Peotone Village Treasurer 1 1,268.36Peru City Treasurer 5 6,341.80Pinckneyville City Treasurer 1 1,268.36Pittsfield City Treasurer 1 1,268.36Plainfield Village Treasurer 1 1,268.36Plano City Treasurer 2 2,536.72Polo City Treasurer 1 1,268.36Pontiac City Treasurer 1 1,268.36Pontoon Beach Vlg Treasurer 1 1,268.36Princeton City Treasurer 2 2,536.72Quincy City Treasurer 3 3,805.08Rantoul Village Treasurer 2 2,536.72Red Bud City Treasurer 2 2,536.72Reynolds Village Treasurer 1 1,268.36Ridgway Village Treasurer 1 1,268.36River Grove Village Treasurer 3 3,805.08Riverton Village Treasurer 1 1,268.36Robinson City Treasurer 3 3,805.08Rochelle City Treasurer 2 2,536.72Rock Falls City Treasurer 4 5,073.44Rock Island City Treasurer 9 11,415.24Rockdale Village Treasurer 3 3,805.08Rockford City Comptroller 36 45,660.96Rockton Village Treasurer 1 1,268.36Rolling Meadows City Treasurer 3 3,805.08Romeoville Village Treasurer 1 1,268.36Roscoe Village Treasurer 1 1,268.36Roselle Village Treasurer 1 1,268.36Round Lake Park Vlg Treasurer 1 1,268.36Round Lake Village Treasurer 2 2,536.72Salem City Treasurer 2 2,536.72Sandwich City Treasurer 1 1,268.36Savanna City Treasurer 2 2,536.72Savoy Village Treasurer 1 1,268.36Schaumburg Village Treasurer 1 1,268.36Schiller Park Vlg Treasurer 1 1,268.36Shelbyville City Treasurer 3 3,805.08Shiloh Village Treasurer 1 1,268.36Shorewood Village Treasurer 1 1,268.36Sims Village Treasurer 1 1,268.36Skokie Village Treasurer 1 1,268.36Smithton Village Treasurer 1 1,268.36South Beloit City Treasurer 2 2,536.72South Chicago Hts Vlg Treas 1 1,268.36South Elgin Village Treasurer 2 2,536.72South Roxana Village Treasurer 1 1,268.36Sparta City Treasurer 2 2,536.72

F I S C A L Y E A R 2 0 0 3 A N N U A L R E P O R T
Illinois Department of Revnue 69
Table 49: Pull Tabs and Jar Games Distributions to Municipalities and Counties (continued)
Treasurer Number of licenses AllocationMunicipalitySpringfield City Treasurer 11 13,951.96St Charles City Treasurer 2 2,536.72St Clair County Treasurer 5 6,341.80St Jacob Village Treasurer 1 1,268.36Staunton City Treasurer 2 2,536.72Steeleville Village Treasurer 1 1,268.36Steger Village Treasurer 2 2,536.72Sterling City Treasurer 3 3,805.08Stickney Village Treasurer 1 1,268.36Streamwood Village Treasurer 4 5,073.44Streator City Treasurer 6 7,610.16Sugar Grove Village Treasurer 1 1,268.36Sullivan City Treasurer 1 1,268.36Summit Village Treasurer 3 3,805.08Swansea Village Treasurer 3 3,805.08Sycamore City Treasurer 3 3,805.08Taylor Springs Vlg Treasurer 2 2,536.72Taylorville City Treasurer 3 3,805.08Teutopolis Village Treasurer 1 1,268.36Tilton Village Treasurer 1 1,268.36Tinley Park Village Treasurer 4 5,073.44Toledo Village Treasurer 1 1,268.36Troy City Treasurer 1 1,268.36Tuscola City Treasurer 1 1,268.36Union Village Treasurer 1 1,268.36Urbana City Treasurer 2 2,536.72Vandalia City Treasurer 4 5,073.44
Treasurer Number of licenses AllocationMunicipalityVilla Grove City Treasurer 1 1,268.36Villa Park Village Treasurer 8 10,146.88Virden City Treasurer 1 1,268.36Warrenville City Treasurer 1 1,268.36Washington City Treasurer 1 1,268.36Waterloo City Treasurer 1 1,268.36Wauconda Village Treasurer 1 1,268.36Waukegan City Treasurer 1 1,268.36West Chicago City Treasurer 1 1,268.36West Dundee Village Treasurer 1 1,268.36West Frankfort City Treasurer 4 5,073.44Westchester Village Treasurer 4 5,073.44Westville Village Treasurer 2 2,536.72Wheeling Village Treasurer 1 1,268.36White Hall City Treasurer 1 1,268.36Willow Springs Vlg Treasurer 1 1,268.36Wilmette Village Treasurer 1 1,268.36Wilmington City Treasurer 1 1,268.36Winthrop Harbor Vlg Treasurer 1 1,268.36Wood Dale City Treasurer 2 2,536.72Wood River City Treasurer 3 3,805.08Woodridge Village Treasurer 1 1,268.36Woodstock City Treasurer 4 5,073.44Worth Village Treasurer 1 1,268.36Wyanet Village Treasurer 1 1,268.36Yorkville City Treasurer 1 1,268.36Zeigler City Treasurer 3 3,805.08Zion City Treasurer 2 2,536.72Total Municipalities 916 $ 1,161,817.76
Total 1,004 $ 1,273,433.44

70 Illinois Department of Revnue
F I S C A L Y E A R 2 0 0 3 A N N U A L R E P O R T
Fund Transfers to LocalGovernmentsPopulation-based disbursements(Local Government Distributive Fund and State andLocal Sales Tax Reform Fund)
Income TaxesOne-tenth of the net collections (gross collectionsminus refunds) is distributed to municipal and countygovernments in proportion to their population ascompared to the total state population.
Table 50: Income Tax Revenue-sharing HistoryDate AmountAugust 1, 1969 - June 30, 1994 1/12 (8.3 percent) and a
portion of collectionsfrom the 1989 surcharge
July 1, 1994 - June 30, 1995 1/11 (9.1 percent)
July 1, 1995 1/10 (10 percent)
Local Use TaxThe State and Local Sales Tax Reform Fund wasestablished to receive collections generated when thestate use tax on general merchandise was increasedfrom 5 percent to 6.25 percent and a 1 percent use taxwas imposed on qualifying food, drugs, and medicalappliances as part of Sales Tax Reform in 1990.
The “local” share of use tax, 1.25 percent on generalmerchandise (excluding titled or registered tangiblepersonal property such as vehicles, watercraft, aircraft,trailers, and mobile homes) and 1 percent on qualifyingfood, drugs, and medical appliances is deposited inthe State and Local Sales Tax Reform Fund.
DistributionDistributions from this fund are made as follows:
20 percent to Chicago10 percent to the RTA Occupation and Use TaxReplacement Fund0.6 percent to the Metro-East Public TransportationFund$37,800,000 annually to the Build Illinois Fundthe remaining balance is deposited into the LGDFand paid to counties and municipalities with fewerthan 1 million residents based on relative share ofpopulation.
Table 51: Summary of Income Tax/Sales TaxDistributions to Local Governments
Distribution FY 2003 Percent of totalIncome Tax
Counties 110,053,920.71 12.56%Municipalities 682,517,130.66 77.89%
Subtotal 792,571,051.37 90.45%
Local Use TaxCounties 15,205,168.52 1.74%Municipalities* 68,476,762.39 7.81%
Subtotal 83,681,930.91 9.55%
Total $876,252,982.28 100.00%
The total amount distributed is $73.99 per capita.
* Figure does not include the 20 percent distribution toChicago of $35,060,281.
Sales Tax Transfers for Local Transportation(Public Transportation Fund, Downstate Public TransportationFund, Metro-East Public Transportation Fund)Qualified municipalities, mass transit districts, andunincorporated areas organized in accordance withthe Local Mass Transit District Act are eligible toreceive state sales and use taxes collected by thedepartment and transferred to various funds fordistribution by the Department of Transportation.
The Public Transportation Fund, which receives atransfer of state sales taxes equal to 25 percent of thecollections from local RTA taxes, became effective in1974. The Downstate Public Transportation Fund, alsoestablished in 1974, includes participants not servedby RTA or MED and receives 2/32 of state sales taxesgenerated within each participant’s boundaries (upto an appropriated balance). The Metro-East PublicTransportation Fund, which replaced the Bi-StatePublic Transportation Fund in 1989, receives 2/32 of all
state sales taxes and transfers from the State andLocal Sales Tax Reform Fund.
DistributionState sales and use tax collections are transferred tothe proper fund on the basis of where the taxes werecollected. Within MED, 73.3 percent of the amountpaid into the fund is distributed to St. Clair County; 26.7percent goes to Madison County.
Table 52: FY 2003 Sales Tax Transfers for LocalTransportation
Fund Payment PercentPublic Transportation Fund $ 164,505,018.09 72.7%Downstate Public Transportation Fund 45,574,000.00 20.1%Metro-East Public Transportation Fund 16,329,319.36 7.2%
Total $ 226,408,337.45 100.0%* Total of two separate fund transfers as follows:
• $15,278,357.80 (2/32 of all state sales taxes)• $1,050,961.56 (0.6% transfer from State and Local Sales Tax
Reform Fund)

F I S C A L Y E A R 2 0 0 3 A N N U A L R E P O R T
Illinois Department of Revnue 71
Table 53: FY 2003 Population-based Distributions of Tax Revenues Shared With Local GovernmentsUnincorporated Incorporated
County Income Local Income Local Total Tax Use Tax Total Tax Use Tax Total for county
Adams $ 1,336,666.61 $ 184,046.97 $ 1,520,713.58 $ 3,029,384.80 $ 417,118.42 $ 3,446,503.22 $ 4,967,216.80
Alexander 246,256.62 33,907.28 280,163.90 366,986.80 50,530.58 417,517.38 697,681.28
Bond 469,684.54 64,671.31 534,355.85 657,877.56 90,583.39 748,460.95 1,282,816.80
Boone 1,127,690.56 155,272.84 1,282,963.40 1,544,363.54 212,644.72 1,757,008.26 3,039,971.66
Brown 261,092.13 35,950.00 297,042.13 183,333.42 25,243.20 208,576.62 505,618.75
Bureau 599,047.62 82,483.43 681,531.05 1,671,231.54 230,112.42 1,901,343.96 2,582,875.01
Calhoun 213,452.23 29,390.42 242,842.65 111,649.69 15,372.94 127,022.63 369,865.28
Carroll 433,682.85 59,714.20 493,397.05 632,555.03 87,096.83 719,651.86 1,213,048.91
Cass 237,687.83 32,727.45 270,415.28 638,054.51 87,854.17 725,908.68 996,323.96
Champaign 2,276,675.25 313,477.75 2,590,153.00 9,212,466.85 1,268,473.07 10,480,939.92 13,071,092.92
Christian 673,353.06 92,714.65 766,067.71 1,588,549.69 218,728.32 1,807,278.01 2,573,345.72
Clark 536,764.06 73,907.56 610,671.62 550,832.05 75,844.46 626,676.51 1,237,348.13
Clay 417,312.62 57,460.15 474,772.77 513,743.14 70,737.54 584,480.68 1,059,253.45
Clinton 857,656.60 118,093.10 975,749.70 1,415,801.49 194,931.31 1,610,732.80 2,586,482.50
Coles 716,317.65 98,639.44 814,957.09 2,685,362.13 369,741.07 3,055,103.20 3,870,060.29
Cook 7,047,216.31 970,193.87 8,017,410.18 336,774,741.69 20,872,139.40 357,646,881.09 365,664,291.27
Crawford 608,703.49 83,812.97 692,516.46 699,123.07 96,262.64 795,385.71 1,487,902.17
Cumberland 413,539.80 56,940.67 470,480.47 306,046.06 42,139.54 348,185.60 818,666.07
DeKalb 1,056,454.53 145,464.27 1,201,918.80 4,632,770.93 637,890.42 5,270,661.35 6,472,580.15
DeWitt 329,514.52 45,371.15 374,885.67 744,652.64 102,531.67 847,184.31 1,222,069.98
Douglas 397,489.31 54,730.66 452,219.97 876,445.57 120,678.23 997,123.80 1,449,343.77
DuPage 6,655,197.04 916,361.00 7,571,558.04 51,162,429.02 7,044,588.97 58,207,017.99 65,778,576.03
Edgar 454,785.06 62,619.78 517,404.84 805,209.69 110,869.76 916,079.45 1,433,484.29
Edwards 185,571.71 25,551.50 211,123.21 260,196.66 35,826.50 296,023.16 507,146.37
Effingham 948,193.67 130,557.73 1,078,751.40 1,242,857.05 171,129.81 1,413,986.86 2,492,738.26
Fayette 674,568.04 92,881.93 767,449.97 719,585.78 99,080.10 818,665.88 1,586,115.85
Ford 232,636.08 32,031.85 264,667.93 678,020.66 93,356.93 771,377.59 1,036,045.52
Franklin 783,890.64 107,945.92 891,836.56 1,711,590.47 235,655.47 1,947,245.94 2,839,082.50
Fulton 618,167.53 85,116.07 703,283.60 1,827,772.04 251,666.82 2,079,438.86 2,782,722.46
Gallatin 142,535.95 19,625.86 162,161.81 269,596.55 37,120.69 306,717.24 468,879.05
Greene 318,196.05 43,812.71 362,008.76 625,712.73 86,154.60 711,867.33 1,073,876.09
Grundy 772,149.89 106,318.08 878,467.97 1,628,068.43 224,169.73 1,852,238.16 2,730,706.13
Hamilton 311,034.10 42,826.56 353,860.66 240,245.43 33,079.43 273,324.86 627,185.52
Hancock 427,645.24 58,884.61 486,529.85 859,105.11 118,286.86 977,391.97 1,463,921.82
Hardin 184,996.19 25,472.26 210,468.45 121,945.15 16,790.59 138,735.74 349,204.19
Henderson 255,081.17 35,122.36 290,203.53 270,108.01 37,190.92 307,298.93 597,502.46
Henry 967,697.24 133,243.20 1,100,940.44 2,294,835.17 315,977.45 2,610,812.62 3,711,753.06
Iroquois 748,170.05 103,016.28 851,186.33 1,255,517.77 172,872.44 1,428,390.21 2,279,576.54
Jackson 1,261,294.06 173,662.39 1,434,956.45 2,553,358.88 351,529.37 2,904,888.25 4,339,844.70
Jasper 391,286.52 53,876.59 445,163.11 255,656.36 35,201.16 290,857.52 736,020.63
Jefferson 1,148,025.45 158,072.78 1,306,098.23 1,412,698.07 194,515.34 1,607,213.41 2,913,311.64
Jersey 747,338.78 102,901.80 850,240.58 638,246.29 87,880.44 726,126.73 1,576,367.31
Jo Daviess 687,996.72 94,730.94 782,727.66 737,298.65 101,518.88 838,817.53 1,621,545.19
Johnson 627,951.28 86,463.22 714,414.50 195,546.94 26,924.75 222,471.69 936,886.19
Kane 4,129,579.30 568,606.05 4,698,185.35 21,712,800.05 2,989,646.90 24,702,446.95 29,400,632.30
Kankakee 1,958,159.41 269,620.97 2,227,780.38 4,681,561.53 644,608.16 5,326,169.69 7,553,950.07
Kendall 1,590,654.39 218,972.12 1,809,626.51 1,933,798.97 265,618.33 2,199,417.30 4,009,043.81
Knox 614,842.34 84,658.23 699,500.57 2,955,654.76 406,966.48 3,362,621.24 4,062,121.81
Lake 5,366,170.25 738,873.56 6,105,043.81 35,838,283.90 4,934,601.27 40,772,885.17 46,877,928.98
LaSalle 2,010,787.08 276,867.34 2,287,654.42 5,119,784.26 704,947.18 5,824,731.44 8,112,385.86
Lawrence 421,277.28 58,006.07 479,283.35 566,818.46 78,045.54 644,864.00 1,124,147.35
Lee 815,057.77 112,226.12 927,283.89 1,490,968.09 205,292.25 1,696,260.34 2,623,544.23

72 Illinois Department of Revnue
F I S C A L Y E A R 2 0 0 3 A N N U A L R E P O R T
Table 53: FY 2003 Population-based Distributions of Tax Revenues Shared With Local GovernmentsUnincorporated Incorporated
County Income Local Income Local Total Tax Use Tax Total Tax Use Tax Total for county
Livingston $ 800,286.18 $ 110,192.20 $ 910,478.38 $ 1,736,968.77 $ 239,164.21 $ 1,976,132.98 $ 2,886,611.36
Logan 615,481.76 84,746.30 700,228.06 1,378,550.73 189,813.54 1,568,364.27 2,268,592.33
Macon 961,046.86 132,327.50 1,093,374.36 6,373,961.11 877,636.80 7,251,597.91 8,344,972.27
Macoupin 1,037,398.58 142,840.45 1,180,239.03 2,097,176.80 288,761.04 2,385,937.84 3,566,176.87
Madison 3,496,704.13 481,464.80 3,978,168.93 13,061,867.57 1,798,501.36 14,860,368.93 18,838,537.86
Marion 903,303.45 124,376.76 1,027,680.21 1,762,675.16 242,703.85 2,005,379.01 3,033,059.22
Marshall 300,227.19 41,338.56 341,565.75 542,582.70 74,708.32 617,291.02 958,856.77
Mason 400,942.40 55,206.13 456,148.53 624,625.61 86,004.92 710,630.53 1,166,779.06
Massac 461,435.47 63,535.49 524,970.96 508,052.10 69,954.09 578,006.19 1,102,977.15
McDonough 447,175.47 61,572.01 508,747.48 1,657,483.99 228,220.19 1,885,704.18 2,394,451.66
McHenry 4,356,268.47 599,819.11 4,956,087.58 12,274,656.37 1,690,108.67 13,964,765.04 18,920,852.62
MclLean 1,297,723.40 178,684.85 1,476,408.25 8,321,888.62 1,145,848.50 9,467,737.12 10,944,145.37
Menard 425,369.82 58,569.56 483,939.38 373,061.65 51,366.96 424,428.61 908,367.99
Mercer 489,827.57 67,444.81 557,272.38 594,506.75 81,857.64 676,364.39 1,233,636.77
Monroe 693,751.91 95,523.36 789,275.27 1,072,376.83 147,656.35 1,220,033.18 2,009,308.45
Montgomery 644,897.01 88,796.48 733,693.49 1,315,403.74 181,114.09 1,496,517.83 2,230,211.32
Morgan 519,306.75 71,503.84 590,810.59 1,822,145.37 250,892.56 2,073,037.93 2,663,848.52
Moultrie 364,109.40 50,134.55 414,243.95 549,488.99 75,659.32 625,148.31 1,039,392.26
Ogle 1,517,954.00 209,008.63 1,726,962.63 1,745,345.90 240,317.86 1,985,663.76 3,712,626.39
Peoria 2,336,337.00 321,692.64 2,658,029.64 9,393,498.92 1,293,399.94 10,686,898.86 13,344,928.50
Perry 574,684.12 79,128.81 653,812.93 902,088.20 124,209.10 1,026,297.30 1,680,110.23
Piatt 328,160.00 45,186.11 373,346.11 718,448.92 98,921.82 817,370.74 1,190,716.85
Pike 380,861.96 52,446.34 433,308.30 730,581.28 100,589.83 831,171.11 1,264,479.41
Pope 225,985.67 31,116.15 257,101.82 56,208.59 7,739.34 63,947.93 321,049.75
Pulaski 213,260.40 29,364.00 242,624.40 256,615.53 35,333.29 291,948.82 534,573.22
Putnam 168,114.41 23,147.81 191,262.22 221,061.50 30,437.87 251,499.37 442,761.59
Randolph 637,798.99 87,819.15 725,618.14 1,529,527.46 210,601.55 1,740,129.01 2,465,747.15
Richland 390,327.33 53,744.52 444,071.85 642,338.94 88,444.05 730,782.99 1,174,854.84
Rock Island 1,253,786.89 172,629.86 1,426,416.75 8,322,233.57 1,145,701.87 9,467,935.44 10,894,352.19
Saline 569,632.39 78,433.22 648,065.61 1,139,839.99 156,945.38 1,296,785.37 1,944,850.98
Sangamon 2,388,350.61 328,855.54 2,717,206.15 9,694,518.71 1,334,845.38 11,029,364.09 13,746,570.24
Schuyler 227,200.67 31,283.44 258,484.11 232,507.99 32,014.06 264,522.05 523,006.16
Scott 138,443.39 19,062.37 157,505.76 215,626.05 29,689.38 245,315.43 402,821.19
Shelby 669,708.13 92,212.77 761,920.90 794,210.67 109,355.10 903,565.77 1,665,486.67
St Clair 3,715,860.28 511,656.31 4,227,516.59 12,661,910.36 1,743,497.35 14,405,407.71 18,632,924.30
Stark 159,481.68 21,959.15 181,440.83 245,425.16 33,792.64 279,217.80 460,658.63
Stephenson 955,355.65 131,543.86 1,086,899.51 2,176,662.87 299,706.42 2,476,369.29 3,563,268.80
Tazewell 1,595,073.07 219,627.23 1,814,700.30 6,621,048.87 911,658.30 7,532,707.17 9,347,407.47
Union 570,271.82 78,521.28 648,793.10 599,494.91 82,544.74 682,039.65 1,330,832.75
Vermilion 1,487,579.58 204,826.33 1,692,405.91 3,878,717.24 534,063.54 4,412,780.78 6,105,186.69
Wabash 222,650.91 31,446.41 254,097.32 579,288.08 79,762.55 659,050.63 913,147.95
Warren 358,779.18 50,672.70 409,451.88 798,431.52 109,936.63 908,368.15 1,317,820.03
Washington 395,925.95 55,919.18 451,845.13 527,682.97 72,656.48 600,339.45 1,052,184.58
Wayne 514,083.69 72,607.38 586,691.07 524,166.15 72,172.47 596,338.62 1,183,029.69
White 334,033.79 47,177.75 381,211.54 610,877.12 84,111.78 694,988.90 1,076,200.44
Whiteside 1,215,019.75 171,634.17 1,386,653.92 2,525,602.92 347,711.04 2,873,313.96 4,259,967.88
Will 6,096,146.63 860,998.86 6,957,145.49 25,328,242.53 3,487,470.63 28,815,713.16 35,772,858.65
Williamson 1,086,614.75 153,469.70 1,240,084.45 2,709,398.06 373,059.04 3,082,457.10 4,322,541.55
Winnebago 3,550,990.02 501,529.64 4,052,519.66 13,848,756.26 1,906,849.19 15,755,605.45 19,808,125.11
Woodford 852,997.71 120,474.43 973,472.14 1,318,057.43 181,483.90 1,499,541.33 2,473,013.47
Total $110,053,920.71 $15,205,168.52 $125,259,089.23 $682,517,130.66 $68,476,762.39 $750,993,893.05 $876,252,982.28

F I S C A L Y E A R 2 0 0 3 A N N U A L R E P O R T
Illinois Department of Revnue 73
Local Share of State Sales andUse TaxesThe local governments’ 20 percent share of generalmerchandise and 100 percent of the amount fromsales of qualifying food, drugs, and medicalappliances from Sales Tax and the 20 percent share oftitled or registered items of tangible personal propertyfrom Use Tax, is disbursed as shown below.
Municipal share of state sales tax — Municipalitiesreceive the equivalent of 16 percent of the totalgeneral merchandise collections and 100 percentof the tax collected on qualifying food, drugs, andmedical appliances sold within their incorporatedboundaries.
Municipalities also receive the equivalent of 16percent of the total use tax on out-of-statepurchases of titled or registered generalmerchandise for which the title or registrationaddress of record is within their boundaries.
Distribution — Collections are distributed monthlybased on sales occurring in each municipality.Prior to Illinois Sales Tax Reform, municipalitiescould impose local sales taxes of up to 1 percent.The department collected these taxes anddeducted a 1.6 percent administrative fee. AfterSales Tax Reform in 1990, a uniform state tax rateand base were imposed, and the department’sadministrative fee was eliminated.
County share of state taxes — Counties receivethe equivalent of 16 percent of the total generalmerchandise collections and 100 percent of thetax collected on qualifying food, drugs, andmedical appliances sold within theirunincorporated areas.
Counties also receive the equivalent of 16 percentof the total use tax on out-of-state purchases of
titled or registered general merchandise for whichthe title or registration address of record is withintheir unincorporated areas.
Distribution — Collections are distributed monthlybased on sales occurring in the unincorporatedareas of each county. Prior to Illinois Sales TaxReform, counties could impose a local sales tax ofup to 1 percent. The department collected thesetaxes and deducted a 2 percent administrativefee. After Sales Tax Reform in 1990, a uniform statetax rate and base were imposed, and thedepartment’s administrative fee was eliminated.
Countywide share of state sales tax — All countiesbut Cook County receive the equivalent of 4percent of the total general merchandisecollections on general merchandise soldanywhere in the county.
All counties but Cook County also receive theequivalent of 4 percent on out-of-state purchasesof titled or registered general merchandise forwhich the title or registration address of record iswithin their boundaries.
Note: The Regional Transportation Authority (RTA)receives a distribution equal to 4 percent of thetotal general merchandise sold anywhere in CookCounty and 4 percent on out-of-state purchasesof titled or registered general merchandise forwhich the title or registration address of record iswithin Cook County.
Distribution — Collections are distributed monthly.On July 1, 1986, counties (except Cook County)were allowed to impose a county supplementarysales tax. Ninety-six counties imposed this tax. WithSales Tax Reform in 1990, the tax was incorporatedinto the 6.25 percent state sales tax rate.
Motor Fuel Taxes(collected by the Department of Revenueand distributed by the Department ofTransportation)Collections from motor fuel taxes (excluding theUnderground Storage Tank Tax and the EnvironmentalImpact Fee) are divided among state and localgovernments according to a formula set by law. The2.5 cents additional tax on diesel fuel goes directlyinto the State Construction Account Fund. The GradeCrossing Protection Fund receives $2.25 million permonth, and $420,000 per month is transferred to theBoating Act Fund. The Vehicle Inspection Fundreceives a transfer of $25 million annually. Departmentof Transportation and Department of Revenue
administrative costs, along with the cost of refunds,are deducted. The remainder is distributed as follows:
45.6 percent is distributed to the IllinoisDepartment of Transportation. Of this amount, 63percent is allocated to the Road Fund (includes$1.25 million reserved for use in accordance withprovisions of the Illinois Highway Code) and 37percent to the state Construction Fund.54.4 percent is shared by local governments and isdistributed as follows: 49.1 percent tomunicipalities, 16.74 percent to counties with morethan 1,000,000 residents (Cook County), 18.27percent to all other counties, and 15.89 percent toroad districts.

74 Illinois Department of Revnue
F I S C A L Y E A R 2 0 0 3 A N N U A L R E P O R T
Table 54: Fiscal Year 2003 Municipal and County Share of State Sales and Use Taxes
County Unincorporated Incorporated TotalAdams $ 462,911.94 $ 7,125,466.55 $ 7,588,378.49Alexander 72,101.39 224,698.74 296,800.13Bond 106,248.36 916,950.50 1,023,198.86Boone 606,881.34 2,738,211.48 3,345,092.82Brown 64,083.96 236,270.02 300,353.98Bureau 332,816.67 2,315,977.33 2,648,794.00Calhoun 74,896.92 171,453.54 246,350.46Carroll 291,610.96 902,302.38 1,193,913.34Cass 36,712.84 977,315.07 1,014,027.91Champaign 820,438.37 19,892,070.07 20,712,508.44Christian 261,905.48 2,900,774.20 3,162,679.68Clark 159,640.84 950,247.01 1,109,887.85Clay 91,716.41 778,556.19 870,272.60Clinton 287,991.03 3,085,053.18 3,373,044.21Coles 237,490.84 5,543,307.69 5,780,798.53Cook 4,177,139.71 529,438,482.67 533,615,622.38Crawford 203,323.07 1,211,676.88 1,414,999.95Cumberland 44,820.36 330,909.14 375,729.50DeKalb 347,903.42 10,730,530.30 11,078,433.72DeWitt 126,884.57 1,210,666.84 1,337,551.41Douglas 279,555.53 1,639,817.36 1,919,372.89DuPage 3,831,740.51 154,441,562.11 158,273,302.62Edgar 152,189.87 1,297,566.91 1,449,756.78Edwards 62,759.62 361,504.47 424,264.09Effingham 302,144.21 5,510,557.04 5,812,701.25Fayette 118,990.97 1,469,569.75 1,588,560.72Ford 23,892.40 1,069,721.87 1,093,614.27Franklin 297,804.36 2,711,516.57 3,009,320.93Fulton 128,122.34 2,383,918.90 2,512,041.24Gallatin 34,185.23 179,846.41 214,031.64Greene 59,300.97 615,402.67 674,703.64Grundy 316,317.43 6,998,404.72 7,314,722.15Hamilton 60,039.49 290,249.61 350,289.10Hancock 125,910.94 866,710.47 992,621.41Hardin 47,173.18 87,945.03 135,118.21Henderson 69,257.84 226,127.31 295,385.15Henry 168,372.59 4,031,764.37 4,200,136.96Iroquois 143,163.88 2,931,482.51 3,074,646.39Jackson 400,549.93 6,209,865.83 6,610,415.76Jasper 92,842.80 522,092.24 614,935.04Jefferson 530,695.92 4,610,542.84 5,141,238.76Jersey 118,023.00 1,963,234.16 2,081,257.16Jo Daviess 329,106.79 1,697,782.30 2,026,889.09Johnson 87,919.45 434,854.35 522,773.80Kane 1,827,262.54 46,594,927.71 48,422,190.25Kankakee 668,242.35 18,846,182.64 19,514,424.99Kendall 708,041.23 6,683,862.69 7,391,903.92Knox 239,276.90 4,947,594.55 5,186,871.45Lake 4,240,896.40 92,433,197.75 96,674,094.15LaSalle 730,701.30 13,400,911.22 14,131,612.52Lawrence 224,120.11 687,214.64 911,334.75
County Unincorporated Incorporated TotalLee $ 473,676.00 $ 1,948,212.27 $ 2,421,888.27Livingston 461,672.24 3,312,917.22 3,774,589.46Logan 102,093.11 2,238,409.70 2,340,502.81Macon 286,631.80 12,872,588.19 13,159,219.99Macoupin 1,144,476.20 2,841,466.84 3,985,943.04Madison 759,167.95 26,268,362.64 27,027,530.59Marion 199,252.71 2,589,395.15 2,788,647.86Marshall 59,172.33 625,068.55 684,240.88Mason 44,039.00 858,041.99 902,080.99Massac 64,246.88 729,911.99 794,158.87McDonough 92,670.40 2,616,330.86 2,709,001.26McHenry 2,016,814.24 26,835,998.40 28,852,812.64McLean 576,398.85 19,259,176.95 19,835,575.80Menard 90,629.25 325,660.93 416,290.18Mercer 109,920.69 706,129.39 816,050.08Monroe 158,843.37 2,922,949.03 3,081,792.40Montgomery 104,410.37 2,936,891.62 3,041,301.99Morgan 123,226.32 3,317,602.68 3,440,829.00Moultrie 250,257.73 693,033.15 943,290.88Ogle 312,804.38 3,133,129.39 3,445,933.77Peoria 1,059,081.48 20,877,317.80 21,936,399.28Perry 109,473.12 1,414,455.96 1,523,929.08Piatt 51,023.59 823,708.06 874,731.65Pike 77,233.55 1,026,636.13 1,103,869.68Pope 40,027.03 76,348.95 116,375.98Pulaski 37,904.42 167,174.80 205,079.22Putnam 45,499.99 227,740.73 273,240.72Randolph 1,140,485.43 2,669,522.50 3,810,007.93Richland 126,641.90 1,435,426.31 1,562,068.21Rock Island 361,568.97 15,210,652.83 15,572,221.80Saline 141,967.64 2,127,463.27 2,269,430.91Sangamon 2,180,651.34 23,677,422.60 25,858,073.94Schuyler 56,308.69 311,514.93 367,823.62Scott 35,610.04 200,307.48 235,917.52Shelby 136,630.11 956,523.67 1,093,153.78St Clair 933,434.06 26,206,116.93 27,139,550.99Stark 51,779.39 236,757.81 288,537.20Stephenson 242,804.61 4,058,791.50 4,301,596.11Tazewell 390,906.27 14,634,828.77 15,025,735.04Union 97,375.95 1,292,308.68 1,389,684.63Vermilion 471,154.03 6,952,963.14 7,424,117.17Wabash 121,411.04 873,400.80 994,811.84Warren 96,337.67 973,043.85 1,069,381.52Washington 96,076.96 1,236,832.85 1,332,909.81Wayne 172,789.75 956,017.89 1,128,807.64White 127,708.70 1,037,111.24 1,164,819.94Whiteside 375,659.93 5,208,695.50 5,584,355.43Will 4,387,400.65 46,660,801.57 51,048,202.22Williamson 630,167.69 7,009,432.13 7,639,599.82Winnebago 1,050,818.20 33,295,325.83 34,346,144.03Woodford 302,440.61 2,279,901.78 2,582,342.39Total $47,804,895.19 $1,318,972,674.01 $1,366,777,569.20

F I S C A L Y E A R 2 0 0 3 A N N U A L R E P O R T
Illinois Department of Revnue 75
Table 55: Fiscal Year 2003 Countywide Share of State Sales Taxes
County AmountAdams $ 1,600,252.95Alexander 64,263.70Bond 217,930.75Boone 715,794.61Brown 58,357.91Bureau 556,845.84Calhoun 55,502.97Carroll 264,091.62Cass 194,075.76Champaign 4,316,764.43Christian 641,141.40Clark 233,438.49Clay 172,962.06Clinton 698,673.88Coles 1,198,411.01Cook* 0.00Crawford 288,643.70Cumberland 79,994.81DeKalb 2,416,866.02DeWitt 277,788.48Douglas 420,985.54DuPage 34,349,721.95Edgar 289,278.57Edwards 87,461.73Effingham 1,246,276.29Fayette 332,112.52Ford 223,495.03Franklin 599,393.17Fulton 487,277.65Gallatin 47,995.24Greene 133,003.28Grundy 1,620,889.52Hamilton 74,122.91Hancock 216,168.04
County AmountHardin $ 26,320.93Henderson 66,820.10Henry 867,775.35Iroquois 685,098.60Jackson 1,366,838.19Jasper 130,231.06Jefferson 1,088,535.91Jersey 418,812.15Jo Daviess 447,344.93Johnson 114,121.44Kane 10,167,377.48Kankakee 4,367,352.36Kendall 1,483,275.81Knox 1,059,672.62Lake 20,521,060.16LaSalle 3,010,930.86Lawrence 188,185.69Lee 502,896.78Livingston 806,676.11Logan 459,167.20Macon 2,750,951.66Macoupin 885,364.60Madison 5,563,694.54Marion 589,717.52Marshall 135,072.20Mason 185,247.19Massac 160,857.35McDonough 540,265.81McHenry 5,914,950.65McLean 4,252,103.29Menard 85,902.47Mercer 173,248.33Monroe 637,850.95Montgomery 626,995.13
County AmountMorgan $ 703,742.47Moultrie 196,520.69Ogle 711,739.25Peoria 4,581,599.53Perry 297,032.71Piatt 191,546.16Pike 222,944.65Pope 23,962.38Pulaski 44,296.92Putnam 61,012.59Randolph 819,107.14Richland 316,916.13Rock Island 3,193,663.77Saline 443,563.35Sangamon 5,468,426.64Schuyler 77,211.12Scott 54,126.25Shelby 232,530.22St Clair 5,835,867.93Stark 66,543.31Stephenson 864,758.23Tazewell 3,081,498.33Union 252,536.32Vermilion 1,519,620.03Wabash 212,261.81Warren 217,371.45Washington 301,287.40Wayne 225,262.76White 237,854.94Whiteside 1,143,303.19Will 10,660,740.38Williamson 1,574,111.62Winnebago 7,248,632.94Woodford 564,623.24Total $ 176,106,913.10
* In Cook County, this portion of tax collections is allocated to the Regional Transportation Authority (RTA), rather than to the county. SeeTable 46.

76 Illinois Department of Revnue
F I S C A L Y E A R 2 0 0 3 A N N U A L R E P O R T
Replacement TaxesStatutory References
Personal Property Tax Replacement IncomeTax — 35 ILCS 5/201Electricity Distribution Tax and Invested CapitalTaxes (Electricity Invested Capital Tax, Gas RevenueInvested Capital Tax, Water Company InvestedCapital Tax) — 35 ILCS 620/2a.1 (electricity); 35 ILCS615/2a.1 (gas); 35 ILCS 625/3 (water)Telecommunications Infrastructure MaintenanceFees — 35 ILCS 635/1 to 635/905
DefinitionThe 1970 Illinois Constitution directed the legislature toabolish personal property taxes and replace therevenue lost by local governments and school districts.
The General Assembly enacted, effective July 1, 1979,the Personal Property Tax Replacement Income Tax.This tax was imposed on the income of corporations(other than S corporations) at the rate of 2.85 percentuntil December 31,1980, after which the rate became2.5 percent. The income of partnerships, trusts, and Scorporations is taxed at the rate of 1.5 percent.
Payment of personal property replacement taxesmirrors the procedures and requirements established forcalculating and remitting business income taxes. (See“Income Tax” in this section.) The only credit allowed isthe Replacement Tax Investment Credit allowed tomanufacturers, retailers, and miners of coal or fluorite.
In addition to the income tax component, the GeneralAssembly enacted a tax on regulated utilities (i.e., gas,electric, messages, and water) equal to 0.8 percent ofinvested capital. Effective January 1,1998, the investedcapital tax on electric suppliers was replaced with theelectric distribution tax and the invested capital tax ontelecommunications was replaced by thetelecommunications infrastructure maintenance fee.
Electricity Distribution Tax is imposed on electric utilitiesor alternative retail electric suppliers who
distribute electricity for use or consumption (not forresale); andare not electric cooperatives, school districts, orunits of local government.
The tax rate is based on the kilowatt-hours (kwhs)distributed at the following monthly rates:
$0.00031 for the first 500 million kwhs$0.0005 for the next 1 billion kwhs$0.0007 for the next 2.5 billion kwhs$0.0014 for the next 4 billion kwhs$0.0018 for the next 7 billion kwhs$0.00142 for the next 3 billion kwhs$0.00131 for all kwhs distributed in excess of 18billion kwhs
Invested Capital Taxes are imposed on
electric cooperatives that are required to filereports with the Rural Utilities Service;persons engaged in the business of distributing,supplying, furnishing, or selling natural gas who aresubject to the Gas Revenue Tax; andwater companies subject to taxes imposed by theIllinois Income Tax Act.
The tax rate is 0.8 percent of invested capital.
A state telecommunications infrastructure maintenancefee (TIMFs) of 0.5 percent of gross charges is imposed onpersons in the business of transmitting, supplying, orfurnishing telecommunications and all associatedservices in Illinois for compensation (i.e.,telecommunications retailers).
DistributionNet collections from these taxes are deposited intothe Personal Property Tax Replacement Fund and aredistributed eight times annually to local taxing districts.Distributions are made in January, March, April, May,July, August, October, and December.
The formula for distributing collections is as follows:
51.65 percent is distributed to Cook County taxingdistricts, which is then distributed to the taxing districtsin the county on the basis of each district’s share ofpersonal property tax collection for the 1976 tax year48.35 percent is distributed to taxing bodies indownstate counties, which is distributed based oneach district’s share of personal property taxcollection for the 1977 tax year.
Collections and PaymentsIn FY 2003, the department collected $970,447,790, ofwhich $761,126,499 came from income taxes,$177,285,109 from the Invested Capital Tax and theElectricity Distribution Tax, and $32,036,182 from theTelecommunications Infrastructure Maintenance Fee.
The Refund Fund percentage for replacement taxcollections was 27.0 percent for FY 2003. Distributionsto local governments (reflecting collections from May2002 through April 2003) totaled $753,224,347. Another$205,997,705 was allocated to refunds.

F I S C A L Y E A R 2 0 0 3 A N N U A L R E P O R T
Illinois Department of Revnue 77
Table 56: Replacement Tax Payments by Type of DistrictDistrict type Statewide Cook County Collar counties Rest of state
Total Percent Total Percent Total Percent Total PercentCounty $ 65,079,131.29 8.64% $ 28,969,103.50 7.46% $ 7,344,781.45 7.82% $ 28,765,246.34 10.61%Municipality 152,731,885.26 20.28% 102,813,398.37 26.48% 11,129,793.11 11.85% 38,788,693.78 14.31%Township 13,588,546.44 1.80% 3,323,722.04 0.86% 2,372,788.29 2.53% 7,892,036.11 2.91%Park 40,205,129.83 5.34% 29,696,958.93 7.65% 4,012,864.99 4.27% 6,495,305.91 2.40%Sanitary 28,445,808.98 3.78% 22,437,370.92 5.78% 2,096,582.84 2.23% 3,911,855.22 1.44%Fire Protection 5,384,905.68 0.71% 976,259.58 0.25% 1,902,886.36 2.03% 2,505,759.74 0.92%Public Health 325,670.95 0.04% 168,107.85 0.04% 0 0.00% 157,563.10 0.06%Hospital 819,996.25 0.11% 0 0.00% 0 0.00% 819,996.25 0.30%T. B. Sanitarium 364,183.84 0.05% 361,191.70 0.09% 0 0.00% 2,992.14 0.00%Mosquito Abatement 334,218.19 0.04% 278,856.36 0.07% 23,339.14 0.02% 32,022.69 0.01%Airport Authority 1,715,268.60 0.23% 0 0.00% 32,488.49 0.03% 1,682,780.11 0.62%Public Library 1,843,779.64 0.24% 820,434.25 0.21% 592,793.96 0.63% 430,551.43 0.16%Water Authority 9,785.99 0.00% 0 0.00% 0 0.00% 9,785.99 0.00%Cemetery 15,019.33 0.00% 0 0.00% 312.47 0.00% 14,706.86 0.01%Forest Preserve 6,933,194.14 0.92% 4,454,619.24 1.15% 1,870,805.03 1.99% 607,769.87 0.22%Street Lighting 2,911.00 0.00% 503.81 0.00% 608.59 0.00% 1,798.60 0.00%Mass Transit 440,019.81 0.06% 0 0.00% 0 0.00% 440,019.81 0.16%River Conservation 137,275.58 0.02% 15,138.73 0.00% 0 0.00% 122,136.85 0.05%Soil And Water Cons 856.12 0.00% 0 0.00% 0 0.00% 856.12 0.00%Conservation 391,402.34 0.05% 0 0.00% 104,701.43 0.11% 286,700.91 0.11%Junior College 27,306,307.95 3.63% 11,811,037.41 3.04% 3,637,045.14 3.87% 11,858,225.40 4.37%Road District 13,369,922.31 1.78% 1,283,755.03 0.33% 2,273,774.62 2.42% 9,812,392.66 3.62%School (K-12) 393,779,127.48 52.28% 180,835,409.71 46.58% 56,505,242.33 60.18% 156,438,475.44 57.71%
Total $ 753,224,347.00 $ 388,245,867.43 $ 93,900,808.24 $ 271,077,671.33Percent of state total 100.00 51.54 12.47 35.99Note: Percentages for each category may not add to 100 due to rounding.
Table 57: Replacement Tax Payments by CountyCounty AmountAdams $ 6,257,887.20Alexander 440,656.45Bond 466,309.08Boone 2,351,060.65Brown 141,797.86Bureau 1,421,719.23Calhoun 61,740.43Carroll 679,435.03Cass 513,049.67Champaign 7,025,047.96Christian 1,446,697.16Clark 523,541.33Clay 610,174.94Clinton 928,184.09Coles 2,309,986.41Cook 388,245,867.43Crawford 1,278,716.22Cumberland 276,548.57DeKalb 3,076,584.15DeWitt 1,197,624.46Douglas 1,682,237.10DuPage 24,890,717.05Edgar 744,081.71Edwards 188,643.27Effingham 1,069,147.95Fayette 723,864.06Ford 768,543.93Franklin 1,176,047.66Fulton 5,297,846.63Gallatin 311,175.12Greene 318,417.02Grundy 2,601,162.52Hamilton 271,621.55Hancock 446,635.12
County AmountHardin $ 264,098.18Henderson 197,109.08Henry 1,949,776.55Iroquois 1,045,677.00Jackson 2,629,916.71Jasper 796,311.89Jefferson 1,916,941.32Jersey 489,547.82Jo Daviess 831,694.92Johnson 561,632.23Kane 14,800,498.98Kankakee 5,276,103.49Kendall 2,774,325.15Knox 2,629,694.50Lake 22,620,036.23LaSalle 9,438,024.16Lawrence 327,666.90Lee 2,672,518.61Livingston 2,320,658.46Logan 1,518,379.43Macon 5,012,107.01Macoupin 1,043,566.31Madison 22,065,139.70Marion 2,887,252.74Marshall 553,663.05Mason 1,568,270.85Massac 1,177,368.53McDonough 809,418.47McHenry 5,847,815.35McLean 7,634,638.25Menard 302,205.27Mercer 967,226.68Monroe 721,498.02Montgomery 1,635,284.36
County AmountMorgan $ 2,423,986.29Moultrie 319,253.83Ogle 2,610,347.35Peoria 20,559,973.45Perry 1,016,040.50Piatt 6,266,885.45Pike 502,785.48Pope 55,282.69Pulaski 461,262.64Putnam 1,948,303.76Randolph 2,478,512.23Richland 928,461.94Rock Island 15,716,429.27Saline 755,424.17Sangamon 9,513,420.13Schuyler 115,978.69Scott 193,093.66Shelby 633,625.74St Clair 11,725,033.97Stark 252,652.95Stephenson 2,212,372.52Tazewell 12,897,862.39Union 657,048.71Vermilion 6,324,137.66Wabash 682,401.37Warren 742,514.34Washington 617,964.72Wayne 498,646.56White 504,176.88Whiteside 5,570,087.38Will 25,741,740.63Williamson 1,734,494.39Winnebago 28,338,556.20Woodford 1,196,753.85
Total $ 753,224,347.00

78 Illinois Department of Revnue
F I S C A L Y E A R 2 0 0 3 A N N U A L R E P O R T
Tax Increment FinancingIllinois Tax Increment FundThe department distributes state sales tax collectionsto municipalities that have tax increment financing(TIF) districts for either state sales tax, state utility tax, orboth that produced an incremental growth in retailsales, or gas and electricity consumption. Funds areprorated to each municipality based on its share ofthe overall TIF net state increment.Overall TIF funding is 0.27 percent of net state sales taxrevenues.
DistributionFunds are allocated quarterly to all eligible TIFmunicipalities. Each TIF district is subject to a reducedallocation in order to determine the net state sales taxincrement (the maximum amount available to eachmunicipality for each TIF district):
80 percent of the increment up to and including$100,00060 percent of the increment exceeding $100,000but not exceeding $500,00040 percent of all amounts exceeding $500,000
For each quarterly distribution, each eligiblemunicipality receives a prorated share of the availabledistribution amount.
Table 58: Tax Increment Financing Allocations
Sales Tax TIF district AmountAledo 42,947.15Antioch 57,251.64Arlington Heights #1 232,679.57Arlington Heights #2 28,558.43Aurora 45,036.38Bartlett 23,486.99Belleville #1 6,503.57Belleville #3 161,173.98Bellevue 26,957.80Belvidere 13,141.93Bloomington Market Square 230,068.02Bourbonnais 561,008.78Breese 132,447.07Buffalo Grove 182,285.31Carbon Cliff 4,902.96Charleston 28,389.94Chicago Chatham Ridge 874,140.55Chicago Edgewater 44,581.47Chicago Ridge #2 15,871.41Chicago Ryan/Garfield 183,380.48Chicago W.Ridge/Peterson 79,879.35Cicero 1,472,502.74Collinsville 505,105.04Creve Coeur 97,924.23East Peoria #1 10,917.91East Peoria #2 212,427.52East St. Louis 22,459.22Effingham 819,011.84Elgin #1 171,249.46Elgin #2 11,305.43Elmhurst 91,622.84Elmwood Park 178,090.00Galena 108,471.47Galesburg #1 78,245.03Galesburg #2 45,322.82Galva 3,555.05Gardner 149,245.15Geneva 38,212.68Granite City 59,694.69Harvey 2,358.82Havana 61,413.25Heyworth 12,299.50Hodgkins 2,189,681.44Hoffman Estates 1,785.94Justice 1,533.23
Sales Tax TIF district AmountLibertyville 75,431.31Le Roy 65,777.05La Grange 82,642.52Manteno 32,787.43Mendota 158,949.97Moline 230,556.63Morris 373,601.49Mt. Zion 7,093.27Niles Lawrencewood 750,286.28North Pekin 308,885.91Oak Park 332,642.47Oglesby 146,347.20Palos Heights 67.39Pekin #1 149,211.46Pekin #2 118,142.58Peoria Campustown 136,271.72Peoria Southtown 54,269.43Pontiac #1 15,568.14Pontiac #2 175,764.90River Forest 282,467.26Rock Island 90,426.59Rosemont #1 323,257.79Rosemont #2 182,672.84Rosemont #3 403,221.37Round Lake Beach 558,447.80Silvis 177,955.21Springfield 200,431.29Sterling 32,837.97Sullivan 172,260.38Summit 144,106.31Tuscola 187,407.29University Park 2,257.72Urbana #2 308,818.52Warrenville 189,850.34Watseka 519,325.28Wood River 526,418.56
Total Sales Tax TIFs $ 16,835,587.75
Utility Tax TIF District TotalCanton Utility TIF 4a 2,662.08Canton Utility TIF 4b 471.76Colona Utility TIF 252.74East St. Louis Utility TIF 1,735.41University Park Utility TIF 7,918.86
Total Utility Tax TIFs $ 13,040.85
Total for all TIF Districts $ 16,848,628.60

F I S C A L Y E A R 2 0 0 3 A N N U A L R E P O R T
Illinois Department of Revnue 79
Report on Areas of Recur-rent Non-complianceThe Illinois Department of Revenue is the major taxcollector for the State of Illinois. As of June 30, 2002, thedepartment’s records indicated that 278,044 accountstotaling $393,131,656 were due and payable to theState of Illinois. The enforcement programs used tocollect these debts are identified in Table 59.
Generally, the department has three years from thedate the return is filed, or the date the tax liability isfinal, to file a lien against a delinquent taxpayer’sproperty. Whether or not a lien is filed, the departmentgenerally has 20 years to take collection actions. Forsales and withholding taxes, the department canassess, up to three years from the filing date of thereturn, the officers or those responsible for filing taxreturns and making payments. This time period can beextended under certain circumstances. If use tax isowed and a return is not filed, the statute of limitationsis six years. Otherwise, no statute of limitations exists incases of fraud or failure to file returns.
Audit BureauAudit activity helps to ensure that taxpayers pay theircorrect tax liabilities and that they pay them on time.In addition, audit contacts are responsible for a largeportion of unreported tax that would not otherwisehave been paid.
Taxpayers must self-assess the taxes administered bythe department. An audit program
promotes voluntary compliance and deters taxevasion at minimum cost through systematicselection of accounts and efficient compliancetechniques;provides taxpayer education to ensure returns arecompleted properly and on time; andallows fair and equitable administration ofoverpayments and refunds, as well as deficienciesand delinquencies.
Bureau of Criminal InvestigationsThe Bureau of Criminal Investigation consists of swornpeace officers charged with the enforcement ofIllinois’ criminal tax laws through the prosecution of taxcheats. These professional law enforcement officersdevelop and evaluate forensic evidence of financialtax crimes and evasion where fraud is employed tocircumvent Illinois’ tax laws. The publicized criminalprosecution of tax cheats assists the Department ofRevenue in encouraging our system of voluntary taxcompliance. Criminal prosecution is usually the lastenforcement tool the Department employs after allother reasonable tax collection efforts have beenexhausted.
Collection Services BureauThe Collection Bureau's primary functions arecollecting delinquent state taxes and improvingvoluntary compliance.
Table 59: FY 2003 Major Enforcement ProgramTotals
Program Number of AmountArea cases collectedAudits* 38,196 $ 182,350,585Attorney General Referrals 16 1,230,386Bureau of Criminal Investigations **, *** 847 1,149,939Certificate of Registration Revocation 5,731 37,429,815Chicago City License Revocation 7,412 13,946,813Comptroller Offsets 5,441 8,331,341Corporate Officer 100 Percent Penalty 52 3,486,463Delinquent Child Support 38,995 16,454,071Levies (Asset and Wage) 30,284 23,339,291Liens 14,874 3,536,507Liquor License Programs 5,240 23,861,561Outside Collection Agencies 44,724 16,097,195Payment Agreements 2,599 13,107,214Professional License Referrals 287 733,579Publication of Delinquent Taxpayer Names 3,714 7,127,512Seizure 127 782,452Service and Call Unit 79,505 40,166,932
Total 278,044 $ 393,131,656 * Represents amount collected when audits were closed. Total
audit amount established was $391,747,334.** Prosecution referrals totaled 91; conviction rate was 99
percent.*** Total estimated liability is $6,983,917.

80 Illinois Department of Revnue
F I S C A L Y E A R 2 0 0 3 A N N U A L R E P O R T
Legislation Recap forCalendar Year 2003Miscellaneous / Tax AdministrationPublic Act 93-0025Public Act 93-0025 provides that, when a tax liability isreferred to a collection agency, the collection agency’s feeis added to the liability and collected from the taxpayer.
Public Act 93-0026Public Act 93-0026 created a tax amnesty program whichran from October 1 through November 15, 2003. Amnestywas available for taxable periods ending after June 30, 1983and prior to July 1, 2002. Upon payment of all taxes due incompliance with the amnesty program, all related interestand penalties were abated. Failure to pay all taxes due fora taxable period invalidated any amnesty granted. Ataxpayer who failed to pay the tax liability during theamnesty period will be subject to interest imposed at 200%of the rate otherwise imposed. Payments must have beenmade by cash, check, guaranteed remittance, or ACHdebit. All money collected under the Act that would haveotherwise been deposited into GRF was instead depositedin the General Revenue Fund and into the Common SchoolFund (half in each fund). Two percent of all money col-lected was deposited into the Tax Compliance and Admin-istration Fund to pay for costs associated with the Act.
Public Act 93-0027Public Act 93-0027 amends the Riverboat Gambling Act byincreasing the admission tax to $4 per person admitted by alicensee that admitted 2,300,000 or fewer persons in theprevious calendar year and $5 per person admitted by alicensee that admitted more than 2,300,000 persons in theprevious calendar year. It also permits an increase in thewagering tax from July 1, 2003 until the earlier of (1) July 1, 2005;(2) the first date after the effective date of this amendatory Actthat riverboat gambling operations are conducted pursuant toa dormant license, or (3) the first day that riverboat gamblingoperations are conducted under the authority of an ownerslicense that is in addition to the 10 owners licenses initiallyauthorized under the Act. The additional wagering tax revenuesshall be paid into the Common School Fund.
Public Act 93-0028Public Act 93-0028 amends the Riverboat Gambling Act toauthorize all owners licensees that operate from homedocks on the Mississippi River to relocate to new home docklocations that meet specified requirements. If an ownerslicense terminates or expires without renewal or the Boardrevokes or determines not to renew an owners license, itmay re-issue the owners license pursuant to a competitivebidding process. If the Gaming Board determines that thehighest prospective total revenue to the State would bederived from State conduct of the gambling operation inlieu of reissuing the license, it shall so inform each applicantand commence a competitive bidding process for issuanceof a managers license. If the Board elects to conductriverboat gambling operations previously authorized by aterminated, expired, nonrenewed, or revoked ownerslicense, it may do so without an owners license and thenumber of owners licenses that the Board may issue shall be
reduced by one. The Gaming Board shall have jurisdictionover and shall supervise all State gambling operations.Qualified persons are allowed to apply for a managerslicense to operate and manage any gambling operationconducted by the State. Making a false statement on amanagers license application is a Class A misdemeanor.Issuance of a managers license shall be subject to a com-petitive bidding process. Specific procedures are outlinedfor the bidding for owners licenses and managers licenses.The admission tax rate is changed to a graduated ratebased on admissions in the previous year. The GamingBoard may not re-issue an owners license unless the Board’srevocation or determination not to renew the license is final.Amends Public Act 91-40 to replace that Public Act’sinseverability clause with a severability clause.
Public Act 93-0030Public Act 93-0030 amends the Illinois Estate and Genera-tion-Skipping Transfer Tax Act to define “State tax credit” tobe the amount calculable under the Internal RevenueCode as that credit that would have been computed andallowed on December 31, 2001 for persons dying on orbefore December 31, 2009 and the credit allowable underSection 2011 or Section 2604 of the Internal Revenue Codefor persons dying thereafter. The applicable exclusionamount, however, is equal to the current amount in theInternal Revenue Code for persons dying on or after Janu-ary 1, 2003 and through December 31, 2005, and $2,000,000for persons dying thereafter and through December 31,2009. Persons dying after December 31, 2005 who do nothave to file a federal return but who do have to file anIllinois return shall file with the Attorney General schedules ofassets as required by the Attorney General.
Public Act 93-0032Public Act 93-0032 makes various fund transfers including $80million from GRF into the Tobacco Settlement Recovery Fundand authorizes the re-transfer back into GRF from that fund.
Transfers $5 million from GRF into the Military Family Relief Fund.
Allows the Director of the Governor’s Office of Managementand Budget (GOMB) to transfer from any fund into GRF tohelp defray the State’s operating costs for the fiscal year. Thetransfer amount from any fund may not exceed the lesser of8% or 25% of the beginning balance in the fund. Providesthat transfers from the Road Fund may not exceed 5% ofrevenues deposited in the fund for that year.
Additional revenue generated by the new and increasedfees in this Act shall be allocated between the designatedfund and the General Revenue Fund. Allows the Director ofGOMB to determine those amounts.
From the amount of revenue allocated to the Local Govern-ment Distributive Fund (LGDF) from the income tax, deducts$6.66 million per month for FY 04. Sets the Income Tax RefundFund individual income tax percentage at 11.7% and thecorporate income percentage at 32%.
Increases the amount of sales tax required to be pre-paidon motor fuel and gasohol from $0.04 to $0.06 and from$0.03 to $0.05 per gallon, respectively. Decreases therecord-keeping discount allowed for filing motor fuel taxreturns from 2% to 1.75%.

F I S C A L Y E A R 2 0 0 3 A N N U A L R E P O R T
Illinois Department of Revnue 81
Changes the underpayment and overpayment interest rateamounts to piggyback federal rates. The late paymentpenalty is increased. The amount of penalty imposed ifpayment is made up to 30 days after the due date is 2% ofamount due; if payment is made 30 to 90 days after the duedate, the penalty is 10% of the amount due; if payment ismade between 90 and 180 days after the due date, thepenalty is 15% of the amount due; and if the payment ismade 180 days or more after the due date, the penalty is20% of the amount due.
Penalties are also increased for failure to file a tax return or toshow on a timely return, the full amount of any tax due. If thereturn is filed before the Department initiates an audit orinvestigation of the taxpayer, the penalty is 5% of the taxdue; if the return is filed after the Department has initiated anaudit or investigation of the taxpayer, but prior to any noticeof deficiency or final assessment issued by the Department,then the penalty is 10% of the tax due; if the taxpayer has notfiled and/or paid the amount still due before any notice ofdeficiency or final assessment is issued by the Department,then the penalty is 20% of the amount of tax due.
Imposes a new collection penalty. The collection penalty isimposed if any liability shown on a demand for payment,(related to any return due after July 1, 2003), is not paid infull before the specified due date. The penalty shall beconsidered additional tax imposed under the law which thetax being collected was imposed. If the unpaid amount isless than $1,000, then the penalty is $30. If the unpaidamount is $1,000 or more, then the penalty is $100.
Increases the Used Tire Fee by $1.50 (new fee is $2.50) anddirects $0.50 of that increase to be deposited into theEmergency Public Health Fund. The additional $0.50 shall nolonger be collected after December 31, 2007.
Doubles the Coin-Operated Amusement Device privilegetax from $15 to $30
Public Act 93-0117Public Act 93-0117 creates the State Agency Web Site Actto provide that State agency Web sites may not use perma-nent cookies or any other invasive tracking programs thatmonitor and track Web site viewing habits for cases in whichthe use of permanent cookies “adds value to the userotherwise not available” and the permanent cookies “arenot used to monitor and track web site viewing habits unlessall types of information collected and the State’s use of thatinformation add user value and are disclosed through acomprehensive online privacy statement”. A State agencyWeb site may use transactional cookies that facilitatebusiness transactions.
Public Act 93-0117 also creates the Internet Privacy TaskForce and specifies its membership. The Task Force shallexplore the technical and procedural changes that areneeded in the State’s computing environment to ensurethat visits to State Web sites remain private, identify thethreats to privacy from browsers, search engines, Webservers, Internet service providers, and State agencies andmake recommendations as needed, and, if needed, deviseprocedures for creating or installing computer programs onState host computers that will disable cookies and otherinvasive programs. The Internet Privacy Task Force shall“define the exemption and limitations . . . in practice” and
shall submit reports to the Governor and the GeneralAssembly by December 31 of each year.
Public Act 93-0586Public Act 93-0586 amends the Executive ReorganizationImplementation Act to supersede certain provisions ofExecutive Orders Nos. 2003-9, 2003-10, 2003-11, and 2003-12relating to the transfer of certain legal and auditing functionsand the status of transferred personnel who are under thePersonnel Code. Any legal personnel who have beentransferred under a superseded provision of Executive Order2003-10 (and their associated records and property) shall beimmediately transferred back to the relevant agency fromthe Department of Central Management Services.
Public Act 93-0552Public Act 93-0552 creates the Corporate Accountability forTax Expenditures Act to provide that for each state fiscalyear ending on and after June 30, 2005, the Department ofRevenue shall submit a “Unified Economic DevelopmentBudget” to the General Assembly, which shall contain alltypes of development assistance granted during the priorfiscal year. This is to include the following:
The aggregate amount of uncollected or diverted State taxrevenues resulting from each type of development assis-tance, as reported to the Department, all State develop-ment assistance, all information contained in the report willbe subject to FOIA, and standardized applications for Statedevelopment assistance.
Beginning February 1, 2005, every State granting body mustsubmit copies of all development assistance agreements toDCEO that it approved in the prior calendar year. All grantrecipients must submit progress reports to DCEO.
All development assistance agreements are required tocontain certain recapture provisions. If a grant recipient failsto create or retain the requisite number of jobs the recipientshall be deemed to no longer qualify for the State eco-nomic development assistance. Those recipients shall berequired to pay back the amount of received State taxexemptions.
Public Act 93-0570Public Act 93-0570 provides that the Department ofRevenue’s Debt Collection Bureau is to serve as the primarydebt collecting entity for the State and shall collect debtson behalf of agencies of the State. The Department has thesole authority to let contracts with persons specializing indebt collection for the collection of debt referred to andaccepted by the Department. Any contract with the debtcollector shall specify that the collector’s fee is on a contin-gency basis and the debt collectors are not entitled tocollect a fee for any debt collected through the efforts ofany State offset system.
Public Act 93-0570 also allows the agencies to certify theirdebt to the Department, instead of the Department owningthe debt (which creates much more work and wouldrequire a tremendous amount of resources).
The Department of Public Aid and the Illinois Department ofEmployment Security shall refer their debt to the Departmentto be certified by July 1, 2004. All other agencies shall refertheir debt, provided that debt satisfies the requirements forreferral of delinquent debt established by rule, by July 1, 2005.

82 Illinois Department of Revnue
F I S C A L Y E A R 2 0 0 3 A N N U A L R E P O R T
Authorizes the Department to collect debt using all legalmeans available to the Department as well as those collectiontools available to the referring agency to collect debt.
Creates the Debt Collection Fund. Twenty percent of allamounts collected by the Department, excluding amountscollected on behalf of the Departments of Public Aid andRevenue, shall be deposited into the Debt Collection Fund.All remaining amounts collected are to be deposited into theGeneral Revenue Fund or to any state fund that the moneywould have otherwise been deposited into. Moneys in thefund are to be appropriated only for the administrative costsof the Collection Bureau. On the last day of each fiscal year,unappropriated moneys and moneys otherwise deemedunneeded for the next fiscal year remaining in the Fund maybe transferred into the General Revenue Fund at theGovernor’s reasonable discretion.
This legislation is subject to appropriation by the GeneralAssembly.
Public Act 93-0600Public Act 93-0600 amends the Illinois Procurement Code tocreate a 5-year prohibition against bids from and contractswith businesses with personnel convicted of a felony under(i) the Sarbanes-Oxley Act of 2002 or (ii) the Illinois SecuritiesLaw of 1953. The bids and contracts certify that the businessis not barred by the prohibition and permits a State agencyto void a contract if the certification is false.
Managerial agents are the agents whose convictions areconsidered for purposes of the prohibition. which include that (i)the business has been convicted of one of the specified feloniesor (ii) the business has been ordered to pay punitive damagesas a result of the felony conviction of its officer, director, partner,or managerial agent. The conditions under which the prohibitionapplies to businesses that are not natural persons. Businessesthat are natural persons remain subject to the Code’s otherprohibitions against State contracts with felons.
The Illinois Procurement Code requires, rather than permits,that a State contract be declared void if the certificationsconcerning certain felony convictions of the contractor andthe contractor’s officers, directors, partners, and managerialagents are false.
Circuit Breaker / PharmaceuticalAssistancePublic Act 93-0018Public Act 93-0018 creates the Senior Citizen Prescription DrugDiscount Program Act to provide that the Program shall beadministered by the Department of Central ManagementServices to enable eligible senior citizens and disabled personsto purchase prescription drugs at discounted prices and thatthe Department shall (i) enroll eligible seniors and disabled intothe Program, (ii) enter into rebate agreements with drugmanufacturers, either itself or through an agent, and (iii)reimburse pharmacies for the cost of providing discounts usingthe proceeds from the manufacturer rebate agreements.Eligible seniors are persons who are Illinois residents and whoare disabled or 65 years of age or older. Public Act 93-0018establishes a prescription pricing formula, sets guidelines forthe rebate agreements, and establishes application require-ments for seniors and eligibility requirements for pharmacies.The Department is required to adopt rules.
Public Act 93-0130Public Act 93-0130 allows the Department of Revenue toadopt rules specifying participation requirements for thepharmaceutical assistance program, including copaymentamounts, identification card fees, expenditure limits, andthe benefit threshold to be in effect July 1, 2004. IDOR maynot increase the enrollment fee. Specifies that, to the extentpracticable, these requirements are to be commensuratewith the requirements for SeniorCare.
Public Act 93-0528Public Act 93-0528 amends the Senior Citizens and DisabledPersons Property Tax Relief and Pharmaceutical AssistanceAct to provide that beginning on January 1, 2004, thepharmaceutical assistance program covers prescriptiondrugs used in the treatment of multiple sclerosis.
Income TaxPublic Act 93-0029Public Act 93-0029 eliminates the credit for Personal PropertyTax Replacement Income Tax for tax years ending on andafter December 31, 2003; the Training Expense Credit iseliminated for tax years ending on and after December 31,2003, and the Research and Development tax credit for taxyears ending on and after December 31, 2003. This act alsoeliminates the he corporate standard exemption for taxyears ending on and after December 31, 2003, This act alsoeliminates the two year carryback on net operating lossesand limits the carryforward to 12 years for losses incurred intax years ending on and after December 31, 2003, and Lifeand Health Insurance Guarantee offset as well as the HealthMaintenance Organization offset.
Public Act 93-0029 increases the “floor” of the Rate Reduc-tion for Certain Foreign Insurers from 1.25% of premiums to1.75% of premiums.
Public Act 93-0036Public Act 93-0036 amends the Illinois Income Tax Act tocreate the Lou Gehrig’s Disease (ALS) Research Fundcheckoff. Beginning with the taxable year ending onDecember 31, 2003, the Department of Revenue shall printon its standard individual income tax form a provisionindicating that if taxpayers wish to contribute to the LouGehrig’s Disease Research Fund they may do so by statingthe amount of the contribution on the return. The contribu-tion will reduce the taxpayer’s refund or increase theamount of payment to accompany the return.
Public Act 93-0036 amends the Department of Public Aidshall make grants from the Lou Gehrig’s Disease (ALS)Research Fund to the Les Turner ALS Foundation for researchon Amyotrophic Lateral Sclerosis (ALS).
Public Act 93-0131Public Act 93-0131 creates the WWII Illinois Veterans Memo-rial income tax checkoff. It also directs the Department ofRevenue to include on the standard individual income taxreturn, a space for taxpayers to make a donation to theWWII Illinois Veterans Memorial Fund. The contribution willreduce the taxpayer’s refund or increase the amount ofpayment to accompany the return.

F I S C A L Y E A R 2 0 0 3 A N N U A L R E P O R T
Illinois Department of Revnue 83
Public Act 93-0292Public Act 93-0292 provides that the Department of Revenuemust print on its standard individual income tax form aprovision indicating that if a taxpayer wishes to contribute tothe Asthma and Lung Research Fund, he or she may do soby stating the amount of the contribution (not less than $1)on the return. The contribution will reduce the taxpayer’srefund or increase the amount of payment to accompanythe return. The Department of Public Health must makegrants from the Fund to the Asthma Clinical Researchprogram administered by the American Lung Association.
Public Act 93-0324Public Act 93-0324 amends the Illinois Income Tax Act bycreating a tax checkoff for the Leukemia Treatment andEducation Fund. The Department of Revenue shall print on itsstandard individual income tax form a provision indicatingthat if taxpayers wish to contribute to the Leukemia Treat-ment and Education Fund they may do so by stating theamount of the contribution on the return. The contributionwill reduce the taxpayer’s refund or increase the amount ofpayment to accompany the return.
Public Act 93-0324 also amends the Department of HumanServices Act to provide that the Department may providegrants to public or private hospitals, medical centers, medicalschools, and other organizations for education on andtreatment of leukemia from appropriations to the Departmentfrom the Leukemia Treatment and Education Fund.
Public Act 93-0534Public Act 93-0534 amends the Illinois Income Tax Act byremoving language that terminates the earned income taxcredit with taxable years ending on or before December 31,2002 and exempts the credit from the sunset requirements.
Beginning in 2003, the excess credit to be refunded to thetaxpayer, but such refunds are not counted in determiningeligibility for means-tested benefits. The refunds authorizedby this amendatory Act are subject to the availability offunds from the federal Temporary Assistance for NeedyFamilies Block Grant and the State’s ability to meet itsrequired Maintenance of Effort.
Public Act 93-0543Public Act 93-0543 creates the Film Production Services TaxCredit Act to provide for a credit of 25% of the Illinois laborexpenditures made by an entity for film or television produc-tion to foster job creation and retention in Illinois. The Depart-ment of Commerce and Community Affairs is authorized toaward a tax credit to taxpayer-employers who apply for thecredit and meet the Illinois labor expenditure requirements forthe credit. Minimum requirements for eligibility for the creditand procedures for the award of the credit under the Act areestablished. The Illinois Income Tax Act is amended to establishthe film production services tax credit.
Property Tax / Local GovernmentPublic Act 93-0019Public Act 93-0019 amends the State Property Control Act toprovide that, notwithstanding any other provision of the Actor any other law to the contrary, the Director of CentralManagement Services is authorized to dispose of the JamesR. Thompson Center and the Elgin Mental Health Center andthe Toll Highway Authority is authorized to convey the IllinoisState Toll Highway Authority headquarters building andsurrounding land in certain named ways. The exception tothe Toll Highway Authority’s power to sell the land is limited toland located at 2700 Ogden Avenue in Downers Grove tothe extent that the property is subject to the State PropertyControl Act at the time of the proposed sale. Amends theState Finance Act, the Illinois Procurement Code, the Prop-erty Tax Code, and the Toll Highway Act concerning theconveyance of these properties.
All property owned by a municipality with a population ofover 500,000 inhabitants, or a unit of local governmentwhose jurisdiction includes territory located in whole or in partwithin a municipality with a population of over 500,000inhabitants, shall remain exempt from taxation and anyleasehold interest in that property shall not be subject totaxation if, for the purpose of obtaining financing, theproperty is directly or indirectly leased, sold, or otherwisetransferred to another entity whose property is not exemptand immediately thereafter is the subject of a leaseback orother agreement that directly or indirectly gives the munici-pality or unit of local government certain rights with respectto the property.
The State Mandates Act is amended to require implementa-tion without reimbursement.
Public Act 93-0146Public Act 93-0146 amends the Mobile Home Local ServicesTax Act to provide that beginning on January 1, 2004 amobile home owned and used exclusively by a disabledveteran or the spouse or unmarried surviving spouse of theveteran as a home is exempt from the tax imposed by theAct. It also requires annual reestablishment of eligibility forthe exemption by certification from the Illinois Departmentof Veterans’ Affairs to the county clerk of the county inwhich the exempt mobile home is located.
Public Act 93-0146 defines a “disabled veteran” as a personwho has served in the armed forces of the United States andwhose disability is of such a nature that the federal govern-ment has authorized payment for purchase or constructionof specially adapted housing as set forth in federal law.
Public Act 93-0146 also amends the State Mandates Act torequire implementation without reimbursement from the State.
Public Act 93-0188Public Act 93-0188 provides that any person who has servedas a township or multi-township assessor for 12 years or moreis eligible to hold such offices if he or she possesses aCertified Illinois Assessing Official certificate from the IllinoisProperty Assessment Institute with a minimum of 360 addi-tional hours of successfully completed courses approved bythe Department of Revenue, provided at least 180 of thecourse hours required a written examination.

84 Illinois Department of Revnue
F I S C A L Y E A R 2 0 0 3 A N N U A L R E P O R T
Public Act 93-0193Public Act 93-0193 provides that if an unincorporated area ofa county under township organization in subdivisions initiallyplatted before January 1, 1995 contains at least one mile ofstreets or roadways situated entirely within a township andnot owed by the county or any other unit of government, thehighway commissioner may propose a special service areafor the purpose of repairing, reconstructing, or maintainingthose streets and roadways. The corporate authorities of thecounty may levy or impose additional taxes upon propertywithin the area for the provision of special services and forthe payment of debt incurred in order to provide thoseservices. Requires 51% or more of the property owners toagree to the establishment of the special service area.
Public Act 93-0196Public Act 93-0196 amends the Special Assessment Supple-mental Bond and Procedure Act to provide changesconcerning the following: an additional amount for bonddiscount that may be provided in a special assessmentordinance; issuance of Supplemental Act Assessment Bondsin lieu of vouchers after the date of a judicial order andbefore expiration of the appeal period; billing of specialassessments by the municipality or by the county clerk; andrebates of any surplus.
Public Act 93-0196 amends the Illinois Municipal Code toprovide that a proposed local improvement to be paid forby special assessment or special tax may consist of theacquisition of the necessary interests in real property and theconstruction of any public improvements or any combina-tion of public water mains, sanitary sewer improvements,sidewalks, walkways, bicycle paths, landscaping, lighting,lighting improvements, signage improvements, vehicularparking improvements, any additional improvementsnecessary to provide access to the public improvements,and all necessary appurtenances.
Public Act 93-0203Public Act 93-0203 changes the language required to beplaced on the ballot for a proposition to increase propertytax for the purpose of establishing and maintaining aChildren’s Advocacy Center. The proposition must state whatthe approximate annual increase in property tax will be per$100,000 of assessed value as a result of the increase. Alsorequires the purpose of a Children’s Advocacy Center (tocoordinate the investigation, prosecution and treatmentreferral of child sexual abuse) be printed on the ballot as well.
Public Act 93-0248Public Act 93-0248 amends the Property Tax Code to providethat the Property Tax Appeal Board shall provide annually, nolater than February 1, to the Governor and the GeneralAssembly a report that contains for each county (1) the totalnumber of cases for commercial and industrial propertyrequesting a reduction in assessed value of $100,000 or morefor each of the last 5 years, (2) the total number of cases forcommercial and industrial property decided by the Board foreach of the last 5 years, and (3) the total change in assessedvalue based on the Property Tax Appeal Board decisions forcommercial property and industrial property for each of thelast 5 years. In counties with 3,000,000 or more inhabitants, theBoard shall electronically distribute every 30 days to the chiefcounty assessment officer, free of charge, certain informationabout appeals to the Board. Each appeal to the Property Tax
Appeal Board shall be limited to the grounds listed in thepetition filed with the Board.
Public Act 93-0270Public Act 93-0270 allows a taxing district to abate taxes onproperty of certain historical societies through assessmentyear 2008.
Public Act 93-0298Public Act 93-0298 amends the Tax Increment AllocationRedevelopment Act in the Illinois Municipal Code to providethat the redevelopment project in the TIF District created byan ordinance adopted on (1) September 14, 1994 by the Cityof Alton, (2) November 11, 1996 by the City of Lexington (3)November 5, 1984 by the City of LeRoy (4) December 29, 1986by the City of Collinsville (5) April 3, 1991 or June 3, 1992 by theCity of Markham must be completed by December 31 of the35th year after the year in which the ordinance was adopted.
Public Act 93-0298 also requires contracts entered into on orafter the effective date of this amendatory Act to terminateno later than the estimated dates of completion of theredevelopment project and retirement of the obligationsissued to finance redevelopment project costs, with someexceptions. Proceeds of contracts entered into prior to theeffective date of this amendatory Act that are received bythe municipality after the redevelopment project area hasbeen terminated shall be deposited into a special fund ofthe municipality to be used for other community redevelop-ment needs within the redevelopment project area. Withrespect to a municipality adopting an ordinance or resolu-tion providing for a feasibility study on the designation of anarea as a redevelopment project area, provides that“feasibility study” means a preliminary report to assist amunicipality to determine whether or not tax incrementallocation financing is appropriate for effective redevelop-ment of a proposed redevelopment project area. Prior toterminating a redevelopment project area, a municipalitymust close the books and records of the redevelopmentproject area. All real or personal property and public im-provements acquired by or for the municipality as a result ofthe redevelopment project and plan shall vest in the munici-pality when acquired and shall continue to be held by themunicipality after the redevelopment project area has beenterminated. Revenues received by the municipality fromrepayments of loans may be used to pay redevelopmentproject costs.
Public Act 93-0298 defines “blighted area” to also mean anyarea within the boundaries of a redevelopment project arealocated within the territorial limits of the municipality where, ifvacant, the sound growth of the redevelopment project areais impaired by the fact that the area, prior to its designationas a redevelopment project area, is subject to surface waterthat discharges from all or a part of the area and contributesto flooding within the same watershed, but only if the rede-velopment project provides for facilities or improvements tocontribute to the alleviation of all or part of the flooding.
Public Act 93-0316Public Act 93-0316 amends the Property Tax Code toprovide for a housing opportunity tax abatement programfor the purpose of promoting access to housing near workand to alleviate the concentration of low-income house-holds in areas of high poverty. The applicant for a housing

F I S C A L Y E A R 2 0 0 3 A N N U A L R E P O R T
Illinois Department of Revnue 85
opportunity area tax abatement must, under oath, self-certify as to the total number of dwelling units on theproperty and that the property is in substantial compliancewith local building codes. The housing authority may chargean application fee. In Chicago, inhabitants may annuallypetition the county clerk to be excluded from a housingopportunity area. Properties located in an excluded munici-pality shall not be eligible for the housing opportunity areaabatement for the tax year in which the petition is made.
Public Act 93-0346Public Act 93-0346 amends the Property Tax Code to providethat, notwithstanding any other provision of the Code, if aschool district adopts, in a fiscal year, an additional orsupplemental budget as a result of the voters in the schooldistrict having voted in favor of an increase in the annual taxrate for educational or operations and maintenance pur-poses or both at an election held after the adoption of theannual school budget adopted in that fiscal year, the countyclerk shall include, in the extension of taxes made during thatfiscal year, the extension of taxes for the supplemental oradditional budget adopted by the school district.
Public Act 93-0366Public Act 93-0366 amends language to make it permissivefor a county collector to receive taxes on part of a parcel ofproperty, instead of mandatory, when a particular specifica-tion of the part is furnished by the taxpayer.
Public Act 93-0369Public Act 93-0369 changes the definition of “affordablehousing project” and “sponsor” and defines “project” and“tax credit”. A sponsor must apply to an administrativehousing agency for approval of a project. The agency mustreserve a specific amount of tax credits for each approvedproject now. Tax credits for general operating support canonly be reserved as part of a reservation of tax credits for theproject. It also limits tax credits for general operating supportto 10% of the total tax credit reservation for the relatedproject. An administrative housing agency is authorized toreserve tax credits for any approved projects if the agency isunable to reserve the tax credits set-aside for employer-assisted housing projects and general operating support.
Public Act 93-0369 also amends the IITA to provide thatpersons or entities not subject to the tax and who make adonation under the Illinois Housing Development Act areentitled to receive and to transfer a tax credit for affordablehousing donations.
Public Act 93-0378Public Act 93-0378 amends the Property Tax Code to providethat in Cook County a tax objection complaint must be filedwithin 165 days after the first penalty date of the final taxinstallment. In all other counties, a tax objection complaintmust be filed within 75 days after the first penalty date of thefinal tax installment. Public Act 93-0378 also amends theState Mandates Act to require implementation withoutreimbursement.
Public Act 93-0415Public Act 93-0415 amends the Property Tax Code to allowcounty boards (except in Cook County), with the approvalof the county treasurer, to use monies in the Tax Sale Auto-mation Fund to defray the cost of providing electronicaccess to collection and delinquent tax sale records.
Public Act 93-0421Public Act 93-0421 amends the Property Tax Code toprovide that all property owned by the Joliet ArsenalDevelopment Authority (JADA) is exempt from propertytaxes. Property leased to an entity that is not exempt is toremain exempt.
Public Act 93-0490Public Act 93-0490 provides that in any proceeding in which thetax purchaser is a county acting as a trustee for taxing districts,reimbursement before issuance of a tax deed is not necessary.
Public Act 93-0511Public Act 93-0511 amends the Senior Citizens HomesteadExemption provisions in the Property Tax Code to provide thatbeginning with assessment year 2003, for taxes payable in 2004,property that is first occupied as a residence after January 1 ofany assessment year by a person who is eligible for the seniorcitizens homestead exemption must be granted a pro-rataexemption for the assessment year. The amount of the pro-rataexemption is the senior citizens homestead exemption allowedin the county divided by 365 and multiplied by the number ofdays during the year the property is occupied as a residenceby a person eligible for the exemption. The chief countyassessment officer must adopt reasonable procedures toestablish eligibility for the pro-rata exemption. Amends the StateMandates Act to restate that the senior citizens homesteadexemption is exempt from the requirements of the StateMandates Act and further amends the Property Tax Code tostate that the senior citizens homestead exemption is exemptfrom the requirements of the State Mandates Act.
Public Act 93-0533Public Act 93-0533 provides that low-income housingprojects under Section 515 of the federal Housing Act are nolonger assessed at 33 1/3% of the fair market value of theireconomic productivity to the owners of the projects.Instead, low-income housing projects that qualify for thelow-income housing tax credit under Section 42 of theInternal Revenue Code will be assessed at 33 1/3% of thefair market value of their economic productivity to theowners of the projects. A qualified low-income housingproject under this section includes any residential rentalproperty, which meets either the 20-50 test or the 40-60 testas elected by the taxpayer.
The 20-50 test is met if 20% or more of the units in the projectare both rent-restricted and occupied by individuals whoseincome is 50% or less of area median gross income. The 40-60 test is met if 40% or more units in the project are bothrent-restricted and occupied by individuals whose income is60% or less of area median gross income.
Public Act 93-0556Public Act 93-0556 amends the Counties Code by adding“transportation”, which includes passenger rail, to thepurposes and uses of the revenue from the special countyretailers’ occupation tax for public safety. If a tax is imposedfor transportation for public highways, as authorized underthe Illinois Highway Code or for passenger rail transportation,the county board must publish notice of the existence of itslong-range highway transportation or passenger rail trans-portation plan and must make the plan publicly availableprior to approval of the ordinance or resolution imposing thetax. The form of a referendum proposition for imposing the

86 Illinois Department of Revnue
F I S C A L Y E A R 2 0 0 3 A N N U A L R E P O R T
tax for transportation purposes and also requires that themoneys collected be deposited into a special fund.
Public Act 93-0560Public Act 93-0560 amends the Property Tax Code to providethat if a taxpayer receives a tax bill for any property orportion of property that was omitted for 2 or more years fromassessment, the tax bill for the omitted property must be paidwithin 16 months after the date the taxpayer receives the taxbill. No interest may be imposed during that 16-month period.Thereafter, interest shall be charged as with all other delin-quent tax bills (1.5% per month).
Public Act 93-0601Public Act 93-0601 restores bonding ability to the 1991 levelfor the Forest Preserve District of Cook County and 16 otherpark districts. Amends the Property Tax Extension LimitationLaw (PTELL) to define “debt service extension base” for parkdistricts as an amount equal to that portion of the extensionfor the 1991 levy year constituting an extension for paymentof principal and interest on non-referendum park districtbonds – but only if these park districts were first subject toPTELL in 1991 or 1995 and the extension for the 1994 levy yearfor the payment of principal and interest on non-referendumpark district bonds was less than 51% of the amount for the1991 levy year constituting an extension for payment ofprincipal and interest on non-referendum park district bonds.
“Excluded non-referendum bonds” is defined as (i) bondsauthorized for certain aquarium and museum projects, (ii)double-barreled bonds (Local Government Debt ReformAct bonds), and (iii) refunding obligations issued to refund orto continue to refund obligations initially issued pursuant toreferendum.
Exempt from the definition of “aggregate extension” speciallevies: (1) made for payments of principal and interest onbonds authorized by this amendatory Act and issued underthe Cook County Forest Preserve District Act and (2) issuedunder Section 44.1 of the Cook County Forest PreserveDistrict Act for botanical gardens projects.
Public Act 93-0606Public Act 93-0606 amends the Property Tax ExtensionLimitation Law in the Property Tax Code to provide that“new property” means, for real property in Cook Countyclassified as property eligible for property tax incentives inClasses 6 through 9 or that was so classified in the immedi-ately preceding levy year, in addition to its other meanings,an incentive property’s additional assessed value resultingfrom a scheduled increase in the level of assessment asapplied to the first year final board of review market value.
Public Act 93-0612Public Act 93-0612 excludes special purpose extensions thatare made by the Chicago Park District for recreationalprograms for the handicapped under subsection (c) ofSection 7.06 of the Chicago Park District Act from thedefinition of “aggregate extension” for taxing districtssubject to PTELL in Cook County.
The Chicago Park District is authorized to establish, maintainand manage recreational programs for mentally andphysically handicapped individuals. The Chicago ParkDistrict is authorized to levy and collect an annual tax at arate not to exceed .04% of the equalized assessed value of
the taxable property in the district for purposes of fundingrecreational programs for the handicapped.
Public Act 93-0643Public Act 93-0643 provides that the definition of “coeffi-cient of dispersion” means the average deviation of allassessments from the median level and that the number ofinhabitants shall be determined by the latest federaldecennial or special census of the county. When the mostrecent census shows an increase in inhabitants to over50,000, then the assessment year used to compute thecoefficient of dispersion and median levels of assessment isthe year that determines the qualification for additionalcompensation.
Sales and Excise TaxPublic Act 93-0022Public Act 93-0022 ends the crediting of any balance in theDram Shop Fund over $5 million to liquor license fees. Alsoincreases the Liquor License Fee from $175 to $500, effectiveJuly 1, 2003 and apportions that money to the Dram ShopFund and the General Revenue Fund.
Beginning October 1, 2003 requires alcoholic beveragedistributors in Illinois to report their sales made to individualliquor retailers on a monthly basis. This report must be filed withthe Department electronically and must identify gross receiptsby individual retailer and include the purchaser’s tax registra-tion number. A copy of the retailer’s monthly sales must alsobe sent to the retailer. To help offset the cost of gathering anddistributing this information, the bill also raises the cap on therecord-keeping discount allowed to distributors for their liquortax returns. The cap is increased from 1.75% or $1,250 perreturn to 2% or $3,000 per return for one year, and then 2% or$2,000 per return for each year thereafter.
Also beginning October 1, 2003, retailers selling alcoholicliquor must file a statement with the Department of Revenueindicating the amount paid for alcoholic liquor for thepreceding month and any other information reasonablyrequired by the Department, on a monthly basis. Failure tocomply can result in a retailer’s liquor license being revoked.
Effective July 1, 2003, the bill ends the practice of allowing acigarette tax distributor a 30-day “float” on payment forcigarette tax stamps.
Public Act 93-0023Public Act 93-0023 tightens the Rolling Stock Exemption byamending the test for motor vehicles to qualify as rollingstock. Provides that on and after July 1, 2003 “use as rollingstock moving in interstate commerce” occurs when a motorvehicle, during a 12-month period, has carried persons orproperty for hire in interstate commerce for 51% of its totaltrips. Those trips must cross the Illinois State Border.
Creates the Commercial Distribution Fee (CDF) administeredby the Office of the Secretary of State. The CDF is imposedupon vehicles of the second division with a gross vehicleweight exceeding 8,000 lbs. and that incur any tax or feeunder Section 3-815(a) or Section 3-818(a) of the IllinoisVehicle Code in an amount equal to 36% of the fees andtaxes incurred under those Sections. The CDF is also imposedupon vehicles of the second division with a gross vehicleweight 8,000 lbs. or less that incur any tax or fee underSection 3-815(a) or Section 3-818(a) of the Illinois Vehicle

F I S C A L Y E A R 2 0 0 3 A N N U A L R E P O R T
Illinois Department of Revnue 87
Code and that are eligible for and have claimed the rollingstock exemption. Fees paid under this Section are to bedeposited in the General Revenue Fund. Vehicles subject tothe Commercial Distribution Fee are exempt from the Actsthat comprise the State “sales tax”.
A new Transportation Employee Credit created under theIllinois Income Tax Act for tax years beginning on or afterJanuary 1, 2004. This credit provides that a qualified em-ployer is allowed a credit against its income tax liability inthe amount of $50 for each eligible employee (full-timeemployee who is an Illinois resident).
Public Act 93-0024Public Act 93-0024 imposes a Use Tax on the sale of air-planes. The tax is modeled after the Private Vehicle Use Taxthat individuals pay when they purchase a car from anotherindividual.
Public Act 93-0024 eliminates the following exemptions:pollution control facilities, vehicle replacement tax, graphicarts machinery and equipment, oil field exploration, coalexploration, distillation machinery, vending machines,aggregate mining, and Manufacturers’ Purchase Credit.
Public Act 93-0025Public Act 93-0025 creates the FY2004 Budget Implementa-tion (State Finance-Administration) Act and amends theExecutive Reorganization Implementation Act, the CivilAdministrative Code of Illinois, the Illinois Procurement Code,the Illinois Income Tax Act, the Retailers’ Occupation TaxAct, the Counties Code, the Illinois Municipal Code, theSchool Code, the Department of Central ManagementServices Law, the Department of Commerce and Commu-nity Affairs Law, and the Department of Revenue Law of theCivil Administrative Code of Illinois, the Bureau of the BudgetAct, the State Finance Act, the Pretrial Services Act, theProbation and Probation Officers Act, and the Code of CivilProcedure to implement the FY2004 State finance-adminis-tration budget.
Public Act 93-0031Public Act 93-0031 states that beginning October 1, 2003, ause tax is imposed on out-of-state gas purchases. The tax isimposed at a rate of 2.4 cents per therm or 5% of thepurchase price, whichever is less.
A delivering supplier who maintains a place of business in thisState must collect the tax from purchasers who have electedthe alternate tax rate (2.4 cents per therm) under Section 5-10. Delivering suppliers are relieved of the responsibility ofcollecting the tax if that supplier receives a copy of a certifi-cate of registration issued to a self-assessing purchaser. Anypurchaser who does not elect the alternate tax rate mustregister with the Department as a self-assessing purchaser.
Provides for the following exemptions from the Gas Use Tax:
• Gas used by businesses located within enterprise zones
• Gas used by governmental bodies, or a corporation,society, association, foundation, or institution organizedand operated exclusively for charitable, religious, oreducation purposes.
• Gas used in the production of electric energy
• Gas used in petroleum refinery operation
• Gas purchased by persons for use in liquefaction andfractionation processes that produce value addednatural gas byproducts for resale
• Gas used in the production of anhydrous ammonia anddownstream nitrogen fertilizer products for resale
Public Act 93-0052Public Act 93-0052 increases the Used Tire Fee by $0.50 pernew or used tire purchased beginning July 1, 2003. Theadditional 50 cents will be allocated to the Department ofPublic Health for grants to county health departments forexpenses related to the West Nile Virus and other vector-borne diseases. The increased fee sunsets January 1, 2008.
Public Act 93-0286Public Act 93-0286 amends the Telecommunications ExciseTax Act and the Telecommunications Infrastructure Mainte-nance Fee Act.
The date for using any reasonable method for apportioningthe telecom taxes is pushed back to January 1, 2004because the original bill was passed and signed too late, sothe effective date would have been June 1, 2003. Theseparate language listed as part (iii) allowing the use of anyreasonable method for any period is stricken because allparties involved expected that the methods listed under (i)and (ii) would be the only way that the private lines wouldbe proportionately taxed after the effective date.
The specific language added to the Simplified MunicipalTelecommunications Act apportions the municipal telecom-munications tax between the municipalities in the samemanner as state telecom taxes are apportioned betweenthe states.
The amendment also adds language that allows a credit fortax paid to the wrong municipality. This is similar to a creditgiven to state telecom taxes. Contains language thatchanges the date a municipality’s ordinance imposing oreliminating the local telecommunications tax is due to theDepartment. Also changes the amount of time the Depart-ment has to certify the ordinance and notify the providers.
Public Act 93-0303Public Act 93-0303 provides that the Department of Rev-enue must coordinate with the Fire Marshal to create anawareness program to inform fire protection districts thatpurchases made by fire protection districts are not subjectto sales tax and how to get the exemption.

88 Illinois Department of Revnue
F I S C A L Y E A R 2 0 0 3 A N N U A L R E P O R T
Court CasesZebra Technologies Corp. v. Topinka, et al., 1-01-2861& 1-03-0386 Consolidated ( 1st District Appellate Court10/27/03)Taxpayer organized two offshore companies, ZDI andZII, to hold intellectual property, which the companiesleased back to the taxpayer. The taxpayer sought toexclude ZDI and ZII from the unitary group claimingthat greater than 80% of their property and payrollwas outside of the U.S. The Court determined that thetaxpayer failed to support its position and includedthe entities in the unitary group. Taxpayer also pur-ported to create a wholly owned Investment Com-pany in Delaware, ZIH, and sought to exclude itsincome under § 1501(a)(8) of the IITA. The Courtconcluded that ZIH was not a regulated investmentcompany and thus its business income could beapportioned to Illinois. The Court went on to findhowever, that much of ZIH’s income was investmentincome and the Department could only tax thatincome earned from funds used by the taxpayer toacquire another business as business income.
Envirodyne Industries, Inc. et al. v. Illinois Departmentof Revenue, 02-1632 (U.S. Court of Appeals 7th Circuit01/06/04)Taxpayer sought to include a subsidiary, WisconsinSteel Company, in its unitary group to reduce itsapportionable income by the steel company’s losses.The Department objected, claiming that the entitieswhile under common ownership were not unitary. TheBankruptcy Court and District Court concluded thatthe entities were unitary and allowed the losses tooffset the income. The Circuit Court concluded thatthe taxpayer needed to do more than participate inmanagement of the steel company to include it in theunitary group. It went on to find that there was noconnection between the steel company and thefood-packing subsidiary and held that the entitieswere not unitary.
Hollinger International, Inc. v. Bower, et al., 02 L 51514(Cook County Circuit Court 01/06/04)Taxpayer retained the services of a licensed certifiedpublic accountant to compute the first and secondinstallment amounts of its Illinois taxes. The accountantused the safe harbor delineated in 35 ILCS 5/804(c),which allowed a taxpayer to base its quarterly taxinstallments on either 90% of the current year’s esti-mated tax or 100% of its taxable income from the prioryear. Although the prior year’s return was unfinishedthe accountant estimated the taxpayer’s liability forthat year and instructed the taxpayer to pay $62,500per quarter. The accountant determined that thetaxpayer had an overpayment from the prior yeargreater than the first quarterly installment amount. Asa result the taxpayer did not make the first installment
payment and paid $62,500 on the second installment.By the time the third installment was due the prioryear’s return had been completed wherein thetaxpayer realized a loss, the accountant then deter-mined that the safe harbor did not apply and calcu-lated the quarterly payment based on estimatedtaxes for the current year. An employee of the tax-payer mailed the third installment payment of taxes toan incorrect address. After the payment was retunedby the Post Office, the employee corrected his mis-take and mailed the payment to the correct addressseveral days after it was due. The Department penal-ized the taxpayer for underpayment of taxes on thefirst two installments and for late payment of the thirdinstallment. The Court determined, on administrativereview, that reasonable cause applied to the circum-stances. It found the taxpayer’s reliance on theindependent accountant reasonable and reversedthe underpayment penalties for the first two install-ments. The Court also determined that the taxpayerexercised standard business care with the late pay-ment and reversed those penalties as well.
Shakkour et al. v. Bower et al., 99 L 50548 (CookCounty Circuit Court 03/26/04)The taxpayer was a partner in a firm that developedequity-trading technology. She engaged in managingstocks and other equities from her office in New Yorkand then in Connecticut. The partnership entered intoa joint venture with Swiss Bank in late 1990. In July 1991,Swiss Bank sought unfettered control of the tradingtechnology and made an offer to buy thepartnership’s assets. The partnership sold its assets tothe Swiss Bank and distributed the sales proceeds tothe partners. The Department sought to tax the tax-payer on her share of the proceeds. The Court con-cluded that the income was nonbusiness incomebecause it was from a business liquidation; citingBlessing/White v. Zehnder, 329 Ill. App. 3d 714 (1st Dist2002). As a result the Court concluded that there wereno taxes due to Illinois from the taxpayer on theincome at issue.
Wexler et al. v. Wirtz et al., 94127, 94128, 94171 (IllinoisSupreme Court 04/01/04)Taxpayer challenged the constitutionality of PublicAct 91-38, which amended the Liquor Control Act, theState Finance Act and the School Construction Law.The Act created a single tax rate for wine manufac-tures and raised the state liquor tax, which is levied onmanufacturers and importing distributors of alcoholicbeverages. The taxpayer was an individual purchaserof alcoholic beverages and neither a manufacturernor an importing distributor of alcoholic beverages.The Circuit Court found that the Act violated the threereadings rule and the single subject clause of articleIV, section 8(d), of the Illinois Constitution of 1970. TheIllinois Supreme Court on direct appeal determined

F I S C A L Y E A R 2 0 0 3 A N N U A L R E P O R T
Illinois Department of Revnue 89
that in order to have a standing to challenge theconstitutionality of a statute one must have sustainedor be in immediate danger of sustaining a direct injuryas a result of enforcement of the challenged statute.The claimed injury must be (1) distinct and palpable;(2) fairly traceable to the defendant’s actions: and (3)substantially likely to be prevented or redressed by thegrant of the requested relief. The Court determinedthat the tax was levied on manufacturers and import-ing distributors of alcoholic beverages. As a consumerthe plaintiff was not responsible for paying or remittingany part of the challenged tax and did not havestanding to challenge the underlying tax or the Act.
Ogden Chrysler Plymouth, Inc. v. Bower, 2-03-0194 (2nd
District Appellate Court 05/07/04)The taxpayer, an automobile dealer, sold automobilesto employees and retirees of the manufacturer. Themanufacturer created an incentive program thatallowed its employees and retirees to purchaseautomobiles at a fixed price, which was lower thanthe sticker price. The dealer received the fixed pricefrom the purchaser plus a payment of 6% of the fixedprice and an additional $75 from the manufacturer.The Department sought to tax the entire amount thedealer received. The dealer sought to pay tax only onthe amount received from the purchaser. On adminis-trative review the Circuit Court agreed that the dealerwas only required to pay ROT on the amount receivedfrom the purchaser. The Appellate Court reversed,determining that the manufacturer’s payments alsoconstituted gross receipts for ROT purposes.


PUB-1 (R-12/04)Printed by authority of the State of Illinois(100 - $2.32 per copy - 12/04)