ijs.v19i2.1 vol. 19, no. 2 (2017) 201 - AJOL
15
Ife Journal of Science (2017) vol. 19, no. 2 SORPTION CHARACTERISTICS OF METHYLENE BLUE ONTO NYPA FRUITICANS LIGNIN *Ogunsile, B.O. and Bamgboye, M.O. Department of Chemistry, University of Ibadan, Ibadan, Nigeria *Corresponding author: [email protected]; Tel. +234 8055373249 th th (Received: 15 June, 2017; Accepted: 20 August, 2017) The sorption characteristics of soda lignin extracted from Nypa fruiticans for the removal of methylene blue dye from aqueous solution was investigated in this study, as an ethically sound way of utilizing this unexploited abundant natural resource. Equilibrium data were fitted to the Langmuir and Freundlich isotherm equations while the sorption dynamics were examined with the pseudo-first and second-order kinetic models. The influence of operational variables, namely, time, temperature, liquor-to-solid ratio and temperature, on the removal efficiency was determined using a second-order factorial equation. The Langmuir adsorption isotherm satisfactorily described the sorption of methylene blue dye unto the lignin matrix with a monolayer adsorption capacity of 16.67 mg/g. The sorption kinetics followed the pseudo-second-order kinetic model. The factorial equation derived reproduces the experimented data with errors less than 5%. The influence of the operational variables showed that the maximum variation in the highest uptake of methylene blue was caused by changes in concentration of methylene blue (a change of 32.7 units) while the liquor-to-solid ratio has little or no effect on the dye uptake. Keywords: adsorption, methylene blue, lignin, factorial design, isotherms, sorption kinetics ABSTRACT 201 INTRODUCTION Dye is one of the most common and important toxic and carcinogenic pollutants adversely affecting the ecosystem (Yagub et al., 2014). Effluents, especially from the textiles, paint, printing, photographic, and pigment processing industries, are discharged into water streams, thereby, increasing the biochemical oxygen demand (BOD), chemical oxygen demand (COD), and the total organic carbon (TOC) (Dos Santos, et al., 2007). These industries use various classes of dyes such as azo, acid, basic, mordants, vat, sulphur, direct and reactive dyes. Most of these dyes are water soluble and possess features that make them more vulnerable to the aquatic ecological system. For example, they easily spread around when dropped into water, even without stirring. Irrespective of how massive a water body is, a little insignificant amount of dye will eventually spread around, making the practical use of such water unhealthy for aquatic organisms and unsuitable for human consumption and other purposes. Majority of these dyes have complex aromatic molecular structures that confer greater stability on them and make them recalcitrant to biodegradation (Przysta 2012; Yagub et al., 2014; Jabbar et al., 2014). The situation is further compounded and fuelled by the fact that most of the afore-mentioned dye-producing industries handle a large amount of water in their operational activities and discharge the same into the environment, especially in developing countries where no stringent, restrictive or punitive laws are enforced. Methylene blue (MB) is one of the most widely used cationic dyes in the textile, leather and printing industries. It is also valuable in medicine for clinical purposes (Ginimuge and Jyothi, 2010; Manghelli, et al., 2015). Despite its applications in industries and medicine, MB dye has been reported to have adverse effects on the central nervous system and has also been associated with inflammation, anal diseases, serotonin, and other forms of toxicity, such as cardiac arrhythmias, coronary vasoconstriction, decreased cardiac output, renal and mesenteric blood flow, increased pulmonary vascular pressure, pulmonary vascular resistance, and gas exchange deterioration (Vutskits, et al., 2008; Bleicher et al., 2009; Top et al., 2014; Xiang and Feng 2016). It is considered to be potentially harmful to the aquatic organisms (Álvarez-Torrellas et al., 2015). This, therefore, necessitates its removal from aqueous systems and the environments. Out of the numerous methods of dye treatment, adsorption stands out as one of the most effective https://dx.doi.org/10.4314/ijs.v19i2.1
Transcript of ijs.v19i2.1 vol. 19, no. 2 (2017) 201 - AJOL

Ife Journal of Science (2017)vol. 19, no. 2
SORPTION CHARACTERISTICS OF METHYLENE BLUE ONTO NYPA FRUITICANS LIGNIN
*Ogunsile, B.O. and Bamgboye, M.O.Department of Chemistry, University of Ibadan, Ibadan, Nigeria
*Corresponding author: [email protected]; Tel. +234 8055373249th th(Received: 15 June, 2017; Accepted: 20 August, 2017)
The sorption characteristics of soda lignin extracted from Nypa fruiticans for the removal of methylene blue dye from aqueous solution was investigated in this study, as an ethically sound way of utilizing this unexploited abundant natural resource. Equilibrium data were fitted to the Langmuir and Freundlich isotherm equations while the sorption dynamics were examined with the pseudo-first and second-order kinetic models. The influence of operational variables, namely, time, temperature, liquor-to-solid ratio and temperature, on the removal efficiency was determined using a second-order factorial equation. The Langmuir adsorption isotherm satisfactorily described the sorption of methylene blue dye unto the lignin matrix with a monolayer adsorption capacity of 16.67 mg/g. The sorption kinetics followed the pseudo-second-order kinetic model. The factorial equation derived reproduces the experimented data with errors less than 5%. The influence of the operational variables showed that the maximum variation in the highest uptake of methylene blue was caused by changes in concentration of methylene blue (a change of 32.7 units) while the liquor-to-solid ratio has little or no effect on the dye uptake.
Keywords: adsorption, methylene blue, lignin, factorial design, isotherms, sorption kinetics
ABSTRACT
201
INTRODUCTIONDye is one of the most common and important toxic and carcinogenic pollutants adversely affecting the ecosystem (Yagub et al., 2014). Effluents, especially from the textiles, paint, printing, photographic, and pigment processing industries, are discharged into water streams, thereby, increasing the biochemical oxygen demand (BOD), chemical oxygen demand (COD), and the total organic carbon (TOC) (Dos Santos, et al., 2007). These industries use various classes of dyes such as azo, acid, basic, mordants, vat, sulphur, direct and reactive dyes. Most of these dyes are water soluble and possess features that make them more vulnerable to the aquatic ecological system. For example, they easily spread around when dropped into water, even without stirring. Irrespective of how massive a water body is, a little insignificant amount of dye will eventually spread around, making the practical use of such water unhealthy for aquatic organisms and unsuitable for human consumption and other purposes. Majority of these dyes have complex aromatic molecular structures that confer greater stability on them and make them recalcitrant to biodegradation (Przysta 2012; Yagub et al., 2014; Jabbar et al., 2014). The situation is further compounded and fuelled by the fact that most of the afore-mentioned dye-producing industries
handle a large amount of water in their operational activities and discharge the same into the environment, especially in developing countries where no stringent, restrictive or punitive laws are enforced.
Methylene blue (MB) is one of the most widely used cationic dyes in the textile, leather and printing industries. It is also valuable in medicine for clinical purposes (Ginimuge and Jyothi, 2010; Manghelli, et al., 2015). Despite its applications in industries and medicine, MB dye has been reported to have adverse effects on the central nervous system and has also been associated with inflammation, anal diseases, serotonin, and other forms of toxicity, such as cardiac arrhythmias, coronary vasoconstriction, decreased cardiac output, renal and mesenteric blood flow, increased pulmonary vascular pressure, pulmonary vascular resistance, and gas exchange deterioration (Vutskits, et al., 2008; Bleicher et al., 2009; Top et al., 2014; Xiang and Feng 2016). It is considered to be potentially harmful to the aquatic organisms (Álvarez-Torrellas et al., 2015). This, therefore, necessitates its removal from aqueous systems and the environments.
Out of the numerous methods of dye treatment, adsorption stands out as one of the most effective
https://dx.doi.org/10.4314/ijs.v19i2.1
202
in terms of simplicity, effectiveness and ease of operation (Vijayaraghavan and Balasubramanian, 2015; El-Kafrawy et al., 2017). Adsorbent, such as activated carbon, is highly efficient in dye removal but is largely imported, expensive and difficult to regenerate. Plants, agricultural biomass and by-products of no economic value, such as plant shells, nuts, peels, leaves, tree barks, straws, bagasse, seeds, peat, etc., are being employed in place of the high cost activated carbon (Seow and Lim, 2016; 2016). In fact, most recent studies focus on the utilization of cellulose-derived adsorbents for the remediation of dyes from solution.
Lignin, a by-product of the pulp and paper industry, is an abundant natural resource that can be used as biosorbent for the removal of dyes (Suhas et al., 2007; Albadarin et al., 2017; Rosas et al., 2017). Nypa fruiticans has some appreciable quantity of lignin which can be exploited as biosorbent for the remediation of pollutants (Ogunsile and Abayomi, 2014). The plant grows massively along the coastal areas of Akwa Ibom State in Nigeria and is highly invading, threatening the Nigerian coastal vegetation, and destroying mangroves and aquatic lives. A possible use of this plant is the exploitation of its lignin content as biosorbent for the removal of dyes from aqueous solution. The utilization of lignin for the removal of MB from aqueous solution has been reported in the literature. Research in these series include the adsorption of MB using modified lignin from sugar cane bagasse (Consolin et al., 2007), Tunisian activated lignin (Fu et al 2013), lignin-based activated carbon from black liquor lignin (Kriaa et al., 2011), and alkali extracted lignin from the residues of corn stalks used in butanol production (Feng et al., 2014). However, little or no work has been done with respect to the modeling and optimization of process variables using lignin as adsorbent for the removal of MB. In this study, lignin extracted from Nypa fruitican plant was utilized for the removal of methylene blue (MB) dye from aqueous solution. Isotherm and kinetics study were determined with respect to the dye up-take, while the effects of time, temperature, concentration and liquor-to-solid (LS) ratio were optimized using a central composite factorial design.
De Gisi et al.,
MATERIAL AND METHODSPreparation of AdsorbentNypa fruitcans leaves were collected at Oron Beach in Oron Local Government Area of Akwa Ibom State, Nigeria. The leaves were cut into chips of about 2 by 2 cm, washed and sun - dried prior to pulping. The cooking of the leaves was done in an autoclave digester. About 400 g of the leaves were placed in the inner jacket of the digester with 4 litres of 8 % NaOH solution. The digester was
oheated to a temperature of 120 C and a pressure of about 40 bar. The pulping was maintained at these conditions for 2 hours. The black liquor was separated from the pulp by filtration after the cooking process. Soda lignin was precipitated out at a pH of 2-3 by the addition of 72% sulphuric acid. The precipitated lignin was then filtered and washed. The lignin extracted was dried in an oven
oat 60 C and then stored in a plastic container before it was used.
Adsorption studiesBatch adsorption studies were conducted on the soda lignin using 50 ml of 100 mg/L solution of methylene blue in polyethylene bottles. The mixture was shaken for a specified period of time and then decanted. The initial and residual dye content was determined spectrophotometrically. The percentage sorption R was estimated as:e
(1)
While the sorption capacity was calculated as follows:
(2)
where q (mg/g) is the equilibrium adsorption e
capacity, C (mg/L) and C (mg/L) are the initial o e
and final adsorbate concentration in solution after adsorption respectively; M (g) is the mass of adsorbent used and V (litres) is the volume of the solution. Each experiment was carried out in duplicates.
Effect of Adsorbent dose on adsorptionDifferent masses of the adsorbent dose, from 0.2 g to 1.0 g (0.2 g, 0.4 g, 0.6 g, 0.8 g, 1.0 g), were added to 50 ml solution of 100 mg/L MB. The mixture was agitated for 60 minutes, decanted and the residual MB solution was analyzed using a visible
Ogunsile and Bamgboye: Sorption Characteristics of Methylene Blue

203
spectrophotometer. Each experiment was carried out in duplicate.
Effect of Contact Time on Adsorption0.25 g of lignin was treated with 50 ml of 100 mg/l solution of dye and agitated at the time intervals of 2, 5, 10, 20, 30, 60 and 120 minutes. The solution was decanted and the residual dye concentration was determined using the visible spectrophotometer. Each experiment was carried out in duplicate.
Effect of Initial ConcentrationFixed lignin dose (0.2 g) was added to 50 ml of MB solution in an amber bottle at natural pH. The mixture was agitated at different time intervals (2, 5, 10, 20, 30, 60 and 180 minutes). The initial concentrations of dye solution tested were 10, 20, and 40 mg/L
Effect of Temperature0.25 g of lignin was treated with 50 ml of 100 mg/l solution of the dye. The experiment was performed at different temperatures, 25 °C, 40 °C and 55 °C, respectively, for a period of 60 minutes. The solution was thereafter decanted and the residual dye concentration determined with a visible spectrophotometer.
Adsorption Isotherm Model The Langmuir and Freundlich adsorption isotherm models were used in the study. The Langmuir isotherm is based on the assumption that adsorption does not proceed beyond monolayer coverage, all sites available on the adsorbent surface are equivalent and the surface is perfectly uniform. It also assumes that there is no interaction between adjacent adsorbed molecules (Langmuir, 1916). Thus,
(3)where b, is the adsorption equilibrium constant (L
-1mg ) that is related to the apparent energy of adsorption, q is the quantity of adsorbate m
required to form a monolayer on unit mass of -1
adsorbent (mg g ) and q is the amount adsorbed e-1
on unit mass of the adsorbent (mg g ) when the -1
equilibrium concentration is C (mg L ). The e
equation can be linearized thus,
(4)
A plot of C /q versus C will give a straight line e e e
from where the monolayer adsorption capacity q m
and the adsorption equilibrium constant b can be calculated from the slope and intercept, respectively.
Freundlich equation is an empirical equation based on adsorption on a heterogeneous surface (Freundlich, 1906). The Freundlich isotherm is expressed as:
(5)where q is the amount of dye per unit mass of e
adsorbent and C is the equilibrium concentration e
in mg/l.To simplify the equation, it was linearized thus:
(6)
The Freundlich isotherm coefficients were determined by plotting log q against log C . The e e
slope 1/n indicates the adsorption intensity or surface heterogeneity while the constant K is a f
measure of the adsorption capacity.
Adsorption DynamicsThe mechanism of the adsorption of the dye can be explained using pseudo first- and second-order kinetic models.Pseudo first-order kineticsThe non-linear form of pseudo first-order equation (Lagergren, 1898) is given by:
(7)where q and q are the amounts of dyes e t
adsorbed at equilibrium time and any instant of time (t) respectively. K is the rate constant. The ad
integrated rate law then becomes:
(8)
A plot of log (q - q ) against t gives a straight line e t
from which the adsorption rate constant k can ad
be computed.
Second order kinetics Applicability of the second order kinetics (Ho and McKay, 1999) is tested with the rate equation:
(9)
Ogunsile and Bamgboye: Sorption Characteristics of Methylene Blue

204
where k is the second order rate constant. 2
From the boundary conditions t = 0 to t = t and q t= 0 to q = q , the integrated rate law becomes t t
(10)
This can be rewritten as:
(11)
The plot of t/q versus t gives a linear relationship t2
of slope 1/q and intercept, 1/( k q ).e 2 e
Since t tends to zero, the initial sorption rate h is express as:
(12)Then equation (11) becomes:
(13)
The Central Composite DesignIn order to quantify the effects of some of the operational variables, namely, time, temperature, liquor-to-solid (LS) ratio and the concentration of the MB dye, some of the experimental data were fitted to the following first order polynomial regression equation, with variables at two levels
4(2 ) (Aknazarova, 1982; Ogunsile and German, 2010).
(14)
The response variable Y is the amount (%) of MB dye adsorbed. The parameters X , X , X and X 1 2 3 4
r e p re sen t the i nde penden t va r i ab l e s corresponding to time (10 to 50 minutes),
otemperature (25 to 55 C), LS ratio (25 to 75 ml) and concentration of the MB (10 to 40 ppm), respectively. The values of the independent variables were normalized from –1 to +1 by using
the equation:
(15)
Where:is the normalized value of time, temperature,
LS r a t i o and concen t r a t i on o f MBis the absolute experimental value of the
variable. is the mean of all the experimental values for
the variable in questionand are the maximum and minimum
values respectively of such a variable.
The central point of the design corresponds to the following reaction conditions: Time = 30 minutes
oTemperature = 40 CLS ratio = 50 mlConcentration of the MB dye = 25 ppmAll normalized independent variables for the central points of the design are designated zero. Influences of the individual and second order interaction were evaluated over the response surface of the independent variables.
RESULTS AND DISCUSSION Effect of contact time on adsorption. The variation in MB dye removal with time at varying adsorbent dose is shown in figure 1. The dye uptake increases with time. There was a rapid rate of adsorption in the 20-30 minutes of adsorption, especially at a lower lignin dose (0.2 g and 0.4 g), followed by a gradual increase as equilibrium is approached. However, at a high adsorbent dose (0.6-1.0 g), the rate of MB uptake was gradual at the commencement and remained constant throughout the duration of the adsorption. A total of about 60-120 minutes was required to reach an equilibrium which is an indication of a good uptake of MB by the lignin adsorbent.
Ogunsile and Bamgboye: Sorption Characteristics of Methylene Blue

205
The percentage MB removed increases from 91. 3 to 96.82 % when the lignin mass was increased from 0.2 g to 1.0 g. However, sorption capacity decreases with increase in lignin dose. For instance, with an increase in the initial lignin dose from 0.2 g to 1.0 g, the sorption capacity decrease from 22.8 to 4.8 mg/g .This has been attributed to a partial aggregation of adsorption sites at high
sorbent dosage, resulting in a decrease in total active surface of the lignin particles available for dye sorption (Cordero et al., 2004). Lower lignin dose will be more advantageous, especially where high sorption capacity is required and when the objective of the adsorption process is to minimize the amount of adsorbent used.
0 20 40 60 80 100 1200
5
10
15
20
25
So
rptio
nca
pa
city,
qe
(mg
/g)
Time
0.2g
0.4g
0.6g
0.8g
1.0g
Figure 1: MB uptake with time by soda lignin at different adsorbent dose
Effect of lignin dosageThe variation of sorption capacity with varying adsorbent dose is an important parameter in the sorption process, indicating how the sorbate interacts with the sorbent, thus, providing information for optimization and design purposes. The variation of the sorption capacity
and percent MB removal with respect to the lignin dose is shown in figure 2. The removal efficiency of the MB increases with an increase in the amount of lignin. An increase in the adsorbent dose implies an increase in the adsorption site for a fixed concentration of solute; hence, the percentage of dye removal increases.
Figure 2: Variation of Sorption capacity and removal efficiency with lignin dose
Ogunsile and Bamgboye: Sorption Characteristics of Methylene Blue
206
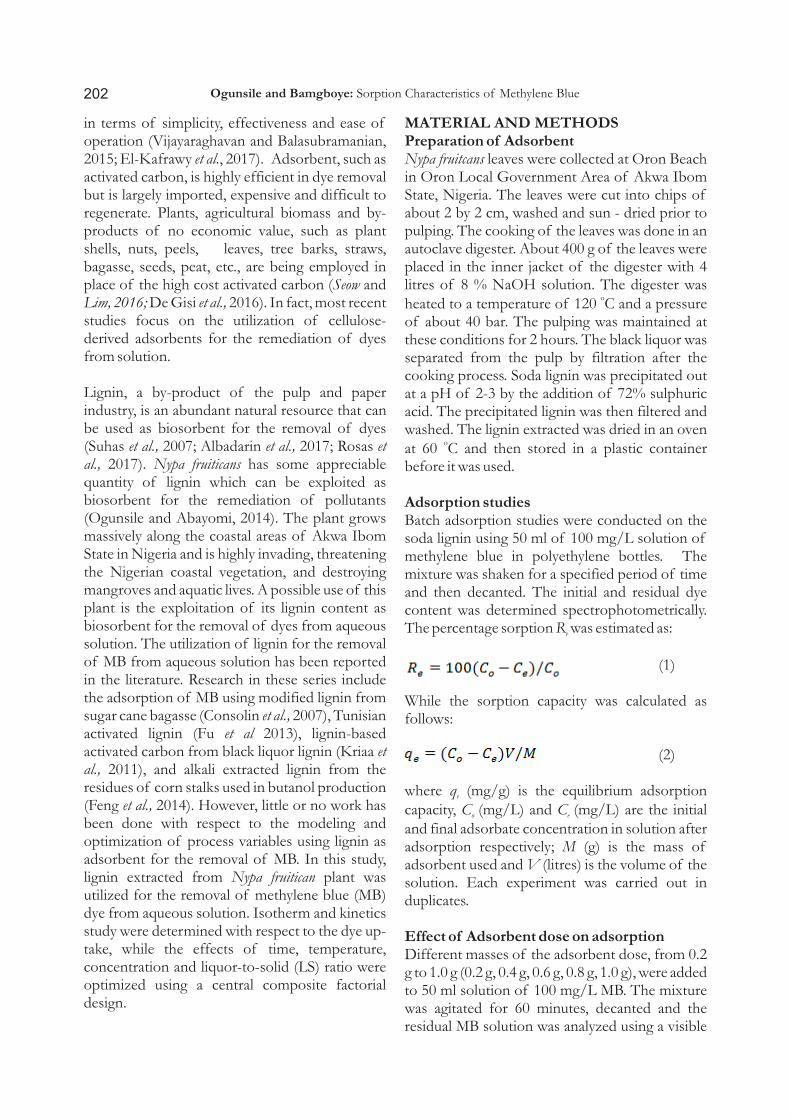
Effect of initial concentration of MBIt was observed that the percentage dye adsorbed (R ) increased with an increse in the initial e
concentration of dye. The percentage dye adsorbed increases from 62.5 % to 91.3 % when the initial concentration was increased from 10 to 40 ppm. A similar trend was also observed with the adsorption capacity q . This has been attributed t
to the number of available (or exchangeable) sites
on the biosorbent coupled with the adsorbate-to-biosorbent ratio (Kavak, 2009; Man et al., 2112). Obviously, at a fixed adsorbent dosage, most of the available exchangeble sites are already occupied with an optimum dye molecule at an initial dye concentration. However, as the dye-to-lignin ratio was increased, the available exchangeable sites in the lignin become saturated, resulting in a decrease in the percentage adsorbed.
0 20 40 60 80 100 120
0
20
40
60
80
100
Re
(%)
Time (min.)
10 ppm
20 ppm
40 ppm
Adsorption IsothermAdsorption isotherm provides the most appropriate relationship between the sorbate and the sorbents, thus, it is a necessary tool in exploring the profile of a novel adsorbent. Experimental data obtained from the sorption of MB onto the lignin adsorbent were modeled using the Langmuir and Freundlich isotherms at varying adsorbent doses. The estimated isotherm parameters are summarized in table 1. The Langmuir adsorption isotherm plots are shown in figure 4, which satisfactorily described the sorption of methylene blue dye from aqueous solutions unto the lignin gel. The high values of
2the correlation coefficients (R ) indicated goodness-of-fits of the Langmuir isotherm. This suggests the formation of a single layer on the lignin surface and an indication of finite adsorption capacity and energetically equivalent sites (Hubbe, et al., 2011). As observed from table
1, the sorption capacity q decreases from 16.67 m
mg/g to 4.13 mg/g while the removal efficiency R e
and adsorption equilibrium constant b increases from 90.80 % to 96 % and 3.53 to 16.13 respectively, with an increase in lignin dose. The decrease in the sorption capacity, with an increasing adsorbent dose has been attributed to a split in the concentration gradient between the amount solute in solution and the amount of solute in the surface of the sorbent (Vadivelan and Kumar, 2005). However, one obvious reason for this observation is the inverse relationship between sorption capacity q and adsorbent mass e
M, according to equation (2). Thus, the amount of MB dye adsorbed onto unit weight of adsorbent decreases with an increase in adsorbent mass. The calculated values of the Langmuir dimensionless constant separation factor R ranged from 0 to 1 L
which is a measure of favourable adsorption of MB dye onto the lignin adsorbent.
Figure 3: Time course of MB adsorption at different initial dye concentration
Ogunsile and Bamgboye: Sorption Characteristics of Methylene Blue

207
For the Freundlich isotherm, the value of K and n f
as estimated from the intercept and slope of the plot of ln q versus ln C are summarized in table 1. e e
The K value decreases with an increase in lignin f
dose, indicating a decrease in dye - adsorbent
interaction. This means that there is a less amount of dye in solution to interact with the increased amount of lignin. The value of n > 1 at every adsorbent dosage is an indication of a well distributed lignin site.
Table 1: Langmuir and Freundlich parameters for the sorption of MB unto soda lignin
Ms Langmuir Freundlich Re qm k R2 RL n Kf R2
0.2 g 90.08 16.67 3.53 0.996 0.028 5.00 22.58 0.9710.4 g 91.82 8.77 4.75 0.998 0.021 5.81 11.17 0.980.6 g 92.28 5.99 5.39 0.998 0.018 6.25 7.40 0.9830.8 g 93.33 4.78 7.74 0.998 0.013 7.87 5.56 0.9731.0 g 95.99 4.13 16.13 0.998 0.006 12.05 4.44 0.962
0.5 1.0 1.5 2.0 2.5 3.00.025
0.050
0.075
0.100
0.125
0.150
0.175
R2=0.997
0.2g
Ce
Ce/qe
0.5 1.0 1.5 2.0 2.5 3.00.05
0.10
0.15
0.20
0.25
Ce
Ce/qe
R2=0.998
0.4g
0.5 1.0 1.5 2.0 2.5
0.1
0.2
0.3
0.4
Ce
Ce/qe
R2=0.6
0.6g
0.5 1.0 1.5 2.0 2.50.05
0.10
0.15
0.20
0.25
0.30
0.35
0.40
0.45
Ce
Ce/qe
R2=0.998
0.8g
0.00 0.25 0.50 0.75 1.00 1.25 1.50 1.750.0
0.1
0.2
0.3
0.4
Ce
Ce/qe
R2=0.998
1.0g
Figure 4. Langmuir isotherm plots for the biosorption of MB unto lignin at different adsorbent dosages
Ogunsile and Bamgboye: Sorption Characteristics of Methylene Blue
208
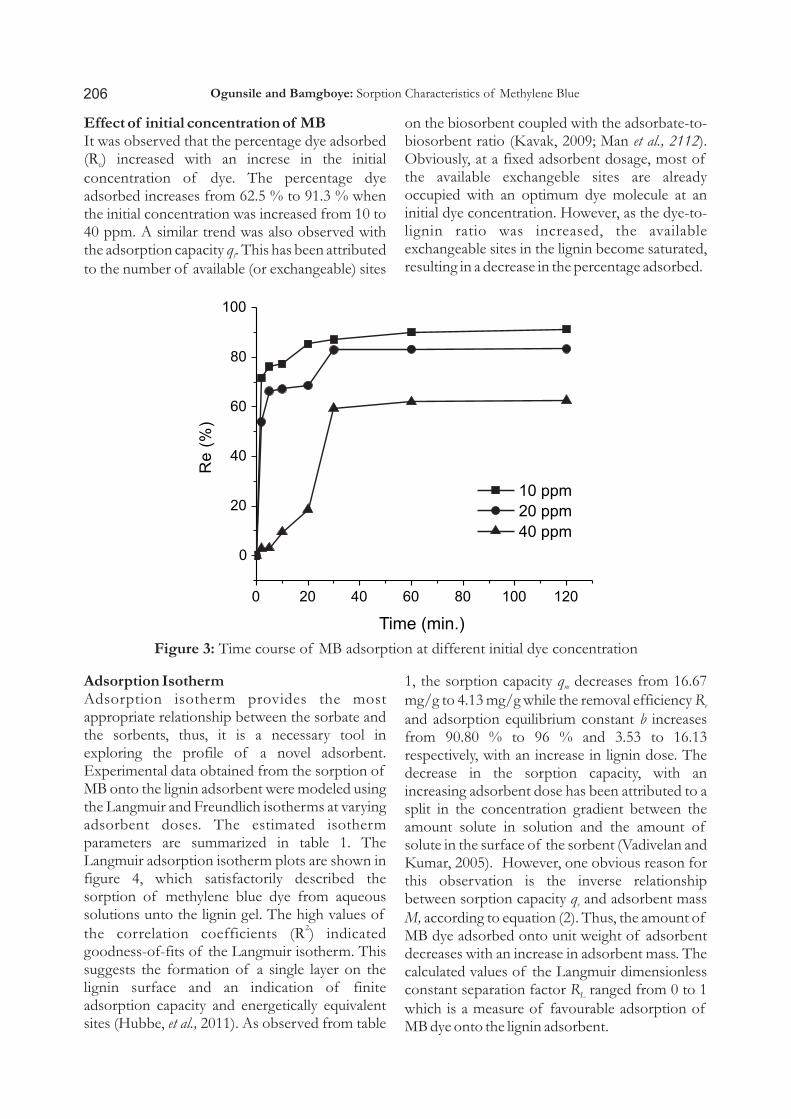
Sorption kineticsDifferent types of kinetic models have been used to study and predict sorption mechanism of adsorption processes. Experimental data obtained from the sorption of MB dye unto the lignin gel was subjected to the pseudo-first and second order kinetic models in order to elucidate the biosorption mechanism of MB unto the lignin matrix. Pseudo-first and Pseudo-second order kinetic models are commonly employed, along with other kinetic models, in understanding the uptake of sorbate unto sorbent system. The plot of ln(q -q ) versus time is show in figure 5. The e t
calculated values of the sorption capacity q , rate 1
constant k and the linear regression correlation 1, 2factor r at different adsorbent doses, are
summarized in table 2. The sorption capacity decreases with an increase in the adsorbent dosage. The rate constant also followed the same trend, except for the 0.2 g lignin dose. The relatively high values of the correlation coefficient show the applicability of the pseudo-first order kinetic model. However, the calculated values of sorption capacity were far less than the experimental values.
Table 2: Pseudo-first and modified pseudo-first-oder kinetic parameters
Ms Pseudo-first order (PFO) Modified Pseudo-first order (MPFO)
qe,1 k1 r2 qe,mpfo ƙ1 r2
0.2 g 4.85 0.047 0.979 11.05 0.044 0.985 0.4 g 2.82 0.072 0.992 6.65 0.071 0.988 0.6 g 2.48 0.071 0.879 5.67 0.069 0.87
0.8 g 1.03 0.049 0.992 2.33 0.048 0.989
1.0 g 1.29 0.046 0.997 1.86 0.044 0.965
Figure 5: Pseudo-first order plot for different initial concentration of lignin
In order to minimize the observed deviation from the experimental data, Yang and Al-Duri (2005) proposed a modified form of the pseudo-first order model. The rate constant k , was modified 1
and defined in terms of a new rate constant ƙ , 1
which was proposed as follows:
(16)
This implies that as q >q , the rate constant k is e t 1
minimum when equilibrium is attained. The modified pseudo-first order rate equation was then derived as follows:
(17)
Rearranging the above equation, we have(18)
Ogunsile and Bamgboye: Sorption Characteristics of Methylene Blue
209
Equation (18) on integration gives the modified pseudo-first order rate equation:
(19)
A plot of q /q + ln (q -q ) versus t should give a t e e t
straight line if the modified pseudo-first kinetic model is followed.
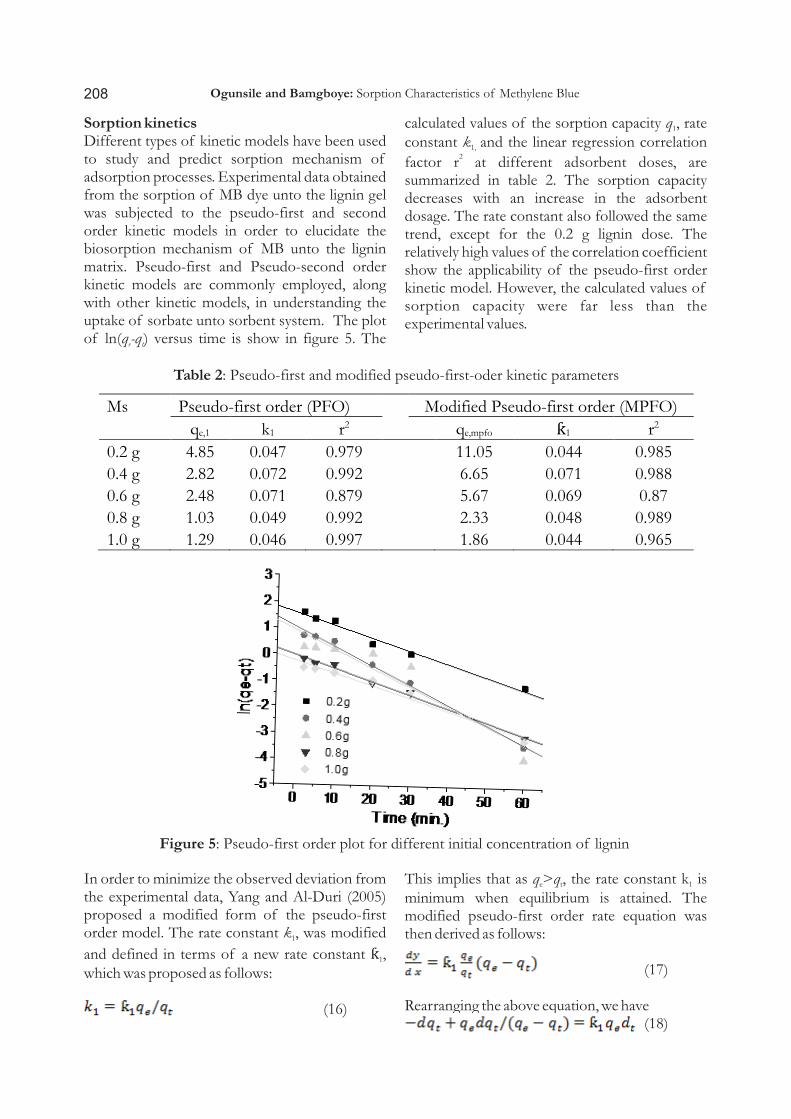
The plot of the modified pseudo-first order
kinetic is shown in figure 6. The parameters obtained from the application of the sorption data to the modified pseudo-first order equation are shown in table 2. The predicted values of the sorption capacity q for modified pseudo-first e,mpfo
model were higher than those of the pseudo-first model but lesser than the experimented value, while the values of the rate constants and the correlation coefficients remained relatively the same.
Figure 6: Modified pseudo-first order model plot for different initial concentration of lignin
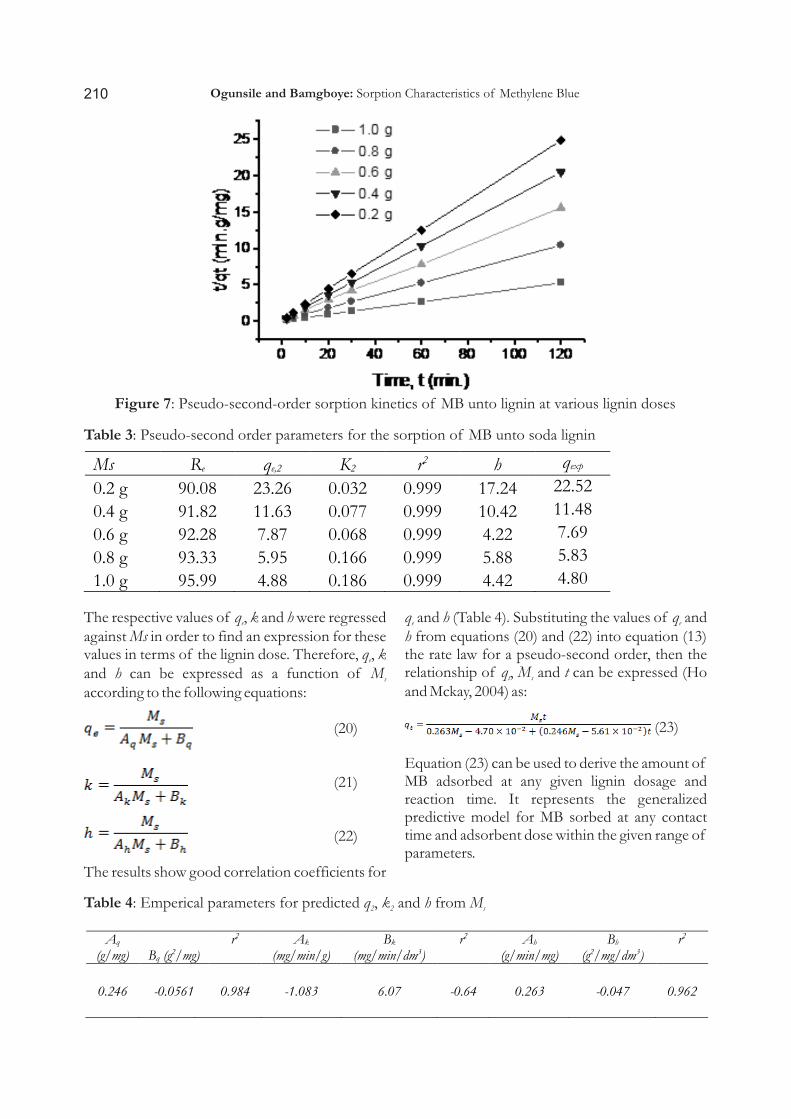
The linear plots of t/qt versus t for the pseudo-second-order model are shown in figure 7 and it revealed a highly significant linear relationship
2with correlation coefficients r of 0.999 greater than the pseudo first – order and the modified- pseudo first – order kinetic models. The pseudo second – order kinetic parameters are summarized in table 3. The estimated values of the predicted
sorption capacity q were similar to the e2
experimented parameter q . This revealed that the exp
mechanism of sorption of MB unto the lignin followed the pseudo second – order-kinetic, suggesting that the rate limiting step is a chemical biosorption process between the MB dye and the functional groups of the lignin matrix.
Ogunsile and Bamgboye: Sorption Characteristics of Methylene Blue
210
The respective values of q , k and h were regressed e
against Ms in order to find an expression for these values in terms of the lignin dose. Therefore, q , k e
and h can be expressed as a function of M saccording to the following equations:
(20)
(21)
(22)
The results show good correlation coefficients for
q and h (Table 4). Substituting the values of q and e e
h from equations (20) and (22) into equation (13) the rate law for a pseudo-second order, then the relationship of q , M and t can be expressed (Ho t s
and Mckay, 2004) as:
(23)
Equation (23) can be used to derive the amount of MB adsorbed at any given lignin dosage and reaction time. It represents the generalized predictive model for MB sorbed at any contact time and adsorbent dose within the given range of parameters.
Figure 7: Pseudo-second-order sorption kinetics of MB unto lignin at various lignin doses
Table 3: Pseudo-second order parameters for the sorption of MB unto soda lignin
Ms Re qe,2 K2 r2 h qexp
0.2 g 90.08 23.26 0.032 0.999 17.24 22.52
0.4 g 91.82 11.63 0.077 0.999 10.42 11.48
0.6 g 92.28 7.87 0.068 0.999 4.22 7.69
0.8 g 93.33 5.95 0.166 0.999 5.88 5.83
1.0 g 95.99 4.88 0.186 0.999 4.42 4.80
Aq
(g/mg) Bq (g2/mg)r2
Ak
(mg/min/g)
Bk
(mg/min/dm3)
r2
Ah
(g/min/mg)
Bh
(g2/mg/dm3)
r2
0.246 -0.0561 0.984 -1.083 6.07 -0.64 0.263 -0.047 0.962
Table 4: Emperical parameters for predicted q , k and h from M2 2 s
Ogunsile and Bamgboye: Sorption Characteristics of Methylene Blue

211
The Central Composite Factorial Design4The 2 factorial experimental design and the
percentage MB adsorbed are presented in table 5. Experiments 1-16 of table 5 allowed the calculation of different parameters of the regression equation a and a . Their significance at i ij
95 % confidence level was checked by submitting them to a T – test, using the experimental error estimated from the replication at the central point of the design, i.e., experiments 17, 18 and 19.
The amount of MB adsorbed was related to the operational variables by the mathematical equation:
(24)
The coefficients of the model equation and the statistical parameters establishing its validity are
2summarized in table 6. The values of R, R and 2adjusted R were 0.982, 0.964 and 0.919
respectively. The different factor values of a , a , a , o 1 2
…, represent the fitting parameters by which the effects of each of the independent variables on the dependent variable (experimental results) can be determined and compared (Ligero et al., 2007). All calculations were performed with a statistics module of SPSS. Values calculated from the polynomial equation above were plotted with the experimental values for the different response variables as shown in figure 8. The results show a good correlation between the experimental values and those predicted by the model equation with correlation
2factor r of 0.95
Table 5: Experimental design and result for percentage MB adsorbed
Experiment No
Time X1
Tempt X2
LS
X3
ConcnX4
Removal efficiency (%)
1 1
1
1
1
59.59
2 1
1
1
-1
93.87
3 1
1
-1
1
52.83
4 1
1
-1
-1
91.98
5 1
-1
1
1
62.49
6 1
-1
1
-1
91.3
7 1
-1
-1
1
59.48
8 1
-1
-1
-1
88.04
9 -1
1
1
1
51.14
10 -1
1
1
-1
82.14
11 -1
1
-1
1
42.63
12 -1
1
-1
-1
80.47
13 -1
-1
1
1
12.89
14 -1
-1
1
-1
76.38
15 -1
-1
-1
1
24.83
16 -1
-1
-1
-1
75.47
17 0 0 0 0 65.17
18 0 0 0 0 65.53
19 0 0 0 0 64.88
Ogunsile and Bamgboye: Sorption Characteristics of Methylene Blue

212
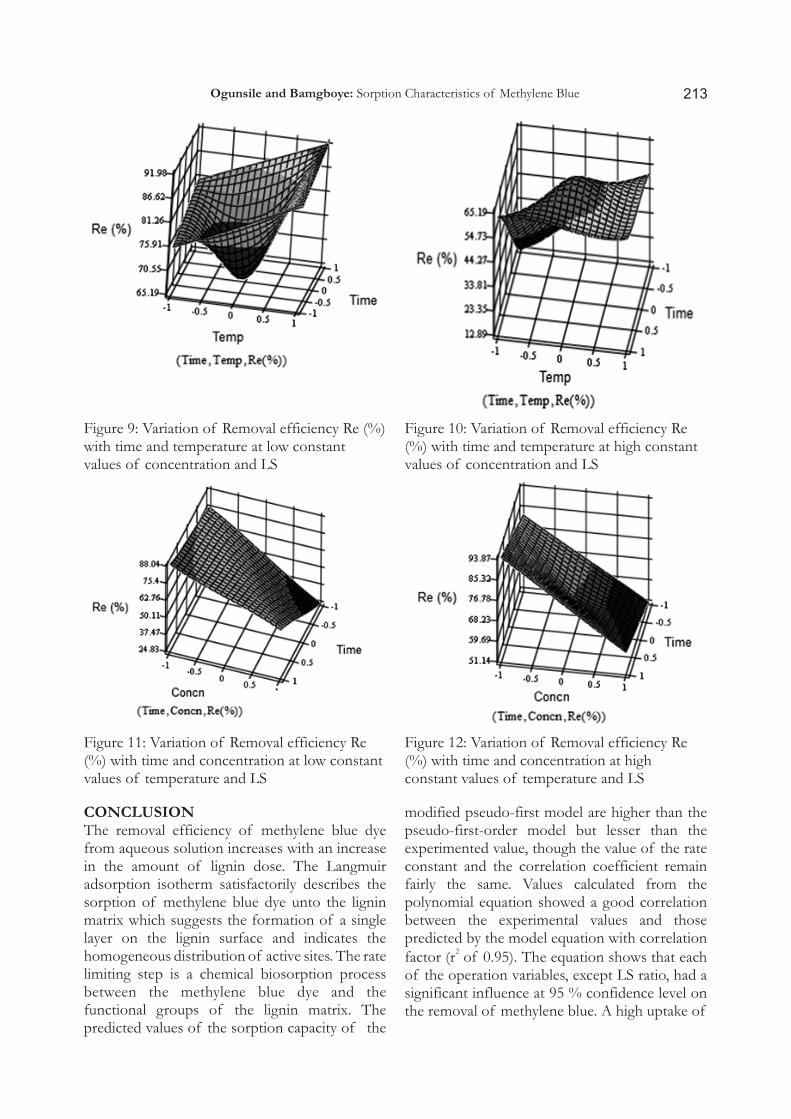
Equation 24 allows the estimation of the variation in the uptake of MB with changes in each independent variable over the range considered while the other three remain constant. Non-significant parameters were dropped to obtain simpler equations. The equation shows that each of the operation variables, except LS ratio, had a significant influence at 95 % confidence level on
the removal of MB as apparent from the values of a , a a and a . It was also apparent that there were 1 2, 3 4
significant interactions between time (X ) and 1
temperature (X ) on one hand (as depicted in 2
figures 9 and 10), and time (X ) and concentration 1
(X ) on the other hand (as shown in figures 11 and 4
12 respectively. Figures 9 and 10 depict the MB removal according to the variation in time and temperature when LS and concentration values remain constant. Figures 11 and 12 represent the behavior of the MB adsorbed, with respect to variations in time and concentration at a low and high constant value of temperature and LS respectively. The lowest predictable amount of MB adsorbed according to equation 3, was 24.48 % (compared to experimental value of 12.89). This value was obtained at a high concentration of MB (+1) and low values of time and temperature (-1 for all), but LS has no significant effect. This amount can be increased close to 70 % by operating at a low concentration (-1) of MB and other variables (experiments 15 and 16). Indeed, a high uptake of MB was associated with a low value (-1) of initial concentration (experiments 2, 4, 6, 8, 10 and 12) while a low uptake of MB was associated with a high value (+1) of initial concentration of MB (experiments 1, 3, 5, 7, 9, 11, 13 and 15). This may account for the low monolayer sorption capacity q obtained in table 1: m
it revealed that the soda lignin had little affinity for MB uptake.
The highest predictable uptake of MB was about 91 % which was close to the experimented value of 93.87 % and obtained at a low value of concentration and high values of time and temperature. The maximum variation in the highest uptake of MB was caused by changes in concentration (a change of 32.7 units). This was reflected by the large negative slopes observed in figures 11 and 12. The next variation in the highest uptake of MB was caused by changes in time (a change of 16.98 units), followed by changes in temperature (a change of 0.74 unit) while LS has no effect.
Table 6: Signicative regression parameter
Factors Removal efficiency, Re (%)
a0 65.32 a1
9.6
a2
4.0
a3
(0.88)
a4
-19.61
a12
-4.37
a13
(0.99)
a14
3.261
a23
(1.47)
a24 (1.83)
a34 (-0.087) Non significant parameters are in parentheses
Figure 8: Correlation between experimented and predicted values of removal efficiency Re, (%)
Ogunsile and Bamgboye: Sorption Characteristics of Methylene Blue
213
CONCLUSIONThe removal efficiency of methylene blue dye from aqueous solution increases with an increase in the amount of lignin dose. The Langmuir adsorption isotherm satisfactorily describes the sorption of methylene blue dye unto the lignin matrix which suggests the formation of a single layer on the lignin surface and indicates the homogeneous distribution of active sites. The rate limiting step is a chemical biosorption process between the methylene blue dye and the functional groups of the lignin matrix. The predicted values of the sorption capacity of the
modified pseudo-first model are higher than the pseudo-first-order model but lesser than the experimented value, though the value of the rate constant and the correlation coefficient remain fairly the same. Values calculated from the polynomial equation showed a good correlation between the experimental values and those predicted by the model equation with correlation
2factor (r of 0.95). The equation shows that each of the operation variables, except LS ratio, had a significant influence at 95 % confidence level on the removal of methylene blue. A high uptake of
Figure 9: Variation of Removal efficiency Re (%) with time and temperature at low constant values of concentration and LS
Figure 10: Variation of Removal efficiency Re (%) with time and temperature at high constant values of concentration and LS
Figure 11: Variation of Removal efficiency Re (%) with time and concentration at low constant values of temperature and LS
Figure 12: Variation of Removal efficiency Re (%) with time and concentration at high constant values of temperature and LS
Ogunsile and Bamgboye: Sorption Characteristics of Methylene Blue
214
MB is associated with low values of concentration while a low uptake of methylene blue was associated with high concentration of MB.
REFERENCESAknazarova, S. and Kafarov, V. 1982. Experiment
Optimization in Chemistry and Chemical Engineering. Mir Publishers, Moscow. 312pp
Albadarin, A. B., Collins, M. N., Naushad, M.,
Shirazian, S., Gavin Walker, G. and Mangwandi, C. 2017. Activated lignin-chitosan extruded blends for efficient adsorption of methylene blue. Chemical Engineering Journal 307, 264–272.
Álvarez-Torrellas, S., García-Loverab, R , Rodrígueza, A. and Garcíaa, J. 2015 Removal of methylene blue by adsorption on mesoporous carbon from peach stones. Chem Eng. Trans. 43, 1963-1968
Bleicher, R. J., Kloth, D. D., Robinson, D. and Axelrod P. 2009. Inflammatory cutaneous adverse effects of methylene blue dye injection for lymphatic mapping/sentinel lymphadenectomy. Journal of surgical oncology. 99(6), 356–360.
Consolin F. N., Venancio, E. C., Barriquello, M. F., Hechenleitner, A. A. W. and Pineda, E. A. G. 2007. Methylene blue adsorption onto modified lignin from sugar cane bagasse. Eclética Química. 32(4), 63-70.
Cordero, B., Loderio, P., Herrero, R. and de-Vicente, M.E.S. 2004. Biosorption of cadmium by Fucus spiralis, Environ. Chem. 1, 180–187.
Dos Santos, A. B., Cervantes, F. J., and van Lier, J. B. 2007. Review paper on current technologies for decolourisation of textile wastewaters: Perspectives for anaerobic biotechnology. Bio-resource Technology 98(12), 2369-2385
El-Kafrawy, A. F., El-Saeed, S.M., Farag, R.K. El-Saied, H. A. and Abdel-Raouf, M.E. 2017. Adsorbents based on natural polymers for removal of some heavy metals from aqueous
De Gisi, S., Lofrano, G., Grassi, M. and Notarnicola, M. 2016. Characteristics and adsorption capacities of low-cost sorbents for wastewater treatment: A review of sustainable materials and technologies 9, 10–40
solution. Egyptian J. of Petrol. 26(1), 23-32.Feng, Q., Cheng, H., Li, J., Wang, P. and Xie, Y.
2014. Adsorption Behavior of Basic Dye from Aqueous Solution onto Alkali Extracted Lignin. BioResources 9(2), 3602-3612.
Freundlich, H. M. F., 1906. Over the adsorption in solution. J. Phys. Chem. 57, 385.
Fu, K.F., Yue, Q.Y., Gao, B., Sun, Y.Y. and Zhu, L.J. 2013. Preparation, characterization and application of lignin-based activated carbon from black liquor lignin by steam activation. Chem. Eng. J. 228 (15), 1074-1082.
Ginimuge, P. R. and Jyothi, S. D. 2010. Methylene Blue: Revisited. J. Anaesthesiol Clin. Pharmacol. 26(4): 517–520.
Ho, Y.S. and McKay, G. 1999.Pseudo-second order model for sorption processes. Process Biochemistry. 34, 451 – 465.
Ho, Y.S. and McKay, G. 2004. Sorption of copper(II) from aqueous solution by peat. Water, Air, and Soil Pollution. 158, 77–97.
Hubbe, M. A., Hasan, S.H. and Ducoste, J. J. 2011. Cellulose substrates for removal of pollutants from aqueous systems: A review. 1. Metals. Bioresources. 6(2), 2161 – 2287.
Jabbar, A. Z., Hadi, A. G. and Sami, F. 2014. Removal of Azo Dye from Aqueous Solutions using Chitosan. Oriental J. Chem. 30(2), 571-575.
Kavak, D. 2009. Removal of boron from aqueous solutions by batch adsorption on calcined alunite using experimental design. Hazard.Mater. 163(1), 308–314.
Kriaa,A., Hamdi,N. and Srasra,E. 2011. Adsorption studies of methylene blue dye on tunisian activated lignin. Russ. J. Phys. Chem. A. 85(2), 279-287.
Lagergren, S., 1898. About the Theory of So-Called Adsorption of Soluble Substances. Kungliga Svenska Vetenskapsakademiens. Handlingar Band. 24(4), 1.
Langmuir, I., 1916. The constitution and fundamental properties of solids and liquids, J. Am. Chem. Soc. 38, 2221.
Ligero, P., Villaverde, J. J. Vega, A. and Bao, M. 2007. Acetosolv delignification of depithed cardoon (Cynara cardunculus) stalks. Industrial Crops and Products 25,
J.
Ogunsile and Bamgboye: Sorption Characteristics of Methylene Blue

215
294–300Man, H.C., Chin, W. H., Zadeh, M. R. and Yusof,
M. R. M. 2012. Adsorption potential of unmodified rice husk for boron removal. Bioresources 3810-3822.
Manghelli. J., Brown. L., Tadros, H. B. and Munfakh, N. A. 2015. A reminder of methylene blue's effectiveness in treating vasoplegic syndrome after on-pump cardiac surgery. Tex Heart Inst J. 42(5), 491-494.
Ogunsile, B. O. and Abayomi, A. A. 2014. Adsorption of Chromium (VI) and Cadmium (II) from aqueous solution by soda lignin obtained from Nypa palm leaves (Nypa fruitcans). Ozean J. Appl. Sci. 7(2), 43.
Ogunsile, B. O. and German C. Q. 2010. Modelling of soda – ethanol pulps from Carpolobia lutea. BioResources, 5(4), 2417-2430.
Przystaś , W., Zabłocka-Godlewska, E., Grabińska-Sota, E. 2012. Biological removal of azo and triphenylmethane dyes and toxicity of process by-products. Water Air Soil Pol-lut. 223(4), 1581-1592.
Rosas, J. M., Ruiz-Rosas, R., Rodríguez-Mirasol, J. and Cordero, T. 2017. Kinetic study of SO 2
removal over lignin-based activated carbon Chem. Eng. J. 307, 707–721
Seow, T. W. and Lim, C. K. 2014. Removal of dye by adsorption: a review. International J Appld. Eng. Res. 11(4), 2675-2679
Suhas, Carrott, P.J.M. and Ribeiro Carrott, M.M.L. 2007. Lignin – from natural adsorbent to
7(3),
activated carbon: A review. Bioresource Technology 98(12), 2301–2312.
Top, W. M., Gillman, P. K., de Langen, C.J. and Fatal, K. A. 2014. Methylene blue associated serotonin toxicity. Neth. J. Med. 72, 179-181.
Vadivelan, V. and Kumar, K. V. 2005. Equilibrium, kinetics, mechanism, and process design for the sorptionof methylene blue onto rice husk. Journal of Colloid and Interface Science. 286, 90–100.
Vijayaraghavan, K. and Balasubramanian, R. 2015. Is biosorption suitable for decontamination of metal-bearing wastewaters? A critical review on the state-of-the-art of biosorption processes and future directions. J. Environ. Manag. 160, 283–296.
Vutskits, L., Briner, A., Klauser, P., Gascon,E., Dayer, A. G., Kiss, J. Z., Muller, D., Licker, M. J. and Morel, D. R. 2008. Adverse effects of methylene blue on the central nervous system. Anesthesiology. 108, 684-692.
Xiang, F. and Feng, J. J. 2016. Postoperative analgesic effect of methylene blue compound in anal diseases. Int. J. Clin. Exp. Med. 9(3), 6302-6308.
Yagub, M. T., Sen, T. K.., Afroze, S. and Ang, H. M. 2014. Dye and its removal from aqueous solution by adsorption: a review. Adv. Colloid Interface Sci. 209, 172-84.
Yang, X., and Al-Duri, B. 2005. Kinetic modeling of liquid-phase adsorption of reactive dyes on activated carbon. Journal of Colloid and Interface Science, 287, 25–34.
Ogunsile and Bamgboye: Sorption Characteristics of Methylene Blue