· (IJSSBT) is a research journal published by Shram Sadhana Bombay Trust’s, COLLEGE Of...
60
Transcript of · (IJSSBT) is a research journal published by Shram Sadhana Bombay Trust’s, COLLEGE Of...


PRATIBHA: INTERNATIONAL JOURNAL OF SCIENCE, SPIRITUALITY, BUSINESS AND TECHNOLOGY (IJSSBT)
Pratibha: International Journal of Science, Spirituality, Business and Technology (IJSSBT) is a research journal published by Shram Sadhana Bombay Trust’s, COLLEGE Of ENGINEERING & TECHNOLOGY, Bambhori, Jalgaon, MAHARASHTRA STATE, INDIA. Founder Chairperson of the college is Honourable Sau. Pratibha Devisingh Patil, the former President of India.
College is awarded as Best Engineering College of Maharashtra State by Engineering Education Foundation, Pune in year 2008-09.
The College has ten full-fledged departments. The Under Graduate programs in 4 courses are accredited by National Board of Accreditation, All India Council for Technical Education, New Delhi for 2 years. QMS of the College conforms to ISO 9001:2008 and is certified by JAAZ under the certificate number: 1017-QMS-0117.The college has been included in the list of colleges prepared under Section 2(f) of the UGC Act, 1956 vide letter number F 8-40/2008 (CPP-I) dated May, 2008 and 12(B) vide letter number F. No. 8-40/2008(CPP-I/C) dated September 2010.UG courses permanently affiliated to North Maharashtra University are: Civil Engineering, Chemical Engineering, Computer Engineering, Electronics and Telecommunication Engineering, Electrical Engineering, Mechanical Engineering, Information Technology. Two years Post Graduate courses are Computer Engineering (Computer Science and Engineering) and Electrical Engineering (Electrical Power System). Civil Engineering Department, Mechanical, Biotechnology, Electronics and Telecommunication Engineering and Chemical Engineering Department laboratories are recognized for Ph.D. Programs. Spread over 25 Acres, the campus of the college is beautifully located on the bank of river Girna.
The International Journal of Science, Spirituality, Business and Technology (IJSSBT) is an excellent, intellectual, peer reviewed journal that takes scholarly approach in creating, developing, integrating, sharing and applying knowledge about all the fields of study in Engineering, Spirituality, Management and Science for the benefit of humanity and the profession.
The audience includes researchers, managers, engineers, curriculum designers administrators as well as developers.

EDITOR(s)-IN-CHIEF
Prof. Dr. K. S. WANI, M. Tech. (Chem. Tech.), D.B.M., Ph. D. LMISTE, LMAFST, MOTAI, LMBRSI, LMIIChE Principal, S.S.B.T.’s College of Engineering and Technology, Bambhori, Jalgaon Mobile No. +919423774254 Phone No. (0257) 2258393, Fax No. (0257) 2258392 Email id: [email protected] Prof. Dr. SANJAY P. SHEKHAWAT Ph.D. (Mechanical Engineering) Professor and Head, Department of Mechanical Engineering, S.S.B.T.’s College of Engineering and Technology, Bambhori, Jalgaon Mobile No. +91 9423621653 Phone No. (0257) 2258393, Fax No. (0257) 2258392 Email id : [email protected] Web Address : www.ijssbt.org/com
Journal Indexing
COSMOS IMPACT FACTOR
PUBLICATION COMMITTEE
Prof. Dr. SANJAY P. SHEKHAWAT Professor and Head, Department of Mechanical Engineering,
Mr. SUHAS M. SHEMBEKAR Assistant Professor Department of Electrical Engineering
RESEARCH REVIEW COMMITTEE
Dr. K. S. Wani Principal, S.S.B.T.’s College of Engineering and Technology, Bambhori, Jalgaon Dr. M. Husain Department of Civil Engineering Dr. I.D. Patil Department of Bio-Technology Dr. K.S. Patil Department of Applied Science Dr. V.R. Diware Department of Chemical Engineering Dr. S.R. Suralkar Department of Electronics & Telecommunication Engineering Dr. P. V. Thakre Department of Electrical Engineering Dr. S.B. Pawar Department of Civil Engineering Dr. M.P. Deshmukh Department of Electronics & Telecommunication Engineering Dr. S.D. Suryawanshi Department of Mechanical Engineering B.S. Deore, College of Engineering, Dhule Dr. S.I. Kolhe Department of Mechanical Engineering J.T. Mahajan, College of Engineering, Faizpur
Dr. S.P. Shekhawat Department of Mechanical Engineering Dr. G. K. Patnaik Department of Computer Engineering Dr. P. J. Shah Department of Electrical Engineering Dr. U. S. Bhadade Department of Information Technology Dr. V. S. Rana Department of Business Administration Dr. H.A Salunkhe Department of Business Administration Dr. R.A. Modiyani Department of Business Administration Dr. K.P.Adhiya Department of Computer Engineering Dr. P.G. Damle Department of Mechanical Engineering Dr. R.B. Barjibhe Department of Mechanical Engineering S.S.G.B. College of Engineering and Technology, Bhusawal Dr. V.U. Edlabadkar Department of Applied Science PES Modern College of Engineering, Pune Dr. R.N. Khairnar Chartered Accountant, Jalgaon
PRATIBHA: INTERNATIONAL JOURNAL OF SCIENCE, SPIRITUALITY, BUSINESS AND TECHNOLOGY
(IJSSBT) Table of Contents
Volume 5, No. 2, August 2017
1) A study on book-to-market ratio of selected companies listed with NSE for finding undervalued and overvalued shares with reference to power sector 01
2) Web application mining tool by integrating pattern mining with graph theory 05
3) A Duplicate File Finder System 10
4) Experimental investigation of molten salt in concentrated solar power system 15
5) Internet of Things for Smart Cities 22
6) Transmission & Tribological Consideration in Human Powered Electric Generator: A Critical Review 31
7) Experimental, analytical and numerical study of energy absorption properties of Aluminium crush boxes with and without buckling initiators (axial loading) 35
8) Experimental study of conventional and geopolymer mortar 43
9) Myths and Reality of Goods and Service Tax (GST): A Study 47
PRATIBHA: INTERNATIONAL JOURNAL OF SCIENCE, SPIRITUALITY, BUSINESS AND TECHNOLOGY (IJSSBT), Vol. 5, No. 2, August 2017
ISSN (Print) 2277-7261
A Study on Book-to-Market ratio of selected companies listed with NSE for finding undervalued and overvalued shares
with reference to power sector
Dr. S Poornima1 and Ms.R Bhuvaneswari2
1) Associate Professor, Department of Business Administration, P.S.G.R Krishnammal College for Women, Coimbatore
2) *M.Phil (FT) Research Scholar, P.S.G.R Krishnammal College for Women, Coimbatore Email: [email protected]
*Corresponding Author
ABSTRACT :
India is one of the fastest emerging economies of the world, with an average GDP growth rate of around 7.0% over the last few years. It has emerged as the world's fastest growing wealth creator, recognitions to its floating stock market and higher earnings. The name “stock market” when comes into the mind, everyone has a different opinion. One feels that it is risky to invest in the stock market, others may perceive that it is a game of gambling. Many of the investors may feel that it is a great opportunity to make profits in the stock market. The opinion differs from person to person and investor to investor. One has to develop a bird’s view over the stock market, and analyse every factor with tools and techniques so that they may not go wrong in the investment decisions. The present study aims to analyse the Book-to-Market ratio of selected companies listed with NSE for the five financial years from 2010 to 2014. This study aims to show that investors can build a stronger value portfolio by using simple historical financial performance.
Keywords: Book value, Market value, Book-to-Market Ratio, Stock Market
I. INTRODUCTION
Investment is the sacrifice of certain present value for an uncertain future reward. Generally Investment means the use of money in the hope of making more
money. Further, investment decision-making has not only to be endless, but rational too. Broadly speaking, an investment decision is a trade off between risk and return. The capital market is a good source of investment where various types of securities like equity shares, preference shares, debentures, bonds etc. are traded. Most commonly equity shares are traded and investments are huge. Investment management is necessary for attaining profits at lower risk. Hence the Book-to-Market Ratio helps the investors to find undervalued and overvalued shares and to select the right shares in the stock market.
BOOK-TO-MARKET RATIO
The book-to-market ratio helps the investor to identify undervalued or overvalued securitiesby taking the book value and dividing it by market value. The Book value is calculated by deducting all the liabilities of a company from its total assets (as depicted in the balance sheet). It is the total value of the company's assets that equity shareholders would theoretically receive if a company were to be liquidated. Market value is based on the price of its stock and it is determined in the stock market through its market capitalization. In basic terms, if the ratio is above 1 then the stock is high Book-to-Market Ratio/undervalued; if it is less than 1, the stock is low Book-to-Market Ratio /overvalued.
1
PRATIBHA: INTERNATIONAL JOURNAL OF SCIENCE, SPIRITUALITY, BUSINESS AND TECHNOLOGY (IJSSBT), Vol. 5, No. 2, August 2017
ISSN (Print) 2277-7261
II. REVIEW OF LITERATURE
Fama and French (1995) attempted to show that value stocks (high book/market) are significantly outperformed growth stocks (low book/market). The average return of the highest book/market decile is stated to be one percent per month higher than the average return for the lowest book/market decile. Dhatt et al., (1999) examined the relationship between stock returns and potential explanatory factors in Korea during 1982–1992. Their results showed that book-to-market ratio has the greatest explanatory power for stock returns and it indicated superior returns for value stocks. Their findings strengthen the international evidence of the role of the book-to market ratio in explaining stock returns by demonstrating its significance even in the segmented Korean market. Piotroski (2000) examined whether a simple accounting based Fundamental Analysis strategy, when applied to a broad portfolio of high Book to Market firms, can shift the distribution of returns earned by an investor. The research showed that the mean returns earned by a high Book to Market investor can be increased by at least 7.5% annually through the selection of the financially strong high Book to Market firms. III. OBJECTIVES OF THE STUDY
1. To measure the Book Value of shares for selected companies.
2. To measure the Market Value of shares for selected companies.
3. To calculate the Book-to-Market Ratio 4. To identify the undervalued or
overvalued shares.
IV. METHODOLOGY The current study is contemplated after thoroughly reviewing the above mentioned literature. The study is based on the secondary data. The period covered for the study is five financial years from 2010 to 2014 and 5 selected NSE companies from Power sector. At the first instance Book value and Market value of the five companies for the five financial years are taken and then to calculate the Book-to-Market ratio. The Average Book-to-Market Ratio is above one, it is said to be undervalued shares
and if it is below one it is treated as overvalued shares. V. ANALYSIS AND INTERPRETATION
1. ADANI POWER LTD TABLE NO.1 - BOOK VALUE & MARKET VALUE OF ADANI POWER LTD YEAR BOOK
VALUE MARKET VALUE
BM RATIO
2010 26.60 115.95 0.23 2011 29.00 112.80 0.26 2012 27.65 68.30 0.40 2013 19.43 40.65 0.48 2014 27.11 48.65 0.56 AVG VALUE 25.96 77.27 0.39 Interpretation: The average Book-to-Market Ratio of the Adani Power Ltd is 0.39 which shows that the shares are overpriced since it has the value of below 1. 2. GUJARAT INDUSTRIES POWER CO LTD TABLE NO.2 - BOOK VALUE & MARKET VALUE OF GUJARAT INDUSTRIES POWER CO LTD
YEAR BOOK VALUE
MARKET
VALUE
BM RATIO
2010 82.38 121.00 0.68 2011 90.25 92.50 0.98 2012 95.17 66.70 1.43 2013 106.72 74.25 1.44 2014 116.08 65.75 1.77 AVG VALUE 98.12 84.04 1.26 Interpretation: The average Book-to-Market Ratio of the Gujarat Industries Power Co Ltd is 1.26 which indicates that the shares are underpriced since it has the value of above 1. 3. RELIANCE POWER LTD TABLE NO.3 - BOOK VALUE & MARKET VALUE OF RELIANCE POWER YEAR BOOK
VALUE MARKET VALUE
BM RATIO
2010 58.69 149.50 0.39 2011 56.67 129.70 0.44 2012 57.40 116.90 0.49 2013 59.98 61.55 0.97 2014 60.17 70.35 0.86
2

PRATIBHA: INTERNATIONAL JOURNAL OF SCIENCE, SPIRITUALITY, BUSINESS AND TECHNOLOGY (IJSSBT), Vol. 5, No. 2, August 2017
ISSN (Print) 2277-7261
AVG VALUE 58.58 105.60 0.63 Interpretation: The average Book-to-Market Ratio of the Reliance Power Ltd is 0.63 which infers that the shares are overpriced since it has the value of below 1. 4. CESC LTD TABLE NO.4 - BOOK VALUE & MARKET VALUE OF CESC LTD YEAR BOOK
VALUE MARKET VALUE
BM RATIO
2010 263.94 382.40 0.69 2011 344.52 311.05 1.11 2012 388.68 272.15 1.43 2013 435.06 264.80 1.64 2014 486.31 500.45 0.97 AVG VALUE 383.70 346.17 1.17 Interpretation: The average Book-to-Market Ratio of the CESC Ltd is 1.17 which indicates that the shares are underpriced since it has the value of above 1. 5. ORIENT GREEN POWER COMPANY LTD TABLE NO.5 - BOOK VALUE & MARKET VALUE OF ORIENT GREEN POWER COMPANY Interpretation: The average Book-to-Market Ratio of the Orient
Green Power CompanyLtd is 1.37 which shows that the shares are underpriced since it has the value of above 1.
VI. FINDINGS
The average Book-to-Market Ratio of the Adani Power Ltd is 0.39
The average Book-to-Market Ratio of the Gujarat Industries Power Co Ltd is 1.26
The average Book-to-Market Ratio of the Reliance Power Ltd is 0.63
The average Book-to-Market Ratio of the CESC Ltd is 1.17
The average Book-to-Market Ratio of the Orient Green Power Company Ltd is 1.37
VII. SUGGESTIONS The investors are recommended to buy the following companies share which is underpriced.
Gujarat Industries Power Company Ltd CESC Ltd Orient Green Power Company Ltd
The investors are suggested to sell the following companies share which is overpriced.
Adani Power Ltd Reliance Power Ltd
VIII. CONCLUSION The present study attempted to explain that how to calculate Book-to-Market Ratio and also its importance among investors. It helps the investors to identify undervalued and overvalued shares traded in the stock market. This study covered only in Power sector, like that investor has to analyse the sharesof each and every sector before going to makethe investment. It is concluded that investors are suggested to invest undervalued shares compared to overvalued shares. At the same time, investors should analyse and confirm that those undervalued shares are fundamentally strong or not by using Fundamental Analysis. References: Journals [1] Eugene F. Fama and Kenneth R French (1995). “Size and Book-to-Market Factors in Earnings and Returns”.The Journal of Finance, Vol.50, No.1, pp. 131-155. [2] Joseph D Piotroski, J. D. (2000). “Value Investing: The Use of Historical Financial Statement Information to Separate Winners from Losers”. Journal of Accounting Research, Vol. 38, No. 3, pp. 1-41. [3] Jaya M and Charulatha V (2014). “Factors Determining Market Price of Equity Shares in Indian Information Technology Industry”. Radix International Journal of Economics and Business Management, Vol. 3, No.5, pp. 1-8
YEAR BOOK VALUE
MARKET VALUE
BM RATIO
2010 9.61 44.90 0.21 2011 24.21 25.45 0.95 2012 24.10 12.74 1.89 2013 23.76 14.08 1.69 2014 19.81 9.34 2.12 AVG VALUE 20.30 21.30 1.37
3

PRATIBHA: INTERNATIONAL JOURNAL OF SCIENCE, SPIRITUALITY, BUSINESS AND TECHNOLOGY (IJSSBT), Vol. 5, No. 2, August 2017
ISSN (Print) 2277-7261
[4] Madhu Tyagi, Venkatesh.C.K. and Kiran.M (2013). “Analyzing Momentum Effect in High and Low Book-to-Market Ratio Firms with Specific Reference to Indian IT, Banking and Pharmacy Firms”. Asia Pacific Journal of Research, Vol.1, No. 11, pp. 44-55. [5] Manjeet S Dhatt, Yong H Kim and Sandip Mukherji (1999). “Relations between Stock Returns and Fundamental Variables: Evidence from a Segmented Market”. Asia-Pacific Financial Markets, Vol. 6, pp. 221–233. [6] Venkatesh C K, Madhu Tyagi and Ganesh L (2013). “Analyzing the Performance of High and Low Book-to-Market Ratio Firms with specific reference to Indian IT, Pharmacy and Banking Stocks”. Innovative Journal of Business and Management, Vol.2, No.3, pp 40-43. [7] Xiaoquan Jiang and Bong-Soo Lee (2007). “Stock returns, dividend yield and book-to-market ratio”. Journal of banking and finance, Vol 31, pp. 455-475. Websites www.moneycontrol.com www.gurufocus.com www.nseindia.com www.in.yahoofinance.com
4
PRATIBHA: INTERNATIONAL JOURNAL OF SCIENCE, SPIRITUALITY, BUSINESS AND TECHNOLOGY (IJSSBT), Vol. 5, No. 2, August 2017
ISSN (Print) 2277-7261
Web Application Mining Tool by Integrating Pattern Mining with Graph Theory
1Shambhu Kumar Singh1, Dr. Umesh S. Bhadade2
1Assistant Professor, 2 Professor Department of Information Technology, SSBT’s COET, Bambhori, Jalgaon India
[email protected], [email protected]
ABSTRACT :
Today, web usage mining plays an important role in analyzing and improving performance of web based applications and also 90 percent application belong to web-based application. In this paper first, concept of web usage mining is introduced. Improved AprioriAll algorithms is discussed which is the base algorithm for the proposed tool along with its limitation. The enhanced approach is discussed which integrates sequential pattern mining with graph theory. Secondly, design of web usage mining tool with superior approach is discussed. Implementation details of the tool are discussed along with the results. The last part covers how the raw result from the proposed tool can be further visualized and analyzed using new technologies like D3.js and Neo4j.
Index Terms—Web-based Application, Web usage mining, Improved AprioriAll
I. INTRODUCTION
Due to uses of high availability and affordability of internet services, there is exponential growth in number of users accessing web based application services. This leads to large number of business opportunity in internet world. The service provider, who can exactly understand what users want and how users behave, will eventually succeed. In order to understand user activities, web usage mining can be used. The input for web usage mining is server side log files. Whenever user uses a web service, a log file stores that action. The following section describes some concepts of web usage mining.
II. WEB USAGE MINING Web usage mining is a sub branch of web
mining, in which various data mining techniques are applied on server side log files to mine important usage patterns [2]. Whenever a user makes any request on internet, an entry is created in server side log file of that
corresponding web application. The entry may contain attributes like IP address of user, date and time stamp of request, status of request, protocols used etc. Along with this, links of images, videos, documents, entries made by web crawlers/ spiders etc are also stored. This makes log file very bulky and it is nearly impossible to use such files directly for data mining.
Web usage mining is subdivided into three sub phases: Log file preprocessing, Pattern mining, Pattern visualization and analysis [6]. These steps are discussed below.
A. Log File Preprocessing
As discussed above, log file contains large amount of unwanted data like links of images, docs, entries of crawlers etc. These unwanted links do not add any value in pattern extraction phase and hence must be removed. The preprocessing phase aims to remove such unwanted links.
B. Pattern Mining
In this phase, different types of data mining algorithms are applied on a pre-processed log file in order to extract usage patterns.
C. Pattern Analysis and Visualization
As result obtained from pattern mining phase is very difficult to analyze, it must be converted into different graphical charts. This phase converts such raw results into graphical form. This helps web analyst to effectively understand the user’s behavior.
In this paper, focus will be on pattern mining phase and implementation details of web usage mining tool. Pattern mining can be done using three techniques: association rule mining (finding groups of pages being accessed together), clustering (finding groups of users with same behaviour), and sequential pattern mining (finding path in which user access web pages).
5

PRATIBHA: INTERNATIONAL JOURNAL OF SCIENCE, SPIRITUALITY, BUSINESS AND TECHNOLOGY (IJSSBT), Vol. 5, No. 2, August 2017
ISSN (Print) 2277-7261
III. RELATED WORK
Lot of work has already been done on web usage mining. There are many algorithms which can be used in pattern mining phase. Some of the most commonly used algorithms are: Free span, Apriori, Prefix span etc. Each of these algorithms has their own parsing techniques to extract usage patterns from the log file.
For the proposed tool, Improved AprioriAll algorithm is used. The main advantage of using this algorithm over other algorithms is that it significantly reduces number of redundant item sets, hence improving performance. The algorithm which was originally proposed in [2] is discussed as follows.
Input to Algorithm
U= {UB1, UB2…., UBi} -> set of Web users D= {st1, st2…., sti} -> set of session ids sorted according to UserID S -> Minimum support
Output: Sequential patterns fulfilling support criteria
IMPROVED APRIORIALL ALGORITHM
D=sort D on UserID and time of first page reference in each session;
L1 with UserID = {large 1-itemsets}; For (k=2; Lk-1! = null; k++) do Begin Ck=Apriori-gen (Lk-1, U); //new candidate set For all transaction ti D do Begin
Ci = subset (Ck, ti); For all candidate c Ci do c.count++;
End Lk={c
k|c.count>S};//S:support End Find maximal reference sequences from L; Procedure Apriori-gen (Lk-1, S, U) Ck=null;
For each itemset Li Lk-1 For each itemset Lj Lk-1
Begin If Li and Lj has same U Begin C=Li join Lj;
If has infrequent-subset(c, Lk-1) Delete c;
Else Add c to Ck;
end End
Return Ck;
Explanation: The precondition for Improved AprioriAll algorithm is that the input log file should be sorted and grouped into sessions of each unique user. Each unique user is identified using IP address field from the log file.
During first iteration, the algorithm finds one large 1-item set. This item set contains all unique links present in web application. In subsequent iterations, item sets are grouped to generate candidate sets satisfying given support criteria. The improvement of this algorithm as stated above is that this eliminates redundant candidate sets by crossing candidate sets having same UserID. This significantly reduces size of candidate sets and hence reduces number of scanning databases.
Visualization constraint: The algorithm gives sequential patterns satisfying support criteria as an output. But just knowing access patterns is not enough. Attention must also be given to least visited links; as such links consume unnecessary space and does not add any value to the web application. In order to overcome this limitation, graph theory can be integrated with to be had improved AprioriAll algorithm. The end result will show entire usage analysis of the web application.
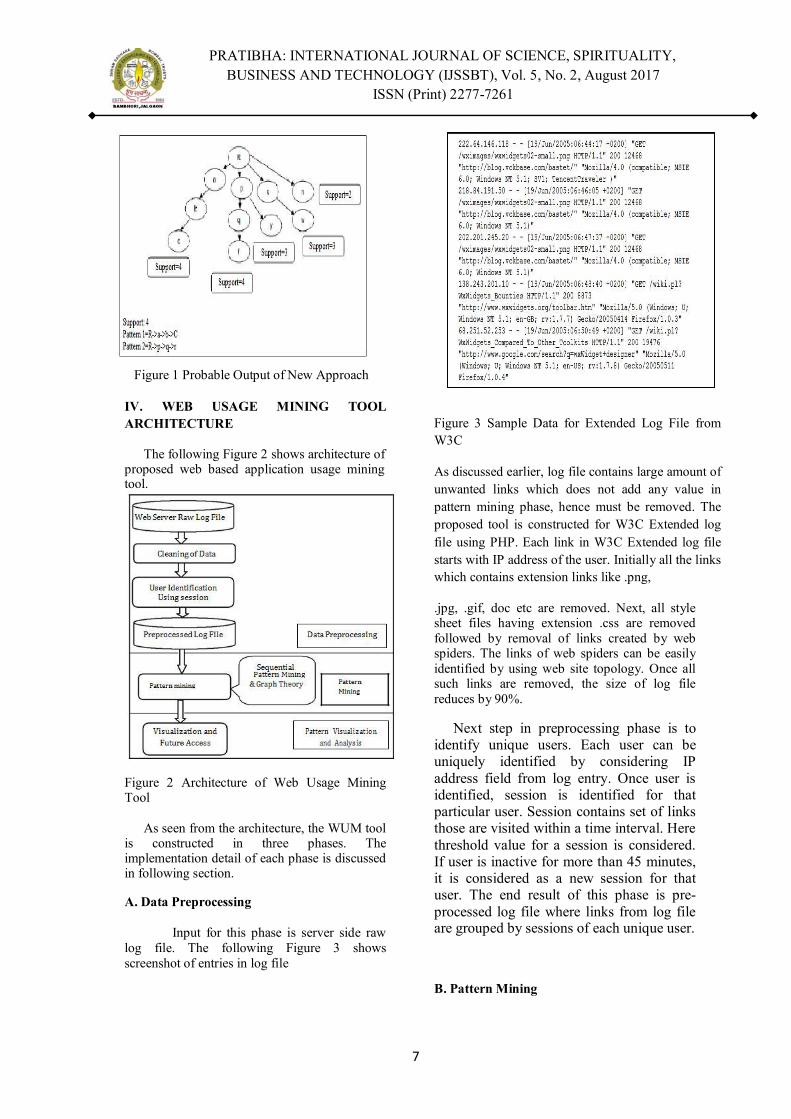
Improvement: In order to properly visualize entire access patterns, directed tree structure is used. Directed tree have two main mechanisms: nodes and links. Root node of the tree represents home page of the web application whereas all other subsequent nodes will represent subpages present within the web application. Links represent how pages are linked to each other. Links help to represent the path which determines how the web pages are being accessed. The following Figure 1 shows the probable output of new approach.
6
PRATIBHA: INTERNATIONAL JOURNAL OF SCIENCE, SPIRITUALITY, BUSINESS AND TECHNOLOGY (IJSSBT), Vol. 5, No. 2, August 2017
ISSN (Print) 2277-7261
Figure 1 Probable Output of New Approach
IV. WEB USAGE MINING TOOL ARCHITECTURE
The following Figure 2 shows architecture of proposed web based application usage mining tool.
Figure 2 Architecture of Web Usage Mining Tool
As seen from the architecture, the WUM tool
is constructed in three phases. The implementation detail of each phase is discussed in following section.
A. Data Preprocessing
Input for this phase is server side raw log file. The following Figure 3 shows screenshot of entries in log file
Figure 3 Sample Data for Extended Log File from W3C
As discussed earlier, log file contains large amount of unwanted links which does not add any value in pattern mining phase, hence must be removed. The proposed tool is constructed for W3C Extended log file using PHP. Each link in W3C Extended log file starts with IP address of the user. Initially all the links which contains extension links like .png,
.jpg, .gif, doc etc are removed. Next, all style sheet files having extension .css are removed followed by removal of links created by web spiders. The links of web spiders can be easily identified by using web site topology. Once all such links are removed, the size of log file reduces by 90%.
Next step in preprocessing phase is to identify unique users. Each user can be uniquely identified by considering IP address field from log entry. Once user is identified, session is identified for that particular user. Session contains set of links those are visited within a time interval. Here threshold value for a session is considered. If user is inactive for more than 45 minutes, it is considered as a new session for that user. The end result of this phase is pre-processed log file where links from log file are grouped by sessions of each unique user.
B. Pattern Mining
7

PRATIBHA: INTERNATIONAL JOURNAL OF SCIENCE, SPIRITUALITY, BUSINESS AND TECHNOLOGY (IJSSBT), Vol. 5, No. 2, August 2017
ISSN (Print) 2277-7261
In this phase, Improved AprioriAll algorithm is applied on pre-processed log file. Initial Support must be specified before running this algorithm. Support is total number of unique users visiting same link. During each iteration, item sets are generated. At this step, directed tree generating algorithm is injected in every iteration. The directed tree generating algorithm is given as follows.
The root node of the tree will be home page of the web application.
Let Ri be the current request link and Rj be the next request link For each Ri in session
If Rj is not there in tree Create a link new link pointing from Ri to Rj
with solid line along with support count. Else
Continue. So during each iteration, a new level of tree
will be generated. When the algorithm is terminated, a tree structure is generated which not only shows most frequently accessed patterns but also the least frequently visited links. The tree structure gives overall view of how the web application is being accessed by the users.
C. Pattern Visualization and Analysis
The above result helps web analyst to analyze how the entire web application is being used by the users. The analyst can bring resources which are more frequently visited by users to higher level of tree. This will reduce efforts of users to access it. Also web analyst can focus on least visited links, which can be removed to free up web space which ultimately improves web application performance. The above base result can further be converted into more detailed charts like pie charts, bar chart, scatter plot etc using Opensoure libraries like D3.js, CanvasJS etc.
Neo4j that is a graph database can also be used during tree plotting phase. Neo4j have capability to define value to relations [links] in the tree structure. Using this feature, different queries can be executed to derive various inferences about user’s behaviour.
V. CONCLUSION
Web based application usage mining techniques plays an important role in analyzing and improving performance of web based applications. At first concepts of web usage
mining were discussed. Improved AprioriAll algorithm was explained along with its constraint with respect to visualization. Newly approach is discussed which combines chronological pattern mining with graph theory. In the second part, architecture and implementation of web usage mining tool was discussed along with the results. On other hand the proposed tool helps the web analyst to visualize entire website usage in one go but there are still many boundaries to it. Now a day, the size of log files is very enormous, so it will be difficult to use such huge files directly on single client due to hardware restrictions. Here concepts of distributed file processing using Hadoop can be used along with this tool to control such enormous files.
REFERENCES
[1] Winnie W. M. Lam, “IEEE International Conference one-Technology”, Granular Computing, 26-28 Aug. 2008, INSPEC Accession Number: 10386663, DOI:10.1109/GRC.2008.4664741.
[2] Tong, Wang and Pi-lian , “Web Log Mining by an Improved AprioriAll Algorithm”, World Academy of Science, Engineering and Technology, Volume 4, 2005 pp 97-100.
[3] Jianli Duan, Shuxia Liu, “Research on Web Log Analysis”, Instrumentation and Measurement, Sensor Network and Automation (IMSNA), 2012
[4] Margaret H Dunham. “Data Mining Introductory and Advanced Topics” [M]. Beijing: Tsinghua University Press, 2003, p195-220.
[5] Lin jie bin, Liu ming de, Chen xiang. “Data mining and OLAP Theory & Practice” [M]. Beijing: Tsinghua University Press, 2003, p194-244
[6] S. Agarwal, R. Agrawal, P. M. Deshpande, A. Gupta, J. F. Naughton, R. Ramakrishnan, and S. Sarawagi. “On the computation of multidimensional aggregates”. In Proc. 1996 Int. Conf. Very Large Data Bases, pages 506{521, Bombay, India, Sept. 1996
[7] J. Borges and M. Levene, “Data mining of user navigation patterns, Proceedings of Workshop on Web Usage Analysis and User Profiling (WEBKDD)”, in conjunction with ACM SIGKDD International Conference on Knowledge Discovery and Data Mining, San Diego, CA., pp.31-36, 1999
8

PRATIBHA: INTERNATIONAL JOURNAL OF SCIENCE, SPIRITUALITY, BUSINESS AND TECHNOLOGY (IJSSBT), Vol. 5, No. 2, August 2017
ISSN (Print) 2277-7261
[8] J. Cho, S. Roy, and R. E. Adams. “Page quality: in search of an unbiased web ranking”. Proceedings of ACM SIGMOD, pp.551-562, 2005
[9] R. Cooley, B. Mobasher and J. Srivastava, “Data preparation for mining World Wide Web browsing patterns”, Journal of Knowledge and Information Systems, 1(1), pp.55-32, 1999
[9] Bain Tony SQL Server 2000 “Data Warehouse and Analysis Services”. Beijing: China Electric Power Press, 2003, p443-470
[10] Wang Bin; Liu Zhijing, "Web mining research", Proceedings of fifth International Conference on Computational Intelligence and Multimedia Applications(ICCIMA 2003) , 2003 , pp: 84 - 89
[11] Wen-Hai Gao, “Research On Client Behaviour Pattern Recognition System Based On Web Log Mining, Proceedings of the Ninth International Conference on Machine Learning and Cybernetics”, Qingdao, 11-14 July 2010, 001, 978-1-4244-6527-9/101$26.00 ©2010 IEEE, pp 466-47
[12] Guo, Di, Collector Engine System: “A Web Mining Tool for Ecommerce”, Proceedings of the First International Conference on Innovative Computing, Information and Control (ICICIC'06) DOI computer society 0-7695-2616-0106 2006 IEEE Yuewen, LI, Research on E-Commerce Secure Technology DOI 978-1-4244-3709-2/10 2010
[13] Mei Li and Cheng Feng, “Overview of WEB Mining Technology and Its Application in E-commerce”, 2010 2nd International Conference on Computer Engineering and Technology ,Volume 7, DOI 978-1-4244-6349-7/10 2010 IEEE pp V7-277-V7-280
[14] Li-na Lu, Hengyi Wei, "Sequential patterns recognition in web log mining", Mini-micro system, Volume 5, No. 3, pp. 81-83, Feb. 2008
[15] Sung-Shun Weng, Mei-Ju Liu, "Personalized product recommendation in e-commerce" , IEEE International Conference one-Technology, e-Commerce and e-Service(EEE '04), 2004, pp.413-420, doi: 1O.1109IEEE.2004.1287340
[16] H. Yao and H. J. Hamilton, “Mining itemset utilities from transaction databases,” Data Knowl. Eng., vol. 59, no. 3, pp. 603–626, 2006
[17] Y. Liu, W. keng Liao, and A. N. Choudhary, “A two-phase algorithm for fast discovery of high utility itemsets,” in PAKDD, 2005, pp. 689–695
[18] M.-S. Chen, J. S. Park, and P. S. Yu, “Efficient data mining for path traversal patterns,” IEEE Trans. Knowl. Data Eng., vol. 10, no. 2, pp. 209–221, 1998
[19] B. Mobasher, N. Jain, E.-H. Han, and J. Srivastava, “Web Mining: Pattern discovery from World Wide Webtransactions,” Tech Rep: TR96-050, 1996
[20] Y.-S. Lee and S.-J. Yen, “Incremental and interactive mining of web traversal patterns,” Inf. Sci., volume 178, no. 2, pp. 287– 306, 2008
9

PRATIBHA: INTERNATIONAL JOURNAL OF SCIENCE, SPIRITUALITY, BUSINESS AND TECHNOLOGY (IJSSBT), Vol. 5, No. 2, August 2017
ISSN (Print) 2277-7261
A Duplicate File Finder System
S. J. Patil* N. P. Jagtap* S. H. Rajput* R. B. Sangore*
*Assistant Professor, Department of IT, SSBT’s COET, Bambhori, Jalgaon
ABSTRACT:
Growth of electronics in past couple of years resulted in increase in computation powers, storage which demand to cope in different computational algorithms. With this there is almost lot of storage space provided in computers and there is no worry for the user to paste huge amount of files in computer hard drives. However this advantage has one drawback in which many times user is not aware about number of files are copied by the users are duplicated. In this paper we have focused on the techniques by which we can find duplicate files present on the computer drives or any other removable storage device. We propose file detection systems to give an indication to users about how many duplicate files are present which may have either similar name or similar contents. The key idea of this system is to monitor files in a given directory or drive periodically or at user’s discretion and check similar files in the storage system so as to save the space by proving option to the user to delete the duplicate files. In this work, different attributes such as file name, file size, file checksum, file content etc. will be considered while searching duplicate files. Content based file searching will give accurate results. Contents of files will be compared byte by byte or by having check on samples of chunk of bytes in the files at different locations. The later method is time efficient as it will not scan the whole file resulting savage of time.
Keywords: Checksum, duplicate.
I. INTRODUCTION
We all know the value of hard drive storage space. Hard drive of a computer is the primary storage area used to store information and if there are duplicate files stored on your hard drive, then you are definitely wasting the precious space. Because of such type of
duplicate files storing on hard drive, you may run out of memory space which creates a great problem for you and may your system gets slow down in its performance. Hence it is necessary to find and delete all those files which are having the same contents. Finding duplicate files manually in your hard drive is not an easy task as it takes a lot of time and effort, and also it could be risky as you may delete an important file by mistake. But with the help of automated tools, you can easily find all the duplicate files that are dwelling on your hard drive very easily. Remo more tool is best software which is perfectly programmed to identify duplicate files in hard drive of a computer. Generally it has found that on your computer there exist more than one file having same name and same content. Such files should be identified and deleted from hard drive to free memory space occupied by duplicate file. More suites are one perfect software which is developed with many options to find the duplicate files. It scans the selected folder or drive and if there are two files with same content, then it will help you to delete one of them and retains one in one click. It has got a special algorithm which performs rigorous scanning of folders and compares the content of two files even if they have same names to make sure whether they are having different information or same.
With the help of Remo more software, you can set searching criteria for searching the files. It is capable of searching various types of files including Words, Access, Excel and so on. This tool produces a detail report after fast scanning and let you make choice which file you want to delete and which to skip. It has a user friendly interface which makes it easy to use. It has flexible search criteria which helps user to customize search and helps in fast scanning. This software can identify duplicate files in all kinds of storage devices including USB drive, flash drive, iPod and digital camera. In addition, duplicate file finder also helps you to improve
10

PRATIBHA: INTERNATIONAL JOURNAL OF SCIENCE, SPIRITUALITY, BUSINESS AND TECHNOLOGY (IJSSBT), Vol. 5, No. 2, August 2017
ISSN (Print) 2277-7261
your system performance by deleting unnecessary files and freeing memory space for further use. And as a computer user you will no longer need to confuse for finding right files on the hard drive. More suites are totally safe and secure and there is no risk in using it. This is why; it is the first choice for most of the users for finding the duplicate file.
If you often find that you create duplicate files as you rename or use files in another context, or just backup more than you had intended, Duplicate File Finder help you find and/or delete these duplicates and regain the storage space they previously occupied. Judging from some of the recent comments, it would appear that some cautions should be noted before using this type of software. One might also note that with the cost per gigabyte rapidly decreasing, redundancy is no longer such a bad thing.
Don't ever just blindly run the program, find all the duplicates and then click "remove". This can be disastrous in the sense that even though filenames are the same, the content is sometimes different. For example, you may have multiple icons with the same name, but of differing sizes; or you may have a photograph that has been modified when placed in a different folder but retains the same filename. Don’t scan too much at once. A complete scan of drive C: would not be smart. However, scanning a few related folders at one time is much more efficient and the results less overwhelming. Despite the best software, human intelligence may still have to be used. It is best, like eating an elephant, to take one bite or one small scan at a time.
II. OBJECTIVES
In duplicate file finder process most of technique involves some standard hashing algorithm. Hashing algorithm act as one way encryption process that generate signature of document on which it is applied i.e. each document will generate a unique hash. For duplication detection hash values of files are compared between. If both files are with same hash it indicates that file content are same thus duplicate. Also combined with strong light weight hashing function we are going to use all the attributes that define the current duplicate file search. These attributes
include the current filter criteria (such as filename, masks, etc.), search paths, exclusion folders, file matching methods, visible duplicate result report columns, and more. In this paper we propose following methods to find duplicate files in the directory or folder.
A. Checksum Search
Search the selected drive or folder for duplicates that match by file name, extension, size and 128 bit content checksum. It is quick with a good degree of accuracy.
B. Matching of Files based on Contents with Different Extension.
In this search is performed in selected drive(s) or folder(s) for duplicate files that match files by their contents as a whole byte by byte having different extensions. In this method we compare byte by byte and see if file match occurs. There will be increased accuracy to find out duplicate file with different extensions.
C. Content based Search
It will be done byte by byte and by taking samples of chunks of bytes at different predetermined locations in the files. Byte by byte content matching is slower as it needs to scan the complete file. However second method of completion is time efficient as few bytes will be compared.
The overall objectives of this paper are
•Find all types of duplicate files
•Accurate search of files and deletes them
•Delete and rename of duplicate files
•Compare files by their content and lets you preview any files
•Manage your documents, photos, songs, movies
III. ANALYSIS AND SYSTEM ARCHITECTURE
Duplicate File Finder is a powerful tool to search for file duplicates on your computer. It can find duplicates of any files: text, binary, music or
11
PRATIBHA: INTERNATIONAL JOURNAL OF SCIENCE, SPIRITUALITY, BUSINESS AND TECHNOLOGY (IJSSBT), Vol. 5, No. 2, August 2017
ISSN (Print) 2277-7261
image. Algorithms used in the program allow for quickly analyzing of content of small and large files. The following criteria can be used search for duplicates: filename, file size, or file content. For multimedia files (MP3, OGG, WMA), the content of the following tags can be also analyzed: "Artist", "Album", "Title" and "Comment".
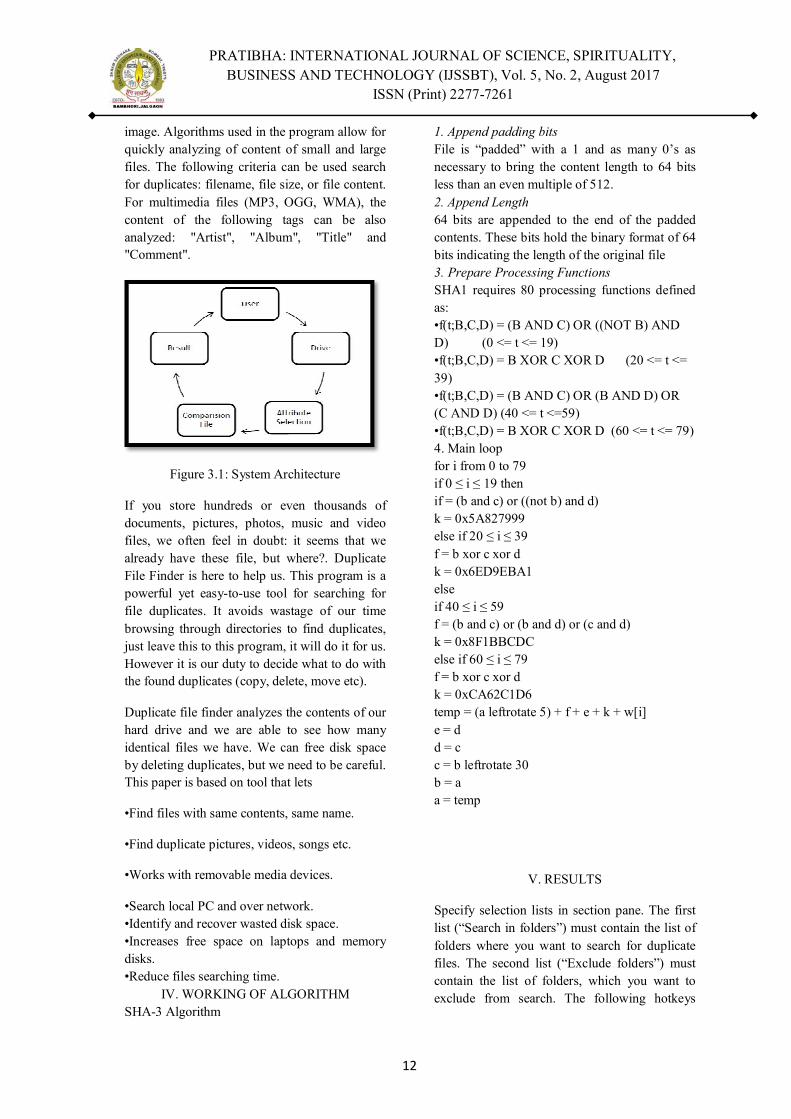
Figure 3.1: System Architecture
If you store hundreds or even thousands of documents, pictures, photos, music and video files, we often feel in doubt: it seems that we already have these file, but where?. Duplicate File Finder is here to help us. This program is a powerful yet easy-to-use tool for searching for file duplicates. It avoids wastage of our time browsing through directories to find duplicates, just leave this to this program, it will do it for us. However it is our duty to decide what to do with the found duplicates (copy, delete, move etc).
Duplicate file finder analyzes the contents of our hard drive and we are able to see how many identical files we have. We can free disk space by deleting duplicates, but we need to be careful. This paper is based on tool that lets
•Find files with same contents, same name.
•Find duplicate pictures, videos, songs etc.
•Works with removable media devices.
•Search local PC and over network. •Identify and recover wasted disk space. •Increases free space on laptops and memory disks. •Reduce files searching time.
IV. WORKING OF ALGORITHM SHA-3 Algorithm
1. Append padding bits File is “padded” with a 1 and as many 0’s as necessary to bring the content length to 64 bits less than an even multiple of 512. 2. Append Length 64 bits are appended to the end of the padded contents. These bits hold the binary format of 64 bits indicating the length of the original file 3. Prepare Processing Functions SHA1 requires 80 processing functions defined as: •f(t;B,C,D) = (B AND C) OR ((NOT B) AND D) (0 <= t <= 19) •f(t;B,C,D) = B XOR C XOR D (20 <= t <= 39) •f(t;B,C,D) = (B AND C) OR (B AND D) OR (C AND D) (40 <= t <=59) •f(t;B,C,D) = B XOR C XOR D (60 <= t <= 79) 4. Main loop for i from 0 to 79 if 0 ≤ i ≤ 19 then if = (b and c) or ((not b) and d) k = 0x5A827999 else if 20 ≤ i ≤ 39 f = b xor c xor d k = 0x6ED9EBA1 else if 40 ≤ i ≤ 59 f = (b and c) or (b and d) or (c and d) k = 0x8F1BBCDC else if 60 ≤ i ≤ 79 f = b xor c xor d k = 0xCA62C1D6 temp = (a leftrotate 5) + f + e + k + w[i] e = d d = c c = b leftrotate 30 b = a a = temp
V. RESULTS
Specify selection lists in section pane. The first list (“Search in folders”) must contain the list of folders where you want to search for duplicate files. The second list (“Exclude folders”) must contain the list of folders, which you want to exclude from search. The following hotkeys
12
PRATIBHA: INTERNATIONAL JOURNAL OF SCIENCE, SPIRITUALITY, BUSINESS AND TECHNOLOGY (IJSSBT), Vol. 5, No. 2, August 2017
ISSN (Print) 2277-7261
work in both lists: [Ins] add a folder to the list, [Del] delete a folder form the list, [Enter] select another folder. When leaving the program, the content of these lists is preserved and will be restored at the next program startup.
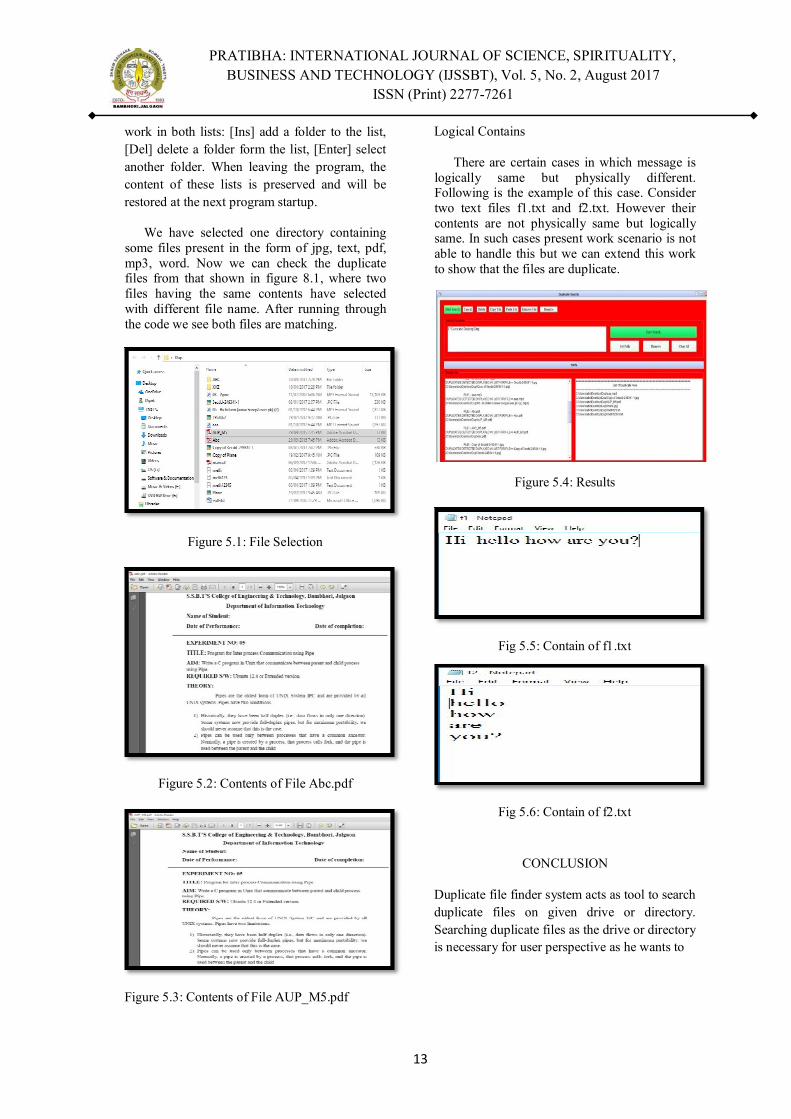
We have selected one directory containing some files present in the form of jpg, text, pdf, mp3, word. Now we can check the duplicate files from that shown in figure 8.1, where two files having the same contents have selected with different file name. After running through the code we see both files are matching.
Figure 5.1: File Selection
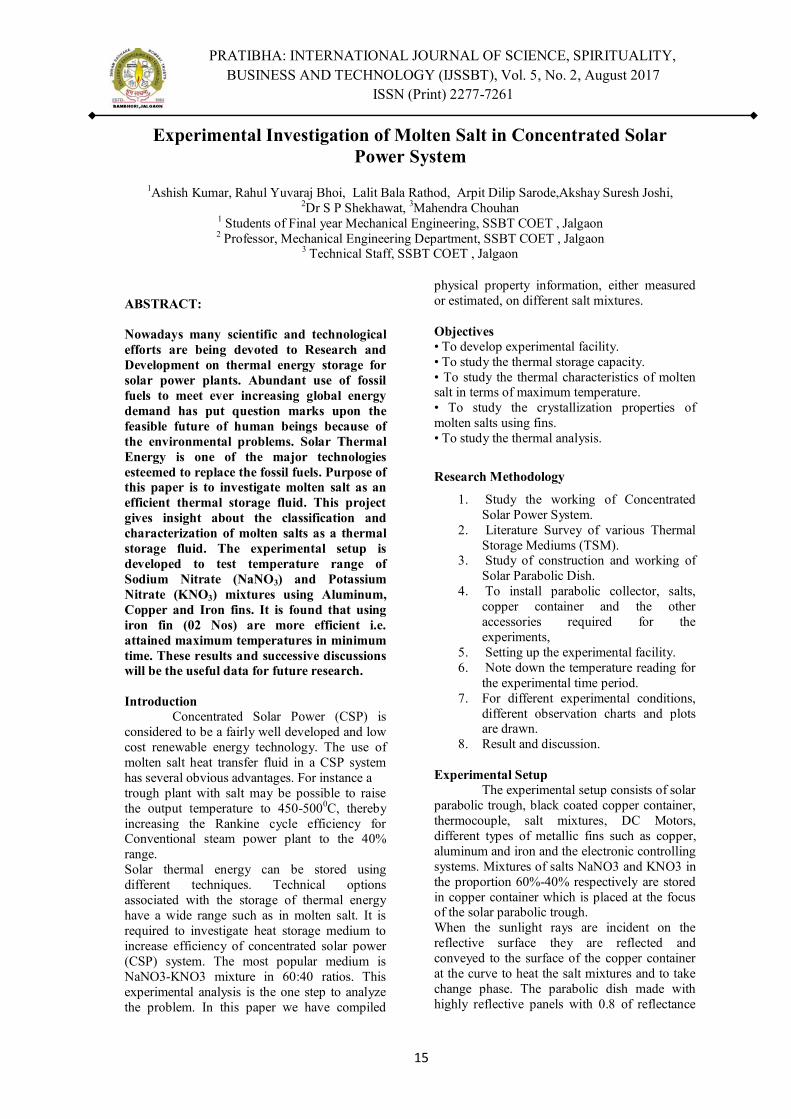
Figure 5.2: Contents of File Abc.pdf
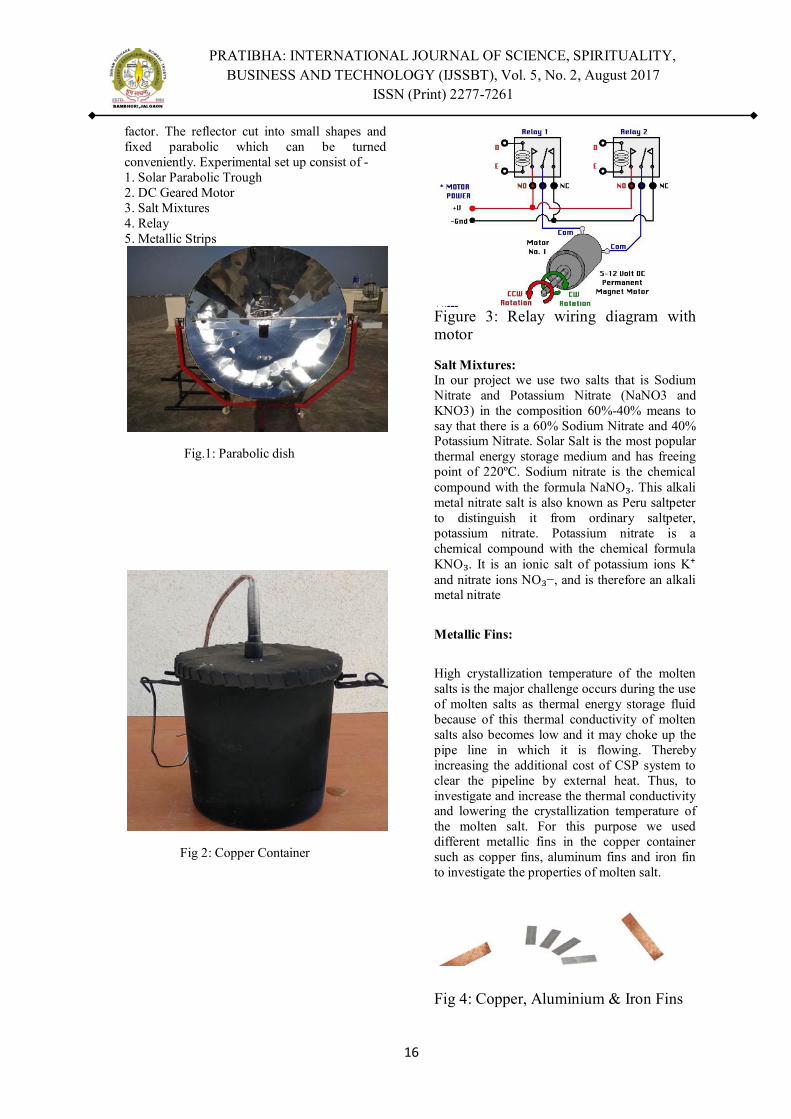
Figure 5.3: Contents of File AUP_M5.pdf
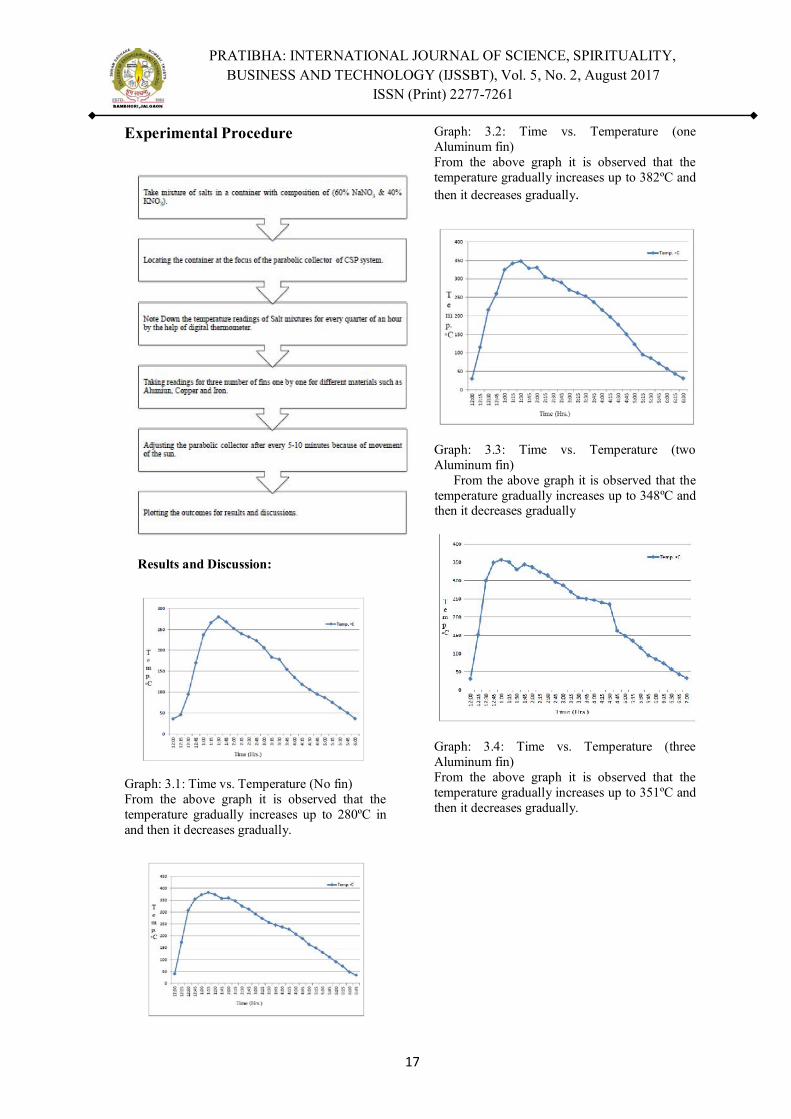
Logical Contains
There are certain cases in which message is logically same but physically different. Following is the example of this case. Consider two text files f1.txt and f2.txt. However their contents are not physically same but logically same. In such cases present work scenario is not able to handle this but we can extend this work to show that the files are duplicate.
Figure 5.4: Results
Fig 5.5: Contain of f1.txt
Fig 5.6: Contain of f2.txt
CONCLUSION
Duplicate file finder system acts as tool to search duplicate files on given drive or directory. Searching duplicate files as the drive or directory is necessary for user perspective as he wants to
13

PRATIBHA: INTERNATIONAL JOURNAL OF SCIENCE, SPIRITUALITY, BUSINESS AND TECHNOLOGY (IJSSBT), Vol. 5, No. 2, August 2017
ISSN (Print) 2277-7261
save the space. Also many a times user may have created several versions of same file which may lead to the confusion.
By using this system user gets flexibility to either delete duplicate files, remove, copy, paste & rename like operations. Due to that we can save the time of user so it is reducing the workload.
REFERENCES
[1] Thorsten Papenbrock, Arvid Heise, and Felix Naumann, “Progressive Duplicate Detection” in IEEE Transactions on Knowledge and Data Engineering, Volume: 27, Issue: 5, May 1 2015, pp.1316 - 1329
[2] Ahmed K. Elmagarmid, Panagiotis G. Ipeirotis, Vassilios S. Verykios, Members, “Duplicate Record Detection”, IEEE Computer Society, Jan 2007.
[3] Jaspreet Singh, “Understanding Data Deduplication”, on Druva Blog 2009 in Product Deep-Dives.
[4] Sanjay Jain, Puneesh Chaudhry, “Methods and apparatus for content-aware data de-duplication”, Apr 12, 2011
[5] Data Deduplication – “Why, When, Where and How”, Evaluator Group. Evaluation Guides, Starter, January 2, 2015.
14
PRATIBHA: INTERNATIONAL JOURNAL OF SCIENCE, SPIRITUALITY, BUSINESS AND TECHNOLOGY (IJSSBT), Vol. 5, No. 2, August 2017
ISSN (Print) 2277-7261
Experimental Investigation of Molten Salt in Concentrated Solar Power System
1Ashish Kumar, Rahul Yuvaraj Bhoi, Lalit Bala Rathod, Arpit Dilip Sarode,Akshay Suresh Joshi,
2Dr S P Shekhawat, 3Mahendra Chouhan 1 Students of Final year Mechanical Engineering, SSBT COET , Jalgaon 2 Professor, Mechanical Engineering Department, SSBT COET , Jalgaon
3 Technical Staff, SSBT COET , Jalgaon
ABSTRACT: Nowadays many scientific and technological efforts are being devoted to Research and Development on thermal energy storage for solar power plants. Abundant use of fossil fuels to meet ever increasing global energy demand has put question marks upon the feasible future of human beings because of the environmental problems. Solar Thermal Energy is one of the major technologies esteemed to replace the fossil fuels. Purpose of this paper is to investigate molten salt as an efficient thermal storage fluid. This project gives insight about the classification and characterization of molten salts as a thermal storage fluid. The experimental setup is developed to test temperature range of Sodium Nitrate (NaNO3) and Potassium Nitrate (KNO3) mixtures using Aluminum, Copper and Iron fins. It is found that using iron fin (02 Nos) are more efficient i.e. attained maximum temperatures in minimum time. These results and successive discussions will be the useful data for future research. Introduction
Concentrated Solar Power (CSP) is considered to be a fairly well developed and low cost renewable energy technology. The use of molten salt heat transfer fluid in a CSP system has several obvious advantages. For instance a trough plant with salt may be possible to raise the output temperature to 450-5000C, thereby increasing the Rankine cycle efficiency for Conventional steam power plant to the 40% range. Solar thermal energy can be stored using different techniques. Technical options associated with the storage of thermal energy have a wide range such as in molten salt. It is required to investigate heat storage medium to increase efficiency of concentrated solar power (CSP) system. The most popular medium is NaNO3-KNO3 mixture in 60:40 ratios. This experimental analysis is the one step to analyze the problem. In this paper we have compiled
physical property information, either measured or estimated, on different salt mixtures. Objectives • To develop experimental facility. • To study the thermal storage capacity. • To study the thermal characteristics of molten salt in terms of maximum temperature. • To study the crystallization properties of molten salts using fins. • To study the thermal analysis.
Research Methodology
1. Study the working of Concentrated Solar Power System.
2. Literature Survey of various Thermal Storage Mediums (TSM).
3. Study of construction and working of Solar Parabolic Dish.
4. To install parabolic collector, salts, copper container and the other accessories required for the experiments,
5. Setting up the experimental facility. 6. Note down the temperature reading for
the experimental time period. 7. For different experimental conditions,
different observation charts and plots are drawn.
8. Result and discussion.
Experimental Setup The experimental setup consists of solar
parabolic trough, black coated copper container, thermocouple, salt mixtures, DC Motors, different types of metallic fins such as copper, aluminum and iron and the electronic controlling systems. Mixtures of salts NaNO3 and KNO3 in the proportion 60%-40% respectively are stored in copper container which is placed at the focus of the solar parabolic trough. When the sunlight rays are incident on the reflective surface they are reflected and conveyed to the surface of the copper container at the curve to heat the salt mixtures and to take change phase. The parabolic dish made with highly reflective panels with 0.8 of reflectance
15
PRATIBHA: INTERNATIONAL JOURNAL OF SCIENCE, SPIRITUALITY, BUSINESS AND TECHNOLOGY (IJSSBT), Vol. 5, No. 2, August 2017
ISSN (Print) 2277-7261
factor. The reflector cut into small shapes and fixed parabolic which can be turned conveniently. Experimental set up consist of - 1. Solar Parabolic Trough 2. DC Geared Motor 3. Salt Mixtures 4. Relay 5. Metallic Strips
Fig.1: Parabolic dish
Fig 2: Copper Container
Figure 3: Relay wiring diagram with motor
Salt Mixtures: In our project we use two salts that is Sodium Nitrate and Potassium Nitrate (NaNO3 and KNO3) in the composition 60%-40% means to say that there is a 60% Sodium Nitrate and 40% Potassium Nitrate. Solar Salt is the most popular thermal energy storage medium and has freeing point of 220ºC. Sodium nitrate is the chemical compound with the formula NaNO₃. This alkali metal nitrate salt is also known as Peru saltpeter to distinguish it from ordinary saltpeter, potassium nitrate. Potassium nitrate is a chemical compound with the chemical formula KNO₃. It is an ionic salt of potassium ions K⁺ and nitrate ions NO₃−, and is therefore an alkali metal nitrate
Metallic Fins:
High crystallization temperature of the molten salts is the major challenge occurs during the use of molten salts as thermal energy storage fluid because of this thermal conductivity of molten salts also becomes low and it may choke up the pipe line in which it is flowing. Thereby increasing the additional cost of CSP system to clear the pipeline by external heat. Thus, to investigate and increase the thermal conductivity and lowering the crystallization temperature of the molten salt. For this purpose we used different metallic fins in the copper container such as copper fins, aluminum fins and iron fin to investigate the properties of molten salt.
Fig 4: Copper, Aluminium & Iron Fins
16
PRATIBHA: INTERNATIONAL JOURNAL OF SCIENCE, SPIRITUALITY, BUSINESS AND TECHNOLOGY (IJSSBT), Vol. 5, No. 2, August 2017
ISSN (Print) 2277-7261
Experimental Procedure
Results and Discussion:
Graph: 3.1: Time vs. Temperature (No fin) From the above graph it is observed that the temperature gradually increases up to 280ºC in and then it decreases gradually.
Graph: 3.2: Time vs. Temperature (one Aluminum fin) From the above graph it is observed that the temperature gradually increases up to 382ºC and then it decreases gradually.
Graph: 3.3: Time vs. Temperature (two Aluminum fin)
From the above graph it is observed that the temperature gradually increases up to 348ºC and then it decreases gradually
Graph: 3.4: Time vs. Temperature (three Aluminum fin) From the above graph it is observed that the temperature gradually increases up to 351ºC and then it decreases gradually.
17
PRATIBHA: INTERNATIONAL JOURNAL OF SCIENCE, SPIRITUALITY, BUSINESS AND TECHNOLOGY (IJSSBT), Vol. 5, No. 2, August 2017
ISSN (Print) 2277-7261
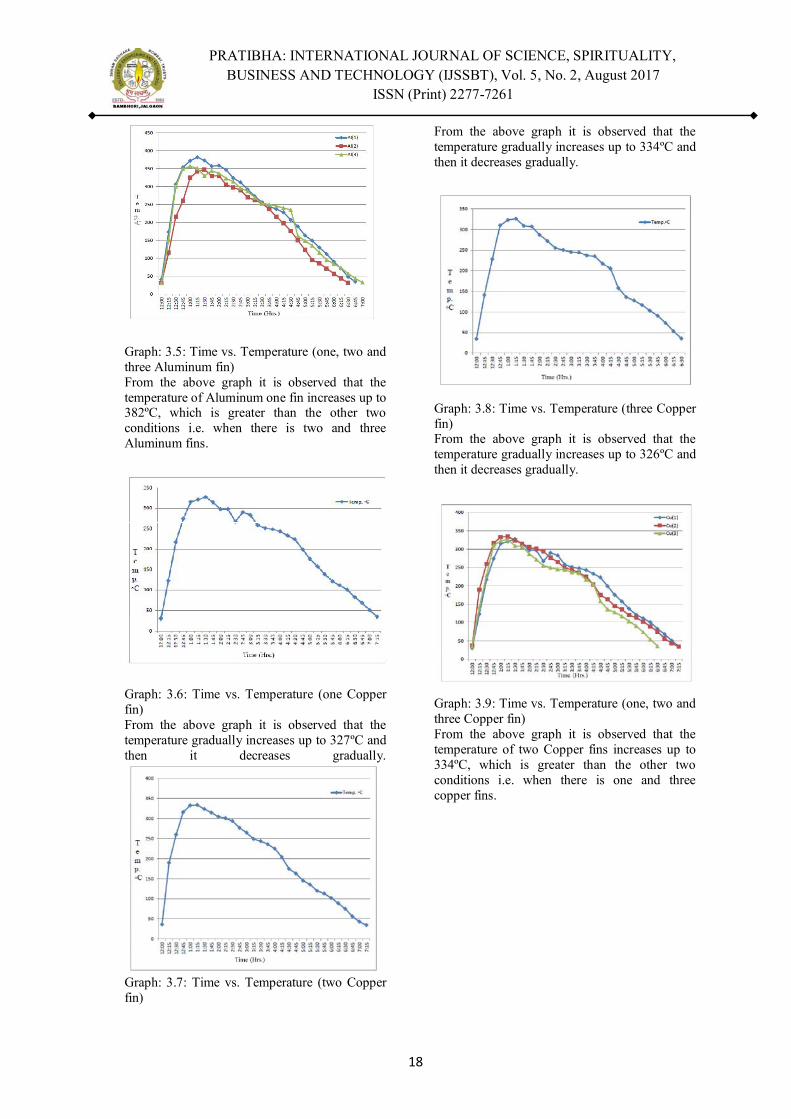
Graph: 3.5: Time vs. Temperature (one, two and three Aluminum fin) From the above graph it is observed that the temperature of Aluminum one fin increases up to 382ºC, which is greater than the other two conditions i.e. when there is two and three Aluminum fins.
Graph: 3.6: Time vs. Temperature (one Copper fin) From the above graph it is observed that the temperature gradually increases up to 327ºC and then it decreases gradually.
Graph: 3.7: Time vs. Temperature (two Copper fin)
From the above graph it is observed that the temperature gradually increases up to 334ºC and then it decreases gradually.
Graph: 3.8: Time vs. Temperature (three Copper fin) From the above graph it is observed that the temperature gradually increases up to 326ºC and then it decreases gradually.
Graph: 3.9: Time vs. Temperature (one, two and three Copper fin) From the above graph it is observed that the temperature of two Copper fins increases up to 334ºC, which is greater than the other two conditions i.e. when there is one and three copper fins.
18
PRATIBHA: INTERNATIONAL JOURNAL OF SCIENCE, SPIRITUALITY, BUSINESS AND TECHNOLOGY (IJSSBT), Vol. 5, No. 2, August 2017
ISSN (Print) 2277-7261
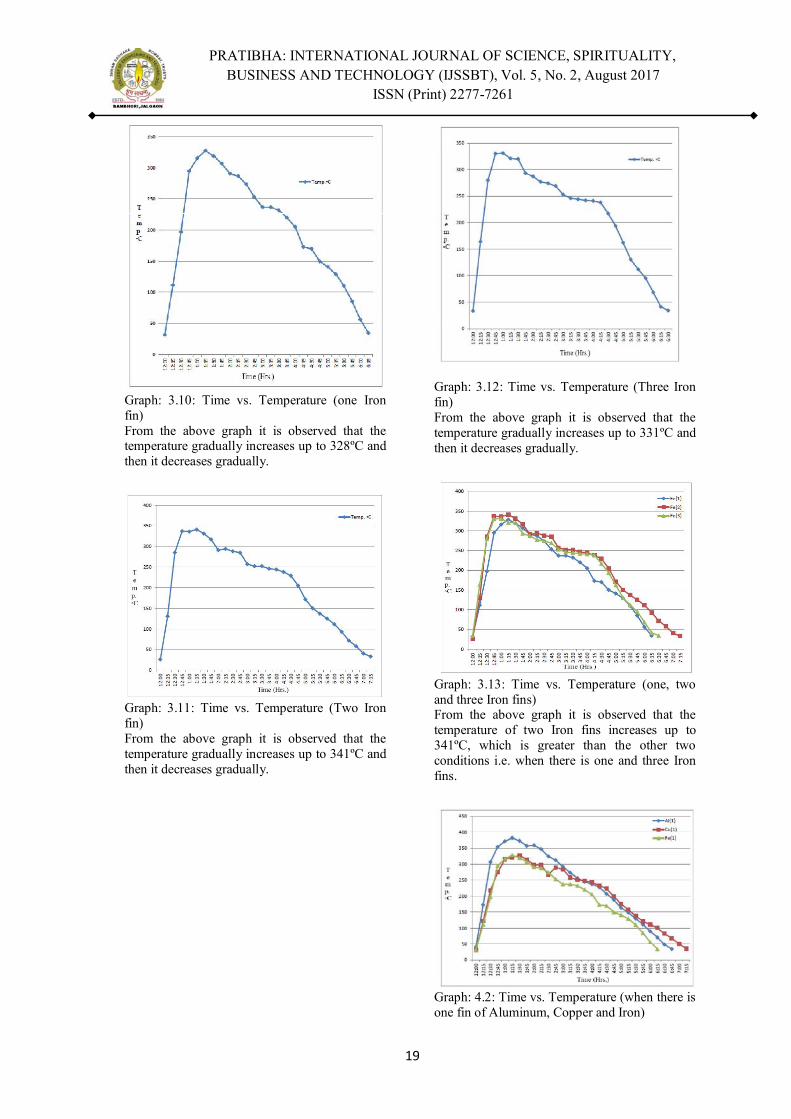
Graph: 3.10: Time vs. Temperature (one Iron fin) From the above graph it is observed that the temperature gradually increases up to 328ºC and then it decreases gradually.
Graph: 3.11: Time vs. Temperature (Two Iron fin) From the above graph it is observed that the temperature gradually increases up to 341ºC and then it decreases gradually.
Graph: 3.12: Time vs. Temperature (Three Iron fin) From the above graph it is observed that the temperature gradually increases up to 331ºC and then it decreases gradually.
Graph: 3.13: Time vs. Temperature (one, two and three Iron fins) From the above graph it is observed that the temperature of two Iron fins increases up to 341ºC, which is greater than the other two conditions i.e. when there is one and three Iron fins.
Graph: 4.2: Time vs. Temperature (when there is one fin of Aluminum, Copper and Iron)
19
PRATIBHA: INTERNATIONAL JOURNAL OF SCIENCE, SPIRITUALITY, BUSINESS AND TECHNOLOGY (IJSSBT), Vol. 5, No. 2, August 2017
ISSN (Print) 2277-7261
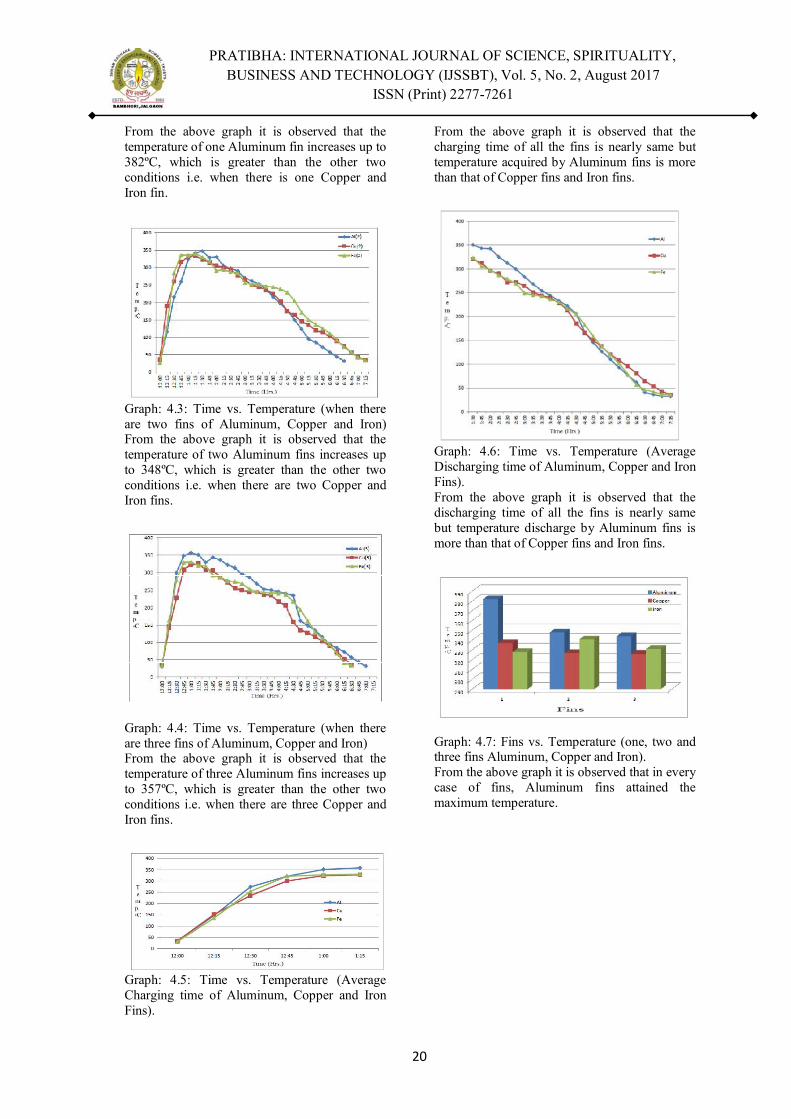
From the above graph it is observed that the temperature of one Aluminum fin increases up to 382ºC, which is greater than the other two conditions i.e. when there is one Copper and Iron fin.
Graph: 4.3: Time vs. Temperature (when there are two fins of Aluminum, Copper and Iron) From the above graph it is observed that the temperature of two Aluminum fins increases up to 348ºC, which is greater than the other two conditions i.e. when there are two Copper and Iron fins.
Graph: 4.4: Time vs. Temperature (when there are three fins of Aluminum, Copper and Iron) From the above graph it is observed that the temperature of three Aluminum fins increases up to 357ºC, which is greater than the other two conditions i.e. when there are three Copper and Iron fins.
Graph: 4.5: Time vs. Temperature (Average Charging time of Aluminum, Copper and Iron Fins).
From the above graph it is observed that the charging time of all the fins is nearly same but temperature acquired by Aluminum fins is more than that of Copper fins and Iron fins.
Graph: 4.6: Time vs. Temperature (Average Discharging time of Aluminum, Copper and Iron Fins). From the above graph it is observed that the discharging time of all the fins is nearly same but temperature discharge by Aluminum fins is more than that of Copper fins and Iron fins.
Graph: 4.7: Fins vs. Temperature (one, two and three fins Aluminum, Copper and Iron). From the above graph it is observed that in every case of fins, Aluminum fins attained the maximum temperature.
20
PRATIBHA: INTERNATIONAL JOURNAL OF SCIENCE, SPIRITUALITY, BUSINESS AND TECHNOLOGY (IJSSBT), Vol. 5, No. 2, August 2017
ISSN (Print) 2277-7261
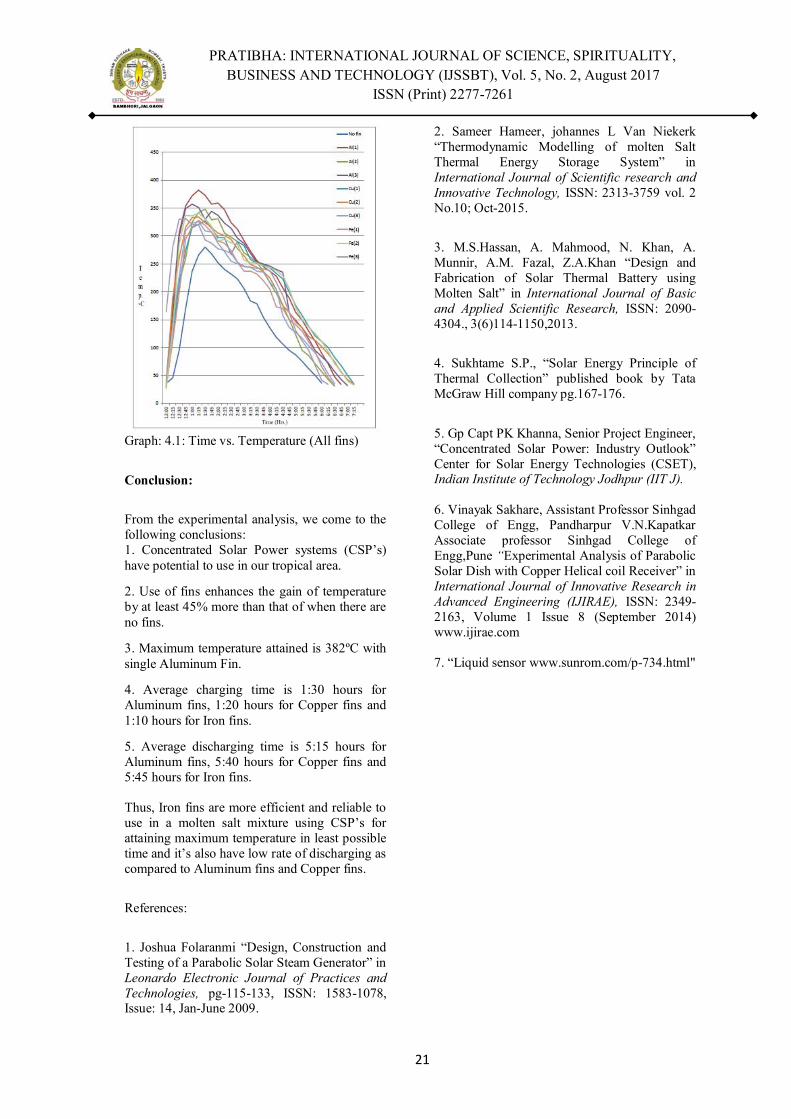
Graph: 4.1: Time vs. Temperature (All fins)
Conclusion:
From the experimental analysis, we come to the following conclusions: 1. Concentrated Solar Power systems (CSP’s) have potential to use in our tropical area.
2. Use of fins enhances the gain of temperature by at least 45% more than that of when there are no fins.
3. Maximum temperature attained is 382ºC with single Aluminum Fin.
4. Average charging time is 1:30 hours for Aluminum fins, 1:20 hours for Copper fins and 1:10 hours for Iron fins.
5. Average discharging time is 5:15 hours for Aluminum fins, 5:40 hours for Copper fins and 5:45 hours for Iron fins. Thus, Iron fins are more efficient and reliable to use in a molten salt mixture using CSP’s for attaining maximum temperature in least possible time and it’s also have low rate of discharging as compared to Aluminum fins and Copper fins.
References:
1. Joshua Folaranmi “Design, Construction and Testing of a Parabolic Solar Steam Generator” in Leonardo Electronic Journal of Practices and Technologies, pg-115-133, ISSN: 1583-1078, Issue: 14, Jan-June 2009.
2. Sameer Hameer, johannes L Van Niekerk “Thermodynamic Modelling of molten Salt Thermal Energy Storage System” in International Journal of Scientific research and Innovative Technology, ISSN: 2313-3759 vol. 2 No.10; Oct-2015.
3. M.S.Hassan, A. Mahmood, N. Khan, A. Munnir, A.M. Fazal, Z.A.Khan “Design and Fabrication of Solar Thermal Battery using Molten Salt” in International Journal of Basic and Applied Scientific Research, ISSN: 2090-4304., 3(6)114-1150,2013.
4. Sukhtame S.P., “Solar Energy Principle of Thermal Collection” published book by Tata McGraw Hill company pg.167-176.
5. Gp Capt PK Khanna, Senior Project Engineer, “Concentrated Solar Power: Industry Outlook” Center for Solar Energy Technologies (CSET), Indian Institute of Technology Jodhpur (IIT J). 6. Vinayak Sakhare, Assistant Professor Sinhgad College of Engg, Pandharpur V.N.Kapatkar Associate professor Sinhgad College of Engg,Pune “Experimental Analysis of Parabolic Solar Dish with Copper Helical coil Receiver” in International Journal of Innovative Research in Advanced Engineering (IJIRAE), ISSN: 2349-2163, Volume 1 Issue 8 (September 2014) www.ijirae.com 7. “Liquid sensor www.sunrom.com/p-734.html"
21
PRATIBHA: INTERNATIONAL JOURNAL OF SCIENCE, SPIRITUALITY, BUSINESS AND TECHNOLOGY (IJSSBT), Vol. 5, No. 2, August 2017
ISSN (Print) 2277-7261
Internet of Things for Smart Cities
1Dr. U. S. Bhadade, Prof. & Head, Department of IT, SSBT’s COET, Bambhori, Jalgaon 2S. J. Patil Assistant Prof., Department of IT, SSBT’s COET, Bambhori, Jalgaon
ABSTRACT : IoT (Internet of Things) is the network of physical objects-devices, vehicles, buildings and other items embedded with electronics, software, sensors, and network connectivity that enables these objects to collect and exchange data. The internet of things allows objects to be sensed and controlled remotely across existing network infrastructure. According to the Gartner, 260 million objects will be connected by year 2020. Several companies and governments have tried to make references with IoT in initial times, but nowadays in manufacturing, retail and SOC (Social Overhead Capital) industries, successful best practices are built recently. In this paper we focus specifically to an urban IoT system that, while still being quite a broad category, are characterized by their specific application domain of measuring certain environmental parameters. Urban IoTs, in fact, are designed to support the Smart City vision, which aims at exploiting the most advanced communication technologies to support added-value services for the administration of the city and for the citizens. This paper hence provides a comprehensive implementation of a system that measures temperature, sound, humidity, CO2 etc. Furthermore, the paper presents the technical solutions and by which we have disseminated information to the people through web site. We have also discussed the components of the system that made this concept a realization with system architecture. Keywords: IoT, Internet of Things, Smart city, environmental parameter, CO2, temperature, humidity, noise. I. INTRODUCTION
The IoT has a large role to play in future smart cities. The IoT can be used in practically all
scenarios for public services by governments. Basically IoT is the platform where we connect any electronic device and access it using the World Wide Web. Sensor-enabled devices can help monitor the environmental impact of cities, collect details about sewers, air quality, and garbage. Such devices can also help monitor woods, rivers, lakes, and oceans. Many environmental trends are so complex, that they are difficult to conceptualize.[1][2]
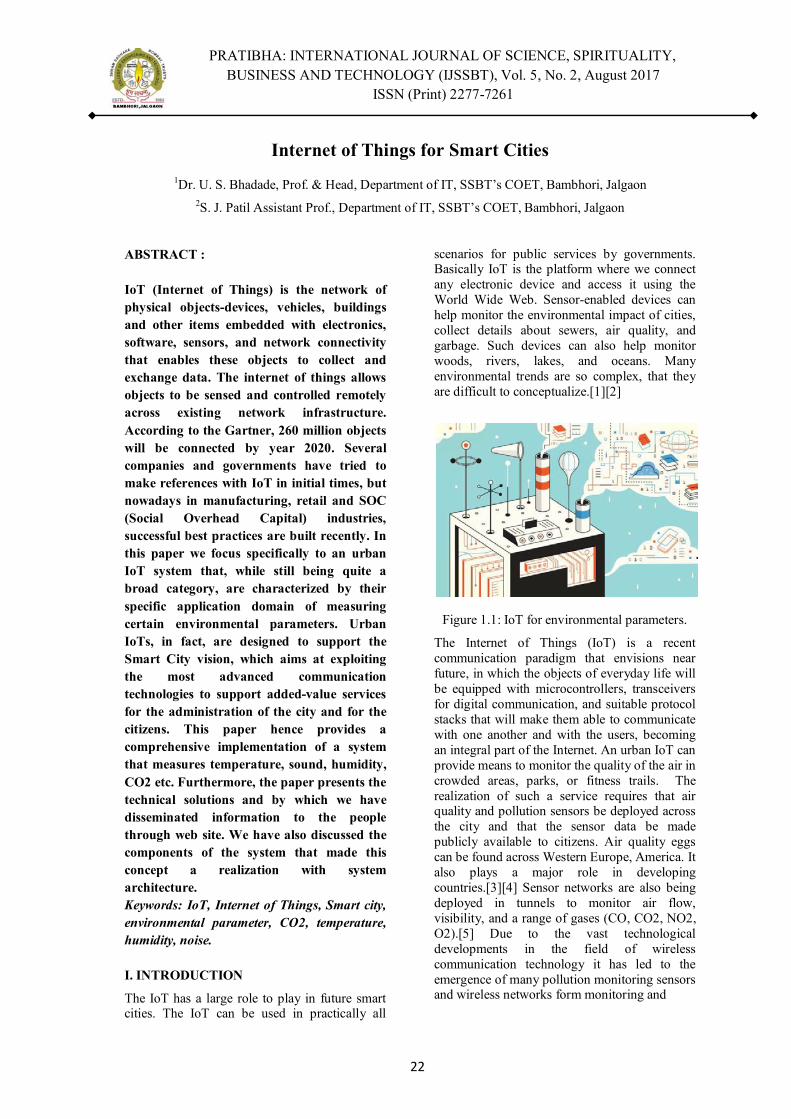
Figure 1.1: IoT for environmental parameters.
The Internet of Things (IoT) is a recent communication paradigm that envisions near future, in which the objects of everyday life will be equipped with microcontrollers, transceivers for digital communication, and suitable protocol stacks that will make them able to communicate with one another and with the users, becoming an integral part of the Internet. An urban IoT can provide means to monitor the quality of the air in crowded areas, parks, or fitness trails. The realization of such a service requires that air quality and pollution sensors be deployed across the city and that the sensor data be made publicly available to citizens. Air quality eggs can be found across Western Europe, America. It also plays a major role in developing countries.[3][4] Sensor networks are also being deployed in tunnels to monitor air flow, visibility, and a range of gases (CO, CO2, NO2, O2).[5] Due to the vast technological developments in the field of wireless communication technology it has led to the emergence of many pollution monitoring sensors and wireless networks form monitoring and
22
PRATIBHA: INTERNATIONAL JOURNAL OF SCIENCE, SPIRITUALITY, BUSINESS AND TECHNOLOGY (IJSSBT), Vol. 5, No. 2, August 2017
ISSN (Print) 2277-7261
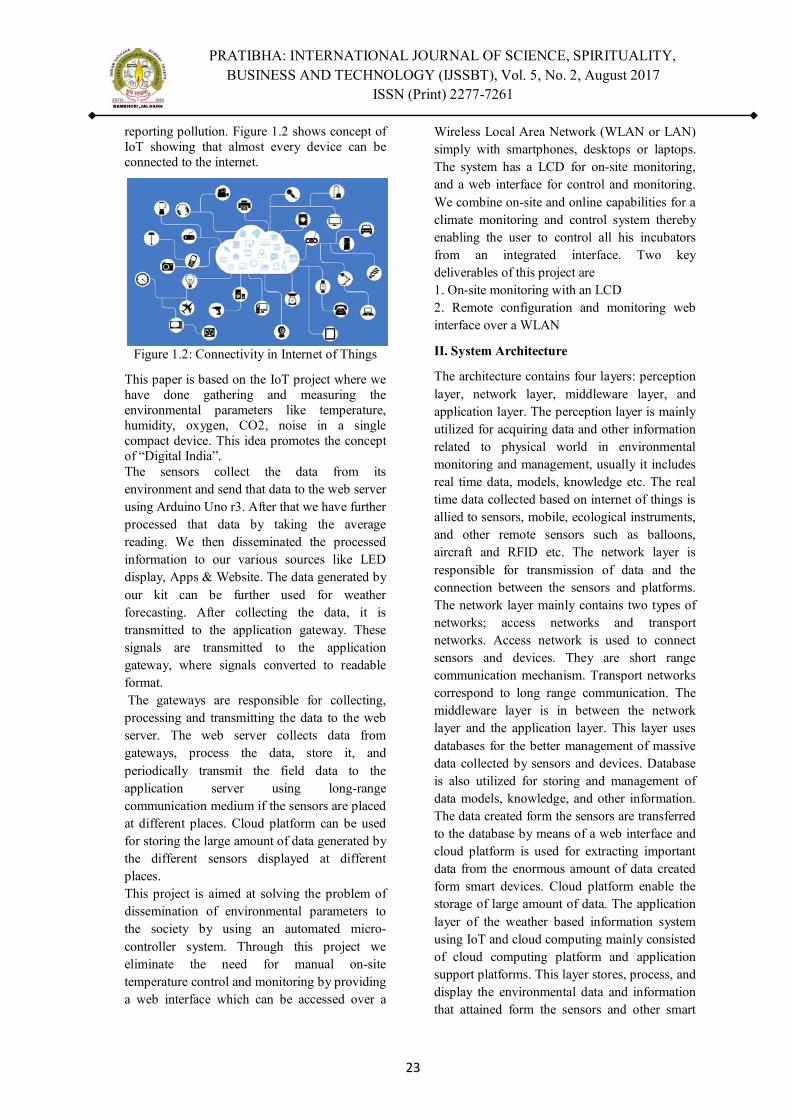
reporting pollution. Figure 1.2 shows concept of IoT showing that almost every device can be connected to the internet.
Figure 1.2: Connectivity in Internet of Things
This paper is based on the IoT project where we have done gathering and measuring the environmental parameters like temperature, humidity, oxygen, CO2, noise in a single compact device. This idea promotes the concept of “Digital India”. The sensors collect the data from its environment and send that data to the web server using Arduino Uno r3. After that we have further processed that data by taking the average reading. We then disseminated the processed information to our various sources like LED display, Apps & Website. The data generated by our kit can be further used for weather forecasting. After collecting the data, it is transmitted to the application gateway. These signals are transmitted to the application gateway, where signals converted to readable format. The gateways are responsible for collecting, processing and transmitting the data to the web server. The web server collects data from gateways, process the data, store it, and periodically transmit the field data to the application server using long-range communication medium if the sensors are placed at different places. Cloud platform can be used for storing the large amount of data generated by the different sensors displayed at different places. This project is aimed at solving the problem of dissemination of environmental parameters to the society by using an automated micro-controller system. Through this project we eliminate the need for manual on-site temperature control and monitoring by providing a web interface which can be accessed over a
Wireless Local Area Network (WLAN or LAN) simply with smartphones, desktops or laptops. The system has a LCD for on-site monitoring, and a web interface for control and monitoring. We combine on-site and online capabilities for a climate monitoring and control system thereby enabling the user to control all his incubators from an integrated interface. Two key deliverables of this project are 1. On-site monitoring with an LCD 2. Remote configuration and monitoring web interface over a WLAN
II. System Architecture
The architecture contains four layers: perception layer, network layer, middleware layer, and application layer. The perception layer is mainly utilized for acquiring data and other information related to physical world in environmental monitoring and management, usually it includes real time data, models, knowledge etc. The real time data collected based on internet of things is allied to sensors, mobile, ecological instruments, and other remote sensors such as balloons, aircraft and RFID etc. The network layer is responsible for transmission of data and the connection between the sensors and platforms. The network layer mainly contains two types of networks; access networks and transport networks. Access network is used to connect sensors and devices. They are short range communication mechanism. Transport networks correspond to long range communication. The middleware layer is in between the network layer and the application layer. This layer uses databases for the better management of massive data collected by sensors and devices. Database is also utilized for storing and management of data models, knowledge, and other information. The data created form the sensors are transferred to the database by means of a web interface and cloud platform is used for extracting important data from the enormous amount of data created form smart devices. Cloud platform enable the storage of large amount of data. The application layer of the weather based information system using IoT and cloud computing mainly consisted of cloud computing platform and application support platforms. This layer stores, process, and display the environmental data and information that attained form the sensors and other smart
23
PRATIBHA: INTERNATIONAL JOURNAL OF SCIENCE, SPIRITUALITY, BUSINESS AND TECHNOLOGY (IJSSBT), Vol. 5, No. 2, August 2017
ISSN (Print) 2277-7261
objects. Applications layer provides a web interface for the display of information obtained from sensor generated data. The system components are sensor nodes, application gateways, and application servers. The sensor nodes are allotted for real world data acquisition using sensors, and transmitting the data to the gateways using short range communications. The connection between the sensors, gateways and between gateways and system depends upon the application. The application server is responsible long term data storage, and interface and process by users. Application servers provide an interface to the users by means of a web application, that the users can access the data in a visual model format.
III. System Components
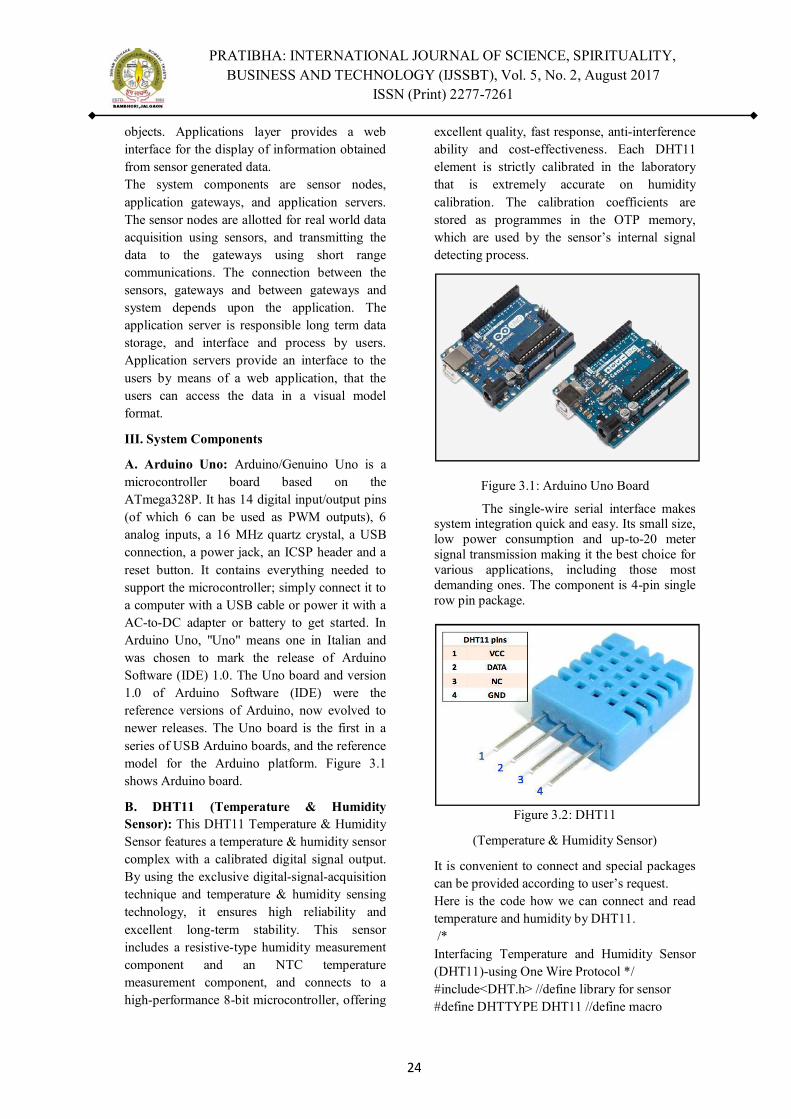
A. Arduino Uno: Arduino/Genuino Uno is a microcontroller board based on the ATmega328P. It has 14 digital input/output pins (of which 6 can be used as PWM outputs), 6 analog inputs, a 16 MHz quartz crystal, a USB connection, a power jack, an ICSP header and a reset button. It contains everything needed to support the microcontroller; simply connect it to a computer with a USB cable or power it with a AC-to-DC adapter or battery to get started. In Arduino Uno, "Uno" means one in Italian and was chosen to mark the release of Arduino Software (IDE) 1.0. The Uno board and version 1.0 of Arduino Software (IDE) were the reference versions of Arduino, now evolved to newer releases. The Uno board is the first in a series of USB Arduino boards, and the reference model for the Arduino platform. Figure 3.1 shows Arduino board.
B. DHT11 (Temperature & Humidity Sensor): This DHT11 Temperature & Humidity Sensor features a temperature & humidity sensor complex with a calibrated digital signal output. By using the exclusive digital-signal-acquisition technique and temperature & humidity sensing technology, it ensures high reliability and excellent long-term stability. This sensor includes a resistive-type humidity measurement component and an NTC temperature measurement component, and connects to a high-performance 8-bit microcontroller, offering
excellent quality, fast response, anti-interference ability and cost-effectiveness. Each DHT11 element is strictly calibrated in the laboratory that is extremely accurate on humidity calibration. The calibration coefficients are stored as programmes in the OTP memory, which are used by the sensor’s internal signal detecting process.
Figure 3.1: Arduino Uno Board
The single-wire serial interface makes system integration quick and easy. Its small size, low power consumption and up-to-20 meter signal transmission making it the best choice for various applications, including those most demanding ones. The component is 4-pin single row pin package.
Figure 3.2: DHT11
(Temperature & Humidity Sensor)
It is convenient to connect and special packages can be provided according to user’s request. Here is the code how we can connect and read temperature and humidity by DHT11. /* Interfacing Temperature and Humidity Sensor (DHT11)-using One Wire Protocol */ #include<DHT.h> //define library for sensor #define DHTTYPE DHT11 //define macro
24

PRATIBHA: INTERNATIONAL JOURNAL OF SCIENCE, SPIRITUALITY, BUSINESS AND TECHNOLOGY (IJSSBT), Vol. 5, No. 2, August 2017
ISSN (Print) 2277-7261
int SensorPin =2; DHT dht(SensorPin, DHTTYPE); //pin initialization float t, h; void setup() { Serial.begin(9600); } void loop() { delay(2000); t=dht.readTemperature(); //object to read the sensor value h=dht.readHumidity(); //object to read the sensor value Serial.print("Temperature="); Serial.println(t); Serial.print("Humidity="); Serial.println(h); } Technical Details 1. Low cost 2. 3 to 5V power and I/O. 3. 2.5mA max current use during conversion (while requesting data). 4. Good for 20-80% humidity readings with 5% accuracy. 5. Good for 0-50°C temperature readings ±2°C accuracy. 6. No more than 1 Hz sampling rate (once every second). 7. Body size 15.5mm x 12mm x 5.5mm. 8. 4 pins with 0.1" spacing. C. BMP180 Sensor: The BMP180 is the function compatible successor of the BMP085, a new generation of high precision digital pressure sensors for consumer applications. The ultra- low power, low voltage electronics of the BMP180 is optimized for use in mobile phones, PDAs, GPS navigation devices and outdoor equipment. With a low altitude noise of merely 0.25m at fast conversion time, the BMP180 offers superior performance. The I2C interface allows for easy system integration with a microcontroller. The BMP180 is based on piezo-resistive technology for robustness, high accuracy and linearity as well as long term stability. Robert Bosch is the world market leader for pressure sensors in automotive applications. Based on the experience of over 400 million pressure sensors in the field, the
BMP180 continues a new generation of micro-machined pressure sensors.
Figure 3.3: BMP180 Sensor
Technical details 1. Vin: 3 to 5VDC 2. Logic: 3 to 5V compliant 3. Pressure sensing range: 300-1100hPa (9000m to -500m above sea level) 4. Up to 0.03hPa / 0.25m resolution 5. -40 to +85°C operational range, +-2°C temperature accuracy 6. This board/chip uses I2C 7-bit address 0x77 D. Ultrasonic Sensor: Ultrasonic ranging module HC-SR04 provides 2cm-400cm non-contact measurement function, where the ranging accuracy can reach to 3mm. The modules includes ultrasonic transmitters, receiver and control circuit. The basic principle of work: 1. Using IO trigger for at least 10us high level signal, 2. The Module automatically sends eight 40 kHz and detect whether there is a pulse signal back. 3. If the signal back, through high level, time of high output IO duration is the time from sending ultrasonic to returning. Test distance = high level time × velocity of sound (340m/s) / 2.
25
PRATIBHA: INTERNATIONAL JOURNAL OF SCIENCE, SPIRITUALITY, BUSINESS AND TECHNOLOGY (IJSSBT), Vol. 5, No. 2, August 2017
ISSN (Print) 2277-7261
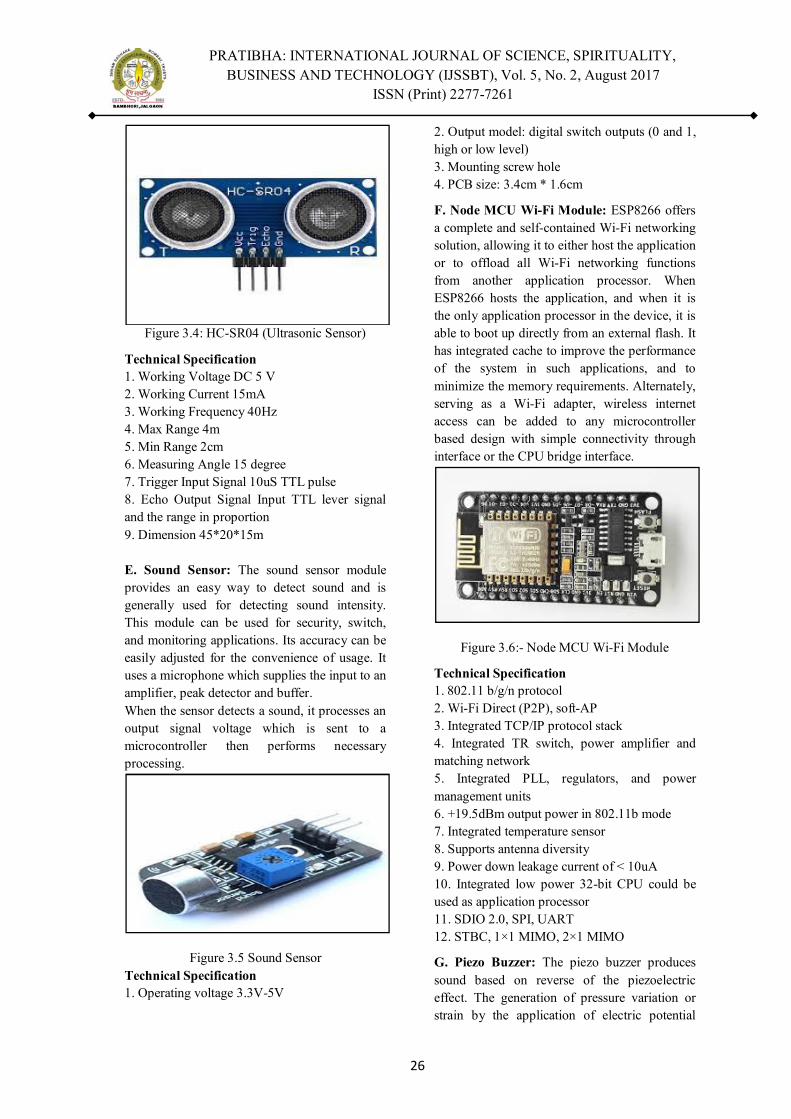
Figure 3.4: HC-SR04 (Ultrasonic Sensor)
Technical Specification 1. Working Voltage DC 5 V 2. Working Current 15mA 3. Working Frequency 40Hz 4. Max Range 4m 5. Min Range 2cm 6. Measuring Angle 15 degree 7. Trigger Input Signal 10uS TTL pulse 8. Echo Output Signal Input TTL lever signal and the range in proportion 9. Dimension 45*20*15m E. Sound Sensor: The sound sensor module provides an easy way to detect sound and is generally used for detecting sound intensity. This module can be used for security, switch, and monitoring applications. Its accuracy can be easily adjusted for the convenience of usage. It uses a microphone which supplies the input to an amplifier, peak detector and buffer. When the sensor detects a sound, it processes an output signal voltage which is sent to a microcontroller then performs necessary processing.
Figure 3.5 Sound Sensor Technical Specification 1. Operating voltage 3.3V-5V
2. Output model: digital switch outputs (0 and 1, high or low level) 3. Mounting screw hole 4. PCB size: 3.4cm * 1.6cm
F. Node MCU Wi-Fi Module: ESP8266 offers a complete and self-contained Wi-Fi networking solution, allowing it to either host the application or to offload all Wi-Fi networking functions from another application processor. When ESP8266 hosts the application, and when it is the only application processor in the device, it is able to boot up directly from an external flash. It has integrated cache to improve the performance of the system in such applications, and to minimize the memory requirements. Alternately, serving as a Wi-Fi adapter, wireless internet access can be added to any microcontroller based design with simple connectivity through interface or the CPU bridge interface.
Figure 3.6:- Node MCU Wi-Fi Module
Technical Specification 1. 802.11 b/g/n protocol 2. Wi-Fi Direct (P2P), soft-AP 3. Integrated TCP/IP protocol stack 4. Integrated TR switch, power amplifier and matching network 5. Integrated PLL, regulators, and power management units 6. +19.5dBm output power in 802.11b mode 7. Integrated temperature sensor 8. Supports antenna diversity 9. Power down leakage current of < 10uA 10. Integrated low power 32-bit CPU could be used as application processor 11. SDIO 2.0, SPI, UART 12. STBC, 1×1 MIMO, 2×1 MIMO
G. Piezo Buzzer: The piezo buzzer produces sound based on reverse of the piezoelectric effect. The generation of pressure variation or strain by the application of electric potential
26

PRATIBHA: INTERNATIONAL JOURNAL OF SCIENCE, SPIRITUALITY, BUSINESS AND TECHNOLOGY (IJSSBT), Vol. 5, No. 2, August 2017
ISSN (Print) 2277-7261
across a piezoelectric material is the underlying principle. These buzzers can be used alert a user of an event corresponding to a switching action, counter signal or sensor input. They are also used in alarm circuits. The buzzer produces a same noisy sound irrespective of the voltage variation applied to it. It consists of piezo crystals between two conductors. When a potential is applied across these crystals, they push on one conductor and pull on the other. This, push and pull action, results in a sound wave. Most buzzers produce sound in the range of 2 to 4 kHz.
Figure 3.7:-Piezo Buzzer.
H. Gas Sensors: MQ-135 gas sensor has a lower conductivity in the clear air as a gas sensing material. In an atmosphere where there may be polluting gas, the conductivity of the gas sensor raises along with the concentration of the polluting gas increases.
Figure: 3.8 MQ-135 Gas Sensor
MQ-135 performs a good detection to smoke and other harmful gas, especially sensitive to ammonia, sulfide and benzene steam. Its ability to detect various harmful gas and lower cost make MQ-135 an ideal choice of different applications of gas detection. Figure 3.9 shows interfacing of gas sensor with Arduino board. I. The Website: The dissemination of the data is done through a website named Explicit Weather. This is part of application layer. The website contains various tabs through which the user can access to different types of information.
Particularly the homepage of the website displays the current values or the average of the values taken from all the locations. The homepage of the website also contains the subscribers list to which if the user wants to subscribe to the regular updates of the information disseminated as shown in figure 3.11-3.12. The services page of the website includes various filters from which the user is able to access particular data for example the user wants the data of a particular date then with the help of constraints the data can be displayed. The login page provides administrator privileges in which the admin can keep the track of the list of subscribers and also can filter the subscribers. Figures from 3.10 to 3.13 shows the results.
Figure 3.9: Gas Sensor Interfacing
IV. Applications
a. Agriculture Field Monitoring: The system can be used for Agricultural field monitoring the moisture content of the field also the temperature around the field and humidity around the atmosphere which can used for crop selection as well as preventive measures. b. Home Automation: Home automation is the most basic application with the use of the sensors the system can be used for home automation provided with various facilities such as remote access to electronic devices. c. Weather forecasting: Weather forecasting is the main perspective of the project the data collected by the sensors are analyzed and the data can be used for forecasting which can be more accurate than before.
27

PRATIBHA: INTERNATIONAL JOURNAL OF SCIENCE, SPIRITUALITY, BUSINESS AND TECHNOLOGY (IJSSBT), Vol. 5, No. 2, August 2017
ISSN (Print) 2277-7261
d. Pollution Control: The system with minor change in sensors can be applicable for the pollution control with the air quality and the content of hazardous gases in air detected and measures for reduction of these gases.
e. Industrial purpose: Highly sensitive areas which cannot be overlooked where the temperature or pressure should not exceed the limit this system can be used.
Figure 3.10: Services Page
Figure 3.11: Services Data Display Page
28
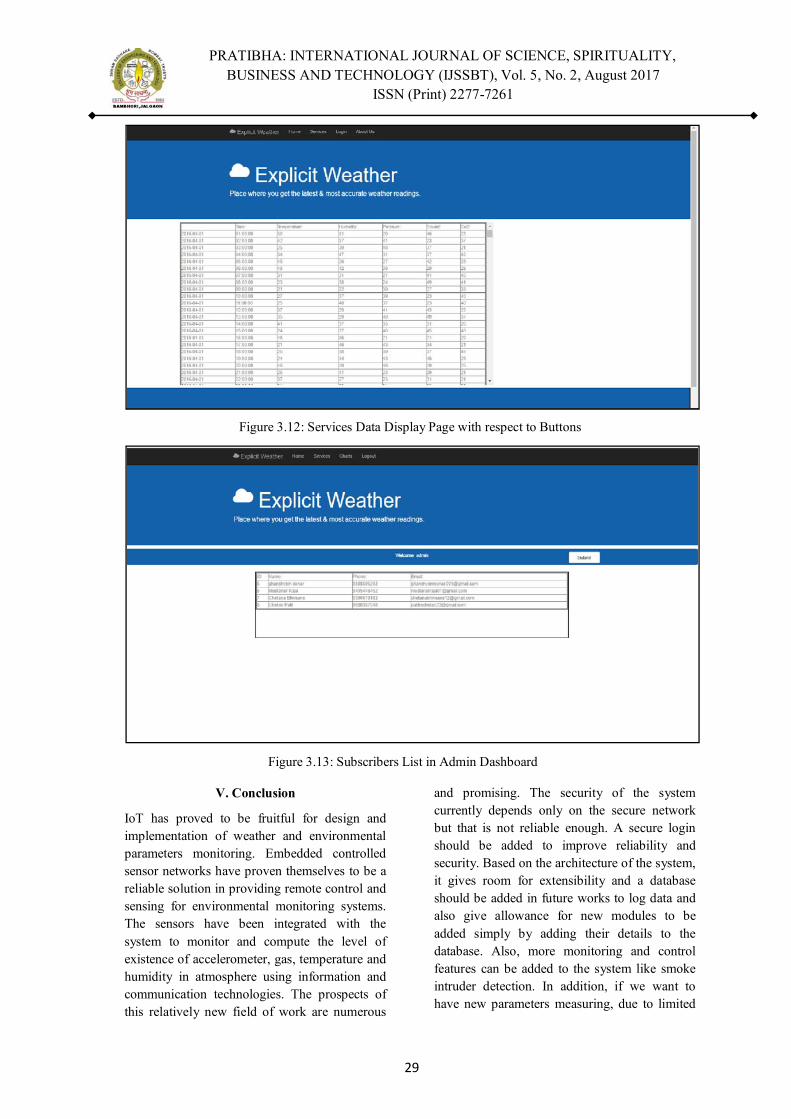
PRATIBHA: INTERNATIONAL JOURNAL OF SCIENCE, SPIRITUALITY, BUSINESS AND TECHNOLOGY (IJSSBT), Vol. 5, No. 2, August 2017
ISSN (Print) 2277-7261
Figure 3.12: Services Data Display Page with respect to Buttons
Figure 3.13: Subscribers List in Admin Dashboard
V. Conclusion
IoT has proved to be fruitful for design and implementation of weather and environmental parameters monitoring. Embedded controlled sensor networks have proven themselves to be a reliable solution in providing remote control and sensing for environmental monitoring systems. The sensors have been integrated with the system to monitor and compute the level of existence of accelerometer, gas, temperature and humidity in atmosphere using information and communication technologies. The prospects of this relatively new field of work are numerous
and promising. The security of the system currently depends only on the secure network but that is not reliable enough. A secure login should be added to improve reliability and security. Based on the architecture of the system, it gives room for extensibility and a database should be added in future works to log data and also give allowance for new modules to be added simply by adding their details to the database. Also, more monitoring and control features can be added to the system like smoke intruder detection. In addition, if we want to have new parameters measuring, due to limited
29
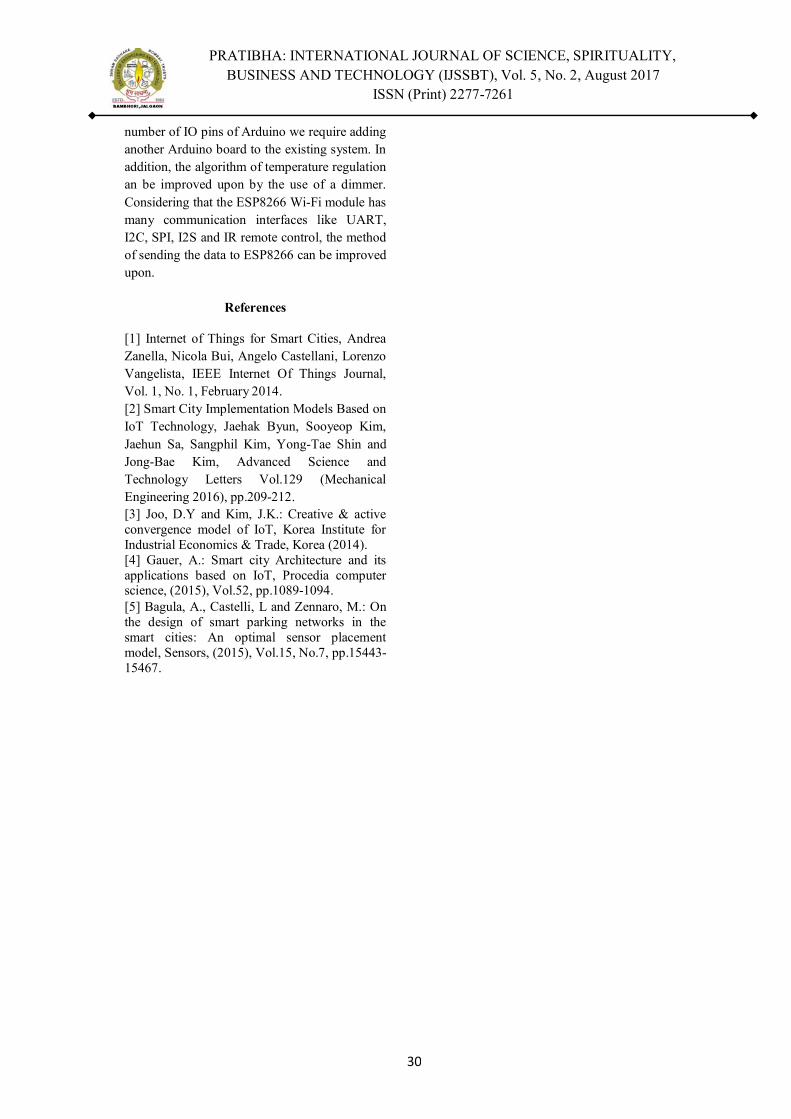
PRATIBHA: INTERNATIONAL JOURNAL OF SCIENCE, SPIRITUALITY, BUSINESS AND TECHNOLOGY (IJSSBT), Vol. 5, No. 2, August 2017
ISSN (Print) 2277-7261
number of IO pins of Arduino we require adding another Arduino board to the existing system. In addition, the algorithm of temperature regulation an be improved upon by the use of a dimmer. Considering that the ESP8266 Wi-Fi module has many communication interfaces like UART, I2C, SPI, I2S and IR remote control, the method of sending the data to ESP8266 can be improved upon.
References
[1] Internet of Things for Smart Cities, Andrea Zanella, Nicola Bui, Angelo Castellani, Lorenzo Vangelista, IEEE Internet Of Things Journal, Vol. 1, No. 1, February 2014. [2] Smart City Implementation Models Based on IoT Technology, Jaehak Byun, Sooyeop Kim, Jaehun Sa, Sangphil Kim, Yong-Tae Shin and Jong-Bae Kim, Advanced Science and Technology Letters Vol.129 (Mechanical Engineering 2016), pp.209-212. [3] Joo, D.Y and Kim, J.K.: Creative & active convergence model of IoT, Korea Institute for Industrial Economics & Trade, Korea (2014). [4] Gauer, A.: Smart city Architecture and its applications based on IoT, Procedia computer science, (2015), Vol.52, pp.1089-1094. [5] Bagula, A., Castelli, L and Zennaro, M.: On the design of smart parking networks in the smart cities: An optimal sensor placement model, Sensors, (2015), Vol.15, No.7, pp.15443-15467.
30
PRATIBHA: INTERNATIONAL JOURNAL OF SCIENCE, SPIRITUALITY, BUSINESS AND TECHNOLOGY (IJSSBT), Vol. 5, No. 2, August 2017
ISSN (Print) 2277-7261
Transmission & Tribological Consideration in Human Powered Electric Generator: A Critical Review
Pravin D. Pati11, Dr. D.S. Deshmukh2, M. P. Mohurle3
1Assistant Professor of Mechanical Engineering, SSBT`s COET, Bambhori, Jalgaon, (M. S.), India [email protected]
2Associate Professor, Dr. Babasaheb Ambedkar College of Engg. & Research, Nagpur, (M. S.), India [email protected]
3Assistant Professor of Mechanical Engineering, G. H. R. P, Jalgaon, (M. S.), India [email protected]
ABSTRACT : In this paper we are mainly dealing with the efficient use of human power as an alternative source of energy. The importance of human power as an alternative energy source is investigated, since beginning to present state and its future scope. Human power credit is more because of health benefit as a source of energy. Human power as prime mover used to operate working unit is termed as human powered machine. So the main concern in this study is to reduce human efforts. More effective use of human power could be achieved through properly designed mechanisms. These include the design of human powered machine with aesthetic and ergonomic consideration.
In this paper we are more focusing on the different conversion devices to transmit human energy into electrical energy. Also we are stressing roll of lubrication to achieve maximum output. One of the main goal of this study is to make these machines very famous among the general people such that they will identify these human powered generators as the easiest, comfortable and immediate source of electrical energy.
Keywords: Human Power machine, Bicycle Technology, Dynapod, Flywheel.
I. INTRODUCTION The content of this paper built around the phenomenon of ‘human-powered energy systems in consumer product’. Although there are various ways of using human power, this paper focuses on the conservation of muscular work into electricity. Products discussed in this paper are therefore characterized by the presence of a technical system converting muscular work into electricity. Human power is generally defined as a non-conventional power source and seen as battery alternative for electrical products.
A mechanism for the transmission of mechanical power, usually with a transformation of the forces, torques, speeds, and in some cases, the nature of the motion. In machine drives, power transmission makes it possible to match the operating conditions of the motor with those of the machine’s working elements. It also allows several mechanisms to be driven from one motor, reverses the direction of motion, alters torques and rotational speeds while maintaining a constant torque and speed for the motor, and converts rotational motion into reciprocating, helical, or other type of motion. The most common power transmissions in machine building have mechanical linkages, although hydraulic, pneumatic, and other types are occasionally used. In order to drive different mechanisms in one machine, different types of power transmissions are sometimes used, combinations of transmissions, as in hydro mechanical power transmissions. The economic advantage of using high-speed motors in machines (because of their smaller dimensions, weight, and cost) accounts for the preference for power transmissions that reduce the speed of the driven shaft in comparison to that of the driving shaft.
Mechanical power transmissions are compact, suitable for machine layouts, and very reliable. They make it possible to achieve in a relatively simple fashion the required conversion of motion and practically any transmission characteristics. With proper manufacturing, the majority of power transmissions have a high efficiency.
II. TRANSMISSION MECHANISM
A. Belt Drive
A belt is a loop of flexible material used to link two or more rotating shafts mechanically, most often parallel. Belts may be used as a source of motion, to transmit power efficiently, or to track relative movement. Belts are looped over pulleys and may have a twist between the pulleys, and the shafts need not be parallel. In a two pulley system,
31
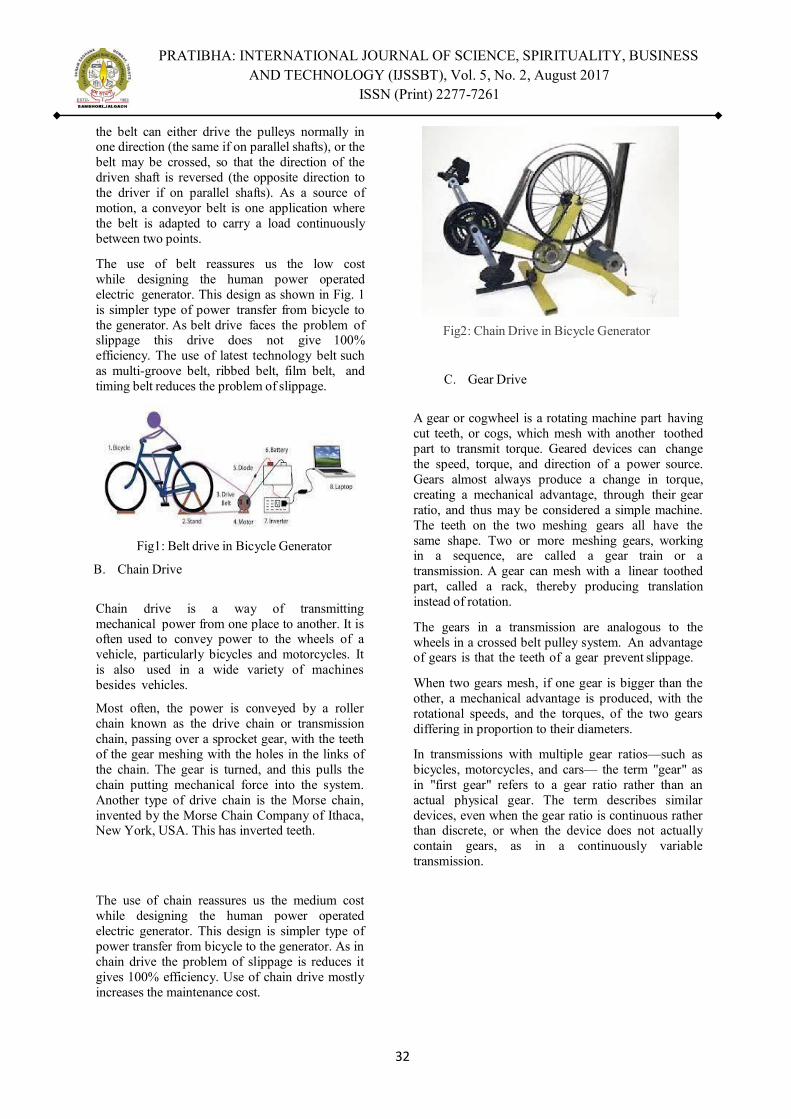
PRATIBHA: INTERNATIONAL JOURNAL OF SCIENCE, SPIRITUALITY, BUSINESS AND TECHNOLOGY (IJSSBT), Vol. 5, No. 2, August 2017
ISSN (Print) 2277-7261
the belt can either drive the pulleys normally in one direction (the same if on parallel shafts), or the belt may be crossed, so that the direction of the driven shaft is reversed (the opposite direction to the driver if on parallel shafts). As a source of motion, a conveyor belt is one application where the belt is adapted to carry a load continuously between two points.
The use of belt reassures us the low cost while designing the human power operated electric generator. This design as shown in Fig. 1 is simpler type of power transfer from bicycle to the generator. As belt drive faces the problem of slippage this drive does not give 100% efficiency. The use of latest technology belt such as multi-groove belt, ribbed belt, film belt, and timing belt reduces the problem of slippage.
Fig1: Belt drive in Bicycle Generator
B. Chain Drive
Chain drive is a way of transmitting mechanical power from one place to another. It is often used to convey power to the wheels of a vehicle, particularly bicycles and motorcycles. It is also used in a wide variety of machines besides vehicles.
Most often, the power is conveyed by a roller chain known as the drive chain or transmission chain, passing over a sprocket gear, with the teeth of the gear meshing with the holes in the links of the chain. The gear is turned, and this pulls the chain putting mechanical force into the system. Another type of drive chain is the Morse chain, invented by the Morse Chain Company of Ithaca, New York, USA. This has inverted teeth.
The use of chain reassures us the medium cost while designing the human power operated electric generator. This design is simpler type of power transfer from bicycle to the generator. As in chain drive the problem of slippage is reduces it gives 100% efficiency. Use of chain drive mostly increases the maintenance cost.
Fig2: Chain Drive in Bicycle Generator
C. Gear Drive
A gear or cogwheel is a rotating machine part having cut teeth, or cogs, which mesh with another toothed part to transmit torque. Geared devices can change the speed, torque, and direction of a power source. Gears almost always produce a change in torque, creating a mechanical advantage, through their gear ratio, and thus may be considered a simple machine. The teeth on the two meshing gears all have the same shape. Two or more meshing gears, working in a sequence, are called a gear train or a transmission. A gear can mesh with a linear toothed part, called a rack, thereby producing translation instead of rotation.
The gears in a transmission are analogous to the wheels in a crossed belt pulley system. An advantage of gears is that the teeth of a gear prevent slippage.
When two gears mesh, if one gear is bigger than the other, a mechanical advantage is produced, with the rotational speeds, and the torques, of the two gears differing in proportion to their diameters.
In transmissions with multiple gear ratios—such as bicycles, motorcycles, and cars— the term "gear" as in "first gear" refers to a gear ratio rather than an actual physical gear. The term describes similar devices, even when the gear ratio is continuous rather than discrete, or when the device does not actually contain gears, as in a continuously variable transmission.
32

PRATIBHA: INTERNATIONAL JOURNAL OF SCIENCE, SPIRITUALITY, BUSINESS AND TECHNOLOGY (IJSSBT), Vol. 5, No. 2, August 2017
ISSN (Print) 2277-7261
The main advantage of this drive when used for the design of human powered operated generator is to reduce the size of machine. As it is positive drive maximum efficiency is achieved.
Fig3: Belt Drive in Bicycle Generator
D. COMPARISON BETWEEN DRIVES
III. TRIBOLOGICAL CONSIDERATIONS
The general purpose of this is to explain the fundamental theory of tribology and to study the behavior of machine elements behavior with tribology. This paper was commissioned by HAMK University of Applied Sciences with the aim to provide additional studying material for this science area. The initial background was based on machine elements theory and the thesis results are essential knowledge for machinery related design.
This work aims to define theory and results behind friction phenomena. Also, to determine different wear types and reasons for wear failure. This paper also focuses on different aspects of lubrication and the influence of viscosity and lubrication regimes on machine elements performance. An additional target of paper was to present tribological behavior of gears and sliding elements.
The starting theory used in this paper was based on machine elements and strength of materials studies but it required a further knowledge of other fields such fluid and solids mechanics, thermodynamics, physics and material science. The paper focuses only on tribological functions of gears and sliding elements and requires previous knowledge of these elements.
The studies presented in this work allowed analysis of different phenomena causing friction and the definition of different formulas to evaluate friction. This paper also provided methods of calculations to predict wear losses under non-lubricated and lubricated conditions.
Furthermore lubrication regimes for operating machine elements and viscosity response for different working conditions were presented. Finally, equations quantifying bearing and gears tribological behaviour were determined.
If all these concern of friction and lubrication are taken into consideration then we can design electric generator which will give a maximum efficiency. This maximum efficiency is achieved as in terms of reducing human efforts. The properly lubricated system will ensure low loss of energy and thus maximum utilization of human power.
II. CONCLUSION
In conclusion human power there is vast scope in economical use of Bicycle mechanism as an alternative energy Source thereby renewable energy generation as well as exercising for good health cause.
When we will adopt the proper drive system for transmission of human energy into electrical energy we can utilize the maximum efficiency. Thus lubrication of machine will make it comfortable to operate this machine. Once our machine will thus ergonomically comfortable then in near future these machine will become very famous.
Belt Chain Gear Required alignment
accuracy
Medium Medium High
Positive drive
No (except toothed)
Yes Yes
Efficiency Medium High Variable Stiffness LOW High High Strength Low-
medium High High
Ability to span large distances
Medium Medium Low
Maintenance Medium High Medium Cost Low Low Medium
33
33

PRATIBHA: INTERNATIONAL JOURNAL OF SCIENCE, SPIRITUALITY, BUSINESS AND TECHNOLOGY (IJSSBT), Vol. 5, No. 2, August 2017
ISSN (Print) 2277-7261
III. ACKNOWLEDGEMENT:
Authors are thankful to the SSBT`s, College of Engineering and Technology, Bambhori, Jalgaon for providing library facility. The authors would like to thank the staff and colleagues for useful discussions.
IV. REFERENCES
1. ŞtefanMocanu, Adrian Ungureanu, RaduVarbanescu, ―Bike-Powered Electricity Generator , Asia Pacific Journal of Multidisciplinary Research, Vol. 3, No. 1, February 2015.
2. Rajneesh Suhalka, Mahesh Chand Khandelwal, Krishna Kant Sharma, AbhishekSanghi, “Generation of Electrical Power using Bicycle Pedal”, International Journal of Recent Research and Review, Vol.VII, Issue 2, June 2014, ISSN 2277 – 8322.
3. Shunmugham R. Pandian, “A Human Power Conversion System Based on Children‘s Play”, 0-78038390-7/04/$20.00 (C) IEEE.
4. Green, Robert E. et al. (eds) (1996), Machinery's Handbook (25 ed.), New York, NY, USA: Industrial Press, ISBN 978-0-8311-2575-2.
5. Sclater, Neil. (2011). "Chain and belt devices and mechanisms." Mechanisms and Mechanical Devices Sourcebook. 5th ed. New York: McGraw Hill. pp. 262– 277. ISBN 9780071704427. Drawings and designs of various drives.
6. John J. Flather, Rope-Driving: A treatise on the transmission of power by means of fibrous ropes, Wiley, New York, 1895.
7. J. P. Modak (1982): Manufacture of Lime- Flyash-Sand Bricks using Manually Driven Brick Making Machine, Project Report, Project sponsored by MHADA, Mumbai, Emeritus Professor of Mechanical Engineering and Dean (R&D) Priyadarshini College of Engineering, Near Central Reserve Police Force Campus, Hingna Road, MIDC, NAGPUR 440019 (INDIA), pp 1-50.
8. Zakiuddin Sayed Kazi, J.P. Modak (2010): Design and Development of Human Energized Chaff Cutter, New York Science Journal, PP. 104-108.
9. www.ferrari-tractors.com: A treadle powered machine FT 370, Gridley, CA 95948
10. Arjen Jansen, “Human power Empirically Explored”, PhD Thesis, Delft University of Technology, January 2011, ISBN978- 90-5155-072-6.
11. J. P. MODAK, “Human Powered Flywheel Motor Concept, Design, Dynamics And Applications” Emeritus Professor of Mechanical Engineering and Dean (R&D) ,Priyadarshini College of Engineering, Near Central Reserve Police Force Campus, Hingna Road, MIDC, NAGPUR 440019 (INDIA)
12. Shunmugham R. Pandian, “A Human Power Conversion System Based on Children’s Play”, Department of Electrical Engineering and Computer Science, Tulane University, New Orleans, LA 70118 .
13. Kajogbola R. Ajao, Kadiri Mustapha, Modupe R. Mahamood and Muritala O. Iyanda1, “Design and Development of a Pedal-powered Soap Mixer ”, New York Science Journal, 2010;3(1).
34
PRATIBHA: INTERNATIONAL JOURNAL OF SCIENCE, SPIRITUALITY, BUSINESS AND TECHNOLOGY (IJSSBT), Vol. 5, No. 2, August 2017
ISSN (Print) 2277-7261
Experimental, Analytical and Numerical Study of Energy Absorption Properties of Aluminium Crush Boxes with and without Buckling
Initiators (axial loading) Mr. Atul Gaikwad Mr. Kamal Ukey
PG Research Scholar Guide
ABSTRACT Crashworthiness in automobile is defined as the ability of a passenger car and its internal systems to protect occupants from injury in the event of a crash, In general, injury in passenger car crashes can be considered to arise from three distinct sources: (1) excessive acceleration forces; (2) direct trauma from contact with injurious surfaces, and; (3) exposure to environmental factors such as fire, smoke and chemicals resulting in bums, drowning or asphyxiation.Consequently, effective crashworthiness designs must consider all possible sources of injury and eliminate or mitigate as many as practical for a given design impact limit. This involves considerations of(1) Strength of the body shell, (2) adequacy restraint systems, (3) adequacy of energy attenuation systems, (4) injurious objects in the local environment of occupants, and (5) post-crash factors,principally fire prevention and adequacy of escape. The purpose of this paper is to propose or determine suitable material through literature also designing and developing a suitable crush box used in passenger car, evaluation of its properties and physical behavior through test in laboratory, verify its suitability under the circumstances of accident or impact loading. The crush box of 3mm thickness of material Al 6063 failed to exhibit desired buckling pattern and cracked which is against the design principle of crush boxes. Hence there is search for alternate suitable material through literature.
1.1 Introduction :
This paper is related to occupant safety in a passenger car.Millions of people throughout the world are killed due to the road accidents. With the increase in vehicles, the number of collisions and fatalities has also increased.In view of this, higher demand has been advocated to ensure higher standards of safety in vehicles. This has led to continuous research in designing efficient energy absorbers to dissipate energy during an accident and protecting the occupant in the vehicle. Most of the reviewed research is based
on crushing of prismatic uniform thickness circular and rectangular steel and aluminium cross-section crash boxes. Less research has been published on crash boxes with buckling triggers. To increase robustness of the crush mode and to minimize repair costs to BIW front side rails after a crash, it is desirable for crash box to achieve crush progressively. Here, progressive crush refers to a mode of axial crush that initiates near the tip of the rail and then progresses towards rear. Crash boxes are one of the key energy absorbers during frontal and rear crash of automotive structures. These components not only should absorb significant amount of kinetic energy and have high specific energy absorption, but also control the maximum forces that will be transmitted to the occupant cabin. In uniform thickness crash box without buckling initiators, maximum peak force occurs at start of force displacement curve, which is undesirable, because higher peak value at start of crash event leads to higher force acting on occupant which leads to higher head injury criteria number. Properly designed and placed buckling initiators not only ensure controlled deformations but also minimize initial peak. Energy absorbers, because of their great applications, havea significant importance in the industry and there products and applications. Energy absorbersdevices that transfer the kinetic energy to the other kinds of energy and its main purpose is to reduce the damaging forcewhich is transfer to the structure. Survey of lateral load totubes has been considered as an important group of energyabsorbers by the researchers.
Axial impacts are rarely observed in real life accidents. Also crash boxes designed for axial loading are worst performer for oblique loading. Design proposal plan will be worked out for existing crash boxes to make it good performer during oblique accident event.
1.2 Literature Survey Accidents and occupant’s safety Axial impacts are rarely observed in real life accidents. Also crash boxes designed for axial loading are worst performer for oblique loading. In any collision between vehicles, kinetic energy has to dissipate in a controlled manner that will protect the occupants in the vehicle from bodily injuries or fatalities. Thin-walled tubular
35
PRATIBHA: INTERNATIONAL JOURNAL OF SCIENCE, SPIRITUALITY, BUSINESS AND TECHNOLOGY (IJSSBT), Vol. 5, No. 2, August 2017
ISSN (Print) 2277-7261
metallic structures are very efficient as energy absorbers and can be easily designed into a vehicle’s frontal protection system [1]. Material for Thin walled structure These metallic thin-walled structures have the capability to convert the kinetic energy to strain energy by irreversible plastic deformation. Most of the reported works in the literature on such tubes have used mild steel as the base material for understanding the energy absorption efficiency. However, in the light of efficient fuel economics, aluminum as a lightweight material is gainingpopularity [2]. Analysis – Aluminum Alloy Presented in [3] adopt the non-linear finite element code of ABAQUS to analyze an aluminum-alloy rectangular thin-walled structure, determining the effect of the impact speed and the impact masses on the axial buckling behavior of thin-walled tubes. In the simulation, the property of aluminum was found to be insensitive to the strain rate which was consistent with the experimental results. It was also found that the discrepancy between the dynamic buckling behaviors of cylindrical and rectangular tubes was mainly associated with the transmission of the stress wave in the structure of different geometric shapes. Buckling Generation The work in [4] divided the plastic buckling of a cylindrical shell under axial loading into dynamic progressive buckling and dynamic plastic buckling. When a structure sustains a slower impact, members from one end to the other gradually develop overlapping shrinkage, which process is called dynamic progressive buckling. Dynamic plastic buckling is an overall buckling behavior that is caused by the repeated reflection of the stress wave when the structure is under an impact of high-velocity. Impact test and analysis Conducted in [5] were impact tests on a rectangular AA6060 aluminum- alloy structure. Taking into account the fact that the members were initially imperfect, they investigated the effect of impact mass and impact speed on the energy absorbing behavior of the tubes. They also utilized LS-DYNA to analyze the dynamic response of the aluminum tube to impacts of various speeds and masses. Experimental results were consistent with the destruction pattern and the energy absorbing properties. LS-DYNA were employed [6] to scrutinize hat-shaped sections of various materials, analyzing in detail the effect of the height and initial imperfection of the hat-shaped member on its axial compression behavior.
The Compression Test The compression behaviors of an aluminum-alloy cylindrical tube have been tested [7] which also developed a numerical model that is consistent with experiments. Moreover, the adopted analyticalmodel was used to study the effect of initial imperfection and material strain rate on the axial compression behavior of a thin walled cylindrical tube. Stress-Strain Curve Recent works [8] performed dynamic tensile tests to plot the stress–strain curve of material at various strain rates. The Cowper–Symonds equation were modified form the dynamic parameters to establish a numerical model of thin-walled members made of TRIP and dual phase steel. The findings revealed that the modified dynamic parameters can effectively simulate the deformation behavior of a thin-walled member under impact loading. Analysis of Thin Walled Members Non-linear finite element software LS-DYNA is used to analyze the axial compression behavior andenergy absorption of a high-strength thin-walled member under an impact load. To elucidate the effect of dynamic impact on the strain rate, the Cowper–Symonds equation is applied to analyze the plastic state of stress and the onset of dynamic yielding under different strain rates, such that the modeled deformation behavior of the member is consistent with the actual situation. Results for the thin-walled members made of mild steel and dual phase steel are compared. Assuming two different materials with equal sectional areas, an analysis confirms that the energy absorption of high-strength steel thin-walled component is better than the mild steel thin-walled component. Hence, thin-walled tubes made of high strength steel are investigated using a series of analysis. The relationships between displacement and load, average load and energy absorption properties are obtained in [9]. Investigation of Various Parameters & their correlation [10] Investigates the interaction of design factors such as tube thickness, tube length, and tube cross-sectional aspect ratio, along with friction and impacting mass on crashworthiness parameters such as specific energy absorption contact time, peak force and crush distance. The impact velocity is assumed to be constant at 15 m/s. The focus is on rectangular aluminum tubes and the analysis was carried out by using a validated finite element model. The analysis shows that the factors are not independent of each other and there is some degree of interaction between them. It was found that the
36

PRATIBHA: INTERNATIONAL JOURNAL OF SCIENCE, SPIRITUALITY, BUSINESS AND TECHNOLOGY (IJSSBT), Vol. 5, No. 2, August 2017
ISSN (Print) 2277-7261
trigger mechanism is a very important design factor to be included in the design of thin-walled tubes for energy absorption applications. The improvement of the crush responsedetermined through the reduction of the Initial Peak force (IPK) and the increase of the Specific Energy Absorption (SEA). The cross-section of Crush box & Comparison Square, circular, and elliptic tubes of steel and aluminum were used to compare energy absorption. The experimental results of load-displacement used for verification in the square steel tubes showed good agreement. Three-dimensional simulation was accomplished with a finite element method while the impactor collided with one side of tube and the other side was kept rigid. Square tubes for 2 specified widths with 2 different thicknesses were also compared. In addition, 2 other cross sections including circle and ellipse with the same area were studied for comparison in a load displacement curve. Quasi-static Compression Test AA6063 An experimental work on quasi static compression tests on aluminum AA 6063 circular and square tubes was presented in [13]. Specimen tubes with ratio of R/t = 12 and b/t = 24 for circular and square tubes respectively were prepared and validated with several analytical model developed by previous researchers. The deformation and energy absorption of tubes with different type of cross section (rectangular or square) and with similar volumes, height, mean cross section thickness, and material under loading with different speeds is surveyed and studied in [14]. Axial loading Vs Lateral Loading Lateral loading of tubes are quasi-static type and beside as numerical analysis; also experimental experiences has been performed to evaluate the accuracy of the results. Results from the surveys is indicates that in a same conditions which mentioned above, samples with square cross section,absorb more energy compare to rectangularcross section, and also by increscent in speed of loading, energyabsorption would be more.Quasi-static axial and lateral compression tests were conducted on aluminum tubes of circular,rectangular, and square cross sections on a universal testing machine (Instron model 1197) in [15]. Collapse Pattern in Compression Process During the compression process, different tubes were collapsed in different modes of collapse.These compression processes were also modelled using FORGE2 finite element code. The codehas the capabilities of automatic mesh
generation, modelling of die, creation of material data file,carrying out the finite element computations, and post-processing of results. The deforming tube material was modeled as rigid-visco-plastic. Development of different modes of collapsewas investigated experimentally and computationally. The experimental load-compression curvesand deformed shapes are compared with the computed results and found in good agreement. Study of Oblique Impact In [16], a rectangular steel tube of bumper of light commercial vehicle is subjected to axial & obliqueimpacts. The mean crushing load determined by using equations of square tube are used to validate the results of finiteelement analysis. The reduction in energy absorption during the oblique impacts is studied. Effect of oblique loading onmean crushing load, peak load & crush force efficiency are observed during this work. Simulation Results In [17] plane crash box geometry was studied for the energy absorption. Study was based on analytical, experimental and numerical work. Various parameters like width, thickness, taper which affects on the crash box performance are studied by using Design of experiments in Minitab 17. Crash box crushing behavior is analyzed by using quasi static method. Experimental test was performed on UTM machine. Quasi-static simulation was performed using ANSYS Explicit Dynamic workbench with its Auto -Dyna solver. Good agreement obtained in the results of analytical, experimental and numerical method. By varying the parameters and application of beads different designs were proposed and simulated for the maximum energy absorption. Application of various positioned beads show good influence on the energy absorption. The Post Impact Analysis In [18], the problem of collapse load, post-failure behaviour and energy dissipation of a tubularstructure subjected to lateral impact load is presented. The analytical solution of theproblem of initial collapse load and post-failure behaviour of a single tube is discussed. Theanalysis is limited to the “dynamic progressive crushing”, which means that we take intoaccount the strain-rate but neglect inertia effects. The solution is based on the yield-line analysisand takes into account the impact velocity and strain rate, using the Cowper-Symondsconstitutive relation. The same problem concerning both the single tube and multi-membertubular structure subjected to lateral bending impact load is solved using Finite
37
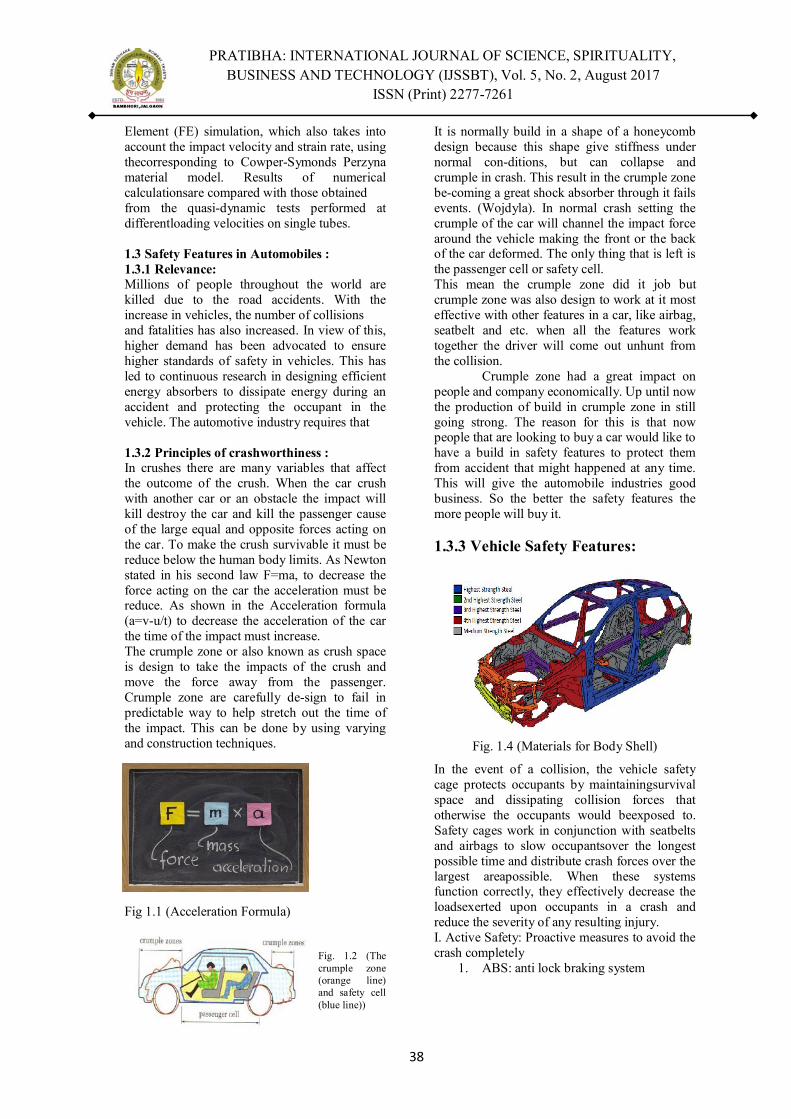
PRATIBHA: INTERNATIONAL JOURNAL OF SCIENCE, SPIRITUALITY, BUSINESS AND TECHNOLOGY (IJSSBT), Vol. 5, No. 2, August 2017
ISSN (Print) 2277-7261
Element (FE) simulation, which also takes into account the impact velocity and strain rate, using thecorresponding to Cowper-Symonds Perzyna material model. Results of numerical calculationsare compared with those obtained from the quasi-dynamic tests performed at differentloading velocities on single tubes. 1.3 Safety Features in Automobiles : 1.3.1 Relevance: Millions of people throughout the world are killed due to the road accidents. With the increase in vehicles, the number of collisions and fatalities has also increased. In view of this, higher demand has been advocated to ensure higher standards of safety in vehicles. This has led to continuous research in designing efficient energy absorbers to dissipate energy during an accident and protecting the occupant in the vehicle. The automotive industry requires that 1.3.2 Principles of crashworthiness : In crushes there are many variables that affect the outcome of the crush. When the car crush with another car or an obstacle the impact will kill destroy the car and kill the passenger cause of the large equal and opposite forces acting on the car. To make the crush survivable it must be reduce below the human body limits. As Newton stated in his second law F=ma, to decrease the force acting on the car the acceleration must be reduce. As shown in the Acceleration formula (a=v-u/t) to decrease the acceleration of the car the time of the impact must increase. The crumple zone or also known as crush space is design to take the impacts of the crush and move the force away from the passenger. Crumple zone are carefully de-sign to fail in predictable way to help stretch out the time of the impact. This can be done by using varying and construction techniques.
Fig 1.1 (Acceleration Formula) Fig. 1.2 (The crumple zone (orange line) and safety cell (blue line))
It is normally build in a shape of a honeycomb design because this shape give stiffness under normal con-ditions, but can collapse and crumple in crash. This result in the crumple zone be-coming a great shock absorber through it fails events. (Wojdyla). In normal crash setting the crumple of the car will channel the impact force around the vehicle making the front or the back of the car deformed. The only thing that is left is the passenger cell or safety cell. This mean the crumple zone did it job but crumple zone was also design to work at it most effective with other features in a car, like airbag, seatbelt and etc. when all the features work together the driver will come out unhunt from the collision.
Crumple zone had a great impact on people and company economically. Up until now the production of build in crumple zone in still going strong. The reason for this is that now people that are looking to buy a car would like to have a build in safety features to protect them from accident that might happened at any time. This will give the automobile industries good business. So the better the safety features the more people will buy it.
1.3.3 Vehicle Safety Features:
Fig. 1.4 (Materials for Body Shell)
In the event of a collision, the vehicle safety cage protects occupants by maintainingsurvival space and dissipating collision forces that otherwise the occupants would beexposed to. Safety cages work in conjunction with seatbelts and airbags to slow occupantsover the longest possible time and distribute crash forces over the largest areapossible. When these systems function correctly, they effectively decrease the loadsexerted upon occupants in a crash and reduce the severity of any resulting injury. I. Active Safety: Proactive measures to avoid the crash completely
1. ABS: anti lock braking system
38

PRATIBHA: INTERNATIONAL JOURNAL OF SCIENCE, SPIRITUALITY, BUSINESS AND TECHNOLOGY (IJSSBT), Vol. 5, No. 2, August 2017
ISSN (Print) 2277-7261
2. ESC: electronic stability control 3. Adaptive cruise control
4. Automatic braking system 5. Daytime running lights 6. Tyre Pressure Monitoring System
(TPMS) 7. On-board breathalyser
II.Passive Safety: Reactive measures to reduce severity of injury after crash occurs
1. Seat belts 2. airbags 3. Energy absorbers 4. Pre-tensioners 5. Load limiters 6. Crumple zones
Thus vehicle safety must have following features to protect occupant 1. Minimize crush to maintain survivalspace
2. Provide proper restraint throughoutthe entire accident event 3. Prevent ejection from the vehicle andnominal seating positions 4. Distribute energy and dissipate crashforces 5. Prevent post-crash fires
1.4 Geometry and Material Used for Making Crush Boxes : 1.4.1 Geometry of crush boxes :
Specimen geometry is known to have significant effect on specific energy absorption. Experimental analysis carried out on circular, square and rectangular cross section tube showed that the order for lay up and tube geometry is greatest for circular tubes followed by square and rectangular tubes. It was found that epoxy shows significant result with variation in geometry as compared to graphite/ epoxy tubes. From the experiment is concluded that nearly elliptical cross section tubes absorb more energy with increase in the percentage of corner in tube. It is also determined that specific energy of glass epoxy specimen decrease by 20% which change in cross section from full to quarter circle. However carbon/Peak tubes showed only 5% change. Experiments conducted studies on various types on crush initiators and its effect on sustained crushing of material. The parts of vehicle that are allowed to damage in a low velocity impact are the bumper and the crash-box. The length of these parts varies with the length of vehicle. We can vary the material properties and sheet thickness to improve the performance of the vehicle at the crash impact. As crash box is separate component it can be varied singly of other components of vehicle.
Therefore it is useful to utilize mathematical optimization by varying the material properties, geometry of the crash-box to improve the performance.Design of crash box should meet following essential condition. 1. Critical buckling force (first maximum peak load) need to be low so that the force dispatched to vehicleframe can be minimized. 2. Energy absorption in crash box deformation should be high. 3. Crash box should be light weight as its weight influences on vehicles weight. 1.4.2Material of crush boxes : In any collision between vehicles, kinetic energy has to dissipate in a controlled manner that will protect the occupants in the vehicle from bodily injuries or fatalities. Thin-walled tubular metallic structures are very efficient as energy absorbers and can be easily designed into a vehicle’s frontal protection system. These metallic thin-walled structures have the capability to convert the kinetic energy to strain energy by irreversible plastic deformation. Most of the reported works in the literature on such tubes have used mild steel as the base material for understanding the energy absorption efficiency. However, in the light of efficient fuel economics, aluminum as a lightweight material is gaining popularity.
1.4.3 Energy Absorbing materials
1. Steel: lower strength to weight ratio compared to Al & Composites.
2. Aluminium: Higher strength to weight ratios
3. Composites: Highest strength to weight ratio
4. Honeycombs & Metal Foams: Higher strength to weight ratio.
Fig. 1.7 Circular, hexagonal and octagonal section absorbs more energy
39

PRATIBHA: INTERNATIONAL JOURNAL OF SCIENCE, SPIRITUALITY, BUSINESS AND TECHNOLOGY (IJSSBT), Vol. 5, No. 2, August 2017
ISSN (Print) 2277-7261
Fig 1.8 Oblique impact responses at different angles The figure shows different material geometries and effect of quasi static compression pattern. The cross sections selected are square, octagonal, circular, rectangular and hexagonal. The cross sectional geometries when subjected to compressional forces buckles differently. The graph in the figure 1.7 represents energy absorption vs displacement and corresponding resultant pattern. While selecting material for the crush boxes one should consider the criteria, the factors selected are material characteristic, cross sectional characteristic and manufacturing methodologies applied.
1.5 Energy Absorbers and Type of Loading : 1.5.1 Energy Absorbers
Crumple zones are structural areas in the front and sometimes rear of a vehicle that are designed to absorb energy upon impact in a predictable way. 1• Crash test results from the National Highway Traffic Safety Administration’s New Car Assessment Program (NCAP) indicate that occupant injury and fatality risk can be reduced by designing vehicles with softer front end structures resulting in larger “maximum crush,” provided there is no intrusion. 2• Newton’s first law states that an object in motion will stay in motion with the same speed and in the same direction unless acted upon by an unbalanced force. As a result, if a vehicle is going 50mph, the bodies inside are as well, and if the vehicle hits a solid wall and comes to a stop immediately, the bodies will want to continue going in the same direction at 50mph.1 • Passengers will continue to move forward at the same speed until they come in contact with a part of the automobile or another human being, causing injury. Even after a human body comes to a stop in an accident, its internal organs continue to move, slamming against each other because of the impact, often causing serious injury or death
3 Newton’s second law of motion, force = mass x acceleration, conveys that as the time it takes for an automobile to come to rest or change direction is increased, the force experienced by the automobile (and its occupants) is decreased. Conversely too, if the time to stop is shorter, the force experienced is greater. 4 Crumple zones add time to the crash by absorbing energy.Crumple zones allow the front of the vehicle to crush like an accordion, absorbing some of the impact of the collision and giving some off in the form of heat and sound. The front of the vehicle effectively acts as a cushion that slows the time it takes for the vehicle to come to a complete stop, applying less force on passengers, which could help save their lives. 5When used in crumple zones, lightweight plastic components can help absorb energy and save vehicle weight at the same time. Located in the front crumple zone, the plastic fan/shroud reservoir of the 2000 Dodge Dakota and Durango saved 1.1 lbs./vehicle, while the plastic bumper beam of the Saturn VUE saved 2.5 lbs. in vehicle weight.5 1.5.2 Type of Loading Crashworthiness of a vehicle is today of great importance. Strict standards need to be adhered to in the industry, in particular to protect human life. In the aim for better performance, the design of vehicles has also evolved to improve protection capabilities. The most important phenomenon in a crush or crash situation is to absorb the kinetic energy. Crash tubes are designed for that purpose and are used in many practical situations. They have the ability to absorb and convert large amounts of kinetic energy into plastic strain energy under severe loading conditions. A vehicle rarely encounters either completely axial or transverse loads, but rather happens in a combination of oblique (or off-axis) impacting direction. So, behavior of the tubes during oblique loading plays important role. 1.5.3 Energy absorption during oblique loading
During oblique loading work, effect of angular impact on energy absorption of rectangular tube is studied as shown in figure 1.9 and 1.10 Various angles atwhich tube was impacted are 0 to 30 deg in steps of 5 deg. The plane is inclined such that it will touch larger side of tube first. From the above curves it is observed that peak load is very much higher for axial loading
40

PRATIBHA: INTERNATIONAL JOURNAL OF SCIENCE, SPIRITUALITY, BUSINESS AND TECHNOLOGY (IJSSBT), Vol. 5, No. 2, August 2017
ISSN (Print) 2277-7261
of the tube. As the angle ofimpact increases, the load –displacement curves flatten out. Figure 1.8 shows deformed shapes of tube for various angles of impact. It is clearly seen that as the angle of impact increases, tube fails in global bending mode rather than progressive folding mode. Progressive folding is desired mode of deformation & is obtained in axial loading.
Fig 1.9 Force displacement curve 1.5.4 Energy absorption during Axial loading For the experimental tests, a minimum of five samples were used for each test. Fig 1.9shows force-displacement curves of the conventional tube subjected to axial static loading.Simulation result compared favorably with the experimental result. Both curves show high IPF followed bylower fluctuating mean forces. Experimental values were slightly lower than the simulation values. This could bedue to specimen imperfections in the form of tube geometry and material properties.
1.6 Expermental SET-UP and Conclusion : 1.6.1 Test set-up for Tensile Test
Sample is selected based on literature survey, many paper on similar article or study suggests Aluminum AA6063 material. A rectangular piece of dimension 100mmX100mmX3mm is selected and purchased from the local market. Three test were decided to carry out, one is tensile, another one is compression and last one is compression with buckling initiators. For tensile test a piece of 200mm hollow rectangular sample is machined to obtain the desired dimension and testing is done at lab, shown in fig 1.10 a& b. The tensile is done evaluate the material properties
Fig 1.10 Test sample & Lab setup
1.6.2 Test set-up for Compression Test For compression test the test sample of
100mmX100mmX3mm with the height of 220mm is selected with material AA6063. The same is offered to Metalab, for carrying out the test. The test set-up is shown in figure below. The test is carried out on Universal Testing machine, UTM UTES 60 TS. Fig 1.13 aCompression Test sample& Setup 6.3 Results and Conclusion
6.3 Tensile & Compression Test Results
The specimen having thickness of 3.03mm and the width of 19.96mm prepared by to suit to the UTM The original gauge length was 50mm. The machine pre-load at 0.2% is 12.75kN. The ultimate load observed to be 14.16kN. The final length of specimen obtained is 56.40mm. The Ultimate tensile stress obtained is 0.234kN/mm2.The table1 below summarizes tensile test results. The rectangular specimen of 100mmX100mmX3mm of height 225mm was prepared to carryout compression at Metalab. The figure 1.11 is a result of compression test carried out on UTM. The specimen cracked while compressing which is against the designed principle of crush box Table 1 Tensile results for sample
Fig 1.11 Failed compression sample Aluminium crash box tube (3mm thickness) with grade 6063 H9 showed failure in brittle manner even though it is ductile material. Tested Aluminium square crash box with 6063 grade does not meet design principle of crashworthiness. As progressive crushing pattern is not observed in test, energy absorbed by above
41

PRATIBHA: INTERNATIONAL JOURNAL OF SCIENCE, SPIRITUALITY, BUSINESS AND TECHNOLOGY (IJSSBT), Vol. 5, No. 2, August 2017
ISSN (Print) 2277-7261
crush box will be very small which is against purpose of crash box. 6.4 References [1] Olabi A-G, Morris E, Hashmi M. Metallic tube type energy absorbers: a synopsis. Thin-Walled Structres. 2007;45:706-26. [2] Deb A, Mahendrakumar M, Chavan C, Karve J, Blankenburg D, Storen S. Design of an aluminium-based vehicle platform for front impact safety. International Journal of Impact Engineering. 2004;30:1055-79. [3] D. Karagiozova, N. Jones, Dynamic buckling of elastic-plastic square tubes under axial impact-II: structural response, International Journal of Impact Engineering 30 (2004) 167–192. [4] N. Jones, Structural Impact, Cambridge University Press, Cambridge (UK), 1989. [5] M. Langseth, O.S. Hopperstad, T. Berstad, Crashworthiness of aluminum extrusions: validation of numerical simulation, effect of mass ratio and impact velocity, International Journal of Impact Engineering 22 (1999) 829–854. [6] M. Yamashita, M. Gotoh, Y. Sawairi, A numerical simulation of axial crushing of tubular strengthening structures with various hat-shaped cross-sections of various materials, Key Engineering Materials 233 (2002) 193–198. [7] Galib. DAl, A. Limam, Experimental and numerical investigation of static and dynamic axial crushing of circular aluminum tubes, Thin Walled Structures 42 (2004) 1103–1137. [8] N. Peixinho, A. Pinho, Study of viscoplasticity models for the impact behavior of high-strength steels, Transactions of the ASME 2 (2007) 114–123. [9] Y.S. Tai, M.Y. Huang, H.T. Hu, “ Axial Compression and energy absorption characteristics of high-strength thin-walled cylinders under impact load”, Theoretical and Applied Fracture Mechanics 53 (2010) 1-8 [10] P. Khalili, F.Tarlochan, A.M.S. Hamouda and K.Al-Khalifa,” Energy Absorption Capability of Thin Walled Aluminium Tubes Under Crash Loading”, Journal of Mechanical Engineering and Sciences, 9 Dec (2015) 2231-1659. [11] Prescilla Christy Albert, Amir Radzi Ab Ghani, Mohd Zaid Othman & Ahmad Mujahid Ahmad Zaidi, “ Axial Crushing Behavior of
Aluminum Square Tube with Origami Pattern”, Modern Applied Science, 10 (2) 2016 90-108. [12] Javad MARZBANRAD, Mehdi MEHDIKHANLO and Ashkan SAEEDI POUR, “ An Energy Absorption Comparison of Square, Circular and Elliptic Steel and Aluminum Tubes Under Impact Loading”, Turkish J. Engg, Env. Sci. (2009) 159-166. [13] Nizam Yob, K.A. Ismail, M.A. Rojan, Mohd. Zaid Othman & Ahmad Mujahid Ahmad Zaidi, “ Quasi Static Axial Compression of Thin Walled Aluminum Tubes: Analysis of Flow Stress in the Analytical Models”, Modern Applied Science, 10(1) 2016, 34-46. [14] Sajjad Dehghanpour, Ali Yousefi, “Lateral Crushing of Square and Rectangular Metallic Tubes under Different Quasi-Static Conditions”, World Academy of Science, Engineering and Technology, International Journal of Mechanical, Aerospace, Industrial, Mechatronic and Manufacturing Engineering, 6 (1) 2012, 204-208. [15] P.K.Gupta, N.K.Gupta and G.S. Sekhon, “ Finite Element Analysis of Collapse of Metallic Tubes”, Defence Science Journal, 58 (1) Jan 2008, 33-45. [16] S.B. Tuljapur, Dr. S.S. Sarawade, “ Study of Energy Absorption of Rectangular Tube of Bumper of Light Commercial Vehicle during Oblique Loading”, IJIRSET, 4 (5) May 2015 3175-3181. [17] Dhananjay D. Desai , Prof. M.A. Kadam, “ Analysis and development of Energy Absorbing Crash Box”, IJARIIE, 2 (3) 2016, 3776-3782. [18] Sebastian Lipa and Maria Kotelko, “ Lateral Impact of Tubular Structure – Theoretical and Experimental Analysis Part I- Investigation of single Tube”, Journal of Theoretical and Applied Mechanics 51 (4) 2013 873-882.
42
PRATIBHA: INTERNATIONAL JOURNAL OF SCIENCE, SPIRITUALITY, BUSINESS AND TECHNOLOGY (IJSSBT), Vol. 5, No. 2, August 2017
ISSN (Print) 2277-7261
Experimental Study of Conventional and Geopolymer Mortar
Lomesh S. Mahajan1, S.R.Bhagat2 Dept.of Civil Engineering
1Research Scholar, Dr. BabasahebAmbedkar Technological University,Lonere, (M.S.), India. 2Associate Professor, Dr. BabasahebAmbedkar Technological University,Lonere,(M.S.), India.
[email protected] , [email protected]
ABSTRACT:
In the advancement of construction industry supplementary cement used with the material like fly ash, slag, metakaolin, geopolymerbecause of considerably cost and sustainability. Today’s surrounding environment is competitive, it is well known fact that, thermal power plant wastes causesdestruction and produces impacts on nation economics. The current challenge of concrete industry is to produce high strength and workability supporting material. Geopolymer is emerging material which plays same roles as gain through cement including binding property and strength. The intergovernmental panel on climate change (IPCC) also suggested geopolymers to clinker could be used to minimize global CO2 emission. The use of geopolymer in mortar enhances durability and consistancy of mortar at effective cost. Fly ash based geopolymer has effectively minimizing the quantity of cement content in mortar mix. Cement saving will reduce an equal amount of CO2 to be discharged into atmosphere. It is evident from literatures that replacement of conventional cement is possible by selecting an alkaline activator and secondary cementatious materials. In this study experimental results are presented to evaluate the feasibility of utilizing geopolymer based mortar over conventional mortar. The variation taken for experiment study was in Na2SiO3 to NaoH as 1, 1.5and 2.5. Also evaluated Variation in molarity of sodium hydroxide in alkaline activator with M8, M10, M14.
Keywords—Fly ash, Supplementary cement,Geopolymer, Alkaline activator, Mortar.
I. INTRODUCTION According to Davidovits J.1geopolymer is a raw material which mainly silicon based polymers. It is rich in silica and alumina with alkaline solution and according to T.F.Yenget al.2geopolymers can be categorized into two groups i.e. pure inorganic geopolymers and organic geopolymers. Geopolymers consist of polymeric Si- O – Al framework, similar to zeolites. The reaction of binding agents was depending on SiO2/Al2O3 ratio in the framework.Geopolymer cement mostly includes metakaolin, fly ash and user friendly alkaline reagent. Mahajan L.S. et al.3explained the effective reuse of fly ash at North Maharashtra region and it’s a reliable to need future ingredients in concrete mix. Classifications of geopolymer cement are as follows:
Fly ash based geopolymer cement Slag based geopolymer cement Rock basedgeopolymer cement Ferro sialatebasedgeopolymer cement
Fly ash is one of the main natural sources of alumina silicate and it’s a popular choice for geopolymer synthesis. Again Mahajan L.S. et al.4evaluated the study on fly ash and metakaolin and stated that Fly ash gives stable chemical composition in concrete.
The use of fly ash enhances durability of concrete and life at effective cost.Kawashima S.et al.5 illustrated that nano silica instantly offset the adverse effect of flyash on early age properties for environmentally friendly high- volume fly ash concrete.Geopolymer samples analyzed for compressive strength and resulted that active alumina with pozzolana act as a good binding material in mortar (Najafiet al.6).
Ismail et al.7 did the micro structural evaluation of alkali activated binders based on geopolymer like fly ash and blast furnace slag. It shows during silica activated slag paste structure dominated by a C-A-S-H type gel,
43

PRATIBHA: INTERNATIONAL JOURNAL OF SCIENCE, SPIRITUALITY, BUSINESS AND TECHNOLOGY (IJSSBT), Vol. 5, No. 2, August 2017
ISSN (Print) 2277-7261
while N-A-S-H structure formed in silicate activated fly ash geopolymer. All reactions offer strong binding properties between geopolymer and convention cement. Boukendakdji. O. etal8 observed compressive strength inclusion of blast furnace slag by substitution of cement was found beneficial in self compacting concrete and also improvement in workability seen.
He. J. et al.9has investigated new type of geopolymer composites from rise husk ash and red mud and suggested that prolong curing affected on compressive strength. Mahajan L.11 examined fly ash based study and suggested various ways to utilize thermal power plant waste effectively.Geopolymer binder is an inorganic nature that offers superior properties than ordinary Portland cement if they contain finer size of byproduct of coal in term as fly ash (Y. Lvov et al.12).
II. OBJECTIVE The experimental study is carried out to check consistency, Initial setting time (IST) and Final setting time (FST), compressive strength of geopolymer mortar and cement mortar. The variations taken in this study are following two ways:
Variation in Na2SiO3 to NaoH as 1, 1.5and 2.5
Variation in molarity of sodium hydroxide in alkaline activator.
III. MATERIALS DETAILS
A. FLY ASH AND ALKALINE SOLUTION For the present study fly ash is obtained from thermal power station at bhusaval, Maharashtra. The alkaline solution is a formation of sodium hydroxide and sodium silicate solutions. For obtaining required molarity solution were prepared by the adding pellets of sodium hydroxide solution with water. The ratio of Na2SiO3 andNaoH was kept in the range of 1, 1.5 and 2.5. The molar solutions of Na2SiO3 andNaoH were prepared in laboratory. Before mixing it allows to cool for 24 hours.
B. AGGREGATES: Particle sizes of aggregates for experimental study are mention in following table no. 1.
Table1: Particle size proportions of aggregates.
Grades Particle Size
I Less than 2mm & greater than 2.5
II Less than 1mm & greater than 0.5
III Less than 0.5mm & greater than 0.09
C. CEMENTS: Ordinary Portland cement grade 53 was used and Portland water used for the time of curing.
IV. EXPERIMENTAL DETAIL Three concentration of alkaline solution was carried out and experiment design done. 3cubes were casted for each combination with a repetition. Response variables for this study were selected. Following four types of variable used:
The effects of IST The effects of EST Standard Consistency Compressive Strength
Interaction and effects were evaluated. NaOH solutions of 3 different molar concentrations were prepared with respective sodium silicates for making alkaline solution. 70.6 mm cubical moulds used and the fresh paste were cast in two layers. After that specimen were cured at 600C for 24 hours. Compressive strength was evaluated after 1 day curing periods.
V. RESULTS AND DISCUSSION
A. IST AND FST Initial and final setting time test were tested on traditional cement mortar and geopolymer mortar. The IST and FST for various grades obtained are shown in following table no 2.
Table 2: IST and FST with mortar grades
Grade Time (Minutes)
IST FST
M8 (1:1) 280 1780
M8 (1:1.5) 275 1700
44
PRATIBHA: INTERNATIONAL JOURNAL OF SCIENCE, SPIRITUALITY, BUSINESS AND TECHNOLOGY (IJSSBT), Vol. 5, No. 2, August 2017
ISSN (Print) 2277-7261
M8 (1:2.5) 230 1675
M10 (1:1) 240 1800
M10 (1:1.5) 235 1770
M10 (1:2.5) 200 1690
M14 (1:1) 210 1600
M14 (1:1.5) 190 1590
M14 (1:2.5) 190 1560
Cement 100 310
As comparedgeopolymer with conventional cement, it can be seen that the initial and final setting time increased significantly in case of geopolymer. From the results obtained, here also seen that, the IST and FST decreased as the concentration of the sodium hydroxide increased from M8 to M14. The lowest setting time obtain in M14(1:2.5). The reduction in IST and FST may be occurs due to increased concentration of active silica solution.
B. STANDARD CONSISTANCY TESTS
The consistency test gives an idea of water required for the hydration process of cement. Following results were obtained while testing the consistency of cement and activator. Following table no. 3 shows the value obtained in consistency test for prescribed grades of mortar.
Table3:Cement and activator with consistency
Cement and Activator
Consistency (%)
M8 (1:1) 22
M8 (1:1.5) 23
M8 (1:2.5) 23
M10 (1:1) 23.5
M10 (1:1.5) 20.5
M10 (1:2.5) 22
M14 (1:1) 24
M14 (1:1.5) 21.5
M14 (1:2.5) 22.5
Cement 29
From results, it can be concluded that the consistency of cement is more as compared to fly ash with solutions of M8, M10 and M14. The reason of greater consistency of cement as compared to that of fly ash was that the matters of fly ash are spherical in nature and minimum friction. Cement particles contain more reactive silica as compared to fly ash particle. Therefore conventional cement consistency is more. It can be concluded that standard consistency decreased when geopolymer concrete was used. Due to less water requirement of geopolymer concrete the standard consistency value has decreased.
C. COMPRESSIVE STRENGTH CTM was used to conduct compressive strength test. Three cubes of size 76.6mm were casted for each solution. These cubes were tested after 28days under the dry saturated surface condition. Compressive strength obtained in MPa is shown in table no. 4 as below.
Table 4: Cement and activator with compressive strength
Cement and Activator
Compressive Strength
(MPa)
M8 (1:1) 15
M8 (1:1.5) 20
M8 (1:2.5) 21.51
M10 (1:1) 25.01
M10 (1:1.5) 27.22
M10 (1:2.5) 26.13
M14 (1:1) 25.09
M14 (1:1.5) 41.03
M14 (1:2.5) 44.15
Cement 34.78
It can be concluded from CTM results that the compressive strength decreased initially for mix M8 solution and there was increase in compressive strength with salt concentration.
45
PRATIBHA: INTERNATIONAL JOURNAL OF SCIENCE, SPIRITUALITY, BUSINESS AND TECHNOLOGY (IJSSBT), Vol. 5, No. 2, August 2017
ISSN (Print) 2277-7261
VI. CONCLUSION
Conclusions had been drawn on the basis of various test conducted in the laboratory. The standard consistency result taken for fly ash and cement with solution of M8, M10 and M14. In all cases cement is highest as compared to the fly ash;therefore the water requirement of geopolymer concrete has decreases. In M8 found highest IST and FSTand from all results, it can be placed easily when compared with conventional concrete. For M14 solution, geopolymer was obtained higher result significantly. Due to Na2SiO3 salt concentration, the compressive strength has increased.
VII. REFRENCES
[1] Davidovits, J., “Ancient and modern Concrete: What is the real difference”, Concr.Int.,No.9, pp.23-28, 1972
[2] Kim, D., Lai, H.T., Chilingar, G.V., Yen, T.F., “Geopolymer formation and its unique properties, ”,Environ. Geol,51(1), pp.101-104, 2006.
[3] Mahajan L.S.,BhagatS.R.,Prasad Sonar, “Techno-economic feasibility of Partial replacement of soil by fly ash in clay brick”, International Journal of innovation research in science,Engineering and technology , volume 6, Issue 1:pp.844-849, Jan 2017.
[4] Mahajan L.S.,BhagatS.R.,Pore S.M.,” Strength appraisal of blended concrete”, Pratibha:IJSSBT, ISSN:2277-7261, Vol.5,No. 1,Dec 2016, pp.47-51.
[5] Kawashima S., Hou. P.,Corr. D.J., Shah. S.P., “Modification of cement based materials with nano particles, Cement and concrete composites, Volume 36, Issue 1: pp.08-15, Feb 2013.
[6] NajafiKani E.,Allaverdi. A., ,Provis. J.L., “Effloresense control in geopolymer binders based on natural pozolana”,.Cement and
Concrete Research, Volume 34, Issue 1, pp. 25-33. Jan 2012
[7] Ismail. I.,Bernal S.A., Provis J.L., San Nicolas R., Hamdan S., “Modification of phase evolution alkali- activated blast furnace slag by the incorporation of fly ash”Cement and Concrete Research, Volume 45, pp. 125-135. Jan 2014.
[8] Boukendakdji. O.,Kadri. E. H., Kenai. S., “Effect of of granulated blast furnace slag and super plasticizertype onthe fresh properties and compressive strength of self compactingconcrete”, Cement and Concrete Research, Volume 34, issue 4, pp. 583-590. April 2012.
[9] He. J., Jie., Y., Zhang. J., Yu., Y., Zhang., G., “Systhesis and charectarization of red mud and rice husk ash based geopolymer compositesCement and Concrete Research, Volume 37, issue 1, pp. 108-118. March 2013.
[10] Mahajan L.S.,” Comparative analysis for suitability of fly ash and coconut husk in BOD and COD removal from paper mill waste water”, Pratibha:IJSSBT, ISSN:2277-7261, Vol.4,No. 2, May 2016, pp.52-59.
[11] Y. Lvov.,Joshi A., Montes C., Saeid S.,E.Alluche.,“Optimization of geopolymerproperties by coating of fly as micro particle with nano clays,”, Journal of inorganic and organ metallic polymers and materials , Volume 25, Issue 2: pp.289-292, Mar 2015.
46
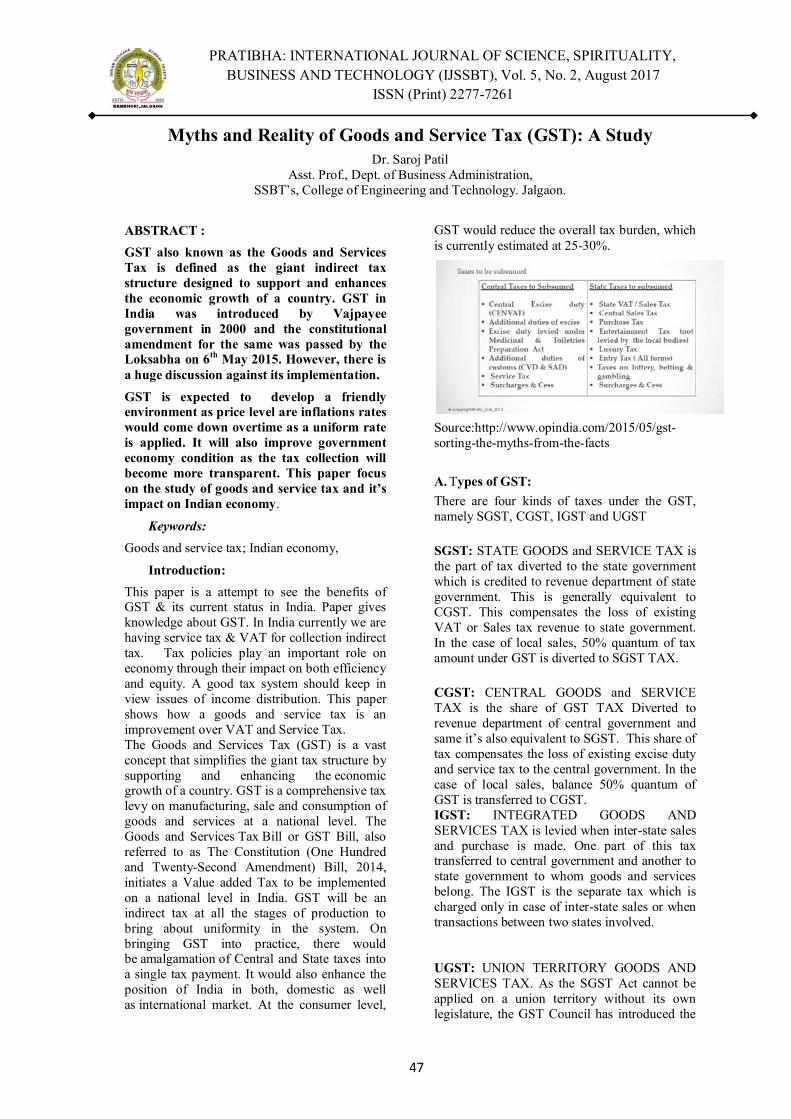
PRATIBHA: INTERNATIONAL JOURNAL OF SCIENCE, SPIRITUALITY, BUSINESS AND TECHNOLOGY (IJSSBT), Vol. 5, No. 2, August 2017
ISSN (Print) 2277-7261
Myths and Reality of Goods and Service Tax (GST): A Study Dr. Saroj Patil
Asst. Prof., Dept. of Business Administration, SSBT’s, College of Engineering and Technology. Jalgaon.
ABSTRACT : GST also known as the Goods and Services Tax is defined as the giant indirect tax structure designed to support and enhances the economic growth of a country. GST in India was introduced by Vajpayee government in 2000 and the constitutional amendment for the same was passed by the Loksabha on 6th May 2015. However, there is a huge discussion against its implementation. GST is expected to develop a friendly environment as price level are inflations rates would come down overtime as a uniform rate is applied. It will also improve government economy condition as the tax collection will become more transparent. This paper focus on the study of goods and service tax and it’s impact on Indian economy.
Keywords: Goods and service tax; Indian economy,
Introduction: This paper is a attempt to see the benefits of GST & its current status in India. Paper gives knowledge about GST. In India currently we are having service tax & VAT for collection indirect tax. Tax policies play an important role on economy through their impact on both efficiency and equity. A good tax system should keep in view issues of income distribution. This paper shows how a goods and service tax is an improvement over VAT and Service Tax. The Goods and Services Tax (GST) is a vast concept that simplifies the giant tax structure by supporting and enhancing the economic growth of a country. GST is a comprehensive tax levy on manufacturing, sale and consumption of goods and services at a national level. The Goods and Services Tax Bill or GST Bill, also referred to as The Constitution (One Hundred and Twenty-Second Amendment) Bill, 2014, initiates a Value added Tax to be implemented on a national level in India. GST will be an indirect tax at all the stages of production to bring about uniformity in the system. On bringing GST into practice, there would be amalgamation of Central and State taxes into a single tax payment. It would also enhance the position of India in both, domestic as well as international market. At the consumer level,
GST would reduce the overall tax burden, which is currently estimated at 25-30%.
Source:http://www.opindia.com/2015/05/gst-sorting-the-myths-from-the-facts
A. Types of GST: There are four kinds of taxes under the GST, namely SGST, CGST, IGST and UGST
SGST: STATE GOODS and SERVICE TAX is the part of tax diverted to the state government which is credited to revenue department of state government. This is generally equivalent to CGST. This compensates the loss of existing VAT or Sales tax revenue to state government. In the case of local sales, 50% quantum of tax amount under GST is diverted to SGST TAX.
CGST: CENTRAL GOODS and SERVICE TAX is the share of GST TAX Diverted to revenue department of central government and same it’s also equivalent to SGST. This share of tax compensates the loss of existing excise duty and service tax to the central government. In the case of local sales, balance 50% quantum of GST is transferred to CGST. IGST: INTEGRATED GOODS AND SERVICES TAX is levied when inter-state sales and purchase is made. One part of this tax transferred to central government and another to state government to whom goods and services belong. The IGST is the separate tax which is charged only in case of inter-state sales or when transactions between two states involved.
UGST: UNION TERRITORY GOODS AND SERVICES TAX. As the SGST Act cannot be applied on a union territory without its own legislature, the GST Council has introduced the
47

PRATIBHA: INTERNATIONAL JOURNAL OF SCIENCE, SPIRITUALITY, BUSINESS AND TECHNOLOGY (IJSSBT), Vol. 5, No. 2, August 2017
ISSN (Print) 2277-7261
UTGST Act, to levy a tax, called UTGST, in the union territories of Chandigarh, Lakshadweep, Daman and Diu, Dadra and Nagar Haveli and Andaman and Nicobar Islands. UTGST will be levied in place of SGST in these union territories.
GST: Pro & Cons:
1. GST is a transparent tax and also reduces number of indirect taxes.
2. GST will not be a cost to registered retailers therefore there will be no hidden taxes and the cost of doing business will be lower.
3. Due to Reverse Charge Mechanism the number of tax payers will be increase.
4. As GST council added new products for levy of GST like Cloth, etc. the number of tax payer will be increased.
5. Benefit people as prices will come down which in turn will help companies as consumption will increase.
6. There is no doubt that in production and distribution of goods, services are increasingly used or consumed and vice versa.
7. Separate taxes for goods and services, which is the present taxation system, requires division of transaction values into value of goods and services for taxation, leading to greater complications, administration, including compliances costs.
8. In the GST system, when all the taxes are integrated, it would make possible the taxation burden to be split equitably between manufacturing and services.
9. GST will be levied only at the final destination of consumption based on VAT principle and not at various points (from manufacturing to retail outlets). This will help in removing economic distortions and bring about development of a common national market.
10. GST will also help to build a transparent and corruption free tax administration.
11. Presently, a tax is levied on when a finished product moves out from a factory, which is paid by the manufacturer, and it is again levied at the retail outlet when sold.
12. GST is backed by the GSTN, which is a fully integrated tax platform to deal with all aspects of GST.
13. Some Economist say that GST in India would impact negatively on the real estate market. It would add up to 8 percent to the cost of new
homes and reduce demand by about 12 percent.
14. Some Experts says that CGST(Central GST), SGST(State GST) are nothing but new names for Central Excise/Service Tax, VAT and CST. Hence, there is no major reduction in the number of tax layers.
15. Some retail products currently have only four percent tax on them. After GST, garments and clothes could become more expensive.
16. The aviation industry would be affected. Service taxes on airfares currently range from six to nine percent. With GST, this rate will surpass fifteen percent and effectively double the tax rate.
17. It would subsume all indirect taxes at the center and the state level.
18. It would free the manufacturing sector from cascading effect of taxes, thus by improve the cost-competitiveness of goods and services.
19. It would bring down the prices of goods and services and thus by, increase consumption.
20.It would create business-friendly environment, thus by increase tax-GDP ratio.
21..E-commerce does not leave signs of the transaction outside the internet and has anonymity associated with it. As a result, it becomes almost impossible to track the business transaction taking place through internet which can be business to business, business to customer or customer to customer. New techniques can be developed to track such transactions but until such technologies become readily accessible, generation of tax revenue from this sector would continue to be uncertain and much below the expectation. Communication is considered to be necessity and one cannot do without communication. In modern times, communication has assumed the dimension of telecommunication.
22. Service tax and material tax and daily needs things prices has be reduced after the announcement of GST daily things such as soap, toothpaste, hair oil, toothbrush and cosmetic products had raised their prices. One relaxation is on vegetable oil GST tax has
48

PRATIBHA: INTERNATIONAL JOURNAL OF SCIENCE, SPIRITUALITY, BUSINESS AND TECHNOLOGY (IJSSBT), Vol. 5, No. 2, August 2017
ISSN (Print) 2277-7261
reduced from 6% to 5% and sugar rates have also raised high. GST on cosmetic has been high from 13% to 28% as a result shampoo, conditioner and washing powder, perfume etc is being costly. 23. One of the major disadvantages of the GST regime could be in the service tax rate from 14% to 20-22%. The entire issue of telecommunication sector assumes a serious proportion when India’s rural tele-density is not even 50%. 24. The proposed GST intends to keep petroleum products, electricity, real estate and liquor for human consumption out of the purview of GST
25. It is a well-known fact that petroleum products have been a major contributor to inflation in India. Inflation in India depends on how the government intends to include petroleum products under GST in future. Electricity is essential for the growth and development of India. If electricity is included under standard or luxury goods in future then it would badly affect the development of India. It is said that GST would impact negatively on the real estate market. It would add up to 8% to the cost of new homes and reduce demand by about 12%. 26. GST on goods and other product businessman is needed to keep the track of all transactions commerce graduates has got large scope of work is required as per survey. Online accountant are required pay three returns in one month for every businessman therefore full time account is needed to each businessman as compared to previous tax paid. 27. GST has regulated the Marathi file industry has been facing problems. According to the survey of Marathi film has been reduced by 20-25% removal of tax free result and caretaker of film theater has also be removed by 18% GST on film ticket the owner of theater in bearing a heavy loss.
Myths & Reality: 1. Myth: The new GST rate is higher
compared to earlier VAT. Reality: It appears higher because excise duty and other taxes which were invisible earlier are now subsumed in GST and so visible now.
2. Myth: If a person makes payment of utility bills by credit cards, they will be paying GST twice.
Reality: Inaccurate. GST is only levied once, irrespective of the payment being made by cash or cards.
3. One India One Tax is a Myth!!! GST is one tax in India is not the correct statement as GST only comes on the replacement of different indirect taxes, However CUSTOM DUTY OR IMPORT EXPORT DUTY will remain continue to levy. Further few amendments have already being made In custom law and same will remain applicable in India. All other direct taxes like Income Tax, Gift Tax, Property Tax etc will remain continued in forces as earlier.
4. Myth: All invoices must be generated on computer/internet only.
Reality: Invoices can be generated manually also 5. Myth: A retailer needs internet all the
time to do business under GST Reality: Internet would be needed only while filing the monthly return of GST.
6. Myth: A retail business I have provisional ID but waiting for final ID to do business
Reality: Provisional ID will be your final 7. Myth: An item of trade was earlier
exempt so the retailer will need new registration before starting a business now.
Reality: You can continue doing business and get registered within 30 days.
8. Myth: There are three return per month to be filed
Reality: There is only one return with three parts, out of which first part filed by the dealer and two other parts auto-populated by computer.
9. Myth: Even small dealers will have to file invoice wise details in the return.
Reality: Those in retail business (B2C) need to file only summary of total sales.
10. Myth: Cost will decrease Reality: Cost may decrease , but various products , services may become costlier also. Services which are being taxed at 15% will be taxed at 18%. In initial period costs are going to increase for sure. Later on with proper understanding of law and strategy cost may decrease.
11. Myth: Seamless credit flow
49
PRATIBHA: INTERNATIONAL JOURNAL OF SCIENCE, SPIRITUALITY, BUSINESS AND TECHNOLOGY (IJSSBT), Vol. 5, No. 2, August 2017
ISSN (Print) 2277-7261
Reality: The most important feature of GST is to remove cascading effect of taxes. So taxes paid on inputs can be utilized for payment of GST on output. But as per model law SGST credit of one state cannot be utilized to pay SGST liability of another state. Credit of SGST cannot be utilized to pay off CGST and vice versa.
12. Myth: Under GST number of returns to reduce drastically
Reality: An average tax payer (other than composition scheme option) will have to file at least 38 returns in a year. (First return, 3 monthly returns and Annual return ) . And if Business entity is operating from more than one state than this number will be multiplied by so many states. So it can go up to 1922 returns per year. (This includes monthly TDS returns, reverse charge returns ).
13. Myth: Person with turnover below twenty lacs need not register under GST
Reality: Following persons even though turnover below 20 lacs will have to register under GST: Person making any taxable supply to other state ( no threshold limit even 100 rupees transaction will invite registration ) Casual taxable persons like exhibitors, temporary business Nonresident persons Persons who are require to deduct or collect tax at source (TDS/TCS under GST) Person who are required to pay under reverse charge
14. Myth: Composition scheme for small businessmen having turnover below 50 lacs for easy compliance. ( tax rate between 1% to 3% )
Reality: Although turnover below 50 lacs , if a person makes even a single supply to different state he will be out of composition scheme . Also this scheme is only for Goods not for services. So small service providers cannot take its benefit.
15. Myth: Easy to comply Reality: It’s certainly easy to comply for bigger concerns, corporate etc. But as GST envisages total electronic compliance, small suppliers, persons in rural, remote areas will find it difficult to comply. Though there is no doubt that GST is going to be the biggest indirect tax reform it still suffers from many complications. If government wants
to implement the law successfully then it must involve all the stakeholders in decision making. Educate the masses properly. Train the administration thoroughly. Otherwise as we are facing daily new notifications in post demonetization era same will be witnessed in post GST era also.
Conclusion : Implementation of GST is one of the best decisions taken by the Indian government. The higher GST rate will definitely boost the tax to GDP ratio, while giving financial muscle to the government for increasing the capital expenditure. This is likely to spur growth in the economy. Tax policies play an important role on the economy through their impact on both efficiency and equity. A good tax system should keep in view issues of income distribution and, at the same time, also endeavor to generate tax revenues to support government expenditure on public services and infrastructure development. The ongoing tax reforms on moving to a goods and services tax would impact the national economy, International trade, firms and the consumers No doubt; GST will simplify existing indirect tax system and will help to remove inefficiencies created by the existing current heterogeneous taxation system revenue rate, and inclusion of petroleum products, electricity, liquor and real estate. Until the consensus is reached, the government should resist from implementing such regime. We must be ready to deal with GST and many other changes that are going to take place in India. Slowly, India shall move to join the world wide standards in taxation, corporate laws and managerial practices and be among the leaders in these fields. The GST increases the opportunity employment.
References :
1. The Economic Times (2009) Featured Articles from The Economic Times.
2. GST India (2015) Economy and Policy.
3. Mehra P (2015) Modi govt.’s model for GST may not result in significant growth push. The Hindu.
50

PRATIBHA: INTERNATIONAL JOURNAL OF SCIENCE, SPIRITUALITY, BUSINESS AND TECHNOLOGY (IJSSBT), Vol. 5, No. 2, August 2017
ISSN (Print) 2277-7261
4. Sardana M (2005) Evolution Of E‐Commerce In India Part 3.
5. TRAI (2015) Highlights of Telecom Subscription Data as on 28th February.
6. Patrick M (2015) Goods and Service Tax: Push for Growth. Centre for Public Policy Research (CPPR).
7. SKP (2014) GST: Impact on the Telecommunications Sector in India.
8. Khan, M., & Shadab, N., Goods and
Services Tax (GST) in India: prospect for states. Budgetary Research Review, 4(1), 38–64.n.d
9. Vasanthagopal, R., GST in India: A Big Leap in the Indirect Taxation System. International Journal of Trade, Economics and Finance, 2(2), 144–147, 2011.
10. The Empowered Committee Of State Finance Ministers (2009), First Discussion Paper On Goods and Services Tax In India, November 10, 2009.
11. Nakhchian, A., Gorji, N., Shayesteh,
T., & Sheibany, E., Value Added Tax and Its Relationship With Management Information Technology. Interdisciplinary Journal of Contemporary Research in Business, 4(9), 402–410, 2013.
12. Cnossen, S., Preparing the way for a modern GST in India. International Tax and Public Finance, 20(4), 715–723, 2013. http://dx.doi.org/10.1007/s10797-013-9281-0
13. Nishita Gupta, Goods and Services Tax: Its implementation on Indian economy, CASIRJ Volume 5 Issue 3 [Year - 2014] ISSN 2319 – 9202, Pg. No.126-133.
14. www.indiafilings.com 15. http://taxguru.in/goods-and-service-tax/goods-service-tax-myths-facts.html
VIII. 16. GOODS AND SERVICE TAX, INDIAN ECONOMY Vishwanath Achari, Advocatespedia Journal 17. http://economictimes.indiatimes.com/news/economy/policy/will-you-get-the-gst-benefits-depends-on-the-state-you-live-in/articleshow/59393689.cms
50
51

PRATIBHA: INTERNATIONAL JOURNAL OF SCIENCE, SPIRITUALITY, BUSINESS AND TECHNOLOGY (IJSSBT), Vol. 5, No. 2, August 2017
ISSN (Print) 2277-7261
18. SHEFALI DANI, A RESEARCH PAPER ON AN IMPACT OF GOODS AND SERVICE TAX (GST) ON INDIAN ECONOMY, BUSINESS AND ECONOMICS JOURNAL, DANI, BUS ECO J 2016, 7:4 DOI: 10.4172/2151-6219.1000264
19. HTTPS://WWW.VSKILLS.IN/CERTIFICATION/BLOG/GST-AND-ITS-IMPACT-ON-THE-ECONOMY/
20. HTTP://WWW.BUSINESSALLIGATORS.COM/GST-IMPACT-RATES-TYPE-CONCLUSION/
21.HTTPS://EFACDIM.COM/POST/GST-ADVANTAGES-AND-DISADVANTAGES/
22. HTTPS://WWW.INDIAFILINGS.COM/LEARN/GST-ADVANTAGES-DISADVANTAGES/
23. HTTP://TIMESOFINDIA.INDIATIMES.COM/GST/NEWS-STORIES/PROVISIONAL-ID-TO-BE-FINAL-GSTIN-NUMBER-REVENUE-SECRETARY-BUSTS-7-GST-MYTHS/ARTICLESHOW/59409543.CMS
24. HTTP://WWW.THEHINDUBUSINESSLINE.COM/ECONOMY/REVENUE-SECRETARY-ADHIA-BUSTS-7-MYTHS-ON-GST/ARTICLE9746517.ECE
25. HTTP://INDIANEXPRESS.COM/ARTICLE/BUSINESS/ECONOMY/REVENUE-SECRETARY-BUSTS-8-GST-MYTHS-SAYS-IMPLEMENTATION-AND-EXECUTION-WILL-BE-TRANSPARENT-4732070/
26. HTTPS://MEDIUM.COM/@EDCBITM/WHAT-IS-GST-AND-WHY-YOU-NEED-TO-UNDERSTAND-THIS-3F7C52271CF
27. HTTP://WWW.GOFRUGAL.COM/BLOG/2017/03/29/7-THINGS-YOU-NEED-TO-KNOW-ABOUT-GST-RETAIL-AND-OTHER-BUSINESS/
28. GOODS AND SERICES TAX (GST):
28. A COMPREHENSIVE INDIRECT TAX REFORMS IN INDIA, GOLAKH KUMAR BEHERA, PROF. R. P MAHAPATRA
29. Ministry of Finance, (2008-09). Indian Public Finance Statistics. Development of Economic Affairs, Economic Division, GOI.
30. HTTP://WWW.ONLINEGST.IN/IMPACT-OF-GST-ON-GOODS-AND-SERVICES/
31. RAJAN GANDHI, GST- A NIGHTMARE OR SWEET DREAM, HTTP://WWW.EARLYTIMES.IN/NEWSDET.ASPX?Q=205311
32. HTTPS://CLEARTAX.IN/S/COMPOSITION-SCHEME-UNDER-GST
33. HTTPS://WWW.PRESSREADER.COM/INDIA/THE-TIMES-OF-INDIA-NEW-DELHI-EDITION/20170425/282471413746845
34. HTTP://ABCAUS.IN/GST/GST-MSME-SECTORAL-FAQ-57-QUESTION-AND-ANSWERS-BOOKLET-BY-CBEC.HTML
35. HTTPS://WWW.LEGALRAASTA.COM/GST/INPUT-TAX-CREDIT-UNDER-GST/ 36.http://www.businesstoday.in/current/economy-politics/gst-parliament-session-tax-system-impact-on-household-budget/story/255464.html
52

PRATIBHA: INTERNATIONAL JOURNAL OF SCIENCE, SPIRITUALITY, BUSINESS AND TECHNOLOGY (IJSSBT), Vol. 5, No. 2, August 2017
ISSN (Print) 2277-7261