
IJPSS Volume 2, Issue 8 ISSN: 2249-5894 2012 - IJMRA doc/IJPSS_AUGUST2012/IJMRA-PSS1409.pdfIJPSS...
14
IJPSS Volume 2, Issue 8 ISSN: 2249-5894 ___________________________________________________________ A Monthly Double-Blind Peer Reviewed Refereed Open Access International e-Journal - Included in the International Serial Directories Indexed & Listed at: Ulrich's Periodicals Directory ©, U.S.A., Open J-Gage, India as well as in Cabell’s Directories of Publishing Opportunities, U.S.A. International Journal of Physical and Social Sciences http://www.ijmra.us 37 August 2012 Construction of equity portfolio of large caps companies of selected sectors in India with reference to the Sharpe Index Model P.Varadharajan* Ganesh** __________________________________________________________ Abstract Security analysing and selection of portfolios and managing them in the right manner helps in improving the investor’s awareness about the trends and changes that exist in the market and h elps the investors as a very attractive avenue for investment. In these investments, generally both rationale and emotional responses are involved. So, investing in financial securities is considered to be one of the attractive areas for investing and saving while it is also acknowledged to be one of the most risky areas for investment. Creation of an optimum portfolio helps to reduce risk, without sacrificing returns. Portfolio management deals with the analysis of individual securities as well as with the theory and practice of optimally combining securities into good portfolios. An investor who understands the fundamental principles and analytical aspects of portfolio management has a better chance of earning higher returns. In this research 18 stocks from three different large caps sectors are taken for study. The risk and return of all the stocks are studied individually. Based on the study top five stocks are selected for forming optimum portfolio. The final step in the process is to determine the number of shares of each stock to be purchased. This method helps us to carefully select the stocks and also the proportion of investment to be made in each stock, thereby yielding higher returns. Key words: Stock, Sharpe, Beta, Market variance, Residual Variance, Index and stock price * Assistant Professor, PSG Institute of Management, PSG College of Technology, Coimbatore, Tamilnadu. ** Student, EMBA, PSG Institute of Management, PSG College of Technology, Coimbatore, Tamilnadu.
Transcript of IJPSS Volume 2, Issue 8 ISSN: 2249-5894 2012 - IJMRA doc/IJPSS_AUGUST2012/IJMRA-PSS1409.pdfIJPSS...

IJPSS Volume 2, Issue 8 ISSN: 2249-5894 ___________________________________________________________
A Monthly Double-Blind Peer Reviewed Refereed Open Access International e-Journal - Included in the International Serial Directories Indexed & Listed at: Ulrich's Periodicals Directory ©, U.S.A., Open J-Gage, India as well as in Cabell’s Directories of Publishing Opportunities, U.S.A.
International Journal of Physical and Social Sciences http://www.ijmra.us
37
August
2012
Construction of equity portfolio of large
caps companies of selected sectors in India
with reference to the Sharpe Index Model
P.Varadharajan*
Ganesh**
__________________________________________________________
Abstract
Security analysing and selection of portfolios and managing them in the right manner helps in
improving the investor’s awareness about the trends and changes that exist in the market and helps the
investors as a very attractive avenue for investment. In these investments, generally both rationale and
emotional responses are involved. So, investing in financial securities is considered to be one of the
attractive areas for investing and saving while it is also acknowledged to be one of the most risky
areas for investment. Creation of an optimum portfolio helps to reduce risk, without sacrificing
returns. Portfolio management deals with the analysis of individual securities as well as with the
theory and practice of optimally combining securities into good portfolios. An investor who
understands the fundamental principles and analytical aspects of portfolio management has a better
chance of earning higher returns. In this research 18 stocks from three different large caps sectors are
taken for study. The risk and return of all the stocks are studied individually. Based on the study top
five stocks are selected for forming optimum portfolio. The final step in the process is to determine
the number of shares of each stock to be purchased. This method helps us to carefully select the stocks
and also the proportion of investment to be made in each stock, thereby yielding higher returns.
Key words: Stock, Sharpe, Beta, Market variance, Residual Variance, Index and stock price
* Assistant Professor, PSG Institute of Management, PSG College of Technology, Coimbatore,
Tamilnadu.
** Student, EMBA, PSG Institute of Management, PSG College of Technology, Coimbatore,
Tamilnadu.

IJPSS Volume 2, Issue 8 ISSN: 2249-5894 ___________________________________________________________
A Monthly Double-Blind Peer Reviewed Refereed Open Access International e-Journal - Included in the International Serial Directories Indexed & Listed at: Ulrich's Periodicals Directory ©, U.S.A., Open J-Gage, India as well as in Cabell’s Directories of Publishing Opportunities, U.S.A.
International Journal of Physical and Social Sciences http://www.ijmra.us
38
August
2012
Introduction
An investor considering investment in securities is faced with the problem of choosing from
among a large number of securities and how to allocate those funds over this group of securities.
But, another hurdle that exists is that the investor has a problem of deciding which securities to
hold and how much to invest in each of them. The main factor that governs portfolio selection is
risk and return characteristics. So, the general trend is that the investor tries to choose the optimal
portfolio taking into consideration the risk and return element of all possible portfolios. Portfolio
construction is investing in a variety of funds or investment options that work together to meet the
requirements of the investor. As the risk element of individual securities as well as portfolios
change the investor must periodically review and revise the investment portfolios.
Here in we are mainly focused on Equity portfolio construction. Portfolio constructions are of two
types, they are Traditional Approach and Modern Approach. The traditional approach is based on
Current Income, Capital Appreciation, Tax Considerations, Liquidity and Safety. Traditional
approach usually begins with the analysis of constraints, and then we will determine the
objectives of investment. After determining the objectives the type of portfolio is selected. The
portfolio can comprise of Bonds and Common Stock or only Bonds or only Common Stocks.
After selecting the type of portfolio the risk and return of the selected type is assessed. The last
step of Traditional approach is diversification. Similarly, the Modern approach of portfolio
construction comprises of three methods. They are Markowitz Model of portfolio construction
which was developed by Harry M. Markowitz in 1969, the Sharpe Index Model of portfolio
construction developed by William Sharpe and later John Linter and Jan Mossin formulated the
development of the Capital Asset Pricing Model of portfolio construction.
An investor invests his funds in a portfolio expecting to get good returns consistent with the risk that
he has to bear. The return realized from the portfolio has to be measured and the performance of the
portfolio has to be evaluated. It is evident that rational investment activity involves creation of an
investment portfolio. Portfolio management comprises all the processes involved in the creation and
maintenance of an investment portfolio. It deals specifically with the security analysis, portfolio
analysis, portfolio selection, portfolio revision & portfolio evaluation. Portfolio management makes
use of analytical techniques of analysis and conceptual theories regarding rational allocation of funds.
Portfolio management is a complex process which tries to make investment activity more rewarding

IJPSS Volume 2, Issue 8 ISSN: 2249-5894 ___________________________________________________________
A Monthly Double-Blind Peer Reviewed Refereed Open Access International e-Journal - Included in the International Serial Directories Indexed & Listed at: Ulrich's Periodicals Directory ©, U.S.A., Open J-Gage, India as well as in Cabell’s Directories of Publishing Opportunities, U.S.A.
International Journal of Physical and Social Sciences http://www.ijmra.us
39
August
2012
and less risky. The selection of portfolio depends upon the objectives of the investor. The selection of
portfolio under different objectives are based on the following decisions, they are Objectives and
Asset mix, Growth of income and Asset mix, Capital appreciation and Asset Mix, Safety of principle
and Asset Mix and Risk and return analysis. Investment is no longer a simple process. It requires a
scientific knowledge, a systematic approach and also professional expertise. Portfolio management is
the only way through which an investor can get good returns, while minimizing risk at the same time.
So the purpose portfolio management objectives can be divided into Risk minimization, Safeguarding
capital, Capital Appreciation, Choosing optimal mix of securities and Keeping track on performance.
The report has taken three sectors into consideration existing in the Indian scenario for building an
optimum portfolio combination. The three sectors which are taken are the Indian Power Sector, Indian
Shipping Sector and Indian Textile Sector as these sectors are generally good performing sectors in
the market. Primarily, the power sector is taken as this industry is responsible for the production and
delivery of electrical energy in sufficient quantities to meet the demand for electricity in all domestic,
industrial and commercial operations so; they are viewed as a public utility or defensive industry so
this sector performs considerably good in the market. Secondly, the shipping sector is taken as this
industry has been operating for a long period of time and major exports and imports are involved in
this industry so a lot of foreign exchange is involved and this helps to increase the overall economy of
the nation, so investing in this sector will provide good returns as this sector works on a good basis.
Thirdly, the Textile sector is taken for portfolio selection and construction as they are concerned with
the design, manufacture, trade and distribution of fabrics and this sector has come a long way since
the independence period from domestic production of cotton, wool etc. to an organised industry using
latest leveraging modern technologies, innovations and electronics in producing all types of fabrics.
This industry is like a defensive industry as the demands for clothes never reduce so constant growth
can be expected over an expected period of time.
Hence, these sectors are taken for portfolio construction and over a period of time good returns can be
expected. Also, Government has huge investments in these companies so they usually will perform
very well in the market and will develop more in the market in the period to come so investors can
expect lower risk in these sectors as demand doesn’t reduce so they will perform consistently and
meet the expectations of the investors.

IJPSS Volume 2, Issue 8 ISSN: 2249-5894 ___________________________________________________________
A Monthly Double-Blind Peer Reviewed Refereed Open Access International e-Journal - Included in the International Serial Directories Indexed & Listed at: Ulrich's Periodicals Directory ©, U.S.A., Open J-Gage, India as well as in Cabell’s Directories of Publishing Opportunities, U.S.A.
International Journal of Physical and Social Sciences http://www.ijmra.us
40
August
2012
Statement of the problem
The report has been prepared for the basis of studying the various avenues or sectors where
investors can invest their savings in a group of securities or portfolios. Creation of portfolios
helps to reduce risk, without sacrificing returns. Portfolio management deals with the analysis of
individual securities as well as with the theory and practice of optimally combining securities into
good portfolios. Hence, the Power sector, shipping sector and Textile sector have been
considered. It is also essential to educate about investment options in the market so that the
investors can earn higher returns. As market fluctuations exist the investors have to always careful
and keenly the market movement to invest at the right moment in the right kind of securities to
reduce risk and increase returns.
Objectives
The main objective of this project is to find the optimum portfolio from the selected companies in
Power sector, Shipping sector and Textile sector. At the end of the analysis a portfolio of five
stocks with maximum return for a given risk is constructed which shows how much proportion of
money is to be invested in each security wholly taken from different sectors. These sectors are
generally consistently performing as these kinds of sectors are depended by the public in a large
extent and active government participation in the activities of companies in these sectors shows
the importance they have to national economy.
Theoretical Framework
AJ Du Plessis, M Ward (2009), explained the possibility of identifying the right kind of attributes
in an portfolio ensuring good returns in the future. It stresses on the importance of applying the
Markowitz model of portfolio selection with respect to the Johannesburg Securities Exchange to
analyse if an optimal portfolio can be identified and be used as an effective guideline method for
trading purposes. It concludes on how an optimal portfolio is selected and rebalanced periodically
and comparing the returns with the JSE index rate thereby, showing how a particular trading
strategy can outperform in the market. G Van der Hoek, AHG Rinnooy Kan, GT Timmer (1983),
investigated the optimal selection of smaller efficient portfolios from the market that can be

IJPSS Volume 2, Issue 8 ISSN: 2249-5894 ___________________________________________________________
A Monthly Double-Blind Peer Reviewed Refereed Open Access International e-Journal - Included in the International Serial Directories Indexed & Listed at: Ulrich's Periodicals Directory ©, U.S.A., Open J-Gage, India as well as in Cabell’s Directories of Publishing Opportunities, U.S.A.
International Journal of Physical and Social Sciences http://www.ijmra.us
41
August
2012
ascertained by an implicit enumeration algorithm of these securities whose beta coefficient of
variance is negative in the aspect of Markowitz method of portfolio selection. Based on an
efficient heuristic method it aids in generating positive optimum portfolios. The article concludes
on saying that a dynamic extension of the Markowitz model could have been used in order to
relate between the transactions cost and size of the respective securities. Francesc J Ortí , José
Sáez, Antonio Terceño (2002), stated that the Markowitz model of portfolio selection is a classic
optimization model stressing on two shortcomings with two objectives i.e., maximize returns and
minimize risk. The article concludes by emphasising on the fact that one must prevent taking a
portfolio using variance and also portrays that the fuzzy return on portfolio model is easier to
implement and enables a predictable risk definition to the investors mind, than the Markowitz
model. Frank J Fabozzi, Harry M Markowitz, Francis Gupta (2008), stated that the main objective
of portfolio selection is the grouping and construction of the portfolios to maximize returns
expected on them with a certain level of risk. Investors generally use modelling techniques on the
historical data and based on their future expected returns, the optimal portfolio selection is done
and this allows computing the investment risk and expected return on a portfolio. Also, the theory
of portfolio selection shifts from individual risk to the entire risk of the portfolio and shows the
possibility of combining risky assets to produce an optimum portfolio. Rainer Baule (2008),
focused on the problems faced usually by small investors during portfolio selection like
transaction costs in the form of banks and brokerage fee. Hence, due to this the investors are
forced to choose smaller assets. These factors lead to an optimization problem where transaction
costs dominate risk costs. Hence, investors are forced to choose more cost-effective commodities
like index certificates and exchange traded funds, depending on the level of invested wealth in
these items. Aouni, Belaïd (2009), explained on problems involved during analysis and selection
of portfolios having multi-dimensional attributes in the market making it difficult for the investors
to make conclusions based on the expected risk, return and liquidity. Hence, high investment on
such securities cannot guarantee high returns always so sometimes compromises have to be made
with a specific amount of investment. The article mainly focuses on various approaches on
portfolio selection like stochastic dominance model, multi attribute utility model, multi objective
programming model, discriminant analysis, heuristic methods, neural networks, multi objective
and multi criteria based methods and analyse which is preferable for the investor to get more
returns on minimum risk. Marcus Davidsson (2010), focused on two important factors during

IJPSS Volume 2, Issue 8 ISSN: 2249-5894 ___________________________________________________________
A Monthly Double-Blind Peer Reviewed Refereed Open Access International e-Journal - Included in the International Serial Directories Indexed & Listed at: Ulrich's Periodicals Directory ©, U.S.A., Open J-Gage, India as well as in Cabell’s Directories of Publishing Opportunities, U.S.A.
International Journal of Physical and Social Sciences http://www.ijmra.us
42
August
2012
portfolio selection i.e., minimising the risk associated on the portfolios and increase the earning
capacity by an investor on that portfolio the study of the article was based on the Kuwaiti Stock
Market. It emphasises on rebalancing the portfolios in an effective manner where a rebalancing
strategy is used to give equal weightage to the portfolio proportion by having 50% bond and 50%
momentum which will help to achieve lower risk as it is diversified and higher returns. Ward,
David J Griepentrog, Gary L (1993), explained how well an investor should invest mainly
focusing on investment in defaulted bonds and how appropriately they should be diversified to
earn higher rate of expected returns. Such kind of a portfolio attracts investors by giving higher
returns but on the contrary will also increase the level of unsystematic risk. Hence, investors have
to examine the risk and return factors carefully, as they offer higher returns than equities and
normal bonds. Cassell, Merrill (1999), focused on how an efficiently balanced portfolio can meet
the investors’ expectations i.e., lowering risk level and maximising the returns. The article
emphasises the fact that there is a positive relation between risk and return and this helps to select
an optimum portfolio by investors. Also various types of risks like systematic and unsystematic
risks are discussed in the article which is usually present during investing and concludes by
saying that investors can reduce risk by following a simple strategy i.e., diversifying the
investments that are having longer time periods. Emanuela Sciubba (2005), This article is framed
for the purpose of studying the need for adopting the CAPM model in a heterogeneous trading
scenario of portfolio selection i.e., different agents or traders exist in the market who advice the
investors to invest in different portfolios according to different theories and convince the investors
that an extensive kind of scrutiny has been done and then invested, but in reality they just go with
some irrelevant method or some mean variance preferences under unfavourable conditions which
will be risky for investors in the long run. Alina Lucia Trifan (2009), This article is based on the
CAPM model based on the Romanian Capital Market and the purpose of this research is to find
whether the relationship between risk and expected return is linear in nature, and if beta is a
complete measure of the risk and if a higher risk is compensated by a higher return. The article
concludes by stating that the intercept is statistically insignificant, upholding theory, for both
individual assets and portfolios but an alternate model can be simulated which can help achieve
more to investor’s expectations and also get a comparison between local market and global
economy. Robert Paff, Garry Twite (1999), focused on the related to CAPM wherein smaller
firms tend to deliver abnormal returns when compared to larger firms. Here, conflicts exist within

IJPSS Volume 2, Issue 8 ISSN: 2249-5894 ___________________________________________________________
A Monthly Double-Blind Peer Reviewed Refereed Open Access International e-Journal - Included in the International Serial Directories Indexed & Listed at: Ulrich's Periodicals Directory ©, U.S.A., Open J-Gage, India as well as in Cabell’s Directories of Publishing Opportunities, U.S.A.
International Journal of Physical and Social Sciences http://www.ijmra.us
43
August
2012
the traditional approach as usually the returns on portfolio assets are decided from a single
dimension or point of view i.e., risk to beta relationship. The article concludes by saying that beta
is the crux of the model but some problems are usually observed like inability to explain cross
sectional variances. George M Franfurter, Christopher G Lamoureux (1990), focused on the
importance of applying the Sharpe Diagonal Model to simplify portfolio selection process by
making an assumption i.e., covariance of the stocks are compared to the covariance of the market
(beta) and the stocks with a lesser beta to return ratio are considered. The article concludes by
relating to stocks having significant betas to a model framed by taking the covariance of the
stock’s rate of return which will help to improve the performance of the diagonal model. A
Bilbao, M Arenas, M Jiménez, B Perez Gladish and MV Rodriguez (2005), emphasised on the
approach to portfolio selection problem based on Sharpe’s single index model and on Fuzzy Sets
Theory. It considers estimations on future Betas of each financial asset which have been included
in the portfolio selection denoted as ‘Expert Betas’ and modelled as fuzzy numbers. Also factors
like value, ambiguity and fuzziness are taken and in order to select an optimal portfolio, a Goal
Programming model is proposed taking imprecise investor’s aspirations concerning asset’s
proportions on high and low risk assets. Pui Lam Leung, Wing Keung Wong (2008), proposed a
multivariate Sharpe Ratio Statistic to test the hypothesis of the equality of multiple share ratios.
The Sharpe ratio is used on 18 ishares and to test their equality in the market and concludes by
saying that the equality among the shares were rejected and final implication was that these
ishares perform differently in each year while some outperformed others also. Hence, the
multivariate Sharpe model ratio helps investors to effectively evaluate their portfolio’s
performance and make better decisions on investments.

IJPSS Volume 2, Issue 8 ISSN: 2249-5894 ___________________________________________________________
A Monthly Double-Blind Peer Reviewed Refereed Open Access International e-Journal - Included in the International Serial Directories Indexed & Listed at: Ulrich's Periodicals Directory ©, U.S.A., Open J-Gage, India as well as in Cabell’s Directories of Publishing Opportunities, U.S.A.
International Journal of Physical and Social Sciences http://www.ijmra.us
44
August
2012
Model Framework
Methodology
For constructing the portfolio in this project we have selected companies from three sectors
namely Power Sector, Shipping Sector and Textile Sector. From each sector six companies are
selected, so a total of eighteen companies.
The companies are selected based on their market capitalization. Companies with the largest
market capitalization in each sector are selected. Companies selected for analysis from Power
sector are CESC, Gujarat Power Industries, GVK Power and Infra, Jayaprakash Power, NTPC
and Tata Power. Companies selected from shipping sector are Bharthi Shipyard, Dredging Corp.,
Harrisons Malayalam, Mercator Lines, Shipping Corporation of India and Varun shipping.
Companies selected from textile sector Bombay Dyeing, Bombay Rayon, Century Textiles,
Patspin, Raymond and Eastern Silks. The data of the previous five financial year are used for the
constructing the portfolio; ie, from 01-April-2006 to 31-March-2011. The steps in constructing
the portfolio using the Sharpe Method are as follows. (All calculations are done in MS Excel).
i. Find the excess return to β ratio
ii. Arrange the calculated excess return to β ration in the descending order.
iii. Find the cut-off point

IJPSS Volume 2, Issue 8 ISSN: 2249-5894 ___________________________________________________________
A Monthly Double-Blind Peer Reviewed Refereed Open Access International e-Journal - Included in the International Serial Directories Indexed & Listed at: Ulrich's Periodicals Directory ©, U.S.A., Open J-Gage, India as well as in Cabell’s Directories of Publishing Opportunities, U.S.A.
International Journal of Physical and Social Sciences http://www.ijmra.us
45
August
2012
Cut-off Point,
iv. Decide how much to be invested in each security.
Where, Zi
IJPSS Volume 2, Issue 8 ISSN: 2249-5894 ___________________________________________________________
A Monthly Double-Blind Peer Reviewed Refereed Open Access International e-Journal - Included in the International Serial Directories Indexed & Listed at: Ulrich's Periodicals Directory ©, U.S.A., Open J-Gage, India as well as in Cabell’s Directories of Publishing Opportunities, U.S.A.
International Journal of Physical and Social Sciences http://www.ijmra.us
46
August
2012
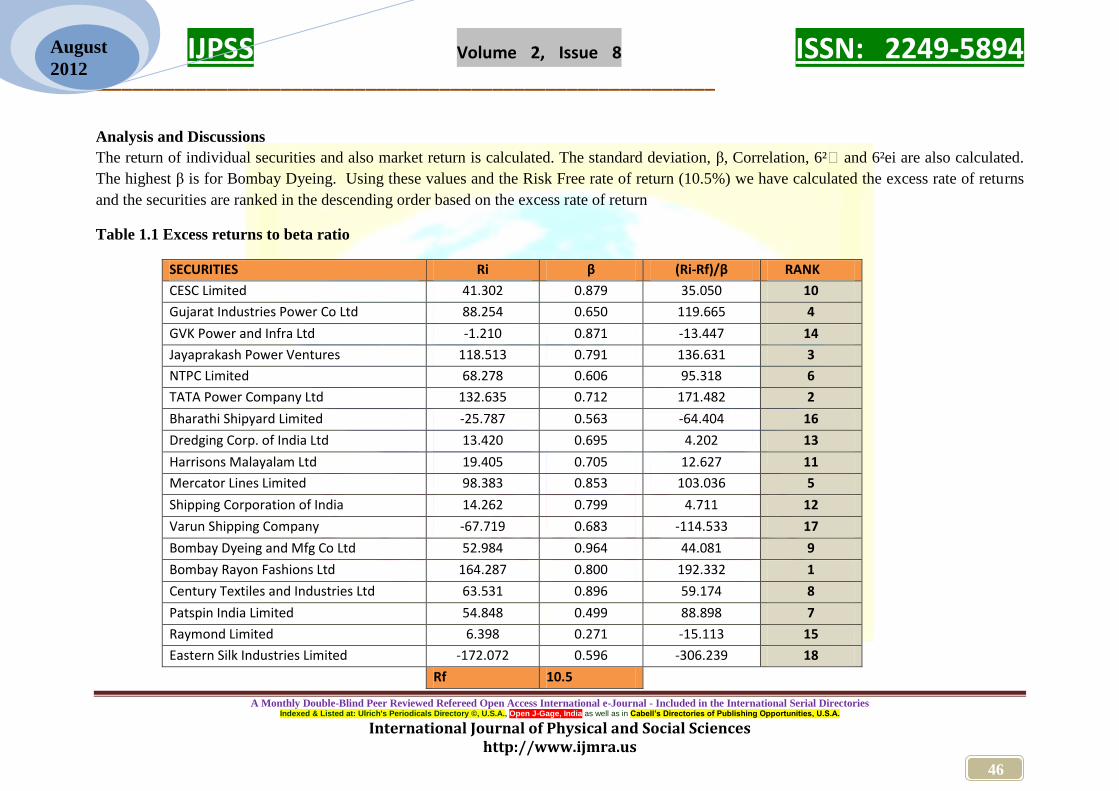
Analysis and Discussions
The return of individual securities and also market return is calculated. The standard deviation, β, Correlation, 6² mand 6²ei are also calculated.
The highest β is for Bombay Dyeing. Using these values and the Risk Free rate of return (10.5%) we have calculated the excess rate of returns
and the securities are ranked in the descending order based on the excess rate of return
Table 1.1 Excess returns to beta ratio
SECURITIES Ri β (Ri-Rf)/β RANK
CESC Limited 41.302 0.879 35.050 10
Gujarat Industries Power Co Ltd 88.254 0.650 119.665 4
GVK Power and Infra Ltd -1.210 0.871 -13.447 14
Jayaprakash Power Ventures 118.513 0.791 136.631 3
NTPC Limited 68.278 0.606 95.318 6
TATA Power Company Ltd 132.635 0.712 171.482 2
Bharathi Shipyard Limited -25.787 0.563 -64.404 16
Dredging Corp. of India Ltd 13.420 0.695 4.202 13
Harrisons Malayalam Ltd 19.405 0.705 12.627 11
Mercator Lines Limited 98.383 0.853 103.036 5
Shipping Corporation of India 14.262 0.799 4.711 12
Varun Shipping Company -67.719 0.683 -114.533 17
Bombay Dyeing and Mfg Co Ltd 52.984 0.964 44.081 9
Bombay Rayon Fashions Ltd 164.287 0.800 192.332 1
Century Textiles and Industries Ltd 63.531 0.896 59.174 8
Patspin India Limited 54.848 0.499 88.898 7
Raymond Limited 6.398 0.271 -15.113 15
Eastern Silk Industries Limited -172.072 0.596 -306.239 18
Rf 10.5

IJPSS Volume 2, Issue 8 ISSN: 2249-5894 ___________________________________________________________
A Monthly Double-Blind Peer Reviewed Refereed Open Access International e-Journal - Included in the International Serial Directories Indexed & Listed at: Ulrich's Periodicals Directory ©, U.S.A., Open J-Gage, India as well as in Cabell’s Directories of Publishing Opportunities, U.S.A.
International Journal of Physical and Social Sciences http://www.ijmra.us
47
August
2012
Table 1.2 after ranking the securities the cut-off point is calculated. The cut-off point obtained is 72.436
Five securities are selected for investment. These include the four companies immediately above the cut-off point and the company which gives
the cut-off point. The proportion of money to be invested in these five securities is found out using Xi (%).
Securities Ri Β σ2 ei
(Ri-Rf)*
β/σ2ei
E(Ri-Rf)*β/
σ2ei
σ2mE(Ri-Rf)*β/
σ2ei
β2/
σ2ei
Eβ2/
σ2ei
1+σ2mEβ2/
σ2ei
Ci
Bombay Rayon Fashions
Ltd 164.287 0.800 15.829 7.768 7.768 29.633 0.040 0.040 1.154 25.677
Tata Power Company Ltd 132.635 0.712 8.136 10.691 18.460 70.418 0.062 0.103 1.392 50.591
Jayaprakash Power
Ventures 118.513 0.791 13.766 6.203 24.663 94.079 0.045 0.148 1.565 60.111
Gujarat Industries Power
Co Ltd 88.254 0.650 9.585 5.271 29.933 114.186 0.044 0.192 1.733 65.885
Mercator Lines Ltd 98.383 0.853 19.417 3.860 33.794 128.912 0.037 0.230 1.876 68.715
NTPC Ltd 68.278 0.606 5.299 6.610 40.403 154.125 0.069 0.299 2.141 72.003
Patspin India Ltd 54.848 0.499 16.861 1.312 41.716 159.131 0.015 0.314 2.197 72.436
Century Textiles 63.531 0.896 14.236 3.338 45.054 171.866 0.056 0.370 2.412 71.252
Bombay Dyeing 52.984 0.964 16.885 2.425 47.479 181.116 0.055 0.425 2.622 69.078
CESC Ltd 41.302 0.879 8.805 3.074 50.553 192.844 0.088 0.513 2.957 65.226
Harrisons Malayalam Ltd 19.405 0.705 16.078 0.391 50.944 194.334 0.031 0.544 3.075 63.208
Shipping Corporation of
India 14.262 0.799 9.514 0.316 51.260 195.539 0.067 0.611 3.330 58.716
Dredging Corp. of India 13.420 0.695 11.593 0.175 51.435 196.206 0.042 0.653 3.489 56.234
GVK Power and Infra Ltd -1.210 0.871 21.197 -0.481 50.954 194.371 0.036 0.688 3.626 53.611
Raymond Limited 6.398 0.271 9.913 -0.112 50.841 193.942 0.007 0.696 3.654 53.077
Bharati Shipyard Limited -25.787 0.563 12.192 -1.677 49.164 187.545 0.026 0.722 3.753 49.968
Varun Shipping Company -67.719 0.683 6.398 -8.350 40.815 155.694 0.073 0.795 4.031 38.620
Eastern Silk Industries Ltd -172.072 0.596 17.210 -6.324 34.490 131.569 0.021 0.815 4.110 32.011

IJPSS Volume 2, Issue 8 ISSN: 2249-5894 ___________________________________________________________
A Monthly Double-Blind Peer Reviewed Refereed Open Access International e-Journal - Included in the International Serial Directories Indexed & Listed at: Ulrich's Periodicals Directory ©, U.S.A., Open J-Gage, India as well as in Cabell’s Directories of Publishing Opportunities, U.S.A.
International Journal of Physical and Social Sciences http://www.ijmra.us
48
August
2012
Table 1.3 Proposition of funds invested
Zi β/6²ei
((Ri-
Rf)/(β))-
(Ci) Zi Xi (%)
Jayaprakash Power Ventures 0.057 64.196 3.6866 0.325
Gujarat Industries Power Co Ltd 0.068 47.228 3.2016 0.282
Mercator Lines Ltd 0.044 30.600 1.3442 0.119
NTPC Ltd 0.114 22.882 2.6176 0.231
Patspin India Ltd 0.030 16.462 0.4871 0.043
Figure 1.1 Proposition of funds invested
33%
28%
12%
23%4%
Jayaprakash Power
VenturesGujarat Industries Power
Co LtdMercator Lines Ltd
NTPC Ltd
Patspin India Ltd

IJPSS Volume 2, Issue 8 ISSN: 2249-5894 ___________________________________________________________
A Monthly Double-Blind Peer Reviewed Refereed Open Access International e-Journal - Included in the International Serial Directories Indexed & Listed at: Ulrich's Periodicals Directory ©, U.S.A., Open J-Gage, India as well as in Cabell’s Directories of Publishing Opportunities, U.S.A.
International Journal of Physical and Social Sciences http://www.ijmra.us
49
August
2012
Findings
From the analysis we have found out the portfolio constructed from the eighteen companies
selected. The portfolio consists of five companies, they are Jayaprakash Powers, Gujarat Power
Corp., Mercator lines Ltd, NTPC, Patspin. The percentage of money to be invested in each
security has also been found out. Out of these five stocks selected Jayaprakash Powers, Gujarat
Power Corp and NTPC are from Power sector, Mercator Lines Ltd. is from shipping sector and
Patspin Ltd. is from Textile sector.
Recommendations
Based on the calculation and the analysis it has been found out that the portfolio can be
constructed from the five securities selected. The proportion of money to be invested in each of
the securities is also found out. The percentage wise break up is given below
Security Percentage (%)
Jayaprakash Power Ventures 33
Gujarat Industries Power Corp. 28
Mercator Lines Ltd 12
NTPC 23
Patspin Limited 4
These recommendations are based on Sharpe Index Model, but the final decision should be taken
only after considering other factors as the complete or overall value of the risk and return of the
securities cannot be decided by just ascertaining on a basis of a single calculation as various other
factors are present which will affect the growth or decline of these securities.
Conclusion
The optimum portfolio is constructed using Sharpe method. The proportions of money that has to
be invested in these securities are also calculated. The portfolio is constructed using the data from
the previous five years. The final decision of investing should be made only after considering all
the factors affecting the securities. These can be general economic factors or any other
macroeconomic factors which govern the movement and action of the movement of these
securities in the market.
IJPSS Volume 2, Issue 8 ISSN: 2249-5894 ___________________________________________________________
A Monthly Double-Blind Peer Reviewed Refereed Open Access International e-Journal - Included in the International Serial Directories Indexed & Listed at: Ulrich's Periodicals Directory ©, U.S.A., Open J-Gage, India as well as in Cabell’s Directories of Publishing Opportunities, U.S.A.
International Journal of Physical and Social Sciences http://www.ijmra.us
50
August
2012
References
A Bilbao, M Arenas, M Jiménez, B Perez Gladish and MV Rodriguez (2005), An
extension of Sharpe’s single-index model: portfolio selection with expert betas, Journal of
the Operational Research Society (2006) 57, 1442–1451
AJ Du Plessis, M Ward (2009), A note on applying the Markowitz portfolio selection
model as a passive investment strategy on the JSE, Investment Analysts Journal, No. 69
Alina Lucia Trifan (2009), TESTING CAPITAL ASSET PRICING MODEL FOR
ROMANIAN CAPITAL MARKET, Annales Universitatis Apulensis Series Oeconomica,
11(1).
Aouni, Belaïd (2009), Multi attribute Portfolio selection – New Perspective, INFOR; Feb
2009; 47, 1; ABI/INFORM Complete pp. 1
Cassell, Merrill (1999), Risk and return, Financial Management; Oct 1999; 77, 9;
ABI/INFORM Complete pp. 22-24
Emanuela Sciubba (2005), The evolution of portfolio rules and the capital asset pricing
model, Economic Theory 29: 123–150 DOI 10.1007/s00199-005-0013-2
Frank J Fabozzi, Harry M Markowitz, Francis Gupta (2008), Portfolio Selection,
JWPR026-Fabozzi c01 June 22, pp. 6:54
Francesc J Ortí , José Sáez, Antonio Terceño (2002), On The Treatment of Uncertainty in
Portfolio Selection, Vol. VII, No. 2, November, FUZZY ECONOMIC REVIEW
G Van der Hoek, AHG Rinnooy Kan, GT Timmer (1983), The Optimal selection of small
Portfolios, Management Science (pre-1986); 29, 7; ABI/INFORM, pp. 792
George M Franfurter, Christopher G Lamoureux (1990), Insignificant Betas and the
Efficacy of the Sharpe Diagonal Model for portfolio selection, Decision Sciences; Fall
1990; 21, 4; ABI/INFORM Complete. pp. 853
Marcus Davidsson (2010), Expected Return and Portfolio Rebalancing, International
Journal of Economics and Finance Vol. 3, No. 3; pp. 123-136
Pui Lam Leung, Wing Keung Wong (2008), On testing the equality of multiple Sharpe
ratios, with application on the evaluation of iShares, The Journal of Risk; Spring 2008; 10,
3; ABI/INFORM Complete pp. 15-21
Rainer Baule (2008), Optimal portfolio selection for the small investor considering risk
and transaction costs, OR Spectrum (2010) 32:61–76 DOI 10.1007/s00291-008-0152-5
Robert Paff, Garry Twite (1999), To B or not to B, Jassa, Issue 3, Spring, 1999
Ward, David J Griepentrog, Gary L (1993), Risk and Return in Defaulted Bonds,
Financial Analysts Journal; May/Jun 1993; 49, 3; ABI/INFORM Complete pg. 61
Security analysis and Portfolio management by Donald E Fischer and Ronald J Jordan (6th
Edition), Pearson Publications.
www.nseindia.com
www.info.shine.com
www.rbi.org