
IJECT Vol. 2, I 3, sEpT. 2011 ISSN : 2230-7109(Online ... · The Ethernet Passive Optical Network...
7
154 INTERNATIONAL JOURNAL OF ELECTRONICS & COMMUNICATION TECHNOLOGY IJECT VOL. 2, ISSUE 3, SEPT. 2011 ISSN : 2230-7109(Online) | ISSN : 2230-9543(Print) www.iject.org Abstract In the present work, performance of the FTTH Gigabit Ethernet Passive Optical Network (GEPON) system with triple play services such as video broadcast at 1550 nm and voice over IP and high speed internet at 1490 nm with 1:32 splitting is evaluated using FEC technique. By using the FEC (Forward Error Correction) technique the transmission distance of fiber is increased from 20 Km to 30 Km and data rate is increased from 1.25 Gb/s to 2.50 Gb/s. The performance characteristics like bit error rate, quality factor, dispersion, optical power and eye diagrams are studied by simulating different systems. The simulation model of the GEPON based on the OptSim is presented according to the above principle. Keywords PON, GEPON, Simulation, BER, Q-factor, Dispersion, Optical Network. I. Introduction Nowadays there is a rapidly growing demand for transporting information from one place to another. Optical communication systems have proven to be suitable for moving massive amounts of information over long distances at low cost. As internet traffic capacity is increasing, this increase has lead to future capacity upgrades. Fiber optic cables are made of glass fiber that can carry data at speeds exceeding 2.5 gigabits per second (Gbps). In these days almost all long haul high capacity information transport needs are fulfilled by optical communication systems. For next generation of optical communication systems, fiber-to- the-home (FTTH) using passive optical network (PON) system design is required to improve transmission performance [1]. In Japan, the number of broadband service contracts reached 30.11 million as of the end of December 2008. Among these, the number of fiber-to-the-home (FTTH) users was 14.42 million, followed by 11.59 million for digital subscriber line (DSL) and 4.08 million for cable television (CATV). The number of service contracts for FTTH access services now exceeds that of DSL and half of all broadband users are FTTH users. Passive optical network (PON) is a point-to-multipoint network in which unpowered optical splitters are used to enable a single optical fiber to serve multiple premises [2]. PON is classified into APON (ATM PON), EPON (Ethernet PON) and GPON (Gigabit Capable PON) on the basis of protocol method. APON provides transmission at 622 Mb/s and uses ATM (Asynchronous Transfer Mode) protocol, standard is ITU-T G.983. Later, APON has been renamed as BPON (Broadband PON), since it is misunderstood that APON provides only ATM services. The first BPON standard was published in 1998. GPON provides the transmission at 1.2 or 2.4 Gb/s and standard is ITU-T G.984. GPON was published in 2003. The Ethernet Passive Optical Network (EPON) system, which was standardized in 2004 as IEEE 802.3ah (1.25 Gb/s bidirectional transmission of Ethernet signals), has come to the widely known in Japan as the Gigabit Ethernet Passive Optical Network (GEPON). GEPON is a perfect combination of Ethernet technology and passive optical network technology. The GEPON system has been playing a leading role in the rapid expansion of FTTH and has been instrumental in increasing the number of FTTH users to about 14 million over these last five years [1, 3]. PON deployment is limited to split ratios of less than 64 and network reach of the order of 20 km as stipulated by the most-popular PON standards such as Gigabit Ethernet PON (GEPON) and Gigabit PON (GPON). However, higher split ratios can increase the benefits of a PON by lowering cost through sharing optical line terminal (OLT) among a larger number of users through fiber and more efficiently utilizing the head-end rack space for higher density OLT, and simplifying the fiber management at the head end. Furthermore, the high-split-ratio PON, which accommodates more users within each PON, makes the network become more flexible and be able to address the market that consists of various bandwidth-intensive services. Increasing the reach of the network will lead to a reduction in the number of Central office (CO) premises located close to the customers and allow the network operators to consolidate multiple COs in more conveniently located facilities for easier management. Despite these benefits of increasing the distance and split size of the PON, the optical power budget remains a major challenge. These studies investigated the use of the forward error correction (FEC) technique and an optical amplifier for achieving higher split ratios and longer reach [4, 5]. II. GEPON Architecture The Architecture of GEPON is as shown in the Fig.1 below: DS – Down stream US – Upstream OLT – Optical Line Terminal ONU – Optical Network Unit UNI – User Network interface Fig.1 : GEPON Architecture In GEPON model the basic building blocks are the optical line terminal (OLT), passive optical splitter and optical network terminal (ONT). A GEPON system is basically a point-to-multipoint (1: N) optical access network with no active elements in the signal path. This network provides two-way operation (Fig.1), in which traffic from an optical line terminal (OLT) is sent to/from multiple optical network units (ONUs). Namely, OLT-ONU traffic is called “downstream” (point-to-multipoint) and meanwhile, reverses ONU-OLT direction traffic is called “upstream” (multipoint-to- point) [6]. The latter requires contention resolution (arbitration) mechanisms to avoid upstream transmission collision between ONU senders. The OLT typically resides in a central office (CO) location and connects the optical access network to the metro Performance analysis of FTTH Gigabit Ethernet Passive Optical Network (GEPON) system with triple play services 1 Nitish Verma, 2 Ankur Singhal 1,2 Dept. of ECE, MM University, Mullana, Ambala, Haryana, India
Transcript of IJECT Vol. 2, I 3, sEpT. 2011 ISSN : 2230-7109(Online ... · The Ethernet Passive Optical Network...
154 InternatIonal Journal of electronIcs & communIcatIon technology
IJECT Vol. 2, IssuE 3, sEpT. 2011 ISSN : 2230-7109(Online) | ISSN : 2230-9543(Print)
w w w . i j e c t . o r g
AbstractIn the present work, performance of the FTTH Gigabit Ethernet Passive Optical Network (GEPON) system with triple play services such as video broadcast at 1550 nm and voice over IP and high speed internet at 1490 nm with 1:32 splitting is evaluated using FEC technique. By using the FEC (Forward Error Correction) technique the transmission distance of fiber is increased from 20 Km to 30 Km and data rate is increased from 1.25 Gb/s to 2.50 Gb/s. The performance characteristics like bit error rate, quality factor, dispersion, optical power and eye diagrams are studied by simulating different systems. The simulation model of the GEPON based on the OptSim is presented according to the above principle.
KeywordsPON, GEPON, Simulation, BER, Q-factor, Dispersion, Optical Network.
I. Introduction Nowadays there is a rapidly growing demand for transporting information from one place to another. Optical communication systems have proven to be suitable for moving massive amounts of information over long distances at low cost. As internet traffic capacity is increasing, this increase has lead to future capacity upgrades. Fiber optic cables are made of glass fiber that can carry data at speeds exceeding 2.5 gigabits per second (Gbps). In these days almost all long haul high capacity information transport needs are fulfilled by optical communication systems. For next generation of optical communication systems, fiber-to-the-home (FTTH) using passive optical network (PON) system design is required to improve transmission performance [1]. In Japan, the number of broadband service contracts reached 30.11 million as of the end of December 2008. Among these, the number of fiber-to-the-home (FTTH) users was 14.42 million, followed by 11.59 million for digital subscriber line (DSL) and 4.08 million for cable television (CATV). The number of service contracts for FTTH access services now exceeds that of DSL and half of all broadband users are FTTH users. Passive optical network (PON) is a point-to-multipoint network in which unpowered optical splitters are used to enable a single optical fiber to serve multiple premises [2]. PON is classified into APON (ATM PON), EPON (Ethernet PON) and GPON (Gigabit Capable PON) on the basis of protocol method. APON provides transmission at 622 Mb/s and uses ATM (Asynchronous Transfer Mode) protocol, standard is ITU-T G.983. Later, APON has been renamed as BPON (Broadband PON), since it is misunderstood that APON provides only ATM services. The first BPON standard was published in 1998. GPON provides the transmission at 1.2 or 2.4 Gb/s and standard is ITU-T G.984. GPON was published in 2003. The Ethernet Passive Optical Network (EPON) system, which was standardized in 2004 as IEEE 802.3ah (1.25 Gb/s bidirectional transmission of Ethernet signals), has come to the widely known in Japan as the Gigabit Ethernet Passive Optical Network (GEPON). GEPON is a perfect combination of Ethernet technology and passive optical network technology. The GEPON system has been playing a leading role in the rapid expansion
of FTTH and has been instrumental in increasing the number of FTTH users to about 14 million over these last five years [1, 3]. PON deployment is limited to split ratios of less than 64 and network reach of the order of 20 km as stipulated by the most-popular PON standards such as Gigabit Ethernet PON (GEPON) and Gigabit PON (GPON). However, higher split ratios can increase the benefits of a PON by lowering cost through sharing optical line terminal (OLT) among a larger number of users through fiber and more efficiently utilizing the head-end rack space for higher density OLT, and simplifying the fiber management at the head end. Furthermore, the high-split-ratio PON, which accommodates more users within each PON, makes the network become more flexible and be able to address the market that consists of various bandwidth-intensive services. Increasing the reach of the network will lead to a reduction in the number of Central office (CO) premises located close to the customers and allow the network operators to consolidate multiple COs in more conveniently located facilities for easier management. Despite these benefits of increasing the distance and split size of the PON, the optical power budget remains a major challenge. These studies investigated the use of the forward error correction (FEC) technique and an optical amplifier for achieving higher split ratios and longer reach [4, 5].
II. GEPON ArchitectureThe Architecture of GEPON is as shown in the Fig.1 below:
DS – Down streamUS – UpstreamOLT – Optical Line TerminalONU – Optical Network UnitUNI – User Network interfaceFig.1 : GEPON Architecture
In GEPON model the basic building blocks are the optical line terminal (OLT), passive optical splitter and optical network terminal (ONT). A GEPON system is basically a point-to-multipoint (1: N) optical access network with no active elements in the signal path. This network provides two-way operation (Fig.1), in which traffic from an optical line terminal (OLT) is sent to/from multiple optical network units (ONUs). Namely, OLT-ONU traffic is called “downstream” (point-to-multipoint) and meanwhile, reverses ONU-OLT direction traffic is called “upstream” (multipoint-to-point) [6]. The latter requires contention resolution (arbitration) mechanisms to avoid upstream transmission collision between ONU senders. The OLT typically resides in a central office (CO) location and connects the optical access network to the metro
Performance analysis of FTTH Gigabit Ethernet Passive Optical Network (GEPON) system with triple play services
1Nitish Verma, 2Ankur Singhal1,2Dept. of ECE, MM University, Mullana, Ambala, Haryana, India

InternatIonal Journal of electronIcs & communIcatIon technology 155
IJECT Vol. 2, IssuE 3, sEpT. 2011ISSN : 2230-7109(Online) | ISSN : 2230-9543(Print)
w w w . i j e c t . o r g
(backbone) network. Meanwhile, the ONU is usually located at or near end-user locations and must support a wide array of services— broadband video, voice, data, etc. The network within the splitter and number of ONTs is known as distribution network and the network within the OLT and splitter is known as feeder network. The OLT is connected with up to 32 ONTs by optical fiber and a passive optical splitter. The ONT is used to serve as an interface between optical and electrical medium. The different types of networks and OLT form the central office (CO). On the subscriber end, the optical fiber is terminated with a node commonly referred to as optical network terminal (ONT). On the CO end, the feeder network is terminated with optical line terminal (OLT). Optical line terminal is a node which is used to send and receive the different services to and from the optical network terminals (ONTs). In particular, various ONU deployment possibilities exist, as per different architectures such as fiber-to-the-curb (FTTC), fiber-to-the-building (FTTB), and fiber-to-the-home (FTTH). Overall, the operational costs of these setups are minimal since no active elements are placed in the outside fiber plant, e.g., no maintenance is needed in the field. Moreover, by sharing the network equipment among the maximum number of customers, operators can amortize the cost of installation and operation in a much more economical manner [7, 8].
III. DispersionOne of the major limitations of fiber communication system is the pulse broadening introduced by dispersion. Dispersion is the mechanism within the fiber that causes the broadening of light waves as they travel along the channel. Dispersion is present in both single mode and multimode fibers. Dispersion is the mechanism in the fiber that degrades the performance of the system. Dispersion can be classified in to three types: material dispersion or chromatic dispersion, waveguide dispersion, and intermodal dispersion. The material dispersion arises due to the variation of refractive index with wavelength or frequency of light i.e., it is a wavelength – based effect. Light waves of different wavelengths travel at different speeds in a medium. For wavelengths less than 1300 nm, the long wavelengths travel faster than shorter wavelengths. So narrow pulses of light tend to broaden as they travel down the optical fiber. This is known as material dispersion. The waveguide dispersion arises from the guiding properties of the fiber. The effective refractive index for any mode varies with wavelength. This causes pulse spreading similar to variation in refractive index. This is known as waveguide dispersion. The waveguide dispersion present in both single and multimode fibers. Intermodal dispersion occurs in multimode fiber. Because light wave propagates through a fiber in different modes. Each of the mode in a multimode fiber travels at a slightly different velocity. So, there is a difference in propagation times for the different modes. This result the pulse to spread in time as it travels along the fiber. This is known as Intermodal dispersion [9].
IV. Results Analysis
Wavelength Spectrum
x10-10
Wavelength (m)
15494 15496 15498 15500 15502 15504 15506
Pow
er (d
Bm)
90-
80-
70-
60-
50-
40-
30-
20-
10-
Fig. 2: Transmitted video signal wavelength spectrum
Fig. 2 shows the wavelength spectrum of video signal. Video signal is transmitted at the wavelength of 1550nm. The power of video signal is about -9.4513 dBm before the transmission.
Wavelength Spectrum
x10-10
Wavelength (m)
14894 14896 14898 14900 14902 14904 14906
Pow
er (d
Bm)
80-
70-
60-
50-
40-
30-
20-
10-
0
Fig. 3: Transmitted voice/data signal wavelength spectrum
Fig.3 shows the wavelength spectrum of voice/data signal. Voice/data signals are transmitted at the wavelength of 1490nm. The power of voice/data signal is about 0.0849 dBm before the transmission. At 20 Km fiber length

156 InternatIonal Journal of electronIcs & communIcatIon technology
IJECT Vol. 2, IssuE 3, sEpT. 2011 ISSN : 2230-7109(Online) | ISSN : 2230-9543(Print)
w w w . i j e c t . o r g
Wavelength Spectrum
x10-10
Wavelength (m)
15494 15496 15498 15500 15502 15504 15506
Powe
r (dB
m)
100-
80-
60-
40-
Fig. 4: Received video signal wavelength spectrum
The wavelength spectrum of received video signal is as shown in the Fig.4. It is found that the power of video signal is about -25.77 dBm at the receiver side. Here the power of video signal is reduced when the fiber length is of 20 Km.
Wavelength Spectrum
x10-10
Wavelength (m)
14894 14896 14898 14900 14902 14904 14906
Powe
r (dB
m)
120-
100-
80-
60-
40-
Fig. 5 : Received voice/data signal wavelength spectrum
The wavelength spectrum of received voice/data signal shows that at the receiver side the power of voice/data signal is about -32.65 dBm which is less compare to the power of transmitted voice/data signal.
BER
Fiber Length(m)6000 9000 12000 15000 18000
BER
10-13810-98
10-69
10-4910-35
10-2510-18
10-13
10-9
10-6
10-4
Legend:
Bitrate = 1.25Gbps
Bitrate = 2.50Gbps
Fig. 6 : BER v/s fiber length (m) without FEC
This simulation result shows the BER with variation in fiber length without FEC technique. As the fiber length incrases then the corresponding BER increases. Thus BER will be different at different bitrates such as 1.25 and 2.50 Gb/s. The BER will be more at 2.50 Gb/s.
BER FEC
Fiber Length(m)6000 9000 12000 15000 18000
BER
FEC
10-13810-11210-9110-7410-60
10-4810-39
10-31
10-25
10-20
10-16
Legend:
Bitrate = 1.25Gbps
Bitrate = 2.50Gbps
Fig. 7: BER v/s fiber length (m) with FEC
By using the FEC technique the performance of system can be improved as shown in the Fig.7. BER can be reduced by using this technique. Thus using this technique fiber length can be increased up to 20 Km and data rate can be increased up to 2.5 Gb/s.
InternatIonal Journal of electronIcs & communIcatIon technology 157
IJECT Vol. 2, IssuE 3, sEpT. 2011ISSN : 2230-7109(Online) | ISSN : 2230-9543(Print)
w w w . i j e c t . o r g
Q2
Fiber Length(m)6000 8000 10000 12000 14000 16000 18000 20000
Q2 (
dB)
12
14
16
18
20
22
24Legend:
Bitrate = 1.25Gbps
Bitrate = 2.50Gbps
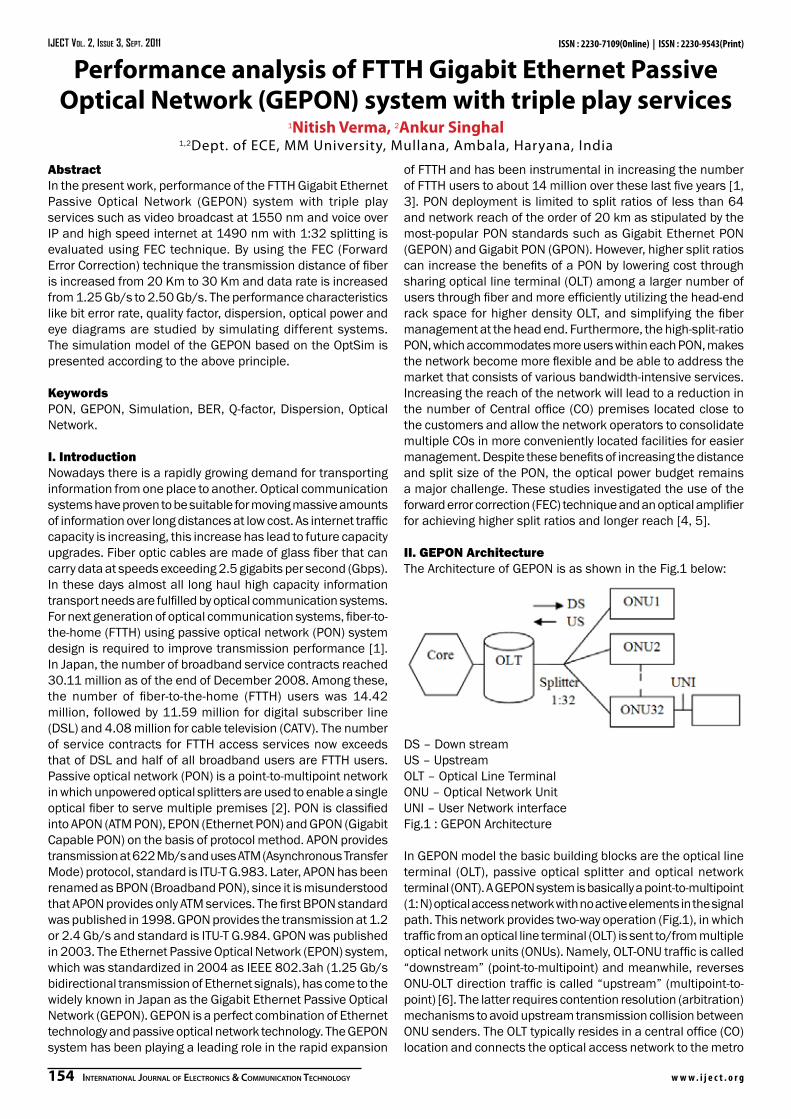
Fig. 8: Quality factor v/s fiber length (m) without FEC
This simulation result shows that when the length of fiber will increase then the corresponding quality factor will decrease. Without using the FEC technique, the quality factor will become very less for the signal having bit rate of 2.50 Gb/s.
Q2 FEC
Fiber Length(m)6000 8000 10000 12000 14000 16000 18000 20000
Q2 F
EC (d
B)
18
20
22
24
26
28
Legend:
Bitrate = 1.25Gbps
Bitrate = 2.50Gbps
Fig. 9 : Quality factor v/s fiber length (m) with FEC
The simulation result with FEC technique is as shown in the Fig.9. It is observed that by using FEC technique the quality factor can be increased for the signal having bit rate of 2.50 Gb/s.
Dispersion Map
x104
Distance [m]
0 1 2
Disp
ersio
n [p
s/nm
]
0
100
200
300Channels
λ=1.4900 µm
λ=1.5500 µm
Fig. 10 : Dispersion v/s distance (m)
This simulation result shows that dispersion within the fiber will increase when transmission distance will increase. For video signal dispersion will be more compare to the voice/data signal.
Eye Diagram
x10-10
Time (s)
0 1 2 3 4 5 6 7 8
Sign
al (V
)
0.018
0.020
0.022
0.024
Fig. 11 : Eye diagram
Eye diagram from the Fig.11 shows the width and height of the eye opening. Thus the width and height of the eye opening is large which means that reception of the signal is very much clear. The width of eye opening defines the time interval over which received signal can be sampled without interference and distortion. The height of eye opening shows the noise margin of the signal.At 30 Km fiber length
158 InternatIonal Journal of electronIcs & communIcatIon technology
IJECT Vol. 2, IssuE 3, sEpT. 2011 ISSN : 2230-7109(Online) | ISSN : 2230-9543(Print)
w w w . i j e c t . o r g
Wavelength Spectrum
x10-10
Wavelength (m)
15494 15496 15498 15500 15502 15504 15506
Powe
r (dB
m)
100-
80-
60-
40-
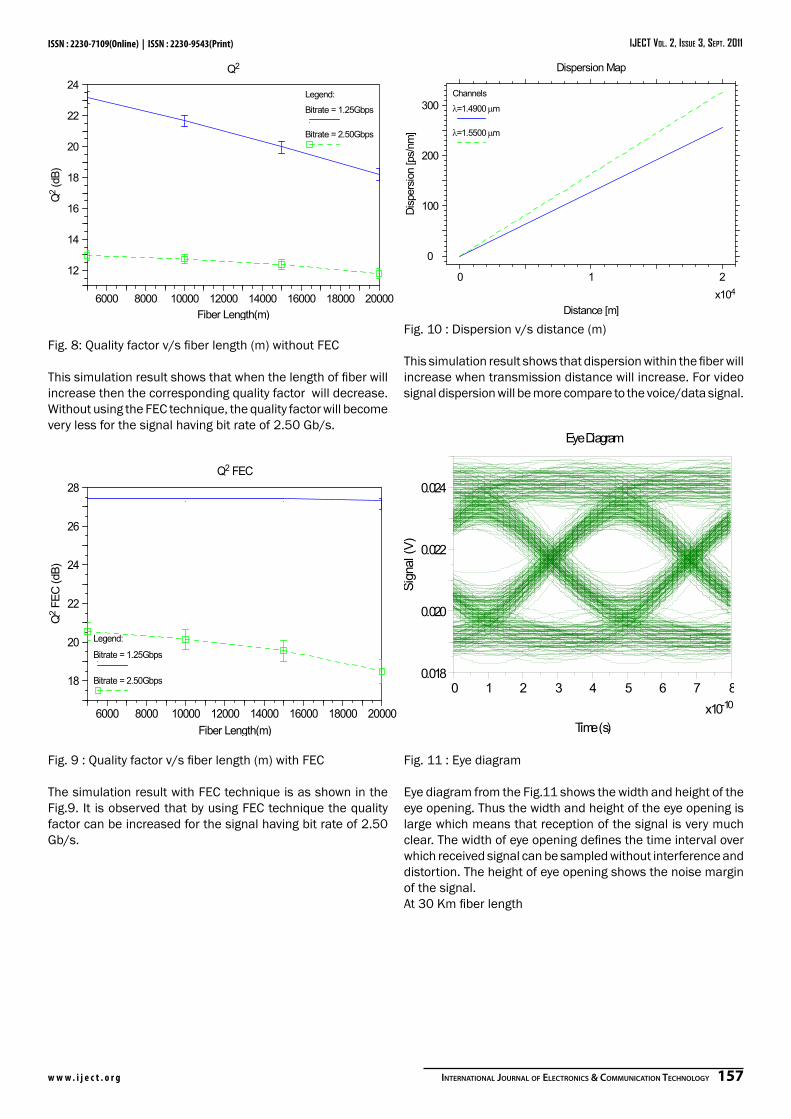
Fig. 12: Received video signal wavelength spectrum
Fig.12 shows the wavelength spectrum of received video signal. The power of video signal is about -26.02 dBm at the receiver side. Thus the power of video signal will reduce when the fiber length will span up to 30 Km.
Wavelength Spectrum
x10-10
Wavelength (m)
14894 14896 14898 14900 14902 14904 14906
Powe
r (dB
m)
120-
100-
80-
60-
40-
Fig. 13: Received voice/data signal wavelength spectrum
By observing the wavelength spectrum of received voice/data signal it is analyzed that at the receiver side the power of voice/data signal is about -33.15 dBm which is less compare to the transmitted voice/data signal. The signal strength or power of the signal will reduce when loss will occure in the fiber.
BER
x104
Fiber Length(m)
1 2 3
BER
10-13810-9810-6910-4910-3510-2510-1810-1310-9
10-6
10-4
Legend:
Bitrate = 1.25Gbps
Bitrate = 2.50Gbps
Fig. 14: BER v/s fiber length (m) without FEC
This graph shows the simulation result without FEC technique. As the fiber length incrases then the corresponding BER increases. Thus BER will be different at different bitrates such as 1.25 and 2.50 Gb/s. The BER will be more at 2.50 Gb/s.
BER FEC
x104
Fiber Length(m)
1 2 3
BER
FEC
10-13810-10410-7810-5810-4310-3210-2410-18
10-1310-10
10-7Legend:
Bitrate = 1.25Gbps
Bitrate = 2.50Gbps
Fig. 15: BER v/s fiber length (m) with FEC
Fig.15 shows that by using the FEC technique the performance of system can be improved. BER can be reduced by using this technique. Thus using this technique fiber length can be increased up to 30 Km and data rate can be increased up to 2.5 Gb/s.

InternatIonal Journal of electronIcs & communIcatIon technology 159
IJECT Vol. 2, IssuE 3, sEpT. 2011ISSN : 2230-7109(Online) | ISSN : 2230-9543(Print)
w w w . i j e c t . o r g
Q2
x104
Fiber Length(m)
1 2 3
Q2 (
dB)
10
12
14
16
18
20
22
24Legend:
Bitrate = 1.25Gbps
Bitrate = 2.50Gbps
Fig. 16 : Quality factor v/s fiber length (m) without FEC
This simulation result shows that when the length of fiber will increase then the corresponding quality factor will decrease. Without using the FEC technique the quality factor will become very less for the signal having bit rate of 2.50 Gb/s when the fiber length will span up to 30 Km.
Q2 FEC
x104
Fiber Length(m)
1 2 3
Q2 F
EC (d
B)
14
16
18
20
22
24
26
28Legend:
Bitrate = 1.25Gbps
Bitrate = 2.50Gbps
Fig. 17 : Quality factor v/s fiber length (m) with FEC By using
FEC technique the quality factor can be increased for the signal having bit rate of 2.50 Gb/s even when the fiber length spans up to 30 Km. Thus by using the FEC technique the performance of the system can be increased by taking parameters such as BER, quality factor into account.
Dispersion Map
x104
Distance [m]
0 1 2 3
Disp
ersio
n [p
s/nm
]
0
100
200
300
400
500 Channels
λ=1.4900 µm
λ=1.5500 µm
Fig. 18 : Dispersion v/s distance (m)
This graph shows that dispersion within the fiber will increase when transmission distance will increase. For video signal dispersion will be more compare to the voice/data signal. Eye Diagram
x10-10
Time (s)
0 1 2 3 4 5 6 7 8
Sign
al (V
)
0.010
0.012
0.014
0.016
Fig. 19 : Eye diagram
Fig.19 shows that the width and height of the eye opening is reduced and the data signal is very much distorted. The height is reduced as a result of amplitude distortion in data signal.
Table 1: BER and quality factor without FEC
FiberLength
Without FEC 1.25Gbps 2.5Gbps
BER Q.F.(dB)
BER Q.F.(dB)
20Km 1.86e-16 18.22 5.21e-5 11.80
30Km 8.54e-8 14.31 0.0005 10.27

160 InternatIonal Journal of electronIcs & communIcatIon technology
IJECT Vol. 2, IssuE 3, sEpT. 2011 ISSN : 2230-7109(Online) | ISSN : 2230-9543(Print)
w w w . i j e c t . o r g
Table 2: BER and quality factor with FEC
FiberLength
With FEC
1.25Gbps 2.5Gbps
BER Q.F.(dB) BER Q.F.(dB)
20Km 2.69e-100
27.32 2.05e-17 18.50
30Km 4.20e-42
22.53 5.217e-9 15.15
Table 3: Dispersion with fiber lengthFiber Length Dispersion[ps/nm]
Data/Voice Video
20Km 255.25 326.31
30Km 384.34 490.93
V. ConclusionBy observing the tables and analyzing the eye diagrams it is found that at the fiber length of 20Km the system performs better by taking parameters like BER, quality factor, dispersion and Optical Power into accounts. It is also found that system does not perform well at the fiber length of 30 Km. Thus by using the FEC (Forward Error Correction) technique, the transmission distance and data rate can be increased. The system can perform well even at the distance of 30Km and can increase the data rate of 2.50 Gbps.
References[1] Monika Gupta et al, “Performance Analysis of FTTH at10
Gb/s by GEPON Architecture,” IJCS International Journal of Computer Science Issues, Vol. 7, Issue 5, September 2010, pp.265-271.
[2] Yoshinori Ishii, “Optical access transport system-GEPON platform-,” Fujitsu Sci. Tech. J., VOL.45, NO.4, October 2009, PP.346-354.
[3] Abdallah Shami, “QoS Control Schemes for Two-Stage Ethernet Passive Optical Access Networks,” IEEE Journal on Selected Areas in Communications, VOL. 23, NO.8, August 2005, pp.1467-1478.
[4] Chien Aun Chan, “Remote Repeater-Based EPON with MAC Forwarding for Long-Reach and High-Split-Ratio Passive Optical Networks,” J. Opt. Commn. Netwk. VOL.2, NO.1/January 2010, pp.28- 37.
[5] Darren P. Shea, “A 10-Gb/s 1024-Way-Split 100- Km Long-Reach Optical-Access Network,” IEEE Journal of Lightwave Technology, VOL. 25, NO. 3, March 2007, pp.685-693.
[6] Chadi M. Assi et al, “Dynamic Bandwidth Allocation for Quality-of- Service over Ethernet PONs,” IEEE Journal on Selected Communications Areas In, VOL. 21, NO. 9, November 2003, pp.1467-1476.
[7] Biao Chen et al, “Efficient and Fine Scheduling Algorithm for Bandwidth Allocation in Ethernet Passive Optical Networks,” IEEE Journal on Selected Topics in Quantum Electronics, VOL. 12, NO. 4, July/August 2006, pp.653-660.
[8] Ahmad R., “Per-Stream QoS and Admission Control in Ethernet Passive Optical Networks (EPONs),” IEEE Journal of Lightwave Technology, VOL. 25, NO. 7, July 2007, pp.1659-1669.
[9] T. Schäfer, “Optimization of Dispersion-Managed Optical Fiber Lines,” IEEE Journal of Lightwave Technology, VOL. 20, NO. 6, June 2002, pp.946-952.
Nitish Verma was born in Himachal Pradesh, India, in 1985. He earned B.Tech degree of Telecommunication Engineering from S.J.C.I.T. Chickballapur, Karnataka, India in 2008. He is currently doing his M-Tech in Electronics & Communication Engineering from Maharishi Markandeshwar University Mullana, Ambala, Haryana, India. The degree
of M-Tech is almost completed only final viva is left. He is currently working with Shiva Institute of Engineering and Technology, Chandpur Distt. Bilaspur, Himachal Pradesh, India as Assistant Professor.


![CSX - Family · CSX5-V.24 1405 - 1120 Covered Software Versions of CSX ... [IEEE 802.3ah] IEEE Std 802.3ah ™-2004: Media Access Cont rol Parameters, Physical Layers, ...](https://static.fdocuments.net/doc/165x107/5b0d83b57f8b9ab7658c844c/csx-1405-1120-covered-software-versions-of-csx-ieee-8023ah-ieee-std-8023ah.jpg)