i^iijE · Name. Date. .Cla Practice A Kyi Using Intercepts Find the x- and y-intercepts. Name TEKS...
2
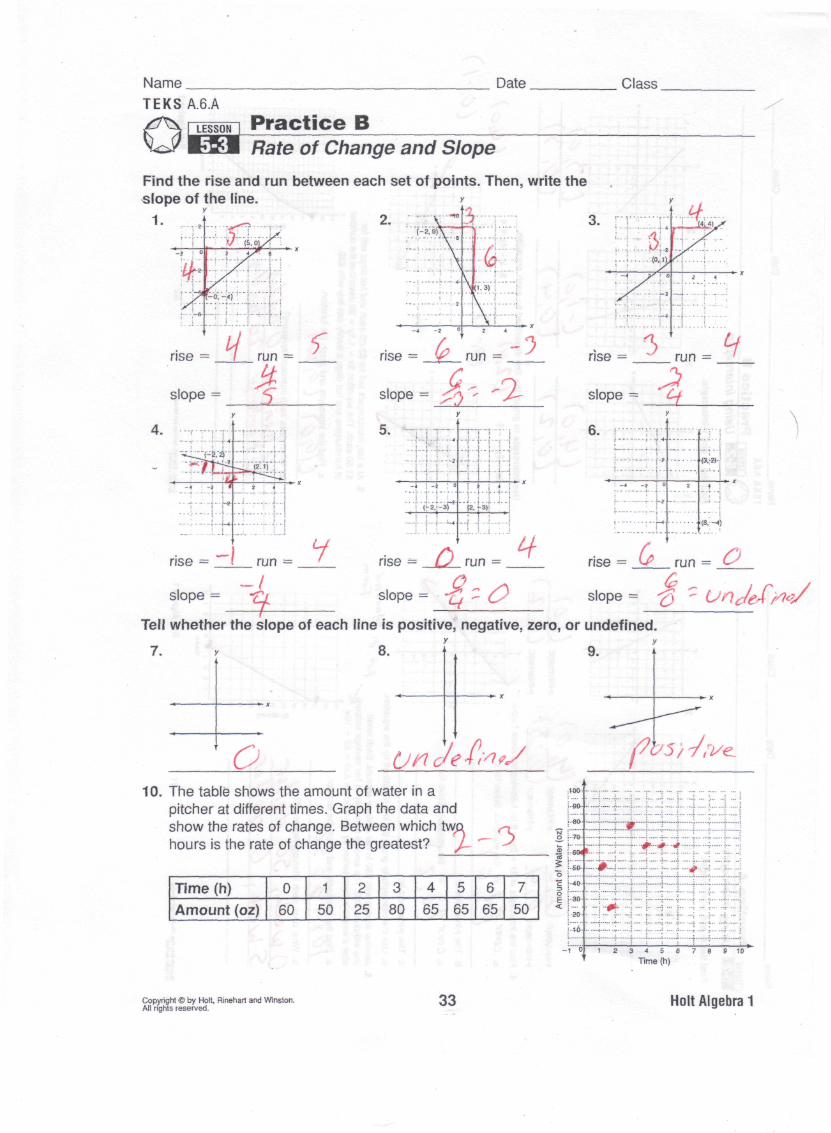
Name TEKS A.6.A | LESSON | r Km R, Find the rise and i slope of the line. y 1. .4.. -•-*«? ~*.j ° ^-p?~- i^iijE Date Class ractice B ate of Change and SJ •un between each set of poii 2. ;:::;ri f'j •"•' i :••* 4- - i •--; :-i rise = f run = rise = y^ ] ope its. Then, write the y y ^ : - '•- „ . _/ 1 • ... \ • -•1 X 1 ° ; 2 ^ 4 N(1.3) ! JX \ i Xi •-V-- i ••-•;- \ • '' ; "T"VI ;. r run = rise = ^ run = ' slope = " ^" slope = ^ '' •" „£- slope = £•/ X 4 r . .,._,._, ,.. .,. : ; j- 4 —T----- : •^irc-z."^ .^rj-ii— - {2 ~, ' -' : -j i 1 ) * • rise = ! ru -J slope = -Q f Tell whether the si 7. <c > j | ' • ' ~< i -» ; o LJ .. n = 1 rise = O y - T -, j-r-j 6. rj •-|;rj ri i i i - i \ • \ i: \ i ! i < I •_<-,;» 2 < ; ' "[2^!-3)i " ; : i run = . rise = O 5 run = ^ O ^ C- , r slope = • -£, C- £/ slope = -^) - UnJe* ^ ope of each line is positive, y 8. , Un&t negative, zero, or undefined. 9. " Y t . v /) /)"-, f • J r I • / f'&5/'7ii/'€L. 1 0. The table shows the amount of water in a ;™ : ; ; r; T ;;;; - r. j ~ r :i ~ r ; pitcher at different times. Graph the data and show the rates of change. Between which two <-t ~ ;:: 8 * :::::4:::::i::::i::::±::::;:::4::::i::::::j:::::t:::j hours is the rate of change the greatest? J- J f | : ^~- :;: { \:^:::^::i:.:i:::. Time (h) Amount (oz) "n j i • : j : : • - - : 0 1 2 3 4 5 6 7 l^ 0 ::::::t:::T::::t::::j:::h:i::t:::t::r;;:; 60 50 25 80 65 65 65 50 < \' w : :! :ft. :j :: t :i :. |: ::; :r:r:i l-t6 ; ; i ! i | ;.- ; \~ \ -1 ° 1 2 3 4 5 6 7 8 9 10 Time (h) • Copyright © by Holt, Rineharf and Winston. Al! rights reserved. 33 Holt Algebra 1
Transcript of i^iijE · Name. Date. .Cla Practice A Kyi Using Intercepts Find the x- and y-intercepts. Name TEKS...
NameTEKS A.6.A
| LESSON | r
Km R,Find the rise and islope of the line.
y
1. .4.. -•-*«?~*.j ° ^-p?~-
i iijE
Date Class
ractice Bate of Change and SJ
•un between each set of poii
2. ;:::;ri
f ' j • " • ' i :••*
4- - i •--; :-i
rise = f run = rise = y^
]ope
its. Then, write they y
^ :- '•- „ . _/ 1 • ...\ • -• 1 X 1 ° ; 2 ^ 4
N(1.3) ! JX\ i Xi
• -V - - i • • - • ; -\ • '' ;
"T "VI ;. r
run = rise = ^ run = '
slope = " " slope = '' •" „£- slope = £•/X
4 r. .,._,._, ,.. .,.: ; j- 4 — T - - - - - :
• irc-z."^. rj-ii— -{2~,
' -' : -j i1) * •
rise = ! ru
-Jslope = -Qf
Tell whether the si
7.
<c
>
j | ' • ' ~< i -» ; o
LJ ..n = 1 rise = O
y
-T-, j-r-j 6. rj •-|;rj ri
i i i - i \ • \ i: \i ! i < I • _ < - , ; » 2 < ; '
"[2^!-3)i " ; : i
run = . rise = O5 run = O ^ C- , r
slope = • -£, C- £/ slope = - ) - UnJe*
ope of each line is positive,y
8.
,
Un&t
negative, zero, or undefined.
9.
" Y t . v
/) /)"-, f • J rI • / f'&5/'7ii/'€L.
1 0. The table shows the amount of water in a ;™: ; ; r; T ;;;; - r. j ~ r :i ~ r ;pitcher at different times. Graph the data andshow the rates of change. Between which two <-t ~ ;::8* :::::4:::::i::::i::::±::::;:::4::::i::::::j:::::t:::jhours is the rate of change the greatest? J- J f |:^~-:;:{ \:^:::^::i:.:i:::.
Time (h)Amount (oz)
"n j i • : j : : • - - :
0 1 2 3 4 5 6 7 l 0::::::t:::T::::t::::j:::h:i::t:::t::r;;:;
60 50 25 80 65 65 65 50 < \'w : :! :ft. :j :: t :i :. |: ::; :r:r:il-t6 ; ; i ! i | ;.- ; \~ \
-1 ° 1 2 3 4 5 6 7 8 9 10Time (h)
•
Copyright © by Holt, Rineharf and Winston.Al! rights reserved.
33 Holt Algebra 1
Name. Date. .Cla
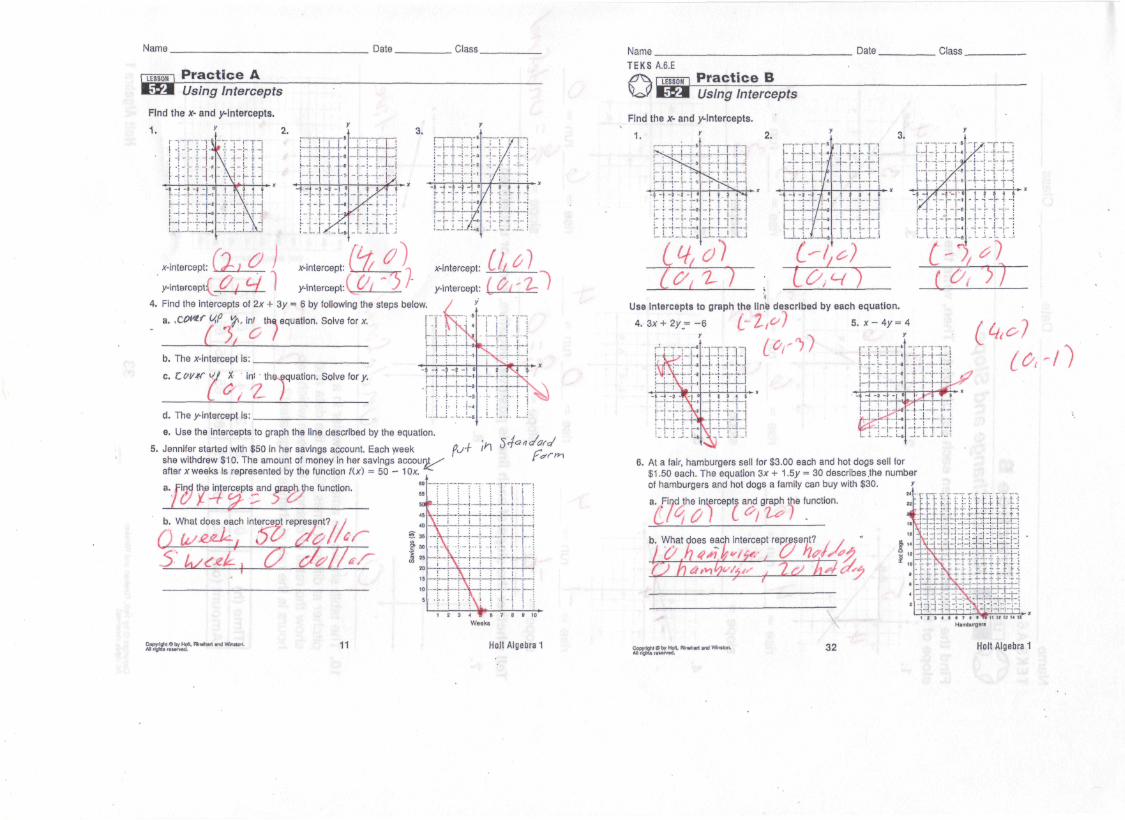
Practice AKyi Using Intercepts
Find the x- and y-intercepts.
NameTEKS A.6.E
LESSON
Date. . Class __
Practice Baz-B Using Intercepts
J* Find the x- and y-lntercepts.
1.
.
x-intercept: t // " /
y-interoept: ( 6 / ' -
4. Find the intercepts of 2x + 3y = 6 by following the steps below,
a. ,COt*f Uf ,, jn, th« equation. Solve for x. I !
" (?,c i / i ib. The x-intercept is: _ _
c. 'COV*r ^J X in! the .equation. Solve for y.
d. The y-intercept is:
e. Use the intercepts to graph the line described by the equation.
5. Jennifer started with $50 in her savings account. Each weekshe withdrew $10. The amount of money in her savings account,^after x weeks is represented by the function ftx) = 50 — 10x.
a. Find the intercepts and graph-the function.
! f fS *
54°
b. What does each intercept represent?
a4-
by Holt. Rhieharl antl WtnupH. 11
. :
^nUse Intercepts to graph the line described by each equation.
4. 3x + 2y_= -6 5. x - 4y = 4
i t- 4.1.-I -J - -( -| 0
H 1-l-v!.-.<....
\ H4-
:rn:i:
^1t*,-ri
6. At a fair, hamburgers sell for $3.00 each and hot dogs sell for$1.50 each. The equation 3x + 1.5y = 30 describes the numberof hamburgers and hot dogs a family can buy with $30.
a. Find the intercepts and graph the function.. c M f r r » ' 1 ' • • i^fi-U-r-r ; 4-vffi-, L-l- _, ,. ..-^ (., — JJ.r
b. What does each intercept represent?
IPt do
hl \
\ -JT:!:I.
,-:ttt±-t'.rhi:ta.r
- r f l-\ t ;ml
32
-ttttj-ij^l i v1:": - i-r-s^/H:;.^-;-^.-
HamtxiroBrs
Holt Algebra 1